
ByCarol Bolstad
Copyright 2004 - Scheduling and Information Services, Inc.
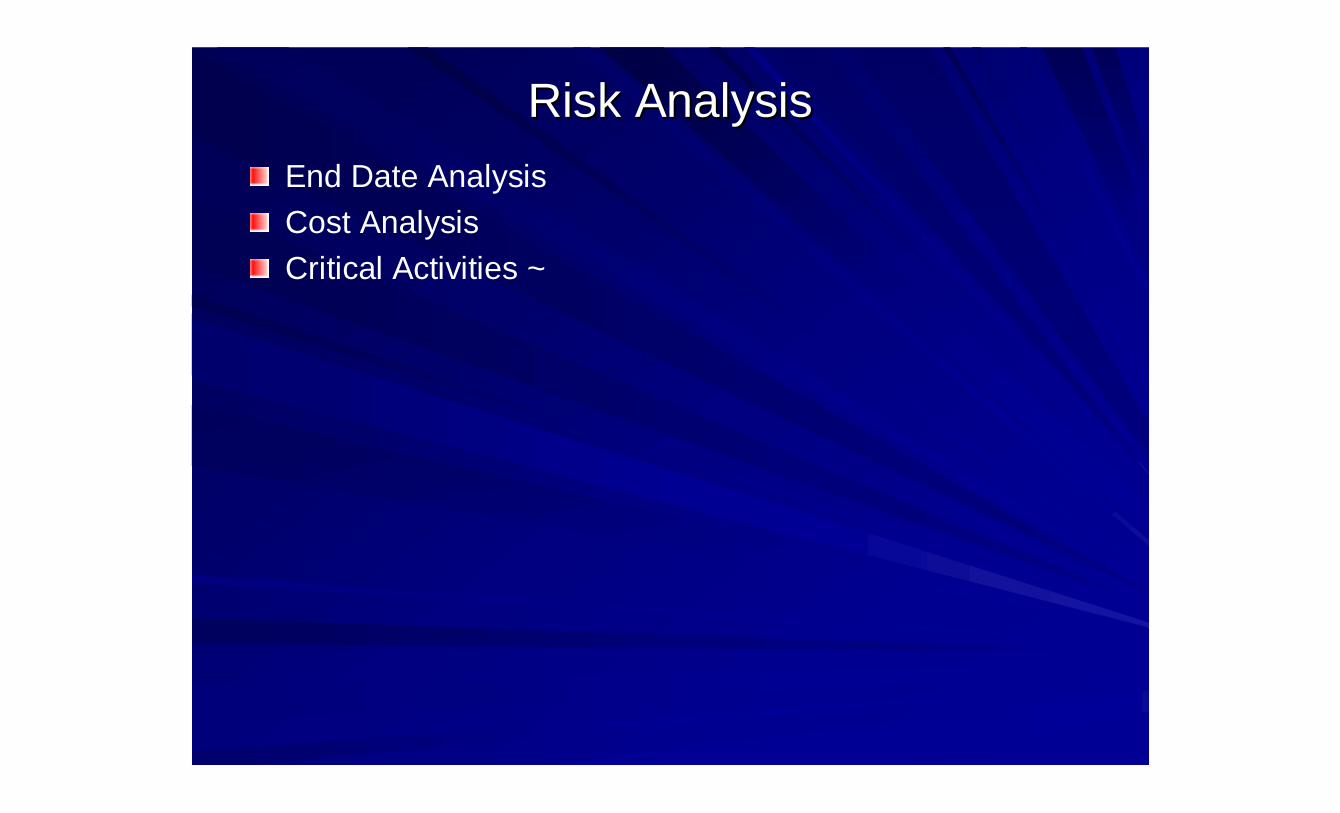
Risk AnalysisRisk AnalysisEnd Date AnalysisCost AnalysisCritical Activities ~

Risk AnalysisRisk AnalysisSingle Path (CPM) vs. Monte Carlo technique (1000iterations)CPM - Does not take uncertainty into account3 Durations (min, most likely ,max)Each iteration has it’s own critical pathTraditional CPM shows only 1 critical path“S-Curve”presents likelihood of finish datesPertmaster –3rd Party software that analyzes schedules~

Imported Baseline ScheduleImported Baseline Schedule

Sanity Check to Baseline ScheduleSanity Check to Baseline Schedule
•VerifyScheduleIntegrity /Mechanics

Baseline Schedule with 3 DurationsBaseline Schedule with 3 Durations
Min and Max set to specific numbers or a percentage (10-20%) ofMost Likely or Original Duration

Distribution Triangle for Individual ActivitiesDistribution Triangle for Individual Activities
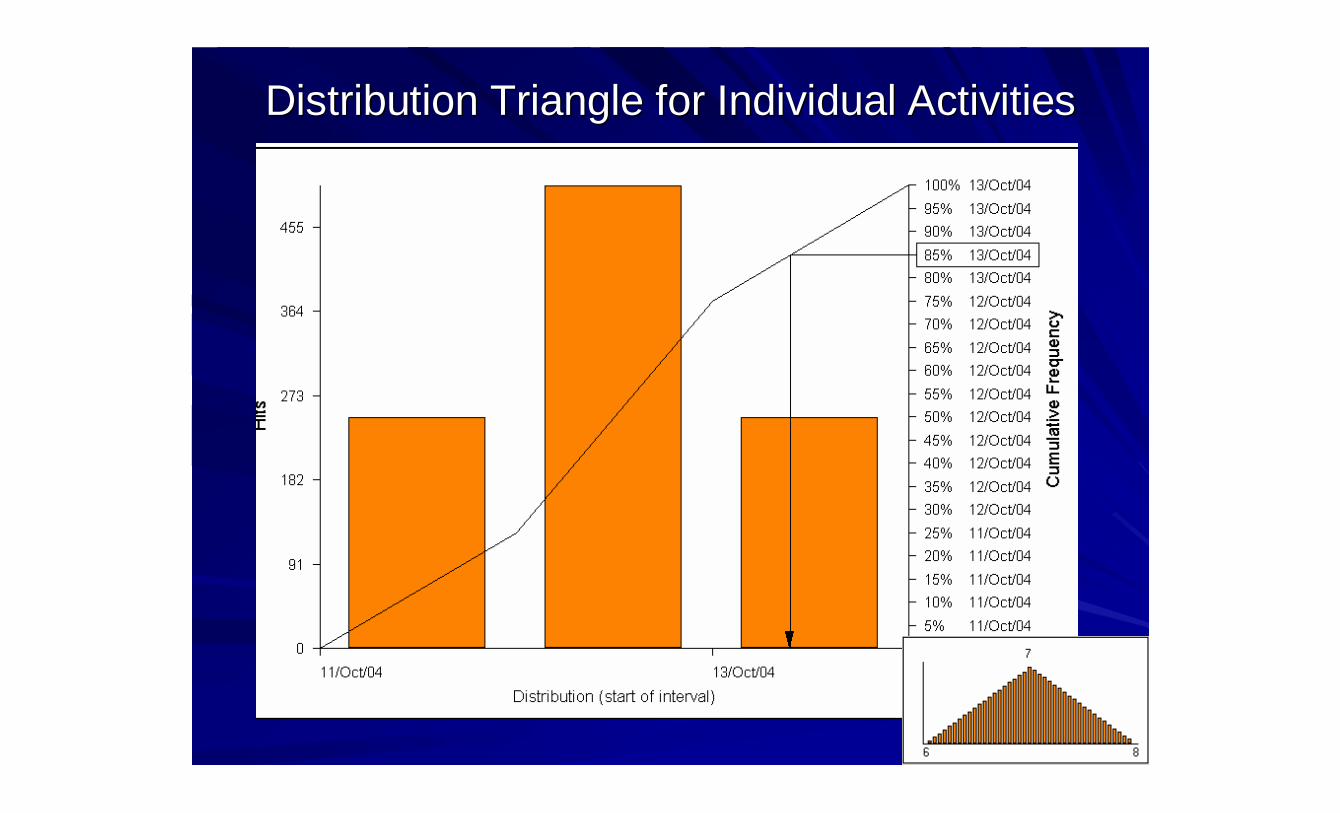
Distribution Triangle for Individual ActivitiesDistribution Triangle for Individual Activities

Finish Date AnalysisFinish Date Analysis


Why Did the Finish Date Change?Why Did the Finish Date Change?Single Path (CPM) vs. Monte Carlo technique(1000 iterations)Parallel Path & Merge Bias Effect ~
WallFramed
InstallElectricalRough-inWalls L2
InstallElectricalRough-inSoffits L2
InstallElectricalRough-inCeiling L2
InstallPhone &
Data CablingL2
InstallSecurity
System RIWalls L2
InstallGWB,
Drywall,and Taping L2
“MergeBias”Point

Cost RiskCost RiskCan be view by activity or entire project ~

Tornado GraphsTornado Graphs ––Criticality IndexCriticality IndexDuring the risk analysis iterations, the number oftimes an activity was critical is recorded ~

Criticality IndexCriticality Index

Schedule Sensitivity IndexSchedule Sensitivity IndexThe SSI identifies and ranks the tasks most likely toinfluence the project duration / finish ~

Duration SensitivityDuration SensitivityCorrelation between the duration of a task and theduration of the project.The task with the highest duration sensitivity is the taskthat is most likely to increase the project duration ~.

The EndThe End
Presentation by Carol Bolstad
Scheduling and Information Services, Inc.www.1sis.com
SIS can perform Risk Analysis on your schedule.


