THIS REPORT CONTAINS ASSESSMENTS OF COMMODITY AND TRADE ISSUES MADE BY
USDA STAFF AND NOT NECESSARILY STATEMENTS OF OFFICIAL U.S. GOVERNMENT
POLICY
Date:
GAIN Report Number:
Approved By:
Prepared By:
Report Highlights:
The value of the Japanese food processing industry was estimated at 23.2 trillion yen in 2015, down
0.3% from 2014. However, the market is relatively stable and provides many opportunities and rewards
for U.S. food and agricultural product exporters.
Sumio Thomas Aoki, Senior Marketing Specialist
Interns: Anne Oakley, Moe Sakamoto, Dianna Santodonato
Rachel Nelson, Director
Food Processing Sector
Food Processing Ingredients
Japan
JA6521
12/22/2016
Required Report - public distribution

Post:
Executive Summary:
SECTION I: Market Summary
A. Overall Market Summary
The value of the Japanese food processing industry was estimated at 23.2 trillion yen in 2015.
Although the data showed a slight decrease of 0.3% from 2014, the Japanese food processing
industry has been relatively stable in recent years.
Note: Because of the fluctuating exchange rate, the data in this report is in Japanese Yen. The
following table of average annual exchange rate is provided for the readers’ reference:
Figure 1: Average Annual Yen/USD Exchange Rate
Yearly average 2012 2013 2014 2015
JPY per USD 80.82 98.65 106.85 122.05
Source: http://murc-kawasesouba.jp/fx/year_average.php
In 2015, sales of alcoholic beverages, wheat flour, confectionery products, dairy product, fats,
oils, tea, coffee, cocoa, processed meats, frozen foods and retort products increased. The most
significant increase was in health foods, which reflects the Japanese interest in healthy lifestyles
and the demands of the aging society. On the other hand, the categories of soft drinks, juices,
and water; other marine products; sugars; fish paste and canned and bottled foods were slightly
down in 2015. There was no major change in the overall sales value, thus showing the stability
of the food processing industry.
Tokyo ATO

Figure 2: Japanese Food Processing Industry Sales 2012-2015
Category of
Foods
2014
(Million
Yen)
2015
(Million
Yen)
2016 Est.
(Million
Yen)
% change Compositio
n (%)
(2015/2014
)
(2016/2015
) 2015
Soft Drinks,
Juices,
Water
3,687,067 3,676,024 3,658,783 99.7% 99.5% 15.9%
Alcoholic
Beverage 3,330,483
3,369,485 3,384,030 101.2% 100.4% 14.6%
Wheat Flour 2,494,700 2,524,800 2,516,100 101.2% 99.7% 10.9%
Confectioner
y 2,395,000
2,388,700 2,408,200 99.7% 100.8% 10.3%
Dairy 2,182,962 2,222,510 2,243,145 101.8% 100.9% 9.6%
Fats & Oils 1,924,790 1,943,265 1,960,840 101.0% 100.9% 8.4%
Other
Processed
Agricultural
Products
1,693,059 1,704,952 1,704,703 100.7% 100.0% 7.4%
Health Foods 1,000,000 1,050,000 1,110,000 105.0% 105.7% 4.5%
Tea, Coffee,
& Cocoa 923,430 929,580 929,370 100.7% 100.0% 4.0%
Processed
Meats 740,000
750,000 746,000 101.4% 99.5% 3.2%
Other
Marine
Products
707,065
701,129 689,195 99.2% 98.3% 3.0%
Frozen
Foods 675,990
680,040 686,650 100.6% 101.0% 2.9%
Sugars 488,970 475,350 475,080 97.2% 99.9% 2.1%
Retort 327,015 329,200 330,300 100.7% 100.3% 1.4%
Fish Paste 306,380 300,789 304,559 98.2% 101.3% 1.3%
Canned &
Bottled
Foods
211,452
210,912 213,557 99.7% 101.3% 0.9%
Total 23,088,36
3
23,256,73
6
23,360,51
2 100.7% 100.4% 100%
Source: Shurui Shokuhin Tokei Geppo (酒類食品統計月報1月号, January 2015 pp19, 2016 pp20)
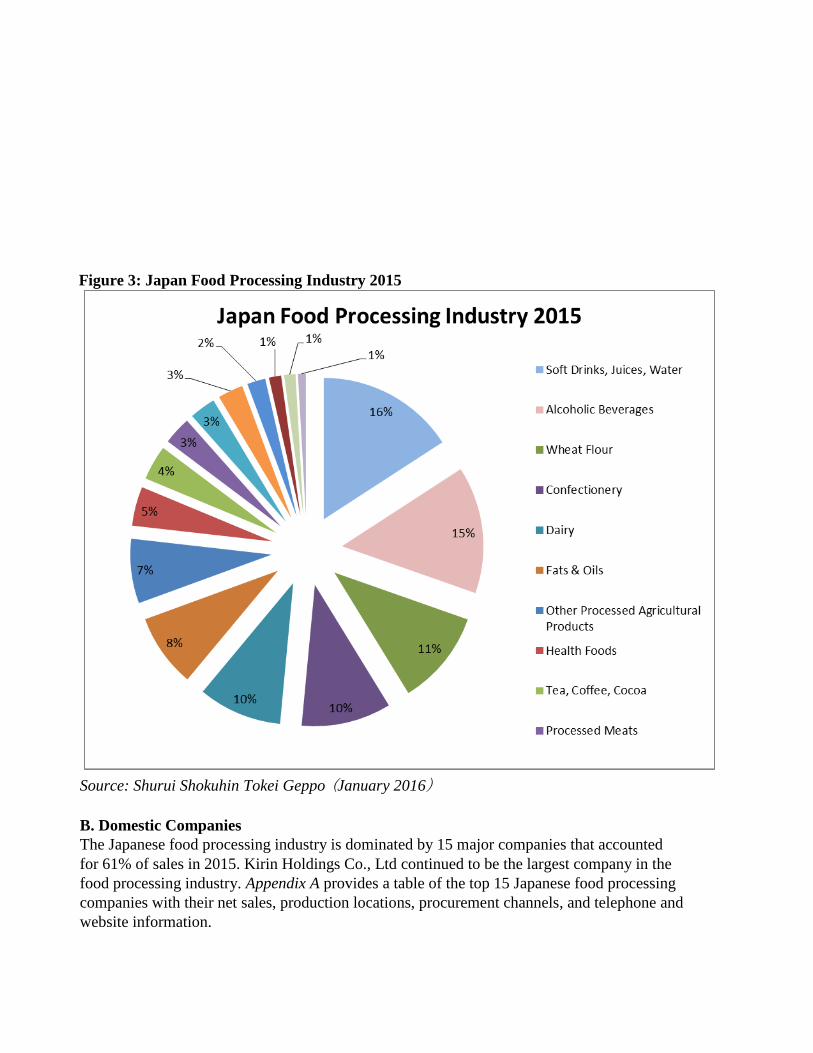
Figure 3: Japan Food Processing Industry 2015
Source: Shurui Shokuhin Tokei Geppo (January 2016)
B. Domestic Companies
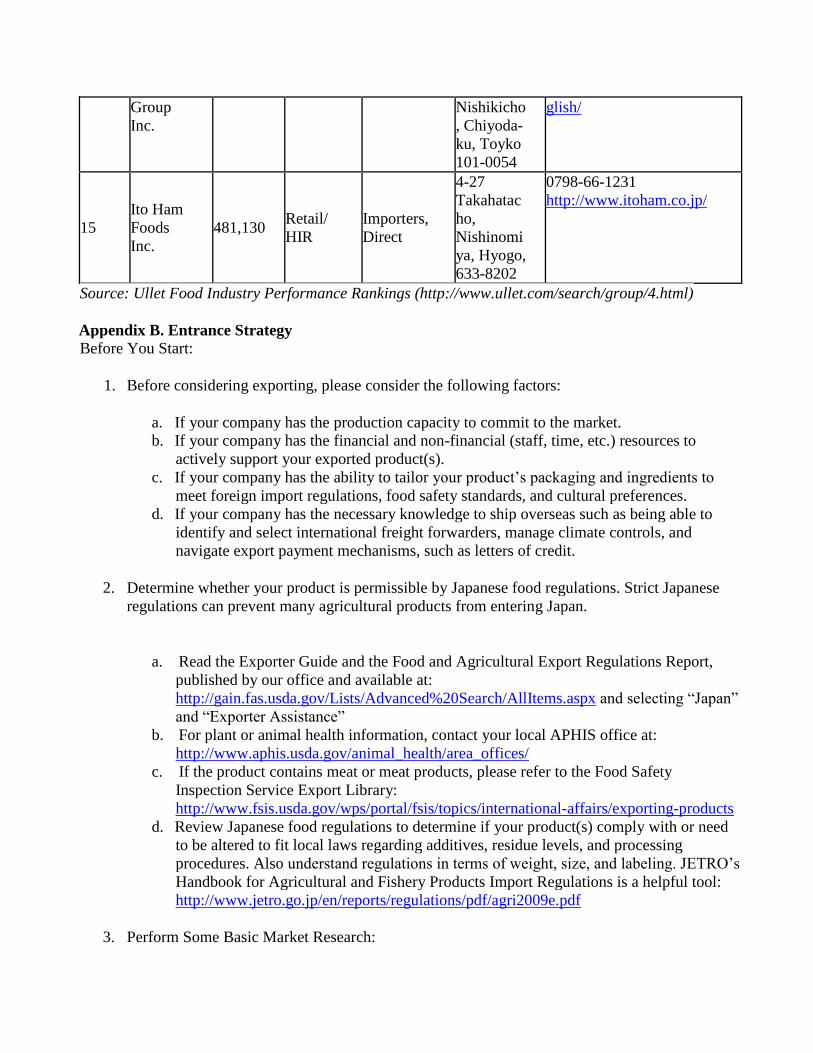
The Japanese food processing industry is dominated by 15 major companies that accounted
for 61% of sales in 2015. Kirin Holdings Co., Ltd continued to be the largest company in the
food processing industry. Appendix A provides a table of the top 15 Japanese food processing
companies with their net sales, production locations, procurement channels, and telephone and
website information.

C. Key Market Drivers
Key market drivers for the food processing sector in Japan frequently change however some
recent ones include:
A deflationary economic environment, causing processors to seek out lower-cost food inputs
and international processing options to maintain competitive prices. A weak Japanese yen
causing a slowdown in imports.
Continued diversification of the Japanese diet.
Personalization and individualization of food and food marketing.
Increasing emphasis on convenience, ready-to-eat foods due to changes in the Japanese family
structure.
Heightened consumer and retailer food safety concerns.
Decreasing consumer demand for some products due to the aging population and lower fertility
rate.
Increasing interest in health and functional foods with an emphasis on the needs of the growing
senior population.
D. U.S. Involvement in the Industry The United States is one of the largest exporters and suppliers of agricultural products to the
Japanese market, representing 10.27% of Japanese agricultural imports in 2015.
Figure 4: Major Food Exporters to Japan in 2015
Partner
Country
United States Dollars
(Billions)
% Share %
Change
Rank 2013 2014 2015 2013 2014 2015 15/14
World 832,627 812,954 648,083 100
100.00
100.00
- 20
1 China 180,840 181,038 160,624
21.72
22.27 24.78 - 12
2 United States 69,824 71,386 66,589 8.39 8.78 10.27 - 7
3 Australia 50,989 48,176 34,822 6.12 5.93 5.37 - 28
4 Saudi Arabia 49,888 47,521 25,070 5.99 5.85 3.87 - 47
5 United Arab
Emirates
42,521 41,771 23,516 5.11 5.14 3.63 - 44
6 Qatar 37,007 33,575 16,345 4.44 4.13 2.52 - 51
7 Korea, South 35,852 33,408 26,815 4.31 4.11 4.14 - 20
8 Malaysia 29,778 29,204 21,532 3.58 3.59 3.32 - 26
9 Indonesia 28,849 25,656 19,765 3.46 3.16 3.05 - 23
10 Germany 23,784 24,140 20,279 2.86 2.97 3.13 - 16
Source: Global Trade Atlas: Agricultural Total Group 2
Source: Global Trade Atlas

Figure 5: Major Food Exporters to Japan in 2015
Source: Global Trade Atlas
Figure 6: Japan Import Statistics from United States 2015
Description Value (U.S. Dollars)
%
Change
2013 2014 2015 2015/2014
Beverages 384,615,631 361,244,972 362,880,548 0.45
Preserved Food 44,533,083 43,177,909 35,411,677 -17.99
Cereals 10,295,847 16,326,165 15,088,340 -7.58
Misc. Grain, Seed 3,372,642 3,434,570 3,861,750 12.44
Meat 535,914 543,424 497,162 -8.51
Edible Fruit and Nuts 326,385 269,393 259,706 -3.6
Vegetables 179,508 162,429 139,252 -14.27
Prepared or Preserved Meat 129,320 122,692 114,343 -6.8
Sugars 60,582 67,868 70,072 3.25
Dairy, Eggs, Honey 67,898 87,173 65,739 -24.59
Baking Related 79,470 74,749 63,273 -15.35
Sausages, Similar Products 12,035 10,732 10,820 0.81
Cocoa 7,540 6,542 6,696 2.36
Spices, Coffee, Tea 4,135 3,540 3,337 -5.74
Soybean Oil, derivatives, not
chemically modified 2,633 3,140 1,897 -39.58
Global Trade Atlas, Japan Import Statistics, All AG Simplified. (Figures Rounded)
E. Analysis Some key factors affecting food exports to Japan are:
1. Japanese consumers enjoy trying new types of food.
2. The weak Japanese yen exchange rate in 2015 made imported food more expensive and
drove down food imports from foreign countries to Japan.
The U.S. supplies many important components of Japanese food. For example, about 70% of
soybeans are imported from the United States. Soybeans are a staple of Japanese food culture
and are used for tofu, miso, natto, soy milk, soy sauce, and many other common items. China
enjoys a geographical advantage, which affects prices and its ability to ship fresh products.
F. Key Advantages and Challenges for U.S. Food Products In addition to the U.S. being a large food exporter to Japan, Japanese consumers are familiar
with common U.S. ingredients such as meats, dried fruits, nuts, etc. Products from the U.S.
are also recognized for their high quality, trendiness, and health benefits. Some of the key
advantages and challenges for U.S. food products are:
Advantages Challenges
The U.S. has a reputation as a reliable supplier of
food inputs in terms of availability and
trustworthiness.
Consumers perceive Japanese food as safer
than imported food, including food from the
U.S.
Manufacturers in the U.S. produce many specialty
food products that are attractive to Japanese
consumers.
Getting a meeting with the most appropriate
purchaser or company can be difficult in
Japan.
Many Japanese consumers love American culture
and cuisine.
Getting product information to the
consumer is a challenge.
G. Industry Developments
The stagnation of personal consumption was a challenge for the Japanese food processing
industry in 2015. Due to the unstable pricing for commodities affected by the weak yen,
purchasing power of the Japanese consumers decreased. Companies were faced with the
challenge of finding ways to produce a product that would enhance the customers’ desire to
purchase it despite cutbacks.
Sales of wheat flour, confectionery products, dairy products and other processed products
increased in 2015. Many companies launched new brands as well as upscale versions of
their original brands in order to stimulate consumption.
Here are a few of examples of these new brands products:
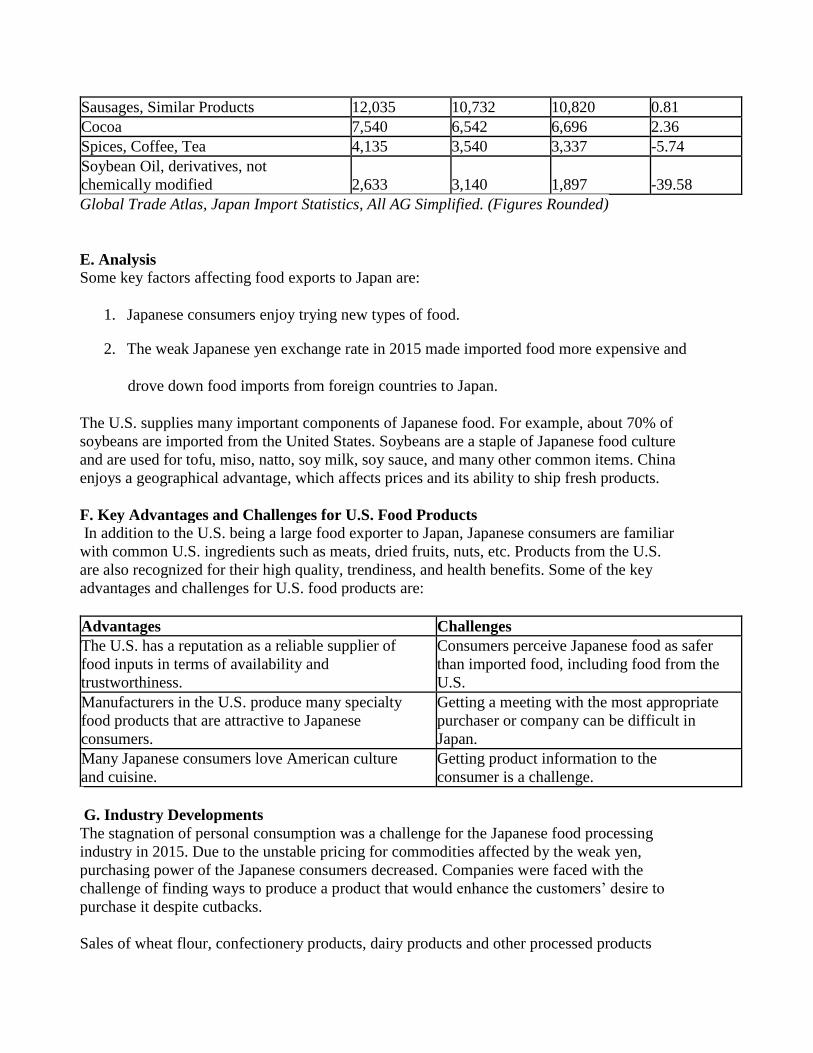
In November 2015, Japanese confectionery company Ezaki Glico Co., Ltd. introduced an
upscale version of their signature ice cream products, but these were aimed at adults instead
of children. They released two different flavors, “Papico Otona-
no Chocolate” and “Ice no mi Otona-no Cafelatte” which
became tremendously popular. “Otona-no” means “for adults” in
Japanese, but it also implies “high quality.” Glico introduced
this new series to capture the interests of customers whom do
not usually buy retail ice cream products. “Otona-no” became
a new popular keyword for naming and marketing products in
the food processing market, commonly used with upscale
versions of traditional products.
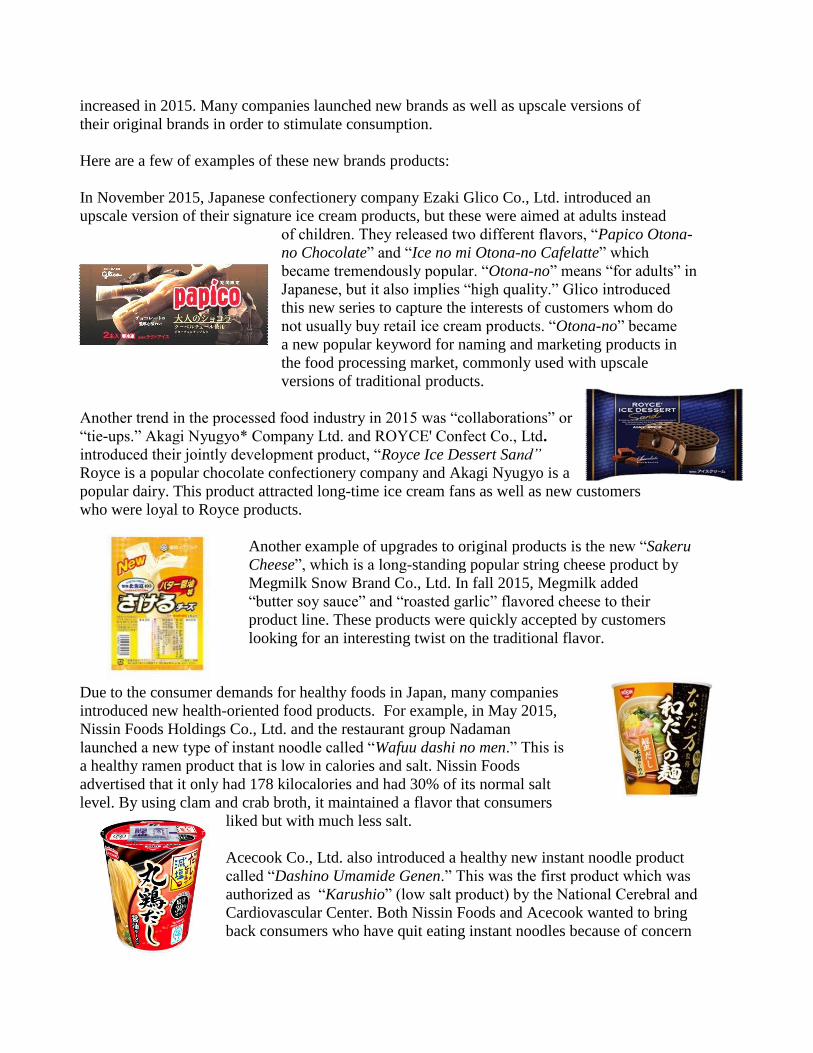
Another trend in the processed food industry in 2015 was “collaborations” or
“tie-ups.” Akagi Nyugyo* Company Ltd. and ROYCE' Confect Co., Ltd.
introduced their jointly development product, “Royce Ice Dessert Sand”
Royce is a popular chocolate confectionery company and Akagi Nyugyo is a
popular dairy. This product attracted long-time ice cream fans as well as new customers
who were loyal to Royce products.
Another example of upgrades to original products is the new “Sakeru
Cheese”, which is a long-standing popular string cheese product by
Megmilk Snow Brand Co., Ltd. In fall 2015, Megmilk added
“butter soy sauce” and “roasted garlic” flavored cheese to their
product line. These products were quickly accepted by customers
looking for an interesting twist on the traditional flavor.
Due to the consumer demands for healthy foods in Japan, many companies
introduced new health-oriented food products. For example, in May 2015,
Nissin Foods Holdings Co., Ltd. and the restaurant group Nadaman
launched a new type of instant noodle called “Wafuu dashi no men.” This is
a healthy ramen product that is low in calories and salt. Nissin Foods
advertised that it only had 178 kilocalories and had 30% of its normal salt
level. By using clam and crab broth, it maintained a flavor that consumers
liked but with much less salt.
Acecook Co., Ltd. also introduced a healthy new instant noodle product
called “Dashino Umamide Genen.” This was the first product which was
authorized as “Karushio” (low salt product) by the National Cerebral and
Cardiovascular Center. Both Nissin Foods and Acecook wanted to bring
back consumers who have quit eating instant noodles because of concern

for the amount of salt these products normally contain.
The very popular green tea product, “Lemon Tokucha” by Suntory Holdings., Ltd.
added a two-liter sized bottle in its lineup for family rather than individual use. The
tea includes the ingredients quercetin glycoside, which is
believed to help reduce body fat. In 2015, shipments of Tokucha expanded by
125%, making it the top selling item among functional food (FOSHU)
products.
Nissin Seifun Group Inc. received an award from the
Nikkei Marketing
Journal for their new flour product. Nissin used new manufacturing
methods to create a smoother flout texture than ever before. Also, the
new package, which is more compact and has a lid that can be opened
two different ways, received favorable feedback from consumers. They
say the packaging makes it easier to measure the flour. This innovation
made it a very popular new item in 2015.
SECTION II: Market Structure & Entry
A. Market Structure
The Japanese market structure and distribution system is different from that of the United States.
The following illustration is a basic flowchart showing how imported products enter and move
through the traditional Japanese distribution system:
Figure 7: Food Ingredient Distribution Flow Chart
Your product will most likely be handled by a:
1. General trading company
2. First-line wholesaler
3. Second-line wholesaler
4. Retailer, HRI or food processor
U.S. Exporter
Retailers & HRI
Japanese Importer
- Large trading company
- Specialty importer
Large Food
Processors
Primary
Wholesaler
Secondary
Distributor
Small Food
Processor

Trading companies play the following roles:
1. Legal importer
2. Financing
3. Customs clearance
4. Warehousing
5. Preparation of order and shipping documentation
In the past, trading companies would normally sell to first-line wholesalers, who would then
sell to secondary distributors. This pattern has changed in the past decade as companies seek to
reduce logistical costs. Large food processors and retailers are now purchasing sizeable quantities
of product directly from trading companies.
In some cases, the HRI and retail sectors are choosing to directly import items themselves if the
size of the transaction makes it cost effective, as displayed in the graph above by the dotted line
from exporters to retailers and HRI.
These HRI importers are often large family-owned chain restaurants, kaiten (conveyer belt)
sushi restaurants, and regional restaurants. Often times, the importer or trading company needs
to also add value through special processing, designing, or packaging. These transactions
circumvent the usual second-line wholesalers and distributors.
B. Market Entry It can be difficult to enter the Japanese market. There are many factors to consider, such as
strict regulations on some ingredients and additives, demands for consistency and high quality,
and the amount of information that buyers will ask for before making a decision to import.
Despite this, the Japanese market has enormous potential. With Japan’s changing demographics,
demand is shifting and new opportunities are constantly presenting themselves.
Strategies for entering the Japanese market will vary depending on product characteristics,
competition, and the market environment. However, Japan is a very competitive market.
Therefore, buyers in the food and beverage industry are inundated with meeting requests and
do not respond well to requests for meetings with individual companies that they do not know.
Instead, they prefer to find new products at large trade shows, or specially targeted trade
showcases, where they can look at many products at once. Therefore, the best way to learn
about the market while getting the chance to talk to potential business partners is to participate
in a trade show.
The largest food related trade show in Japan is FOODEX Japan, which takes place every March.
Depending on your target market, other smaller trade shows can also be useful, such as the
Supermarket Trade Show, International Food Ingredients and Additives Exhibition, Patisserie
and Bakery Show, the Tokyo International Gift Show, Health Food Exhibition, etc.
USDA works very closely with a few regional organizations in the United States, which are
designed to help agricultural exporters, and offer export counseling to food and beverage
companies and bring delegations to shows, often helping defer the costs of exhibiting. The
regional contacts are:

Southern US Trade Association (SUSTA); http://www.susta.org
States AL, AR, FL, GA, KY, LA,MD, MS, NC, OK, PR, SC, TE, TX, VA, WV
Western US Agricultural Trade Association (WUSATA); https://www.wusata.org/
States: AL, AZ, CA, CO, HI, ID, MT, NV, NM, OR, UT, WY
FOODEXPORT Northeast; (215) 829-9111; [email protected]; https://www.foodexport.org/
States: DE, NY, VT, CT, MA, ME, RI, NH, NJ, PA
FOODEXPORT Midwest, (312) 334-9200; [email protected]; https://www.foodexport.org
States: IL, IN, KS, MN, MO, NE, IA, MI, ND, OH, SD, WI
The Agricultural Trade Office is also available for consultations about the potential for your
product in the market. For further guidance and a more detailed outline of the variety of resources
available to U.S. exporters, please refer to Appendix B.
SECTION III: Sector Trends and Products with Good Sales Potential
A. Consumer Trends At the consumer level, the following trends are driving the way food processors markettheir products.
1. Beauty & Anti-Aging
Products that offer beauty or anti-aging benefits have always been popular in the Japanese market.
Research has shown that over 80% of Japanese women are aware of the word “Anti-aging”, and it
is a keyword that especially attracts Japanese female consumers.
Most recently, products which combine collagen, elastin, and/or hyaluronic acid are popular
among female consumers. Products containing “superfoods” linked to “beauty from within” such
as coconut oil and chia seeds have also become extremely popular in 2015. These ingredients are
all said to have various benefits for the skin, hair, and general health, and can be found in many
new products.
Another very popular example is gummy candy that has added collagen to improve
skin health. Through mass media and SNS, these foods have gained tremendous popularity among
mainly female consumers. Food manufacturers in Japan are always looking for the next
“superfood” or anti-aging breakthrough ingredients to introduce into their products, so exporters
with new ingredients with beauty-related benefits that can tap into this demand can do very well
in this market. It is especially helpful if you can offer something that is not yet widely available
in Japan.
2. Health and Functional Foods
Like anti-aging and beauty related food items, food with other health benefits is also highly
prized in Japan. A recent study showed that over 70% of Japanese people feel the need to live a
healthy lifestyle, and over 90% of Japanese women have experienced dieting. A healthy diet is
an extremely valued concept in Japan, and many people aim to maintain a healthy diet by
excluding instant foods which contain artificial ingredients or additives or adding foods with
special properties.
Functional foods have gained popularity from all generations in Japan. The official definition of
functional foods (FOSHU) and drinks in Japan is “food which is expected to have a specified
effect on health due to the relevant constituents or food from which allergens have been removed.
” Functional ingredients such as dietary fiber, oligosaccharides, non-calorie sweeteners, calcium,
iron, mineral absorption promoters, beta-carotene, chitosan, specified soy protein, collagen,
polyphenols, lactic acid bacteria cultures, soy isoflavones, and germinated brown rice (GABA)
have been included in functional foods marketed in Japan. As of December 2015, there were
149 products approved for use on foods and the list is growing rapidly.
Examples of functional foods include yogurt or chocolate with lactic bacteria to help digestion
and blueberry smoothies with lutein, which is shown to improve eye health. The major
distribution line for these functional food products is through supermarkets and convenience stores.
3. “Gohoubi Shouhi”
According to research conducted by the Japanese Cabinet Office, approximately 70% of the
Japanese population classifies themselves as middle class. Despite years of deflationary pressures
restricting income growth, there is a concept of enjoying small luxuries that is popular in Japan.
This idea is called “Gohoubi Shouhi” (Reward Consumption).
“Gohoubi Shouhi” is a consumer behavior in which individuals treat and reward themselves by
purchasing pricey products. Approximately 38% of Japanese women report that they spend
money on Gohoubi Shouhi once a month. They are especially more likely to spend their extra
money on dessert and confectionery products. Many convenience stores have launched up-scale
and premium versions of products in their confectionery lines for those who are willing to spend
extra money on better quality products.
“Puchi Zeitaku” (Mini luxury), “Otonano” (Adult or Upgraded) are other keywords that refer to
this concept. Many products such as limited-time special flavor products and craft beers are
sold at slightly higher prices than normal products for the Gohoubi Shouhi market.
4. Increasing purchasing power of women
Japanese women have always had a great deal of responsibility for daily purchases for
themselves and their families. However, due to the increase in the number of working women
in Japan, net household income has risen. Thus, the purchasing power of Japanese women has
increased, as has their reliance on convenience stores for food purchases. It is therefore essential
to look carefully at female consumer behavior when it comes to creating marketing strategies
in Japan because of the influence Japanese women have in regards to purchasing so many items.
With the increase of women in the workforce, many confectionery companies have launched
products that target working women. In convenience stores in Japan, you can find a variety of
mini size packaged candy, snacks, and chocolates in the confectionery area that target working
women who want a sweet snack with their coffee or lunch. However, the confectionery market

is extremely competitive.
5. Growth of Convenience Foods
Along with the increase in the number of working women and the overall long hours worked in
Japan has been an increase in demand for convenience foods as a replacement for meals made
from scratch at home. The best example is the rapid expansion of convenience (konbini) store
chains over the past decades, which specialize in a large variety of prepared meals. Examples
of prepared meals are traditional bento lunch boxes, onigiri (rice balls), pasta dishes,
sandwiches, salads, baked goods, and desserts. Ingredients such as low-cost processed
vegetables for bento lunches or ingredients in snack foods such as croquettes, fried potatoes,
and meat patties, are in high demand.
As the number of households with two working parents has increased, so had the demand for
easy-to-prepare meals. Another factor is that young Japanese are marrying later, so single people
tend to choose easy-to-prepare single-portion meals. Packaged sauces, meals in-a-box, instant
meals, and other convenient options are growing in popularity and will most likely continue to
grow.
6. Demographic Issues in Japan
Japan is undergoing a major demographic change. Due to low fertility rates, the percentage of
young people has been shrinking since the 1980’s. On the other hand, the population for Japanese
aged 60 and over has been growing, and now accounts for approximately 44% of the total
population. By the end of this decade, there will be three pensioners for every child under 15
in Japan. This significant change has impacted consumer demands.
One impact has been to intensify the already strong demand for healthy and functional food
products. Many domestic firms in Japan have begun the process of creating product lines that
target the physical and dietary needs of elderly people. These include high-nutrient food
products, anti-aging foods, and pureed foods which elderly people can eat with ease (often
referred to in this market as “care food” or “universal design”. Some companies claim that
products in the market need improvements in areas of taste, texture, and price. Thus, raising
the quality and lowering the price of these products is the current challenge for food producers.
B. Producer Trends The best place to see producer trends is at the large trade shows. As mentioned earlier in this
report, one of the largest food trade shows in Japan is FOODEX (see Appendix: Entry Strategy:
part 3) which lasts four days and usually attracts more than 76,000 trade-only visitors
including food service, trading, wholesalers, manufacturing, and retail. FOODEX provides
business opportunities for exhibitors to expand their business as well as receive contacts from
industry professionals. The FOODEX organizers also provide data on the types of products most
sought out by visitors.
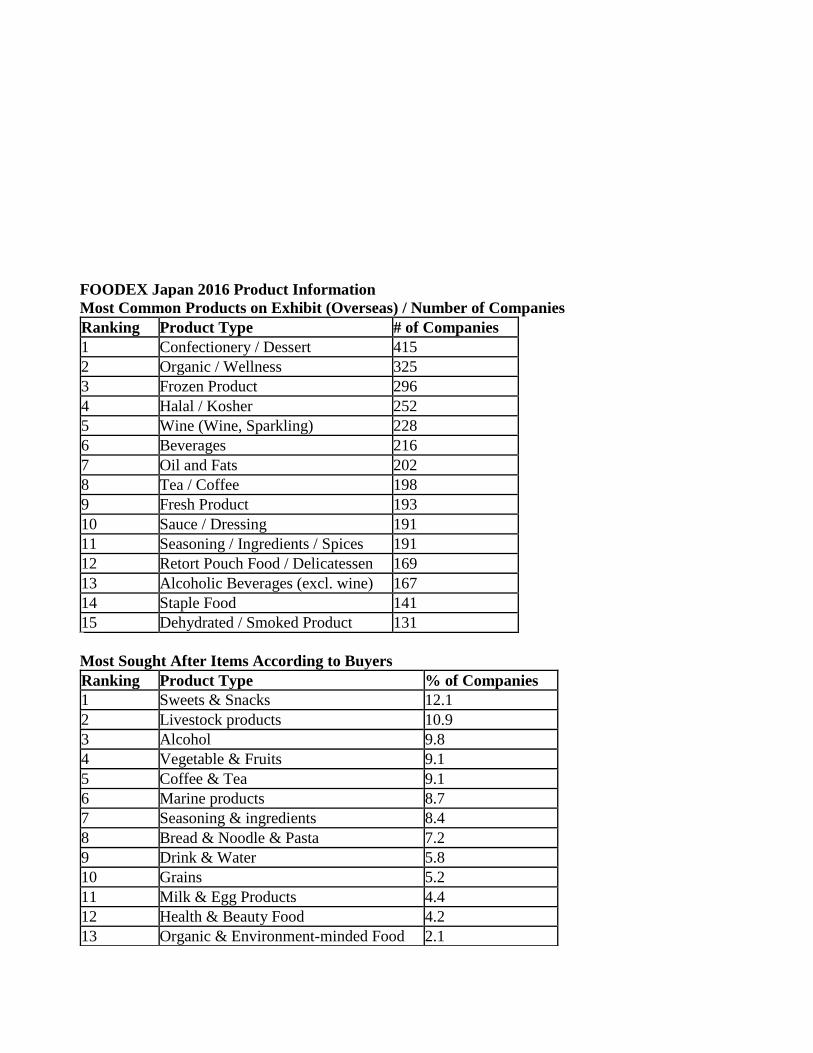
FOODEX Japan 2016 Product Information
Most Common Products on Exhibit (Overseas) / Number of Companies
Ranking Product Type # of Companies
1 Confectionery / Dessert 415
2 Organic / Wellness 325
3 Frozen Product 296
4 Halal / Kosher 252
5 Wine (Wine, Sparkling) 228
6 Beverages 216
7 Oil and Fats 202
8 Tea / Coffee 198
9 Fresh Product 193
10 Sauce / Dressing 191
11 Seasoning / Ingredients / Spices 191
12 Retort Pouch Food / Delicatessen 169
13 Alcoholic Beverages (excl. wine) 167
14 Staple Food 141
15 Dehydrated / Smoked Product 131
Most Sought After Items According to Buyers
Ranking Product Type % of Companies
1 Sweets & Snacks 12.1
2 Livestock products 10.9
3 Alcohol 9.8
4 Vegetable & Fruits 9.1
5 Coffee & Tea 9.1
6 Marine products 8.7
7 Seasoning & ingredients 8.4
8 Bread & Noodle & Pasta 7.2
9 Drink & Water 5.8
10 Grains 5.2
11 Milk & Egg Products 4.4
12 Health & Beauty Food 4.2
13 Organic & Environment-minded Food 2.1
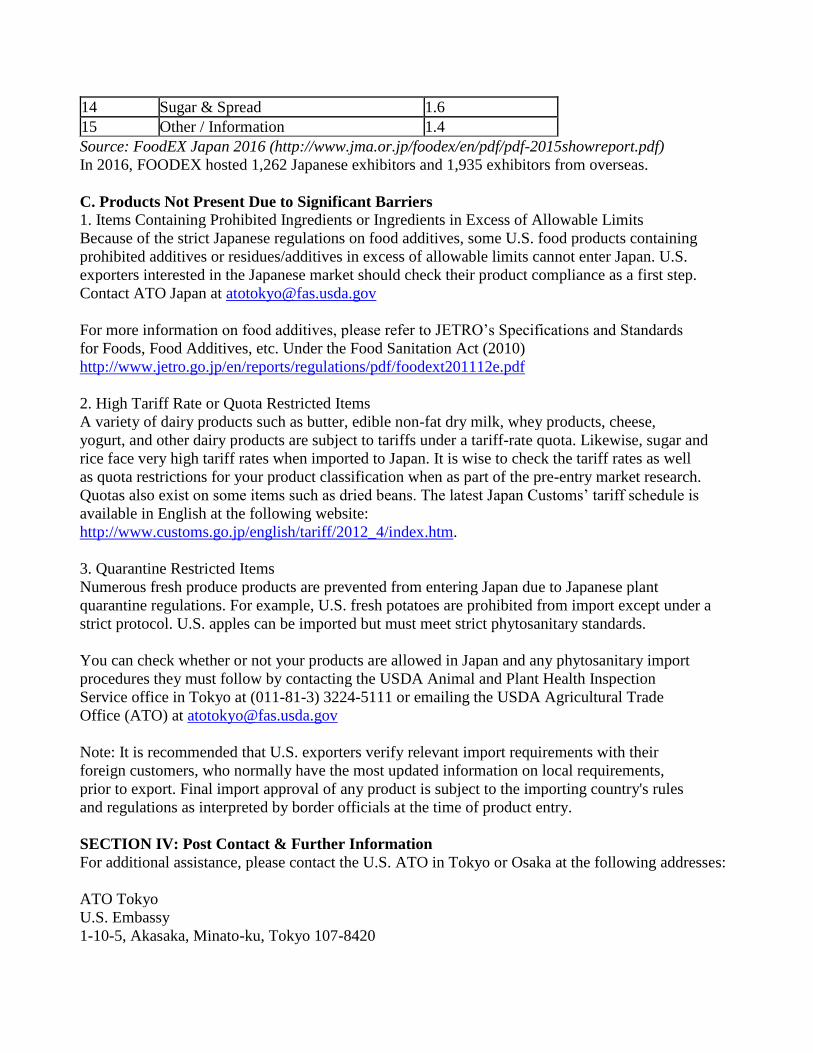
14 Sugar & Spread 1.6
15 Other / Information 1.4
Source: FoodEX Japan 2016 (http://www.jma.or.jp/foodex/en/pdf/pdf-2015showreport.pdf)
In 2016, FOODEX hosted 1,262 Japanese exhibitors and 1,935 exhibitors from overseas.
C. Products Not Present Due to Significant Barriers 1. Items Containing Prohibited Ingredients or Ingredients in Excess of Allowable Limits
Because of the strict Japanese regulations on food additives, some U.S. food products containing
prohibited additives or residues/additives in excess of allowable limits cannot enter Japan. U.S.
exporters interested in the Japanese market should check their product compliance as a first step.
Contact ATO Japan at [email protected]
For more information on food additives, please refer to JETRO’s Specifications and Standards
for Foods, Food Additives, etc. Under the Food Sanitation Act (2010)
http://www.jetro.go.jp/en/reports/regulations/pdf/foodext201112e.pdf
2. High Tariff Rate or Quota Restricted Items
A variety of dairy products such as butter, edible non-fat dry milk, whey products, cheese,
yogurt, and other dairy products are subject to tariffs under a tariff-rate quota. Likewise, sugar and
rice face very high tariff rates when imported to Japan. It is wise to check the tariff rates as well
as quota restrictions for your product classification when as part of the pre-entry market research.
Quotas also exist on some items such as dried beans. The latest Japan Customs’ tariff schedule is
available in English at the following website:
http://www.customs.go.jp/english/tariff/2012_4/index.htm.
3. Quarantine Restricted Items
Numerous fresh produce products are prevented from entering Japan due to Japanese plant
quarantine regulations. For example, U.S. fresh potatoes are prohibited from import except under a
strict protocol. U.S. apples can be imported but must meet strict phytosanitary standards.
You can check whether or not your products are allowed in Japan and any phytosanitary import
procedures they must follow by contacting the USDA Animal and Plant Health Inspection
Service office in Tokyo at (011-81-3) 3224-5111 or emailing the USDA Agricultural Trade
Office (ATO) at [email protected]
Note: It is recommended that U.S. exporters verify relevant import requirements with their
foreign customers, who normally have the most updated information on local requirements,
prior to export. Final import approval of any product is subject to the importing country's rules
and regulations as interpreted by border officials at the time of product entry.
SECTION IV: Post Contact & Further Information
For additional assistance, please contact the U.S. ATO in Tokyo or Osaka at the following addresses:
ATO Tokyo
U.S. Embassy
1-10-5, Akasaka, Minato-ku, Tokyo 107-8420
Tel: 81-3-3224-5115 Fax: 81-3-3582-6429
E-mail address: [email protected]
ATO Osaka
American Consulate General
2-11-5, Nishi Tenma, Kita-ku, Osaka City, Osaka 530-8543
Tel: 81-6-6315-5904 Fax: 81-6-6315-5906
E-mail address: [email protected]
You can also find more information about the USDA offices in Japan by visiting our website at
http://www.usdajapan.org/ or following us on twitter at @USDAJapan.
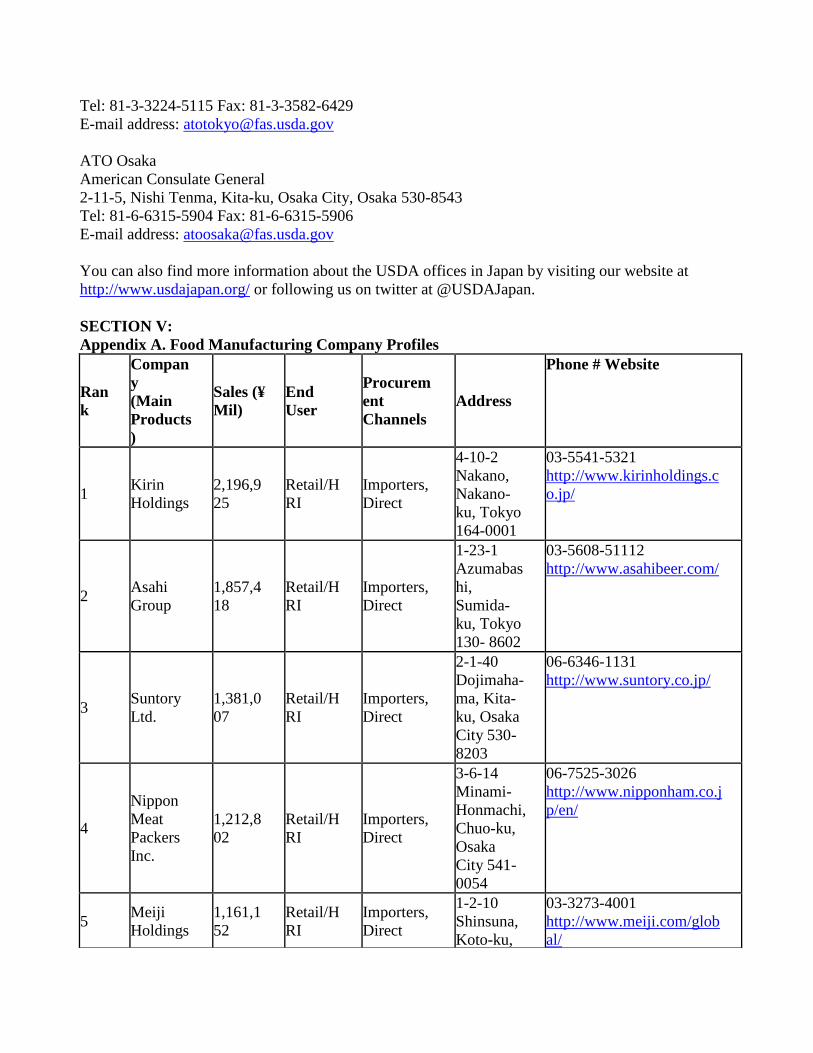
SECTION V:
Appendix A. Food Manufacturing Company Profiles
Ran
k
Compan
y
(Main
Products
)
Sales (¥
Mil)
End
User
Procurem
ent
Channels
Address
Phone # Website
1 Kirin
Holdings
2,196,9
25
Retail/H
RI
Importers,
Direct
4-10-2
Nakano,
Nakano-
ku, Tokyo
164-0001
03-5541-5321
http://www.kirinholdings.c
o.jp/
2 Asahi
Group
1,857,4
18
Retail/H
RI
Importers,
Direct
1-23-1
Azumabas
hi,
Sumida-
ku, Tokyo
130- 8602
03-5608-51112
http://www.asahibeer.com/
3 Suntory
Ltd.
1,381,0
07
Retail/H
RI
Importers,
Direct
2-1-40
Dojimaha-
ma, Kita-
ku, Osaka
City 530-
8203
06-6346-1131
http://www.suntory.co.jp/
4
Nippon
Meat
Packers
Inc.
1,212,8
02
Retail/H
RI
Importers,
Direct
3-6-14
Minami-
Honmachi,
Chuo-ku,
Osaka
City 541-
0054
06-7525-3026
http://www.nipponham.co.j
p/en/
5 Meiji
Holdings
1,161,1
52
Retail/H
RI
Importers,
Direct
1-2-10
Shinsuna,
Koto-ku,
03-3273-4001
http://www.meiji.com/glob
al/

Tokyo
136-8908
6
Yamazak
i Baking
Co., Ltd.
1,027,1
99
Retail/H
RI
Importers,
Direct
3-10-1,
Iwamoto-
cho,
Chiyoda-
ku, Tokyo
101-8585
03-3864-3111
http://www.yamazakipan.c
o.jp/
7
Ajinomot
o Co.,
Inc.
1,006,6
30
Retail/H
RI
Importers,
Direct
1-15-1
Kyobashi,
Chuo -ku,
Tokyo 104
-8315
03 -5250 -8111
http://www.ajinomoto.com
/
8
Morinaga
Milk
Industry
Co., Ltd.
594,834 Retail/H
RI
Importers,
Direct
5-33-1
Shiba,
Minato-
ku, Tokyo
108 -8384
03 -3798 -0111
http://www.morinagamilk.
co.jp/
9
Kewpie
Corporati
on
578,192 Retail/H
RI
Importers,
Direct
1-4-13
Shibuya
Shibuya-
ku, Tokyo
150-0002
03-3486-3331
http://www.kewpie.co.jp/e
nglish/
10
Coca-
Cola East
Japan
Co., Ltd.
563,162 Retail Direct
6-1-20
Akasaka,
Minato-
ku, Tokyo
107-0052
045-222-5850
http://www.ccej.co.jp/en/
11
Mega-
Milk
Snow
Brand
Co., Ltd.
549,816 Retail/H
RI
Importers,
Direct
13
Honshio-
cho
Shinjuku-
ku, Tokyo
160-8575
03-6887-3690
http://www.meg-
snow.com/english/
12
Nichiei
Corporati
on
545,266 Retail/H
RI
Importers,
Direct
6-19-20
Tsukiji,
Chuo-ku,
Tokyo 104
-8402
03-3248-2101
http://www.nichirei.co.jp/e
nglish/
13 Sapporo
Holdings 533,748
Retail/H
RI
Importers,
Direct
4-20-1
Ebisu,
Shibuya-
ku, Tokyo
150 -8522
03-6859-2303
http://www.sapporoholding
s.jp/
14 Nissin
Seifun 526,144
Retail/H
RI
Importers,
Direct
1-25
Kanda,
03-5282-6666
http://www.nisshin.com/en
Group
Inc.
Nishikicho
, Chiyoda-
ku, Toyko
101-0054
glish/
15
Ito Ham
Foods
Inc.
481,130 Retail/
HIR
Importers,
Direct
4-27
Takahatac
ho,
Nishinomi
ya, Hyogo,
633-8202
0798-66-1231
http://www.itoham.co.jp/
Source: Ullet Food Industry Performance Rankings (http://www.ullet.com/search/group/4.html)
Appendix B. Entrance Strategy Before You Start:
1. Before considering exporting, please consider the following factors:
a. If your company has the production capacity to commit to the market.
b. If your company has the financial and non-financial (staff, time, etc.) resources to
actively support your exported product(s).
c. If your company has the ability to tailor your product’s packaging and ingredients to
meet foreign import regulations, food safety standards, and cultural preferences.
d. If your company has the necessary knowledge to ship overseas such as being able to
identify and select international freight forwarders, manage climate controls, and
navigate export payment mechanisms, such as letters of credit.
2. Determine whether your product is permissible by Japanese food regulations. Strict Japanese
regulations can prevent many agricultural products from entering Japan.
a. Read the Exporter Guide and the Food and Agricultural Export Regulations Report,
published by our office and available at:
http://gain.fas.usda.gov/Lists/Advanced%20Search/AllItems.aspx and selecting “Japan”
and “Exporter Assistance”
b. For plant or animal health information, contact your local APHIS office at:
http://www.aphis.usda.gov/animal_health/area_offices/
c. If the product contains meat or meat products, please refer to the Food Safety
Inspection Service Export Library:
http://www.fsis.usda.gov/wps/portal/fsis/topics/international-affairs/exporting-products
d. Review Japanese food regulations to determine if your product(s) comply with or need
to be altered to fit local laws regarding additives, residue levels, and processing
procedures. Also understand regulations in terms of weight, size, and labeling. JETRO’s
Handbook for Agricultural and Fishery Products Import Regulations is a helpful tool:
http://www.jetro.go.jp/en/reports/regulations/pdf/agri2009e.pdf
3. Perform Some Basic Market Research:

a. Determine the specific area of the market your product is targeting:
http://www.fas.usda.gov/topics/getting-started
b. Determine whether there is demand for your product by searching online websites,
speaking with other companies with experience in Japan, visiting the market to conduct
market tours, or even better yet, attending a trade show in Japan.
c. Determine whether your product is price competitive against Japanese and other
producers, keeping in mind transportation and modification costs. Determine the
comparative advantage of your products. Potential customers need to be convinced of
the merit of using your products. Some examples are price savings, higher quality,
higher value or more convenient packaging. Packaging or labeling will often have to be
changed for the Japanese market, as American packaging is usually too large.
d. The ATOs in Tokyo and Osaka can assist with market research and developing
marketing strategies.
You should also contact your regional trade group, which works closely with USDA to help food
and agricultural companies advance their exporting goals:
Southern US Trade Association (SUSTA); (504) 568-5986; http://www.susta.org/
States AL, AR, FL, GA, KY, LA,MD, MS, NC, OK, PR, SC, TE, TX, VA, WV
Western US Agricultural Trade Association (WUSATA); (360)693-3373 x 314;
https://www.wusata.org/
States: AL, AZ, CA, CO, HI, ID, MT, NV, NM, OR, UT, WY
FOODEXPORT Northeast; (215) 829-9111; [email protected]; https://www.foodexport.org/
States: DE, NY, VT, CT, MA, ME, RI, NH, NJ, PA
FOODEXPORT Midwest, (312) 334-9200; [email protected]; https://www.foodexport.org/
States: IL, IN, KS, MN, MO, NE, IA, MI, ND, OH, SD, WI
4. Develop an Export Action Plan:
Once you have reviewed the general market research and regulatory information, begin the process
of creating an export action plan. This will be instrumental in helping distributors and buyers see
your vision. Keep in mind that many portions of this plan will change after personal interaction
with the market or as more information is gathered.
This action plan should include:
Your Story
Objective
Goals and benchmarks, short-term and long-term
Product list
Market target
Product packaging and handling
Product modifications, if applicable

Financial resources to be committed
Non-financial resources to be committed
Additional financing
Potential importers and buyers
Schedule
Marketing plan
Evaluation
Literature in Japanese
5. Get to Know the Market Personally:
Once you have determined that exporting your product to Japan is feasible and you have
developed a basic strategy, either visit Japan to explore opportunities first-hand or find a
representative to do so. When appointing agents, be sure your partner has a good reputation and
track record in the market.
This face-to-face interaction is very important in business because in Japan personal
relationships are very important. Additionally, keep in mind that it takes time to form these
relationships.
Understand how the Japanese distribution system works and begin the process of figuring out
where you are should enter.
Finding a Buyer:
1. Trade shows: There are a variety of trade shows, large and small, which are the best avenues for
market research as well as for finding potential distributors. A list of USDA endorsed trade
shows can be found at: http://www.fas.usda.gov/topics/trade-shows
a. The four main recommended trade shows in Japan for the food processing sector are:
-FOODEX JAPAN http://www3.jma.or.jp/foodex/en/
-Supermarket Trade Show http://www.smts.jp/en/
-International Food Ingredients and Additives Exhibition (IFIA) Japan:
http://www.ifiajapan.com/en/
-Health Ingredients Japan http://www.hijapan.info/eng/
b. Contact one of the State Regional Groups listed in 3.d above, and ask if they have any
upcoming activities involving your target market such as trade missions or showcases.
c. Try to meet with Japanese importers who distribute the types of agricultural products
that you wish to export to learn more about the market.
d. Once you make contacts, visit potential customers to emphasize your interest and learn
more about them, such as how they normally source products. Ask if/how products are
normally reformulated and how packaging could be tailored to better fit the
marketplace.
Documentation and Shipping:
1. After revising your export action plan and finding an importer/distributor, begin the process of
setting up a payment structure and working on import documentation requirements. Information
on this area can be found at: http://www.fas.usda.gov/topics/regulations-and-requirements. It is
very important in Japanese business culture to respond thoroughly and promptly to all requests
for information or documentation from your buyer.
2. When ready to ship, consider using a finding a freight forwarder that can handle many of the
logistics of shipping for a fee. Refer to the website above for more information on this
procedure.
Marketing: When ready to market your product, use the ATO Tokyo or Osaka offices as resources for information
on promotion and marketing. Buyers may expect your assistance promoting your product in the
market.
For additional information, refer to the USDA Foreign Agricultural Service’s export assistance
website: http://www.fas.usda.gov/topics/exporting
Helpful Tips: Points to remember when doing business in Japan:
a. Be clear with importers about the conditions under which price adjustments may occur.
b. Be aware that Japan is a very service-oriented culture and requires quick responses to
both product complaints and requests for information.
c. Doing business for the first time in Japan requires patience. Orders normally start small
to determine whether the product will meet market requirements.
d. Arranging a credit check can be a good way to avoid problems. The following
companies will conduct credit checks in English:
Teikoku Databank America, Inc. 780 Third Avenue, 22nd Floor
New York, NY 10017 Tel: 212-421-9805 | Fax: 212-421-9806
Email: [email protected]

We would like to thank the following ATO interns who contributed to this report:
Anne Oakley, Moe Sakamoto, Dianna Santodonato


