
1 (18) | Interim report January – June 2015
Tradedoubler interim report
January – June 2015

2 (18) | Interim report January – June 2015
Positive signs in net sales and good progress in product development
THE SECOND QUARTER APRIL-JUNE 2015
Net sales amounted to SEK 414 M (411). Excluding change related items net sales were SEK 419 M (411), an increase of 2% or a
decrease of 4% adjusted for changes in FX rates.
Gross profit excluding change related items was SEK 84 M (91), a decrease of 8% or 13% adjusted for changes in FX rates.
Gross margin excluding change related items was 19.9% (22.1%). The decrease was mainly due to price pressure within
affiliate.
Operating costs, excluding depreciation and change related items, were SEK 90 M (87). This was an increase of 3% or a
decrease of 2% adjusted for FX changes mainly related to fewer staff. Full time equivalents at end of Q2 were 355 (378).
EBITDA amounted to SEK -13 M (-9). Excluding change related items EBITDA was SEK -6 M (4).
Capitalised expenses increased to SEK 8 M (3), due to hiring of more developers in line with the strategy.
Earnings per share, before and after dilution, were SEK -0.52 (-0.37).
Cash flow from operating activities was SEK -32 M (-43) and net cash decreased by SEK 42 M during the second quarter to SEK
77 M. The sum of cash and interest-bearing financial assets was SEK 323 M (380) at the end of the second quarter.
Bertil Lundell who was appointed as CTO in January 2015 left, as earlier communicated, the company in June.
As previously communicated, renegotiations with one major international client have a negative impact on revenue in 2015.
THE INTERIM PERIOD JANUARY – JUNE 2015
Net sales were SEK 846 M (856). Net Sales excluding change related items were SEK 851 M (856), a decrease of 1% or 8%
adjusted for changes in exchange rates.
Gross profit excluding change related items was SEK 173 M (192), a decrease of 10% or 16% adjusted for changes in exchange
rates. Gross margin excluding change related items amounted to 20.3% (22.4)
Operating costs, excluding depreciation and change related items, were SEK 176 M (176). This was a decrease of 0% or 6%
adjusted for changes in exchange rates.
EBITDA amounted to SEK -17 M (3). EBITDA adjusted for change related costs was SEK -3 M (16).
Cash flow from operating activities amounted to SEK -30 M (-119).
Earnings per share, before and after dilution, amounted to SEK -0.76 (-0.28).
Tradedoubler finalised its Nordic regional structure and closed its office in Norway with limited one off costs.
The German technology company Adnologies was acquired to support the new corporate strategy. The impact from Adnologies
upon the results year to date were limited.
French media company Reworld Media S.A. acquired 19.1 per cent of Tradedoubler’s share mainly from Monterro 1A AB and
thus became the largest shareholder in the company.
Apr-Jun Apr-Jun Jan-Jun Jan-Jun Full year
2015 2014 2015 2014 2014
Net sales excluding change related items 419 411 851 856 -1% 1,743
Gross profit excluding change related items 84 91 173 192 -10% 379
Gross margin (%) 19.9% 22.1% 20.3% 22.4% 21.7%
Operating costs excl. depr. and change related costs -90 -87 -176 -176 0% -339
EBITDA excluding change related items -6 4 -3 16 -118% 39
EBITDA-margin (%) -1.4% 0.9% -0.3% 1.8% 2.3%
Change related items1 -7 -12 -14 -12 -20
EBITDA -13 -9 -17 3 -609% 20
Impairment goodwill 0 0 0 0 -60
Operating profit (EBIT) -19 -14 -29 -7 -63
Net investments in non-financial fixed assets (Capitalized expense) -8 -3 -23 -7 -17
Cash-flow from operating activities -32 -43 -30 -119 -110
Liquid assets incl financial investments, at period's end 323 380 323 380 372
Net cash2, at period's end 77 135 77 135 126
FINANCIAL OVERVIEW, SEK M Change %
1Change related items during Q2 2015 that impacted net sales related to an adjustment for errors in recurring invoic ing to one large customer since mid 2013. Change related costs are
mainly related to severance payments.
2Current investment and liquid assets less interest-bearing liabilit ies
3 (18) | Interim report January – June 2015
CEO MATTHIAS STADELMEYER’S COMMENTS ON
THE SECOND QUARTER OF 2015 “The underlying gross profit development during the second
quarter was in line with the year-on-year trend of previous
quarter. However, the development within different markets
varies considerably due to specific market reasons and our own
performance. We see good results and year-on-year revenue
growth in the United Kingdom, Germany, Spain, Sweden and
Poland while especially France is more challenging. Total
operating costs increased compared to the first quarter 2015
due to higher product development costs in line with the
strategy. Capitalised product development expenditure was on
the same level as in the previous quarter.
During the second quarter we made good further progress with
the realisation of our new offerings. We are currently running
test campaigns in selected markets using integrated
Tradedoubler and Adnologies technology and are seeing
encouraging results. In September, we will have a beta product
to further test and develop together with selected clients.
While we continue to roll out ADAPT, our market-leading
business intelligence tool, we are adding new functionalities
and are in the process of incorporating data relating to online
user journeys. This is a major step forward and enables clients
to have great insights into how their consumers interact with
performance channels.
We have more exciting launches planned during the second half
of 2015 focusing on new solutions that deliver data-driven
insights and functionalities that help us to create smarter
performance marketing results for our clients.
With these new offerings we are extending our addressable
market considerably and we are now in the process of
strengthening our commercial teams in the markets to ensure
that we will be able to take full advantage of the market
potential”
TRADEDOUBLER’S BUSINESS STRATEGY Tradedoubler operates within the dynamic environment of
digital and mobile commerce, which is characterised by positive
trends in both consumer and advertising expenditure. The
digital marketing sector in Europe is changing rapidly. Channels
such as social media, video and mobile are increasing their
market share and advertising is increasingly traded on an
automated, real-time basis. At the same time, growth within
traditional affiliate marketing is declining.
To address a larger part of the dynamic digital marketplace,
Tradedoubler launched a corporate strategy in November 2014
with the ultimate aim of taking a leadership position with a
significantly expanded performance marketing offering. The
strategy will be achieved through the optimisation of multiple
high quality traffic sources. The use of Tradedoubler’s
proprietary integrated performance marketing technology and
deep, data-driven insights into online consumer behaviour will
create better results for Tradedoubler´s clients and increase
revenues for both Tradedoubler and its clients. Running
marketing campaigns in an automated way will improve
Tradedoubler´s margins.
Tradedoubler estimates that its present addressable affiliate
market including private networks, from a gross profit
potential, will increase more than five-fold from some 3 billion
SEK per year. This larger addressable market includes the
current affiliate marketing business and additionally branding as
well as performance display marketing budgets. Tradedoubler
already handles significant amounts of data through its
advanced technology platform and works closely with many
leading advertisers and publishers in Europe. Hence, the
company is well positioned to take a significantly larger share
of existing customers’ advertising expenditure.
PRODUCT DEVELOPMENT
The acquisition of the independent technology company,
Adnologies, in January 2015, has advanced the progress of
Tradedoubler’s new corporate strategy. The Adnologies’
technology stack, including a demand side platform connected
to over 80 different sources of traffic and fully functional
tracking and retargeting capabilities, is being integrated into
Tradedoubler’s own technology. Test campaigns running on an
integrated technology set-up are live in several markets and are
showing positive results. In parallel, the development team in
Stockholm has grown significantly during the last 6 months and
Adnologies’ developers are an integrated part of Tradedoubler’s
increased product development capabilities.
Tradedoubler is continuing to roll out its market-leading
business intelligence tool, ADAPT and initial client demand has
been positive. Detailed data relating to online customer
journeys is currently being integrated into ADAPT and insights
based on this user journey data will demonstrate the value of
different performance channels in influencing online purchases.
In the second quarter Tradedoubler launched Conversions API,
which is a new technology that allows Tradedoubler’s
advertisers and publishers to receive conversion data in real
time so that they can keep track of the status of their
performance marketing activity. Further product launches are
planned during the second half of 2015.
TRADEDOUBLER’S CURRENT POSITION
During the last quarter Tradedouber has made further good
progress in realising its corporate strategy with clear priorities
and strong focus on the areas with the greatest commercial
opportunity. Tradedoubler is extending its addressable market
considerably and is in the process of strengthening its
commercial teams to ensure to be well placed to take full
advantage of this opportunity. In summary, Tradedoubler has
the following:
A track record working with leading brands, providing
them with digital marketing expertise
An advanced technology platform as a result of the
heritage in affiliate marketing
Expertise in data analysis and a recently launched market-
leading business intelligence tool that delivers data-driven
insights for our clients
Major shareholders who have deep knowledge and
experience in the digital and e-commerce marketplace
The strategy realisation is progressing well and initial positive
results are expected during 2016.

4 (18) | Interim report January – June 2015
THE GROUP'S RESULTS If not explicitly stated, the disclosed financial information refers to reported
numbers that are not adjusted for change related items nor changes in
exchange rates.
Consolidated net sales during the interim period amounted to
SEK 846 M (856). Excluding change related items net sales were
SEK 851 M (856), a decline of 1 per cent or 8 per cent adjusted
for changes in exchange rates.
Consolidated net sales during the second quarter 2015 were SEK
414 M (411). Change related items affecting net sales were SEK
5 M (0) and referred to an adjustment for errors in recurring
invoicing to one large customer since mid-2013. Management
has no knowledge of any other similar errors. For more
information regarding change related items see page 7.
Excluding change related items net sales in the second quarter
were SEK 419 M (411), an increase of 2 per cent or a decline of
4 per cent adjusted for changes in exchange rates.
Gross profit during the interim period was SEK 168 M (192).
Gross profit excluding the above mentioned change related
item was SEK 173 M (192), which was a decline of 10 per cent or
16 per cent adjusted for changes in exchange rates.
Gross profit during the second quarter was SEK 78 M (91). Gross
profit excluding the change related item mentioned above was
SEK 84 M (91). This was a decline of 8 per cent or 13 per cent
adjusted for changes in exchange rates. The latter was an
improvement compared to Q1 2015 over Q1 2014 with some 6
percentage points verses the -19 percent disclosed in the
previous report. This can be explained by the fact that revenues
and gross profit from two former large pan European
Tradedoubler customers had ceased by the end of Q1 last year.
Gross margin, excluding change related items, during the
interim period was 20.3 per cent (22.4) and 19.9 per cent (22.1)
in the second quarter. The decrease is mainly due to price
pressure within affiliate.
NET SALES (SEK M) / GROSS MARGIN (%), EXCLUDING CHANGE RELATED ITEMS
Operating costs, excluding depreciation, amounted to SEK 185
M (189) during the interim period. Operating costs, excluding
change related items and depreciation, was SEK 176 M (176).
For information regarding change related items see page 7.
Operating costs, excluding depreciation, amounted to SEK 91 M
(99) during the second quarter and included change related
items of SEK 1.6 M mainly referring to severance payments.
Operating costs, excluding change related items and
depreciation, was SEK 90 M (87). This was an increase of 3 per
cent or a decrease of 2 per cent adjusted for changes in
exchange rates. The reduction can mainly be explained by
lower headcount. Full time equivalents at the end of the second
quarter were 355 (378).
Operating profit before depreciation and amortisation (EBITDA)
during the interim period was SEK -17 M (3). Adjusted for
change related costs EBITDA amounted to SEK -3 M (16).
Depreciation and amortisation was SEK 13 M (11) and operating
profit (EBIT) during the interim period amounted to SEK -29 M
(-7).
Operating profit before depreciation and amortisation (EBITDA)
in the second quarter 2015 was SEK -13 M (-9). Adjusted for
change related items, EBITDA was SEK -6 M (4). Depreciation
and amortisation was SEK 6 M (5) and operating profit (EBIT)
amounted to SEK -19 M (-14).
Net financial items during the interim period were SEK -9 M
(-5). Financial income and expenses amounted to SEK -5 M (-1)
and were mainly affected by interest income, revaluations of
the short term investments and interest expense related to the
bond issue. Exchange rate effects were SEK -3 M (-4).
Net financial items in the second quarter 2015 were SEK -7 M
(-4). Financial income and expenses amounted to SEK -4 M (-1)
and mainly included interest income, revaluations of the short
term investments and interest expense related to the bond
issue. During the second quarter financial income was SEK 3 M
lower compared to the first quarter of 2015. This is mainly due
to a revised finance policy, decided by the board, that over
time prohibit investments in high yield bonds. These have
therefore to a very large extent been sold off during the second
quarter. Exchange rate effects were SEK -3 M (-3).
Profit after tax for the interim period was SEK -32 M (-12),
corporate income tax affected profit by SEK 6 M (0.3). Profit
after tax for the second quarter was SEK -22 M (-16).
EBITDA (SEK M) / EBITDA/GP (%), EXCLUDING CHANGE RELATED ITEMS
411 424
462431 419
22% 21% 21% 21% 20%
0%
5%
10%
15%
20%
25%
30%
35%
0
50
100
150
200
250
300
350
400
450
500
Q2-14 Q3-14 Q4-14 Q1-15 Q2-15
4
1212
3
-6
4%
13%12%
3%
-7%
-10%
-5%
0%
5%
10%
15%
20%
25%
30%
35%
-8
-6
-4
-2
0
2
4
6
8
10
12
14
Q2-14 Q3-14 Q4-14 Q1-15 Q2-15
5 (18) | Interim report January – June 2015
OPERATIONAL SEGMENTS
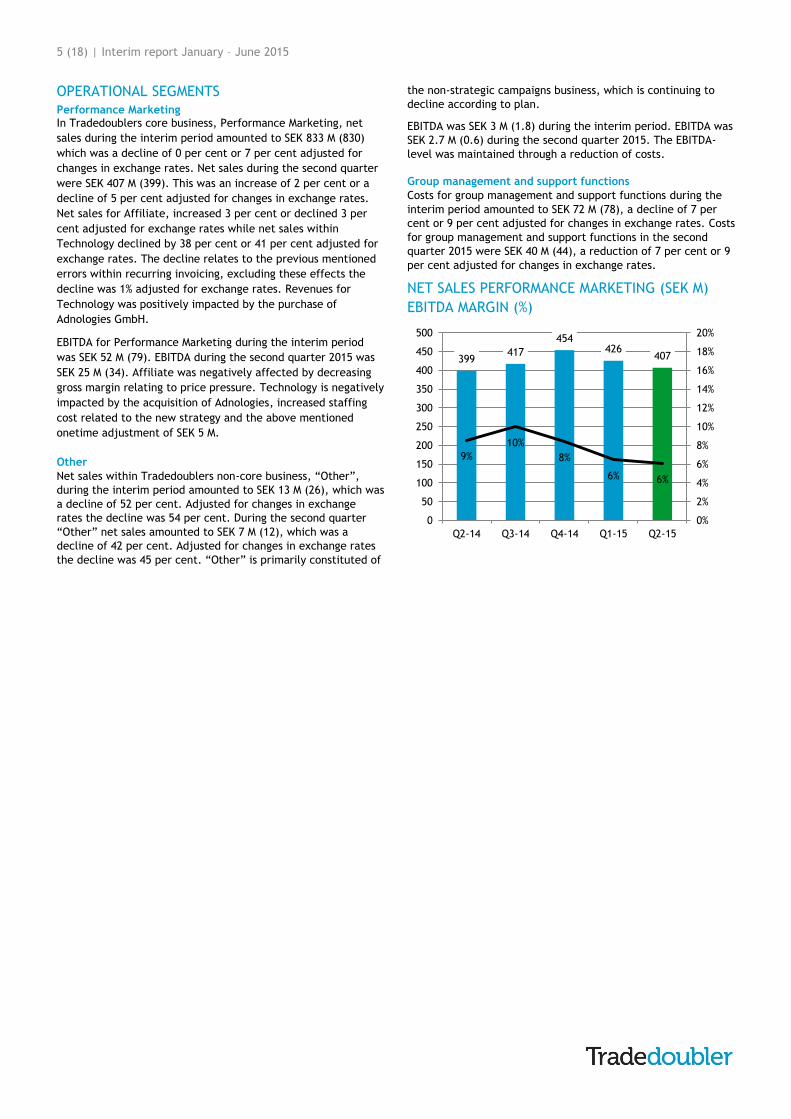
Performance Marketing In Tradedoublers core business, Performance Marketing, net
sales during the interim period amounted to SEK 833 M (830)
which was a decline of 0 per cent or 7 per cent adjusted for
changes in exchange rates. Net sales during the second quarter
were SEK 407 M (399). This was an increase of 2 per cent or a
decline of 5 per cent adjusted for changes in exchange rates.
Net sales for Affiliate, increased 3 per cent or declined 3 per
cent adjusted for exchange rates while net sales within
Technology declined by 38 per cent or 41 per cent adjusted for
exchange rates. The decline relates to the previous mentioned
errors within recurring invoicing, excluding these effects the
decline was 1% adjusted for exchange rates. Revenues for
Technology was positively impacted by the purchase of
Adnologies GmbH.
EBITDA for Performance Marketing during the interim period
was SEK 52 M (79). EBITDA during the second quarter 2015 was
SEK 25 M (34). Affiliate was negatively affected by decreasing
gross margin relating to price pressure. Technology is negatively
impacted by the acquisition of Adnologies, increased staffing
cost related to the new strategy and the above mentioned
onetime adjustment of SEK 5 M.
Other
Net sales within Tradedoublers non-core business, “Other”,
during the interim period amounted to SEK 13 M (26), which was
a decline of 52 per cent. Adjusted for changes in exchange
rates the decline was 54 per cent. During the second quarter
“Other” net sales amounted to SEK 7 M (12), which was a
decline of 42 per cent. Adjusted for changes in exchange rates
the decline was 45 per cent. “Other” is primarily constituted of
the non-strategic campaigns business, which is continuing to
decline according to plan.
EBITDA was SEK 3 M (1.8) during the interim period. EBITDA was
SEK 2.7 M (0.6) during the second quarter 2015. The EBITDA-
level was maintained through a reduction of costs.
Group management and support functions
Costs for group management and support functions during the
interim period amounted to SEK 72 M (78), a decline of 7 per
cent or 9 per cent adjusted for changes in exchange rates. Costs
for group management and support functions in the second
quarter 2015 were SEK 40 M (44), a reduction of 7 per cent or 9
per cent adjusted for changes in exchange rates.
NET SALES PERFORMANCE MARKETING (SEK M)
EBITDA MARGIN (%)
399417
454426
407
9%
10%
8%
6% 6%
0%
2%
4%
6%
8%
10%
12%
14%
16%
18%
20%
0
50
100
150
200
250
300
350
400
450
500
Q2-14 Q3-14 Q4-14 Q1-15 Q2-15

6 (18) | Interim report January – June 2015
Segments and market units
CASH FLOW Cash flow from operating activities, before changes in working
capital, amounted to SEK -21 M (1) during the interim period
and referred to EBITDA adjusted for paid taxes, paid interest
and non-cash items. Changes in working capital was SEK -9 M
(-119) and the large change versus the same period last year
was mainly explained by normalised payment patterns.
Net investments in tangible and intangible assets during the
interim period amounted to SEK -20 M (-7). These investments
mainly related to product development which has increased in
line with the strategy launched in November last year. Total
number of developers have increased by some 25 since the
launch of the strategy. Cashflow from Net investments in short
term investments amounted to SEK 155 M (-48). Cashflow
amounted to SEK 102 M (-185).
Cash flow from operating activities before changes in working
capital was SEK -14 M (-7) in the second quarter 2015. Changes
in working capital decreased to SEK -18 M (-37) compared to
SEK +9 M in Q1 2015. This fluctuation in working capital can
mainly be explained by random changes in payment patterns.
During the last 12 months the total change in working capital
has been SEK -5 M.
Net investments in tangible and intangible assets during the
second quarter amounted to SEK -8 M (-3).
Tradedoubler has invested parts of the proceeds from the bond
issue finalized in December 2013 in interest bearing financial
instruments. At end of the second quarter 2015, a total of SEK
105 M (253) was placed in interest bearing financial
instruments. Cashflow from Net short term financial
SEK M Apr-Jun Apr-Jun Jan-Jun Jan-Jun Full year
Net Sales 2015 2014 2015 2014 2014
DACH 51 45 101 106 201
France & Benelux 79 102 181 218 416
North 74 74 153 155 330
South 44 44 88 95 194
UK & Ireland 151 121 285 229 509
Affiliate 399 386 809 803 1,650
Technology 8 13 20 27 51
Total Performance Marketing 407 399 833 830 1,701
Other 7 12 13 26 32
Total Net Sales 414 411 846 856 1,733
EBITDA
DACH 3 3 6 9 17
France & Benelux 1 6 5 15 25
North 7 7 12 15 37
South 4 2 5 6 13
UK & Ireland 8 6 14 14 31
Affiliate 23 25 44 59 124
Technology 1 9 10 20 35
Total Performance Marketing 25 34 52 79 159
Other 3 1 3 2 -8
Group mgmt & support functions -40 -44 -72 -78 -132
Total EBITDA -13 -9 -17 3 20
Depreciation and impairment -6 -5 -13 -11 -83
Operating profit as in consolidated income statement -19 -14 -29 -7 -63
EBITDA/Net sales, %
DACH 6 7 6 9 8
France & Benelux 2 6 3 7 6
North 10 9 8 10 11
South 10 6 6 7 7
UK & Ireland 5 5 5 6 6
Affiliate 6 6 5 7 7
Technology 16 72 49 74 70
Total Performance Marketing 6 9 6 10 9
Other 41 5 26 7 -24
Total EBITDA Margin -3 -2 -2 0 1

7 (18) | Interim report January – June 2015
investments increased to SEK 94 M (3) during the second
quarter. This increase was due to a revised financial policy,
decided by the board, which over time prohibit investments in
high yield bonds and therefore these to a very large extent has
been sold off. Cashflow amounted to SEK 54 M (-53).
FINANCIAL POSITION Cash and cash equivalents at the end of the interim period
amounted to SEK 218 (128) M and was affected by translation
differences of SEK -0.1 M (8). In addition, SEK 105 M (253) was
invested in interest-bearing financial instruments. The sum of
cash and cash equivalents and interest-bearing financial assets
was therefore SEK 323 M (380). Interest-bearing liabilities
amounted to SEK 246 M (245) and referred to the full five-year
unsecured bond issue with maturity date in the fourth quarter
2018. Net cash hence amounted to SEK 77 M (135) at the end of
the second quarter 2015.
Consolidated shareholders' equity amounted to SEK 411 M (500)
at the end of the interim period. The return on equity during
the rolling 12 months ending June 2015 was -23 per cent (-4)
and the equity/asset ratio was 34 per cent (39).
CHANGE RELATED ITEMS Change related items for the interim period were SEK 14 M and
included change related revenues for badwill related to the
acquisition of Adnologies which amounted to SEK 0.8 M and an
adjustment for errors in recurring invoicing for one large
customer since mid-2013 of SEK -5 M. Change related costs
included severance payments SEK 4.5 M and costs for closing
down the office in Norway, moving costs for the UK office and
costs related to the acquisition of Adnologies. For information
about change related items in 2014, see the 2014 annual report.
SEASONAL VARIATIONS Tradedoubler’s operations, particularly within Performance
Marketing, fluctuate with the development of e-commerce and
online advertising. There are seasonal variations particularly
within e-commerce. The highest level of activity is before
Christmas, which implies that the fourth quarter is normally the
strongest for Tradedoubler.
THE PARENT COMPANY The parent company’s net sales was SEK 18 M (23) during the
second quarter and to SEK 36 M (53) during the interim period.
Revenue primarily consisted of licensing revenue.
Operating profit (EBIT) amounted to SEK -22 M (-15) during the
quarter and to SEK -36 M (-20) during the interim period.
Net financial items amounted to SEK -4 M (1.8) during the
second quarter and to SEK -6 M (1.1) during the interim period.
Changes in exchange rates has impacted the interim period with
SEK –1.5 M (-4).
Profit after tax was SEK -21 M (-9) during the quarter and to SEK
-33 M (-13) in the interim period.
The parent company's receivables from group companies
amounted to SEK 73 M (74) at the end of the interim period, of
which none (0) were non-current. The parent company's
liabilities to group companies were SEK 127 M (155), of which
none (0) were non-current. Cash and cash equivalents
amounted to SEK 154 M (89) at the end of the interim period.
During the fourth quarter 2013 the parent company issued a
bond loan with the nominal value of SEK 250 M. The proceeds
from the bond loan and excess cash was to some extent
invested in short term investments and commercial papers at
the end of the interim period. Short term commercial papers
are disclosed in cash and cash equivalents.
Deferred tax assets amounted to SEK 47 M (34) at the end of the
interim period. The deferred tax assets are mainly related to
carry-forwards of SEK 23 M and deferred tax receivables related
to previous Group loans of SEK 14 M. For more information, see
notes to the consolidated financial statements, note C2 Critical
estimates and judgments in the Annual Report 2014.
EMPLOYEES At the end of the second quarter Tradedoubler’s staff
corresponded to 355 (378) full-time equivalents and includes
permanent and temporary employees as well as consultants.
Expenditures for employees and consultants classified as
capitalised expenses are not included in the reported head
count.
RISKS AND UNCERTAINTY FACTORS Tradedoubler divides risks into market-related risks,
operational risks, financial risks and legal risks. These risks are
described on page 9 in the 2014 Annual Report. No significant
risks and uncertainty factors have arisen in addition to those
described in the 2014 annual report.
CRITICAL ESTIMATES AND JUDGEMENTS For information regarding critical estimates and judgements in
the financial statements see note c2 in the 2014 annual report.
No critical estimates or judgements are considered to have
arisen since the latest submitted annual report.
TRANSACTIONS WITH RELATED PARTIES No transactions between Tradedoubler and related parties
impacting the company's financial position and results have
taken place, aside from remuneration to board and senior
executives.
ANNUAL GENERAL MEETING Pascal Chevalier, Henrik Kvick, Mikael Nachemson, Gautier
Normand, Mernosh Saatchi and Peter Åström were elected
regular board members. Pascal Chevalier was elected as
chairman of the board of directors and Mikael Nachemson to
vice chairman.
The annual general meeting resolved to adopt a share price
related incentive program for 20-25 senior executive and other
key employees within the TradeDoubler group.
For more information see report from Tradedoubler’s annual
general meeting.
FOREIGN EXCHANGE RISK Foreign exchange risk refers to the risk that changes in
exchange rates may affect the consolidated income statement,
balance sheet and cash flow statement. Foreign exchange risk
exists in the form of transaction risk and translation risk.
Tradedoubler is exposed to foreign exchange risk in 17
countries involving eight different currencies, with Euro (EUR)
and British pounds (GBP) representing the majority share. In
2014, approximately 48 per cent of group sales were made in

8 (18) | Interim report January – June 2015
EUR and approximately 29 per cent in GBP. In 2014,
approximately 31 per cent of the group’s costs were in EUR and
approximately 20 per cent in GBP.
ACQUISITION OF ADNOLOGIES The German technology company Adnologies was acquired in
January 2015 to support the new corporate strategy. Acquisition
investments and expenditures, as well as the effect upon the
result for the interim period was limited. At the time of the
acquisition the company had 15 employees.
MISCELLANEOUS
Significant events after the balance sheet date No significant events have occurred after the end of the
reporting period
Accounting policies This interim report is prepared in accordance with IAS 34,
interim financial reporting and the Swedish annual accounts
act. The nature of financial assets and liabilities are essentially
the same as at December 31, 2014 and the carrying values are
the same as the fair values. No new or amended standards have
been applied in 2015. For information on the accounting
policies applied, see the 2014 annual report.
The share The total number of shares at the end of the interim period was
42,807,449 of which 475,000 were in own custody. The average
number of outstanding shares during the interim period was
42,332,449.
Earnings per share, before and after dilution, amounted to SEK -
0.52 (-0.37) during the second quarter and -0.76 (-0.28) in the
interim period. Equity per share amounted to SEK 9.7 (11.8) at
the end of the interim period.
The share price closed at SEK 7.10 on the final trading day of
the second quarter 2015, which was lower than at year-end
2014 when the share price closed at SEK 10.25.
Long term financial targets The company’s long term financial targets, adopted by the
Board is to grow net sales in excess of 5 per cent annually in
local currency and deliver an EBITDA/Gross profit-ratio in
excess of 20 per cent over a business cycle.
Presentation of the interim report This interim report will be presented at a teleconference on the
23rd of July 2015 at 10.00 a.m. CET. The presentation will be
held in English and may be followed via webcast on the
website:
http://financials.tradedoubler.com/en-gb/investorrelations
and by telephone:
Sweden: +46 8 566 426 90
UK: +44 203 428 14 33
US: +1 855 831 59 45
The presentation material will be published concurrently with
the interim report.
Financial information
Interim report Jan – Sep 2015 12 November 2015
Year-end report 2015 6 February 2016
Contact information Matthias Stadelmeyer, President and CEO,
telephone +46 8 405 08 00
Tomas Ljunglöf, CFO, telephone +46 8 405 08 00
E-mail: [email protected]
English version
Both an English version and a Swedish version of this report
have been prepared. In the event of a difference between the
two reports, the Swedish version shall prevail.
Other Tradedoubler discloses the information provided herein
pursuant to the Swedish Securities Markets Act. The information
was released for publication on 23rd of July 2015 at 08.00 a.m.
CET. Numerical data in brackets refers to the corresponding
periods in 2014 unless otherwise stated. Rounding off
differences may arise.
Review This interim report has not been reviewed by the company's
auditor Ernst & Young AB.
THE BOARD OF DIRECTOR'S DECLARATION The Board of Directors and the CEO declare that the interim
report for the period January – June 2015 provides a true and
fair overview of the Parent Company's and the Group’s
operations, financial position and results of operations as well
as describing the material risks and uncertainties facing the
Parent Company and other companies in the Group.
Stockholm, 23th of July 2015
Pascal Chevalier Mikael Nachemson
Chairman Board member and vice
chairman
Gautier Normand Henrik Kvick
Board member Board member
Mernosh Saatchi Peter Åström
Board member Board member
Matthias Stadelmeyer
President and CEO

9 (18) | Interim report January – June 2015
Consolidated income statement
All earnings accrue to the parent company’s shareholders.
Consolidated statement of comprehensive income
Earnings per share
The earnings per share above apply before and after dilution.
Key ratios - Group
Apr-Jun Apr-Jun Jan-Jun Jan-Jun Full year
SEK 000s 2015 2014 2015 2014 2014
Net Sales 413,958 410,798 845,983 856,065 1,732,649
Cost of goods sold -335,850 -320,147 -677,875 -664,153 -1,355,589
Gross profit 78,108 90,651 168,108 191,912 377,060
Selling expenses -45,336 -56,537 -97,941 -112,087 -217,119
Administrative expenses -36,871 -37,793 -74,163 -67,421 -119,221
Development expenses -15,214 -10,422 -25,110 -19,652 -44,075
Writedown goodwill - - - - -59,993
Operating profit -19,312 -14,102 -29,105 -7,247 -63,347
Net financial items -6,724 -4,437 -8,810 -4,729 -19,332
Profit before tax -26,036 -18,539 -37,915 -11,976 -82,679
Tax 3,992 2,730 5,942 299 335
Net Profit -22,044 -15,809 -31,973 -11,677 -82,344
Apr-Jun Apr-Jun Jan-Jun Jan-Jun Full year
SEK 000s 2015 2014 2015 2014 2014
Profit for the period, after tax -22,044 -15,809 -31,973 -11,677 -82,344
Other comprehensive income
Items that subsequently will be reversed in the income statement
Translation difference, net after tax -586 13,667 2,094 14,845 26,992
Total comprehensive income for the period, after tax -22,630 -2,142 -29,879 3,168 -55,352
Comprehensive income attributable to:
Parent company shareholders -22,630 -2,142 -29,879 3,168 -55,352
Apr-Jun Apr-Jun Jan-Jun Jan-Jun Full year
SEK 2015 2014 2015 2014 2014
Earnings per share -0.52 -0.37 -0.76 -0.28 -1.95
Number of Shares
Weighted average 42,332,449 42,332,449 42,332,449 42,332,449 42,332,449
Apr-Jun Apr-Jun Jan-Jun Jan-Jun Full year
2015 2014 2015 2014 2014
Gross profit (GP) / revenue (%) 18.9 22.1 19.9 22.4 21.8
EBITDA / revenue (%) -3.1 -2.1 -2.0 0.4 1.1
EBITDA / gross profit (GP) (%) -16.7 -9.7 -9.9 1.7 5.2
Equity/assets ratio (%) 34.0 38.7 34.0 38.7 34.5
Return on equity (12 months) (%) -22.5 -3.9 -22.5 -3.9 -17.4
Average number of employees 346 374 353 381 371
Return on Capital Employed (12 months) (%) -11.7 -1.0 -11.7 -1.0 -7.8
Working Capital end of period (SEK M) -124 -123 -124 -123 -131
Cash-flow from operating activities per share, SEK -0.8 -1.0 -0.7 -2.8 -2.6
Equity per share, SEK 9.7 11.8 9.7 11.8 10.4
Stock price at the end of the period, SEK 7.1 11.9 7.1 11.9 10.3

10 (18) | Interim report January – June 2015
Consolidated statement of financial position
Consolidated statement of changes in equity
All capital accrues to the parent company’s shareholders.
30 Jun 30 Jun 31 Dec
SEK 000s 2015 2014 2014
Assets
Non-current assets
Goodwill 323,032 374,558 323,682
Intangible fixed assets 65,513 58,956 57,603
Tangible fixed assets 7,255 4,503 3,667
Other non-current receivables 5,533 4,327 5,510
Deferred tax assets 55,916 44,535 48,186
Total non-current assets 457,248 486,880 438,647
Accounts receivable 380,741 385,797 421,753
Tax assets 11,042 8,455 19,030
Other current receivables 41,705 28,652 33,821
Short term investments 105,097 252,768 255,259
Cash & cash equivalents 218,200 127,651 116,747
Total current assets 756,785 803,322 846,610
Total assets 1,214,034 1,290,202 1,285,257
Shareholders' equity and liabilities
Shareholders' equity 411,462 499,570 441,341
Deferred tax liabilities 7,069 4,597 6,974
Other provisions 1,054 1,023 1,138
Bond loan 246,221 245,131 245,676
Total long-term liabilities 254,345 250,751 253,788
Accounts payable 16,379 13,845 12,142
Current liabilities to publishers 336,698 343,065 371,925
Tax liabilities 1,871 2,812 3,727
Other current liabilities 193,279 180,159 202,334
Total current liabilities 548,227 539,881 590,128
Total shareholder´s equity and liabilities 1,214,034 1,290,202 1,285,257
Apr-Jun Apr-Jun Jan-Jun Jan-Jun Full year
SEK 000s 2015 2014 2015 2014 2014
Opening balance 434,092 511,917 441,341 506,535 506,535
Total comprehensive income for the period -22,630 -2,142 -29,879 3,168 -55,352
Equity-settled share-based payments - 379 - 450 741
Repurchase of shares - - - - -
Dividend - -10,583 - -10,583 -10,583
Closing balance 411,462 499,571 411,462 499,571 441,341

11 (18) | Interim report January – June 2015
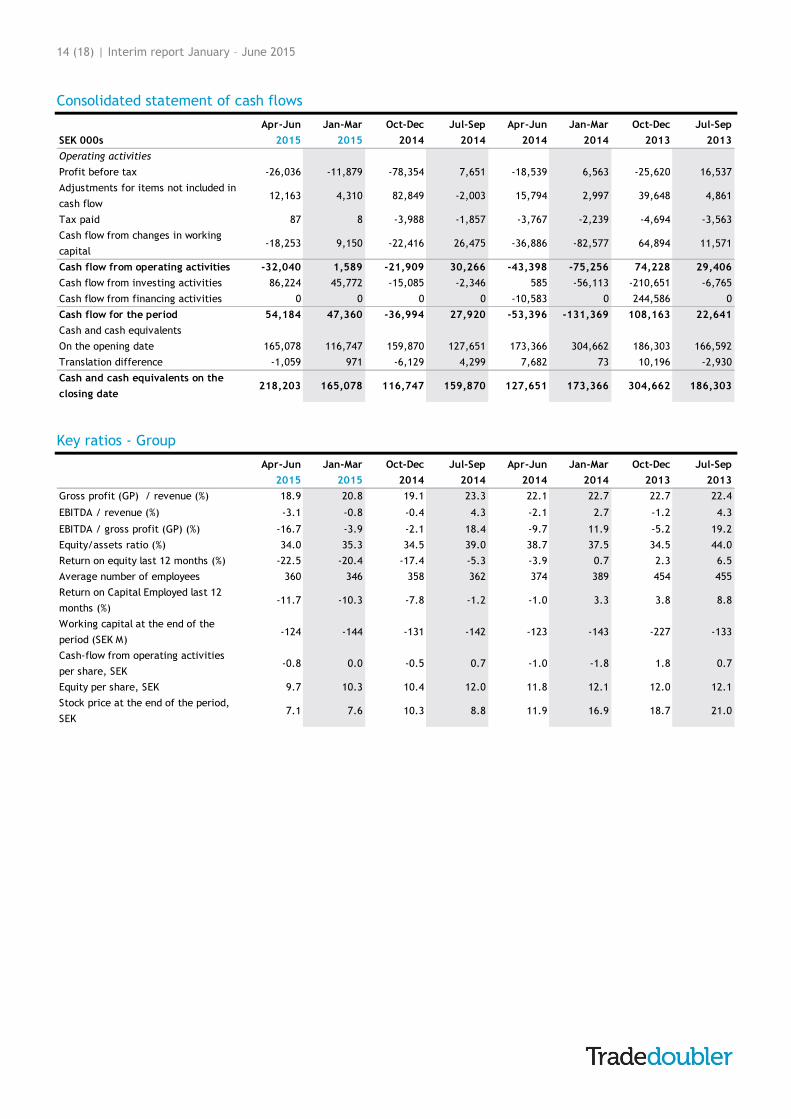
Consolidated statement of cash flows
Apr-Jun Apr-Jun Jan-Jun Jan-Jun Full year
SEK 000s 2015 2014 2015 2014 2014
Operating activities
Profit before tax -26,036 -18,539 -37,915 -11,976 -82,679
Adjustments for items not included in cash flow 12,163 15,794 16,473 18,791 99,637
Income taxes paid 87 -3,767 94 -6,006 -11,851
Cash flow from operating activities before changes in working
capital-13,787 -6,512 -21,348 809 5,107
Changes in working capital -18,253 -36,886 -9,103 -119,463 -115,404
Cash flow from operating activities -32,040 -43,398 -30,451 -118,654 -110,297
Investing activities
Net investments in intangible assets -7,591 -2,789 -16,133 -6,909 -16,642
Net investments in tangible assets -626 -102 -4,009 -155 -692
Net investments in financial assets 178 1 178 26 -899
Net investments in stocks and subsidiaries -2 0 -2,844 0 -1,521
Net investments in short term investments 94,264 3,475 154,803 -48,490 -53,205
Cash flow from investing activities 86,224 585 131,995 -55,528 -72,959
Financing activities
External loans 0 0 0 0 0
Repurchase of own shares 0 0 0 0 0
Dividend paid to parent company's shareholders 0 -10,583 0 -10,583 -10,583
Cash flow from financing activities 0 -10,583 0 -10,583 -10,583
Cash flow for the period 54,184 -53,396 101,544 -184,765 -193,839
Cash and cash equivalents
On the opening date 165,078 173,366 116,747 304,662 304,662
Translation difference in cash and cash equivalents -1,059 7,682 -88 7,754 5,924
Cash and cash equivalens on the closing date 218,203 127,651 218,203 127,651 116,747
Adjustments for non-cash items
Depreciation and impairment 6,733 5,290 12,534 10,505 83,039
Other 5,430 10,504 3,939 8,286 16,598
Total non-cash items 12,163 15,794 16,473 18,791 99,637

12 (18) | Interim report January – June 2015
Income statement – Parent company
Balance sheet – Parent company
Pledged assets and contingent liabilities
Apr-Jun Apr-Jun Jan-Jun Jan-Jun Full year
SEK 000s 2015 2014 2015 2014 2014
Net Sales 18,388 23,156 36,264 52,988 113,141
Cost of goods sold -1,413 -1,879 -2,865 -3,866 -6,779
Gross profit 16,976 21,277 33,399 49,122 106,361
Selling expenses -3 -1,156 -8 -2,260 -2,619
Administrative expenses -28,720 -28,360 -53,630 -53,235 -104,292
Development expenses -10,056 -7,031 -15,686 -13,166 -28,935
Operating profit -21,803 -15,269 -35,925 -19,539 -29,484
Net financial items -3,639 1,756 -6,016 1,114 -532
Profit before tax -25,443 -13,514 -41,941 -18,425 -30,017
Tax 4,882 4,535 8,624 5,583 9,789
Net profit -20,561 -8,979 -33,317 -12,842 -20,228
30 Jun 30 Jun 31 Dec
SEK 000s 2015 2014 2014
Assets
Intangible assets 65,513 58,875 57,592
Equipment, tools, fixtures and fittings 456 727 540
Participation in group companies 161,888 160,881 158,700
Deferred tax assets 46,735 33,904 38,110
Total non-current assets 274,592 254,387 254,942
Accounts receivable 10,006 5,782 5,615
Receivables from Group companies 72,614 74,214 86,646
Tax assets 835 1,426 1,067
Other current receivables 12,588 11,456 9,451
Short term investments 105,097 252,768 255,259
Cash & cash equivalents 153,569 89,262 58,980
Total current assets 354,710 434,907 417,018
Total assets 629,302 689,294 671,960
Shareholders' equity and liabilities
Shareholders equity 153,043 193,415 186,360
Bond loan 246,221 245,131 245,676
Accounts payable 9,623 7,292 8,163
Liabilities to Group companies 126,538 155,139 130,391
Other liabilities 93,876 88,317 101,369
Total current liabilities 476,258 495,879 485,599
Total shareholder´s equity and liabilities 629,302 689,294 671,960
30 Jun 30 Jun 31 Dec
SEK 000s 2015 2014 2014
Group
Pledged assets
Rent deposits 7,048 6,116 7,569
Contingent liabilities none none none
Parent company
Pledged assets
Rent deposits 1,530 1,530 1,530
Contingent liabilities 2,006 2,445 1,048

13 (18) | Interim report January – June 2015
Quarterly summary
Consolidated income statement
Consolidated statement of financial position
Apr-Jun Jan-Mar Oct-Dec Jul-Sep Apr-Jun Jan-Mar Oct-Dec Jul-Sep
SEK 000s 2015 2015 2014 2014 2014 2014 2013 2013
Net Sales 413,958 432,025 452,488 424,096 410,798 445,267 504,323 478,835
Cost of goods sold -335,850 -342,025 -366,289 -325,147 -320,147 -344,005 -389,640 -371,637
Gross profit 78,108 90,000 86,199 98,949 90,651 101,262 114,683 107,198
Total costs -97,421 -99,793 -154,900 -86,348 -104,752 -94,407 -136,830 -91,735
Operating profit -19,312 -9,793 -68,701 12,601 -14,102 6,854 -22,147 15,463
Net financial items -6,724 -2,086 -9,653 -4,950 -4,437 -291 -3,474 1,074
Profit before tax -26,036 -11,879 -78,354 7,651 -18,539 6,563 -25,620 16,537
Tax 3,992 1,950 2,451 -2,415 2,730 -2,431 5,229 -4,011
Net profit -22,044 -9,929 -75,903 5,236 -15,809 4,132 -20,392 12,525
30 Jun 31 Mar 31 Dec 30 Sep 30 Jun 31 Mar 31 Dec 30 Sep
SEK 000s 2015 2015 2014 2014 2014 2014 2013 2013
Assets
Intangible fixed assets 388,545 388,234 381,284 432,998 433,514 424,280 423,569 420,936
Other fixed assets 68,703 65,335 57,362 53,793 53,366 49,875 50,263 42,673
Current receivables 429,584 411,370 474,604 402,006 422,903 461,703 488,630 517,463
Short term investments 105,097 200,357 255,259 250,203 252,768 255,820 201,794 0
Cash & cash equivalents 218,200 165,078 116,747 159,870 127,651 173,366 304,662 186,303
Total assets 1,210,130 1,230,374 1,285,257 1,298,870 1,290,202 1,365,042 1,468,917 1,167,375
Shareholders' equity and liabilities
Shareholders' equity 411,462 434,092 441,341 507,181 499,570 511,917 506,535 513,107
Long-term non-interest bearing debt 8,124 8,431 8,112 7,423 5,620 5,734 5,542 5,441
Long-term interest bearing debt 246,221 245,949 245,676 245,404 245,131 244,859 244,586 0
Current non-interest bearing debt 544,324 541,902 590,128 538,863 539,881 602,532 712,254 648,826
Total shareholder´s equity and
liabilities1,210,130 1,230,374 1,285,257 1,298,870 1,290,202 1,365,042 1,468,917 1,167,375
14 (18) | Interim report January – June 2015
Consolidated statement of cash flows
Key ratios - Group
Apr-Jun Jan-Mar Oct-Dec Jul-Sep Apr-Jun Jan-Mar Oct-Dec Jul-Sep
SEK 000s 2015 2015 2014 2014 2014 2014 2013 2013
Operating activities
Profit before tax -26,036 -11,879 -78,354 7,651 -18,539 6,563 -25,620 16,537
Adjustments for items not included in
cash flow12,163 4,310 82,849 -2,003 15,794 2,997 39,648 4,861
Tax paid 87 8 -3,988 -1,857 -3,767 -2,239 -4,694 -3,563
Cash flow from changes in working
capital-18,253 9,150 -22,416 26,475 -36,886 -82,577 64,894 11,571
Cash flow from operating activities -32,040 1,589 -21,909 30,266 -43,398 -75,256 74,228 29,406
Cash flow from investing activities 86,224 45,772 -15,085 -2,346 585 -56,113 -210,651 -6,765
Cash flow from financing activities 0 0 0 0 -10,583 0 244,586 0
Cash flow for the period 54,184 47,360 -36,994 27,920 -53,396 -131,369 108,163 22,641
Cash and cash equivalents
On the opening date 165,078 116,747 159,870 127,651 173,366 304,662 186,303 166,592
Translation difference -1,059 971 -6,129 4,299 7,682 73 10,196 -2,930
Cash and cash equivalents on the
closing date218,203 165,078 116,747 159,870 127,651 173,366 304,662 186,303
Apr-Jun Jan-Mar Oct-Dec Jul-Sep Apr-Jun Jan-Mar Oct-Dec Jul-Sep
2015 2015 2014 2014 2014 2014 2013 2013
Gross profit (GP) / revenue (%) 18.9 20.8 19.1 23.3 22.1 22.7 22.7 22.4
EBITDA / revenue (%) -3.1 -0.8 -0.4 4.3 -2.1 2.7 -1.2 4.3
EBITDA / gross profit (GP) (%) -16.7 -3.9 -2.1 18.4 -9.7 11.9 -5.2 19.2
Equity/assets ratio (%) 34.0 35.3 34.5 39.0 38.7 37.5 34.5 44.0
Return on equity last 12 months (%) -22.5 -20.4 -17.4 -5.3 -3.9 0.7 2.3 6.5
Average number of employees 360 346 358 362 374 389 454 455
Return on Capital Employed last 12
months (%)-11.7 -10.3 -7.8 -1.2 -1.0 3.3 3.8 8.8
Working capital at the end of the
period (SEK M)-124 -144 -131 -142 -123 -143 -227 -133
Cash-flow from operating activities
per share, SEK-0.8 0.0 -0.5 0.7 -1.0 -1.8 1.8 0.7
Equity per share, SEK 9.7 10.3 10.4 12.0 11.8 12.1 12.0 12.1
Stock price at the end of the period,
SEK7.1 7.6 10.3 8.8 11.9 16.9 18.7 21.0
15 (18) | Interim report January – June 2015
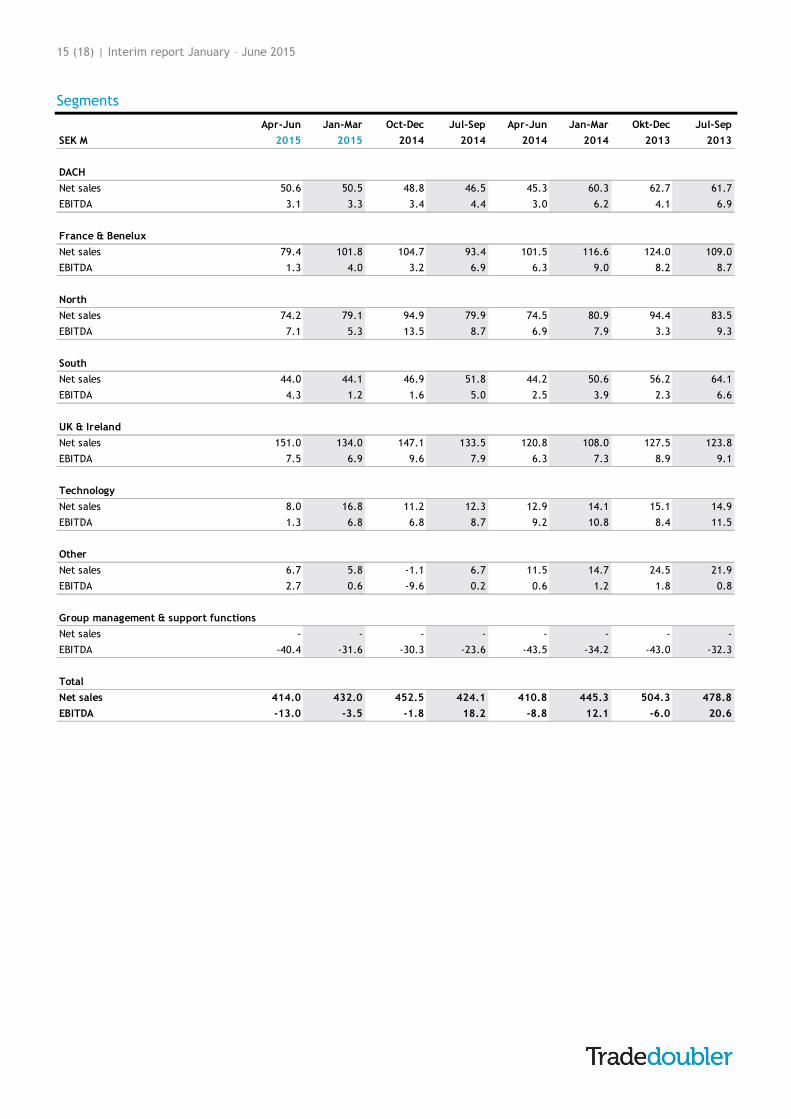
Segments
Apr-Jun Jan-Mar Oct-Dec Jul-Sep Apr-Jun Jan-Mar Okt-Dec Jul-Sep
SEK M 2015 2015 2014 2014 2014 2014 2013 2013
DACH
Net sales 50.6 50.5 48.8 46.5 45.3 60.3 62.7 61.7
EBITDA 3.1 3.3 3.4 4.4 3.0 6.2 4.1 6.9
France & Benelux
Net sales 79.4 101.8 104.7 93.4 101.5 116.6 124.0 109.0
EBITDA 1.3 4.0 3.2 6.9 6.3 9.0 8.2 8.7
North
Net sales 74.2 79.1 94.9 79.9 74.5 80.9 94.4 83.5
EBITDA 7.1 5.3 13.5 8.7 6.9 7.9 3.3 9.3
South
Net sales 44.0 44.1 46.9 51.8 44.2 50.6 56.2 64.1
EBITDA 4.3 1.2 1.6 5.0 2.5 3.9 2.3 6.6
UK & Ireland
Net sales 151.0 134.0 147.1 133.5 120.8 108.0 127.5 123.8
EBITDA 7.5 6.9 9.6 7.9 6.3 7.3 8.9 9.1
Technology
Net sales 8.0 16.8 11.2 12.3 12.9 14.1 15.1 14.9
EBITDA 1.3 6.8 6.8 8.7 9.2 10.8 8.4 11.5
Other
Net sales 6.7 5.8 -1.1 6.7 11.5 14.7 24.5 21.9
EBITDA 2.7 0.6 -9.6 0.2 0.6 1.2 1.8 0.8
Group management & support functions
Net sales - - - - - - - -
EBITDA -40.4 -31.6 -30.3 -23.6 -43.5 -34.2 -43.0 -32.3
Total
Net sales 414.0 432.0 452.5 424.1 410.8 445.3 504.3 478.8
EBITDA -13.0 -3.5 -1.8 18.2 -8.8 12.1 -6.0 20.6

16 (18) | Interim report January – June 2015
DEFINITIONS
Active publisher A publisher that has, during the last month, generated a recordable transaction in the Tradedoubler network.
Capital employed Total assets less current and long-term noninterest-bearing liabilities, including deferred tax liabilities.
EBITDA EBITDA is revenue before tax, net financial items and depreciation/amortization and impairment.
EBITDA-margin EBITDA as a percentage of revenue.
Equity/assets ratio - Shareholders’ equity as a percentage of total assets.
Net margin Profit after tax as a percentage of sales.
Operating margin Operating profit as a percentage of revenue.
Percentage of risk-bearing capital Total of shareholders’ equity, minority interests, shareholder loans and deferred tax liabilities divided by total assets.
Price/equity ratio Price of the share divided by shareholders’ equity per share.
P/E ratio Share price divided by revenue for the year per share.
Return on shareholders’ equity Revenue for the period as a percentage of the average shareholders’ equity, calculated as open and closing shareholders’ equity
divided by two.
Return on capital employed Operating profit plus interest income as a percentage of average capital employed, calculated as opening and closing capital
employed divided by two.
Revenue per share Revenue of the year divided by the average number of shares.
Revenue per share after full dilution Revenue of the year divided by the average number of shares after full dilution.
Solidity Total equity as a percentage of total assets.
Working capital Total current assets less cash and cash equivalents, short term investments and total current liabilities.

17 (18) | Interim report January – June 2015
Our corporate strategy will deliver a new
form of digital advertising
Digital Advertising 1.0 untargeted creative treatments based on delivery/budget goals
Digital Advertising 2.0 targeted creative treatments based on contextual data
Digital Advertising 3.0 targeted creative treatments based on user data – the Adnologies ad tech offering
Digital Advertising 4.0 will be a combination of all this optimised by artificial intelligence to achieve definable
marketing goals

18 (18) | Interim report January – June 2015
Summary of our position During the last 12 months our senior management team has devised the new corporate
strategy and is now responsible for its execution. The strategy extends our addressable
market and we are well positioned to capitalise on the opportunities this presents. In
summary we have the following:
A track record working with leading brands, providing them with digital marketing
expertise
An advanced technology platform as a result of our heritage in affiliate marketing
Expertise in data analysis and a recently launched market-leading business
intelligence tool that delivers data-driven insights for our clients
New major shareholders who are active in the digital and e-commerce marketplace
We are investing in development resources and targeted acquisitions and making
significant advances in product development. The realisation of our strategy is
progressing well and initial positive results are expected during 2016.


