
IUCN WATER AND NATURE INITIATIVE
PANGANI BASIN WATER BOARD1
PANGANI RIVER BASIN FLOW ASSESSMENT
Basin Delineation Report
Final Report
J. King, C. Brown, J. Turpie, B. Clark, A. Duffel-Graham, G. Lugomela, H. Sadiki, B. L. Benno, A. Hepelwa, L. T Kaaya, D Salum, L. Lukambuzi, E. Materu, Felix Peter, S. Kamugisha, F. Mahay and H. Beuster
January 2008
1 As of 2010, Pangani Basin Water Office is known as Pangani Basin Water Board
Published by: Pangani Basin Water Board (PBWB) International Union for Conservation of Nature (IUCN) Copyright: © 2010 International Union for Conservation of Nature and Pangani Basin Water
Board This publication may be produced in whole or part and in any form for education or non-profit uses, without special permission from the copyright holder, provided acknowledgement of the source is made. IUCN would appreciate receiving a copy of any publication which uses this publication as a source. No use of this publication may be made for resale or other commercial purpose without the prior written permission of IUCN. Citation: PBWB/IUCN. 2008. Basin Delineation Report. Pangani Basin Water Board, Moshi
and IUCN Eastern and Southern Africa Regional Programme, Nairobi. 57 Pages Available from: IUCN - ESARO Publications Service Unit, P. O. Box 68200 - 00200, Nairobi, Kenya;
Telephone ++ 254 20 890605-12; Fax ++ 254 20 890615; E-mail: [email protected] The designations of geographical entities in this book, and the presentation of the material, do not imply the expression of any opinion whatsoever on the part of the participating organizations concerning the legal status of any country, territory, or area, or of its authorities, or concerning the delimitation of its frontiers or boundaries. The opinions expressed by the authors in this publication do not necessarily represent the view of PBWB, EU, UNDP GEF, WANI or IUCN.
IUCN WATER AND NATURE INITIATIVE
PANGANI BASIN WATER BOARD
PANGANI RIVER BASIN FLOW ASSESSMENT
Basin Delineation Report
Final Report
CONTRIBUTORS
J. King Southern Waters C. Brown Southern Waters J. Turpie Anchor Environmental B. Clark Anchor Environmental A. Duffel-Graham Anchor Environmental G. Lugomela PBWO H. Sadiki PBWO B. L. Benno University of Dar es Salaam A. Hepelwa University of Dar es Salaam L. T Kaaya University of Dar es Salaam D Salum Institute of Marine Sciences L. Lukambuzi National Environmental Management Council E. Materu Ministry of Water Felix Peter Ministry of Water S. Kamugisha IUCN F. Mahay Wami-Ruvu Basin Water Office H. Beuster Emzantsi Systems

Delineation Final Report
i
ABBREVIATIONS
ABBREVIATION MEANING
DTM Digital Terrain Model
FA Pangani Basin Flow Assessment
GEF Global Environment Facility
ha Hectare
IUCN World Conservation Union
m3/s cubic meters per second
masl meters above sea level
Mm3 million cubic meters
MSL Mean Sea Level
MoW Ministry of Water
Mt Mount
NAWAPO National Water Policy
NYM Nyumba ya Mungu
PBWO Pangani Basin Water Office
ppt parts per thousand
PRB Pangani River Basin
Riv Prefix for river sampling sites
TPC Tanganyika Planting Company
UNDP United Nations Development Programme
URT United Republic of Tanzania
UTM Universal Transverse Mercator
WANI Water & Nature Initiative

Delineation Final Report
i
EXECUTIVE SUMMARY
Introduction
The Pangani River Basin Flow Assessment is an IUCN-Pangani Basin Water Office (PBWO) initiative that brings together a Flow Assessment Group selected from within Tanzania, consisting of specialists in a range of river-related, water-allocation and policy-making disciplines. These specialists will work together with advisors from South Africa to develop an understanding of the hydrology of the Pangani River Basin, the nature and functioning of the river system and the links between the river and socio-economic value of its resources. Project aims The objectives of this Flow Assessment (FA) are to:
• generate baseline data of the condition of the Pangani River system;
• enhance the understanding among PBWO and Ministry of Water (MoW) staff of the relationship between flow, river and estuary health and the people who use the river;
• create an awareness of the trade-offs to be made between water development and natural-resource protection;
• develop simple tools to help guide water-resource management and water allocations in the Pangani Basin;
• build capacity that will enable PBWO to act as a nucleus of expertise for FA-related work in other basins;
• provide information that will aid implementation of the National Water Policy (NAWAPO 2002) and the National Environmental Management Act (2004).
Project tasks The project is divided into ten tasks, as follows: Task 1: Hydrology. Task 2: Study area delineation, site selection and scenario identification. Task 3: Health assessment of the river and estuary. Task 4: Baseline socio-economic assessment. Task 5: Synthesis of understanding of the river systems and its economies
and identify major gaps. Task 6: Specialist Studies. Task 7: Creation and evaluation of scenarios. Task 8: Practical application of scenario evaluation by National Pangani FA
Team. Task 9: Final Reporting. Task 10: Awareness raising outside the National Pangani FA Team. This report addresses Task 2 (Study Area Delineation and Site Selection). The Task was accomplished by first separately delineating relatively homogeneous zones and sub-zones along the river and estuary, and for socio-economic activities in the basin. Thereafter, the resultant delineations were synchronised to produce a scheme for all project work. Within this scheme, representative sites were selected in the sub-zones deemed to be most relevant to the study.

Delineation Final Report
ii
Catchment location and characteristics
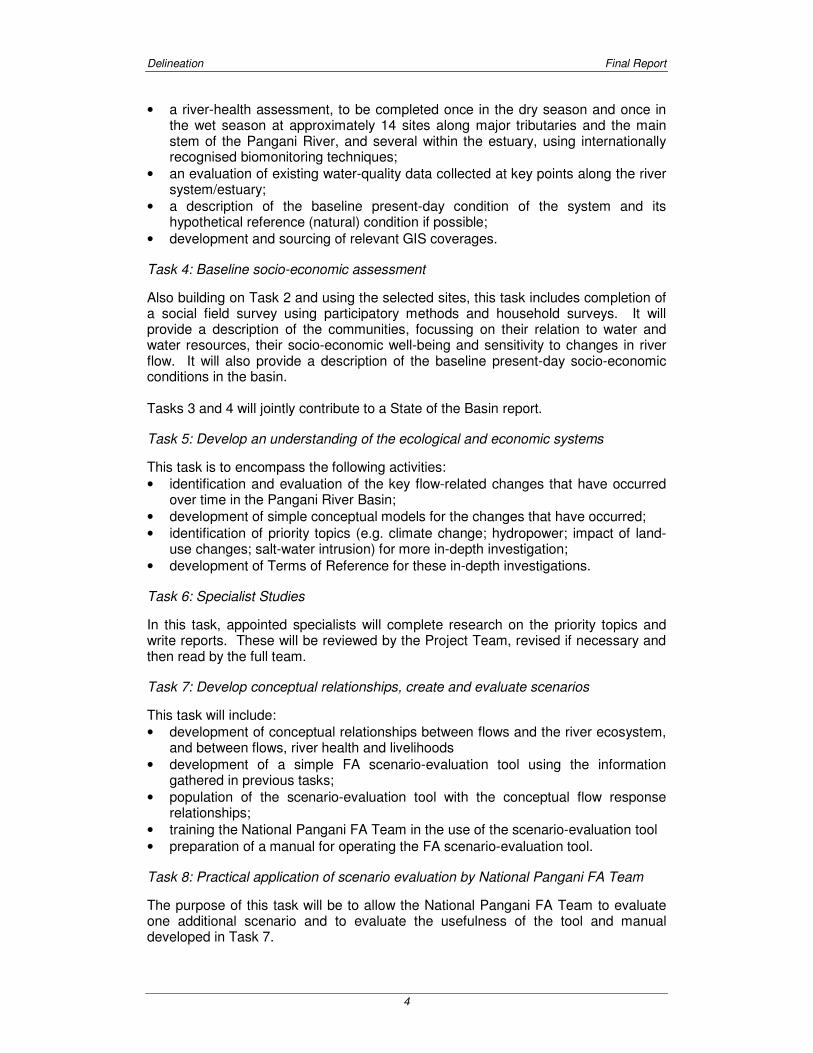
The Pangani River Basin is situated in the north-east of Tanzania and covers a total area of some 43 650 km2, about 3 900 km2 of which is in Kenya (Figure E.1). Note: The area under the PBWO jurisdiction (referred to as the Pangani Basin) incorporates the Pangani River Basin, plus the Umba, Zigi-Mkulumuzi Coastal and Msangazi river catchments.
Figure E.1 River basins administered by the PBWO, including the Pangani River
Basin. Source: PBWO/IUCN.
The Pangani River Basin is bordered by Mt Kilimanjaro (5895 masl), Mt Meru (4565 masl) and the Pare and Usambara Mountains to the north and north-east, respectively, and encompasses the Simanjiro and Kitwei plains to the south-west. Lowlands (up to 900 masl) make up about 50% of the basin. Rainfall patterns are largely related to altitude, with the highlands receiving about 1000-2000 mm annually, and the lowlands receiving 500-600 mm. Rainfall is bimodal, occurring mainly in March-June, with short rains in November-December. The Pangani River rises as a series of small streams on Mt Kilimanjaro and Mt Meru. The two major rivers created by these streams are the Kikuletwa and Ruvu Rivers, which converge at Nyumba ya Mungu Dam. The Pangani River drains Nyumba ya Mungu Dam and is fed by the Mkomazi and Luengera Rivers before it meets the Indian Ocean at the Pangani estuary, south of Tanga town.

Delineation Final Report
iii
River and estuary zonation
Ten river zones were identified for the study, each of which comprised one or more river reaches (Figure E.2). The ten zones are Mountain Torrent (>1200 m); Mountain Stream (1000-1200 m); Upper Foothills; Rejuvenated Foothill, Swamps and Lakes; Floodplains (Kirua swamp); Lower Foothills; Rejuvenated Bedrock Cascade, Mature Lower River and Estuary. Within the zones are nested 31 river sub-zones and three estuary sub-zones (Table E.1 and Figure E.4).
Figure E.2 River zones. The Rejuvenated Foothill zone is too small to show but is situated in the vicinity of K3 to R7.

Delineation Final Report
iv
Table E.1 Synchronised ecological and socio-economic zones.
Socio-economic
Zone
Socio-economic Sub
zone Harmonized River Zone
River Sub Zones
River
Mountain Torrent (>1200 m) MT1 Nduruma River
Mountain Torrent (>1200 m) MT2 Sanya River
Mountain Torrent (>1200 m) MT3 Tengeru River Mountain
Mountain Torrent (>1200 m) MT4 Himo River
Mountain Stream (1000-1200 m) MS5 Himo River
Mountain Stream (1000-1200 m) MS1 Nduruma River
Mountain Stream (1000-1200 m) MS2 Sanya River
Mountain Stream (1000-1200 m) MS3 Tengeru River
Upper foothills UF1 Kikuletwa River
Upper foothills UF1 Sanya River
Upper foothills UF1 Tengeru River
Rejuvenated foothill RJ1 Kikuletwa River
Rejuvenated foothill RJ2 Ruvu River
Lower foothills LF1 Himo River
Northern Highlands
Meru/ Kilimanjaro
Lower foothills LF1a Ruvu River
Mountain Stream (1000-1200 m) MS5 North and South Pare Mountains
Upper foothills UF1 Muraini River
Lower foothills LF2 Muraini River
Pare
Lower foothills LF5 Mkomazi Riv er
Eastern Highlands
Usambara Mountain Stream (1000-1200 m) MS6 Usambara Mountains
Shambalai Swamps and Lakes SW5 Shambalai Swamp
Swamps and Lakes SW3 Ruvu River Lake Jipe
Swamps and Lakes SW2 Lake Jipe
Swamps and Lakes SW1 U/s of Nyumba ya Mungu Dam
Lakes
Nyumba ya Mungu Dam
Swamps and Lakes SW4 Nyumba ya Mungu Dam
Floodplain FP Kirua Swamp Pangani/Kirua Kirua Swamp
Lower foothills LF3 Downstream of swamp to Mswahe
Lower foothills LF4 Mswahe to downstream of Mkomazi Confluence
Pangani
Rejuvenated Bedrock Cascade RBC1 From LF4 to d/s Pangani Falls
Mesic Lowlands
Luengera Lower foothills LF6 Luengera River
Coast Mature lower river LR1 Pangani Fall to estuary
Estuary E1 Upper estuary
Estuary E2 Middle estuary Coastal
Estuary
Estuary E3 Lower estuary
Socio-economic zonation
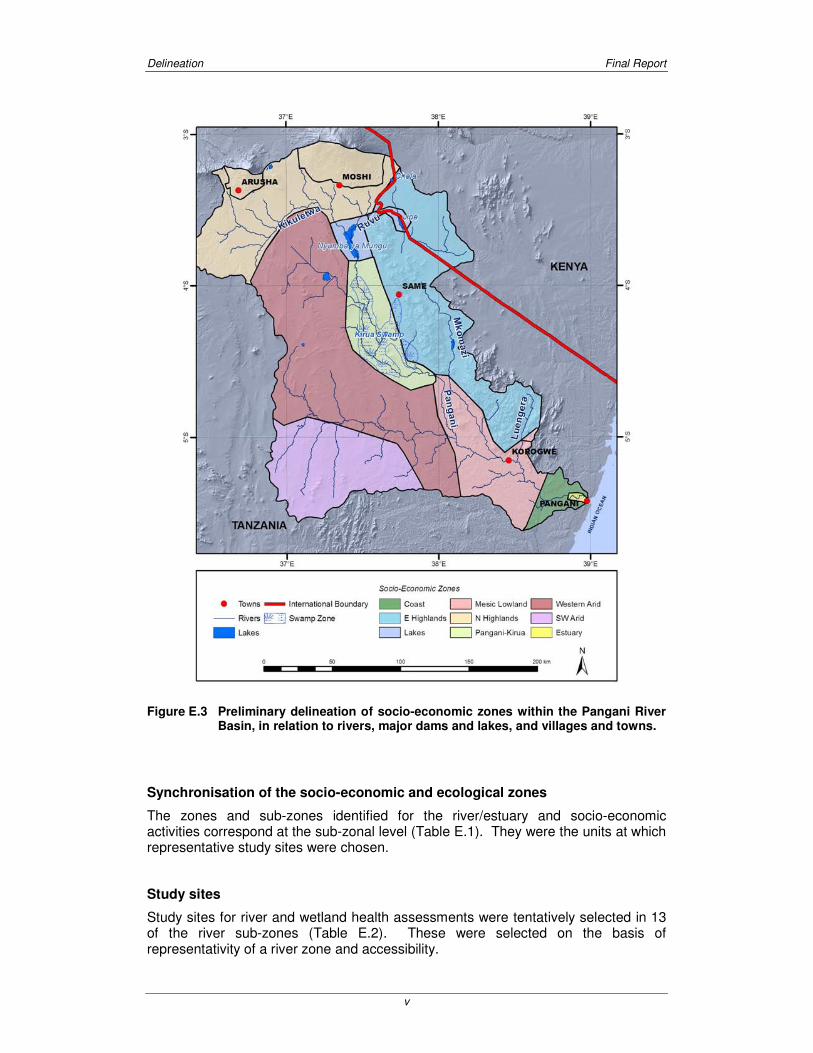
The basin was delineated into six relatively homogenous socio-economic zones on the basis of land use and relationships to aquatic ecosystems (Figure E.3). The six zones are Northern Highlands, Eastern Highlands, Swamps and Lakes, Pangani-Kirua Swamp, Mesic Lowlands and Coast. Within the zones are nested 12 sub-zones (Table E.1). The arid western areas were not included because of relatively low population density and distance from the Pangani River and tributaries.
Delineation Final Report
v
Figure E.3 Preliminary delineation of socio-economic zones within the Pangani River Basin, in relation to rivers, major dams and lakes, and villages and towns.
Synchronisation of the socio-economic and ecological zones
The zones and sub-zones identified for the river/estuary and socio-economic activities correspond at the sub-zonal level (Table E.1). They were the units at which representative study sites were chosen.
Study sites
Study sites for river and wetland health assessments were tentatively selected in 13 of the river sub-zones (Table E.2). These were selected on the basis of representativity of a river zone and accessibility.
Delineation Final Report
vi
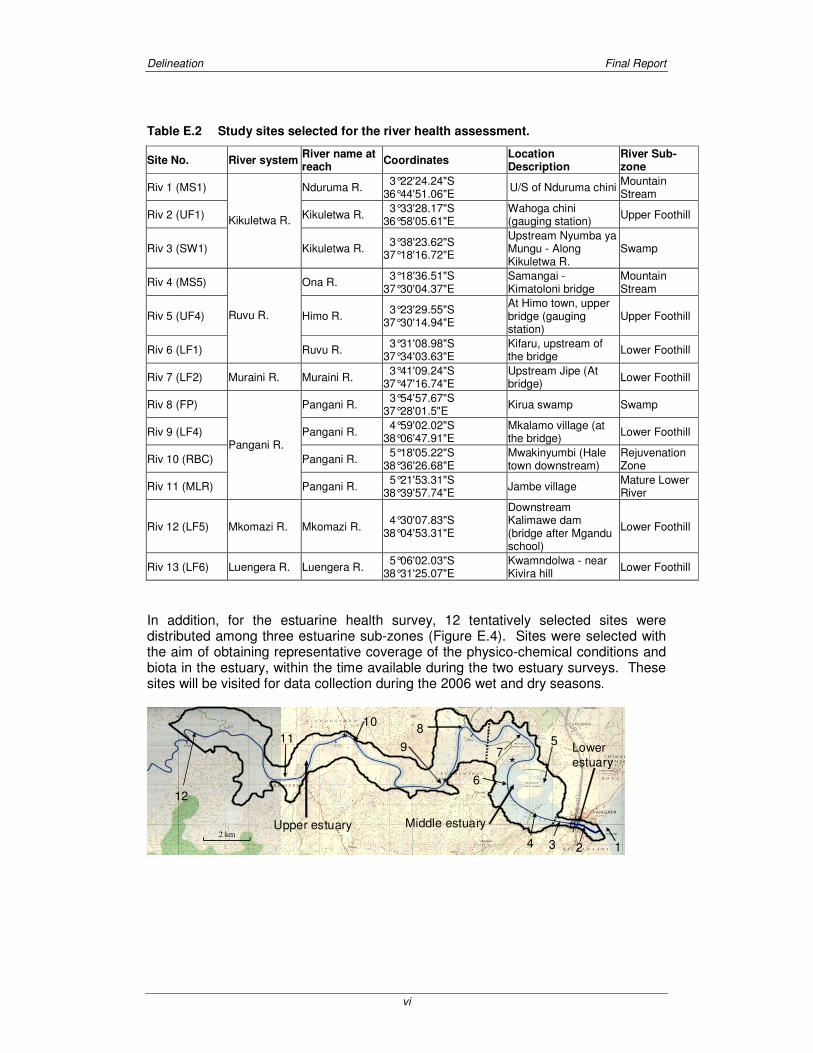
Table E.2 Study sites selected for the river health assessment.
Site No. River system River name at reach
Coordinates Location Description
River Sub-zone
Riv 1 (MS1) Nduruma R. 3°22'24.24"S 36°44'51.06"E
U/S of Nduruma chini Mountain Stream
Riv 2 (UF1) Kikuletwa R. 3°33'28.17"S 36°58'05.61"E
Wahoga chini (gauging station)
Upper Foothill
Riv 3 (SW1)
Kikuletwa R.
Kikuletwa R. 3°38'23.62"S 37°18'16.72"E
Upstream Nyumba ya Mungu - Along Kikuletwa R.
Swamp
Riv 4 (MS5) Ona R. 3°18'36.51"S 37°30'04.37"E
Samangai - Kimatoloni bridge
Mountain Stream
Riv 5 (UF4) Himo R. 3°23'29.55"S 37°30'14.94"E
At Himo town, upper bridge (gauging station)
Upper Foothill
Riv 6 (LF1)
Ruvu R.
Ruvu R. 3°31'08.98"S 37°34'03.63"E
Kifaru, upstream of the bridge
Lower Foothill
Riv 7 (LF2) Muraini R. Muraini R. 3°41'09.24"S 37°47'16.74"E
Upstream Jipe (At bridge)
Lower Foothill
Riv 8 (FP) Pangani R. 3°54'57.67"S 37°28'01.5"E
Kirua swamp Swamp
Riv 9 (LF4) Pangani R. 4°59'02.02"S 38°06'47.91"E
Mkalamo village (at the bridge)
Lower Foothill
Riv 10 (RBC) Pangani R. 5°18'05.22"S 38°36'26.68"E
Mwakinyumbi (Hale town downstream)
Rejuvenation Zone
Riv 11 (MLR)
Pangani R.
Pangani R. 5°21'53.31"S 38°39'57.74"E
Jambe village Mature Lower River
Riv 12 (LF5) Mkomazi R. Mkomazi R. 4°30'07.83"S 38°04'53.31"E
Downstream Kalimawe dam (bridge after Mgandu school)
Lower Foothill
Riv 13 (LF6) Luengera R. Luengera R. 5°06'02.03"S 38°31'25.07"E
Kwamndolwa - near Kivira hill
Lower Foothill
In addition, for the estuarine health survey, 12 tentatively selected sites were distributed among three estuarine sub-zones (Figure E.4). Sites were selected with the aim of obtaining representative coverage of the physico-chemical conditions and biota in the estuary, within the time available during the two estuary surveys. These sites will be visited for data collection during the 2006 wet and dry seasons.
Upper estuary Middle estuary
Lowerestuary
1234
5
6
7
8
9
10
12
11
*
*
*
2 km

Delineation Final Report
vii
Figure E.4 Map of the Pangani estuary showing the upper, lower and lateral boundaries (solid lines), division into Upper, Middle and Lower Zones (dotted lines)
2 and the possible study sites.
2 The solid blue line marks the centre of the estuary. Proposed sampling sites for physico-chemical parameters,
phytoplankton, invertebrates and fish are numbered from 1-12. Historic water quality sampling sites are marked with
asterisks.
Delineation Final Report
viii
TABLE OF CONTENTS
EXECUTIVE SUMMARY.............................................................................................i TABLE OF CONTENTS .......................................................................................... viii LIST OF TABLES.......................................................................................................x
LIST OF FIGURES....................................................................................................xi 1 INTRODUCTION................................................................................................ 1
1.1 Background................................................................................................. 1
1.2 Pangani River Basin Flow Assessment Objectives and Workplan............... 2
1.2.1 Project objectives................................................................................. 2
1.2.2 Work plan............................................................................................. 2
1.3 Task 2: The need for delineation ................................................................. 5
1.4 Approach taken to delineation ..................................................................... 5
1.5 Layout of this report .................................................................................... 5
2 CATCHMENT LOCATION AND CHARACTERISTICS....................................... 7
2.1 Definition of the Pangani River Basin .......................................................... 7
2.2 Location in relation to administrative divisions............................................. 7
2.3 Topography and rainfall............................................................................... 9
2.4 Climate...................................................................................................... 11
Rivers, wetlands, lakes and dams........................................................................ 13
2.5 Vegetation................................................................................................. 15
3 RIVER ZONATION........................................................................................... 17
3.1 Introduction ............................................................................................... 17
3.2 Hydrological zonation................................................................................ 17
3.3 Geomorphological and hydraulic zone analysis......................................... 19
3.3.1 Introduction ........................................................................................ 19
3.3.2 Approach used................................................................................... 19
3.3.3 Geology and dominant substratum..................................................... 20
3.3.4 Channel planform, valley form and the presence of floodplains.......... 20
3.3.5 Slope.................................................................................................. 20
3.4 Chemical and thermal zonation ................................................................. 26
3.4.1 Introduction ........................................................................................ 26
3.4.2 Approach used................................................................................... 27
3.4.3 Findings ............................................................................................. 27
3.5 Biological zonation .................................................................................... 30
3.5.1 Introduction ........................................................................................ 30
3.5.2 Approach used................................................................................... 30
3.5.3 Findings ............................................................................................. 31
3.6 Harmonised river zonation (including the estuary)..................................... 35
3.6.1 Hydrology........................................................................................... 35
3.6.2 Geomorphology ................................................................................. 35
3.6.3 Chemistry and biology........................................................................ 35
4 ESTUARINE ZONATION ................................................................................. 38
4.1 Delineation of upstream, downstream and lateral boundaries ................... 38
4.2 Zonation.................................................................................................... 38
5 SOCIO-ECONOMIC ZONATION...................................................................... 41
5.1 Population................................................................................................. 41
5.2 Land use ................................................................................................... 42
5.3 Use of water.............................................................................................. 42
5.4 Household use of aquatic resources ......................................................... 43
5.5 Delineation of the basin socio-economic zones......................................... 44
5.5.1 Northern Highlands ............................................................................ 45
5.5.2 Eastern Highlands.............................................................................. 45
5.5.3 Lakes ................................................................................................. 45
Delineation Final Report
ix
5.5.4 Middle Pangani River and Kirua Swamps .......................................... 45
5.5.5 Mesic lowlands................................................................................... 46
5.5.6 Coast and estuary.............................................................................. 46
5.5.7 Western and south-western arid regions ............................................ 46
6 SYNCHRONISATION OF THE SOCIO-ECONOMIC AND ECOLOGICAL ZONES.................................................................................................................... 47
7 STUDY SITES.................................................................................................. 49
7.1 River and estuary health assessment........................................................ 49
7.1.1 Rivers (including lakes and swamps) ................................................. 49
7.1.2 Estuary............................................................................................... 51
7.2 Social assessment .................................................................................... 51
8 THE WAY FORWARD ..................................................................................... 53
9 REFERENCES................................................................................................. 54
APPENDIX A: LIST OF PARTICIPANTS AT THE BASIN DELINEATION WORKSESSION ..................................................................................................... 57
APPENDIX B: WORK PLAN FOR BASIN DELINEATION WORKSESSIONS......... 58
APPENDIX C: GIS METADATA .............................................................................. 59
Delineation Final Report
x
LIST OF TABLES
Table 1.1 Gantt chart showing activities and tasks for the Pangani Basin Flow Assessment. 3
Table 2.1 Area of districts occurring within the Pangani River Basin based on GIS data (Appendix C). 9
Table 2.2 Catchment Gross Evaporation (mm) for selected sub-catchments. 12
Table 2.3 Land cover within the basin, as defined by Tanric/FRMP data of 1996. 15
Table 3.1 The sixteen hydrological sub-catchments. 17
Table 3.2 The reports and maps that provided the bulk of the information used in the geomorphological delineation. 19
Table 3.3 Main rivers within the Pangani River Basin considered in the geomorphological zone analysis. 20
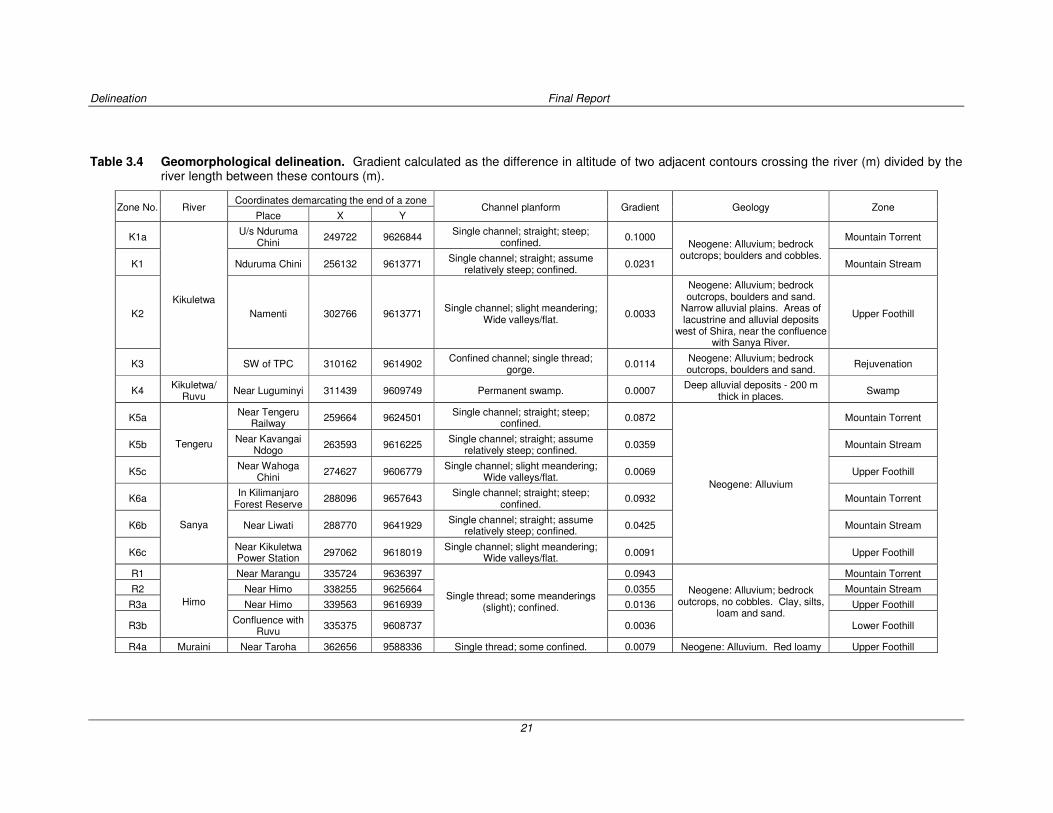
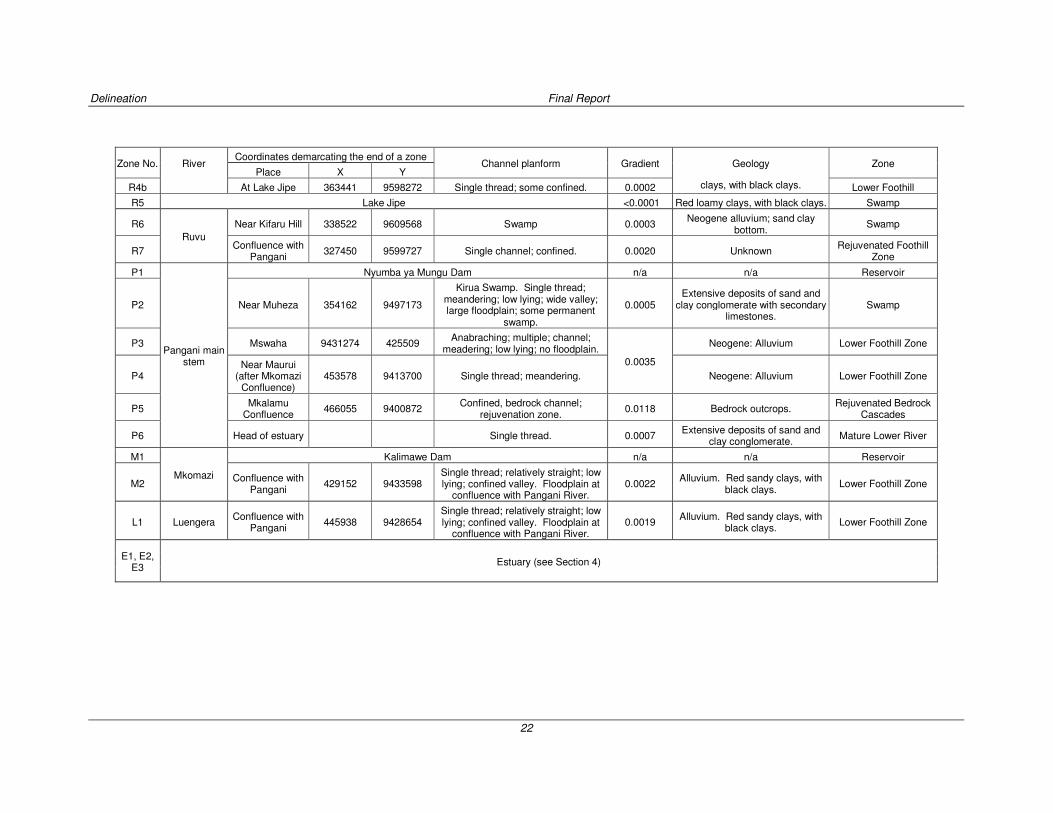
Table 3.4 Geomorphological delineation. Gradient calculated as the difference in altitude of two adjacent contours crossing the river (m) divided by the river length between these contours (m). 21
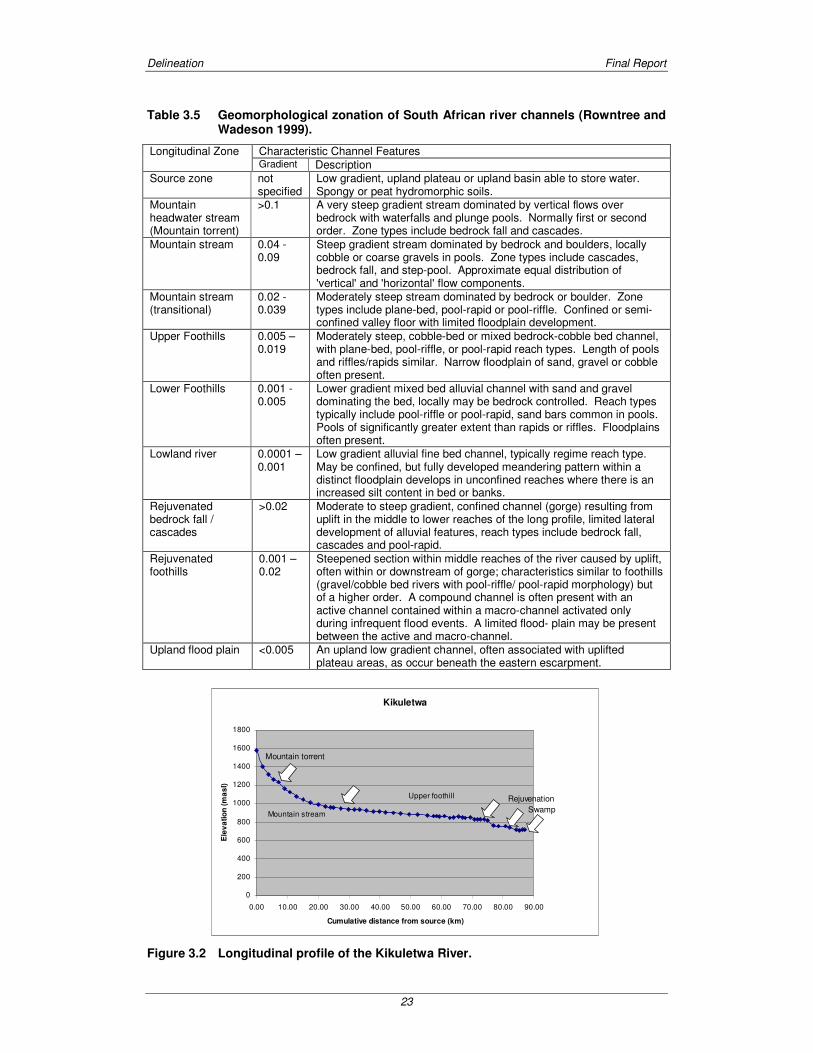
Table 3.5 Geomorphological zonation of South African river channels (Rowntree and Wadeson 1999). 23
Table 3.6 Tentative chemical zonation of the Pangani River system. 29
Table 3.7 Literature searched for data on biological zonation of the Pangani River Basin. 31
Table 3.8 Tentative biological zonation of the Pangani River system. 33
Table 3.9 Harmonized river zones. 37
Table 4.1 Available water quality data for the Pangani estuary. (Source of data: PBWO/Ministry of Water). 39
Table 6.1 Synchronised socio-economic and ecological zones, ordered to highlight relationships to socio-economic zones. 47
Table 6.2 Synchronised ecological and socio-economic zones, ordered to highlight relationships to river zones. 48
Table 7.1 Study sites within the Pangani River Basin selected for the river health assessment. Site characterisation in brackets as in Table 3.9. 49
Delineation Final Report
xi
LIST OF FIGURES
Figure 2.1 River basins administered by the PBWO, including the Pangani River Basin. Source: PBWO/IUCN. 7
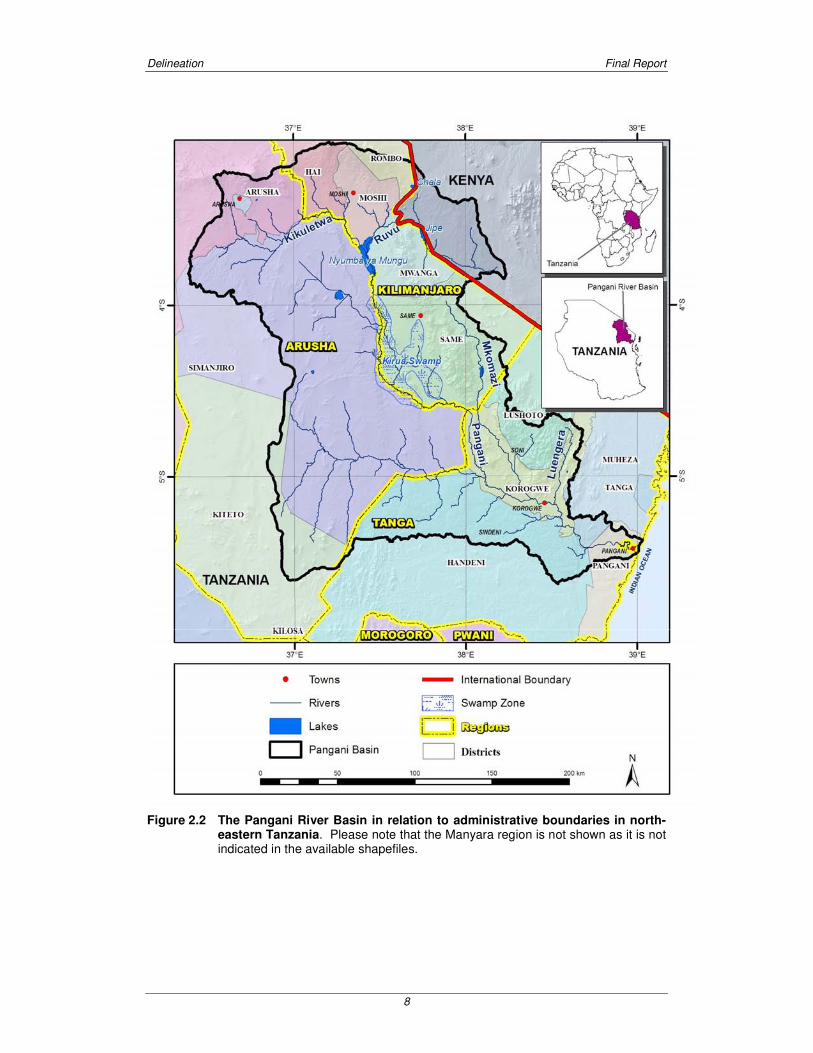
Figure 2.2 The Pangani River Basin in relation to administrative boundaries in north-eastern Tanzania. Please note that the Manyara region is not shown as it is not indicated in the available shapefiles. 8
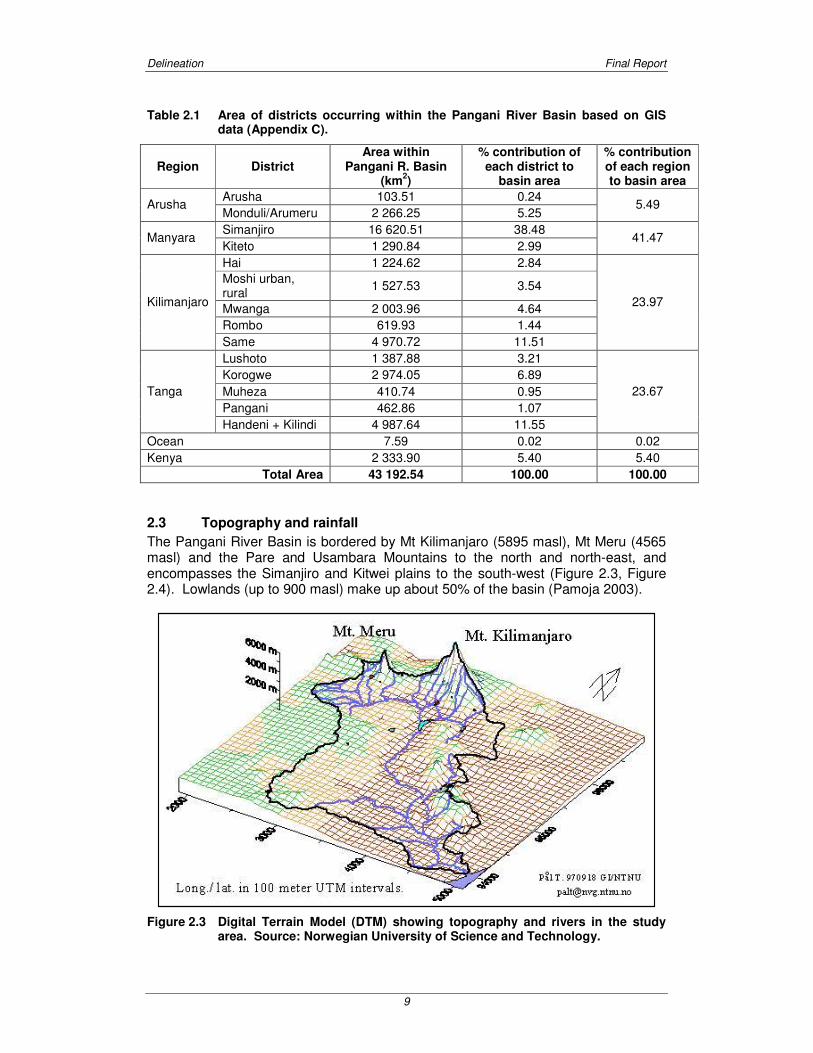
Figure 2.3 Digital Terrain Model (DTM) showing topography and rivers in the study area. Source: Norwegian University of Science and Technology. 9
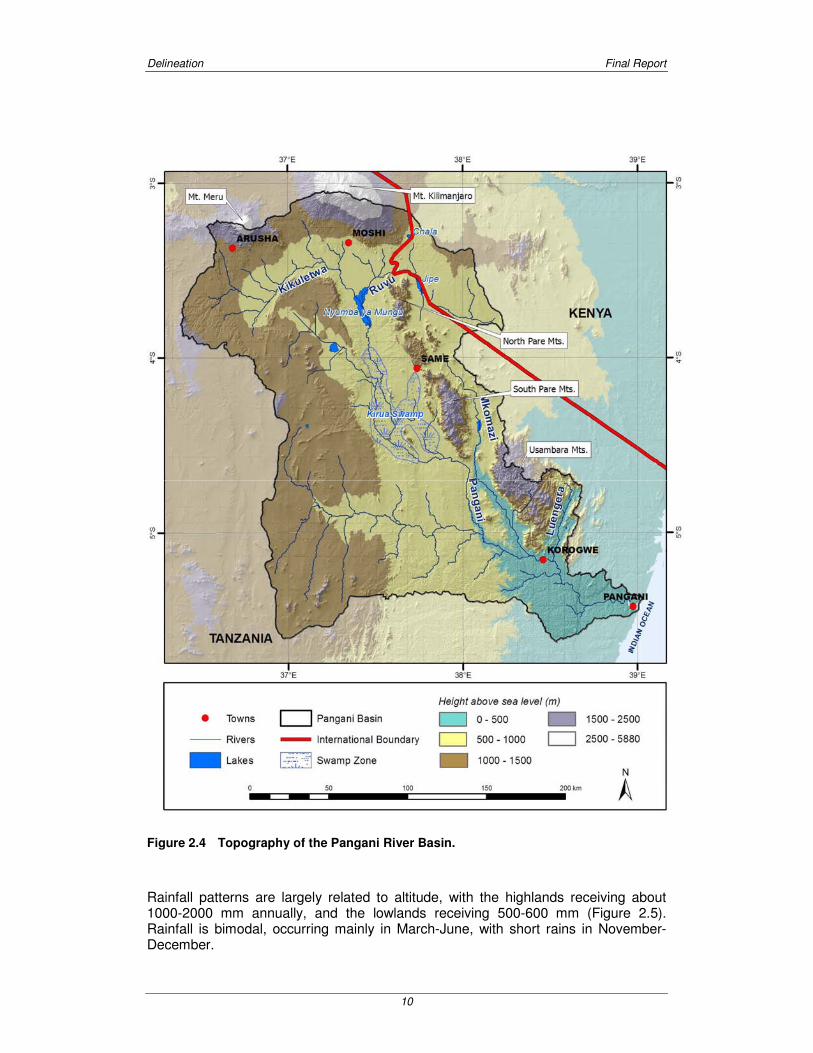
Figure 2.4 Topography of the Pangani River Basin. 10
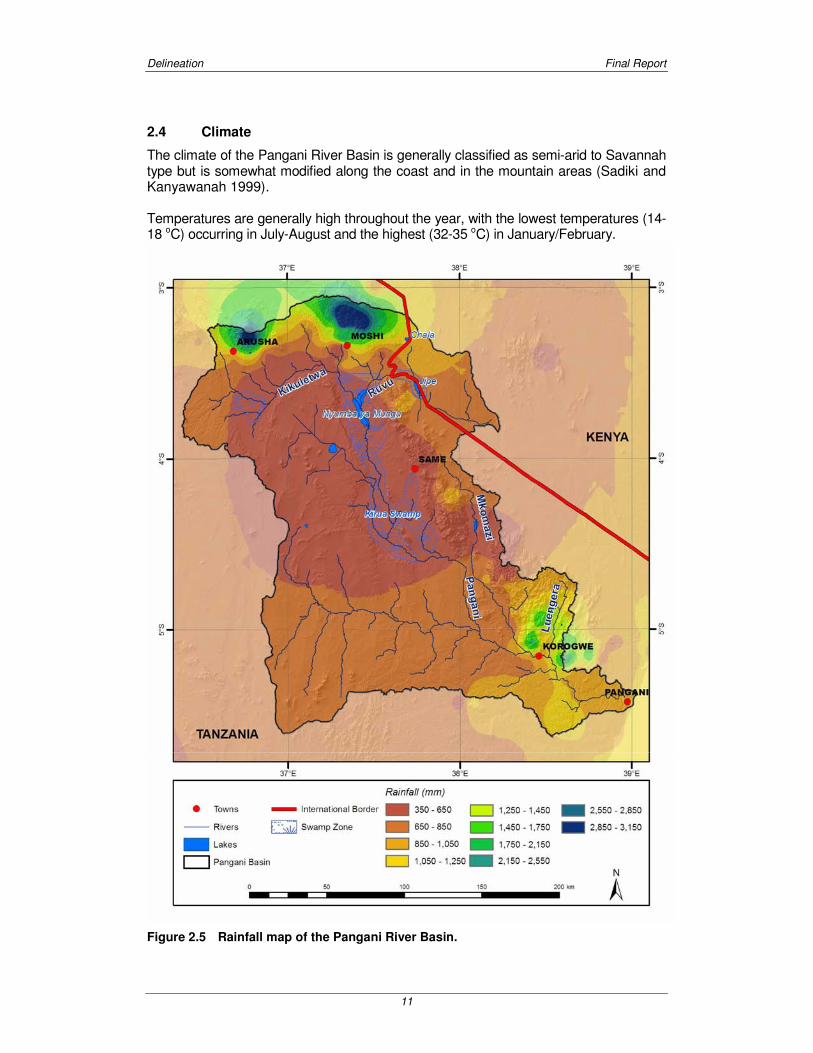
Figure 2.5 Rainfall map of the Pangani River Basin. 11
Figure 2.6 Monthly Distributions of Gross Evaporation (PBWO/IUCN 2006). 12
Figure 2.7 Map of the Pangani River Basin showing major natural features, vegetation types and land uses. Source: Tanric GIS data, IUCN. 16
Figure 3.1 Delineation of sub-catchments within the Pangani Basin (from PBWO/IUCN 2006). 18
Figure 3.2 Longitudinal profile of the Kikuletwa River. 23
Figure 3.3 Longitudinal profile of the Tengeru River. 24
Figure 3.4 Longitudinal profile of the Sanya River. 24
Figure 3.5 Longitudinal profile of the Kahe/Himo River. 25
Figure 3.6 Longitudinal profile of the Muraini River. 25
Figure 3.7 Longitudinal profile of the Ruvu River, downstream of Lake Jipe. 25
Figure 3.8 Longitudinal profile of the Pangani River (mainstem). 26
Figure 3.9 Longitudinal profile of the Mkomazi River, downstream of Kalimawe Dam. 26
Figure 3.10 Longitudinal profile of the Luengera River 26
Figure 3.11 Harmonised river zones. The Rejuvenated Foothill zone is too small to show but is situated in the vicinity of K3 to R7. 36
Figure 4.1 Map of the Pangani estuary showing the upper, lower and lateral boundaries (solid lines) and division into Upper, Middle and Lower sub-zones (dotted lines). 39
Figure 4.2 Vegetation and land use map of the Pangani estuary (Source: Huntington Technical Services 1996. Compiled from Landsat Thematic Mapper imagery data, bands 4, 5 and 3. 1:250 000 scale). 40
Figure 5.1 Variation in population density in the Pangani River Basin at a ward level. Based on 2002 census data. 41
Figure 5.2 Distribution of cultivated areas within the Pangani River Basin, in relation to altitude, rivers and major dams and lakes. 43
Figure 5.3 Delineation of socio-economic sub-zones within the Pangani River Basin, in relation to rivers, major dams and lakes, and villages and towns. 44
Figure 7.1 River Health Assessment sampling sites. 50

Delineation Final Report
xii
ACKNOWLEDGEMENTS
The authors wish to extend their thanks to:
• The Pangani Basin Water Office for logistical support.
• Claire Malan of University of Cape Town for the South African portion of the literature search.
Delineation Final Report
1
1 INTRODUCTION
1.1 Background
Tanzania’s National Water Policy (NAWAPO 2002) provides that water for maintenance of aquatic ecosystems will be accorded second highest priority in allocation, after water for basic human needs. Tanzania has little experience and capacity in environmental flow assessments to support this environmental policy provision. The Pangani River Basin Management Project, supported by the IUCN Water & Nature Initiative, UNDP/GEF and the European Union, has made a commitment to conduct a flow assessment in the Pangani Basin as a means of providing relevant technical information (hydrological, economic, ecological and social) to the Pangani Basin Water Board to support the water-allocation process. Support to the Pangani Basin Water Office (PBWO) started with a 4-day training course on environmental flows held in Mbeya, in September 2003, organised by the Ministry of Water and Livestock Development (now Ministry of Water) and supported by the World Bank, through its Lower Kihansi Environmental Management Project and River Basin Management Project (with sponsorship from the Bank Netherlands Water Partnership Program), and by IUCN, through its Water and Nature Initiative. A training course in environmental economics, supported by the IUCN Water & Nature Initiative, was convened in October 2003. It focussed on livelihood use of the river and estuary, and valuation of goods and services provided by the freshwater ecosystems in the basin. Subsequent to these exercises, IUCN and the PBWO initiated discussions with Southern Waters (Southern Waters) and Anchor Environmental Consultants (“Anchor”) in October 2004 about conducting a flow assessment in the Pangani River Basin. Initial discussions focussed on conducting a detailed flow assessment using a complex methodology applied in South Africa (the DRIFT Methodology) but key limitations were the amount and nature of supporting hydrological data for the Pangani River Basin, and a limited specialist capacity for conducting flow assessments in Tanzania. Owing to these concerns it was decided that application of a full DRIFT Methodology could be too data- and expert-intensive for what was planned as the first FA application in Tanzania, and that it would in all likelihood fall short on the overriding need of creating capacity for flow assessments within Tanzania. Following this, a series of meetings and visits to key locations in the Pangani River Basin were conducted by representatives from PBWO, IUCN and Southern Waters between 13 and 18 December 2004, and a detailed proposal developed for what was termed a “Pangani capacity-building Flow Assessment”. In essence the proposal called for the establishment of a Flow Assessment Team selected from within Tanzania, consisting of specialists in a range of river-related, water-allocation and policy-making disciplines, which could work with international flow-assessment advisors from Southern Waters and Anchor. Together, they would gradually develop an understanding of the hydrology of the Pangani River Basin, the nature and functioning of the river system and the links between the river and subsistence use of its resources. The two aims of the project were to be hands-on capacity building of the PBWO and the Tanzanian group of specialists (who in the future could act as a nucleus of expertise for other Tanzanian basins), and the provision of technical information and decision support tools to assist the Pangani Basin Water Office and the Pangani Basin Water Board in managing water resources.

Delineation Final Report
2
1.2 Pangani River Basin Flow Assessment Objectives and Workplan
1.2.1 Project objectives
The objectives of the Pangani Basin Flow Assessment (FA) are to:
o generate baseline data on the condition of rivers, wetlands and the estuary against which the impact of water-related decision-making can be monitored in future;
o enhance the understanding among PBWO and MoW staff of the relationship between flow, river health and the people who use the river;
o create an awareness of the trade-offs to be made between water development and natural-resource protection;
o develop simple tools to help guide water-resource management and water allocations in the Pangani River Basin;
o build capacity that will enable PBWO to act as a nucleus of expertise for FA-related work in other areas;
o support the National Water Policy (NAWAPO 2002) and the National Environmental Management Act (2004).
1.2.2 Work plan
The final agreed proposal for the Pangani River Basin FA comprised a total of ten tasks spanning a total period of just over two years – October 2005 to February 2008. A brief summary of proposed activities in each task is provided below and a breakdown of timing is provided in Table 1.1.
Task 1: Hydrology
This task is a desktop-exercise and will include describing water-resource developments in the catchment, obtaining daily flow records for the basin, simulating daily historical and present-day flow data, developing a simple hydrological system model for the Pangani River Basin, and generating relevant hydrological data for selected scenarios.
Task 2: Study area delineation and site selection
The objective of this task is to divide the river into relatively homogeneous zones in terms of biophysical characteristics (river reach analysis) and land-use, and homogeneous zones across the basin in terms of social factors; to select representative sampling sites in the river zones, in the estuary and in each social zone; and to develop simple (GIS) base maps for use in the following tasks.
Task 2.1: Scenario identification
The main objective of this task is to conceptualise the kind of scenarios that will be created and evaluated later in the project, as a guide for appropriate data collection.
Task 3: Health assessment of the rivers and estuary
Building on Task 2 and using the sites selected there, this task is to include:
• a literature search aimed at identifying past reports and existing data of relevance to a health assessment of the river system and estuary, and to a social assessment;

Delineation Final Report
3
Table 1.1 Gantt chart showing activities and tasks for the Pangani Basin Flow Assessment.
J J A S O N D J F M A M J J A S O N D J F M A M J J A S O N D J F Task No. Task name
2005 2006 2007 2008
Task 0 Management
Hydrological Report (Volume 1 - Hydrology model) Task 1
Hydrological Report (Volume 2 - Systems model)
Delineation and scenario identification
Basin Delineation Report Task 2
Scenario Conceptualisation Report
Task 3 River and Estuarine Health Assessment
Socio-economic assessment Task 4
State of the Basin Report Identify priority research and develop ToRs for specialist studies Task 5
Report on research priorities and specialist TORs Specialist briefing meeting; Table of Contents of specialist reports; review of studies
Develop an understanding of the river and estuary ecosystem: Specialist Studies
Task 6
Specialist reports received and sent to referees
Task 7 Capture conceptual relationships, and evaluate eight scenarios
Practical application of scenario evaluation by PBWO National Team Task 8 Scenario Evaluation Report
Final Reporting including glossy brochure Task 9
Awareness raising outside of the Team
Delineation Final Report
4
• a river-health assessment, to be completed once in the dry season and once in the wet season at approximately 14 sites along major tributaries and the main stem of the Pangani River, and several within the estuary, using internationally recognised biomonitoring techniques;
• an evaluation of existing water-quality data collected at key points along the river system/estuary;
• a description of the baseline present-day condition of the system and its hypothetical reference (natural) condition if possible;
• development and sourcing of relevant GIS coverages.
Task 4: Baseline socio-economic assessment
Also building on Task 2 and using the selected sites, this task includes completion of a social field survey using participatory methods and household surveys. It will provide a description of the communities, focussing on their relation to water and water resources, their socio-economic well-being and sensitivity to changes in river flow. It will also provide a description of the baseline present-day socio-economic conditions in the basin. Tasks 3 and 4 will jointly contribute to a State of the Basin report.
Task 5: Develop an understanding of the ecological and economic systems
This task is to encompass the following activities:
• identification and evaluation of the key flow-related changes that have occurred over time in the Pangani River Basin;
• development of simple conceptual models for the changes that have occurred;
• identification of priority topics (e.g. climate change; hydropower; impact of land-use changes; salt-water intrusion) for more in-depth investigation;
• development of Terms of Reference for these in-depth investigations.
Task 6: Specialist Studies
In this task, appointed specialists will complete research on the priority topics and write reports. These will be reviewed by the Project Team, revised if necessary and then read by the full team.
Task 7: Develop conceptual relationships, create and evaluate scenarios
This task will include:
• development of conceptual relationships between flows and the river ecosystem, and between flows, river health and livelihoods
• development of a simple FA scenario-evaluation tool using the information gathered in previous tasks;
• population of the scenario-evaluation tool with the conceptual flow response relationships;
• training the National Pangani FA Team in the use of the scenario-evaluation tool
• preparation of a manual for operating the FA scenario-evaluation tool.
Task 8: Practical application of scenario evaluation by National Pangani FA Team
The purpose of this task will be to allow the National Pangani FA Team to evaluate one additional scenario and to evaluate the usefulness of the tool and manual developed in Task 7.

Delineation Final Report
5
Task 9: Final Reporting
This task will serve to synthesise information from the previous tasks into a Summary Report of the Pangani River; and to evaluate the extent to which the project has achieved its goals.
Task 10: Awareness raising outside the National Pangani FA Team
This task will include making presentations to the Pangani Basin Water Board, reducing the State of the Basin Report to text suitable for an information brochure and the creation of text for one additional glossy report/pamphlet.
1.3 Task 2: The need for delineation
This document reports on the activities within Task 2 (Study Area Delineation and Site Selection). Before a study begins, its limits need to be defined. Some of these limits will be connected with time and some with finances. At a technical level, any study area of a river system needs to define the geographical area to be addressed. In this project, the study area is easily delineated as being the whole Pangani River Basin. Within the Pangani River Basin, no study can address ever kilometre of river, or every person living within the area. Thus, it is usual practice to search for representative areas that can together represent the whole study area. These representative areas should be reasonably homogeneous in character, at least in terms of the studies that will be done. Thus, a delineation exercise of a river would search for stretches of river that differ from each other but are internally similar, whilst a social delineation might search for areas that differ in livelihoods or wealth. Once these homogeneous areas have been identified, one or more representative sites can be chosen in each. These will become the focus of data-collection activities, and the results from each will be extrapolated over the respective area.
1.4 Approach taken to delineation
Task 2 of the Pangani River Basin FA project was completed at the PBWO in Moshi, Tanzania, from 27 February to 4 March 2006. The week-long work session was attended by all international and national members of the FA team. A full list of participants present at the work session is included in Appendix A, and the Agenda for the Delineation Work-session in Appendix B. The primary objective of this task was to divide the river into relatively homogeneous areas in terms of biophysical characteristics (reach analysis) and land-use; to select homogeneous sampling areas for socio-economic surveys; to select representative sites for all the river and social work to follow; and to develop simple (GIS) base maps for use as required. The workshop was divided into a number of plenary sessions for the purpose of sharing information, and a number of group work sessions where sub-groups worked on river, estuarine and social analyses. In addition, a GIS team provided maps and related information as required.
1.5 Layout of this report
Chapter 2 provides a summary of relevant data on the Pangani River Basin. Chapters 3-5 present the results of the delineation exercises by the river, estuarine

Delineation Final Report
6
and social sub-groups, respectively. Chapter 6 reports on the exercise to synchronise the various zonation schemes produced by the sub-groups to ensure overlap at the sub-zonal level, and Chapter 7 details the study sites tentatively selected to represent the river and estuary. Finally, Chapter 8 outlines what follows next in the project.
Delineation Final Report
7
2 CATCHMENT LOCATION AND CHARACTERISTICS
2.1 Definition of the Pangani River Basin
The Pangani River Basin, situated in the north-east of Tanzania, covers a total area of some 43 192 km2, or 4.3 million ha. About 2 300 km2 (5.4%) of this area is in Kenya. Note that the “Pangani River Basin”, which is the study area selected by the Water & Nature Initiative (WANI), is defined on the basis of drainage patterns, and is not the same as the slightly larger “Pangani Basin” which is the jurisdiction of the PBWO. The latter also incorporates three smaller basins adjacent to the Pangani River Basin (Figure 2.1), and covers a total area of about 56 000 km2. The terms “Pangani River Basin” and “Pangani Basin” thus have two different meanings and are applied as such in this report.
Figure 2.1 River basins administered by the PBWO, including the Pangani River Basin. Source: PBWO/IUCN.
2.2 Location in relation to administrative divisions
The Tanzanian portion of the Pangani River Basin covers parts of Kilimanjaro, Manyara, Arusha and Tanga Regions. Within these, it covers part or all of fourteen districts and two municipalities (Arusha and Moshi; Figure 2.2, Table 2.1).
Delineation Final Report
8
Figure 2.2 The Pangani River Basin in relation to administrative boundaries in north-eastern Tanzania. Please note that the Manyara region is not shown as it is not indicated in the available shapefiles.
Delineation Final Report
9
Table 2.1 Area of districts occurring within the Pangani River Basin based on GIS data (Appendix C).
Region District Area within
Pangani R. Basin (km
2)
% contribution of each district to
basin area
% contribution of each region to basin area
Arusha 103.51 0.24 Arusha
Monduli/Arumeru 2 266.25 5.25 5.49
Simanjiro 16 620.51 38.48 Manyara
Kiteto 1 290.84 2.99 41.47
Hai 1 224.62 2.84
Moshi urban, rural
1 527.53 3.54
Mwanga 2 003.96 4.64
Rombo 619.93 1.44
Kilimanjaro
Same 4 970.72 11.51
23.97
Lushoto 1 387.88 3.21
Korogwe 2 974.05 6.89
Muheza 410.74 0.95
Pangani 462.86 1.07
Tanga
Handeni + Kilindi 4 987.64 11.55
23.67
Ocean 7.59 0.02 0.02
Kenya 2 333.90 5.40 5.40
Total Area 43 192.54 100.00 100.00
2.3 Topography and rainfall
The Pangani River Basin is bordered by Mt Kilimanjaro (5895 masl), Mt Meru (4565 masl) and the Pare and Usambara Mountains to the north and north-east, and encompasses the Simanjiro and Kitwei plains to the south-west (Figure 2.3, Figure 2.4). Lowlands (up to 900 masl) make up about 50% of the basin (Pamoja 2003).
Figure 2.3 Digital Terrain Model (DTM) showing topography and rivers in the study area. Source: Norwegian University of Science and Technology.
Delineation Final Report
10
Figure 2.4 Topography of the Pangani River Basin.
Rainfall patterns are largely related to altitude, with the highlands receiving about 1000-2000 mm annually, and the lowlands receiving 500-600 mm (Figure 2.5). Rainfall is bimodal, occurring mainly in March-June, with short rains in November-December.
Delineation Final Report
11
2.4 Climate
The climate of the Pangani River Basin is generally classified as semi-arid to Savannah type but is somewhat modified along the coast and in the mountain areas (Sadiki and Kanyawanah 1999). Temperatures are generally high throughout the year, with the lowest temperatures (14-18 oC) occurring in July-August and the highest (32-35 oC) in January/February.
Figure 2.5 Rainfall map of the Pangani River Basin.

Delineation Final Report
12
On a basin scale, evaporation data display a relatively gradual spatial variation when compared to rainfall and other climatic variables. In general monthly patterns of evaporation are relatively uniform across the basin, and the months of October to March have the highest evaporation potential (Figure 2.6; PBWO/IUCN 2006).
Figure 2.6 Monthly Distributions of Gross Evaporation (PBWO/IUCN 2006).
Table 2.2 shows gross evaporation for selected sub-catchments. It is fairly uniform across the basin, with the highest evaporation occurring from October to March.
Table 2.2 Catchment Gross Evaporation (mm) for selected sub-catchments.
CATCHMENT OCT NOV DEC JAN FEB MAR APR MAY JUN JUL AUG SEP
Kikuletwa
1DD55 : Kikuletwa at Karangai 186 193 177 208 184 208 162 146 124 128 146 163
1DD54 : Kikuletwa at Powerstation 204 191 190 199 202 204 167 142 135 135 155 180
1DD1 : Kikuletwa at TPC 195 180 177 186 180 182 154 124 120 120 142 163
Ruvu
1DC2A : Ruvu at Tanga Rd Bridge 195 180 177 186 180 182 154 124 120 120 142 163
1DC11A : Himo at Moshi-Himo Rd 195 180 177 186 180 182 154 124 120 120 142 163
Mkomazi
1DB2A : Saseni at Gulutu 164 171 173 182 176 177 150 128 116 120 128 146
1DB19 : Soni at Soni 137 137 137 173 156 146 116 102 90 97 111 124
1DB17 : Mkomazi at Gomba 164 171 173 182 176 177 150 128 116 120 128 146
Luengera
1DA1 : Luengera at Korogwe 133 141 155 173 168 168 124 111 107 106 106 116
1DA3 : Luengera at Magoma 137 137 137 173 156 146 116 102 90 97 111 124
Pangani Mainstem
1D14 : Pangani at Korogwe 208 206 206 208 188 202 171 146 139 137 159 182
1D17 : Pangani at Hale 155 150 164 174 165 167 138 124 117 115 124 138
ESTUARY 164 171 173 182 176 177 150 128 116 120 128 146
0
50
100
150
200
250
Oct
Nov
Dec Ja
nFeb M
arApr
May Ju
nJu
l
Aug Sep
Month
Eva
po
rati
on
[m
m] 1DD55 : Kikuletw a
at Karangai
1DC11A : Himo at
Moshi-Himo Rd
Bridge1D10 : Pangani at
Buiko
ESTUARY

Delineation Final Report
13
Rivers, wetlands, lakes and dams
The Pangani River rises as a series of small streams on Mt Kilimanjaro and Mt Meru (Figure 2.5). The two major rivers created by these streams are the Kikuletwa and Ruvu Rivers, which converge at Nyumba ya Mungu Dam. The Pangani River drains Nyumba ya Mungu Dam and is fed by the Mkomazi and Luengera Rivers before it meets the Indian Ocean at the Pangani estuary, south of Tanga town. Water feeds into the Kikuletwa River from the Nduruma, Malala, Tengeru,Ngaresero, Usa (joined by Maji ya Chai), Sanya, Kware and Kikafu (joined by Karanga, Weruweru) Rivers and from Chemka. Rundugai springs. Those feeding the Ruvu River downstream of Lake Jipe are the Himo, Mue (joined by the Miwaleni/Dehu, Soko), and the Rau (joined by the Njoro). Much of the water in the streams draining Mts Meru and Kilimanjaro is from an arc of natural springs located about half way down the steeper slopes. As the two rivers converge, they flow through an area of steepened topography and then enter a swamp (4000 ha) that stretches across the northern end of Nyumba ya Mungu Dam before entering the dam itself. The Nyumba ya Mungu Dam is the largest open water body in the study area. Constructed in 1968, originally for water supply, irrigation and water control, it is now used for power supply. It covers an area of 14 000 ha (Røhr and Killingtveit 2002) to 18 000 ha (Bwathondi and Mwamsojo 1993), and comprises some 55% of the basin’s surface water (Røhr and Killingtveit 2002). The natural lakes in these upper reaches of the river are Lake Jipe (1800-2800 ha) and Lake Chala (315ha) on the slopes of Kilimanjaro and near the Kenyan border (IUCN 2003). Downstream of Nyumba ya Mungu dam, the Pangani River flows as a single channel that eventually floods the vast wetland of Kirua Swamps. With an original area of 90 000 ha, this swamp now covers about 36 500 ha since building of the upstream dam. Downstream of the Kirua Swamps, the Mkomazi River and Luengera River enter the Pangani River, draining the South Pare and Usambara Mountains, respectively. Numerous smaller tributaries enter the river nearer the coast. In addition to the wetlands mentioned above, narrow floodplains supporting floodplain vegetation occur along major rivers throughout the basin, and major wetlands occur in the lower Mkomazi Plains and upstream of the estuary.

Delineation Final Report
14
Figure 2.8 Major rivers, lakes, dams and floodplain areas in the Pangani Basin.

Delineation Final Report
15
2.5 Vegetation
Vegetation changes across the basin (Table 2.3 and Figure 2.7), ranging from forests on mountain slopes to arid grasslands away from the mountains, and reflects differences in altitude and precipitation. Much of the basin area to the south-west of the Pangani River is arid. Apart from the more mesic (wet) floodplain vegetation, vegetation on the north bank is generally arid, but becomes more mesic at higher altitudes and towards the coast. Mt Kilimanjaro and Mt Meru can be described as lush vegetation islands emerging from an arid landscape.
Table 2.3 Land cover within the basin, as defined by Tanric/FRMP data of 1996.
Land Cover Type Area in km2 %
Ice cap - snow 5.7 <0.1
Bare Soil 9.2 <0.1
Natural Forest 1 793.7 4.2
Closed Woodland 1 024.2 2.4
Open Woodland 7 147.7 16.6
Bushland with Emergent Trees 6 830.8 15.8
Dense Bushland 882.0 2.0
Open Bushland 563.5 1.3
Thicket with Emergent Trees 661.0 1.5
Thicket 7.1 <0.1
Wooded Grassland 2 583.0 6.0
Wooded Grassland (Seasonally inundated) 67.9 0.2
Bushed Grassland 2 078.1 4.8
Bushland Grassland (Seasonally inundated) 1 582.0 3.7
Open Grassland 133.0 0.3
Open Grassland (Seasonally inundated) 545.4 1.3
Inland Water 170.8 0.4
Swamp/Marsh (Permanent) 365.6 0.9
Mangrove Forest 30.0 <0.1
Estuary 7.6 <0.1
URBAN 69.9 0.2
Plantation Forest 119.6 0.3
Cultivation with Tree crops (with shade trees) 881.9 2.0
Cultivation with Bushy Crops (e.g. tea) 44.3 0.1
Cultivation with Herbaceous crops 2 318.9 5.4
Mixed Cropping 3 331.4 7.7
Grassland with Scattered cropland 1 193.8 2.8
Bushland with Scattered cropland 3 196.9 7.4
Woodland with Scattered Cropland 3 211.8 7.4
KENYA 2 333.9 5.4
Total Area 43 190.5 100.0

Delineation Final Report
16
Figure 2.7 Map of the Pangani River Basin showing major natural features, vegetation types and land uses. Source: Tanric GIS data, IUCN.

Delineation Final Report
17
3 RIVER ZONATION
3.1 Introduction
The river zonation exercise aimed to delineate river zones, within which conditions are deemed to be similar, in terms of hydrology, geomorphology, chemistry and biology. To this end, each of the disciplines first delineated the catchment using discipline-specific criteria. Thereafter, the individual delineations were combined to produce a harmonized river zonation. This section provides:
• discipline-specific delineations;
• harmonized river zonation, including some explanation of the adjustments to the discipline-specific delineations that were required to arrive at the harmonized river zonation.
The harmonized river zonation was adjusted in discussion with the socio-economists to arrive at the Synchronised Zonation (Section 6).
3.2 Hydrological zonation
The Pangani River Basin was delineated into five main catchments (PBWO/IUCN 2006), which together comprise sixteen sub-catchments (Table 3.1 and Figure 3.1).
Table 3.1 The sixteen hydrological sub-catchments.
Main catchments Subcatchments
Kikuletwa at Karangai (1DD55)
Kikuletwa at old Power Station (1DD54) Kikuletwa
Kikuletwa at TPC (1DD1)
Ruvu River at Tanga Bridge (1DC2A) Ruvu
Ruvu River at Railway Bridge (1DC1)
Nyumba ya Mungu Dam Wall
Pangani River at Buiko (1D10)
Pangani at Korogwe (1D14)
Pangani River at Hale (1D17)
Pangani
Pangani River at Estuary (1D17)
Saseni River at Gulutu (1DB2A)
Mkomazi River Upstream of Kalimawe
Soni River at Soni (1DB19) Mkomazi
Mkomazi River at Gomba (1DB17)
Luengera River at Magoma (1DA3) Luengera
Luengera River at Korogwe (1DA1)
Many of the basin’s rivers are presently seasonal as a result of water use. For instance:
• In the Kikuletwa sub-catchment, present stream flow is mainly contributed by springs and upstream of these the flows, which at one time were perennial, have been reduced to zero in most streams for most of the season.
• The Luengera and Mkomazi Rivers are historically perennial but increasing water uses and climate change have resulted in both becoming seasonal.
Some of the basin’s rivers are, however, naturally seasonal. These include:
• the seasonal Muraini River, upstream of Lake Jipe;
• the river draining the semi arid, low-lying area in the south-western half of the

Delineation Final Report
18
basin. This river has no name on any of the GIS files but flows from the west and joins with the Swakira and Kiseru Rivers.
Figure 3.1 Delineation of sub-catchments within the Pangani Basin (from PBWO/IUCN 2006).

Delineation Final Report
19
3.3 Geomorphological and hydraulic zone analysis
3.3.1 Introduction
The main objective of the geomorphological delineation was to divide the main rivers with in the Pangani River Basin into zones. Zones can be defined as stretches of river within which channel form is essentially homogeneous. Nested within zones can be a variety of channel types.
3.3.2 Approach used
Literature supplied by the project was searched for relevant data. The reports and other sources that provided the bulk of the information used in the geomorphological delineation are listed in Table 3.2.
Table 3.2 The reports and maps that provided the bulk of the information used in the geomorphological delineation.
Reference Description of the information extracted
Hunting Technical Services (1994).
The maps were used to delineate the river system in terms of geomorphology. Coordinates (UTM) of the start and end points of most zones were read from the maps. Zones were set considering the type of the vegetation cover, the slope and the terrain of the land.
FAO (1959). Information was use to characterise the geology/soil type of the stretch downstream of Nyumba ya Mungu Dam.
TANESCO (1994). General background information on the Pangani River Basin.
Dr George V Lugomela - Hydrologist for PBWO Hans Beuster - Hydrology Consultant for the FA Project.
Personal Communication: Information on the type of flow in the stream during low flows.
Ministry of Water, Energy and Minerals (1977).
Information on the geology of Kilimanjaro Region.
Sadiki and Kanyawanah (1999). Information on the geology of the Pangani River Basin.
Beuster et al. (2006). Information on the hydrology of the Pangani River Basin and the hydrological sub catchments.
Within the limits of the information and data available for the Pangani River Basin, the following were considered for the geomorphological zone analysis for the main rivers within the basin (Table 3.3):
• geology and dominant substratum;
• channel planform, valley form and the presence of floodplains; (by means of a visual assessment of river courses as shown on the 1:250 000 maps);
• slope (using slope estimates obtained from the GIS Rivers coverage and DTM), and hydraulic habitats sequences (riffle, run, pool, etc.; based on anecdotal evidence gleaned from members of the National Pangani FA Team).

Delineation Final Report
20
Table 3.3 Main rivers within the Pangani River Basin considered in the geomorphological zone analysis.
Rivers Nduruma Tengeru Sanya
Kikuletwa
Himo Muraini
Ruvu
Mkomazi Luengera
Pangani
3.3.3 Geology and dominant substratum
The Pangani River drains the volcanic mountains of Mt Meru and Mt Kilimanjaro. As a result, neogene volcanic deposits carried downstream from the source dominate the river valley. Most of its course is determined by the Pangani Rift. A summary of the geology in each of the designated river zones is provided in Table 3.4, and each aspect therein is discussed in more detail below.
3.3.4 Channel planform, valley form and the presence of floodplains
For the most part, rivers in the basin appear to be single thread, with the most notable exception being a section downstream of the Kirua Swamps, where the river displays a tendency towards anastomosing into two or more channels (Table 3.4). Prominent swamps and lakes on the river courses include:
• Shambalai Swamp, in the north-west corner of the catchment;
• Lake Jipe, on the Ruvu River on the border with Kenya;
• Msitu wa Tembo Swamp, upstream of Nyumba ya Mungu;
• Kirua Swamp, downstream of Nyumba ya Mungu Dam;
• floodplains at the confluence of the Pangani River and the Mkomazi and Luengera Rivers.
3.3.5 Slope
In order to delineate the geomorphological zones, the definitions for South African river channels were used3 (Table 3.5). These are designated on the basis (primarily) of slope (gradient). The longitudinal profiles of the nine rivers considered are presented in Figure 3.2 to Figure 3.10, with the end of each geomorphological zone indicated by a white arrow. The white arrows in Figure 3.2 to Figure 3.10 indicate the approximate position of the change from one zone to the next, and show clearly the differences in average river slope between the different demarcated zones. In many cases, the geomorphological zone delineation resulted in a further division of the rivers from that determined using geology and channel planform alone.
3 These definitions should be universally applicable as they are based on fundamental hydraulic and geomorphic
principles, thus the South African definitions should be equally applicable for the Pangani River.
Delineation Final Report
21
Table 3.4 Geomorphological delineation. Gradient calculated as the difference in altitude of two adjacent contours crossing the river (m) divided by the river length between these contours (m).
Coordinates demarcating the end of a zone Zone No. River
Place X Y Channel planform Gradient Geology Zone
K1a U/s Nduruma
Chini 249722 9626844
Single channel; straight; steep; confined.
0.1000 Mountain Torrent
K1 Nduruma Chini 256132 9613771 Single channel; straight; assume
relatively steep; confined. 0.0231
Neogene: Alluvium; bedrock outcrops; boulders and cobbles.
Mountain Stream
K2 Namenti 302766 9613771 Single channel; slight meandering;
Wide valleys/flat. 0.0033
Neogene: Alluvium; bedrock outcrops, boulders and sand.
Narrow alluvial plains. Areas of lacustrine and alluvial deposits
west of Shira, near the confluence with Sanya River.
Upper Foothill
K3
Kikuletwa
SW of TPC 310162 9614902 Confined channel; single thread;
gorge. 0.0114
Neogene: Alluvium; bedrock outcrops, boulders and sand.
Rejuvenation
K4 Kikuletwa/
Ruvu Near Luguminyi 311439 9609749 Permanent swamp. 0.0007
Deep alluvial deposits - 200 m thick in places.
Swamp
K5a Near Tengeru
Railway 259664 9624501
Single channel; straight; steep; confined.
0.0872 Mountain Torrent
K5b Near Kavangai
Ndogo 263593 9616225
Single channel; straight; assume relatively steep; confined.
0.0359 Mountain Stream
K5c
Tengeru
Near Wahoga Chini
274627 9606779 Single channel; slight meandering;
Wide valleys/flat. 0.0069 Upper Foothill
K6a In Kilimanjaro
Forest Reserve 288096 9657643
Single channel; straight; steep; confined.
0.0932 Mountain Torrent
K6b Near Liwati 288770 9641929 Single channel; straight; assume
relatively steep; confined. 0.0425 Mountain Stream
K6c
Sanya
Near Kikuletwa Power Station
297062 9618019 Single channel; slight meandering;
Wide valleys/flat. 0.0091
Neogene: Alluvium
Upper Foothill
R1 Near Marangu 335724 9636397 0.0943 Mountain Torrent
R2 Near Himo 338255 9625664 0.0355 Mountain Stream
R3a Near Himo 339563 9616939 0.0136 Upper Foothill
R3b
Himo
Confluence with Ruvu
335375 9608737
Single thread; some meanderings (slight); confined.
0.0036
Neogene: Alluvium; bedrock outcrops, no cobbles. Clay, silts,
loam and sand.
Lower Foothill
R4a Muraini Near Taroha 362656 9588336 Single thread; some confined. 0.0079 Neogene: Alluvium. Red loamy Upper Foothill
Delineation Final Report
22
Coordinates demarcating the end of a zone Zone No. River
Place X Y Channel planform Gradient Geology Zone
R4b At Lake Jipe 363441 9598272 Single thread; some confined. 0.0002 clays, with black clays. Lower Foothill
R5 Lake Jipe <0.0001 Red loamy clays, with black clays. Swamp
R6 Near Kifaru Hill 338522 9609568 Swamp 0.0003 Neogene alluvium; sand clay
bottom. Swamp
R7
Ruvu Confluence with
Pangani 327450 9599727 Single channel; confined. 0.0020 Unknown
Rejuvenated Foothill Zone
P1 Nyumba ya Mungu Dam n/a n/a Reservoir
P2 Near Muheza 354162 9497173
Kirua Swamp. Single thread; meandering; low lying; wide valley; large floodplain; some permanent
swamp.
0.0005 Extensive deposits of sand and
clay conglomerate with secondary limestones.
Swamp
P3 Mswaha 9431274 425509 Anabraching; multiple; channel;
meadering; low lying; no floodplain. Neogene: Alluvium Lower Foothill Zone
P4 Near Maurui
(after Mkomazi Confluence)
453578 9413700 Single thread; meandering.
0.0035
Neogene: Alluvium Lower Foothill Zone
P5 Mkalamu
Confluence 466055 9400872
Confined, bedrock channel; rejuvenation zone.
0.0118 Bedrock outcrops. Rejuvenated Bedrock
Cascades
P6
Pangani main stem
Head of estuary Single thread. 0.0007 Extensive deposits of sand and
clay conglomerate. Mature Lower River
M1 Kalimawe Dam n/a n/a Reservoir
M2 Mkomazi Confluence with
Pangani 429152 9433598
Single thread; relatively straight; low lying; confined valley. Floodplain at
confluence with Pangani River. 0.0022
Alluvium. Red sandy clays, with black clays.
Lower Foothill Zone
L1 Luengera Confluence with
Pangani 445938 9428654
Single thread; relatively straight; low lying; confined valley. Floodplain at
confluence with Pangani River. 0.0019
Alluvium. Red sandy clays, with black clays.
Lower Foothill Zone
E1, E2, E3
Estuary (see Section 4)
Delineation Final Report
23
Table 3.5 Geomorphological zonation of South African river channels (Rowntree and Wadeson 1999).
Characteristic Channel Features Longitudinal Zone Gradient Description
Source zone not specified
Low gradient, upland plateau or upland basin able to store water. Spongy or peat hydromorphic soils.
Mountain headwater stream (Mountain torrent)
>0.1 A very steep gradient stream dominated by vertical flows over bedrock with waterfalls and plunge pools. Normally first or second order. Zone types include bedrock fall and cascades.
Mountain stream 0.04 - 0.09
Steep gradient stream dominated by bedrock and boulders, locally cobble or coarse gravels in pools. Zone types include cascades, bedrock fall, and step-pool. Approximate equal distribution of 'vertical' and 'horizontal' flow components.
Mountain stream (transitional)
0.02 - 0.039
Moderately steep stream dominated by bedrock or boulder. Zone types include plane-bed, pool-rapid or pool-riffle. Confined or semi-confined valley floor with limited floodplain development.
Upper Foothills 0.005 – 0.019
Moderately steep, cobble-bed or mixed bedrock-cobble bed channel, with plane-bed, pool-riffle, or pool-rapid reach types. Length of pools and riffles/rapids similar. Narrow floodplain of sand, gravel or cobble often present.
Lower Foothills 0.001 - 0.005
Lower gradient mixed bed alluvial channel with sand and gravel dominating the bed, locally may be bedrock controlled. Reach types typically include pool-riffle or pool-rapid, sand bars common in pools. Pools of significantly greater extent than rapids or riffles. Floodplains often present.
Lowland river 0.0001 – 0.001
Low gradient alluvial fine bed channel, typically regime reach type. May be confined, but fully developed meandering pattern within a distinct floodplain develops in unconfined reaches where there is an increased silt content in bed or banks.
Rejuvenated bedrock fall / cascades
>0.02 Moderate to steep gradient, confined channel (gorge) resulting from uplift in the middle to lower reaches of the long profile, limited lateral development of alluvial features, reach types include bedrock fall, cascades and pool-rapid.
Rejuvenated foothills
0.001 – 0.02
Steepened section within middle reaches of the river caused by uplift, often within or downstream of gorge; characteristics similar to foothills (gravel/cobble bed rivers with pool-riffle/ pool-rapid morphology) but of a higher order. A compound channel is often present with an active channel contained within a macro-channel activated only during infrequent flood events. A limited flood- plain may be present between the active and macro-channel.
Upland flood plain <0.005 An upland low gradient channel, often associated with uplifted plateau areas, as occur beneath the eastern escarpment.
Kikuletwa
0
200
400
600
800
1000
1200
1400
1600
1800
0.00 10.00 20.00 30.00 40.00 50.00 60.00 70.00 80.00 90.00
Cumulative distance from source (km)
Ele
va
tio
n (
ma
sl)
Mountain stream
Upper foothill
Mountain torrent
Swamp
Rejuvenation
Figure 3.2 Longitudinal profile of the Kikuletwa River.

Delineation Final Report
24
Tengeru River
700
800
900
1000
1100
1200
1300
0.00 2.00 4.00 6.00 8.00 10.00 12.00 14.00 16.00 18.00
Cumulative distance from source (km)
Ele
vati
on
(m
asl)
Mountain stream
Upper foothill
Mountain torrent
Figure 3.3 Longitudinal profile of the Tengeru River.
Sanya River
0
500
1000
1500
2000
2500
0 10 20 30 40 50 60
Cumulative distance from source (km)
Ele
vati
on
(m
asl) Mountain stream
Upper foothill
Mountain torrent
Figure 3.4 Longitudinal profile of the Sanya River.
Himo
500
700
900
1100
1300
1500
1700
1900
2100
0.00
2.61
5.78
9.01
12.3
6
16.01
18.69
21.5
4
23.67
26.97
29.7
2
31.56
33.33
35.2
7
37.28
Cumulative distance from source (km)
Ele
va
tio
n (
ma
sl)
Mountain torrent
Mountain stream
Upper foothill
Lower foothill

Delineation Final Report
25
Figure 3.5 Longitudinal profile of the Kahe/Himo River.
Muraini
0
100
200
300
400
500
600
700
800
900
1000
0.00 5.00 10.00 15.00 20.00 25.00 30.00 35.00
Cumulative distance from source (km)
Ele
vati
on
(m
asl)
Lower Foothill
Upper Foothill
Figure 3.6 Longitudinal profile of the Muraini River.
Ruvu River
660
670
680
690
700
710
720
0.00 5.00 10.00 15.00 20.00 25.00 30.00 35.00 40.00 45.00
Cumulative distance from Lake Jipe (km)
Ele
vati
on (
ma
sl)
Rejuvenated foothill
Swamp
Figure 3.7 Longitudinal profile of the Ruvu River, downstream of Lake Jipe.
Pangani Main Stem
0
100
200
300
400
500
600
700
800
0.00 50.00 100.00 150.00 200.00 250.00 300.00 350.00
Cumulative distance from NyM Dam (km)
Ele
vati
on
(m
asl)
Kirua swamp
Lower foothill
Rejuvenated bedrock
cascades
Estuary

Delineation Final Report
26
Figure 3.8 Longitudinal profile of the Pangani River (mainstem).
Mkomazi River
0
100
200
300
400
500
600
0.00 10.00 20.00 30.00 40.00 50.00 60.00 70.00 80.00 90.00 100.00
Cumulative distance from Kalemawe Dam (km)
Ele
vati
on
(m
asl)
Lower foothill
Figure 3.9 Longitudinal profile of the Mkomazi River, downstream of Kalimawe Dam4.
Luengera
250
270
290
310
330
350
370
390
0.00
3.24
6.09
10.21
13.46
16.68
20.20
24.15
30.23
34.00
36.93
39.35
42.13
Cumulative distance from source (km)
Ele
vati
on
(m
asl)
Lower foothill
Figure 3.10 Longitudinal profile of the Luengera River
3.4 Chemical and thermal zonation
3.4.1 Introduction
Most rivers originating in mountains have low temperatures, low conductivity and low dissolved salts. In that case, the water may be termed as being in its natural form, although its dissolved constituents will differ depending on the geological formation that the river drains. With distance downstream, naturally-derived compounds and pollutants gradually dissolve in the water, changing its chemical nature.
4 Note: The anomalies apparent in this figure are a result of digitising, which did not exactly follow the river line.
These anomalies will be corrected by redigitising the rivers’ coverage.

Delineation Final Report
27
In the Pangani River Basin, streams in the upper catchment have clear, cool water that flow turbulently down steep slopes. Human activities taking place along the river course contribute to changes in the quality of the water. Agriculture, industries and human settlements all contribute to the changing quality of the water along the basin. The ambient temperatures in the basin also increase with decreasing altitude, as do water temperatures. As water temperature increases, there is a tendency for the rate of chemical reactions to increase, resulting in a higher expected concentration of dissolved ions. This is one of the reasons for high conductivities in the lower part of the basin. The objective of the exercise reported in this section was to attempt to delineate river zones based on chemical information.
3.4.2 Approach used
Literature supplied by the project was searched for relevant data. Only two reports supplied useful information; these were IVO-NORPLAN joint Venture, on an Environmental Impact Assessment of the redevelopment of the Hydro-electric Power Station at Pangani Falls; and a Ministry of Water- NORPLAN report, on Review of Water Quality Resources Management Policy, Legislation and Institutional Framework-Final Report, 2000. Data were also provided by the PBWO from their regular monitoring programme. These three main sources were used to derive the chemical zonation. From the chemical parameters reported on in the available data sets, only five contained sufficient data for a reasonable analysis. These were used to distinguish the zones from upstream to downstream reaches, and areas of specific concern. These parameters are temperature, conductivity, fluoride, iron and manganese. Areas of low and high conductivity, water temperature, fluoride iron and manganese were delineated on a map of the Basin. Based on this, a number of zones of different chemical nature were recognised (Table 3.6).
3.4.3 Findings
Chemically, the basin may be delineated into six major zones, of which some contain sub-zones, making a total of nine major divisions. Zone 1 encompasses all the mountain streams, these being zones of known or assumed low temperature and low conductivity. The zone is divided into three sub-zones, representing the high-fluoride areas draining Mt Meru and the western flanks of Mt Kilimanjaro (Sanya River); the low-fluoride areas draining Mt Kilimanjaro; and the areas of assumed low fluoride draining the Eastern Arc Mountains. Zone 2 consists of the next reaches downstream of the same rivers. These are slower-moving stretches, with almost clear water. Three sub-zones were recognised: the rivers draining from the west into the Nyumba ya Mungu Dam; those draining from the east into the reservoir, plus the middle and lower reaches of the Mkomazi and Luengera Rivers; and Lake Jipe, which is a major area of standing water situated part way along the eastern river network draining into Nyumba ya Mungu Dam.

Delineation Final Report
28
Zone 3 represents the major impoundments on the system. Zone 3a is Nyumba ya Mungu Dam on the Pangani River, and Zone 3b is the Kalimawe reservoir on the Mkomazi River.

Delineation Final Report
29
Table 3.6 Tentative chemical zonation of the Pangani River system5.
Characteristics Zone Location Temperature
conductivity*6
Fluoride (mg l
-1)
Physical
1. Mountain streams Source areas on Mt Meru, Mt Kilimanjaro, North and South Pare and Usambara Mountains.
Fast, turbulent flow; cold and mostly clear
1a. Themi, Nduruma and Kikuletwa Rivers
All streams originating on Mt Meru, to their confluences at the Kikuletwa R at Karangai; Sanya R from Mt Kilimanjaro.
Low temperature Low conductivity
>1.5 -“-
1b. Njoro, Rau, Weruweru, Himo Streams originating on Mt Kilimanjaro Low temperature Low conductivity
<1.0 -“-
1c. Lumi, Muraini, Mkomazi and Luengera Rivers
Upper part of streams originating from North and South Pare Mountains and Western Usambara Mountains.
Low temperature? Low conductivity?
<1.0? -“-?
2. Foothill Rivers Rivers downstream of the Mountain Stream Zone, and the Kikuletwa sub basin.
Slower-moving rivers, almost clear
2a. Sanya, Rundugai and Chemka Springs, Kikuletwa R
Rundugai and Chemka Springs; Sanya R at Sanya Plains; Kikuletwa R downstream of Karangai to inlet of Nyumba ya Mungu Dam.
High temperature High conductivity
>1.5 -“-
2b. Ruvu R, Kikafu R. Karanga R From Lake Jipe to Nyumba ya Mungu inlet; before confluence with the Kikuletwa; middle and lower Mkomazi and Luengera Rivers.
Low temperature Low conductivity
Unknown Turbid, coloured, slow-moving, sometimes with low oxygen levels
2c. Lake Jipe Different points in the lake. High conductivity High temperature
Unknown Yellowish coloured water
3. Impoundments Man-made dams
3a. Nyumba ya Mungu Dam Different points in the dam. High temperature High conductivity
Unknown Slightly greenish
3b. Kalimawe Dam No data. ? Unknown Unknown 4. Transitional River Pangani River downstream Nyumba ya Mungu to Mkomazi River confluence.
High temperature High conductivity
Unknown Slow-moving, turbid
5. Lower River Pangani River from the confluence with the Mkomazi River to Pangani Falls.
Slightly high iron and manganese concentrations
>1.0 Turbid, brownish waters
6. Mature River Pangani River from Pangani Falls to the upstream end of estuary
Unknown Unknown Unknown
5 ? = assumed.
6 Low temperature = < 25
oC. High temperature = > 25
oC; Low conductivity = < 600 µS cm
-1. High
conductivity = > 600 µS cm
-1.
Delineation Final Report
30
Zone 4 is the Pangani mainstem, from Nyumba ya Mungu Dam wall to its confluence with the Mkomazi River. This is a slow-moving river with turbid waters and high temperatures and conductivity. Zone 5 is the Pangani mainstem from the confluence with the Mkomazi River downstream to Pangani Falls. Temperatures and conductivity remain high, and in addition there may be increased levels of manganese and iron. The final zone is Zone 6, from Pangani Falls to the upstream boundary of the estuary, for which no data are available.
3.5 Biological zonation
3.5.1 Introduction
Rivers are longitudinal ecosystems, with changing conditions from source to sea. Headwaters, if originating on mountains, tend to have cooler, purer water, steeper channels, larger bed particles and more turbulent flow. The downstream ends of the systems are usually flatter, with warmer, less pure water, and finer bed particles because of the slower flow. These aspects of rivers have been covered in the three preceding physical and chemical zonation analyses. Distribution of the living components of the ecosystem reflects these changes: the communities of plants and animals, both in the channel and on the banks, differ along the length of the system. Usually, there is no sudden transition from one community to another. Rather, species replace species along the river resulting in several overall changes from one recognizable community to another. Thus, for instance, a community of montane forest trees may occur along the steep source area of a river, to be gradually replaced by a more shrubby tree community further downstream and then reeds, sedges and grasses along its lowest, slowest-flowing reaches. These recognizably different sections of a river may be seen as biological river zones. Such zones will also be apparent in the distribution of riverine fish, macro-invertebrates, plankton, amphibians, aquatic reptiles and semi-aquatic mammals. The objective of the exercise reported in this section was to attempt to delineate river zones based on biological information – in other words to allow the river species to indicate by their distribution patterns which parts of the river are perceived by them as being different.
3.5.2 Approach used
The literature sourced by the project was searched for relevant data on plant and animal distributions (Table 3.7). No data were found of surveys along the whole river system for any biological component; indeed, most of the literature referred to the fauna or flora of the natural or man-made lakes along the system and thus gave no real idea of biological zonation of the river itself. In the absence of such data, general knowledge of the biology of the system and of the physical and chemical conditions along its length were used by Tanzanian biologists to tentatively identify biological zones. This was done using a general understanding of the effects of altitude, slope, position of springs and landscape features on biotas to delineate the zones (Table 3.8). River

Delineation Final Report
31
lengths at similar altitudes and slopes were allocated to one main zone, but divided into sub-zones per region. Zone 1, for instance, encompassed all the mountain streams, but was divided into sub-zones 1a-d for streams originating in the Mt Meru/Kilimanjaro area, the North Pare Mountains, the South Pare Mountains and the Usambara Mountains, respectively. Natural lakes and man-made lakes (reservoirs) were allocated places in the zonation as they constitute quite large areas within the system, are important for fisheries, and often are the only areas for which biological information exists. Information on faunal and floral species reported from any of these zones was then entered into the table (Table 3.8).
Table 3.7 Literature searched for data on biological zonation of the Pangani River Basin.
Author(s) Date Title Comment Denny, P. and Bailey, R.G.
1974 A biological survey of Nyumba ya Mungu Dam, Tanzania
Species of phytoplankton, periphyton, macrophytes, zooplankton, fish and macro-invertebrates, for the reservoir only
Eccles, D. H. 1992 Field guide to the freshwater fishes of Tanzania
Species list for Pangani system, but no data on where they occur in the system
IVO-NORPLAN Joint Venture
1993 Distribution of water hyacinth Eichhornia crassipes along Pangani River from Pangani Falls upstream to Nyumba ya Mungu Dam
Present from Mkomazi confluence to Pangani Falls, plus in tributaries
IVO-NORPLAN Joint Venture
1994 Environmental impact Assessment of the Redevelopment of Hydro-electric Power Station at Pangani Falls
Species composition (aquatic ecology) Some species listed for specific sites
Inter-consult Ltd 1996 River Basin Management and Smallholder irrigation improvement project: Inland fisheries
Species composition of three lake areas (Jipe, Nyumba ya Mungu Dam, Pangani Falls Dam). No information on river fish communities
Inter-consult Ltd 1996 River Basin Management and Smallholder irrigation improvement project: Sensitive ecosystems (wetlands)
Some species listed for specific areas; no overview of different ecoregions or river zones
IVO-NORPLAN Joint Venture
1997 Pangani River Training project Information on plant and animal species in a 50 km stretch from Jitengeni to Kivukoni
Mbago, F 1997 Botanical survey for the Pangani River Training Project
As above
3.5.3 Findings
The data in Table 3.8 illustrate the paucity of biological data on the river system. Almost all of the available data are for the natural and man-made lakes. Even for these systems, data are few7. The following zonation scheme thus is based on general judgements of physical conditions in the river. Because of the coarse resolution of the physical data referred to, fine differences in physical condition could not be detected and used in this zonation. Five main biological zones and 13 sub-zones were recognised. Zone 1 encompassed all the mountain streams, down to an altitude of about 1000 m. Sub-
7 The river and estuary survey work that forms part of the State of the Basin assessments in Task 3 will collect
biophysical data to complement the existing knowledge.

Delineation Final Report
32
zones within Zone 1 recognised that there may be biological differences between the mountain streams of the Meru, Kilimanjaro, Pare and Usambara Mountains.

Delineation Final Report
33
Table 3.8 Tentative biological zonation of the Pangani River system.
Biological characteristics Zone
Sub-zone
Location Vegetation * = rare species
Fish * = endemic
Invertebrates /Herpetofauna Water birds
1a Mt Meru and Mt Kilimanjaro: Tributaries of Kikuletwa and Ruvu Rivers
1b North Pare Mountains – Muraini R
1c South Pare Mts - Mkomazi R to Kalimawe Dam
1. M
ou
nta
in s
tream
(>
1000 m
asl)
1d Usambara Mts – Luengera R first few kilometres
2a
River stretches of Kikuletwa and Ruvu Rivers: Zone starts at natural springs (c. 750 -840 masl); Rau Forest Reserve (730-765 masl) maintains springs that feed Njoro River
Diverse groundwater and spring-fed forest: e.g.
• Oxystigma msoo*
• Lovoa swynnertonii*
• Ficus sycomorus
2b Lake Jipe: Lake Jipe is fed by Muraini River, and drains as Ruvu R
Bulrush/mace Typha domingensis; Soda-tolerant sedge Cypersu laevigatus; Papyrus grass
e.g. Tilapia Oreochromis jipe* O. pangani*, O.girigan* Sardine Ratrineobola argentea
Crocodile Crocodylus niloticus
Lesser jacana Purple gallinule Black heron African darter Madagascar heron
2c Nyumba ya Mungu Dam
Typha domingensis Cyperus allopecuroides Paspalidium germinatum Water hyacinth: Eichhornia crassipes
River community, e.g. Chiloglaris deckenii, Labeo forskalii. Lake community, e.g. Sarothederon jipe, Haplochromis sp.
Typical lake community: e.g. Caddisfly Ecnomus thomasseti, Prawn Caridina sp Midges Chironomus formosipennis, Bug Ranatra chariensis, Snail Bulinus africanus
2.
Fo
oth
ill
(c.
600-1
000 m
asl)
2d Kalimawe Dam on Mkomazi River

Delineation Final Report
34
Biological characteristics Zone
Sub-zone
Location Vegetation * = rare species
Fish * = endemic
Invertebrates /Herpetofauna Water birds
3a Pangani mainstem downstream of Nyumba ya Mungu dam to Mkomazi confluence
3b Mkomazi River from Kalimawe dam to Pangani confluence
? Water hyacinth: Eichhornia crassipes
3.
Tra
nsit
ion
al(
c.3
00
- 600 m
asl)
3c Luengera R, majority of river to Pangani confluence
4.
Lo
wer
riv
er
(c. 50 -
300
masl)
4a Confluence of Pangani and Mkomazi Rivers, down the mainstream to Pangani Falls
Panicum maximum, Typha capensis, Echnochloa sp., Hyparrhema capensis
Eels Catfish Cyprinids
Crocodiles Weavers Pied kingfishers
5. C
oa
sta
l p
lain
(<
150 m
asl)
5a Mature river from Pangani Falls to top of estuary
Riparian forest: Albizzia versicolor, Rauvolfia mobasiana, Parkia filicoidea, Ficus vallis
Crocodile
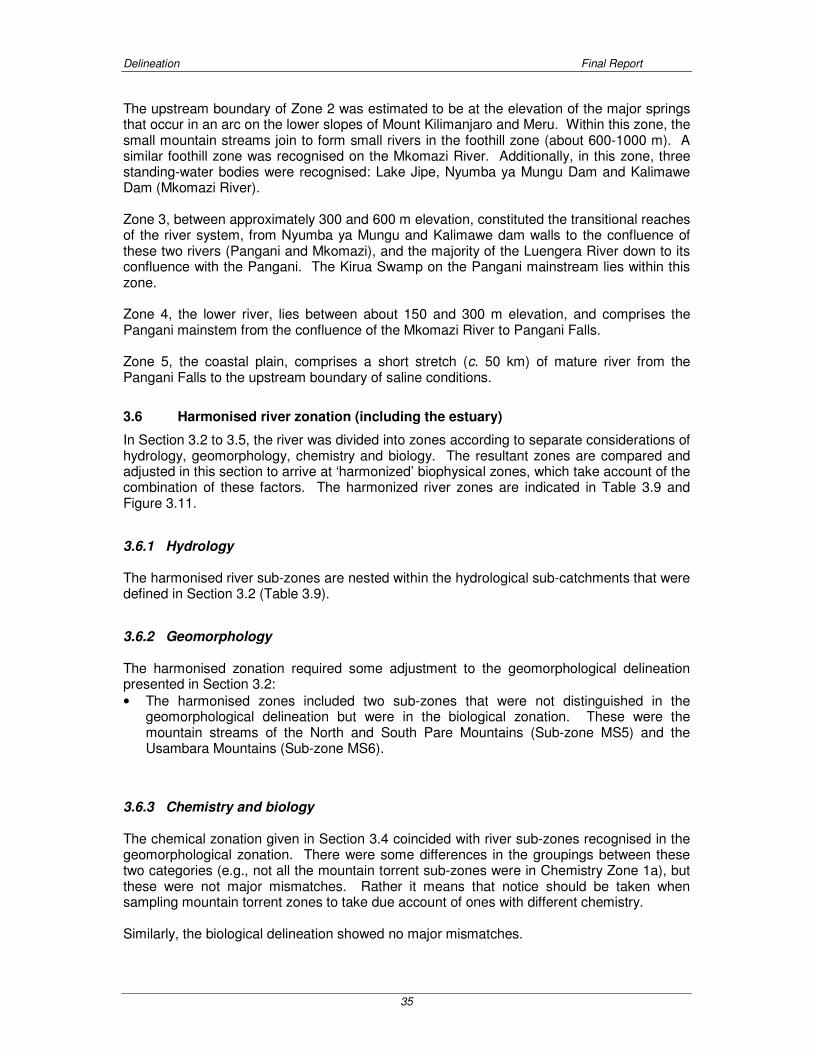
Delineation Final Report
35
The upstream boundary of Zone 2 was estimated to be at the elevation of the major springs that occur in an arc on the lower slopes of Mount Kilimanjaro and Meru. Within this zone, the small mountain streams join to form small rivers in the foothill zone (about 600-1000 m). A similar foothill zone was recognised on the Mkomazi River. Additionally, in this zone, three standing-water bodies were recognised: Lake Jipe, Nyumba ya Mungu Dam and Kalimawe Dam (Mkomazi River). Zone 3, between approximately 300 and 600 m elevation, constituted the transitional reaches of the river system, from Nyumba ya Mungu and Kalimawe dam walls to the confluence of these two rivers (Pangani and Mkomazi), and the majority of the Luengera River down to its confluence with the Pangani. The Kirua Swamp on the Pangani mainstream lies within this zone. Zone 4, the lower river, lies between about 150 and 300 m elevation, and comprises the Pangani mainstem from the confluence of the Mkomazi River to Pangani Falls. Zone 5, the coastal plain, comprises a short stretch (c. 50 km) of mature river from the Pangani Falls to the upstream boundary of saline conditions.
3.6 Harmonised river zonation (including the estuary)
In Section 3.2 to 3.5, the river was divided into zones according to separate considerations of hydrology, geomorphology, chemistry and biology. The resultant zones are compared and adjusted in this section to arrive at ‘harmonized’ biophysical zones, which take account of the combination of these factors. The harmonized river zones are indicated in Table 3.9 and Figure 3.11.
3.6.1 Hydrology
The harmonised river sub-zones are nested within the hydrological sub-catchments that were defined in Section 3.2 (Table 3.9).
3.6.2 Geomorphology
The harmonised zonation required some adjustment to the geomorphological delineation presented in Section 3.2:
• The harmonised zones included two sub-zones that were not distinguished in the geomorphological delineation but were in the biological zonation. These were the mountain streams of the North and South Pare Mountains (Sub-zone MS5) and the Usambara Mountains (Sub-zone MS6).
3.6.3 Chemistry and biology
The chemical zonation given in Section 3.4 coincided with river sub-zones recognised in the geomorphological zonation. There were some differences in the groupings between these two categories (e.g., not all the mountain torrent sub-zones were in Chemistry Zone 1a), but these were not major mismatches. Rather it means that notice should be taken when sampling mountain torrent zones to take due account of ones with different chemistry. Similarly, the biological delineation showed no major mismatches.
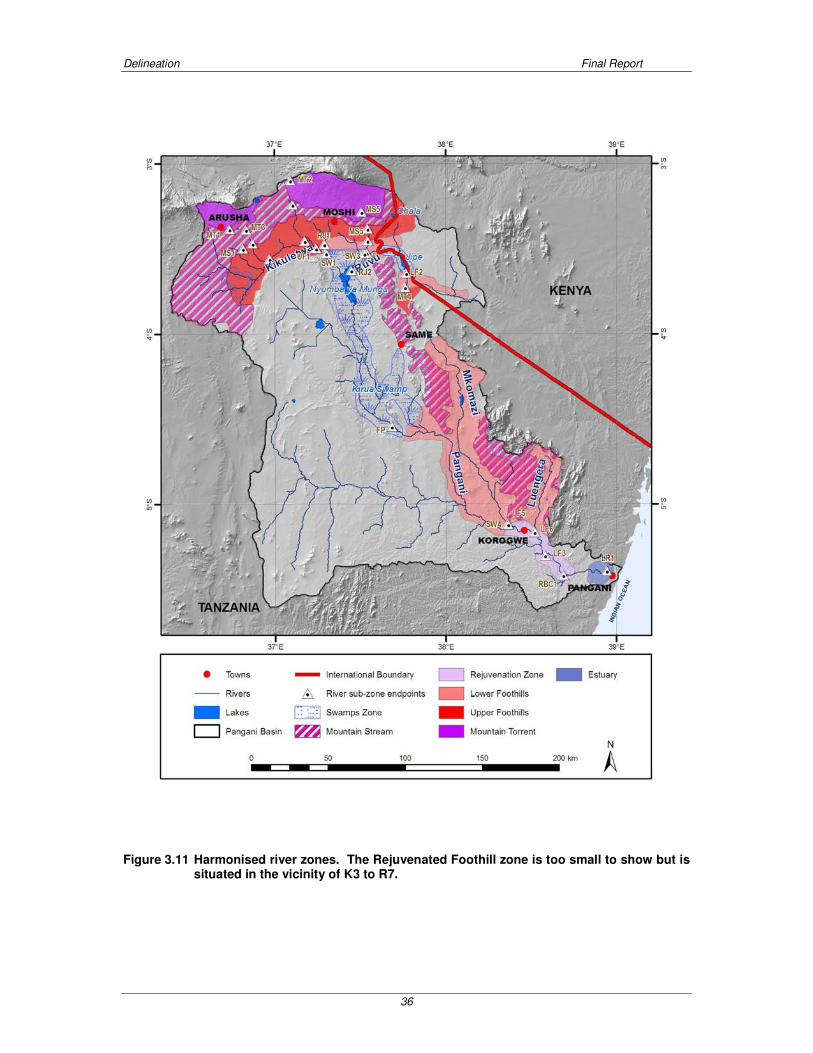
Delineation Final Report
36
Figure 3.11 Harmonised river zones. The Rejuvenated Foothill zone is too small to show but is situated in the vicinity of K3 to R7.

Delineation Final Report
37
Table 3.9 Harmonized river zones.
Code Harmonized River
Zone
River Sub
Zones River
Hydrology sub-catchment
Geomorphology zone Chemistry zone Biology zone
MT1 Nduruma River Kikuletwa K1a 1a 1a
MT2 Sanya River Kikuletwa K6a 1a 1a
MT3 Tengeru River Kikuletwa K5a 1a 1b MT
Mountain Torrent (>1200 m)
MT4 Himo River Kahe/Himo R1a 1b 1b
MS1 Nduruma River Nduruma K1 1a 1a
MS2 Sanya River Kikuletwa K6b 1a 1a
MS3 Tengeru River Kikuletwa K6b 1a 1a
MS5 Himo River Ruvu R1 and R2 1b 1b
MS5 North and South Pare Mountains Mkomazi Not provided 1c 1c
MS Mountain Stream (1000-1200 m)
MS6 Usambara Mountains Luengera Not provided 1c 1d
UF1 Kikuletwa River Kikuletwa K2 2a 2a
UF2 Sanya River Kikuletwa K6c 2a 2a
UF3 Tengeru River Kikuletwa K6c 2a 2a
UF4 Himo River Ruvu R3a 2a 2a
UF Upper foothills
UF5 Muraini River Ruvu R4a 2b 2a
RJ1 Kikuletwa River Kikuletwa K3 2a 2a RJ Rejuvenated foothill
RJ2 Ruvu River Ruvu R7 2b 2a
SW1 U/s of Nyumba ya Mungu Dam Kikuletwa and Ruvu K4 2b 2a
SW2 Lake Jipe Ruvu R5 2c 2b
SW3 Ruvu River Ruvu R6 2c 2b
SW4 Nyumba ya Mungu Dam Kikuletwa and Ruvu P1 3 2c
SW Swamps
SW5 Shambalai Swamp Kikuletwa n/a n/a n/a
FP Floodplain FP Kirua Swamp Pangani Main Stem P2 4 3a
LF1 Himo River Kahe/Himo R3b 2b 2a
LF2 Muraini River Ruvu R4b 2b 2a
LF3 D/s of Kirua Swamp to Mswahe Pangani Main Stem P3 4 3a
LF4 Mswahe to d/s of Mkomazi River Pangani Main Stem P4 4 3a
LF5 Mkomazi River Mkomazi M1 1c 1c
LF Lower foothills
LF6 Luengera River Luengera L1 1c, 2b 3c
RBC Rejuvenated Bedrock Cascade
RBC1 From LF4 to d/s Pangani Falls Pangani Main Stem P5 5 4
MLR Mature lower river LR1 Pangani Fall to estuary Pangani Main Stem P6 6 5
E1 Upper estuary Pangani Main Stem E1 n/a n/a
E2 Middle estuary Pangani Main Stem E2 n/a n/a E Estuary
E3 Lower estuary Pangani Main Stem E3 n/a n/a

Delineation Final Report
38
4 ESTUARINE ZONATION
4.1 Delineation of upstream, downstream and lateral boundaries
The geographical boundaries of the Pangani estuary for the purposes of the Flow Assessment are defined as follows (Figure 4.1):
• Downstream boundary: This is taken nominally as the estuary mouth represented by a straight line drawn perpendicular to the estuary channel joining Ras Muheza on the south bank with a corresponding point on the north bank near the town of Pangani. The coordinates of the mid-point of the channel at this point are: 9399259N, 37498505 E.
• Upstream boundary: This is normally defined as the maximum extent of tidal influence, i.e. the highest point to which tidal variation in water levels can still be detected or the maximum extent of saline intrusion, whichever is furthest upstream (DWAF 2004). No data were available on the extent of tidal variation in the estuary at the time of writing and only limited data were available on water quality (salinity) in the estuary (salinity at a point 7 km up from the mouth ranges from 14-25 parts per thousand (ppt) between low flow and high flow conditions, at 15 km upstream ranges from 1.2-3.7 ppt, while at 22 km a single measurement of 0.4 ppt was recorded under moderate flow) (Table 4.1). Available data on vegetation in the estuary are also confusing. Topographic maps indicate that mangrove forests extend no more than 10 km upstream from the mouth (Figure 4.1) while a vegetation and land-use map (Figure 4.2), compiled from Landsat satellite imagery indicates that mangrove forests extend at least 30 km upstream. Based on this information the upstream end of the estuary has provisionally been defined as 31 km upstream from the mouth. Coordinates of the mid-point of the channel at this point are: 9403855N, 37486646E.
• Lateral boundaries: The 5 m above Mean Sea Level (MSL) contour along each bank.
4.2 Zonation
The estuary forms one of the zones identified for the river (Section 3.6). Marked differences exist between the chemistry of river water and seawater, particularly in terms of system variables (e.g. salinity, temperatures, oxygen levels, pH and suspended solids) and nutrients (e.g. nitrate, ammonium, phosphate). Water-quality characteristics along the length of the estuary, and at any point in time, are dependent on the extent of marine or freshwater influence at that point. This, in turn, is primarily determined by the quantity of river water entering the estuary during that period, and also by the state of the tide. Typically, strong longitudinal gradients are evident in certain parameters, principally salinity, sediment particle size, sediment organic content, and water clarity. Strong gradients in these abiotic parameters also result in longitudinal variations in biotic composition and functioning. In a typical open estuary such as the Pangani, three sub-zones can be identified:
• a lower (downstream) marine dominated sub-zone where salinities are close to that of sea water (25-35 ppt), the channel is narrow and tidal current strong, sediments are coarse and have a low organic content, and water clarity is high;
• a middle intermediate sub-zone where salinities are intermediate between sea and fresh water (10-25 ppt), the estuary channel is at its widest and tidal currents are greatly reduced, sediments are fine (typically muddy) and have a high organic content, and water clarity is moderate to low;
• an upper (upstream) river dominated sub-zone where salinities are <10 ppt, the channel is narrow and river flow dominates over tidal flow, sediments particle size is variable (mostly medium to coarse) and has a moderate organic content, and water clarity is low.

Delineation Final Report
39
Table 4.1 Available water quality data for the Pangani estuary. (Source of data: PBWO/Ministry of Water).
Distance from mouth Date
Flow (Mm
3/ m) Flow description
DO (mg/L)
Temp (°C)
Salinity (ppt) pH
Turbidity. (NTU)
PO4-P (mg/L)
NH4-N (mg/L)
NO3-N (mg/L)
7 km 2004/04/01 95.03 Beginning of high flow season 7.77 33.5 22.6 8.04 - - - -
7 km 2004/05/11 135.96 Peak high flow - 29.8 14.8 8.12 - 0.65 - 0.52
7 km 2004/09/18 62.9 End of low flow season 4.6 31.3 25.2 7.87 - 0.44 - -
7 km 2004/10/26 61.7 End of low flow season 7.5 30.3 18.2 7.93 - 0.6 0.22 -
15 km 1998/03/03 92.15 Low flow - after short rains 3.46 32.3 3.7 8.16 - 0.76 2.1 0
15 km 1998/06/09 131.96 End of high flow season 3.12 28.5 1.2 7.48 31 - 0.59 -
22 km 2001/11/28 57.23 Middle of short rains - - 0.4 8.2 17 - - -
Upper estuary Middle estuary
Lowerestuary
1234
5
6
7
8
9
10
12
11
*
*
*
2 km
Figure 4.1 Map of the Pangani estuary showing the upper, lower and lateral boundaries (solid lines) and division into Upper, Middle and Lower sub-zones (dotted lines)
8.
8 The solid blue line marks the centre of the estuary. Proposed sampling sites for physico-chemical parameters, phytoplankton, invertebrates and fish are numbered from 1-12 – see Section 7.1.2 for
further explanation of these sites. Historic water quality sampling sites are marked with asterisks.

Delineation Final Report
40
5 km
Figure 4.2 Vegetation and land use map of the Pangani estuary (Source: Huntington Technical Services 1996. Compiled from Landsat Thematic Mapper imagery data, bands 4, 5 and 3. 1:250 000 scale).
Few data are available for any of these defining parameters for the Pangani estuary. Delineation of upper, middle and lower sub-zones at this stage is thus difficult. However, three sub-zones have been tentatively defined as follows (Figure 4.1):
• The lower estuary, extending from the mouth (9399259N, 37498505 E) 2 km upstream as far as position 9402076N, 37494089E.
• The middle estuary, extending from the top of the lower estuary (position 9402076N, 37494089E) 7.5 km upstream to position 9402654N, 37491865E.
• The upper estuary, extending from the top of the middle estuary (position 9402654N, 37491865E) 21.5 km upstream to the top of the estuary (position 9403855N, .37486646E).
The upstream and lateral boundaries of the estuary and divisions between the zones will be further refined during the field visits.
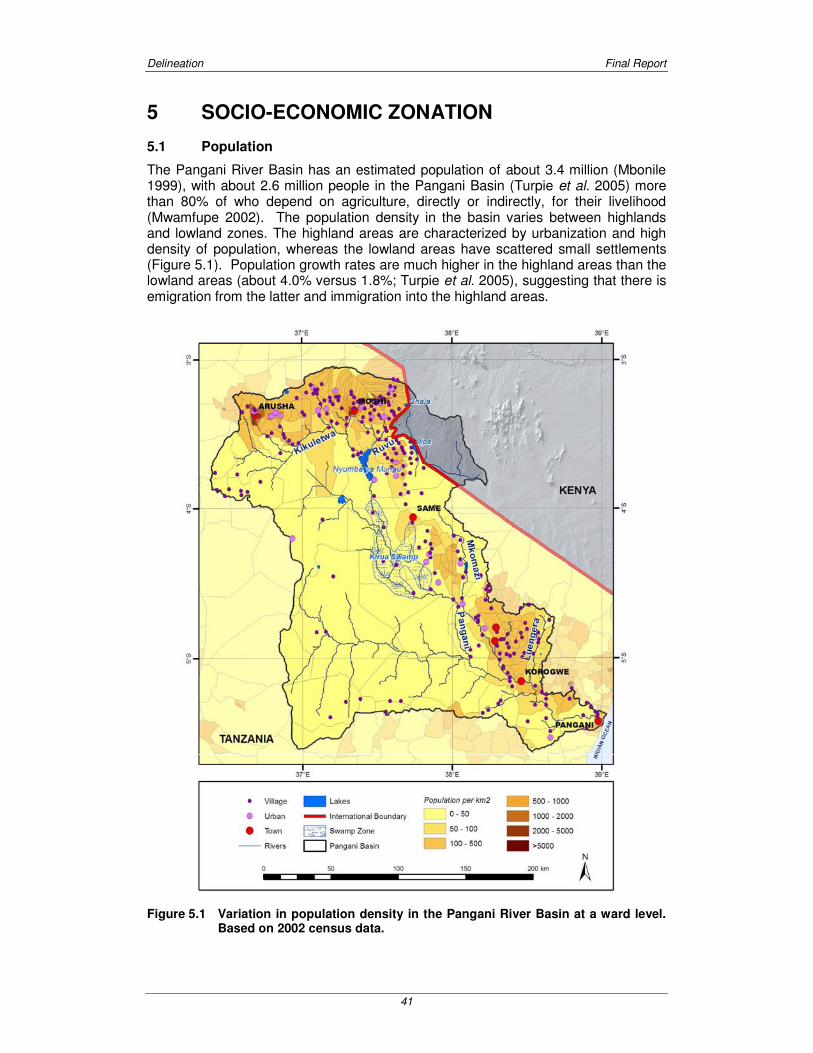
Delineation Final Report
41
5 SOCIO-ECONOMIC ZONATION
5.1 Population
The Pangani River Basin has an estimated population of about 3.4 million (Mbonile 1999), with about 2.6 million people in the Pangani Basin (Turpie et al. 2005) more than 80% of who depend on agriculture, directly or indirectly, for their livelihood (Mwamfupe 2002). The population density in the basin varies between highlands and lowland zones. The highland areas are characterized by urbanization and high density of population, whereas the lowland areas have scattered small settlements (Figure 5.1). Population growth rates are much higher in the highland areas than the lowland areas (about 4.0% versus 1.8%; Turpie et al. 2005), suggesting that there is emigration from the latter and immigration into the highland areas.
Figure 5.1 Variation in population density in the Pangani River Basin at a ward level. Based on 2002 census data.

Delineation Final Report
42
5.2 Land use
Land use in the basin is governed primarily by rainfall but also by slope, soils and availability of surface water (Figure 5.2). The mountainous areas and coastal lowland areas have the highest rainfall. The highlands are particularly favoured for coffee and bananas, flowers and a host of vegetables. Dairy production (using a zero-grazing system, i.e., animals kept indoors) is also important here. The mountain foothills are used mainly for cultivation of crops such as rice, sugarcane, bananas, maize, tomatoes, beans, sugarcane, millet, sorghum, wheat, groundnuts and onions. Much of the agriculture in this area is irrigated, both from reservoirs and from traditional furrows, and there is considerable large-scale/commercial cultivation of coffee, sugar and flowers, as well as small-scale agriculture. However, the latter dominates the cultivated area. In the dryer areas, mountain foothills are favoured for sisal production at a commercial scale. Lower lying floodplain areas in the basin are also cultivated extensively. Most crops that are grown in the highlands are also grown in these areas. Dryland cultivation takes place in the arid south-west. In the relatively mesic coastal lowlands near the estuary, important crops include coconut, sweet and Irish potatoes, pumpkins, cassava, okra, sisal and fruits. Whereas relatively small numbers of cattle and sheep are kept in the higher parts of the basin, livestock grazing is the predominant agricultural activity in the arid regions of the basin, with herds of cattle and goats being relatively large in these areas. Livestock outputs in the highland and upper basin areas are predominantly milk and beef, whereas in the arid rangelands, the output is the meat from cattle and goats.
5.3 Use of water
Irrigated agriculture is the biggest user of surface water with over 50 000 ha of fields in the basin. The major water users are urban water authorities (Moshi and Arusha) for the supply of water for domestic users, various estates (coffee, sugarcane, flowers, rice, sisal and banana), vegetables, sunflower and industries (sugar refineries and sisal processing plants). Major crops under irrigation, which consume large amounts of water, include coffee (1 000 m3/ha/a), sugarcane (12 000 – 17 000 m3/ha/a), and flowers (18 250 m3/ha/a) in large commercial estates and small- scale farms. Other crops under small-scale irrigation and amount of water consumed include traditional furrow (3 000 m3/ha/a) and improved schemes (850 – 1 195 m3/ha/a) in the highlands, upper basin and lowland areas (Turpie et al. 2005). Other users of river waters in the basin are the pastoralists who migrate into the basin searching for water. Highland dairy cattle use about 36 m3/head/a, upper basin dairy and beef cattle 27 m3/head/a and lowlands cattle 18 m3/head/a. Pastoralists and dryland farmers who occupy the western portions of the basin do not place significant demands on surface water supplies, and probably rely largely on groundwater and seasonal springs.

Delineation Final Report
43
Figure 5.2 Distribution of cultivated areas within the Pangani River Basin, in relation to altitude, rivers and major dams and lakes.
5.4 Household use of aquatic resources
Households living near rivers and the estuary derive subsistence benefits and modest incomes from the use of natural resources. These include food and Medicinal plants, reeds, sedges and floodplain grasses, palms, mangroves, fisheries and animals for hunting. The reliance on these resources is relatively low in the highlands, and increases downstream, with the highest benefits from aquatic resources being provided by those associated with the lower floodplain areas and estuary. The construction of the Nyumba ya Mungu Dam also resulted in the
Delineation Final Report
44
development of a fishery, which benefits the communities living around the dam. This has essentially replaced a fishery that was previously associated with the river and Kirua Swamp area below the dam (Turpie et al. 2004).
5.5 Delineation of the basin socio-economic zones
Using the above information as a guide, the basin was delineated into relatively homogenous zones on the basis of land use and relationships to aquatic ecosystems (Figure 5.3). This exercise was performed with the aid of local experts who had a knowledge of the basin. The boundaries are approximate at this stage and will be refined during the description of the state of the basin. The areas are described in more detail below.
Figure 5.3 Delineation of socio-economic sub-zones within the Pangani River Basin, in relation to rivers, major dams and lakes, and villages and towns.

Delineation Final Report
45
5.5.1 Northern Highlands
These are the foothills of Mt Meru and Mt Kilmanjaro, roughly corresponding to the catchments of the Kikuletwa and Ruvu Rivers above the Nyumba ya Mungu Dam. The area is characterised by dense populations and small-holder irrigated agriculture, with small-scale farmers relying on furrow irrigation. Coffee, bananas, paddy rice and maize are the dominant crops. There are several schemes that improve the efficiency of irrigated agriculture. In addition, this zone contains a commercial plantation of sugar. There is a very small amount of fishing, as well as harvesting of aquatic plants. Within this zone, the upper mountain areas can be considered as a subzone. These are the areas above the 1200 m contour on the slopes of Mt Meru and Mt Kilimanjaro. These areas are characterised by dense populations and smallholder cultivation of coffee, bananas, dairy and vegetables, interspersed with large-scale commercial coffee plantations. Most of this is irrigation agriculture, both from furrows and from more sophisticated systems using reservoirs and boreholes. There is relatively little utilisation of riparian resources, with those used being mainly aquatic plants. Although distinguishable in terms of agricultural activities, the upper mountain areas are considered together with the rest of the highland zone because many households have fields in both.
5.5.2 Eastern Highlands
These are characterised by the relatively dense settlements and cultivated areas around the Pare and Usambara Mountains. In addition to small-holder cultivation, the lowland areas immediately below the foothills are used extensively for sisal production. There are also extensive populations living along the main road between Moshi and Tanga. We include these populations in this zone, as their connections are probably more with agricultural lands above the road than towards the river.
5.5.3 Lakes
These are the communities associated with Nyumba ya Mungu Dam and Lake Jipe, and the associated wetland areas. Fishing is important in both of these communities. The majority of fishers around Nyumba ya Mungu Dam are Ngoni and Luo who migrated to Nyumba ya Mungu Dam from Songea in southern Tanzania and from Kisumu in Kenya (URT 1996). Because the reservoir is within a former major wetland area, it is possible that households in this area also have a significant association with other wetland resources.
5.5.4 Middle Pangani River and Kirua Swamps
Between Nyumba ya Mungu Dam and its confluence with the Mkomazi River, the Pangani River flows through an arid lowland area. There are a few small villages and temporary settlements associated with this stretch of river. These people
Delineation Final Report
46
depend on the river for watering cattle, fishing, aquatic plants, and irrigating floodplain fields. In the past, the community living in the northern part of this zone would have been more distinguishable from those living further south due to their association with the Kirua Swamp. However, the difference would probably have diminished since the drying up of the swamp over the past 12 – 15 years. For the purposes of scenario analysis, it might be possible to distinguish these communities into two sub-zones.
5.5.5 Mesic lowlands
Lowland areas in the south-east of the basin are cultivated, with smallholder cropping, probably due to the combination of extensive floodplain areas and high rainfall. In addition, the coastal areas contain large commercial-scale sisal plantations. This area also has a relatively dense population, with economic activity centred in Tanga. Note that this area will also include coastal populations who derive income from inshore fishing. We need to include this part of the population in the Coast and estuary zone.
5.5.6 Coast and estuary
At Pangani Falls, the elevation of the catchment drops sharply. The climatic conditions in the coastal zone differ somewhat from further inland, and the area is more conducive to cultivation of crops such as coconut palms. Within this zone, the estuary sub-zone is defined on the basis of a relatively limited population that derives significant benefits from estuarine resources. The area is also characterised by coconut palm and betelnut plantations.
5.5.7 Western and south-western arid regions
These zones are characterised by a very low population density and are dominated by nomadic pastoralists. The south-western region also has small-scale dryland agriculture. Since there is little direct relationship with the surface water resources in the basin in these areas, they will not be described in detail in the State of the Basin assessment.

Delineation Final Report
47
6 SYNCHRONISATION OF THE SOCIO-ECONOMIC AND ECOLOGICAL ZONES
The zones and sub-zones identified for the river/estuary and socio-economic activities in the basin were compared and adjusted to ensure that data from one set of activities could be usefully transferred to and used in the other set of activities. In order to facilitate the transfer of information between disciplines, it was decided that the socio-economic and ecological spatial delineation should, at least, correspond at the sub-zonal level. The adjustments required to both the socio-economic and ecological zones to achieve the required synchronization were integrated into the delineations discussed in Sections 3, 4, and 5. The resultant relationships between the socio-economic and ecological zones are provided in Table 6.1 and Table 6.2.
Table 6.1 Synchronised socio-economic and ecological zones, ordered to highlight relationships to socio-economic zones.
Socio-economic
Zone
Socio-economic Sub
zone Harmonized River Zone
River Sub Zones
River
Mountain Torrent (>1200 m) MT1 Nduruma River
Mountain Torrent (>1200 m) MT2 Sanya River
Mountain Torrent (>1200 m) MT3 Tengeru River Mountain
Mountain Torrent (>1200 m) MT4 Himo River
Mountain Stream (1000-1200 m) MS5 Himo River
Mountain Stream (1000-1200 m) MS1 Nduruma River
Mountain Stream (1000-1200 m) MS2 Sanya River
Mountain Stream (1000-1200 m) MS3 Tengeru River
Upper foothills UF1 Kikuletwa River
Upper foothills UF1 Sanya River
Upper foothills UF1 Tengeru River
Rejuvenated foothill RJ1 Kikuletwa River
Rejuvenated foothill RJ2 Ruvu River
Northern Highlands
Meru/ Kilimanjaro
Lower foothills LF1 Himo River
Mountain Stream (1000-1200 m) MS5 North and South Pare Mountains
Upper foothills UF1 Muraini River
Lower foothills LF2 Muraini River Pare
Lower foothills LF5 Mkomazi River
Eastern Highlands
Usambara Mountain Stream (1000-1200 m) MS6 Usambara Mountains
Shambalai Swamps SW5 Shambalai Swamp
Swamps SW3 Ruvu River Lake Jipe
Swamps SW2 Lake Jipe
Swamps SW1 U/s of Nyumba ya Mungu Dam
Lakes
Nyumba ya Mungu Dam Swamps SW4 Nyumba ya Mungu Dam
Floodplain FP Kirua Swamp Pangani/ Kirua Kirua Swamp
Lower foothills LF3 Downstream of swamp to LF3
Lower foothills LF4 LF2 to downstream of Mkomazi Confluence Pangani
Rejuvenated Bedrock Cascade RBC1 From LF4 to d/s Pangani Falls Mesic
Lowlands
Luengera Lower foothills LF6 Luengera River
Coast Mature lower river LR1 Pangani Fall to estuary
Estuary E1 Upper estuary
Estuary E2 Middle estuary Coastal
Estuary
Estuary E3 Lower estuary
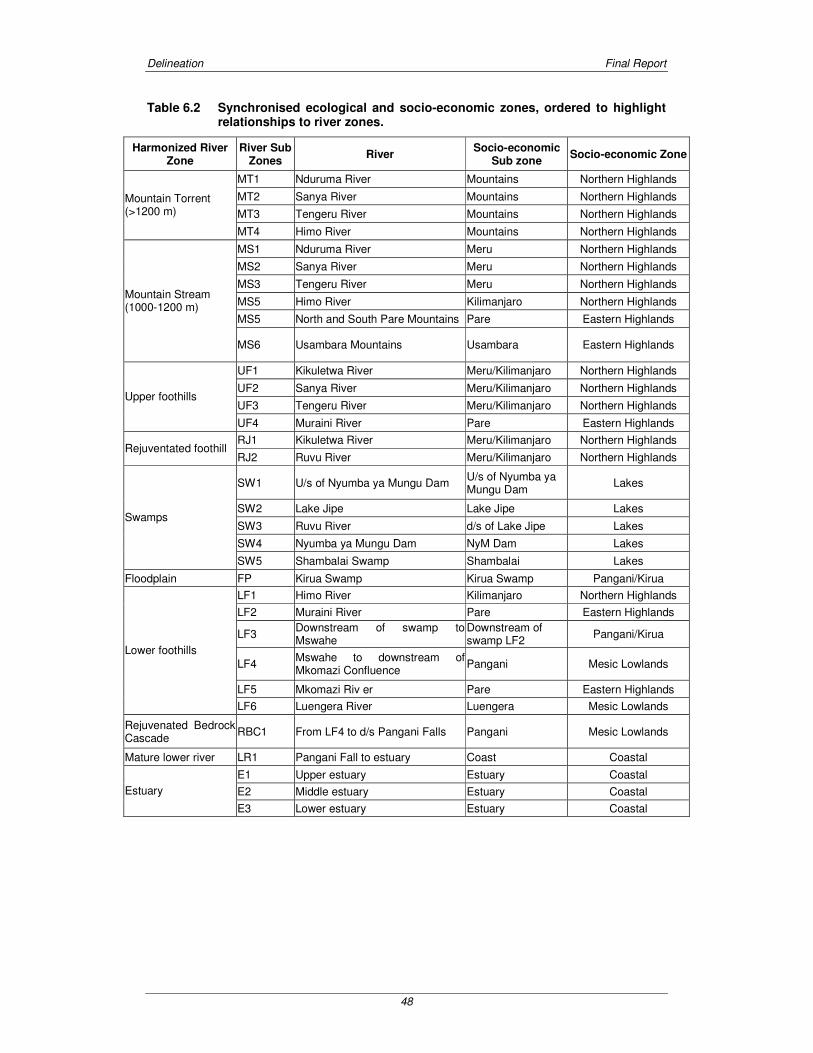
Delineation Final Report
48
Table 6.2 Synchronised ecological and socio-economic zones, ordered to highlight relationships to river zones.
Harmonized River Zone
River Sub Zones
River Socio-economic
Sub zone Socio-economic Zone
MT1 Nduruma River Mountains Northern Highlands
MT2 Sanya River Mountains Northern Highlands
MT3 Tengeru River Mountains Northern Highlands
Mountain Torrent (>1200 m)
MT4 Himo River Mountains Northern Highlands
MS1 Nduruma River Meru Northern Highlands
MS2 Sanya River Meru Northern Highlands
MS3 Tengeru River Meru Northern Highlands
MS5 Himo River Kilimanjaro Northern Highlands
MS5 North and South Pare Mountains Pare Eastern Highlands
Mountain Stream (1000-1200 m)
MS6 Usambara Mountains Usambara Eastern Highlands
UF1 Kikuletwa River Meru/Kilimanjaro Northern Highlands
UF2 Sanya River Meru/Kilimanjaro Northern Highlands
UF3 Tengeru River Meru/Kilimanjaro Northern Highlands Upper foothills
UF4 Muraini River Pare Eastern Highlands
RJ1 Kikuletwa River Meru/Kilimanjaro Northern Highlands Rejuventated foothill
RJ2 Ruvu River Meru/Kilimanjaro Northern Highlands
SW1 U/s of Nyumba ya Mungu Dam U/s of Nyumba ya Mungu Dam
Lakes
SW2 Lake Jipe Lake Jipe Lakes
SW3 Ruvu River d/s of Lake Jipe Lakes
SW4 Nyumba ya Mungu Dam NyM Dam Lakes
Swamps
SW5 Shambalai Swamp Shambalai Lakes
Floodplain FP Kirua Swamp Kirua Swamp Pangani/Kirua
LF1 Himo River Kilimanjaro Northern Highlands
LF2 Muraini River Pare Eastern Highlands
LF3 Downstream of swamp to Mswahe
Downstream of swamp LF2
Pangani/Kirua
LF4 Mswahe to downstream of Mkomazi Confluence
Pangani Mesic Lowlands
LF5 Mkomazi Riv er Pare Eastern Highlands
Lower foothills
LF6 Luengera River Luengera Mesic Lowlands
Rejuvenated Bedrock Cascade
RBC1 From LF4 to d/s Pangani Falls Pangani Mesic Lowlands
Mature lower river LR1 Pangani Fall to estuary Coast Coastal
E1 Upper estuary Estuary Coastal
E2 Middle estuary Estuary Coastal Estuary
E3 Lower estuary Estuary Coastal

Delineation Final Report
49
7 STUDY SITES
7.1 River and estuary health assessment
7.1.1 Rivers (including lakes and swamps)
The study sites selected for the river-health assessment are described in Table 7.1 and Figure 7.1. These sites will be sampled twice during the project, once in May/June 2006 and once in September-October 2006. The data collected will be incorporated into the river and wetlands portion of the State of the Basin Report, which should comprise initial species lists and identification of key areas of concern for the river system, estuary and major wetlands. Thirteen study sites9 were selected from a total of 28 individual river reaches.
Table 7.1 Study sites within the Pangani River Basin selected for the river health assessment. Site characterisation in brackets as in Table 3.9.
Site No. River system River name at reach
Coordinates Location Description
River Sub-zone
Riv 1 (MS1) Nduruma R. 3°22'24.24"S 36°44'51.06"E
U/S of Nduruma chini Mountain Stream
Riv 2 (UF1) Kikuletwa R. 3°33'28.17"S 36°58'05.61"E
Wahoga chini (gauging station)
Upper Foothill
Riv 3 (SW1)
Kikuletwa R.
Kikuletwa R. 3°38'23.62"S 37°18'16.72"E
Upstream Nyumba ya Mungu - Along Kikuletwa R.
Swamp
Riv 4 (MS5) Ona R. 3°18'36.51"S 37°30'04.37"E
Samangai - Kimatoloni bridge
Mountain Stream
Riv 5 (UF4) Himo R. 3°23'29.55"S 37°30'14.94"E
At Himo town, upper bridge (gauging station)
Upper Foothill
Riv 6 (LF1)
Ruvu R.
Ruvu R. 3°31'08.98"S 37°34'03.63"E
At Kifaru, upstream of the bridge
Lower Foothill
Riv 7 (LF2) Muraini R. Muraini R. 3°41'09.24"S 37°47'16.74"E
Upstream Jipe (at bridge)
Lower Foothill
Riv 8 (FP) Pangani R. 3°54'57.67"S 37°28'01.5"E
Kirua swamp Swamp
Riv 9 (LF4) Pangani R. 4°59'02.02"S 38°06'47.91"E
Mkalamo village (at the bridge)
Lower Foothill
Riv 10 (RBC) Pangani R. 5°18'05.22"S 38°36'26.68"E
Mwakinyumbi (Hale town downstream)
Rejuvenation Zone
Riv 11 (MLR)
Pangani R.
Pangani R. 5°21'53.31"S 38°39'57.74"E
Jambe village Mature Lower River
Riv 12 (LF5) Mkomazi R. Mkomazi R. 4°30'07.83"S 38°04'53.31"E
Downstream Kalimawe dam (bridge after Mgandu school)
Lower Foothill
Riv 13 (LF6) Luengera R. Luengera R. 5°06'02.03"S 38°31'25.07"E
Kwamndolwa - near Kivira hill
Lower Foothill
9 The number of study sites needed to be limited to c. 12 to accommodate budget and programme constraints.

Delineation Final Report
50
Figure 7.1 River Health Assessment sampling sites.
The reaches that were excluded, and the reasons for their exclusion are given below:
• Nyumba ya Mungu Dam – a man-made structure for which there is considerably more ecological information available than for the rivers;
• Lake Jipe - which was the subject of an independent and detailed study in 2004/2005;
• four Mountain Torrent Zones - access to these areas is difficult and there are no hydrological data for the zones;
Delineation Final Report
51
• one of the sub-zones (LF3, Table 3.9) in the lower Pangani River between Nyumba ya Mungu Dam and the rejuvenation zone at the town of Korogwe – subjected to similar anthropogenic impacts to the other zone (LF4, Table 3.9);
• the Tengeru and Sanya Rivers (a total of four river reaches, excluding the Mountain Torrent Zones excluded above) – health data to be extrapolated from the Kikuletwa River;
• one of the two reaches on the Muraini River – there are no hydrological data for this river, and sampling of only one site should provide sufficient information on health (in the context of the coarse resolution of the study;
• the rejuvenation zones on the Kikuletwa and Ruvu Rivers - access to these areas is difficult and social utilisation of these reaches appears to be less than for the other reaches;
• the Mountain Stream zones in the Pare and Usambara Mountains – these are short systems that are difficult to access;
• Shambalai Swamp – there are no hydrological data for this swamp.
7.1.2 Estuary
A total of 12 sampling stations have provisionally been identified in the estuary (Figure 4.1). Station 1 is situated in the sea outside of the mouth of the estuary and sampling at this station will be confined to water quality parameters (viz. temperature, salinity, oxygen, nutrients, pH) as this will be used to characterise the nature of the seawater flowing into the estuary. Stations 2 and 3 are located in the lower estuary, stations 4-7 in the middle estuary, and 8-12 in the upper estuary. Each of these stations will be used for sampling water quality, sediment, phytoplankton, vegetation, invertebrate, and fish. Birds (recorded as numbers of individuals of different species) will be counted across the whole estuary split into separate counting sections. A vegetation map will also be compiled for the estuary as a whole.
7.2 Social assessment
Table 7.2 shows the villages that were surveyed in each zone in 2003 or planned for survey in 2006.

Delineation Final Report
52
Table 7.2 Study sites within the Pangani River Basin selected for the social assessment, and the number of households sampled
Zone Sub-zones
Village Year Households
Ambureni 2003 25
Ghona 2006 23
Kimangaro 2003 27
Kisangesangeni/Ngasenyi 2003 9
Lekitatu 2003 24
Mbuguni/Ngumbaru 2006 46
Oria 2003 11
N Highlands Mountain Meru-Kili
165
Kisiwani 2006 31
Kwakoa 2006 28
Makaranga 2006 33
Ndungu 2006 34
E Highlands
Pare-Usambare
126
Jipe 2006 24
Magadini 2006 51 Lakes NyM/Jipe
75
Jitengeni 2003 7
Kombo (Kumbamtoni) 2003 8
Lolokai 2003 13
Mabilioni 2006 16
Mesrani 2003 7
Mvungwe 2003 17
Ruvu Kivukoni 2003 17
Ruvu Muungano 2003 10
Ruvu-Marwa 2003 10
Pangani Kirua Kirua
105
Mazinde/Mheza 2006 24
Mkalamo 2006 31
Segera 2006 24 Mesic Lowlands
Mesic Lowlands
79
Bweni 2003 14
Kigulusimba 2006 34
Mkwajuni 2003 15
Mseko 2003 16
Pangani 2006 30
Estuary Estuary
109
Overall Total 659
Delineation Final Report
53
8 THE WAY FORWARD
Tasks 2 and 2.1 are preparatory exercises for the whole project. Task 2, reported here, provided an overview of the Pangani River Basin and divided it into relatively homogeneous regions. This allowed selection of study sites for the river, estuary and social studies that could be used to represent wider areas of the basin. Task 2.1, building on the outcome of Task 2 and reported on separately, describes a structured set of activities, within the team and with basin stakeholders, designed to provide early identification of a list of possible scenarios for the Flow Assessment exercise. This will guide data-collection activities over the next few months in Tasks 3 and 4. These tasks will culminate in a State of the Basin Report to be completed in draft form by November 2006.
Delineation Final Report
54
9 REFERENCES
Beuster, J., Howard, G.J. and G.V. Lugomela. 2006. IUCN Water and Nature Initiative. Pangani Basin Water Office Pangani Flow Assessment Initiative. Hydrology and System Analysis, Volume 1 of 2: The Hydrology of the Pangani River Basin. Report prepared for Southern Waters Ecological Research and Consulting and Anchor Environmental Consultants by Emzantsi Systems.
Bwathondi, P.O.J. and Mwamsojo, G.U.J. 1993. The status of the fishery resources in the wetlands of Tanzania. Kamukala, and Crafter, S.A (eds) Wetlands of Tanzania: proceedings of a seminar on the wetlands of Tanzania, Morogoro, 27 – 29 November, 1991. IUCN, Gland, Switzerland: 49 – 60.
Denny, P. and Bailey, R.G. (Eds). 1974. A biological survey of Nyumba ya Mungu Reservoir, Tanzania. A report for the Tanzanian Government. From a survey carried out in association with the Fisheries Division, Ministry of Natural Resources and Tourism, Tanzania and the Department of Zoology and Marine Biology, University of Dar es Salaam. 253pp.
Department of Water Affairs and Forestry (DWAF). 2004. Water resource protection and assessment policy implementation process. Resource directed measures for protection of water resource: Methodology for the Determination of the Ecological Water Requirements for Estuaries. Version 2. Pretoria.
Eccles, D. H. 1992. Field guide to the freshwater fishes of Tanzania. UNDP project United Republic of Tanzania (URT)/87/016. FAO, Rome.
Food and Agriculture Organization (FAO). 1959. Expanded Technical Assistance Program: Report to the Government of Tanganyika on the Soils of the Pangani Valley. Food and Agriculture Organization of the United Nations, Rome.
Hunting Technical Services (1997) and cover and Land use maps 1:250000 sheets SA-37-13; SB-37-1;SB-37-2;SB-37-6 and SA-37-14. Maps printed by Hunting Technical Services, Thamesfield House, Boundary Way, Hemel Hempstead, Hertfordshire. United Kingdom.
Inter-consult Ltd. of Tanzania in association with NORPLAN A.S. of Norway. 1996. River Basin Management and Smallholder irrigation improvement project River Basin Management Component. Report G. Inland fisheries. 72pp.
Inter-consult ltd. of Tanzania in association with NORPLAN A.S. of Norway. 1996. River Basin Management and Smallholder irrigation improvement project. River Basin Management Component. Report D. Sensitive Ecosystems (Wetlands). 48pp.
IUCN Eastern Africa Programme. 2003. The Pangani River Basin: A Situation Analysis. IUCN Eastern Africa Region Office, Nairobi. Unpublished report to IUCN. Scan house press limited. xvi + 104 pp.
IVO-NORPLAN Joint Venture. 1993. Distribution of water hyacinth Eichhornia crassipes along Pangani River from Pangani Falls upstream to Nyumba ya Mungu Dam. A report to TANESCO. 10pp.
IVO-NORPLAN Joint Venture. 1994. Environmental Impact Assessment of the Redevelopment of Hydro-electric Power Station at Pangani Falls. Baseline studies mitigation of adverse impacts and monitoring the attainment of intended mitigation. Pangani Falls, Hale, Dar es Salaamand Ski, Norway. 197pp.
IVO-NORPLAN Joint Venture. 1997. Pangani Falls Redevelopment. Pangani River Training Project. Feasibility Study. Pangani Basin water office.
Delineation Final Report
55
Mbago, F. M. 1997. Botanical survey for the Pangani River Training Project. Pangani Basin Water Office. A consultancy report of the Department of Botany, University of Dar es Salaam, Dar es Salaam, Tanzania.
Mbonile, M.J. 1999. Population dynamics in Pangani Basin, Tanzania: workshop proceedings on Water management in Pangani River Basin. University of Dar es Salaam and Technical University of Norway, Bahari Beach Hotel. Dar es Salaam, July 1999.
Mbwambo, Z.D. 2001. Status of the mangrove forests in the Northern Zone. Tanga, Tanzania: Mangrove Management Project, Northern Zone.
Ministry of Water (MoW) 2002. National Water Policy 2002. The United Republic of Tanzania (URT), 88 pp.
Ministry of Water, Energy and Minerals - The United Republic of Tanzania. 1997. Water Master Plan Kilimanjaro Region: Final Report December 1977. Water Master Plan Team, Project Preparation and Planning Division.
Mwamfupe, D.G. 2002. The role of non-farm activities in household economies: a case study of Pangani Basin, Tanzania.
Pamoja 2003. Dialogue on water: A concept paper on water resource use and management of conflicts in the Pangani River Basin: the possible role of PAMOJA. Moshi, PAMOJA.
PBWO/IUCN. 2006. Hydrology and system analysis. Volume 1 of 2. The hydrology of the Pangani River Basin. Report 1: Pangani River Basin Flow Assessment, Moshi, 62 pp.
Røhr, P. C. and Killingtveit, A. 2002. Study of two catchments on the hillside of Mt Kilimanjaro. In Ngaga, J.O. (ed.) Water resources management: the case of Pangani River Basin. Issues and approaches. Dar es Salaam, Dar es Salaam University Press: 211-231.
Rowntree, K.M. and Wadeson, R.A. 1999. A hierarchical geomorphological model for the classification of selected South African Rivers. Water Research Commission Report No. 497/1/99, Water Research Commission, Pretoria, 334 pp.
Sadiki, H. and Kanyawanah, M. 1999. Report on ground water assessment in Pangani Basin. Internal PBWO Report. May 1999.
Semesi, A.K. 1986. Zonation and vegetation structure of mangrove communities in Tanzania. In: Proceedings of a workshop on “Save the Mangrove Ecosystem in Tanzania”, J.R. Mainoya and P.R. Siegel, eds., 21-22 February, 1986. Faculty of Science, University of Dar es Salaam.
Semesi, A.K. 1991. Management plan for the mangrove ecosystems of mainland Tanzania, Vol. 11 (Vols. 1-10 joined). Dar es Salaam : Ministry of Tourism, Natural Resources and Environment (MTNRE), Forestry and Beekeeping Division, Catchment Forestry Project.
Semesi, A.K. and Adelaida, K. 2000. Mangrove of Tanzania. In: Present state of knowledge of marine science in Tanzania: Synthesis report, edited by A.S. Ngusaru. TCMP Working Document.
Spalding, M.D.F., Blasco, F. and Fields, C.D. (eds.) 1997. World Mangrove Atlas. Okinawa, Japan: The international Society for Mangrove Ecosystems.
Tanesco. 1994. Environmental Impact Assessment of the Redevelopment of the Hydro-Electric Power Station at Pangani Falls: Baseline studies mitigation of the adverse impacts and monitoring the attainment of the intended mitigation. Ivo-Norolan Joint Venture. Pangani Falls, Hale, Dar es Salaam and Ski, Norway.
Tanzanian Coastal Management Partnership (TCMP). 2001. Tanzania state of the coast survey: people and the environment. Technical report for WWF Eco-Region Project prepared by the Science and Technical Working Group of Tanzania Coastal Management Partnership.

Delineation Final Report
56
Turpie, J.K., Ngaga, Y. and Karanja, F. 2004. A preliminary economic assessment of water resources of the Pangani River Basin, Tanzania: economic value, incentives for sustainable use and mechanisms for financing management. Unpublished report to IUCN Eastern Africa Regional Office, Nairobi.
Turpie, J.K., Ngaga, Y. and Karanja, F. 2005. Maximising the economic value of water resources. Policy Brief no. 1. Policy briefs for water management, Pangani River Basin – Tanzania. IUCN Eastern Africa Regional Office, Nairobi.
United Republic of Tanzania (URT). 1991. Management plan for the mangrove ecosystem of mainland Tanzania. Ministry of Tourism, Natural Resources and Environment, United Republic of Tanzania.
Wang, Y., Bonynge, G., Nugranan, J., Traber, M., Ngusaru, A., Tobey, J., Hale, L., Bowen, R., and Makota, V. 2003. Remote sensing of mangrove change along the Tanzania coast. Marine Geodesy 26: 1014.
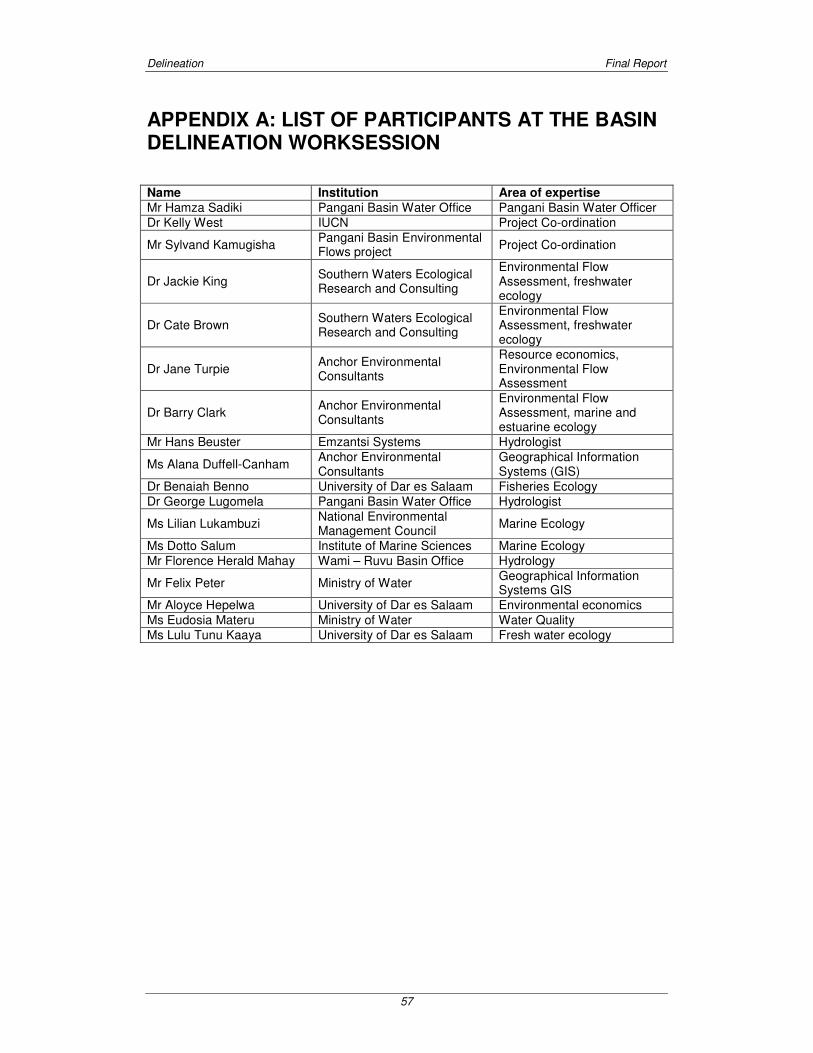
Delineation Final Report
57
APPENDIX A: LIST OF PARTICIPANTS AT THE BASIN DELINEATION WORKSESSION
Name Institution Area of expertise
Mr Hamza Sadiki Pangani Basin Water Office Pangani Basin Water Officer
Dr Kelly West IUCN Project Co-ordination
Mr Sylvand Kamugisha Pangani Basin Environmental Flows project
Project Co-ordination
Dr Jackie King Southern Waters Ecological Research and Consulting
Environmental Flow Assessment, freshwater ecology
Dr Cate Brown Southern Waters Ecological Research and Consulting
Environmental Flow Assessment, freshwater ecology
Dr Jane Turpie Anchor Environmental Consultants
Resource economics, Environmental Flow Assessment
Dr Barry Clark Anchor Environmental Consultants
Environmental Flow Assessment, marine and estuarine ecology
Mr Hans Beuster Emzantsi Systems Hydrologist
Ms Alana Duffell-Canham Anchor Environmental Consultants
Geographical Information Systems (GIS)
Dr Benaiah Benno University of Dar es Salaam Fisheries Ecology
Dr George Lugomela Pangani Basin Water Office Hydrologist
Ms Lilian Lukambuzi National Environmental Management Council
Marine Ecology
Ms Dotto Salum Institute of Marine Sciences Marine Ecology
Mr Florence Herald Mahay Wami – Ruvu Basin Office Hydrology
Mr Felix Peter Ministry of Water Geographical Information Systems GIS
Mr Aloyce Hepelwa University of Dar es Salaam Environmental economics
Ms Eudosia Materu Ministry of Water Water Quality
Ms Lulu Tunu Kaaya University of Dar es Salaam Fresh water ecology
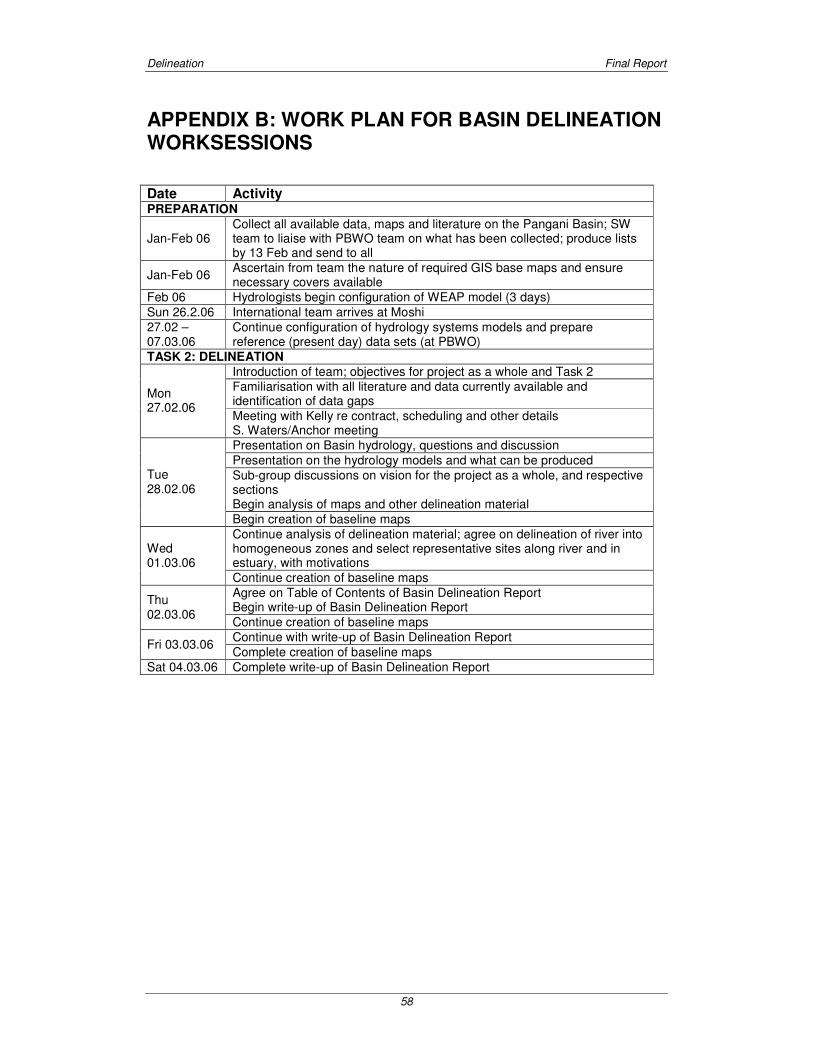
Delineation Final Report
58
APPENDIX B: WORK PLAN FOR BASIN DELINEATION WORKSESSIONS
Date Activity PREPARATION
Jan-Feb 06 Collect all available data, maps and literature on the Pangani Basin; SW team to liaise with PBWO team on what has been collected; produce lists by 13 Feb and send to all
Jan-Feb 06 Ascertain from team the nature of required GIS base maps and ensure necessary covers available
Feb 06 Hydrologists begin configuration of WEAP model (3 days)
Sun 26.2.06 International team arrives at Moshi
27.02 – 07.03.06
Continue configuration of hydrology systems models and prepare reference (present day) data sets (at PBWO)
TASK 2: DELINEATION
Introduction of team; objectives for project as a whole and Task 2 Familiarisation with all literature and data currently available and identification of data gaps
Mon 27.02.06
Meeting with Kelly re contract, scheduling and other details S. Waters/Anchor meeting
Presentation on Basin hydrology, questions and discussion
Presentation on the hydrology models and what can be produced
Sub-group discussions on vision for the project as a whole, and respective sections Begin analysis of maps and other delineation material
Tue 28.02.06
Begin creation of baseline maps
Continue analysis of delineation material; agree on delineation of river into homogeneous zones and select representative sites along river and in estuary, with motivations
Wed 01.03.06
Continue creation of baseline maps
Agree on Table of Contents of Basin Delineation Report Begin write-up of Basin Delineation Report
Thu 02.03.06
Continue creation of baseline maps
Continue with write-up of Basin Delineation Report Fri 03.03.06
Complete creation of baseline maps
Sat 04.03.06 Complete write-up of Basin Delineation Report
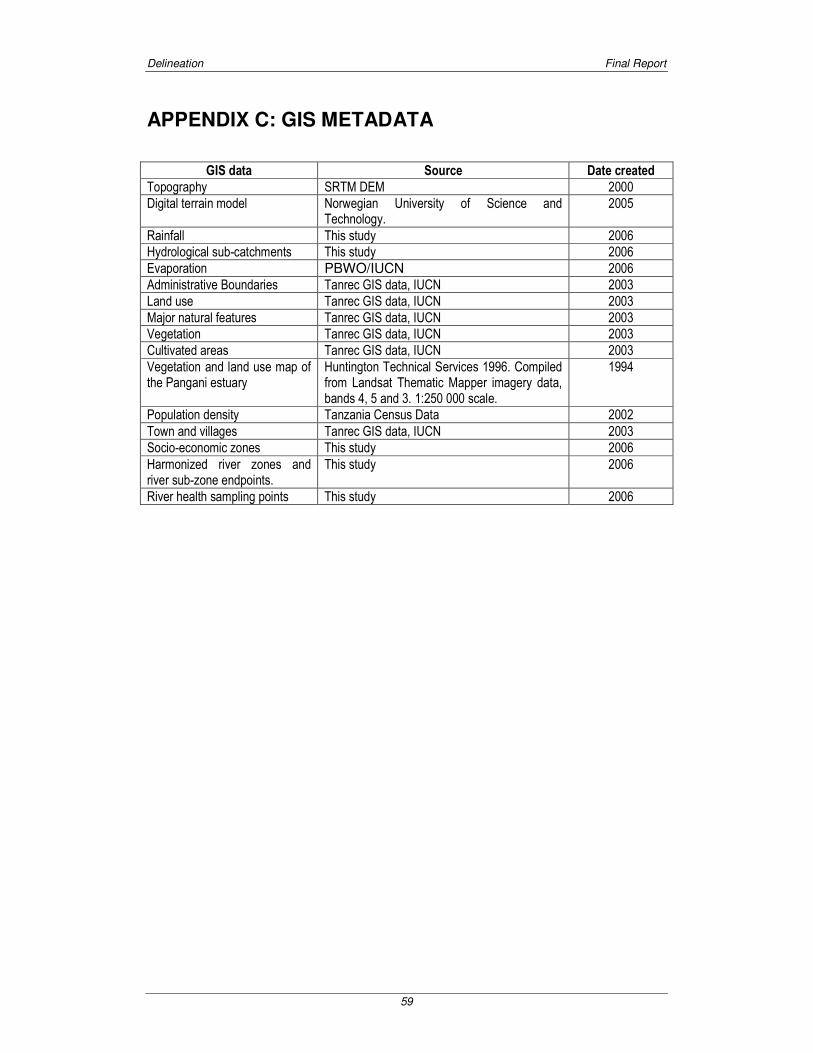
Delineation Final Report
59
APPENDIX C: GIS METADATA
GIS data Source Date created
Topography SRTM DEM 2000
Digital terrain model Norwegian University of Science and Technology.
2005
Rainfall This study 2006
Hydrological sub-catchments This study 2006
Evaporation PBWO/IUCN 2006
Administrative Boundaries Tanrec GIS data, IUCN 2003
Land use Tanrec GIS data, IUCN 2003
Major natural features Tanrec GIS data, IUCN 2003
Vegetation Tanrec GIS data, IUCN 2003
Cultivated areas Tanrec GIS data, IUCN 2003
Vegetation and land use map of the Pangani estuary
Huntington Technical Services 1996. Compiled from Landsat Thematic Mapper imagery data, bands 4, 5 and 3. 1:250 000 scale.
1994
Population density Tanzania Census Data 2002
Town and villages Tanrec GIS data, IUCN 2003
Socio-economic zones This study 2006
Harmonized river zones and river sub-zone endpoints.
This study 2006
River health sampling points This study 2006


