
Richard Casey, PhD
RMRCE
CSU Center for Bioinformatics
ISTeC Cray High-Performance Computing System

Compute Node Status
• Check whether interactive and batch compute nodes are up or down:
– xtprocadmin
NID (HEX) NODENAME TYPE STATUS MODE
12 0xc c0-0c0s3n0 compute up interactive
13 0xd c0-0c0s3n1 compute up interactive
14 0xe c0-0c0s3n2 compute up interactive
15 0xf c0-0c0s3n3 compute up interactive
16 0x10 c0-0c0s4n0 compute up interactive
17 0x11 c0-0c0s4n1 compute up interactive
18 0x12 c0-0c0s4n2 compute up interactive
42 0x2a c0-0c1s2n2 compute up batch
43 0x2b c0-0c1s2n3 compute up batch
44 0x2c c0-0c1s3n0 compute up batch
45 0x2d c0-0c1s3n1 compute up batch
61 0x3d c0-0c1s7n1 compute up batch
62 0x3e c0-0c1s7n2 compute up batch
63 0x3f c0-0c1s7n3 compute up batch
• Currently
• 960 batch compute cores
• 288 interactive compute cores
Naming convention:
CabinetX-Y
Cage-X
Slot-X
Node-X
i.e. Cabinet0-0,Cage0,Slot3,Node0

Compute Node Status
• Check the state of interactive and batch compute nodes and
whether they are already allocated to other user’s jobs:
– xtnodestat
Current Allocation Status at Tue Apr 19 08:15:02 2011
C0-0
n3 -------B
n2 -------B
n1 --------
c1n0 --------
n3 SSSaa;--
n2 aa;--
n1 aa;--
c0n0 SSSaa;--
s01234567
Legend:
nonexistent node S service node (login, boot, lustrefs)
; free interactive compute node - free batch compute node
A allocated, but idle compute node ? suspect compute node
X down compute node Y down or admindown service node
Z admindown compute node
Available compute nodes: 4 interactive, 38 batch
Cabinet ID
Cage X:
Node X
Service
Nodes Interactive Compute Nodes
Batch Compute Nodes
Slots
(=blades)
Allocated Batch Compute Nodes
Free Batch Compute Nodes
Allocated Interactive Compute Nodes
Free Interactive Compute Nodes

Batch Jobs
• Torque/PBS Batch Queue Management System
– For submission and management of jobs in batch queues
– Use for jobs with large resource requirements (long-running, # of cores, memory, etc.)
• List all available queues:
– qstat –Q (brief)
– qstat –Qf (full)
rcasey@cray2:~> qstat -Q
Queue Max Tot Ena Str Que Run Hld Wat Trn Ext T
---------------- --- --- --- --- --- --- --- --- --- --- -
batch 0 0 yes yes 0 0 0 0 0 0 E
• Show the status of jobs in all queues:
– qstat (all queued jobs)
– qstat – u username (only queued jobs for “username”) – (Note: if there are no jobs running in any of the batch queues, this command will show nothing and just return the
Linux prompt).
rcasey@cray2:~/lustrefs/mpi_c> qstat
Job id Name User Time Use S Queue
------------------------- ---------------- --------------- -------- - -----
1753.sdb mpic.job rcasey 0 R batch

Batch Jobs
• Common Job States
– Q: job is queued
– R: job is running
– E: job is exiting after having run
– C: job is completed after having run
• Submit a job to the default batch queue:
– qsub filename
– “filename” is the name of a file that contains batch queue commands
– Command line directives override batch script directives
– i.e. “qsub –N newname script”; “newname” overrides “-N name” in batch script
• Delete a job from the batch queues:
– qdel jobid
– “jobid” is the job ID number as displayed by the “qstat” command. You must
be the owner of the job in order to delete it.
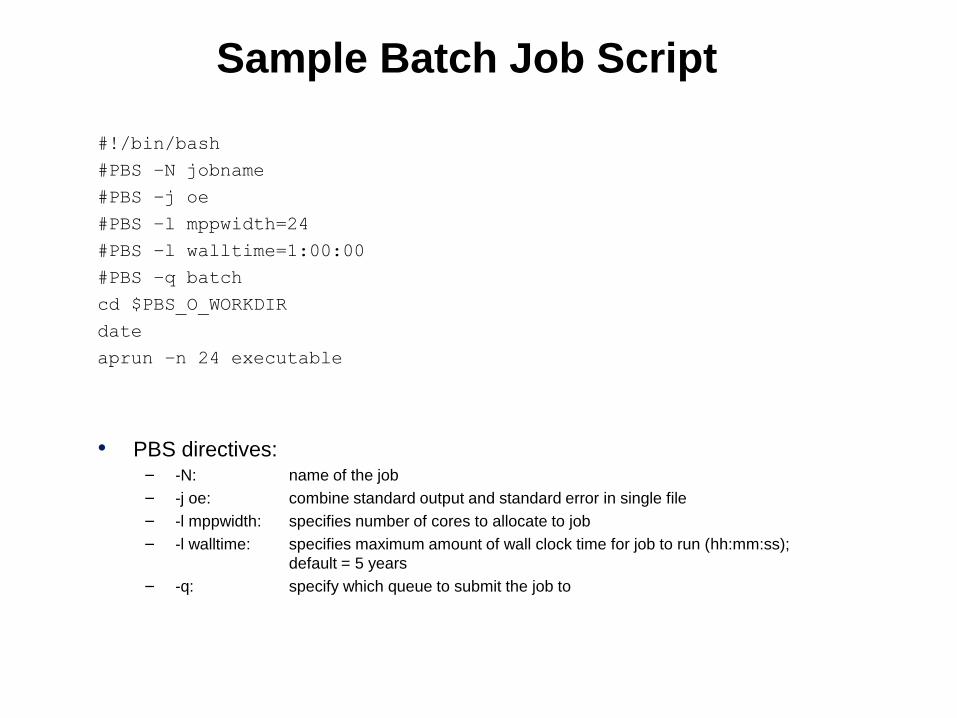
Sample Batch Job Script
#!/bin/bash
#PBS –N jobname
#PBS –j oe
#PBS –l mppwidth=24
#PBS –l walltime=1:00:00
#PBS –q batch
cd $PBS_O_WORKDIR
date
aprun –n 24 executable
• PBS directives: – -N: name of the job
– -j oe: combine standard output and standard error in single file
– -l mppwidth: specifies number of cores to allocate to job
– -l walltime: specifies maximum amount of wall clock time for job to run (hh:mm:ss);
default = 5 years
– -q: specify which queue to submit the job to

Sample Batch Job Script
• PBS_O_WORKDIR environment variable is generated by Torque/PBS.
Contains absolute path to directory from which you submitted your job.
Required for Torque/PBS to find your executable files.
• Linux commands can be included in batch job script
• The value set in aprun “-n” parameter should match value set in PBS
“mppwidth” directive
• i.e. #PBS –l mppwidth=24
• i.e. aprun –n 24 exe
• Request proper resources: • If “-n” or “mppwidth” > 960, job will be held in queued state for awhile and then deleted
• If “mppwidth” < “-n”, then error message “apsched: claim exceeds reservation's node-
count”
• If “mppwidth” > “-n”, then OK
Performance Analysis: Overview
Performance analysis process consists of three basic steps:
• Instrument your program, to specify what kind of data you want to
collect under what conditions
• Execute your instrumented program, to generate and capture the
desired data
• Analyze the resulting data

Performance Analysis: Overview
CrayPat, Perftools
• Cray’s toolkit for instrumenting executables and producing data from runs
• Two basic types of analyses available:
• Sampling/Profiling: samples program counters at fixed intervals
• Tracing: traces function calls
• Type of analysis guided by build options and environment variables
• Profile/Trace function calls & loops
• Produce call graphs and execution profiles
• Adds some overhead to executable & increases runtime

Performance Analysis: Overview
CrayPat, Perftools
• Outputs data in binary format which can be converted to text
format, i.e. reports that contain statistical information
• CrayPat supports many languages + extensions • C, C++, Fortran, MPI, OpenMP
• Use of binary instrumentation means relatively low overhead and
no interference with compiler optimizations:
• Cray performance is dependent on compiler optimizations (loop
vectorization especially), so this is a necessity for CrayPat
• Sampling instrumentation results in some overhead (< 2-3 %)
• Logfiles from runs are generally compact
• Check “man craypat”, “pat_help”, and the Craydoc “Using Cray
Performance Analysis Tools” for more info

• Load Cray, perftools, & craypat modules before compiling
– “module load PrgEnv-cray”
– “module load perftools”
– “module load xt-craypat”
• Compile code
– Use Cray compiler wrappers (cc, CC, ftn)
– Make sure object files (*.o) are retained • C: “cc -c exe.c”, then “cc –o exe exe.o”
• C++: “CC –c exe.c”, then “CC –o exe exe.o”
• Fortran: “ftn –c exe.f90”, then “ftn –o exe exe.o”
– If you use Makefiles, modify them to retain object files
Performance Analysis: Workflow

• Generate instrumented executable
– “pat_build [options] exe”
– Creates an instrumented executable “exe+pat”
• Execute instrumented code
– “aprun –n 1 exe+pat”
– Creates file “exe+pat+PID.xf” (PID = process ID)
• Generate reports
– “pat_report [options] exe+pat+PID.xf”
– Outputs performance reports (“rpt” text file)
Performance Analysis: Workflow

• pat_build
– By default, pat_build instruments code for sampling/profiling
– To instrument code for tracing, include one or several options:
• “-w”, “-u”, “-g”, “-O”, “-T”, “-t”
• i.e. “pat_build –w exe” (enable tracing)
• i.e. “pat_build –u exe” (trace user-defined functions only)
• i.e. “pat_build –g tracegroup exe” (enable tracegroups)
• i.e. “pat_build –O reports exe” (enable predefined reports)
• i.e. “pat_build –T funcname exe” (trace specific function by name)
• i.e. “pat_build –t funclist exe” (trace list of functions by name)
• Control instrumented program behavior and data collection
– 50+ optional runtime environment variables
– For example:
• To generate more detailed reports:
– “export PAT_RT_SUMMARY=0”
• To measure MPI load imbalance:
– “export PAT_RT_MPI_SYNC=1” for tracing
– “export PAT_RT_MPI_SYNC=0” for sampling
Performance Analysis: Workflow

• Trace Groups
– Instrument code to trace all function references belonging to a specified
group
– 30+ trace groups
– “pat_build –g tracegroup exe”
– For example:
• To trace MPI calls, I/O calls, memory references:
– “pat_build –g mpi,io,heap exe”
Performance Analysis: Workflow
Trace Group Desc
mpi MPI calls
omp OpenMP calls
stdio Application I/O calls
sysio System I/O calls
io stdio and sysio
lustre Lustre file system calls
heap Memory references
Performance Analysis: Workflow
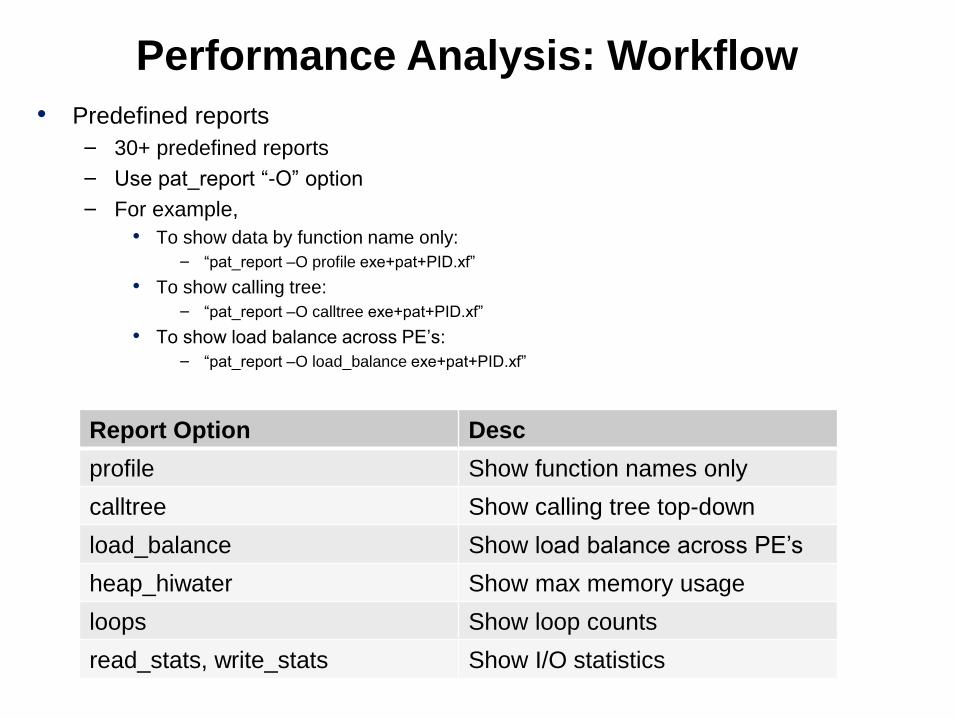
• Predefined reports
– 30+ predefined reports
– Use pat_report “-O” option
– For example,
• To show data by function name only:
– “pat_report –O profile exe+pat+PID.xf”
• To show calling tree:
– “pat_report –O calltree exe+pat+PID.xf”
• To show load balance across PE’s:
– “pat_report –O load_balance exe+pat+PID.xf”
Report Option Desc
profile Show function names only
calltree Show calling tree top-down
load_balance Show load balance across PE’s
heap_hiwater Show max memory usage
loops Show loop counts
read_stats, write_stats Show I/O statistics
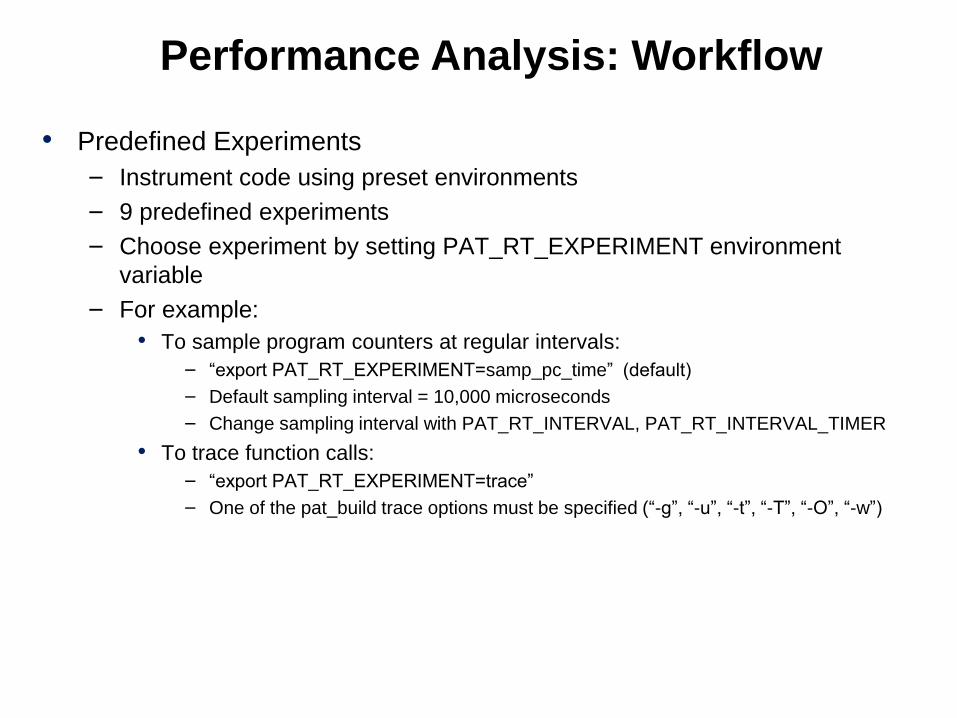
• Predefined Experiments
– Instrument code using preset environments
– 9 predefined experiments
– Choose experiment by setting PAT_RT_EXPERIMENT environment
variable
– For example:
• To sample program counters at regular intervals:
– “export PAT_RT_EXPERIMENT=samp_pc_time” (default)
– Default sampling interval = 10,000 microseconds
– Change sampling interval with PAT_RT_INTERVAL, PAT_RT_INTERVAL_TIMER
• To trace function calls:
– “export PAT_RT_EXPERIMENT=trace”
– One of the pat_build trace options must be specified (“-g”, “-u”, “-t”, “-T”, “-O”, “-w”)
Performance Analysis: Workflow

• Predefined Hardware Performance Counter Groups
– Build and instrument code as usual
– Set PAT_RT_HWPC env var (i.e. “export PAT_RT_HWPC=3”)
– 20 predefined groups available
• Summary
• L1, L2, L3 cache data accesses & misses
• Bandwidth info
• Hypertransport info
• Cycles stalled, resources idle/full
• Instructions and branches
• Instruction caches
• Cache hierarchy
• FP operations mix, vectorization, single-precision, double-precision
• Prefetches
– See “man hwpc” for full list and group numbers
– For summary data:
• “export PAT_RT_HWPC=0”
• Shows MFLOPS, MIPS, computational intensity (FP ops / mem access), etc.
Performance Analysis: Workflow

#include <mpi.h>
#include <stdio.h>
#define N 10000
#define LOOPCNT 10000
void loop(float a[], float b[], float c[]);
void main (int argc, char *argv[]) {
int i, rank;
float a[N], b[N], c[N];
for (i=0; i < N; i++) { a[i] = i * 1.0; b[i] = i * 1.0 }
MPI_Init(&argc,&argv);
MPI_Comm_rank(MPI_COMM_WORLD,&rank);
for (i=0; i<LOOPCNT; i++) { loop(a, b, c); }
MPI_Finalize();
if(rank==0) { for (i=0; i < N; i++) { printf("c[%d]= %f\n", i, c[i]);}}
void loop(float a[], float b[], float c[])
{ int i, numprocs;
MPI_Comm_size(MPI_COMM_WORLD,&numprocs);
for (i=0; i < N; i++) { c[i] = a[i] + b[i]; }
}
Performance Analysis: Reports

Performance Analysis: Reports
CrayPat/X: Version 5.1 Revision 3746 (xf 3586) 08/20/10 16:46:28
Number of PEs (MPI ranks): 6
Numbers of PEs per Node: 6 PEs on 1 Node
Numbers of Threads per PE: 1 thread on each of 6 PEs
Number of Cores per Socket: 12
Execution start time: Mon Apr 18 13:23:12 2011
System name, type, and speed: x86_64 1900 MHz
Table 2: Profile by Group, Function, and Line
Samp % | Samp | Imb. | Imb. |Group
| | Samp | Samp % | Function
| | | | Source
| | | | Line
| | | | PE='HIDE'
100.0% | 13 | -- | -- |Total
|--------------------------------------------
| 100.0% | 13 | -- | -- |USER
| | | | | subfunc
3 | | | | rcasey/perform/exe_c/exe.c
||||-----------------------------------------
4||| 15.4% | 2 | 1.83 | 55.0% |line.45
4||| 84.6% | 11 | 2.33 | 21.5% |line.46 <= for loop in subfunc function
|============================================
• Default profiling
• “cc –c exe.c”; “cc –o exe exe.o”;
“pat_build exe”; “pat_report *.xf > rpt”

Performance Analysis: Reports
Table 1: Profile by Function Group and Function
Samp % | Samp |Group
| | Function
100.0% | 2 |Total
|------------------------
| 50.0% | 1 |ETC
| | | vfprintf
| 50.0% | 1 |USER
| | | subfunc
|========================
• Profile function calls
• “pat_build exe”; “pat_report –O profile *.xf > rpt”
Performance Analysis: Reports
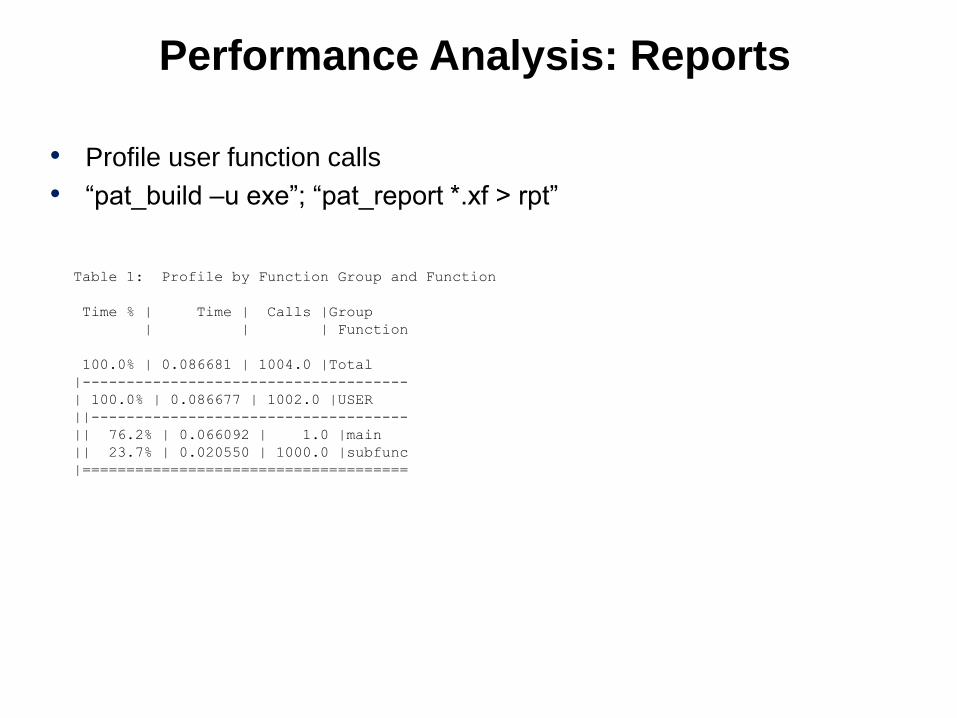
Table 1: Profile by Function Group and Function
Time % | Time | Calls |Group
| | | Function
100.0% | 0.086681 | 1004.0 |Total
|-------------------------------------
| 100.0% | 0.086677 | 1002.0 |USER
||------------------------------------
|| 76.2% | 0.066092 | 1.0 |main
|| 23.7% | 0.020550 | 1000.0 |subfunc
|=====================================
• Profile user function calls
• “pat_build –u exe”; “pat_report *.xf > rpt”

Performance Analysis: Reports
Table 1: Profile by Function Group and Function
Time % | Time | Calls |Group
| | | Function
100.0% | 0.123657 | 12005.0 |Total
|--------------------------------------
| 79.9% | 0.098813 | 10000.0 |STDIO
| | | | printf
| 20.1% | 0.024828 | 1002.0 |USER
||-------------------------------------
|| 16.9% | 0.020847 | 1000.0 |subfunc
|| 3.2% | 0.003947 | 1.0 |main
|======================================
100.0% | 0.086681 | 1004.0 |Total
|-------------------------------------
| 100.0% | 0.086677 | 1002.0 |USER
||------------------------------------
|| 76.2% | 0.066092 | 1.0 |main
|| 23.7% | 0.020550 | 1000.0 |subfunc
|=====================================
Table 2: Load Balance with MPI Message Stats
Time % | Time |Group
100.0% | 0.126971 |Total
|------------------------
| 80.0% | 0.101597 |STDIO
| 19.8% | 0.025107 |USER
|========================
• Combine MPI calls, I/O calls, memory references
• “pat_build –g mpi,io,heap exe”; “pat_report *.xf > rpt”
Table 8: File Output Stats by Filename
Write | Write MB | Write | Writes | Write |File
Name
Time | | Rate | | B/Call |
| | MB/sec | | |
0.100870 | 0.203452 | 2.016974 | 10000.000000 | 21.33 |Total
|----------------------------------------------------------------
-
| 0.100870 | 0.203452 | 2.016974 | 10000.000000 | 21.33 |stdout
|================================================================
Table 9: Wall Clock Time, Memory High Water Mark
Process | Process |Total
Time | HiMem |
| (MBytes) |
0.145398 | 22.160 |Total
|==========================

Performance Analysis: Reports
Table 1: Loop Stats from -hprofile_generate
Loop | Loop | Loop | Loop | Loop | Loop |Function=/.LOOP\.
U.B. | Hit | Trips | Trips | Trips | Notes |
Time | | Avg | Min | Max | |
100.0% | 1003 | 9991.0 | 1000 | 10000 | -- |Total
|-------------------------------------------------------------------
| 82.7% | 1 | 10000.0 | 10000 | 10000 | vector |main.LOOP.0.li.22
| 82.7% | 1 | 1000.0 | 1000 | 1000 | novec |main.LOOP.1.li.30
| 82.7% | 1 | 10000.0 | 10000 | 10000 | novec |main.LOOP.2.li.36
| 17.3% | 1000 | 10000.0 | 10000 | 10000 | vector |subfunc.LOOP.0.li.47
|===================================================================
100.0% | 0.086681 | 1004.0 |Total
|-------------------------------------
| 100.0% | 0.086677 | 1002.0 |USER
||------------------------------------
|| 76.2% | 0.066092 | 1.0 |main
|| 23.7% | 0.020550 | 1000.0 |subfunc
|=====================================
• Loop statistics
• “cc –c –h profile_generate exe.c”; “cc –o exe exe.o”;
“pat_build exe”; “pat_report *.xf > rpt”

Performance Analysis: Reports
Table 1: File Output Stats by Filename
Write | Write MB | Write | Writes | Write |File Name
Time | | Rate | | B/Call |
| | MB/sec | | |
0.108173 | 0.203452 | 1.880805 | 10000.000000 | 21.33 |Total
|-----------------------------------------------------------------
| 0.108173 | 0.203452 | 1.880805 | 10000.000000 | 21.33 |stdout
|=================================================================
• I/O statistics
• “pat_build –O write_stats exe”; “pat_report *.xf > rpt”


