
1
WWA A
1
Thcamsuofanin 1, bo
Bo
Gethrege
T
AtTh(AVoThqura
Notohomda
Algeman
WWIIRREEBIMONTHND MINER
A Review
NMR/BM
. WWiirreelliinddooeess tthh
ttoo kknnooww
he capture aan be a coight come touite in a faften difficultnd what bena completeare some
orehole and t
orehole N
enerally speae logs must
eferenced toeologist need
he probl
t the very leahis is not as Anton Wolmoorspoed mihe top and buite surprisinnge over 1,0
ow, things ho such a largeow much. Thine workingsay, dependin
though log eologists, paeasured trajnd so he nee
EELLIINNHLY BULLETRAL EXPLO
w of the tech
MR logging
nnee LLoogggghhee AAvveerraa
ww?? PPaarrtt 11
and analysismplex busino terms withmiliar envir to decide wefits will accly new prospe useful guthe borehole
Navigation
aking, wirelit at least ovo some empds and expec
lem is th
ast, the geoleasy as he arans), positning site andbottom positng...accuracy000 metres o
ave improvee test jig as here will alws). Even a reng on measur
quality has rticularly if ectory...whicds to know a
NNEE WWTIN FOR WRATION
nology
ggiinngg ‐‐ WWhh
aaggee GGeeoo nn
11 ooff 33..
s of wirelinness. A geoh a particularonment butwhat tools tcrue from thpect. Here, iuidelines one column.
n / Boreho
ne logs shouverlay. Accurirical standacts an accura
at it's of
ogist will wamight thinktioned aboud invited somtions of the y varied fromof borehole).
ed a great dethe Voorspoays be someliable refererement drift
improved aa borehole ch one to bea bit about th
WWOORRWIRELINE L
hhaatt
nneeeedd
e logs ologist ar tool t it is to run he cost in Part n the
ole Vertica
uld be precisracy is not aard. Boreholate log.
ften diffic
ant to know k. In 2005, aut 370 metrme wireline cpipe had bem 0.1% (ver
eal since theoed pipe, to e uncertaintyence jig will nduring the d
a lot in receis logged tw
elieve. The bhe available
RRKKSSHHOGGERS A
ality
se measuremas critical ase navigation
cult to co
the trajectoas an experies of PVC pcontractors ten carefully ry good inde
en, but the pprove that ay about the not always gduration of a
ent years, thwice or by tborehole navtooling and
HHOOPP AND GEOSC
ments...if yos one mightn is differen
onfirm o
ry of his borment, a Soupipe on the to log it withdeterminedeed) to abo
problem is tha particular vreal path of guarantee thea log.
he author stwo differenvigation meathe sources
CIENTISTS
ou log the hot think, partt...precision
or challen
rehole withinuth African mside of a s
h their variou by a mine sut 14% of t
hat it is difficverticality loa test well (e data becau
till hears ocnt contractosurement is of errors.
Issue 24
ENGAGED
ole twice, acicularly if this not good
nge log a
n a known emining compsteep embanus types of vesurveyor. Thhe hole leng
cult, withoutog is right or (unless it enuse errors m
ccasional coors resulting important to
– July 2017
D IN MININ
ccurate or nohe logs can d enough. T
accuracy.
rror tolerancpany, DeBeenkment at terticality tooe results wegth (1m‐140
t having accewrong and ters accessib
may vary day
mplaints froin a differeo the geolog
NG
ot, be he
.
ce. ers he ols. ere 0m
ess by ble to
om ent gist

2
Wireline navigation logs may be based on magnetometers, or some form of gyroscope, orientating a set of level cells or accelerometers.
The magnetometer‐based verticality system is far less expensive than a gyro. It may be a standalone verticality tool or part of a dipmeter or televiewer sonde. It is a continuous log of borehole tilt, with respect to vertical, and borehole azimuth, with respect to magnetic north.
This design has become very reliable in terms of calibration and ruggedness (the tooling is generally good) but its measurement is corrupted by magnetic formations and it cannot log in steel casing or drill pipe, so trajectory is rarely referenced to the borehole collar position but, most often, to base of casing.
Where possible, the geologist should plan to log the cased zone, before casing is lowered, and splice the various logs later.
Even if there are no steel casing or wedges in a borehole, the verticality log might be perturbed by local anomalous crustal magnetism and (perhaps) by atmospheric and solar magnetic phenomena. It would be wrong to overstate the effect of magnetic formations, which, very often, can damage discrete sections of the borehole azimuth log. The data curve may be subjectively but logically edited (manually) as necessary.
A presentation of tilt and azimuth data that allows some quality assurance and valid
manual editing where indicated.
In this example, it seems sensible to
correct the noise on the azimuth log at 450
metres.
This type of verticality log is a continuous log of multiple discrete standalone measurements. The logger could lower his sonde to 3,000 metres and take a single stationary measurement if he wanted to. He could log on the way into the borehole and on the way out in order to check on precision and rotational effects. Importantly, he
Boundary
Dolerite dyke

3
cofoaf
Thlogwhgelo
Thofda
It tilinvth
Hatruloth
Ta
Thre
ould also plarmations. Idfter logging a
A fieldin logr
or
he logger shogging procesheel on his wenerator) whngitudinal ax
here is usualf the tool's rata to determ
is importantt and azimutvalid to smoe entire traj
aving capturue geographcation and we Earth's sur
he main re not re
he gyroscopeeceives a log
ace his sonddeally, this a borehole.
d test jig beinots of concreteround effects)straight. The
rientation me
ould place hiss by asking hwinch (bettehile he slowlxis (without
ly some slighrotation andmine the max
t to considerth which maooth out a noectory curve
ed a navigathical north. Twith time. Lurface via the
problemeliable in
e (gyro) sonof borehole
de into a teshould be d
ng constructede (to limit pro). The PVC pipe client is invitasured and cl
is sonde in thhis assistant er still by usy rotates thlifting it off t
ht sine waved it is possibximum and t
Tilt and a
r the log aboay be edited oisy section be below that
tion log referThe correctiuckily, it is nointernet.
ms with mn magnet
nde may be deviation fro
est jig on odone before
d from PVC pioximity to mape must be stited to have thlearly marked
he jig and mto turn the ding a depth e sonde abothe low side)
e effect as a ble to procestypical error
azimuth logs f
ove. It is not before procbecause the depth. The c
renced to maon, an additow quite eas
magnetotic rocks
run througom collar to
r near site e and
ipe set agnetic iff and he jig's d on it.
imic a depth pulse out its ).
result ss the boxes to be
from two too
a log of trajessing furtheerror causecorrection m
agnetic norttion of the psy to researc
ometer‐band can
gh steel casiend of hole,
and confirm
displayed on
ols rotated in a
ectory at thier. If it wered by the noi
must be done
h, it is necesprevailing mch the curren
based venot be ru
ng (there is, which is a b
m its accurac
n the log.
a PVC jig.
is stage but ie a borehole se would hae before the l
ssary to corremagnetic decnt "magnetic
rticality un throu
s no magnetbig advantage
cy in magne
individual lotrajectory love affected tlogs are com
ect it to be wlination, varc declination
logs are ugh steel
tometer) soe.
etically beni
gs of borehoog, it would the location
mbined.
with respect ries with colof a point"
that the casing.
the geolog
gn
ole be of
to lar on
ey
gist
4
Another advantage is that the driller does not have to pull out his drilling rods. The gyro sonde may be deployed inside the rods.
The gyroscopic Inertial Navigation System, in its many forms, has been the standard for gyro logging in recent years. Directionally, the gyro exhibits inertia. The Earth moves and the sonde moves with respect to the Earth. Both move with respect to the unchanging orientation of the gimballed gyroscope.
The INS log is a continuous measurement that is based on tool face alignment to a surface reference before and after logging. There is always measurement drift during the log that is caused by the Earth's rotation. This drift is measured in terms of total drift and varying rate of drift during the log. The difference between the aggregate of the in‐hole drift checks and the total drift measured at surface is called closure.
There will be a small error caused by uncertain drift between drift check stations. Tool manufacturers admit to 10 degrees per 3 hours as a typical error. Since the tool is usually run within 1 hour in mineral boreholes and the system records an up‐log and a down‐log to share the error, there should be a high degree of accuracy.
Usually, the deeper the hole / longer the log duration, the greater the closure. It can be reduced by judicious editing of drift check values...sometimes, due to tool movement, you get one or two that are obviously anomalous.
A navigation log derived from INS gyro data is mostly very accurate but, if the geologist requires log quality assurance, he has to make a test well available to the logger (difficult to certify). Even then, small navigational errors (variable drift effects) are unique per log run.
The INS system requires some user input, such as aligning the sonde correctly. Drift errors are minimised by careful procedural discipline.
Recent INS sondes include special filters that reduce drift effects thus greatly improving accuracy.
The north‐seeking gyro sonde provide the geologist with a verticality log through steel rods and casing (as with INS, the complete borehole may be surveyed with respect to a surface collar). They do not rely on a start and finish directional reference nor are they affected by measurement drift accumulation over time. Their measurements are referenced to geographical north.
The mineral north‐seeking gyro sonde may be a spinning mass gyro or one of the more recent ring laser or fibre optic designs. In slim mineral tools, the log comprises is a series of unique stand‐alone stationary measurements made with respect to its estimation of true north (continuous north‐seeking normally requires a triaxial platform which is usually a bit too large for slim tool diameters). This takes about two minutes, or longer at high latitudes where the point on the Earth's surface is moving more slowly than it is nearer to the Equator. The client can decide on station frequency or can limit the measurement to a short length of borehole...a deflection perhaps.
As with the magnetometer verticality tool, the logger can lower his sonde and take a unique measurement in the borehole ... or in a test jig at the surface. Speed between stations is unlimited and the logger can log on the way down then confirm precision with a log on the way out of the borehole. Logging programs sort the data points by depth.

5
The tool requires is the latitude of the borehole collar location. Each survey station measured by a north‐seeking gyrocompass is independent so station to station coherence offers some QA (see the log below).
The north‐seeking gyro sonde is relatively expensive but it offers a high degree of repeatability as well as log quality assurance, if required, based on an orientated surface test jig.
A north‐seeking fibre‐optic gyro log with stations every 5 metres overlaid by logs from a televiewer sonde
The advice to the geologist is that no navigation tool is perfect but, nowadays, barring malfunction or operator error, they are all pretty good. It is generally agreed that, given a robust design and ongoing development of solid state systems, a slim version of the continuous north‐seeking option offers the best solution long term.
All navigation systems have developed a lot since the Voorspoed test. Unfortunately, that test jig was dismantled to make way for mining. A similar certified test site would be welcomed by the industry.
What condition is the borehole in?
The geologist should consider the borehole condition before instructing his logging contractor to lower an expensive or radioactive sonde...not least because, in many contracts, he will have to pick up the bill for lost or damaged equipment.
There is the option to run a dummy sonde before measuring anything. That can be done quite quickly and is recommended for boreholes drilled in unfamiliar ground...the first few holes in a new prospect before the logger can assess the risk of borehole collapse.
The next run would be the three‐arm caliper sonde...offering a very accurate measure of borehole diameter. Even that may be dispensed with in high volume jobs where the logger knows his ground and rig time is a factor. It is not wise to lower a radioactive sonde into a small diameter,

6
deep, hard‐rock borehole without first running a caliper sonde. One hard pebble can trap the sonde. The caliper not only describes caving but dislodges most pebbles that might be teetering on the point of falling inwards.
The caliper log describes spalling (as a result of the drilling process), open fractures and borehole volume, which is useful for grouting operations and critical to some grade estimations (diamond carats per cubic metre for instance).
The logger might also offer a two‐arm caliper (on the right) or a four‐arm device with independent arms or independent pairs of arms (dual axis).
A one‐arm caliper logger is created by removing the source from a sidewall density sonde. This might at first seem laughable, who needs a one‐arm caliper tool when a two or three‐arm option is available? Well, maybe they are not available...damaged in transit. Or perhaps the borehole is at such an angle from vertical that the three‐arms will not support the sonde and so are understating hole diameter. The one caliper arm does not support the weight of the sonde, which sits conveniently on the low side of the hole.
The two‐arm version finds the largest borehole diameter, locking into vertically aligned breakout (spalling that occurs perpendicular to the maximum stress orientation). It is therefore very useful to measure depth of breakout, identified and orientated by a televiewer log. In deep mine development, the depth of breakout generated by the pilot hole is proportional to the tonnes of rock that will leave the side of a sinking mine shaft.
The more expensive four‐arm device is a better measure of borehole cross‐section and volume but capturing a log is not always straightforward. Refer to issue 21, January 2017.
If the four‐arm sonde has a verticality tool attached, in alignment with the caliper pair axes, the logger may offer a Borehole Geometry Tool; logs of borehole deviation, borehole diameter, borehole ovality and the orientation of breakout plus natural gamma, all in one run. There are not many of these BGT sondes around but there are plenty of redundant four‐arm dipmeter sondes out there that can be converted (arms instead of pads).
Most three‐arm caliper tools may be run with temperature and natural gamma subs added. This is the ideal first‐run sonde for deep exploration logging.
The writer was recently asked to log the volume of over twenty bored pile conduits at a construction site somewhere in Africa. There are two big issues, one is freighting the kit to site (always tricky) and the second is the special manufacture of extra long caliper arms that are capable of logging to over one metre diameter. The longest arms are 77.5 centimetres pivot to tip. A set of three made from stainless steel would weigh down on the caliper spring too much so it was decided to make these and the intermediate 62.5 centimetre arms from aluminium. Operations are ongoing.
7
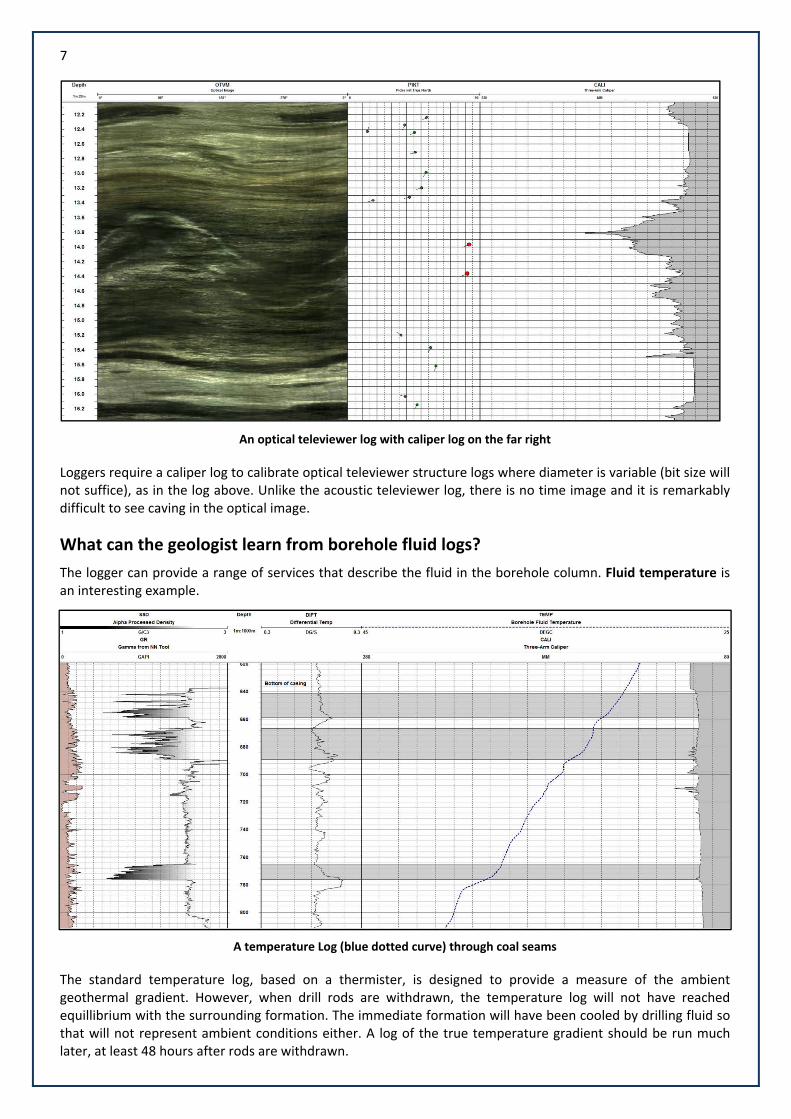
An optical televiewer log with caliper log on the far right
Loggers require a caliper log to calibrate optical televiewer structure logs where diameter is variable (bit size will not suffice), as in the log above. Unlike the acoustic televiewer log, there is no time image and it is remarkably difficult to see caving in the optical image.
What can the geologist learn from borehole fluid logs?
The logger can provide a range of services that describe the fluid in the borehole column. Fluid temperature is an interesting example.
A temperature Log (blue dotted curve) through coal seams
The standard temperature log, based on a thermister, is designed to provide a measure of the ambient geothermal gradient. However, when drill rods are withdrawn, the temperature log will not have reached equillibrium with the surrounding formation. The immediate formation will have been cooled by drilling fluid so that will not represent ambient conditions either. A log of the true temperature gradient should be run much later, at least 48 hours after rods are withdrawn.
8
The inrush of groundwater caused by the lowering of the fluid level as rods are withdrawn will occur at permeable or fractured zones.
The depth of these zones may be determined using differential temperature (water entering the column is usually warmer than drilling fluid). So the temperature tool might be run twice, for quite different applications, once immediately after rods are withdrawn and once 48 hours later. See Bulletin Issue 14 (November 2015).
The ambient temperature curve is modified by local changes in the thermal conductivity of the formation. Some metallic minerals have noticeably higher conductivity, which results in anomalous features on the log.
Coal has low conductivity and acts as an insulator, as can be seen on the log shown at the bottom of the previous page.
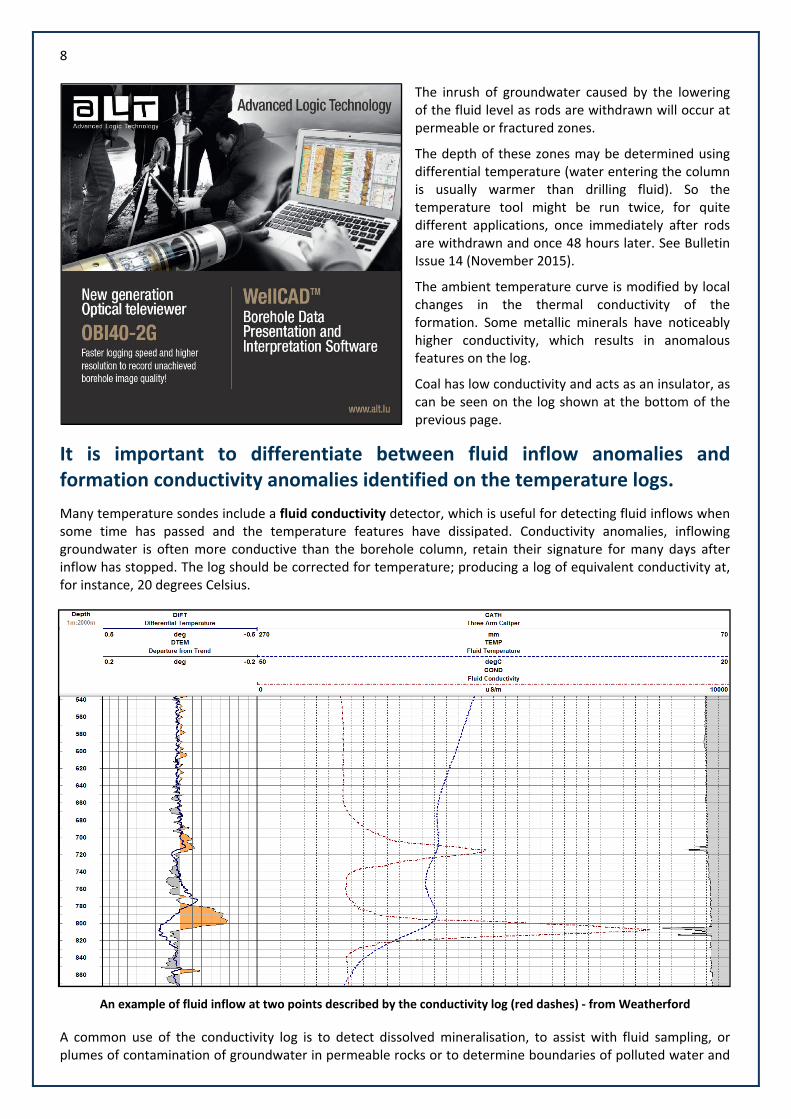
It is important to differentiate between fluid inflow anomalies and formation conductivity anomalies identified on the temperature logs.
Many temperature sondes include a fluid conductivity detector, which is useful for detecting fluid inflows when some time has passed and the temperature features have dissipated. Conductivity anomalies, inflowing groundwater is often more conductive than the borehole column, retain their signature for many days after inflow has stopped. The log should be corrected for temperature; producing a log of equivalent conductivity at, for instance, 20 degrees Celsius.
An example of fluid inflow at two points described by the conductivity log (red dashes) ‐ from Weatherford
A common use of the conductivity log is to detect dissolved mineralisation, to assist with fluid sampling, or plumes of contamination of groundwater in permeable rocks or to determine boundaries of polluted water and

9
fresh water in wells or mine shafts. If a polluting ingress point is identified, the logger can lower his fluid capture sonde to take a sample at the exact depth of the ingress. So, we get ingress depth, to correlate with other logs, and water quality at that depth.
This kind of continuous objective survey may be performed on multiple occasions over time in specially drilled monitoring wells.
There is the option of logging a water quality sonde instead of fluid sampling. In this case, the geologist or hydrologist gets his data immediately on site, instead of waiting for a laboratory. The measurement list is comprehensive...temperature, conductivity, pressure, dissolved, oxygen, pH, oxidation reduction potential (redox), ammonia and chloride. This is a log of groundwater properties, ideal for water quality monitoring and pollution studies.
The geologist or hydrologist has the option of determining flow rates within the borehole column, either natural or induced flows. Usually, natural flow rates between aquifers are quite subtle and, in order to be measured, require a tracer device such as a heat‐pulse flowmeter sonde. This type of sonde makes a stationary measurement of upward or downward flows by timing the transit of heated fluid from element to sensor. The sensitivity is limited by the length of time the heat pulse is retained by the fluid but rates as low as 5 centimetres per minute. The upper limit is around 5 metres per minute.
A "spinner" (Mount Sopris Instruments)
For flows above 2 metres per minute, which might be induced by pumping in (pressuring) or out (depressuring) of the borehole, a mechanical device caller an impeller flowmeter is the best option. Depending on formation transmissivity, a pressure imbalance can result in very rapid water flows and their measurement is an important component of geotechnical logging.
Flow rates up and down a borehole may be calibrated by reference to winch speed and a three‐arm caliper log. The sonde is normally trolled along the borehole so that a continuous log of flow is captured. Ingress/egress from an open fracture, for instance, results in a measurable step on a log.
Induced flow (hard rock / fracture ingress) from an impeller flowmeter
That concludes Part 1 (describing the borehole and borehole column) of a three part series on the basics that every Geo should know. Next time we look at the physical properties of the formation.
10
22.. MMeeaassuurreemmeenntt FFooccuuss
A review of one wireline log measurement
The Nuclear Magnetic Resonance Log (NMR)
This nuclear measurement should not frighten a potential client...there is no radioactive source. The sonde does include a strong permanent magnet and it also applies a (secondary) resonant or pulsed electromagnetic field at a particular frequency.
The NMR sonde is designed to quantify and characterise porosity and infer permeability by measuring RF energy emitted by hydrogen atoms as they relax after induced precession. An RF transmitter/receiver is tuned to detect hydrogen only, it ignores other atoms...so we are looking at hydrogen in water, (and oil and gas, but we mineral loggers concentrate on water). The rock matrix is not included (it is included by other porosity indicators, those based on density, sonic, neutron and resistivity) and that is the key attribute of the NMR technique.
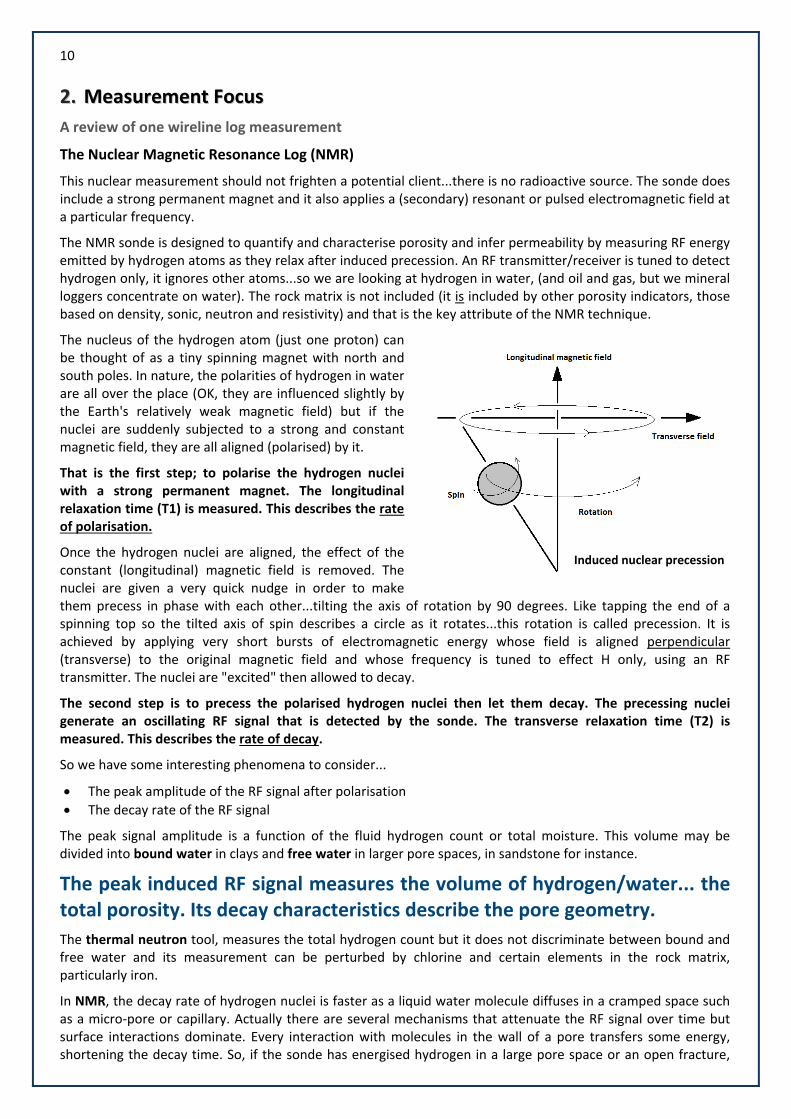
The nucleus of the hydrogen atom (just one proton) can be thought of as a tiny spinning magnet with north and south poles. In nature, the polarities of hydrogen in water are all over the place (OK, they are influenced slightly by the Earth's relatively weak magnetic field) but if the nuclei are suddenly subjected to a strong and constant magnetic field, they are all aligned (polarised) by it.
That is the first step; to polarise the hydrogen nuclei with a strong permanent magnet. The longitudinal relaxation time (T1) is measured. This describes the rate of polarisation.
Once the hydrogen nuclei are aligned, the effect of the constant (longitudinal) magnetic field is removed. The nuclei are given a very quick nudge in order to make them precess in phase with each other...tilting the axis of rotation by 90 degrees. Like tapping the end of a spinning top so the tilted axis of spin describes a circle as it rotates...this rotation is called precession. It is achieved by applying very short bursts of electromagnetic energy whose field is aligned perpendicular (transverse) to the original magnetic field and whose frequency is tuned to effect H only, using an RF transmitter. The nuclei are "excited" then allowed to decay.
The second step is to precess the polarised hydrogen nuclei then let them decay. The precessing nuclei generate an oscillating RF signal that is detected by the sonde. The transverse relaxation time (T2) is measured. This describes the rate of decay.
So we have some interesting phenomena to consider...
The peak amplitude of the RF signal after polarisation
The decay rate of the RF signal
The peak signal amplitude is a function of the fluid hydrogen count or total moisture. This volume may be divided into bound water in clays and free water in larger pore spaces, in sandstone for instance.
The peak induced RF signal measures the volume of hydrogen/water... the total porosity. Its decay characteristics describe the pore geometry.
The thermal neutron tool, measures the total hydrogen count but it does not discriminate between bound and free water and its measurement can be perturbed by chlorine and certain elements in the rock matrix, particularly iron.
In NMR, the decay rate of hydrogen nuclei is faster as a liquid water molecule diffuses in a cramped space such as a micro‐pore or capillary. Actually there are several mechanisms that attenuate the RF signal over time but surface interactions dominate. Every interaction with molecules in the wall of a pore transfers some energy, shortening the decay time. So, if the sonde has energised hydrogen in a large pore space or an open fracture,
Induced nuclear precession
11
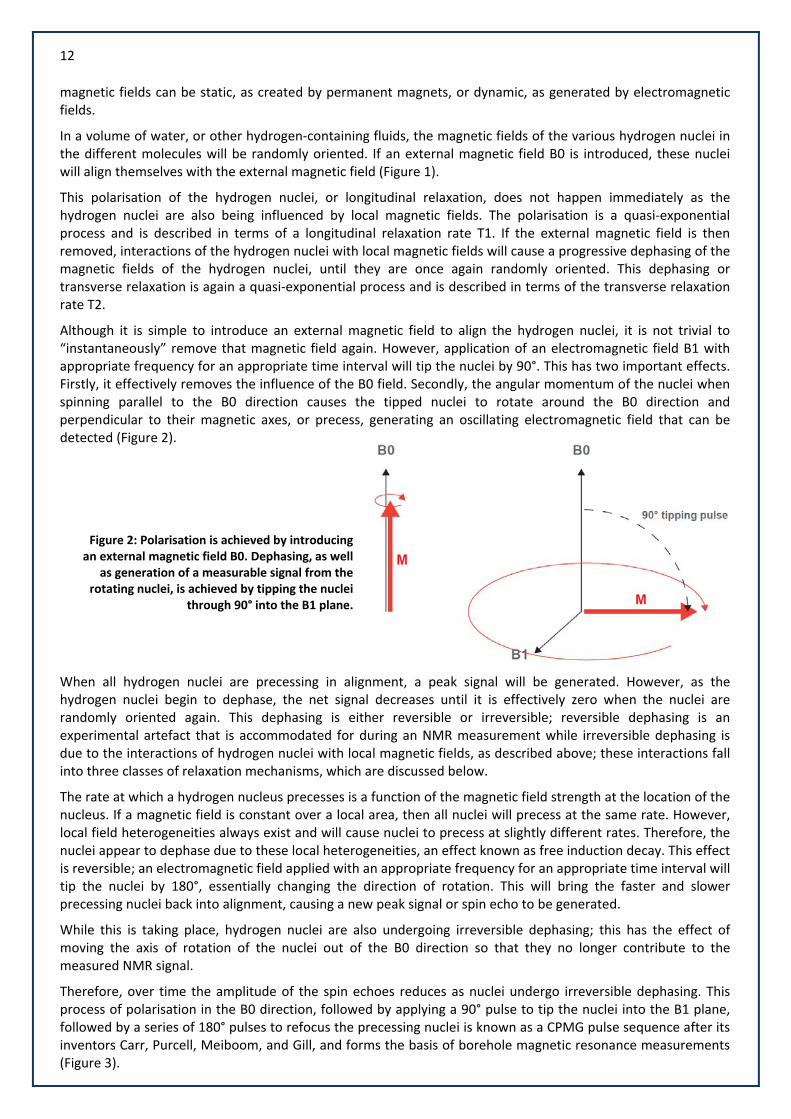
Figure 1: An NMR measurement involves two phases, polarisation and dephasing, each characterised by their own relaxation rate.
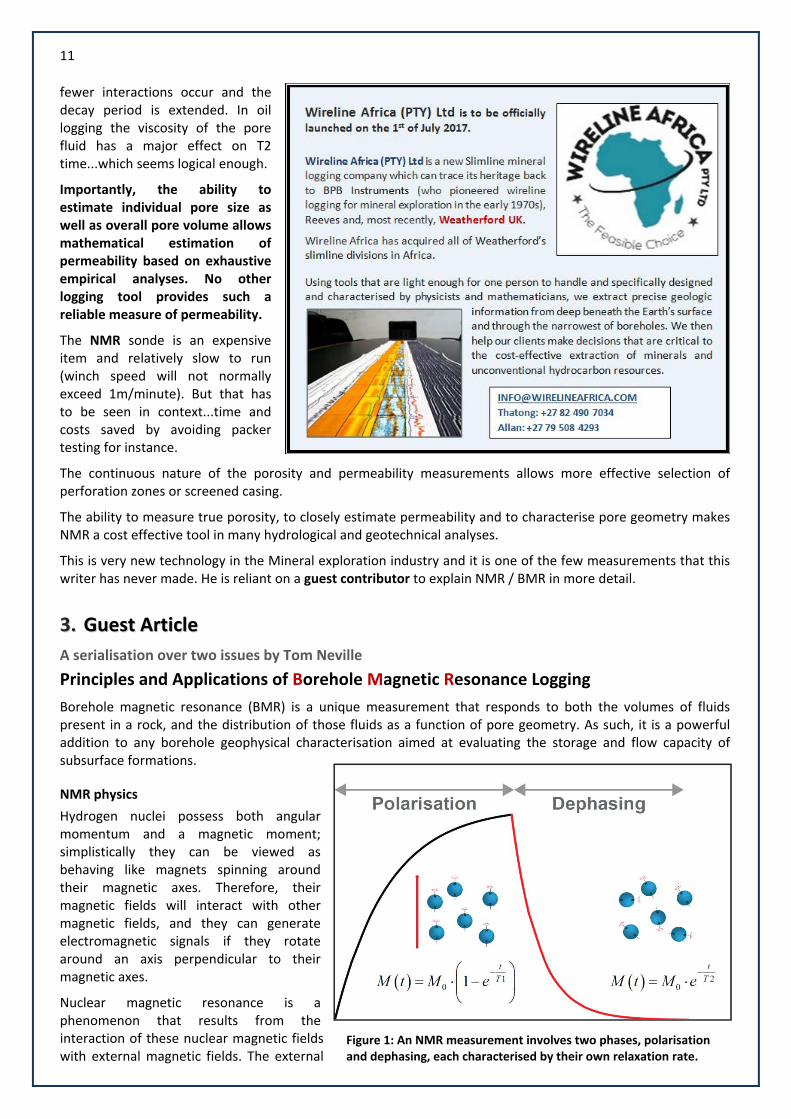
fewer interactions occur and the decay period is extended. In oil logging the viscosity of the pore fluid has a major effect on T2 time...which seems logical enough.
Importantly, the ability to estimate individual pore size as well as overall pore volume allows mathematical estimation of permeability based on exhaustive empirical analyses. No other logging tool provides such a reliable measure of permeability.
The NMR sonde is an expensive item and relatively slow to run (winch speed will not normally exceed 1m/minute). But that has to be seen in context...time and costs saved by avoiding packer testing for instance.
The continuous nature of the porosity and permeability measurements allows more effective selection of perforation zones or screened casing.
The ability to measure true porosity, to closely estimate permeability and to characterise pore geometry makes NMR a cost effective tool in many hydrological and geotechnical analyses.
This is very new technology in the Mineral exploration industry and it is one of the few measurements that this writer has never made. He is reliant on a guest contributor to explain NMR / BMR in more detail.
33.. GGuueesstt AArrttiiccllee A serialisation over two issues by Tom Neville
Principles and Applications of Borehole Magnetic Resonance Logging
Borehole magnetic resonance (BMR) is a unique measurement that responds to both the volumes of fluids present in a rock, and the distribution of those fluids as a function of pore geometry. As such, it is a powerful addition to any borehole geophysical characterisation aimed at evaluating the storage and flow capacity of subsurface formations.
NMR physics
Hydrogen nuclei possess both angular momentum and a magnetic moment; simplistically they can be viewed as behaving like magnets spinning around their magnetic axes. Therefore, their magnetic fields will interact with other magnetic fields, and they can generate electromagnetic signals if they rotate around an axis perpendicular to their magnetic axes.
Nuclear magnetic resonance is a phenomenon that results from the interaction of these nuclear magnetic fields with external magnetic fields. The external
12
magnetic fields can be static, as created by permanent magnets, or dynamic, as generated by electromagnetic fields.
In a volume of water, or other hydrogen‐containing fluids, the magnetic fields of the various hydrogen nuclei in the different molecules will be randomly oriented. If an external magnetic field B0 is introduced, these nuclei will align themselves with the external magnetic field (Figure 1).
This polarisation of the hydrogen nuclei, or longitudinal relaxation, does not happen immediately as the hydrogen nuclei are also being influenced by local magnetic fields. The polarisation is a quasi‐exponential process and is described in terms of a longitudinal relaxation rate T1. If the external magnetic field is then removed, interactions of the hydrogen nuclei with local magnetic fields will cause a progressive dephasing of the magnetic fields of the hydrogen nuclei, until they are once again randomly oriented. This dephasing or transverse relaxation is again a quasi‐exponential process and is described in terms of the transverse relaxation rate T2.
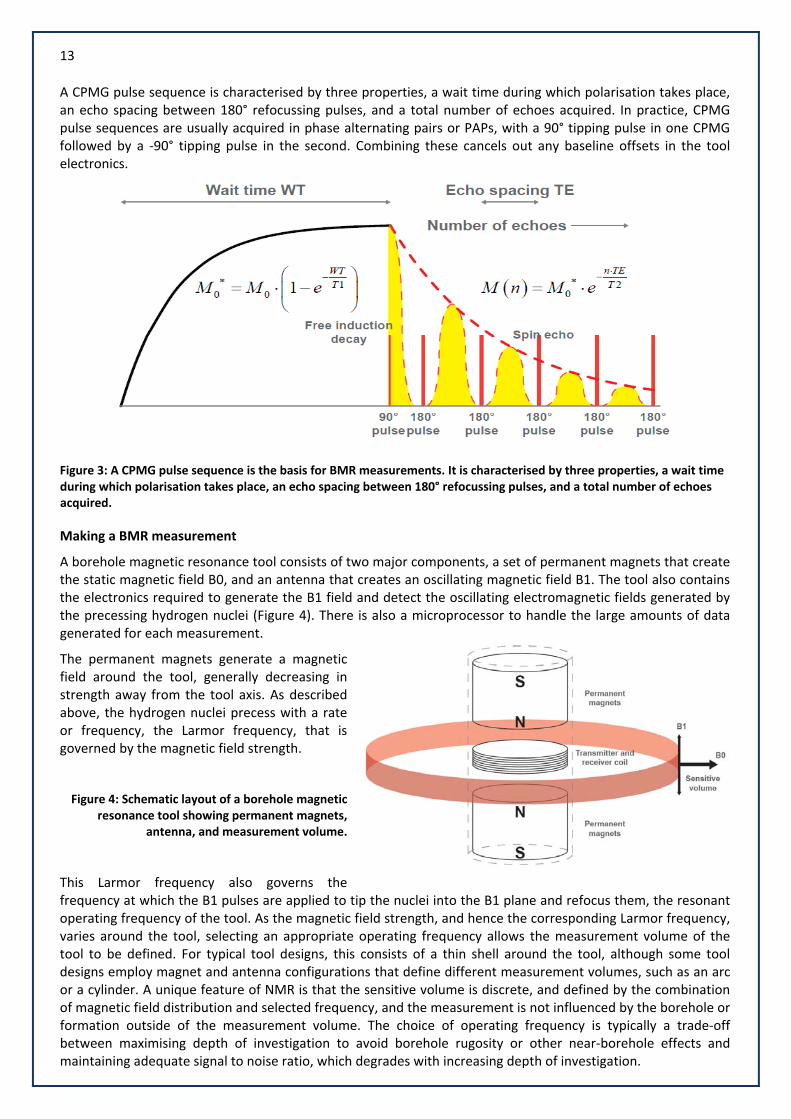
Although it is simple to introduce an external magnetic field to align the hydrogen nuclei, it is not trivial to “instantaneously” remove that magnetic field again. However, application of an electromagnetic field B1 with appropriate frequency for an appropriate time interval will tip the nuclei by 90°. This has two important effects. Firstly, it effectively removes the influence of the B0 field. Secondly, the angular momentum of the nuclei when spinning parallel to the B0 direction causes the tipped nuclei to rotate around the B0 direction and perpendicular to their magnetic axes, or precess, generating an oscillating electromagnetic field that can be detected (Figure 2).
Figure 2: Polarisation is achieved by introducing an external magnetic field B0. Dephasing, as well
as generation of a measurable signal from the rotating nuclei, is achieved by tipping the nuclei
through 90° into the B1 plane.
When all hydrogen nuclei are precessing in alignment, a peak signal will be generated. However, as the hydrogen nuclei begin to dephase, the net signal decreases until it is effectively zero when the nuclei are randomly oriented again. This dephasing is either reversible or irreversible; reversible dephasing is an experimental artefact that is accommodated for during an NMR measurement while irreversible dephasing is due to the interactions of hydrogen nuclei with local magnetic fields, as described above; these interactions fall into three classes of relaxation mechanisms, which are discussed below.
The rate at which a hydrogen nucleus precesses is a function of the magnetic field strength at the location of the nucleus. If a magnetic field is constant over a local area, then all nuclei will precess at the same rate. However, local field heterogeneities always exist and will cause nuclei to precess at slightly different rates. Therefore, the nuclei appear to dephase due to these local heterogeneities, an effect known as free induction decay. This effect is reversible; an electromagnetic field applied with an appropriate frequency for an appropriate time interval will tip the nuclei by 180°, essentially changing the direction of rotation. This will bring the faster and slower precessing nuclei back into alignment, causing a new peak signal or spin echo to be generated.
While this is taking place, hydrogen nuclei are also undergoing irreversible dephasing; this has the effect of moving the axis of rotation of the nuclei out of the B0 direction so that they no longer contribute to the measured NMR signal.
Therefore, over time the amplitude of the spin echoes reduces as nuclei undergo irreversible dephasing. This process of polarisation in the B0 direction, followed by applying a 90° pulse to tip the nuclei into the B1 plane, followed by a series of 180° pulses to refocus the precessing nuclei is known as a CPMG pulse sequence after its inventors Carr, Purcell, Meiboom, and Gill, and forms the basis of borehole magnetic resonance measurements (Figure 3).
13
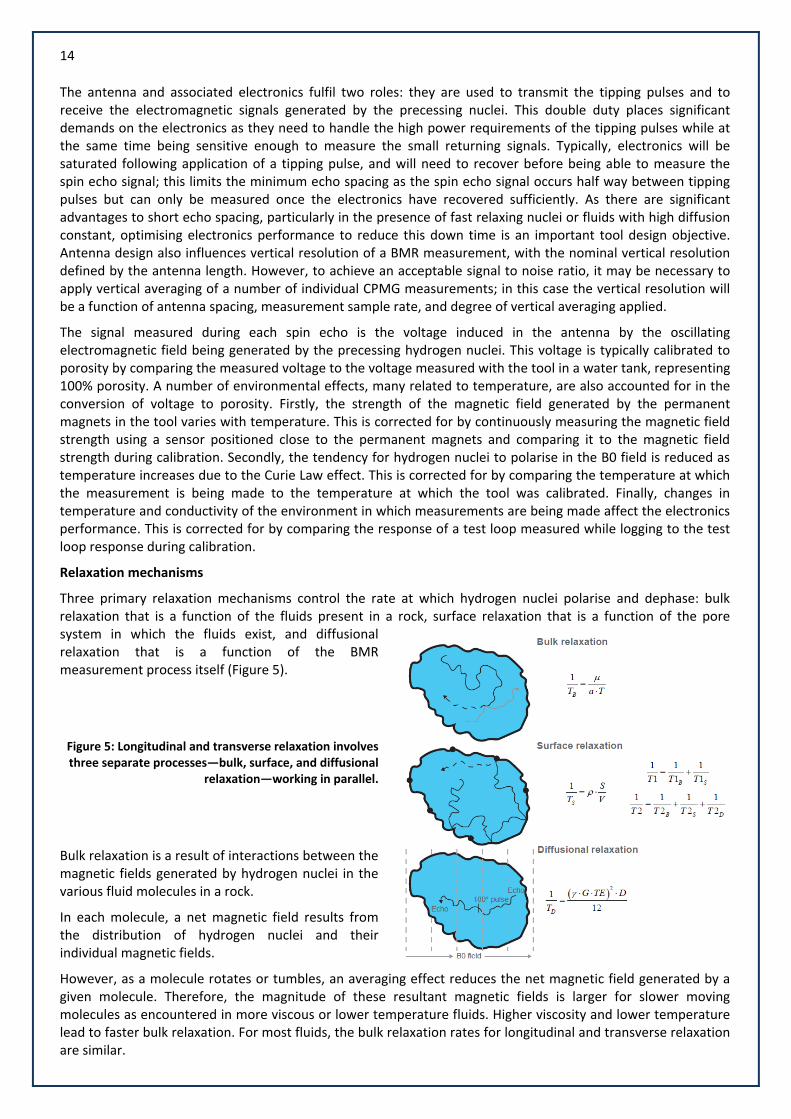
A CPMG pulse sequence is characterised by three properties, a wait time during which polarisation takes place, an echo spacing between 180° refocussing pulses, and a total number of echoes acquired. In practice, CPMG pulse sequences are usually acquired in phase alternating pairs or PAPs, with a 90° tipping pulse in one CPMG followed by a ‐90° tipping pulse in the second. Combining these cancels out any baseline offsets in the tool electronics.
Figure 3: A CPMG pulse sequence is the basis for BMR measurements. It is characterised by three properties, a wait time during which polarisation takes place, an echo spacing between 180° refocussing pulses, and a total number of echoes acquired.
Making a BMR measurement
A borehole magnetic resonance tool consists of two major components, a set of permanent magnets that create the static magnetic field B0, and an antenna that creates an oscillating magnetic field B1. The tool also contains the electronics required to generate the B1 field and detect the oscillating electromagnetic fields generated by the precessing hydrogen nuclei (Figure 4). There is also a microprocessor to handle the large amounts of data generated for each measurement.
The permanent magnets generate a magnetic field around the tool, generally decreasing in strength away from the tool axis. As described above, the hydrogen nuclei precess with a rate or frequency, the Larmor frequency, that is governed by the magnetic field strength.
Figure 4: Schematic layout of a borehole magnetic resonance tool showing permanent magnets,
antenna, and measurement volume.
This Larmor frequency also governs the frequency at which the B1 pulses are applied to tip the nuclei into the B1 plane and refocus them, the resonant operating frequency of the tool. As the magnetic field strength, and hence the corresponding Larmor frequency, varies around the tool, selecting an appropriate operating frequency allows the measurement volume of the tool to be defined. For typical tool designs, this consists of a thin shell around the tool, although some tool designs employ magnet and antenna configurations that define different measurement volumes, such as an arc or a cylinder. A unique feature of NMR is that the sensitive volume is discrete, and defined by the combination of magnetic field distribution and selected frequency, and the measurement is not influenced by the borehole or formation outside of the measurement volume. The choice of operating frequency is typically a trade‐off between maximising depth of investigation to avoid borehole rugosity or other near‐borehole effects and maintaining adequate signal to noise ratio, which degrades with increasing depth of investigation.
14
The antenna and associated electronics fulfil two roles: they are used to transmit the tipping pulses and to receive the electromagnetic signals generated by the precessing nuclei. This double duty places significant demands on the electronics as they need to handle the high power requirements of the tipping pulses while at the same time being sensitive enough to measure the small returning signals. Typically, electronics will be saturated following application of a tipping pulse, and will need to recover before being able to measure the spin echo signal; this limits the minimum echo spacing as the spin echo signal occurs half way between tipping pulses but can only be measured once the electronics have recovered sufficiently. As there are significant advantages to short echo spacing, particularly in the presence of fast relaxing nuclei or fluids with high diffusion constant, optimising electronics performance to reduce this down time is an important tool design objective. Antenna design also influences vertical resolution of a BMR measurement, with the nominal vertical resolution defined by the antenna length. However, to achieve an acceptable signal to noise ratio, it may be necessary to apply vertical averaging of a number of individual CPMG measurements; in this case the vertical resolution will be a function of antenna spacing, measurement sample rate, and degree of vertical averaging applied.
The signal measured during each spin echo is the voltage induced in the antenna by the oscillating electromagnetic field being generated by the precessing hydrogen nuclei. This voltage is typically calibrated to porosity by comparing the measured voltage to the voltage measured with the tool in a water tank, representing 100% porosity. A number of environmental effects, many related to temperature, are also accounted for in the conversion of voltage to porosity. Firstly, the strength of the magnetic field generated by the permanent magnets in the tool varies with temperature. This is corrected for by continuously measuring the magnetic field strength using a sensor positioned close to the permanent magnets and comparing it to the magnetic field strength during calibration. Secondly, the tendency for hydrogen nuclei to polarise in the B0 field is reduced as temperature increases due to the Curie Law effect. This is corrected for by comparing the temperature at which the measurement is being made to the temperature at which the tool was calibrated. Finally, changes in temperature and conductivity of the environment in which measurements are being made affect the electronics performance. This is corrected for by comparing the response of a test loop measured while logging to the test loop response during calibration.
Relaxation mechanisms
Three primary relaxation mechanisms control the rate at which hydrogen nuclei polarise and dephase: bulk relaxation that is a function of the fluids present in a rock, surface relaxation that is a function of the pore system in which the fluids exist, and diffusional relaxation that is a function of the BMR measurement process itself (Figure 5).
Figure 5: Longitudinal and transverse relaxation involves three separate processes—bulk, surface, and diffusional
relaxation—working in parallel.
Bulk relaxation is a result of interactions between the magnetic fields generated by hydrogen nuclei in the various fluid molecules in a rock.
In each molecule, a net magnetic field results from the distribution of hydrogen nuclei and their individual magnetic fields.
However, as a molecule rotates or tumbles, an averaging effect reduces the net magnetic field generated by a given molecule. Therefore, the magnitude of these resultant magnetic fields is larger for slower moving molecules as encountered in more viscous or lower temperature fluids. Higher viscosity and lower temperature lead to faster bulk relaxation. For most fluids, the bulk relaxation rates for longitudinal and transverse relaxation are similar.

15
Surface relaxation involves interactions between the magnetic fields of the hydrogen nuclei and those of paramagnetic atoms such as iron, manganese, chromium, and nickel. These atoms may occur as part of the chemical structure of the rock matrix, and so as fluid molecules move around within a pore in the rock, the hydrogen atoms in these molecules may interact with such atoms occurring close to the surfaces of the pores. Two factors control the rate at which surface relaxation takes place.
For a pore of a given volume, the higher its surface area the more likely it is that molecules will approach the pore walls, so the surface to volume ratio has a major control on the rate of surface relaxation. There is also a direct correlation between surface to volume ratio and pore size, so the rate of surface relaxation reflects pore size in a rock.
The second factor that influences the rate of surface relaxation is the abundance of paramagnetic atoms at or near the surfaces of pores; this is characterised by the surface relaxivity. Small pores and higher concentrations of paramagnetic components lead to faster surface relaxation. Rocks typically show a different surface relaxivity behaviour for longitudinal versus transverse relaxation, therefore the T1 and T2 due to surface relaxation are different.
Diffusional relaxation is an additional irreversible relaxation mechanism that takes place during dephasing, which is conceptually like the process behind free induction decay. After application of the 90° pulse that tips hydrogen nuclei into the transverse plane, the nuclei will precess with a frequency that is a function of the magnetic field strength at the location of the nuclei.
Although local field heterogeneities cause slightly different precession rates, application of the 180° pulses will bring the nuclei back into phase. However, at a larger scale, magnetic field strength reduces away from the permanent magnets that create the B0 field. As a molecule diffuses through the pore system during a CPMG measurement, it may be influenced by a different magnetic field strength, and therefore hydrogen nuclei in this molecule will be precessing with a different frequency than hydrogen nuclei in surrounding molecules that have not moved during the measurement. Therefore, subsequent 180° pulses will not bring these nuclei into phase

16
widifthtim
Fludifcy
Eafa
GuAu
Ne
MM
CCoo
ww
EEdd
FFoo
wwww
6
ith each othffusivity of te rate of diffme for molec
uids with higffusional relycle, it only c
ach of these stest mecha
uest article wustralia (http
ext Time...
Part 2 of
Processin
MMaarrccuuss CChhaattffii
ooppyyrriigghhttss aapp
wwwwww..wwiirreelliinneeww
ddiittoorr//ccoonnttaacctt::
oorr bbaacckk iissssuueess,,
wwww..wwiirreelliinneeww
er. The degrhe various flfusional relacules to diffu
gher diffusioaxation. As dontributes to
relaxation mnism; this is
written by Tops://nmrserv
the technolo
ng and Applic
iieelldd –– JJuullyy 2200
ppppllyy::
wwoorrkksshhoopp..ccoomm
:: wwiillnnaa@@wwiirreell
,, ggoo ttoo::
wwoorrkksshhoopp..ccoomm
ree of dephaluid moleculxation. It is ause between
on constants,diffusional reo transverse
mechanisms typically sur
om Neville (tvices.com.au/
ogy review
cations of BM
001177
mm//bbuulllleettiinn//ccoo
lliinneewwoorrkksshhoopp
mm//bbuulllleettiinn//aarrcc
asing due toes present; talso a functio 180° pulses
, higher magelaxation is relaxation.
operates in rface relaxati
tom@nmrse/).
MR data
ooppyyrriigghhtt
pp..ccoomm
cchhiivvee
o diffusion is the higher thon of the echs.
gnetic field ga result of m
parallel, andion.
ervices.com.a
a function ohe magnetic ho spacing, a
gradients, anmolecule mo
d so the over
au), Formatio
of the magnfield gradienas a longer ec
d longer echovement dur
rall relaxatio
on Evaluatio
etic field grant or diffusivcho spacing
ho spacings ing a CPMG
n rate is dom
n Advisor to
adient and tvity, the highprovides mo
result in fastmeasureme
minated by t
o NMR Servic
he her ore
ter ent
he
ces


