Download - IsPOD DISTRICT REPORT - NEW HANOVER 10OCT01

2010 NC IsPOD Evaluation All rights reserved.
NEW HANOVER
COUNTY
The North Carolina Alliance for Athletics, Health, Physical Education, Recreation, and Dance (NCAAHPERD), launched In-school Prevention of Obesity and
Disease (IsPOD) in 2007. The initiative began with a grant from the NC Health
and Wellness Trust Fund and was expanded with grants from the Blue Cross Blue Shield of North Carolina Foundation. The expansion to a state-wide program
is supported by a $3.6 million grant from the Kate B. Reynolds Charitable Trust. NCAAHPERD is engaged with a large network of health and physical education
groups seeking greater opportunities for a healthier and more creative North Carolina.
IsPOD Data Results
Spring 2010

2010 NC IsPOD Evaluation
Conducted by NCAAHPERD/NC DPH All rights reserved.
New Hanover County
SPARK Training
Staff from New Hanover County began receiving SPARK training in the 2008-
2009 school year with the KBR Grant. New Hanover County has 33 K-8 public
schools. Of these 33 schools, 28 schools (or 85%) have received SPARK
training. At these schools, a total of 43 PE teachers and 3 coordinators have
been trained in SPARK. Table 1 shows the New Hanover County K-8 schools
that have received SPARK training and the number of staff trained. FitnessGram
Response Rates are also given for each of the K-8 schools.

2010 NC IsPOD Evaluation Conducte4d by NCAAHPERD/NC DPH
All rights reserved.
2
Table 1
New Hanover County K-8 Schools
Schools with SPARK Training and FitnessGram Response Rates
ID School Name
DEMOGRAPHICS SPARK FITNESSGRAM
2009-2010 ADM
% Needy
SPARK Trained?
# Staff Trained
Using FG?
FG Response Rates
Grades 1-2
Grades 3-5
Grades 6-8
304 Bradley Creek Elementary 339 33% YES 1 NO 0% 0% NA
308 Carolina Beach Elem 428 16% YES 1 NO 0% 0% NA
309 Castle Hayne Elementary 415 NA YES 1 NO 0% 0% NA
310 Charles P Murray Middle 843 0% YES 2 NO NA 0% 0%
312 R Freeman Engineering 348 0% YES 1 NO 0% 0% NA
316 College Park Elementary 380 100% YES 1 NO 0% 0% NA
320 D C Virgo Middle 285 74% YES 2 NO NA NA 0%
323 Edwin A Anderson Elem 611 39% YES 1 NO 0% 0% NA
324 Edwin A Alderman Elem 279 58% YES 1 NO 0% 0% NA
325 Emma B Trask Middle 850 45% YES 3 NO NA NA 0%
328 Forest Hills Elementary 462 66% YES 1 NO 0% 0% NA
332 Gregory Elementary 396 51% NO 0 NO 0% 0% NA
338 Heyward C Bellamy Elem 608 40% YES 1 NO 0% 0% NA
339 Holly Tree Elementary 489 26% YES 1 NO 0% 0% NA
341 John J Blair Elementary 610 39% YES 1 NO 0% 0% NA
345 Lake Forest Academy 37 92% YES 1 NO 0% 0% 0%
346 Mary C Williams Elem 400 86% YES 1 NO 0% 0% NA
348 Murrayville Elementary 627 41% YES 1 NO 0% 0% NA
350 M C S Noble Middle 887 27% YES 4 NO NA NA 0%
351 Myrtle Grove Middle 962 32% YES 3 NO NA NA 0%
353 Dr Hubert Eaton Sr Elem 576 13% YES 1 NO 0% 0% NA
354 Lakeside 70 100% NO 0 NO NA NA 0%
356 Ogden Elementary 666 13% NO 0 NO 0% 0% NA
362 Pine Valley Elementary 553 39% YES 1 NO 0% 0% NA
364 Roland-Grise Middle 763 40% YES 4 NO NA NA 0%
366 Dr John Codington Elem 528 14% YES 1 NO 0% 0% NA
368 Sunset Park Elementary 306 93% YES 1 NO 0% 0% NA
380 Walter L Parsley Elem 602 15% NO 0 NO 0% 0% NA
384 A H Snipes Acad of Arts 491 94% YES 1 NO 0% 0% NA
392 Williston Middle 600 74% YES 4 NO NA NA 0%
400 Winter Park Model Elem 336 75% YES 1 NO 0% 0% NA
404 Wrightsboro Elementary 470 57% NO 0 NO 0% 0% NA
408 Wrightsville Beach Elem 320 6% YES 1 NO 0% 0% NA
2010 NC IsPOD Evaluation Conducted by NCAAHPERD/NC DPH
All rights reserved.
3
New Hanover County
FitnessGram Response Rates
In spring 2010, none of the New Hanover County K-8 schools conducted
FitnessGram assessments and submitted their data. Table 2 shows the
FitnessGram Response Rates by grade for all New Hanover County K-8 schools
combined.

2010 NC IsPOD Evaluation Conducte4d by NCAAHPERD/NC DPH
All rights reserved.
4
Table 2
FitnessGram Response Rates
For 0 K-8 Schools in New Hanover County
Grade 2009-2010
Average Daily Membership
FitnessGram Response Rate
Number of FG Student Ids
Percent of ADM
1st 1970 0 0%
2nd 1883 0 0%
3rd 1925 0 0%
4th 1964 0 0%
5th 1786 0 0%
6th 1739 0 0%
7th 1761 0 0%
8th 1716 0 0%

2010 NC IsPOD Evaluation Conducted by NCAAHPERD/NC DPH
All rights reserved.
5
Body Mass Index (BMI)
North Carolina
Spring 2010 Percent in Health Fitness Zone (HFZ)
FitnessGram Results for 370 NC K-8 Schools in 61 NC Counties
Grade
Percent in HFZ Counts in HFZ
Female Male
Female Male
Total FG Results
N in HFZ Total FG Results
N in HFZ
1st 56% 57% 937 528 884 500
2nd 55% 57% 1175 642 1209 689
3rd 57% 55% 9670 5556 10075 5558
4th 54% 52% 9624 5227 10103 5260
5th 53% 51% 9396 4961 9857 5043
6th 54% 50% 3528 1893 3550 1785
7th 57% 52% 3315 1897 3149 1644
8th 56% 54% 3174 1780 3321 1802
56%
55% 57%
54%
53%
54% 57%
56%
57%
57%
55%
52%
51%
50%
52%
54%
0%
10%
20%
30%
40%
50%
60%
70%
80%
90%
100%
1st 2nd 3rd 4th 5th 6th 7th 8th
Pe
rce
nt
in H
FZ
Grade
Female Male

2010 NC IsPOD Evaluation Conducte4d by NCAAHPERD/NC DPH
All rights reserved.
6
Body Mass Index (BMI)
New Hanover County
Spring 2010 Percent in Healthy Fitness Zone (HFZ)
FitnessGram Results for 0 K-8 Schools in New Hanover County
Grade
Percent in HFZ Counts in HFZ
Female Male
Female Male
Total FG Results
N in HFZ Total FG Results
N in HFZ
1st NA NA 0 0 0 0
2nd NA NA 0 0 0 0
3rd NA NA 0 0 0 0
4th NA NA 0 0 0 0
5th NA NA 0 0 0 0
6th NA NA 0 0 0 0
7th NA NA 0 0 0 0
8th NA NA 0 0 0 0
2010 NC IsPOD Evaluation Conducted by NCAAHPERD/NC DPH
All rights reserved.
7
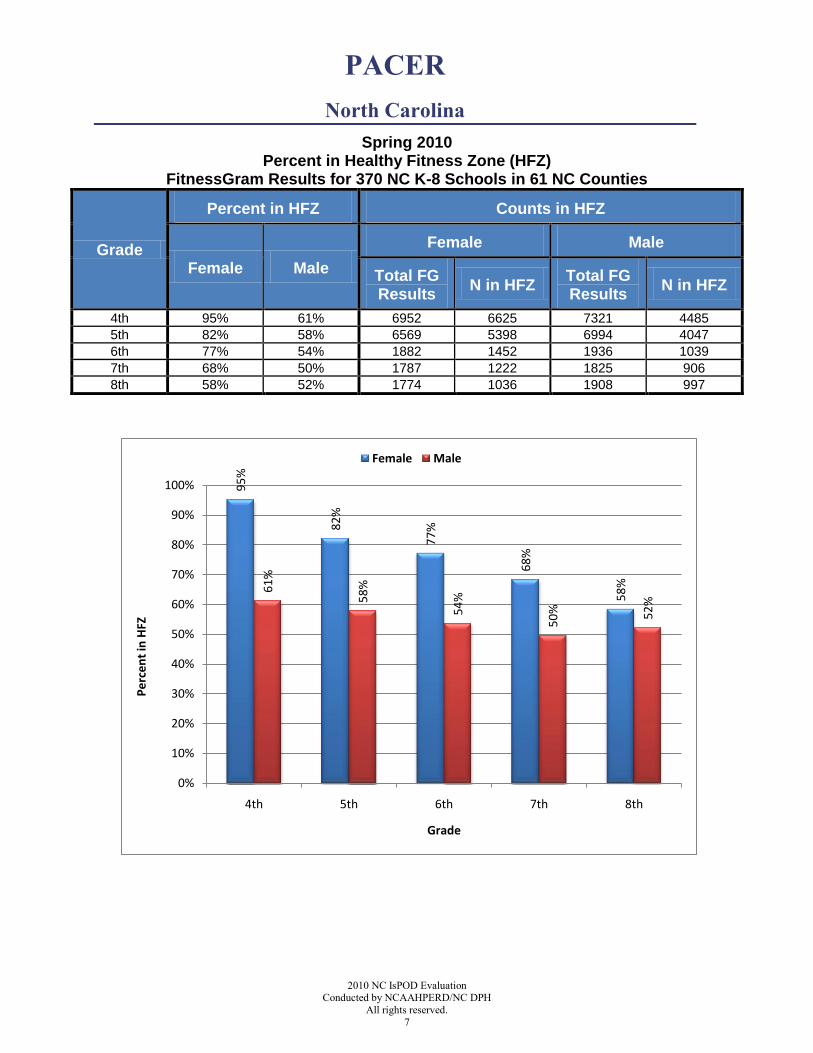
PACER
North Carolina
Spring 2010 Percent in Healthy Fitness Zone (HFZ)
FitnessGram Results for 370 NC K-8 Schools in 61 NC Counties
Grade
Percent in HFZ Counts in HFZ
Female Male
Female Male
Total FG Results
N in HFZ Total FG Results
N in HFZ
4th 95% 61% 6952 6625 7321 4485
5th 82% 58% 6569 5398 6994 4047
6th 77% 54% 1882 1452 1936 1039
7th 68% 50% 1787 1222 1825 906
8th 58% 52% 1774 1036 1908 997
95%
82%
77%
68%
58%61%
58%
54%
50% 52%
0%
10%
20%
30%
40%
50%
60%
70%
80%
90%
100%
4th 5th 6th 7th 8th
Pe
rce
nt
in H
FZ
Grade
Female Male

2010 NC IsPOD Evaluation Conducte4d by NCAAHPERD/NC DPH
All rights reserved.
8
PACER
New Hanover County
Spring 2010 Percent in Healthy Fitness Zone (HFZ)
FitnessGram Results for 0 K-8 Schools in New Hanover County
Grade
Percent in HFZ Counts in HFZ
Female Male
Female Male
Total FG Results
N in HFZ Total FG Results
N in HFZ
4th NA NA 0 0 0 0
5th NA NA 0 0 0 0
6th NA NA 0 0 0 0
7th NA NA 0 0 0 0
8th NA NA 0 0 0 0
2010 NC IsPOD Evaluation Conducted by NCAAHPERD/NC DPH
All rights reserved.
9
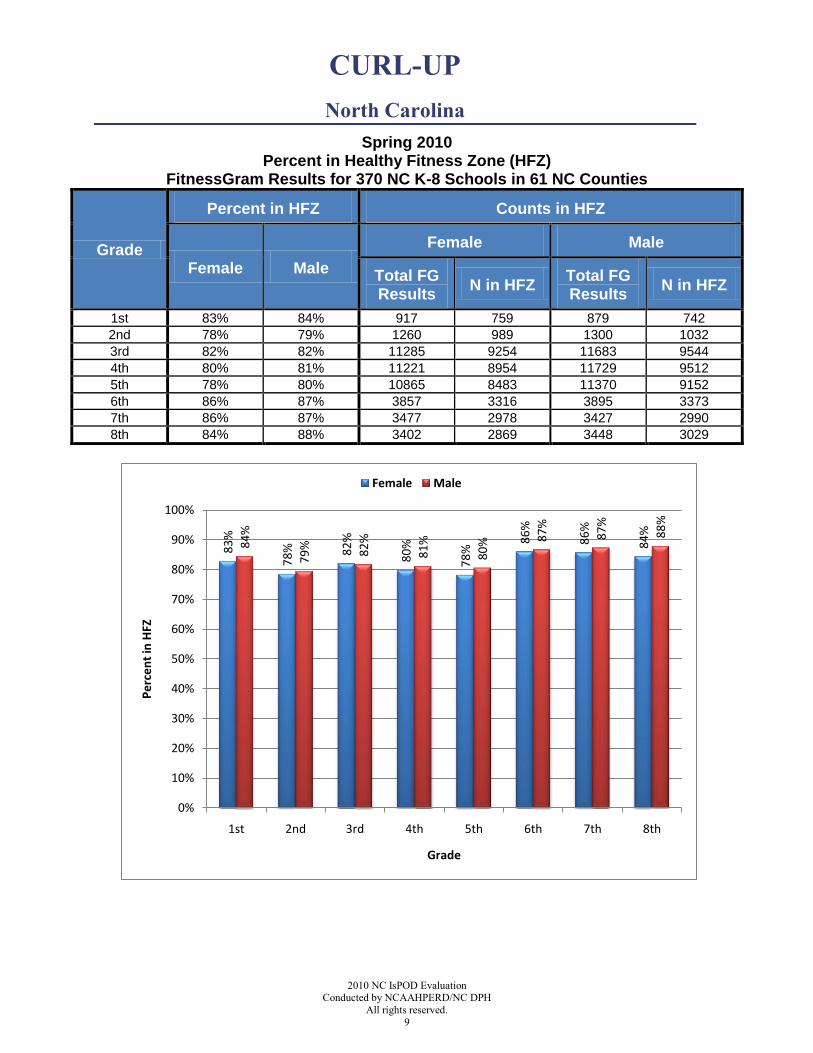
CURL-UP
North Carolina
Spring 2010 Percent in Healthy Fitness Zone (HFZ)
FitnessGram Results for 370 NC K-8 Schools in 61 NC Counties
Grade
Percent in HFZ Counts in HFZ
Female Male
Female Male
Total FG Results
N in HFZ Total FG Results
N in HFZ
1st 83% 84% 917 759 879 742
2nd 78% 79% 1260 989 1300 1032
3rd 82% 82% 11285 9254 11683 9544
4th 80% 81% 11221 8954 11729 9512
5th 78% 80% 10865 8483 11370 9152
6th 86% 87% 3857 3316 3895 3373
7th 86% 87% 3477 2978 3427 2990
8th 84% 88% 3402 2869 3448 3029
83%
78% 82%
80%
78%
86%
86%
84%
84%
79% 82%
81%
80% 87%
87%
88%
0%
10%
20%
30%
40%
50%
60%
70%
80%
90%
100%
1st 2nd 3rd 4th 5th 6th 7th 8th
Pe
rce
nt
in H
FZ
Grade
Female Male

2010 NC IsPOD Evaluation Conducte4d by NCAAHPERD/NC DPH
All rights reserved.
10
CURL-UP
New Hanover County
Spring 2010 Percent in Healthy Fitness Zone (HFZ)
FitnessGram Results for 0 K-8 Schools in New Hanover County
Grade
Percent in HFZ Counts in HFZ
Female Male
Female Male
Total FG Results
N in HFZ Total FG Results
N in HFZ
1st NA NA 0 0 0 0
2nd NA NA 0 0 0 0
3rd NA NA 0 0 0 0
4th NA NA 0 0 0 0
5th NA NA 0 0 0 0
6th NA NA 0 0 0 0
7th NA NA 0 0 0 0
8th NA NA 0 0 0 0

2010 NC IsPOD Evaluation Conducted by NCAAHPERD/NC DPH
All rights reserved.
11
PUSH-UP
North Carolina
Spring 2010 Percent in Healthy Fitness Zone (HFZ)
FitnessGram Results for 370 NC K-8 Schools in 61 NC Counties
Grade
Percent in HFZ Counts in HFZ
Female Male
Female Male
Total FG Results
N in HFZ Total FG Results
N in HFZ
1st 50% 63% 627 314 592 372
2nd 48% 62% 935 451 924 573
3rd 56% 70% 9157 5163 9527 6638
4th 52% 68% 9129 4713 9510 6475
5th 52% 66% 8900 4642 9309 6117
6th 68% 72% 3092 2093 3165 2272
7th 69% 72% 2768 1912 2742 1984
8th 68% 70% 2696 1830 2811 1965
50%
48%
56%
52%
52%
68%
69%
68%
63%
62%
70%
68%
66% 72%
72%
70%
0%
10%
20%
30%
40%
50%
60%
70%
80%
90%
100%
1st 2nd 3rd 4th 5th 6th 7th 8th
Pe
rce
nt
in H
FZ
Grade
Female Male

2010 NC IsPOD Evaluation Conducte4d by NCAAHPERD/NC DPH
All rights reserved.
12
PUSH-UP
New Hanover County
Spring 2010 Percent in Healthy Fitness Zone (HFZ)
FitnessGram Results for 0 K-8 Schools in New Hanover County
Grade
Percent in HFZ Counts in HFZ
Female Male
Female Male
Total FG Results
N in HFZ Total FG Results
N in HFZ
1st NA NA 0 0 0 0
2nd NA NA 0 0 0 0
3rd NA NA 0 0 0 0
4th NA NA 0 0 0 0
5th NA NA 0 0 0 0
6th NA NA 0 0 0 0
7th NA NA 0 0 0 0
8th NA NA 0 0 0 0
2010 NC IsPOD Evaluation Conducted by NCAAHPERD/NC DPH
All rights reserved.
13
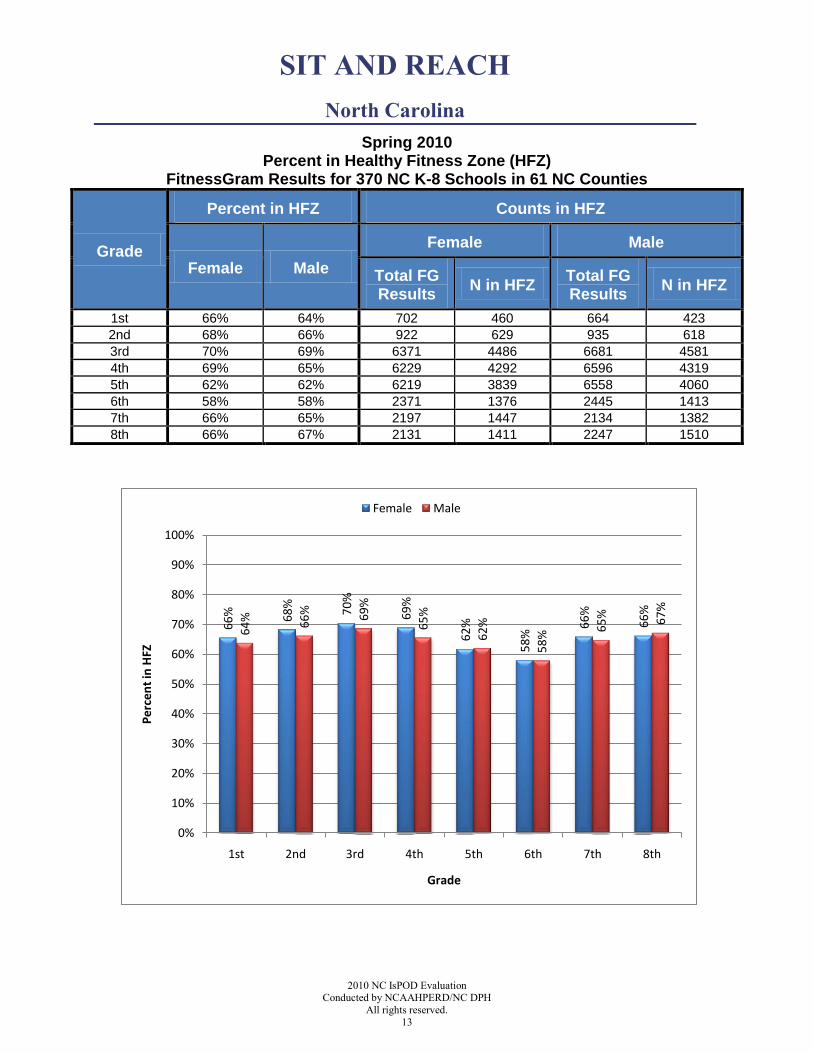
SIT AND REACH
North Carolina
Spring 2010 Percent in Healthy Fitness Zone (HFZ)
FitnessGram Results for 370 NC K-8 Schools in 61 NC Counties
Grade
Percent in HFZ Counts in HFZ
Female Male
Female Male
Total FG Results
N in HFZ Total FG Results
N in HFZ
1st 66% 64% 702 460 664 423
2nd 68% 66% 922 629 935 618
3rd 70% 69% 6371 4486 6681 4581
4th 69% 65% 6229 4292 6596 4319
5th 62% 62% 6219 3839 6558 4060
6th 58% 58% 2371 1376 2445 1413
7th 66% 65% 2197 1447 2134 1382
8th 66% 67% 2131 1411 2247 1510
66% 68%
70%
69%
62%
58%
66%
66%
64% 66% 69%
65%
62%
58%
65% 67%
0%
10%
20%
30%
40%
50%
60%
70%
80%
90%
100%
1st 2nd 3rd 4th 5th 6th 7th 8th
Pe
rce
nt
in H
FZ
Grade
Female Male

2010 NC IsPOD Evaluation Conducte4d by NCAAHPERD/NC DPH
All rights reserved.
14
SIT AND REACH
New Hanover County
Spring 2010 Percent in Healthy Fitness Zone (HFZ)
FitnessGram Results for 0 K-8 Schools in New Hanover County
Grade
Percent in HFZ Counts in HFZ
Female Male
Female Male
Total FG Results
N in HFZ Total FG Results
N in HFZ
1st NA NA 0 0 0 0
2nd NA NA 0 0 0 0
3rd NA NA 0 0 0 0
4th NA NA 0 0 0 0
5th NA NA 0 0 0 0
6th NA NA 0 0 0 0
7th NA NA 0 0 0 0
8th NA NA 0 0 0 0

2010 NC IsPOD Evaluation Conducted by NCAAHPERD/NC DPH
All rights reserved.
15
TRUNK LIFT
North Carolina
Spring 2010 Percent in Healthy Fitness Zone (HFZ)
FitnessGram Results for 370 NC K-8 Schools in 61 NC Counties
Grade
Percent in HFZ Counts in HFZ
Female Male
Female Male
Total FG Results
N in HFZ Total FG Results
N in HFZ
1st 91% 88% 744 680 746 659
2nd 91% 92% 1063 963 1056 971
3rd 93% 91% 10281 9572 10608 9648
4th 84% 80% 10205 8587 10688 8573
5th 81% 77% 9821 7973 10336 8001
6th 83% 79% 3438 2859 3361 2646
7th 82% 77% 3231 2656 3086 2364
8th 84% 79% 3136 2631 3161 2492
91%
91% 93%
84%
81%
83%
82%
84%88% 92%
91%
80%
77%
79%
77%
79%
0%
10%
20%
30%
40%
50%
60%
70%
80%
90%
100%
1st 2nd 3rd 4th 5th 6th 7th 8th
Pe
rce
nt
in H
FZ
Grade
Female Male

2010 NC IsPOD Evaluation Conducte4d by NCAAHPERD/NC DPH
All rights reserved.
16
TRUNK LIFT
New Hanover County
Spring 2010 Percent in Healthy Fitness Zone (HFZ)
FitnessGram Results for 0 K-8 School in New Hanover County
Grade
Percent in HFZ Counts in HFZ
Female Male
Female Male
Total FG Results
N in HFZ Total FG Results
N in HFZ
1st NA NA 0 0 0 0
2nd NA NA 0 0 0 0
3rd NA NA 0 0 0 0
4th NA NA 0 0 0 0
5th NA NA 0 0 0 0
6th NA NA 0 0 0 0
7th NA NA 0 0 0 0
8th NA NA 0 0 0 0


