D E C E M B E R 1 2 , 2 0 1 2
Stephen J. Rourke V I C E P R E S I D E N T , S Y S T E M P L A N N I N G
Energy-efficiency forecast
ISO on Background
Anne George V I C E P R E S I D E N T , E X T E R N A L A F F A I R S & C O R P O R A T E C O M M U N I C A T I O N S

Agenda
2
11:00-11:05 a.m.
11:05-11:10 a.m.
11:10-11:40 a.m.
11:40 a.m.-12:00 p.m.
Welcome and Introductions Ellen Foley, Director, Corporate Communications
About ISO New England Anne C. George, Vice President, External Affairs and Corporate Communications
ISO New England’s Energy-Efficiency Forecast Stephen J. Rourke, Vice President, System Planning
Question-and-Answer Session

3
About the ISO on Background Series
• Informal opportunity for media to learn more about trends affecting New England’s electricity industry
• Hosted by ISO New England senior management
• Content is on-the-record
• Please hold questions until the Q&A session at the end of the presentation
• Presentation and remarks will be posted at www.iso-ne.com>News & Issues>Press Releases after the session
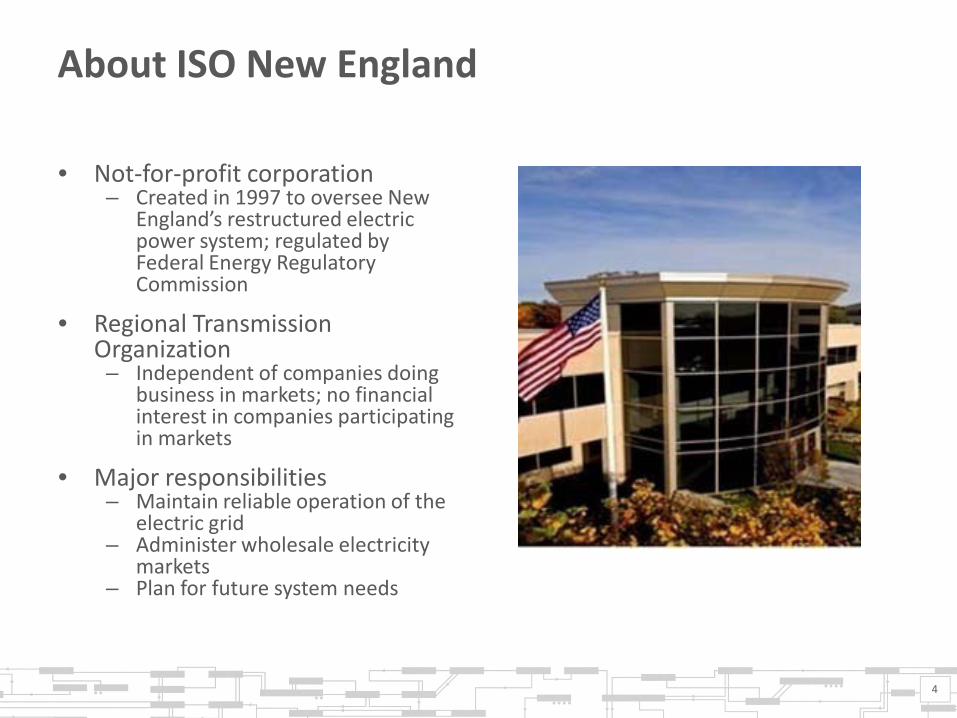
About ISO New England • Not-for-profit corporation
– Created in 1997 to oversee New England’s restructured electric power system; regulated by Federal Energy Regulatory Commission
• Regional Transmission Organization – Independent of companies doing
business in markets; no financial interest in companies participating in markets
• Major responsibilities – Maintain reliable operation of the
electric grid – Administer wholesale electricity
markets – Plan for future system needs
4
5
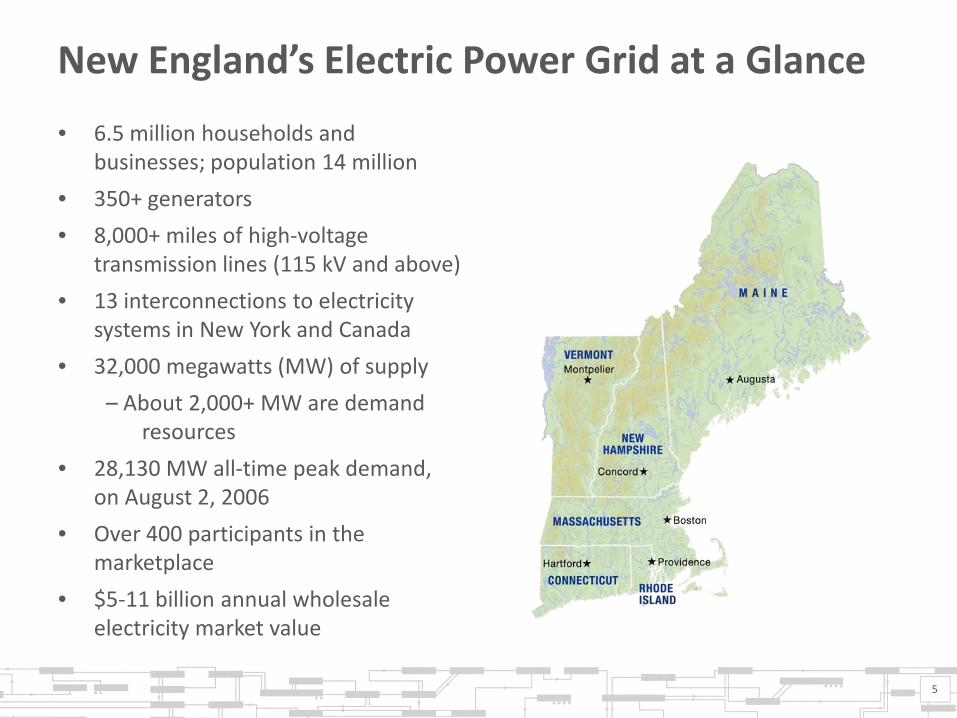
New England’s Electric Power Grid at a Glance
• 6.5 million households and businesses; population 14 million
• 350+ generators
• 8,000+ miles of high-voltage transmission lines (115 kV and above)
• 13 interconnections to electricity systems in New York and Canada
• 32,000 megawatts (MW) of supply
– About 2,000+ MW are demand resources
• 28,130 MW all-time peak demand, on August 2, 2006
• Over 400 participants in the marketplace
• $5-11 billion annual wholesale electricity market value
6
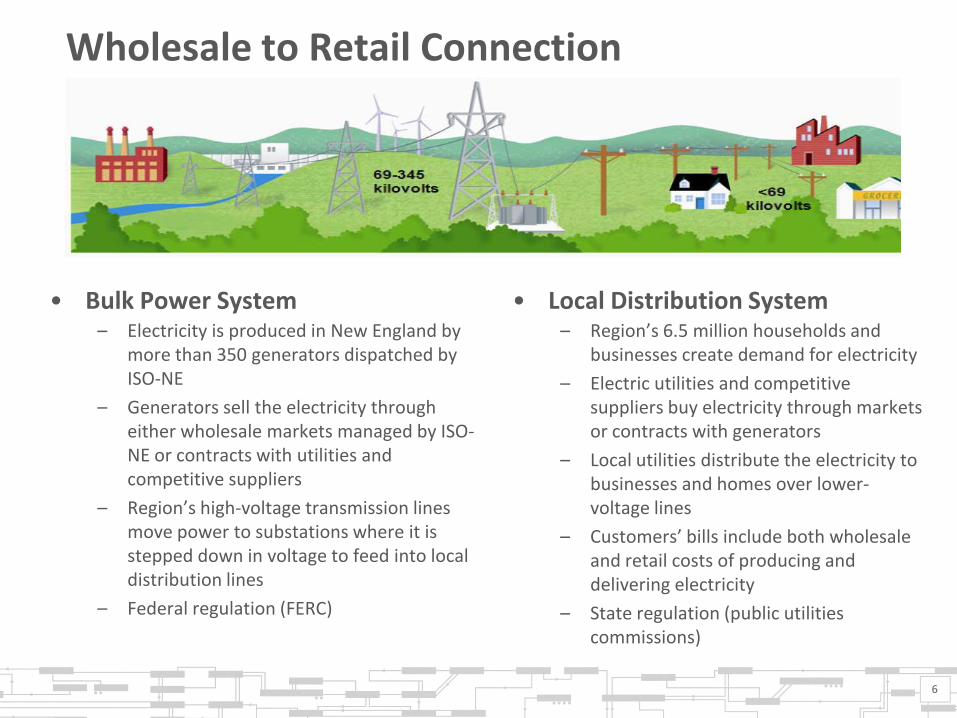
Wholesale to Retail Connection
• Bulk Power System – Electricity is produced in New England by
more than 350 generators dispatched by ISO-NE
– Generators sell the electricity through either wholesale markets managed by ISO-NE or contracts with utilities and competitive suppliers
– Region’s high-voltage transmission lines move power to substations where it is stepped down in voltage to feed into local distribution lines
– Federal regulation (FERC)
• Local Distribution System – Region’s 6.5 million households and
businesses create demand for electricity
– Electric utilities and competitive suppliers buy electricity through markets or contracts with generators
– Local utilities distribute the electricity to businesses and homes over lower-voltage lines
– Customers’ bills include both wholesale and retail costs of producing and delivering electricity
– State regulation (public utilities commissions)
7
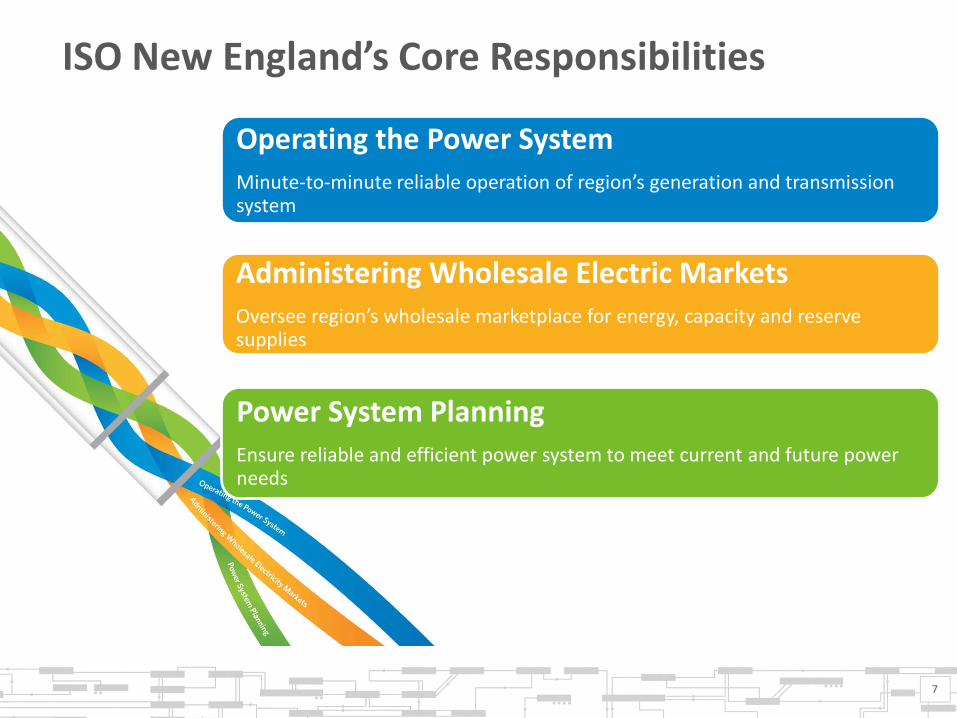
ISO New England’s Core Responsibilities
Operating the Power System Minute-to-minute reliable operation of region’s generation and transmission system
Administering Wholesale Electric Markets Oversee region’s wholesale marketplace for energy, capacity and reserve supplies
Power System Planning Ensure reliable and efficient power system to meet current and future power needs
Energy Efficiency Basics • Energy efficiency (EE): Consuming less energy while achieving the
same level of service – On the other hand, energy conservation is going without a service in order
to use less energy
• Energy-efficiency measures are installed devices or processes that use less electricity – Common measures: lighting, building insulation, HVAC upgrades, more
efficient appliances, and industrial process improvements
• Individual states set goals for reduced electricity use – Energy-efficiency programs funded directly
• ISO New England-administered Forward Capacity Market compensates EE as a resource, the same as power plants – With FCM auction results, the EE levels for the next three years are known – But long-term system plans look ahead 10 years
8
9
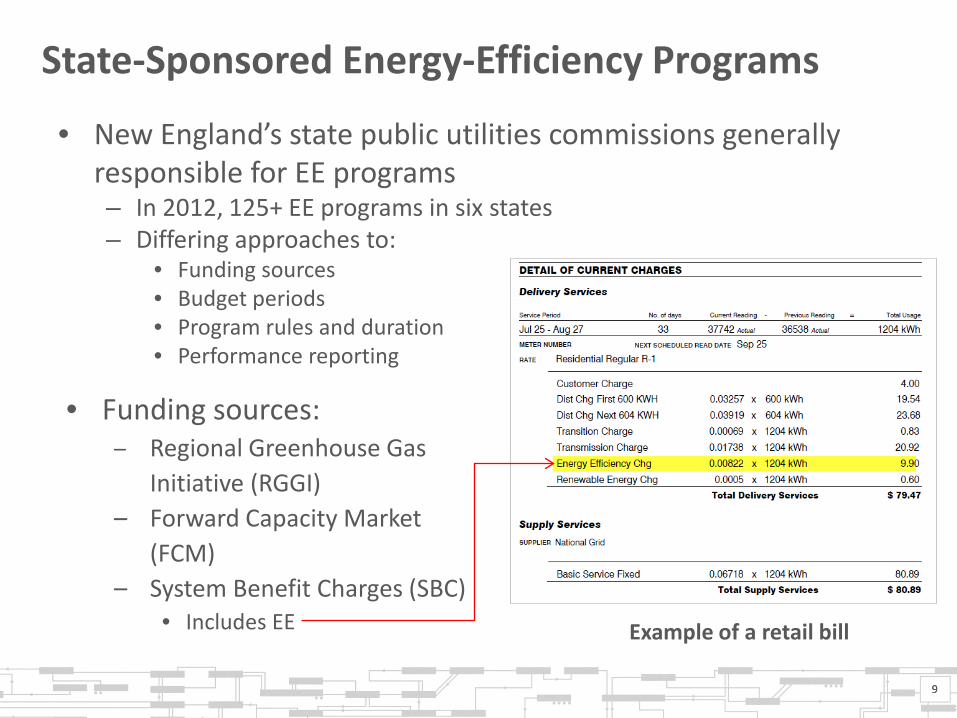
State-Sponsored Energy-Efficiency Programs
• Funding sources: – Regional Greenhouse Gas
Initiative (RGGI) – Forward Capacity Market
(FCM) – System Benefit Charges (SBC)
• Includes EE
9
Example of a retail bill
• New England’s state public utilities commissions generally responsible for EE programs – In 2012, 125+ EE programs in six states – Differing approaches to:
• Funding sources • Budget periods • Program rules and duration • Performance reporting
ENERGY-EFFICIENCY FORECAST Background
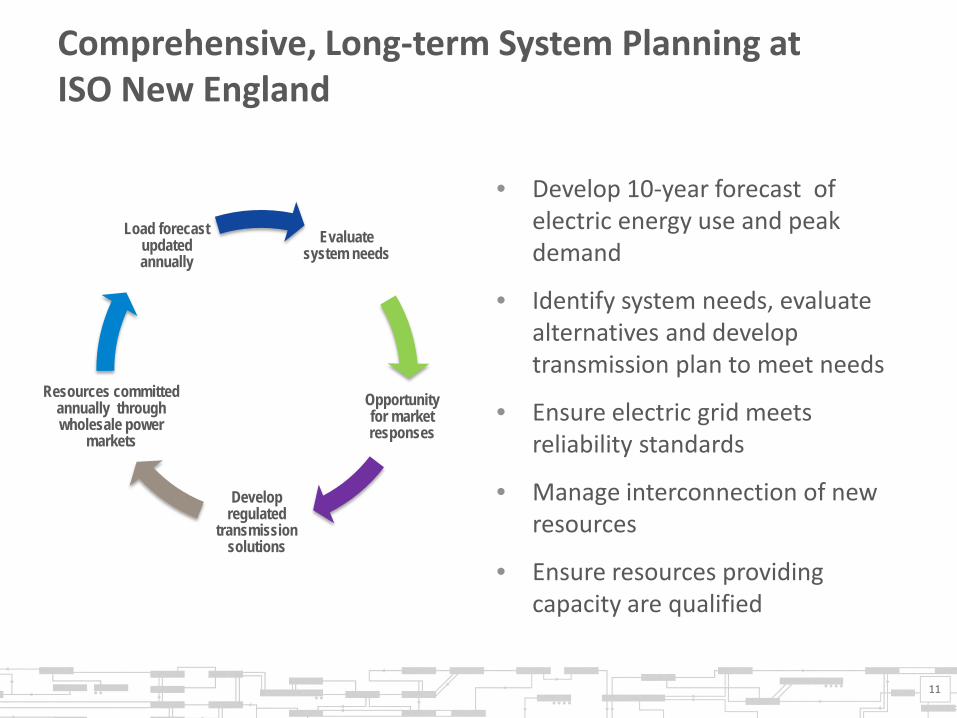
Comprehensive, Long-term System Planning at ISO New England
11
Evaluate system needs
Opportunity for market responses
Develop regulated
transmission solutions
Resources committed annually through wholesale power
markets
Load forecast updated annually
• Develop 10-year forecast of electric energy use and peak demand
• Identify system needs, evaluate alternatives and develop transmission plan to meet needs
• Ensure electric grid meets reliability standards
• Manage interconnection of new resources
• Ensure resources providing capacity are qualified
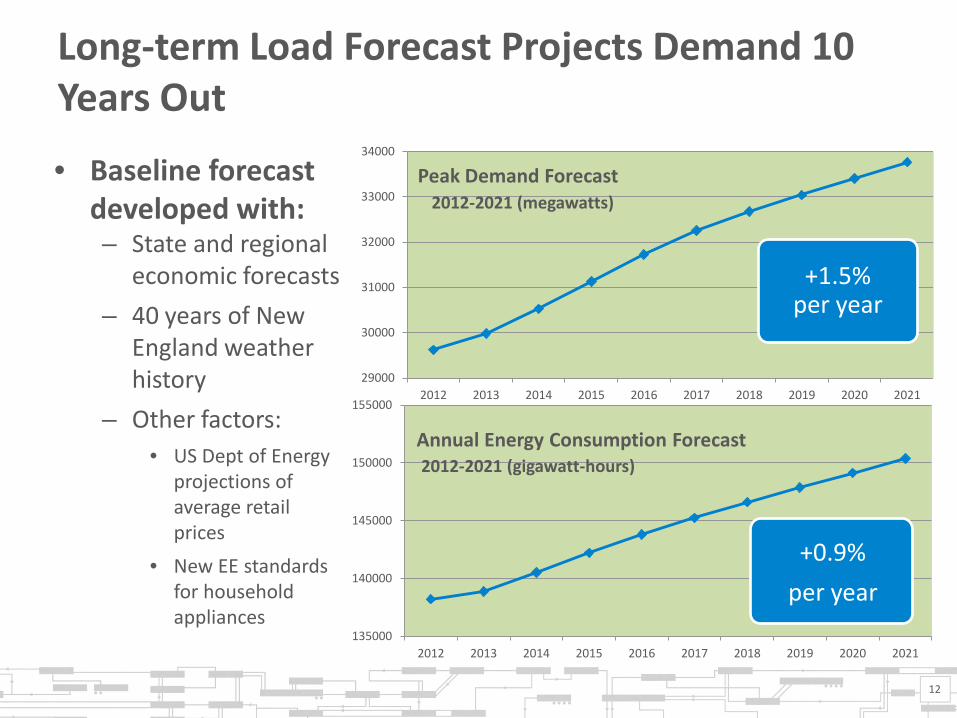
Long-term Load Forecast Projects Demand 10 Years Out • Baseline forecast
developed with: – State and regional
economic forecasts
– 40 years of New England weather history
– Other factors: • US Dept of Energy
projections of average retail prices
• New EE standards for household appliances
135000
140000
145000
150000
155000
2012 2013 2014 2015 2016 2017 2018 2019 2020 2021
Annual Energy Consumption Forecast 2012-2021 (gigawatt-hours)
12
29000
30000
31000
32000
33000
34000
2012 2013 2014 2015 2016 2017 2018 2019 2020 2021
Peak Demand Forecast 2012-2021 (megawatts)
+1.5% per year
+0.9%
per year
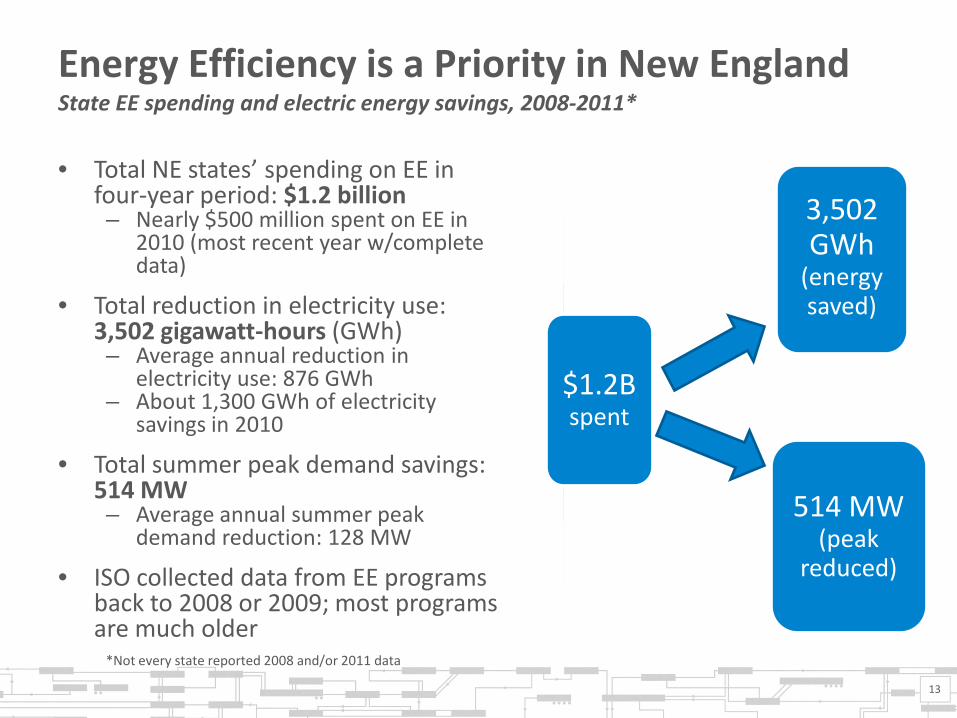
Energy Efficiency is a Priority in New England State EE spending and electric energy savings, 2008-2011*
• Total NE states’ spending on EE in four-year period: $1.2 billion – Nearly $500 million spent on EE in
2010 (most recent year w/complete data)
• Total reduction in electricity use: 3,502 gigawatt-hours (GWh) – Average annual reduction in
electricity use: 876 GWh – About 1,300 GWh of electricity
savings in 2010
• Total summer peak demand savings: 514 MW – Average annual summer peak
demand reduction: 128 MW
• ISO collected data from EE programs back to 2008 or 2009; most programs are much older
*Not every state reported 2008 and/or 2011 data
13
$1.2B spent
3,502 GWh
(energy saved)
514 MW (peak
reduced)
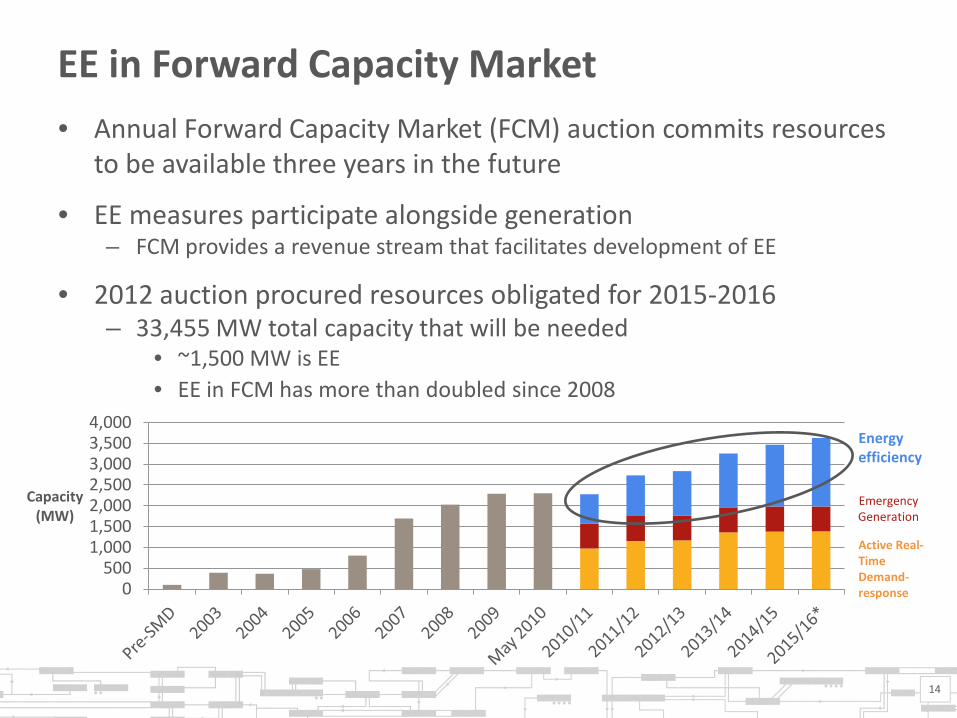
EE in Forward Capacity Market • Annual Forward Capacity Market (FCM) auction commits resources
to be available three years in the future
• EE measures participate alongside generation – FCM provides a revenue stream that facilitates development of EE
• 2012 auction procured resources obligated for 2015-2016 – 33,455 MW total capacity that will be needed
• ~1,500 MW is EE • EE in FCM has more than doubled since 2008
14
0 500
1,000 1,500 2,000 2,500 3,000 3,500 4,000
Capacity (MW)
Energy efficiency
Active Real- Time Demand-response
Emergency Generation
ENERGY-EFFICIENCY FORECAST Development
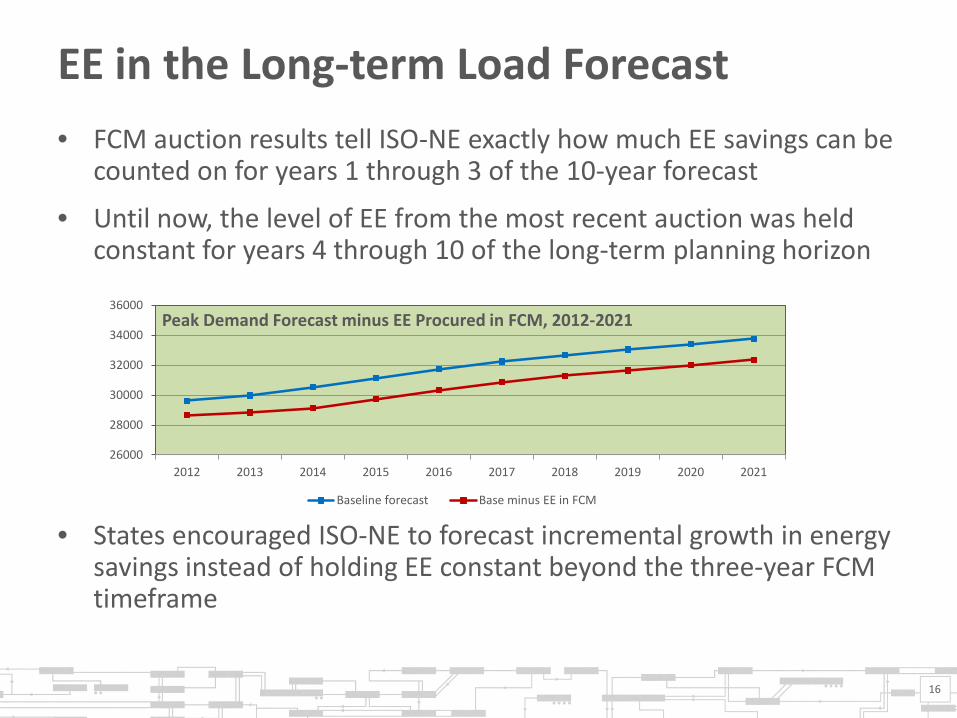
EE in the Long-term Load Forecast • FCM auction results tell ISO-NE exactly how much EE savings can be
counted on for years 1 through 3 of the 10-year forecast
• Until now, the level of EE from the most recent auction was held constant for years 4 through 10 of the long-term planning horizon
• States encouraged ISO-NE to forecast incremental growth in energy savings instead of holding EE constant beyond the three-year FCM timeframe
16
26000
28000
30000
32000
34000
36000
2012 2013 2014 2015 2016 2017 2018 2019 2020 2021
Peak Demand Forecast minus EE Procured in FCM, 2012-2021
Baseline forecast Base minus EE in FCM
Energy-Efficiency Forecast Model Development • Previously, no well-established metrics for determining how much
electricity will not be consumed in the future
• An EE forecast requires data on each program’s spending and level of energy savings achieved
– No aggregated data available; required collection of data on 125+ individual programs with different funding sources, goals, and reporting methods
• ISO-NE developed a forecast of “EE savings”—how much electric energy will not be used—across a 10-year planning horizon by:
– Modifying New York ISO EE forecast model based on production costs (dollars spent per megawatt-hour of savings) and budgets of EE programs
– Factoring in uncertainty around future inflation, rising production costs as less-expensive EE measures are deployed first, changing technologies, state budget priorities
• First multi-state, long-term forecast of energy-efficiency savings* * Forecast does not include estimates of how much money was saved
17
ENERGY-EFFICIENCY FORECAST Regional Results
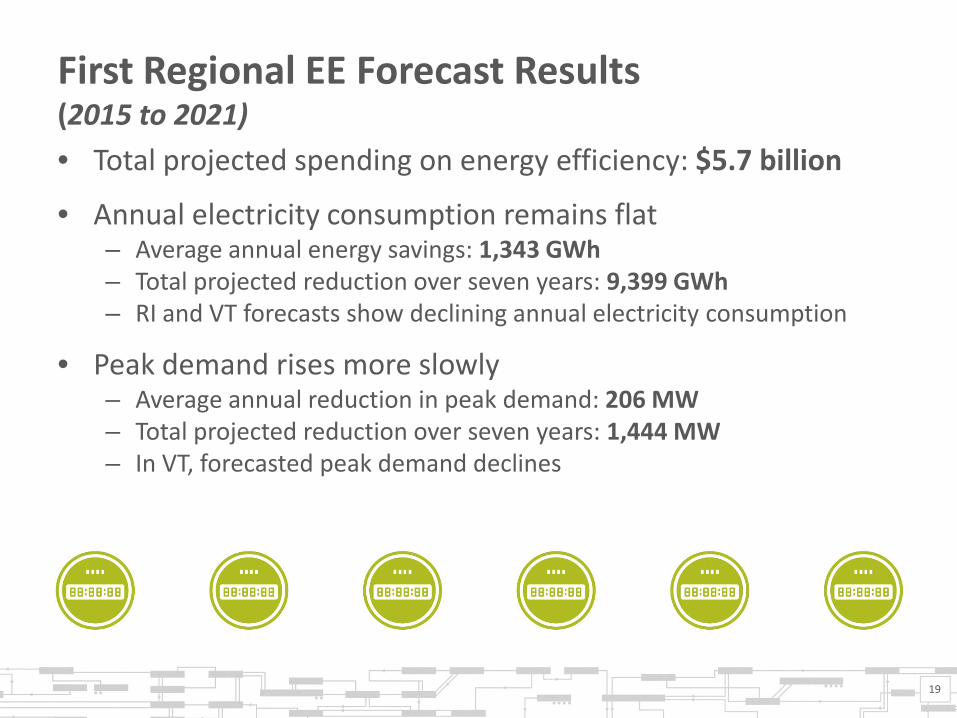
First Regional EE Forecast Results (2015 to 2021) • Total projected spending on energy efficiency: $5.7 billion
• Annual electricity consumption remains flat – Average annual energy savings: 1,343 GWh – Total projected reduction over seven years: 9,399 GWh – RI and VT forecasts show declining annual electricity consumption
• Peak demand rises more slowly – Average annual reduction in peak demand: 206 MW – Total projected reduction over seven years: 1,444 MW – In VT, forecasted peak demand declines
19
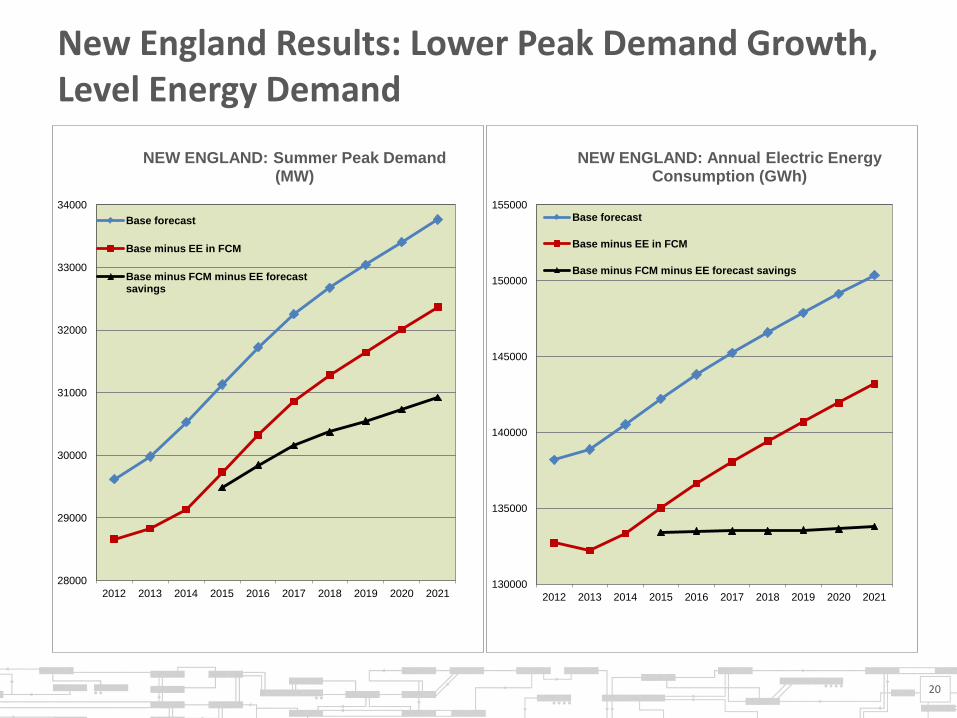
New England Results: Lower Peak Demand Growth, Level Energy Demand
28000
29000
30000
31000
32000
33000
34000
2012 2013 2014 2015 2016 2017 2018 2019 2020 2021
NEW ENGLAND: Summer Peak Demand (MW)
Base forecast
Base minus EE in FCM
Base minus FCM minus EE forecast savings
130000
135000
140000
145000
150000
155000
2012 2013 2014 2015 2016 2017 2018 2019 2020 2021
NEW ENGLAND: Annual Electric Energy Consumption (GWh)
Base forecast
Base minus EE in FCM
Base minus FCM minus EE forecast savings
20
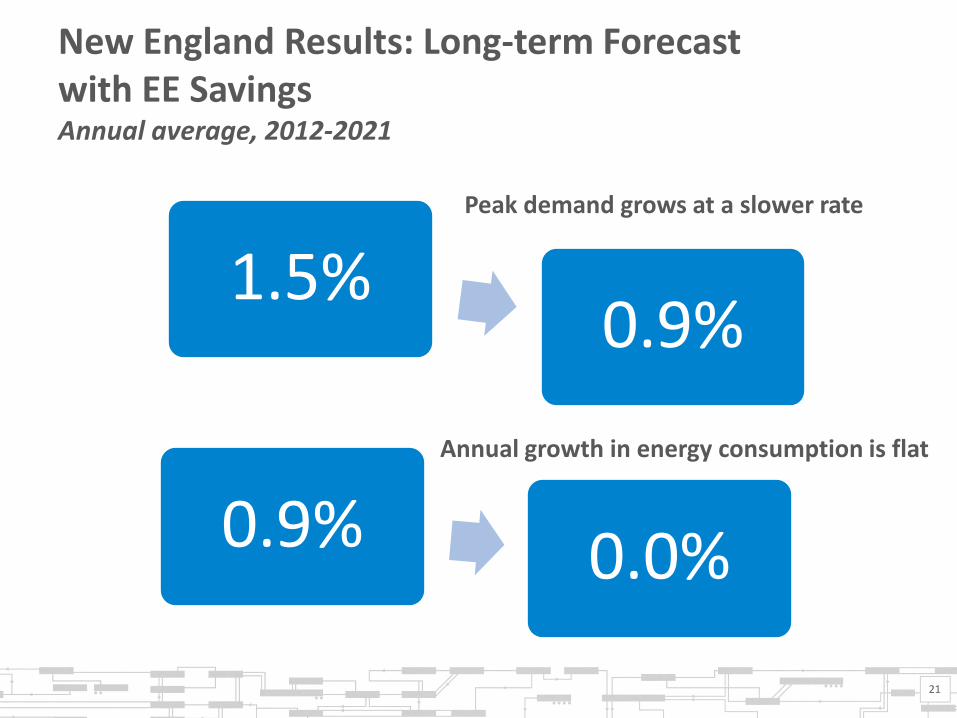
New England Results: Long-term Forecast with EE Savings Annual average, 2012-2021
21
1.5% 0.9%
0.9% 0.0%
Annual growth in energy consumption is flat
Peak demand grows at a slower rate
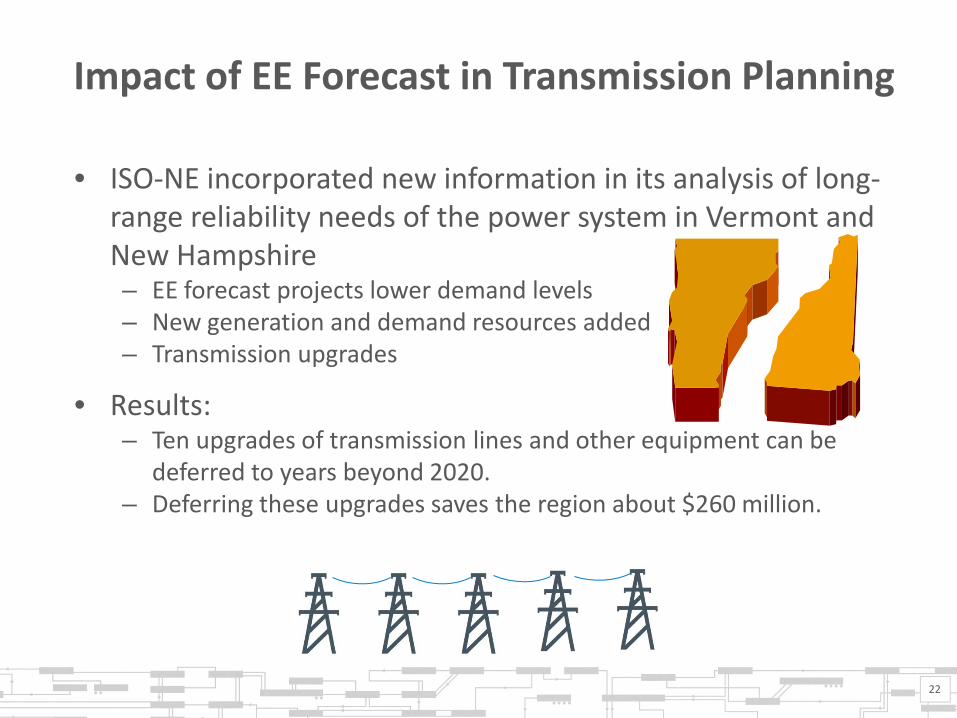
• ISO-NE incorporated new information in its analysis of long-range reliability needs of the power system in Vermont and New Hampshire – EE forecast projects lower demand levels – New generation and demand resources added – Transmission upgrades
• Results: – Ten upgrades of transmission lines and other equipment can be
deferred to years beyond 2020. – Deferring these upgrades saves the region about $260 million.
22
Impact of EE Forecast in Transmission Planning
23
Conclusions
• States continue to make large investments in EE
• ISO-NE worked successfully with stakeholders to fully integrate EE into ISO’s planning and load forecast
• EE forecast shows the states’ investment in EE is having a significant impact on electric energy consumption and peak demand
• About $260 million in transmission expenses already deferred for New England customers
• Second EE Forecast (2016-2022) due out in February 2013 – Preliminary results are consistent with those of first forecast
– For more information see www.iso-ne.com/eefwg
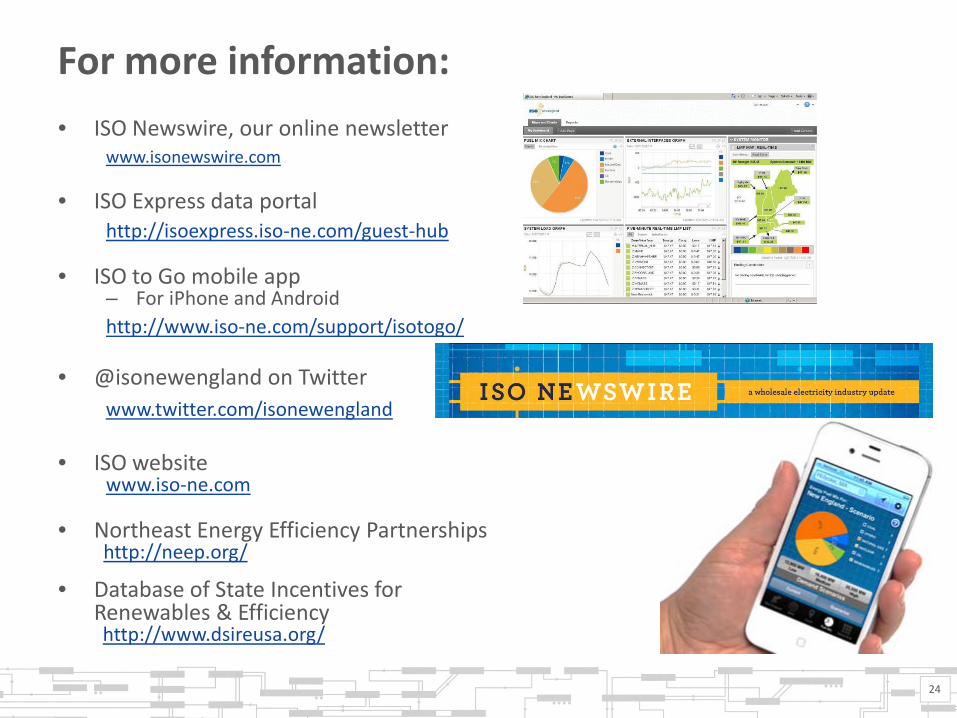
For more information:
• ISO Newswire, our online newsletter www.isonewswire.com
• ISO Express data portal http://isoexpress.iso-ne.com/guest-hub
• ISO to Go mobile app – For iPhone and Android http://www.iso-ne.com/support/isotogo/
• @isonewengland on Twitter www.twitter.com/isonewengland
• ISO website www.iso-ne.com
• Northeast Energy Efficiency Partnerships http://neep.org/
• Database of State Incentives for Renewables & Efficiency http://www.dsireusa.org/
24

25
ENERGY-EFFICIENCY FORECAST State-by-State Results
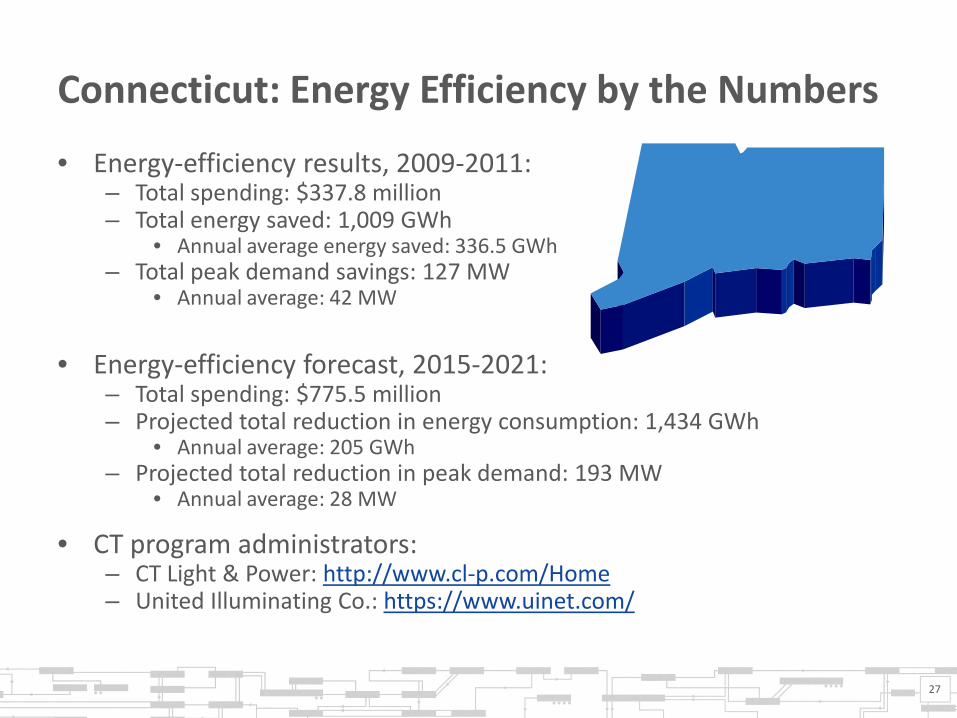
Connecticut: Energy Efficiency by the Numbers
• Energy-efficiency results, 2009-2011: – Total spending: $337.8 million – Total energy saved: 1,009 GWh
• Annual average energy saved: 336.5 GWh – Total peak demand savings: 127 MW
• Annual average: 42 MW
• Energy-efficiency forecast, 2015-2021: – Total spending: $775.5 million – Projected total reduction in energy consumption: 1,434 GWh
• Annual average: 205 GWh – Projected total reduction in peak demand: 193 MW
• Annual average: 28 MW
• CT program administrators: – CT Light & Power: http://www.cl-p.com/Home – United Illuminating Co.: https://www.uinet.com/
27
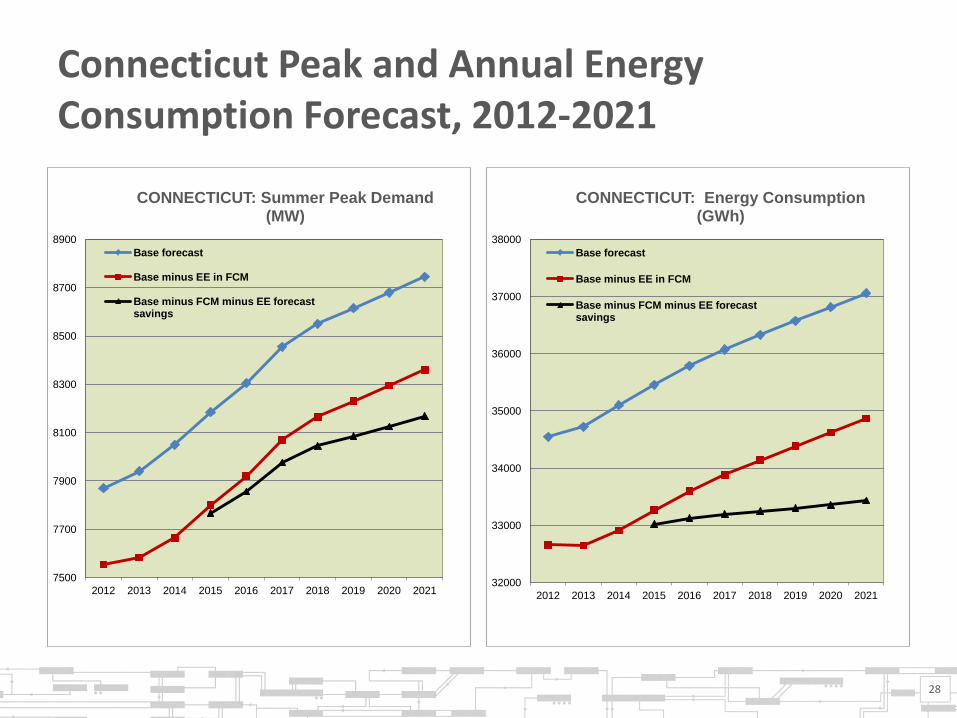
Connecticut Peak and Annual Energy Consumption Forecast, 2012-2021
28
7500
7700
7900
8100
8300
8500
8700
8900
2012 2013 2014 2015 2016 2017 2018 2019 2020 2021
CONNECTICUT: Summer Peak Demand (MW)
Base forecast
Base minus EE in FCM
Base minus FCM minus EE forecast savings
32000
33000
34000
35000
36000
37000
38000
2012 2013 2014 2015 2016 2017 2018 2019 2020 2021
CONNECTICUT: Energy Consumption (GWh)
Base forecast
Base minus EE in FCM
Base minus FCM minus EE forecast savings
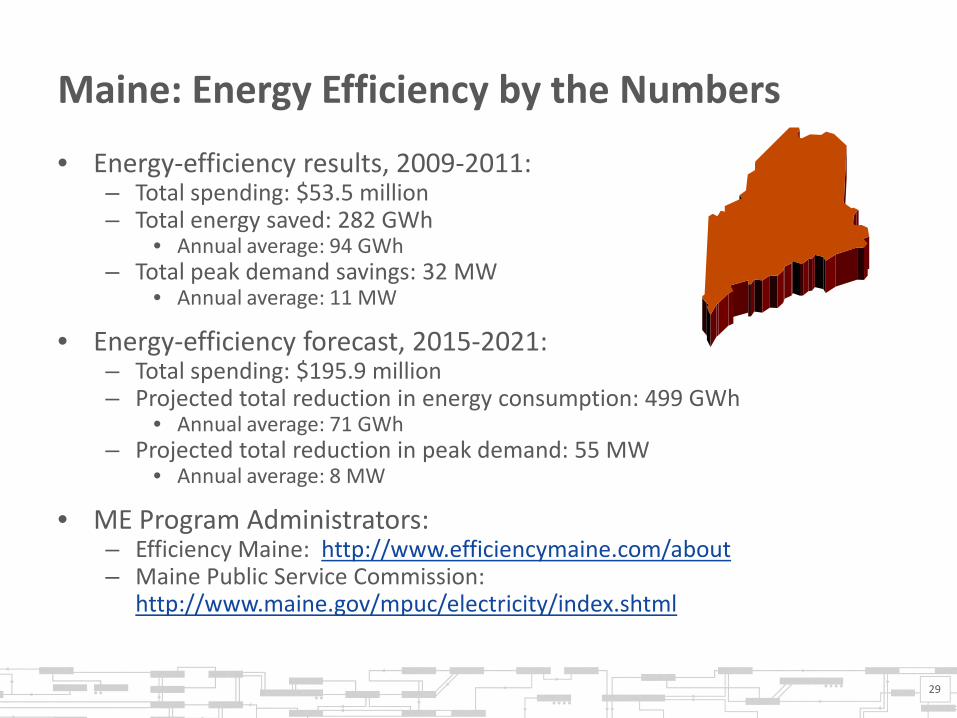
Maine: Energy Efficiency by the Numbers
• Energy-efficiency results, 2009-2011: – Total spending: $53.5 million – Total energy saved: 282 GWh
• Annual average: 94 GWh – Total peak demand savings: 32 MW
• Annual average: 11 MW
• Energy-efficiency forecast, 2015-2021: – Total spending: $195.9 million – Projected total reduction in energy consumption: 499 GWh
• Annual average: 71 GWh – Projected total reduction in peak demand: 55 MW
• Annual average: 8 MW
• ME Program Administrators: – Efficiency Maine: http://www.efficiencymaine.com/about – Maine Public Service Commission:
http://www.maine.gov/mpuc/electricity/index.shtml
29
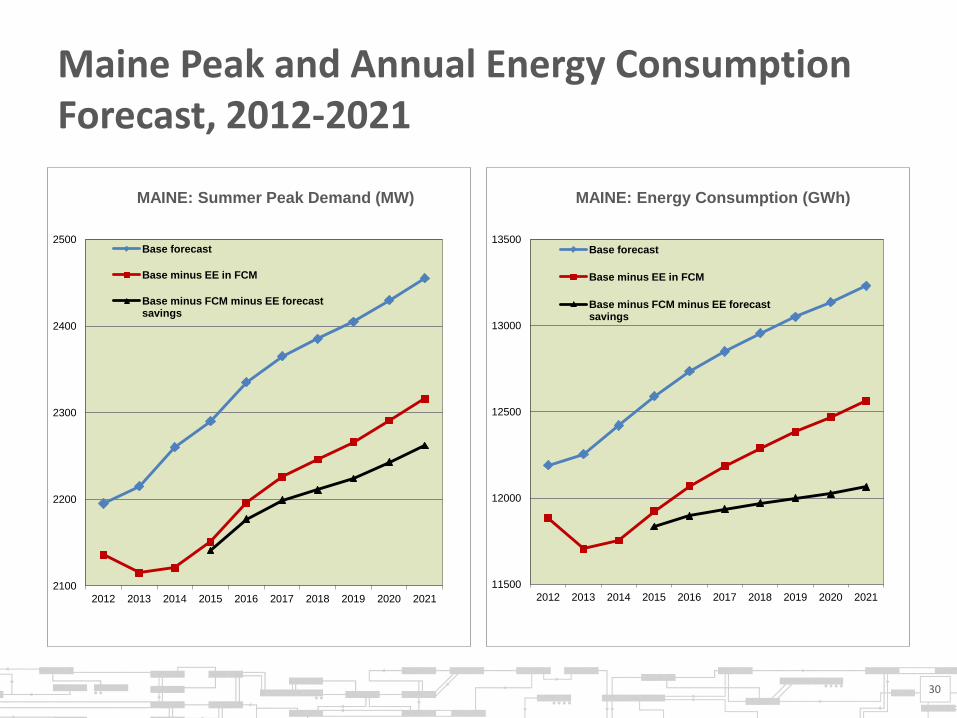
Maine Peak and Annual Energy Consumption Forecast, 2012-2021
30
2100
2200
2300
2400
2500
2012 2013 2014 2015 2016 2017 2018 2019 2020 2021
MAINE: Summer Peak Demand (MW)
Base forecast
Base minus EE in FCM
Base minus FCM minus EE forecast savings
11500
12000
12500
13000
13500
2012 2013 2014 2015 2016 2017 2018 2019 2020 2021
MAINE: Energy Consumption (GWh)
Base forecast
Base minus EE in FCM
Base minus FCM minus EE forecast savings
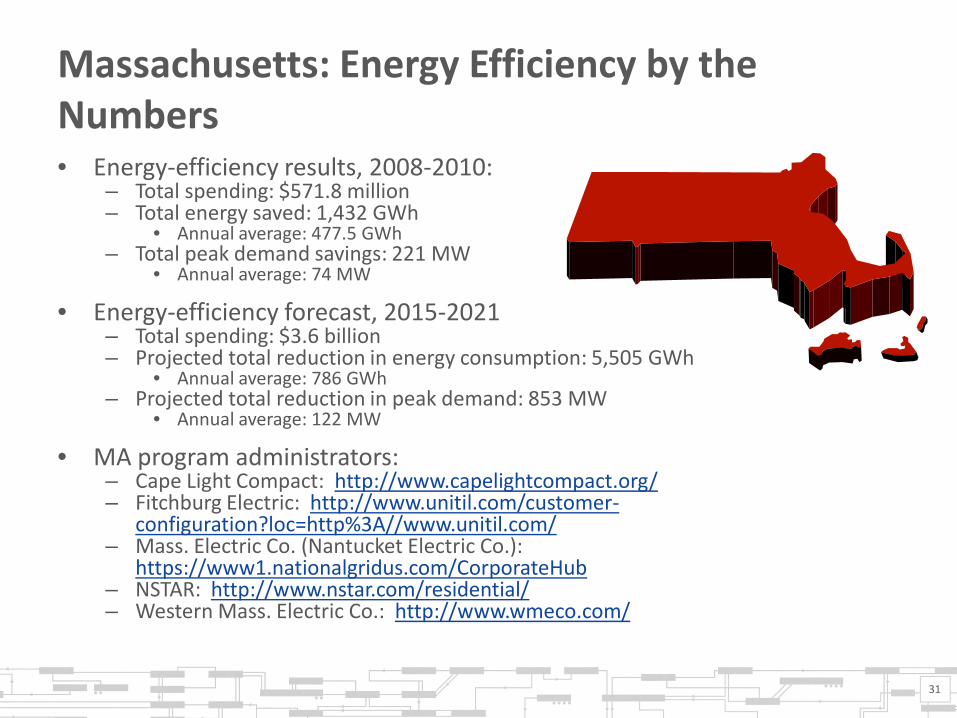
Massachusetts: Energy Efficiency by the Numbers • Energy-efficiency results, 2008-2010:
– Total spending: $571.8 million – Total energy saved: 1,432 GWh
• Annual average: 477.5 GWh – Total peak demand savings: 221 MW
• Annual average: 74 MW
• Energy-efficiency forecast, 2015-2021 – Total spending: $3.6 billion – Projected total reduction in energy consumption: 5,505 GWh
• Annual average: 786 GWh – Projected total reduction in peak demand: 853 MW
• Annual average: 122 MW
• MA program administrators: – Cape Light Compact: http://www.capelightcompact.org/ – Fitchburg Electric: http://www.unitil.com/customer-
configuration?loc=http%3A//www.unitil.com/ – Mass. Electric Co. (Nantucket Electric Co.):
https://www1.nationalgridus.com/CorporateHub – NSTAR: http://www.nstar.com/residential/ – Western Mass. Electric Co.: http://www.wmeco.com/
31
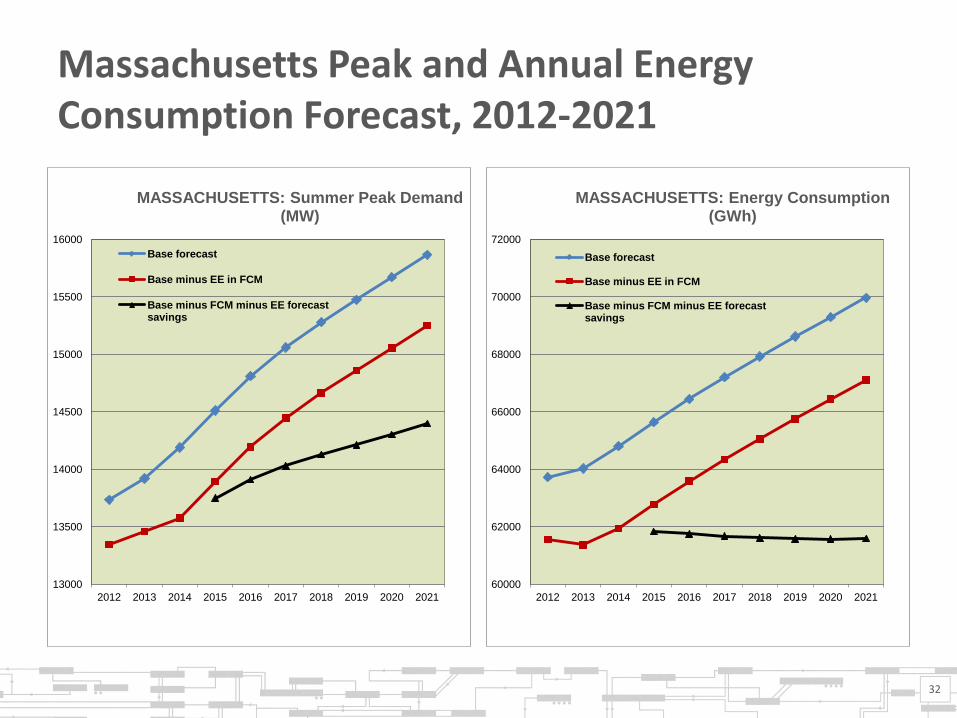
Massachusetts Peak and Annual Energy Consumption Forecast, 2012-2021
13000
13500
14000
14500
15000
15500
16000
2012 2013 2014 2015 2016 2017 2018 2019 2020 2021
MASSACHUSETTS: Summer Peak Demand (MW)
Base forecast
Base minus EE in FCM
Base minus FCM minus EE forecast savings
60000
62000
64000
66000
68000
70000
72000
2012 2013 2014 2015 2016 2017 2018 2019 2020 2021
MASSACHUSETTS: Energy Consumption (GWh)
Base forecast
Base minus EE in FCM
Base minus FCM minus EE forecast savings
32
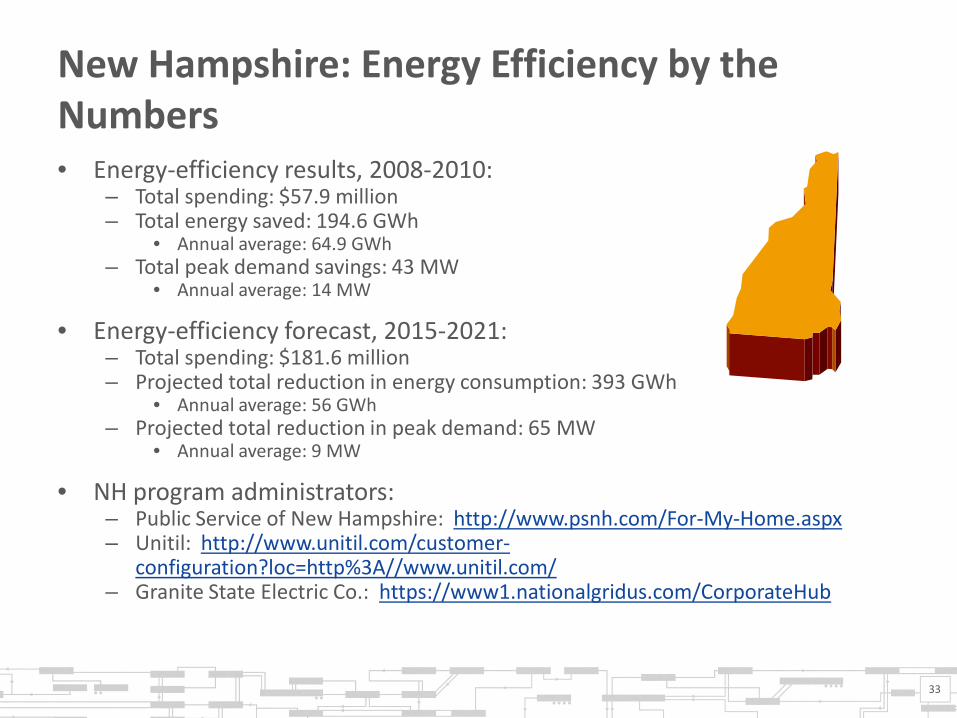
New Hampshire: Energy Efficiency by the Numbers • Energy-efficiency results, 2008-2010:
– Total spending: $57.9 million – Total energy saved: 194.6 GWh
• Annual average: 64.9 GWh – Total peak demand savings: 43 MW
• Annual average: 14 MW
• Energy-efficiency forecast, 2015-2021: – Total spending: $181.6 million – Projected total reduction in energy consumption: 393 GWh
• Annual average: 56 GWh – Projected total reduction in peak demand: 65 MW
• Annual average: 9 MW
• NH program administrators: – Public Service of New Hampshire: http://www.psnh.com/For-My-Home.aspx – Unitil: http://www.unitil.com/customer-
configuration?loc=http%3A//www.unitil.com/ – Granite State Electric Co.: https://www1.nationalgridus.com/CorporateHub
33
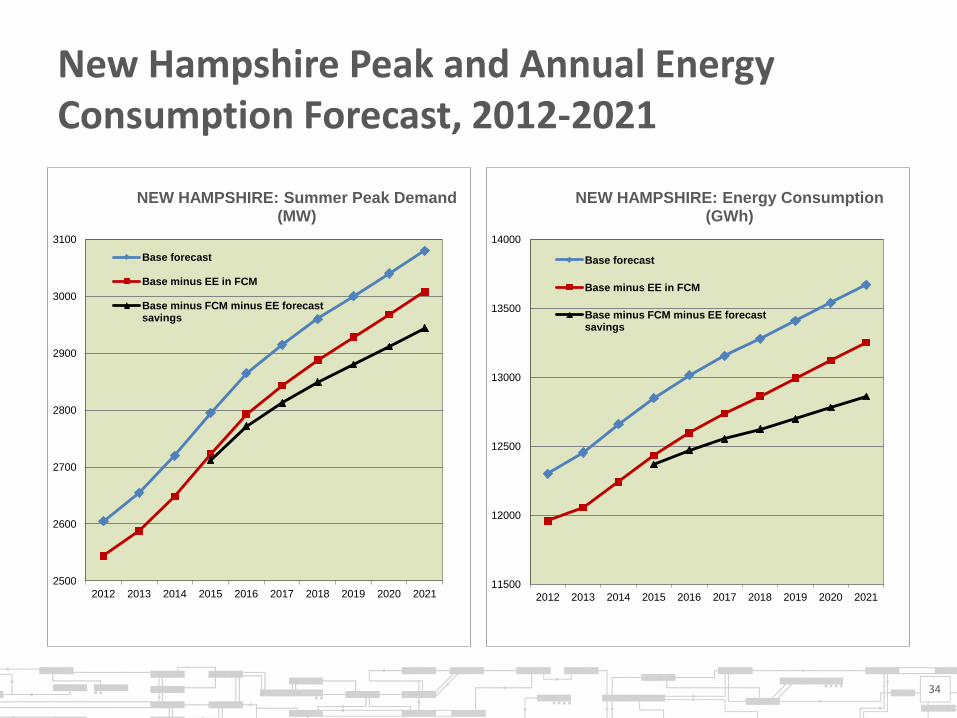
New Hampshire Peak and Annual Energy Consumption Forecast, 2012-2021
2500
2600
2700
2800
2900
3000
3100
2012 2013 2014 2015 2016 2017 2018 2019 2020 2021
NEW HAMPSHIRE: Summer Peak Demand (MW)
Base forecast
Base minus EE in FCM
Base minus FCM minus EE forecast savings
11500
12000
12500
13000
13500
14000
2012 2013 2014 2015 2016 2017 2018 2019 2020 2021
NEW HAMPSHIRE: Energy Consumption (GWh)
Base forecast
Base minus EE in FCM
Base minus FCM minus EE forecast savings
34
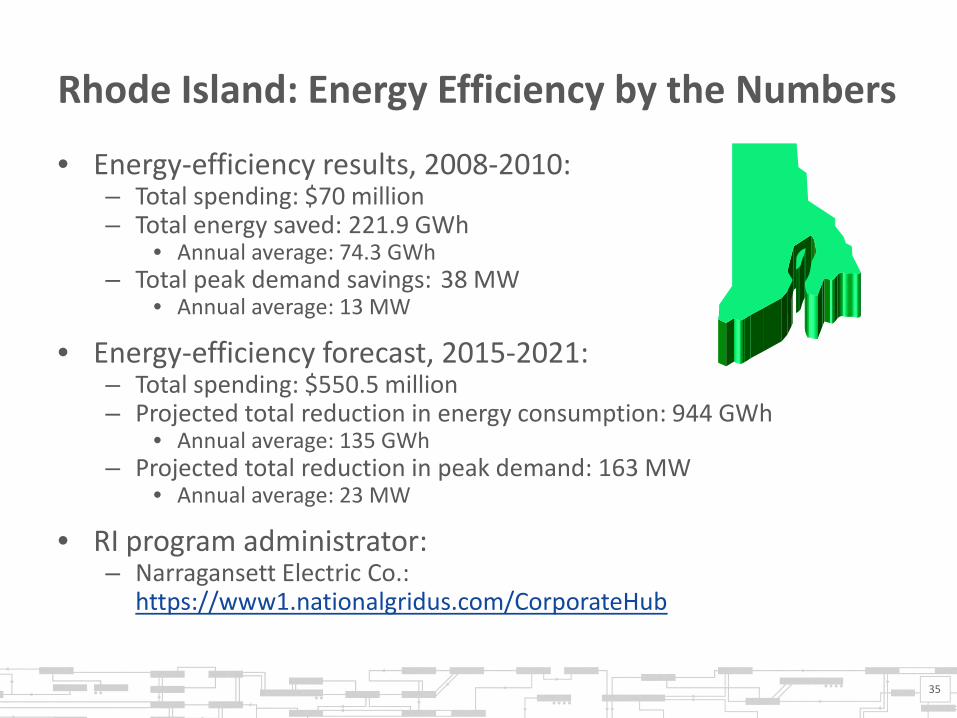
Rhode Island: Energy Efficiency by the Numbers
• Energy-efficiency results, 2008-2010: – Total spending: $70 million – Total energy saved: 221.9 GWh
• Annual average: 74.3 GWh – Total peak demand savings: 38 MW
• Annual average: 13 MW
• Energy-efficiency forecast, 2015-2021: – Total spending: $550.5 million – Projected total reduction in energy consumption: 944 GWh
• Annual average: 135 GWh – Projected total reduction in peak demand: 163 MW
• Annual average: 23 MW
• RI program administrator: – Narragansett Electric Co.:
https://www1.nationalgridus.com/CorporateHub
35
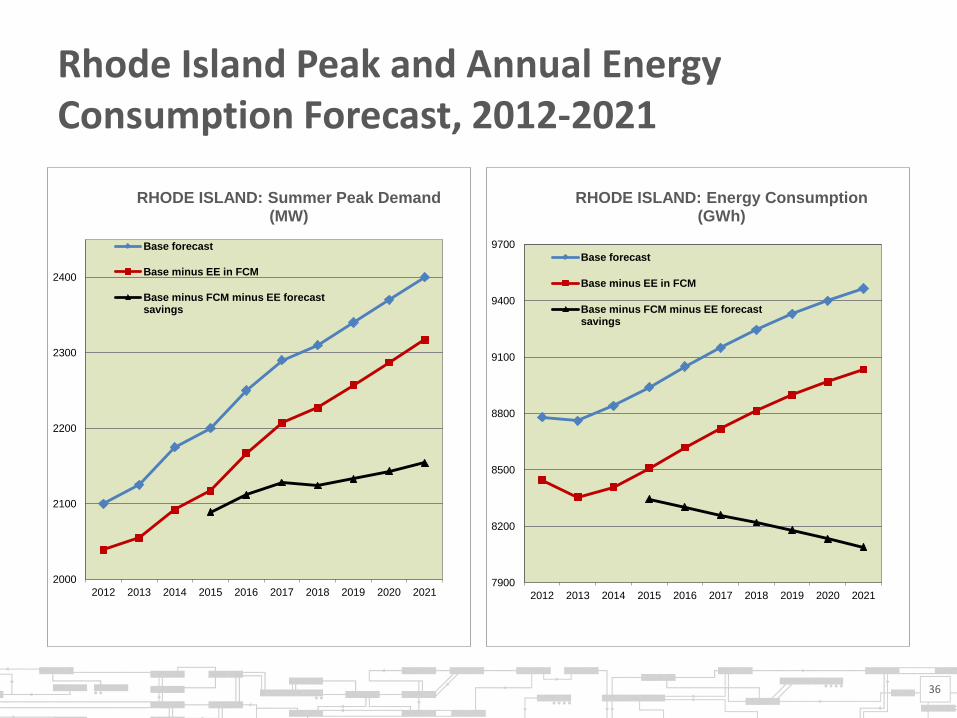
Rhode Island Peak and Annual Energy Consumption Forecast, 2012-2021
2000
2100
2200
2300
2400
2012 2013 2014 2015 2016 2017 2018 2019 2020 2021
RHODE ISLAND: Summer Peak Demand (MW)
Base forecast
Base minus EE in FCM
Base minus FCM minus EE forecast savings
7900
8200
8500
8800
9100
9400
9700
2012 2013 2014 2015 2016 2017 2018 2019 2020 2021
RHODE ISLAND: Energy Consumption (GWh)
Base forecast
Base minus EE in FCM
Base minus FCM minus EE forecast savings
36
Vermont: Energy Efficiency by the Numbers
• Energy-efficiency results, 2008-2010: – Total spending: $95.4 million – Total energy saved: 357.9 GWh
• Annual average: 119.3 GWh – Total megawatts of peak saved: 52 MW
• Annual average: 17 MW
• Energy-efficiency forecast, 2015-2021: – Total spending: $321.3 million – Projected total reduction in energy consumption: 625 GWh
• Annual average: 89 GWh – Projected total reduction in peak demand: 115 MW
• Annual average: 16 MW
• VT program administrators: – Efficiency Vermont: http://www.efficiencyvermont.com/Index.aspx – Burlington
Electric: https://www.burlingtonelectric.com/page.php?pid=62&name=ee_incentives
37
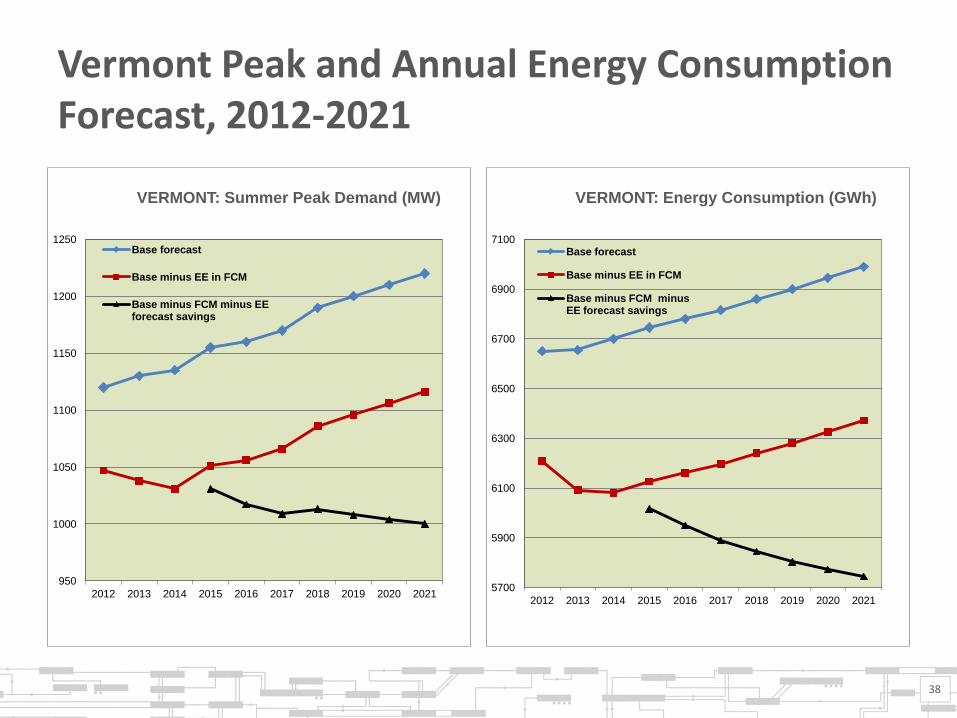
Vermont Peak and Annual Energy Consumption Forecast, 2012-2021
950
1000
1050
1100
1150
1200
1250
2012 2013 2014 2015 2016 2017 2018 2019 2020 2021
VERMONT: Summer Peak Demand (MW)
Base forecast
Base minus EE in FCM
Base minus FCM minus EE forecast savings
5700
5900
6100
6300
6500
6700
6900
7100
2012 2013 2014 2015 2016 2017 2018 2019 2020 2021
VERMONT: Energy Consumption (GWh)
Base forecast
Base minus EE in FCM
Base minus FCM minus EE forecast savings
38


