
Is the UK Moving Up the International Wellbeing Rankings?
David G. BlanchflowerDartmouth College, USA
andNational Bureau of Economic Research
Andrew J. OswaldUniversity of Warwick, UK
To be presented at an NBER conference on May 4, 2000
Abstract
Over the last quarter of a century the UK has not moved up the wellbeingleague tables. It remains near the bottom of the top ten industrialisednations. Satisfaction with life has not changed since the 1970s. Jobsatisfaction has declined over the 1990s. Satisfaction with democracy hasgone up. As is true throughout the European Union, UK workers say thatcompared with five years earlier they are now under much increased stressand pressure at work. When a standard mental stress measure is used toexamine employees’ well-being across 15 nations, the UK is around themiddle of the ranking.
Keywords: Life satisfaction, job satisfaction, labor, well-being, job security, mental health.JEL Classification: J28
________________________* The authors are grateful to the Leverhulme Trust and Nuffield Foundation for research support.Email addresses are [email protected] and [email protected]

1
I. Introduction
Economics is not just about resource allocation, demand and supply, and
prices. It is also concerned with more subtle variables -- with citizens’ utility,
well-being and happiness. Measuring these is difficult. Over the last few decades,
economists have concentrated on the pecuniary and material influences upon the
quality of people’s lives. They have looked predominantly at GDP, real wages,
wealth, and other real variables. Textbooks will no doubt continue to focus on
them. But utility, however conceived, is what ultimately lies at the bottom of the
problems that matter to economists and other kinds of social scientists.
This paper is written for a National Bureau of Economic Research
conference about the United Kingdom. The conference’s theme is encapsulated in
a question: has the economic performance of the UK been improving, and, most
particularly, rising relative to that of other nations? In other words, has the UK
been moving up the international league tables? In this paper we address that
issue in a way unconventional to most economists (though not to applied
psychologists). We look at data on subjective well-being. The paper examines
whether the UK been getting happier – in an absolute and relative sense.

2
II. Has the UK Moved up the Well-being Rankings?
The simplest way to measure well-being is by asking people questions about
how they feel about their lives. In the literature on subjective well-being,
psychologists have traditionally preferred life-satisfaction questions to most
others. It is believed that (compared to questions about happiness levels, for
example) such questions translate more readily across languages and cultures.
Useful introductions to the psychology literature on well-being data include
Campbell (1981) and Argyle (1987). An overview paper written from the
economist’s perspective is Oswald (1997). Easterlin (1974) is an early famous
contribution. Two survey papers by Diener (1984, with co-authors 1999), in one
of the world’s leading psychology journals, are accessible to non-specialists. He
discusses various economic influences upon the quality of life. Warr (1987, 1997)
provides a readable account of the links between work and mental health.
A natural place to begin is with Table 1. This sets out information on
random samples of British people from the years 1972 to 1998. The
Eurobarometer surveys are the source. Individuals in each year are asked the
question: On the whole, are you very satisfied, fairly satisfied, not very satisfied,
or not at all satisfied with the life you lead? The sample is not an especially large
one (slightly less than 2000 people per year). It is likely to be sufficient, however,
for the purpose of identifying broad patterns through the years.

3
It can be seen from Table 1 that British people are not becoming more
satisfied with their lives. There is no upward trend in well-being levels through
the decades. In the earliest group of years, which averages across 1972-6, 4% of
British individuals said they were not at all satisfied with their lives, and 31% said
they were very satisfied. A quarter of a century later, these numbers were almost
exactly unchanged. In the period 1994-8, 3% of Britons answered that they were
not at all satisfied with their lives, and 31% said they felt very satisfied. Even if
we look within each gender group, there is no trend up or down in reported well-
being. On this criterion, nothing fundamental has changed in Great Britain. For
more details, see Blanchflower and Oswald (1999a,b).
Some economists will be able to think of reasons for this lack of trend.
Others will argue that such data may be illusory and wish to turn back to
traditional real-income indicators. Nevertheless, the most straightforward
conclusion from these numbers is that, paradoxically, the near-doubling of real
incomes since the early 1970s does not appear to have fed through into greater
contentment with life. To most economists, this will be surprising. Money buys
happiness in all economics textbooks.
There seem to be three possible explanations.
• One possibility is that reported life-satisfaction data are so unreliable that the
evidence of flat well-being in Table 1 can be ignored.

4
• Another is that life satisfaction data are useful and reliable, and these numbers
are telling us that, whatever our preconceptions, economic progress is not
buying extra ‘happiness’ (perhaps because in a rich society human beings get
their happiness from relative income, so that the rising tide of economic
growth does not produce more utility for the average person, who finds that
unfortunately the neighbours also now have a Volvo and a snowmobile)
• A third possibility is that life satisfaction data are reliable in cross-section but
not in time series, or in other words, that human beings use language in a way
that automatically means they scale their answers by what they see around
them, so that to report oneself as very satisfied in modern Britain it is
necessary to do more than have more BMWs than one’s parents owned.
Distinguishing among these three hypotheses, and possibly others, is not
likely to be easy. Economists are unused to having to think about it. The
distinction between the second hypothesis (where GDP is not buying more well-
being) and the third (where it may be, but citizens’ answers conceal the fact)
seems particularly important. Since Richard Easterlin’s early work, economists
have largely preferred not to face up to the difficulty.
Table 2 turns to Britain’s relative performance as an economy and nation –
its position in an international ranking of life-satisfaction levels. Table 2 draws
5
upon answers to an identical life-satisfaction question asked in each of nine
European nations (with the same wording as above for Great Britain).
Table 2 is derived from pooled regression equations. The estimation uses a
common framework across nations and then calculates the coefficients on country
dummy variables. It shows that in the 1970s Great Britain ranked at number six in
the league table of these nine nations. By the end of the 1990s, it ranked at
number five. Britain’s place in the league table of life-satisfaction therefore
altered only fractionally over a quarter of a century. Denmark is top in each
period. Italy and France are consistently at the bottom of the rankings. No exactly
comparable data are available for the United States, so it is not possible to know
how, in this data set, the US would do in the league table of Table 2.
Measuring people’s answers to well-being surveys across nations is, of
course, likely to be fraught with problems. Translation difficulties and cultural
differences might lead, in principle, to spurious patterns in the rankings.
However, this may not be too serious if the aim is to study changes over time in
the rankings. Assuming such biases stay constant, the data should be usable. The
lack of movement in Britain’s place in the rankings of Table 2 therefore seems of
interest. At least by this type of measure, the quality of life in Britain has risen
approximately neither faster nor slower than elsewhere.

6
There is another way to assess well-being in a society. That is to use the
Human Development Index (HDI), which is produced annually by statisticians at
the United Nations. The index attempts to recognise that human welfare is not
adequately captured by GDP per capita. It is a composite of three main factors:
longevity, knowledge, and standard of living. Longevity is measured by life
expectancy. Knowledge is measured by a combination of adult literacy (given
two-thirds weight) and mean years of schooling (given one-third weight).
Standard of living is measured by real GDP per capita, after adjustment for the
local cost of living as captured by purchasing power parity PPP prices. The three
factors are then averaged to form the HDI index.
Country HDI rankings are given in Table 3. The early years were
constructed retrospectively (HDI methodology dates from the start of the 1990s).
As can be seen from Table 3, in 1975 there were ten countries that ranked above
the United Kingdom. These were Canada, Norway, the US, Japan, Sweden,
Netherlands, Iceland, France, Denmark and New Zealand. In 1997, eight of these
countries still ranked above or equal to the UK. France moved to be equal to the
UK, at an HDI score of 0.918. Denmark and New Zealand fell slightly below the
UK. These numbers again suggest that the United Kingdom has hardly changed
its position in the international league table. At best, it has improved fractionally
in quality-of-life rankings. Moreover, if 1990 rather than 1997 is used as the year,

7
twelve nations would rank above the UK. This suggests that the appropriate
judgement is probably that relative UK performance is essentially the same as it
was a quarter of a century earlier. The findings are consistent with those
suggested by the life-satisfaction rankings.
To provide a feel for the micro-econometric structure of well-being, Table 4
describes pooled life-satisfaction equations using Eurobarometer data from 1975
to 1998. The sample size slightly exceeds 450,000 individuals. It can be seen that
life satisfaction is U-shaped in age, is low among men, high among married
people, and noticeably low among the unemployed. These equations are ordered
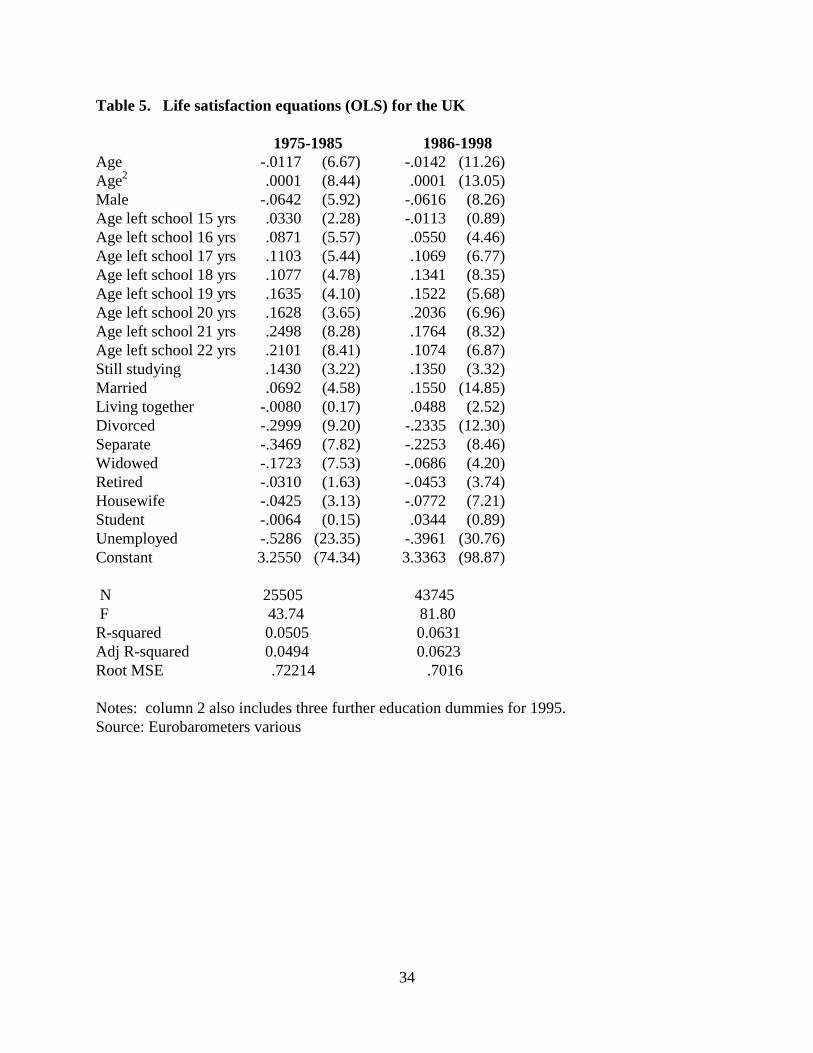
logits but the same conclusions emerge from simple OLS methods. Table 5 is in
the same spirit. It looks at the UK alone and has the same general structure.
Another way to measure well-being in an advanced country is to ask people
how pleased they are with the way democracy is working. Table 6 provides
information on the answers to that kind of question. It produces a little more
evidence of a rise for Britain up the international league tables. Again the
approach is to take random samples of individuals, run regressions with a measure
of satisfaction (in this case with the state of democracy in the nation) as the
dependent variable, and read off the coefficients on country dummies.
Luxembourg is the clear winner in this case. By contrast, Italy and Belgium come
in Table 6 at the foot of the ranking. The United Kingdom starts off in the 1970s
8
at place 5 in the nine-nations table; it moves to number 6 through the 1980s; it
then jumps in the 1990s to 4 and then 3.
III. Well-being at Work and Job Satisfaction
We now turn to satisfaction with work and jobs. What has been happening
to the quality of working life in the United Kingdom? The study by labor
economists of job satisfaction is still in its infancy. This may be, in part, because
economists are suspicious of the usefulness of data on reported well-being.
However, it is known that satisfaction levels are correlated with observable
phenomena (such as quit behavior).
The paper again uses multi-country data. In this case the numbers come
from three sources – the International Social Survey Programme, the
Eurobarometer Surveys, and the US General Social Surveys. While the literature
by economists is small, it has begun to grow recently with the research of, among
others, Andrew Clark and Daniel Hamermesh.
Early papers by economists on job satisfaction include Borjas (1979),
Freeman (1978) and Hamermesh (1977). Blanchflower (1991) is a recent attempt
to use data on feelings of job insecurity within a conventional wage equation. A
fast-growing modern literature on the border between economics and psychology
includes Akerlof et al (1988), Birdi et al (1995), Clark (1996, 1998), Clark and
Oswald (1994, 1996), Clark et al (1995), Curtice (1993), Di Tella et al (2000),

9
Frey and Stutzer (1999), Judge and Watanabe (1993), Kahheman et al (1997),
Levy-Garboua and Montmarquette (1997), Ng (1996, 1997), Pavot et al (1991),
Sui and Cooper (1998), and Veenhoven (1991). A slightly earlier empirical paper
on relativity effects and utility is Van de Stadt et al (1985). Frank (1985) contains
many interesting ideas that cross disciplines. Inglehart (1990) is a large study
using the Eurobarometer surveys; it reports data on overall well-being for a range
of western countries. Spector (1997) is a new overview of the job satisfaction
literature. Parts of his book make interesting though unfamiliar reading for an
economist. Recent studies of job satisfaction among managers include Worrall
and Cooper (1998) for Great Britain, and Spector et al (1999) for a group of
twenty-two countries.
Unfortunately, there appears to be no consistent series on job satisfaction in
Britain for a long period. An early series taken from the General Household
Survey is presented in Appendix A for the period 1973-1983 and is basically flat.
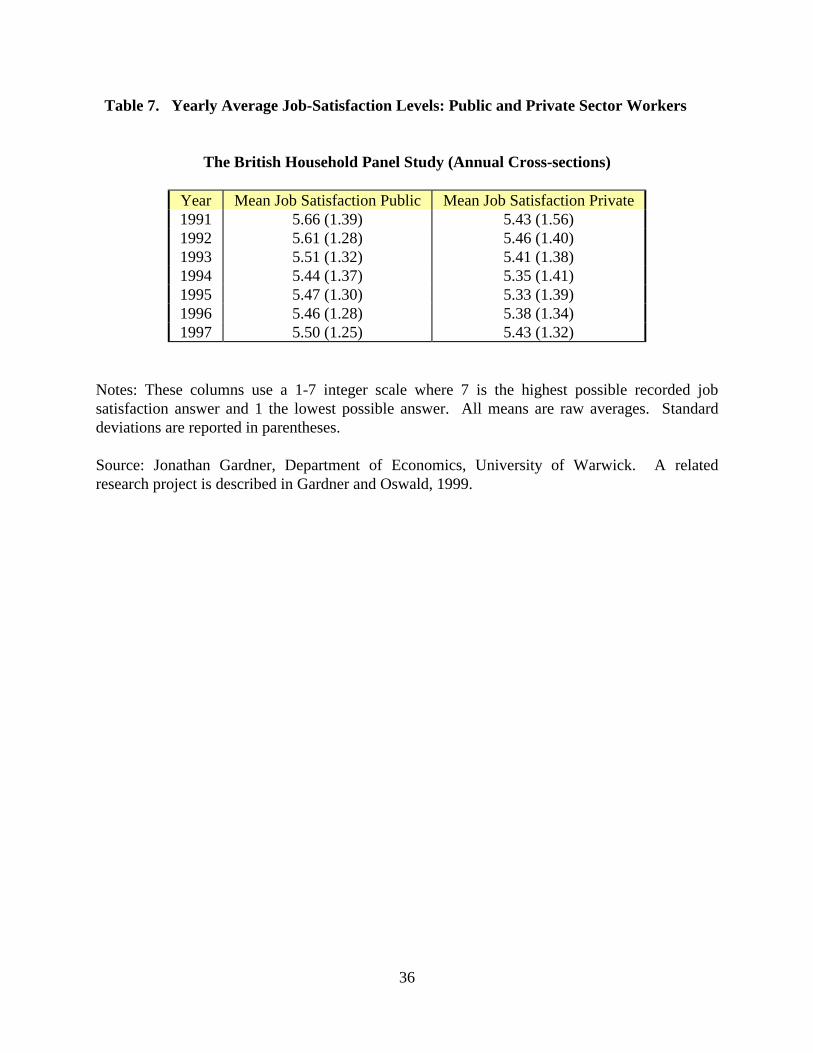
Table 7 contains the best modern data for 1990s Britain. They are drawn from the
British Household Panel Survey. Answers are on a seven-point scale in response
to a question about workers’ overall job satisfaction. In this survey, almost all
individuals put themselves in the top three categories (that is, the job-satisfaction
levels 7,6,5). Over the period, there is no statistically significant time-trend in job
satisfaction in Britain’s private sector through the 1990s. By contrast, the trend is
10
down in the public sector (the t-statistic slightly exceeds two: regression not
reported). Thus in the public sector in Britain, life has apparently been recently
getting worse for workers.
The lack of upward trend in well-being in the British workplace is in the
spirit of the conclusions of Blanchflower and Freeman (1994). After sifting
through evidence on the reforms brought about by Prime Minister Margaret
Thatcher, they concluded that there was no evidence of a fundamental change in
the way the labour market worked in Great Britain. It would be desirable to have a
longer run of data. We return to this, in an imperfect way, later in the paper.
As a benchmark for Britain and other European countries, it is natural to
study the United States. One reason is that this is the country for which there is
the longest run of randomly sampled workers. The data – drawn from the US
General Social Survey -- start early in the 1970s. Table 8 gives the pattern of job
satisfaction responses up to the late 1990s. The question wording is
On the whole how satisfied are you with the work you do – would you say you arevery satisfied, moderately satisfied, a little dissatisfied, or very dissatisfied?
While the size of sample is not large (at just under 1000 American workers per
year), and these are cross-sections rather than a longitudinal sample, the GSS
reveals useful patterns in Table 8. First, the great majority of US workers express
themselves as rather content with their work. Approximately half say they are

11
very satisfied, and forty per cent moderately satisfied. Only a tiny fraction of the
population put themselves in the very-dissatisfied category. This is similar to the
finding in British data, and appears to allow us to reject any simple version of the
idea – traditionally found in Dickens and Marx -- that work exploits people. It
also makes less plausible the commonly heard journalistic view that stress at work
is overwhelming modern Americans. This is not to imply that job-satisfaction
numbers should be accepted uncritically, but that the first pass through the data
seems to reveal a good degree of contentment at work.
Labor economists -- raised on data and theories of rationality -- are perhaps
more likely than some social scientists to expect workers to express satisfaction
with their jobs. It is known that people move around a great deal early in their
careers. They sort themselves into jobs that they like and out of jobs they dislike.
To sample the well-being levels of a cross-section of employees, therefore, is to
sample a group of individuals who are already heavily self-selected into suitable
occupations.
Table 8 shows there is a small but systematic downward trend in the
satisfaction numbers reported in American workplaces (a formal test can be done).
Through the 1990s, for example, approximately 46% of workers gave the top
answer ‘very satisfied’ to the satisfaction question. Yet in the 1970s, 51% of
workers said very satisfied. A reason to find this unusual is that by objective

12
standards the safety and cleanliness (and probably physical arduousness) of
working life in America have been improving through the decades. Table 8B
explores this a little more. It breaks down the time movements by different
sections of the population. For people over age 30, the trend towards lower
reported well-being at work is more marked. Here the average proportions giving
the top score are:
1970s: 56% of over-30s Americans were very satisfied
1980s: 52% were very satisfied
1990s: 48% were very satisfied.
The trends are not very different between men and women (which might be
viewed as unexpected because of a presumption that gender discrimination has
dropped over the last few decades).
Our finding of falling American job satisfaction is consistent with a small
amount of earlier research. Blanchflower et al (1993) documented at best flat
well-being levels through time in Britain and the US. Although not his primary
concern, new work by Hamermesh (1998) documents signs of diminishing job
satisfaction among young workers in the 1978-88 and 1984-1996 periods of the
NLSY for the United States, and in the 1984-96 SOEP for Germany. Hamermesh
is actually fairly sceptical of his results (p.21: “difficult to believe…at a time when
real earnings were rising”).
13
If the next twenty-five years make clear that the trend is not a fluke of recent
decades, it will become important to understand the reason for a downward spiral
in reported well-being. One mechanical possibility is that Americans now use
words differently: they are no less content with work than their parents but they
put things in more vehement language when asked. On such a view, the trend
down in the satisfaction scores is an illusion, and modern workers simply express
themselves more critically about everything (including their own lives) than their
fathers and mothers. Although this eventuality cannot be discounted, it does not
seem natural to believe that use of language has changed in this way in a short
space of time. Moreover, if this were true, it would presumably mean that the
younger sample (the under 30s) would show up as having the largest ‘decline’ in
job satisfaction. The older sample could be expected to be disproportionately
made up of individuals using language as they did when they young. As the data
show that it is the older workers who have become particularly less content, the
hypothesis that declining satisfaction is an artefact of our surveys -- caused by a
changed use of language -- is less compelling.
The Appendix shows in Table B1 that, in the General Social Surveys
studied here, respondents do seem to have become a little less confident about job
prospects over the last two decades. These data are not well known. At the end of
the 1970s, around 70% of people in the US thought it was not at all likely they

14
would lose their jobs. By the end of the 90s, this % had dropped to the low 60s.
More revealingly, in Table B2, a regression equation for ‘perceived likelihood of
job loss’ has a statistically significant upward time trend. Perceived ease of
finding another comparable job has also moved in the direction of increased
insecurity: in Table B2 its time trend is down.
What of job satisfaction levels in other advanced nations? Tables 9 and 10
present cross-sectional information from the International Social Survey
Programme of 1989, and from two Eurobarometers conducted in 1995 and 1996.1
It can be seen from Tables 9 and 10 that, as for the US General Social Survey,
there is strong bunching of ISSP and Eurobarometer answers at the high end of the
job satisfaction scale. Again the old idea that the drudgery of work exploits
human beings is -- at least at face value -- apparently not true.
On both Tables 9 and 10, individuals in Southern Ireland appear to record
the greatest job satisfaction. Another highly satisfied nation is Denmark. By
contrast, Hungary and the Mediterranean countries (Greece, Italy, Spain, France,
Portugal) show up far down the job-satisfaction world league table. According to
Eurobarometer data, 38% of Greek employees say they are dissatisfied.
1 For earlier work on job satisfaction using the International Social Survey Programme data, see Blanchflower (2000)and Blanchflower and Freeman (1997). Curtice (1993) and Clark (1998) also use ISSP data.
15
Because the surveys ask questions in different languages in different
countries, there exists the chance that the Greek and other results are illusory.
They may be a trick of how words translate. It is not possible to overturn such a
view conclusively. But two counter-arguments are worth considering. The first is
that psychologists are well aware of such – translation – objections. For this
reason, as mentioned earlier, there is a preference among researchers for
satisfaction questions, rather than happiness questions, because it is believed that
the word ‘satisfaction’ translates with less international error from one language to
the next. The second is that large differences are discovered even across nations
using the same language, so differences nation-by-nation cannot be attributed
solely to the language of the survey team. Moreover, in Table 10, Ireland comes
out top among the three English-speaking nations here (57% very satisfied). This
is despite the fact it is not a rich country: the United Nations Human Development
Report estimates Ireland’s GDP per head at around half that of the US, and about
two thirds of the UK’s (all measured at purchasing power parity prices). By
contrast, in the United Kingdom, for example, only 38% of workers in Table 10
report themselves as very satisfied. Why the Irish should be so much more
satisfied is unclear.
It should be noted that the sizes of the samples continue to be relatively
small: approximately 1000 workers are sampled from each country in
16
Eurobarometers and slightly less than this in the International Social Survey
Programme. We have no reason to doubt the quality of the sampling, but it would
be comforting to have larger numbers of workers. This is another reason to treat
the estimates cautiously.
International job-satisfaction league tables, derived from regression
methods, are given in Table 11. One ranking uses World Values Survey data for
1981 and 1991. Britain is at number 10 in both years. Looking only at eight
European nations, Britain is at number 5 in both years. Again this suggests that
little fundamental has altered in the British economy relative to other nations’
economies. Table 11, part B, shows too that in ISSP data between 1989 and 1997
Great Britain enters a seven-nation league table at first at number five and then at
number six.
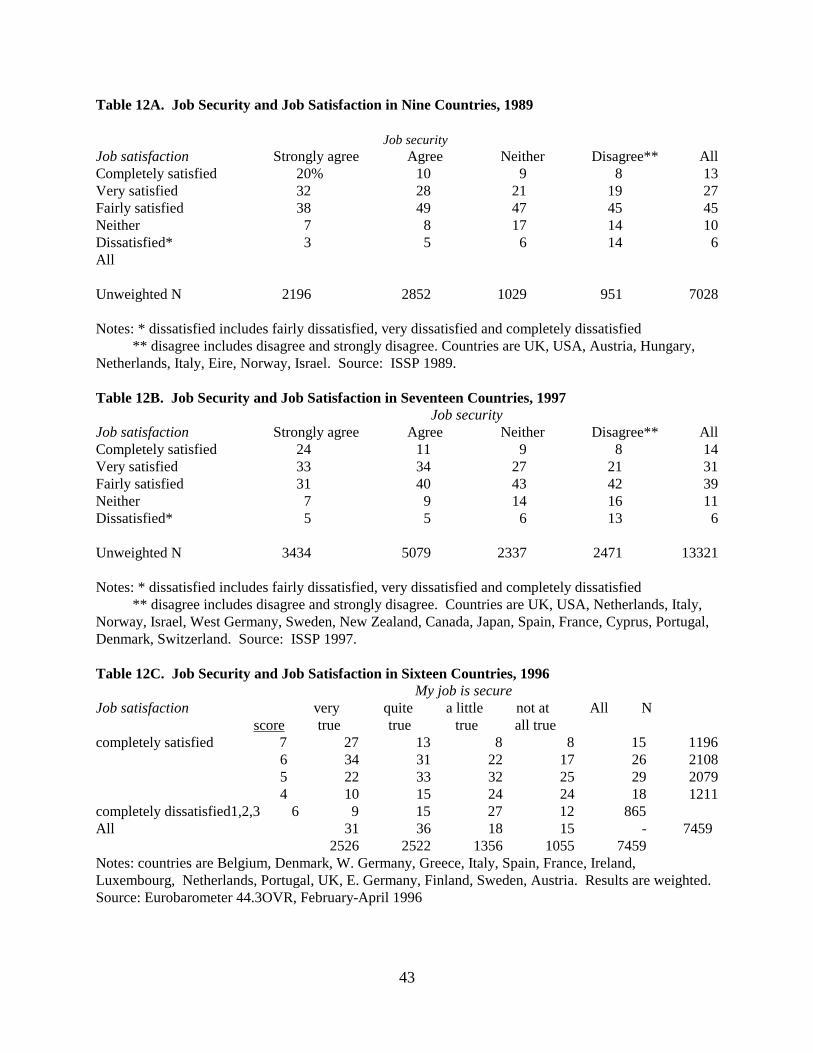
There is a strong connection in the European data between feeling secure
and saying one is satisfied with a job. Table 12 summarizes the numbers (a recent
study of European job insecurity is OECD, 1997). People who state their job is
secure have a much larger probability of reporting themselves happy with their
work. In the 1997 ISSP, for example, Table 12B shows that of those who strongly
agree that they are secure in their jobs approximately 57% say “completely
satisfied” or “very satisfied”, while the figure is only 29% among the sub-sample
disagreeing or disagreeing strongly.
17
The structure of job satisfaction equations is shown in Table 13. Here the
sample is six countries that are present in both the 1989 and 1997 sweeps of the
International Social Survey Programme (i.e. West Germany, the UK, the USA,
Norway, Netherlands and Italy). Table 13 is an ordered logit for the ISSP sample
of approximately four thousand workers in the two years. Men are much less
satisfied; age enters positively, schooling is insignificant while unions continue to
be associated with less job satisfaction. The union result goes back at least to
Freeman (1978) and continues to puzzle researchers; it may simply be reverse
causation led by the tendency of displeased workers to seek union representation.
Most strikingly, job security enters strongly monotonically in Table 13 in both
years. As a rule of thumb, its effect is the largest in the data sets we have seen.
This finding may not be known to most labor economists, or even most
psychologists. In the final column of the table a job satisfaction equation is
estimated for the UK using data pooled across the two years. Job security is an
important determinant of job satisfaction in the UK. The significant 1997 dummy
suggests that job satisfaction declined between 1989 and 1997 in the UK.
Workplaces differ in many ways that are not captured in the controls of
Table 13. A range of job characteristics are therefore introduced in Table 14. As
would be guessed, human beings like to work independently and in workplaces
with high pay and good chances of advancement. They also like to ‘help people’

18
and to work in healthy rather than unhealthy conditions. It might be reasonable
for an economist to object that some -- perhaps even most -- of these subjective
judgments could be close to generating truisms in the data, but we report them
because these are the patterns found in our surveys. The result that people enjoy
independence is well-known to psychology researchers. It is sometimes referred
to as an example of the ‘locus of control’ hypothesis. Spector et al (1999) is a
recent paper looking at a similarly large range of nations. As we found above for
the USA, having a secure job increases job satisfaction: the easier it is to find a
similar job the higher is satisfaction. In these countries also, job security is an
important determinant of work satisfaction. In Table 14, job satisfaction equations
for the Eurobarometer Survey #44.3 for February-April 1996 are reported. As in
the tables of means, Ireland is comfortably top of the satisfaction ranking, and
Greece bottom. The same microeconomic patterns are found as in other data sets.
There is a well-determined U-shape in age; men are less satisfied; the self-
employed, public sector people and supervisors are more satisfied; education
enters here positively. It ought to be noted that there is no income variable; this
data set does not provide it. Detailed job-satisfaction equations, done separately
for male and female sub-samples, are reported in the second and third columns of
Table 14. Variables are included that capture the quality of the job. For example,
Table 14 reveals that satisfaction is greater in quiet workplaces, ones with no

19
gaseous vapours, ones where workers say ‘no painful or tiring positions’, where
employees control the equipment, their work pace, where they do not have to carry
loads or work at high speed. Working at home appears to be associated with
raised satisfaction for women but not men. The ability to control the temperature
and ventilation is correlated with higher satisfaction. Employees who identify a
health and safety risk at their workplace are much more likely to say they are
dissatisfied. Unsurprisingly, women appear to value equal opportunities at work.
We find no significant evidence that the gender of one’s boss has an effect on job
satisfaction for either men or women. In the full 1996 sample, Ireland retains its
top spot in Table 14. In Table 14, Great Britain is in the middle of the job-
satisfaction league table.
As a sense of job security plays an influential role in the satisfaction
equations, it seems sensible to examine the structure of cross-section equations in
which job security is in turn a dependent variable. This is what Table 15 does for
the countries in the International Social Survey Programme. In the survey
interviews, individuals were given the option of replying to the question “How
much do you agree or disagree that your job is secure?”. Answers were coded as:
strongly agree, agree, neither, disagree, strongly disagree. Most individuals do not
fear imminent job loss. Across the sample of countries, 72% of people in 1989
said they either agreed or strongly agreed that their job was secure compared with
20
64% in 1997 for a somewhat longer list of countries. Table 15 attempts to uncover
the microeconometric structure of perceived job security using the ISSP for 1987
and 1997. It estimates ordered logit equations using as independent variables: a
set of country dummies, age, gender, education, whether a supervisor, union
member, and public sector employee. The two years are pooled in the final
column to estimate a separate equation for the UK.
Table 15 is based on two cross-sections rather than longitudinal data, and
makes no identifying assumptions. It would therefore be unwise to place causal
interpretations upon it. Nevertheless, the correlations are such that job security is
greater among older workers, union members and, perhaps rather surprisingly,
women. Translation of ‘job security’ in a consistent way across different
languages is likely to be imperfect. However, it is worth noting that the United
Kingdom performs consistently badly on the security score (see also Turnbull and
Wass, 1999), and that this is true when judged against also two other English-
speaking countries, namely, the US and Ireland. In contrast to the full-sample
findings in the first two columns, the third column of Table 15 shows that job
security in the UK sample falls by age. In addition, job security in the UK appears
to have declined over time – when a 1997 dummy is included it is significantly
negative (this result is not reported in Table 15). Interestingly, in the third column
of Table 15, the significant interaction term between years of schooling and the

21
year dummy suggests that job security has fallen most in the UK for the more
educated2.
These findings mean that job satisfaction equations that omit job-security
measures may tend to generate upwardly-biased coefficients on public-sector
dummy variables. Of course this would be likely to change over time and by
country: Gardner and Oswald (1999) show that in the UK the size of the public-
sector satisfaction premium seems to have fallen sharply through the 1990s.
IV. Stress and Mental Well-being
Also included in the 1996 Eurobarometer Survey was a series of questions
which allow us to examine psychological health. One issue is whether declining
job satisfaction and increased job security have affected workers’ mental well-
being. Table 16 provides the responses to a series of questions that asked workers
whether they had a)…lost much sleep over worry, b)…been feeling unhappy and
depressed, c)…been losing confidence in yourself, d)…been feeling you could not
overcome your difficulties, e)…been feeling constantly under strain, f)…been
thinking of yourself as a worthless person? These questions may appear strange to
economists but are standard questions that are traditionally combined to form part
of a so-called GHQ score (or General Health Questionnaire score). Among
2 This specification works much better than when the interaction term is omitted.

22
European medical statisticians and psychiatrists, the GHQ level is the most widely
used questionnaire method for detecting low-grade mental health problems and
stress (in other words, mild forms of psychological morbidity). It originates from
the work of Goldberg (1972). As might be imagined, for serious mental illness
GHQ is not viewed by doctors as so appropriate, and is supplanted by clinical
examinations. In its most basic form, GHQ simply sums the number of times a
person puts himself or herself in the stressed category. Only a semi-GHQ score
can be calculated here. That is because only six questions (instead of the usual 12)
are asked.
The first six columns of Table 16 report the percentage saying “not at all” to
each of the stated questions. The final column gives the semi-GHQ score, which
adds up the six components, and reports the aggregate outcome as a stress proxy.
Table 16’s final column is interesting because it may be a moderately comparable
test for stress across workers from a range of different countries. The most-
stressed countries – in these samples of workers -- are Italy (with a semi-GHQ
stress level of 1.35), France (0.99) and Spain (0.89). The least-stressed are Eire
(0.33) and Sweden (0.46). These results are interestingly reminiscent of aspects of
the job-satisfaction league tables. Great Britain is slightly above the mean level of
mental well-being in the European 15. Its semi-GHQ score is 0.71 compared to

23
the mean for the whole sample of countries of 0.81. On this measure, British
workers are fractionally less stressed than is the norm in Europe.
Tables 17 and 18 take the same data and examine the overall determinants
of stress and its constituents. In Table 17, a series of ordered logits are estimated
where the dependent variable takes one of the values ‘not at all”, “no more than
usual”, “rather more than usual” and “much more than usual”. Hence a positive
coefficient is to be interpreted as showing the variable is associated with higher
stress and lower mental well-being. According to the GHQ mental stress
equations of Table 18, stress levels increase in age, are higher for females than
males, and are strongly increased by the number of hours worked and job
insecurity, and eased by a healthy financial situation. Based on the semi-GHQ
score in the second column of Table 18 (where the European-15 mean GHQ =
0.95, meaning stressed on approximately one category on average), overall stress
levels appear to be particularly low in Southern Ireland and especially high in
Italy. The third column of Table 18 reports the results of estimating a probit
equation where the dependent variable is set to one if the worker replied positively
when asked if he or she worked under “a great deal of pressure”. Perceived
pressure appears to be greater in the private than in the public sector, and for those
with longer hours and tenure.

24
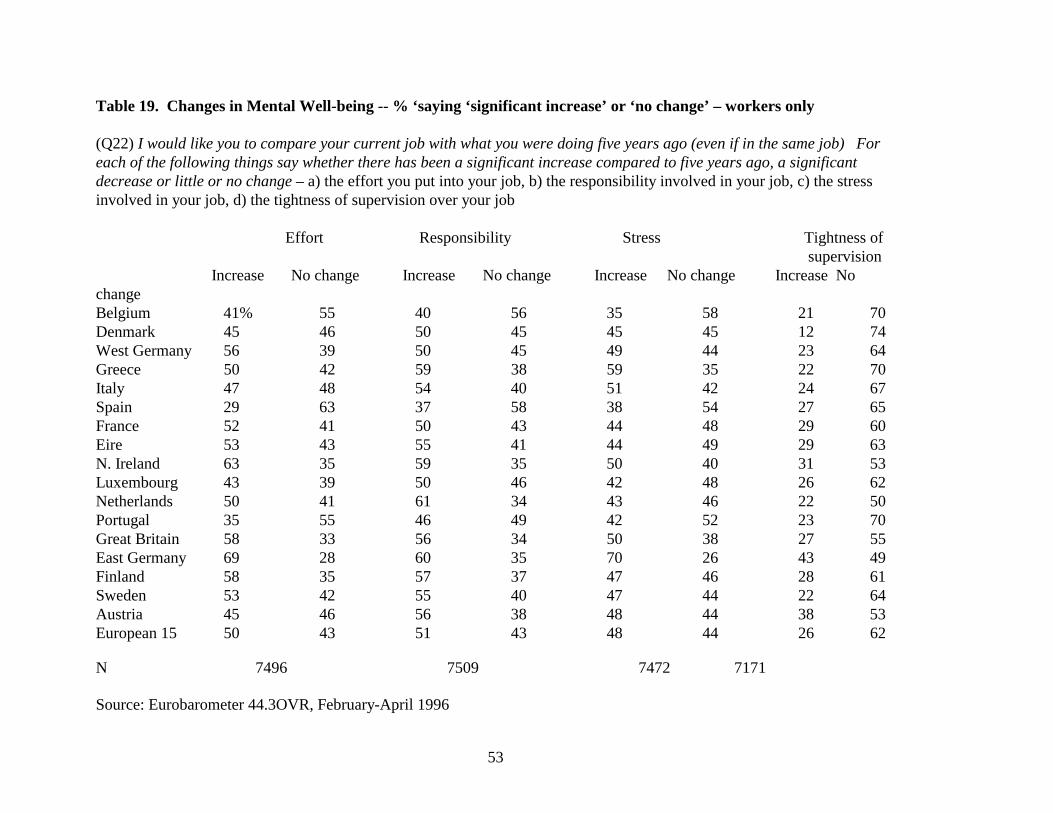
What has been happening through the 1990s to stress levels in these
nations’ workplaces? Has Britain fared worse or better than most? While
imperfect because it is retrospective, Table 19 provides a starting point to answer
those questions. Workers were asked in the 1996 survey to compare their current
job with what they were doing five years ago (even if in the same job) and say
whether there had been an increase compared to five years ago in (a) the effort
they put into their job, (b) the responsibility involved in their job, (c) the stress
involved in their job, (d) the tightness of supervision over their job. Table 19
gives the percentages of people who report an increase and those saying no change
(the remainder, omitted, is of course the small percentage reporting a decrease3).
In all cases there is evidence in Table 19 of large perceived increases in strain over
time. Roughly half of all Europe’s workers believe that there has been in their
workplace a significant rise in effort, responsibility and stress. Approximately a
quarter believe that the tightness of supervision has gone up significantly.
It is not easy to know what to make of the numbers in Table 19. Taken at
face value, they seem remarkable, and perhaps worrying for the Western
3 The overall distributions, weighted to be representative of the European 15 were as follows (%)
Not at all No more than Rather more Much more usual than usual than usual
a) Sleep 46 35 15 4b) Unhappiness 49 35 12 4c) Lost confidence 67 24 7 2d) Difficulties 56 31 11 2e) Strain 42 37 16 4

25
democracies. A natural response is to wonder if human beings accidentally or
deliberately exaggerate their difficulties. Perhaps the numbers in Table 19 are
unreliable. However, one reason to question the idea that answers to such
questions are automatically biased up is found in the final column: perceived
tightness of supervision has worsened much less. Hence 50% saying that things
are worse is not an inevitable outcome from questionnaire inquiries.
In Table 19, Britain is fairly close to the average country across the
European 15. On increases in ‘tightness of supervision’ and ‘stress’, the British
figures are almost identical to the mean for the sample of nations. There is more
divergence in the questions about rising effort and responsibility. For example,
58% of British workers say that there has been a significant increase in the effort
required in their job. Across the European 15, the average is 50% of workers
saying that.
To explore the characteristics of the people most prone to view things as
getting worse, the first four columns of Table 20 report probit equations. These
are for the probability of giving different responses for each category (with the
dependent variable set to 1 if an increase was reported and zero if a decrease or no
change). The dependent variable in the final column of Table 20 is an amalgam: it
is the sum of the responses in the previous four columns -- with a value of four if
_____________________________f) Worthless 78 17 4 1

26
the respondent reported increases in each of the four elements and so on down to
zero if no perceived increases were revealed (European 15 mean=1.75). Raised
stress, effort, responsibility and tightness of supervision all turn out to be
negatively correlated with age, and -- except for ‘responsibility’ -- lower for men
than women. Increases in these strain variables are positively correlated with
hours of work and greater job insecurity. Growth in the various items has been
especially marked in East Germany, and least noticeable in Belgium (the excluded
category). Britain fares poorly in this Table. The final column of Table 20 puts
Great Britain as the third most-likely country to see increases in the amalgamated
stress measure. The two above it are East Germany and Northern Ireland.
In Table 20, burdens appear to be worsened, as would be expected, by
financial difficulties. For each of these equations, we also report coefficients and
t-statistics on sets of industry, occupation and establishment size dummies. In
each column, there is evidence that mental stress is greater for non-manuals than
manuals; is increasing in establishment size, but appears to flatten out around five
hundred employees; and is relatively high in financial services.
Table 21 provides, for two cross-sections in the 1990s, a set of probit
equations for the probability of reporting stress, tiredness, fatigue and sleep
problems. The dependent variable draws on questions of the kind “How often do
you find your work stressful? Always, often, sometimes, hardly ever, never.” The
27
patterns in the table are again consistent with those in earlier tables of various
kinds. Once more, for example, unionism is associated with greater stress and
greater tiredness. Interpretation of the coefficients across countries is again likely
to be fraught with difficulties. Ireland scores well -- although not perfectly
consistently across the columns of Table 21 -- with low measured strain. By
contrast a nation like Greece has notably weak performance: it comes near the top
of the strain league. In Table 21, Britain also does relatively poorly.
V. Conclusions
This paper studies the quality of life in the United Kingdom. Three
questions are examined. First, is well-being improving? Second, where does the
United Kingdom lie in international well-being league tables? Third, has it been
moving up those rankings?
The paper uses information from surveys of random samples of individuals.
Although it could be argued that economists should not concern themselves with
workers’ well-being, we find it hard to see a cogent case for such a position.
‘Utility levels’ are implicitly studied in most published work in economics; there
are systematic patterns in these data sets; satisfaction scores are correlated with
observable behavior; psychologists, who ought to know more than economists
about how to measure well-being, have in their research journals used such
statistics for years.
28
Our data come in the form of responses to questions such as “How satisfied
are you with life as a whole?”, “How satisfied are you with your job?”, and “Have
you lost much sleep over worry?”. People’s answers, the paper shows, are
systematically correlated with personal characteristics.
There are a number of conclusions. Partly because of the lack of
longitudinal data, it is not always straightforward to draw causal inferences.
• On most of the measures used here, life is not improving in the United
Kingdom.
• The UK does respectably, but not outstandingly, in international league
tables. It generally appears near the bottom of the top-ten countries.
• As an approximation, over the last few decades the UK’s position has
neither risen nor fallen in the well-being rankings. Satisfaction with
democracy, however, has increased a little in the UK relative to other
nations.
• Job satisfaction levels have declined in the UK through the 1990s. This
decline has been centred in the public sector. By way of comparison,
there has been a slight but steady fall in job satisfaction in the US
between 1973 and today. These patterns are not yet well-understood.
• Strong microeconomic patterns exist in satisfaction data. They are
approximately the same in all countries. Unemployment (or expectations

29
of possible job loss) has one of the largest discernible negative effects on
subjective well-being.
• Workers across the European Union believe they are under much greater
stress and pressure than earlier in the 1990s. A significant proportion
report being constantly under strain, losing sleep over worry, losing
confidence in themselves, and feeling unhappy and depressed. In
comparison with their situation five years earlier, workers reported
dramatic increases in the amount of stress, responsibility, and effort.
Life at work is perceived to be tougher than at the start of the 1990s -- in
the UK and elsewhere.
• There is some evidence that strain at work has increased more in the UK
than in most countries.
• Workers’ mental well-being levels appear to be especially high in Ireland
and Sweden, and especially low in Italy, France and Spain. The United
Kingdom is in the middle of the international ranking.

30
Table 1
Reported Well-being Levels Over the Last Quarter of a Century in Great Britain
The proportions of people giving different life-satisfaction answers in Great Britain 1973-98
1972-1976 1977-1982 1983-1987 1988-1993 1994-1998
All – not at all satisfied 4% 4 4 4 3All – not very satisfied 11 10 10 10 10All – fairly satisfied 54 54 55 55 57All – very satisfied 31 32 31 31 31
Male – not at all 4 4 4 4 4Male – not very 11 10 10 10 10Male – fairly 55 55 57 57 58Male – very 30 31 29 29 29
Female – not at all 4 4 3 3 3Female – not very 12 10 10 11 9Female – fairly 53 53 54 54 55Female – very 32 34 32 32 32
Q: “On the whole, are you very satisfied, fairly satisfied, not very satisfied, or not at all satisfied with the life youlead?”. Approximate sample size is 2,000 people per year.
Source: Eurobarometers – Great Britain

31
Table 2
Life-Satisfaction Country Rankings Through Time: Nine Nations with ApproximatelyHalf a Million Randomly-Sampled Europeans
Number 1 indicates the top-ranked nation on a life-satisfaction scale (Denmark’s citizens reportthe highest life-satisfaction levels). Number 9 indicates the bottom-ranked nation.
1973-79 1980-84 1985-89 1990-94 1995-98 Av73-98 1975-98*Belgium 3 6 7 6 6 6 7Denmark 1 1 1 1 1 1 1Eire 4 4 5 4 4 4 4France 8 8 8 8 9 8 8Italy 9 9 9 9 8 9 9Luxembourg 5 3 3 3 3 3 3Netherlands 2 2 2 2 2 2 2UK 6 5 4 5 5 5 5West Germany 7 7 6 7 7 7 8
N 92896 71185 103946 127523 77420 472970 452613
These are constructed from the coefficients on country dummy variables in regression equations.
Note: Regression controls in the first six columns =age, age square and male.* Regression controls in the last column =age, age square, male, 5 marital status dummies,4 labor force status dummies and 12 age left school dummies. Education not available in1973 hence it is omitted in 1973. Information on education is in 4 categories in 1995compared with 10 for the remaining years. In all years it was possible to identify thosestill studying. Hence two separate education dummies were also included for 1995.
Source: Eurobarometers – various.

32
Table 3
Human Development Index (HDI) Values Through Time
1975 1980 1985 1990 1997
1 Canada 0.862 0.879 0.901 0.924 0.9322 Norway 0.850 0.869 0.880 0.891 0.9273 United States 0.865 0.885 0.897 0.911 0.9274 Japan 0.851 0.875 0.890 0.906 0.9245 Belgium .. .. .. .. 0.9236 Sweden 0.859 0.869 0.880 0.888 0.9237 Australia 0.838 0.855 0.867 0.880 0.9228 Netherlands 0.856 0.868 0.883 0.896 0.9219 Iceland 0.853 0.874 0.884 0.902 0.91910 United Kingdom 0.840 0.848 0.856 0.876 0.91811 France 0.848 0.864 0.875 0.896 0.91812 Switzerland .. .. .. .. 0.91413 Finland 0.834 0.855 0.871 0.893 0.91314 Germany .. .. .. .. 0.90615 Denmark 0.861 0.869 0.878 0.885 0.90516 Austria 0.836 0.849 0.863 0.886 0.90417 Luxembourg .. .. .. .. 0.90218 New Zealand 0.843 0.852 0.862 0.872 0.90119 Italy 0.824 0.842 0.852 0.875 0.90020 Ireland 0.811 0.824 0.839 0.863 0.90021 Spain 0.814 0.834 0.851 0.871 0.89422 Singapore 0.737 0.767 0.796 0.834 0.888
Note: The HDI index amalgamates information on real income per head, longevity, mean yearsof schooling, and the degree of adult literacy.
Source: Human Development Report, United Nations.

33
Table 4. Life Satisfaction Equations for a Sample of European Nations, 1975-1998
All Males Females
Age -.0419 (35.91) -.0459 (26.52) -.0369 (23.21)Age squared .0004 (39.53) .0005 (28.98) .0004 (26.09)Male -.1499 (22.21) n/a n/aBelgium .8902 (72.14) .8841 (49.75) .9021 (52.49)Netherlands 1.5829 (126.77) 1.4872 (82.73) 1.6921 (97.04)West Germany .6379 (52.85) .6142 (35.37) .6740 (40.04)Italy -.0444 (3.70) .0002 (0.01) -.0775 (4.62)Luxembourg 1.3698 (81.02 1.3045 (54.62) 1.4533 (60.51)Denmark 2.2004 (170.26) 2.1316 (115.65) 2.2707 (124.93)Eire 1.1300 (88.90) 1.0673 (58.80) 1.2149 (67.92)UK 1.0638 (90.80) 1.0298 (60.92) 1.1153 (68.43)Married .3735 (40.14) .3119 (24.17) .4325 (31.45)Living together .1117 (6.98) .0905 (4.04) .1339 (5.82)Divorced -.5524 (29.63) -.3975 (13.28) -.6371 (26.34)Separated -.7222 (25.86) -.6437 (14.18) -.7611 (21.34)Widowed -.2876 (19.13) -.3283 (12.04) -.2083 (10.90)Retired -.0386 (3.28) -.0200 (1.18) -.0976 (5.72)Houseswife -.0499 (5.22) -.1954 (3.39) -.0804 (7.37)Student .0895 (3.43) .0744 (2.12) .0978 (2.50)Unemployed -1.0577 (79.47) -1.2924 (71.36) -.7839 (39.74)
cut1 -3.3065 -3.0962 -2.8880cut2 -1.6546 -1.4763 -1.1995cut3 1.2390 1.4398 1.6819
N 452613 219182 233413LR chi2 72475.05 33840.7 39413.4Pseudo R2 .0755 .0728 .0795Log likelihood -443984.58 -215387.3 -228101.2
Notes: France is the excluded country. Equations also include 12 age-left-school dummies and23 year-dummies.
Source: Eurobarometers – various.
34
Table 5. Life satisfaction equations (OLS) for the UK
1975-1985 1986-1998Age -.0117 (6.67) -.0142 (11.26)Age2 .0001 (8.44) .0001 (13.05)Male -.0642 (5.92) -.0616 (8.26)Age left school 15 yrs .0330 (2.28) -.0113 (0.89)Age left school 16 yrs .0871 (5.57) .0550 (4.46)Age left school 17 yrs .1103 (5.44) .1069 (6.77)Age left school 18 yrs .1077 (4.78) .1341 (8.35)Age left school 19 yrs .1635 (4.10) .1522 (5.68)Age left school 20 yrs .1628 (3.65) .2036 (6.96)Age left school 21 yrs .2498 (8.28) .1764 (8.32)Age left school 22 yrs .2101 (8.41) .1074 (6.87)Still studying .1430 (3.22) .1350 (3.32)Married .0692 (4.58) .1550 (14.85)Living together -.0080 (0.17) .0488 (2.52)Divorced -.2999 (9.20) -.2335 (12.30)Separate -.3469 (7.82) -.2253 (8.46)Widowed -.1723 (7.53) -.0686 (4.20)Retired -.0310 (1.63) -.0453 (3.74)Housewife -.0425 (3.13) -.0772 (7.21)Student -.0064 (0.15) .0344 (0.89)Unemployed -.5286 (23.35) -.3961 (30.76)Constant 3.2550 (74.34) 3.3363 (98.87)
N 25505 43745 F 43.74 81.80R-squared 0.0505 0.0631Adj R-squared 0.0494 0.0623Root MSE .72214 .7016
Notes: column 2 also includes three further education dummies for 1995.Source: Eurobarometers various

35
Table 6
Satisfaction-with-Democracy
Rankings Across Countries Through Time
1973-79 1980-84 1985-89 1990-94 1995-98 1973-98 1975-98Belgium 8 7 7 8 7 8 8Denmark 6 8 5 6 8 6 7Eire 3 4 4 3 4 4 4France 2 2 2 5 6 3 3Italy 9 9 9 9 9 9 9Luxembourg 1 3 1 2 2 1 1Netherlands 4 1 3 1 1 2 2UK 5 6 6 4 3 5 5West Germany 7 5 8 7 5 7 6
N 88268 67311 99364 98405 45723 399071 380101
Note: controls in columns 1- 6 =age, age square and male and year dummies.Controls in columns 7 =age, age square, male, 5 marital status dummies, 4 labor forcestatus dummies, year dummies and 12 age left school dummies. Education not availablein 1973; hence it is omitted in 1973. Information on education is in 4 categories in 1995compared with 10 for the remaining years. In all years it was possible to identify thosestill studying. Hence two separate education dummies were also included for 1995.
Question “ On the whole, are you very satisfied, fairly satisfied, not very satisfied or not at allsatisfied with the way democracy works (in your country)?”.
Source: Eurobarometers (various)
36
Table 7. Yearly Average Job-Satisfaction Levels: Public and Private Sector Workers
The British Household Panel Study (Annual Cross-sections)
Year Mean Job Satisfaction Public Mean Job Satisfaction Private1991 5.66 (1.39) 5.43 (1.56)1992 5.61 (1.28) 5.46 (1.40)1993 5.51 (1.32) 5.41 (1.38)1994 5.44 (1.37) 5.35 (1.41)1995 5.47 (1.30) 5.33 (1.39)1996 5.46 (1.28) 5.38 (1.34)1997 5.50 (1.25) 5.43 (1.32)
Notes: These columns use a 1-7 integer scale where 7 is the highest possible recorded jobsatisfaction answer and 1 the lowest possible answer. All means are raw averages. Standarddeviations are reported in parentheses.
Source: Jonathan Gardner, Department of Economics, University of Warwick. A relatedresearch project is described in Gardner and Oswald, 1999.

37
Table 8. Job Satisfaction in the USA, 1973-98
A) Proportions (Current Workers Only)
Question: On the whole how satisfied are you with the work you do – would you say you arevery satisfied, moderately satisfied, a little dissatisfied, or very dissatisfied?
All 1972 1973 1974 1975 1976 1977 1978 1980 1982 1983 1984
Very satisfied 49% 50 50 56 53 49 52 47 48 53 47
Moderately satisfied 37 37 38 33 33 39 37 37 39 35 35
A little dissatisfied 11 8 8 8 9 10 8 12 9 8 12
Very dissatisfied 3 4 4 3 5 2 4 4 5 4 6
N 864 775 737 748 741 867 850 821 1009 897 875
All 1985 1986 1987 1988 1989 1990 1991 1993 1994 1996 1998 All
Very satisfied 49 49 46 48 48 48 46 44 47 46 48 48
Moderately satisfied 38 40 38 40 38 39 42 42 40 40 38 38
A little dissatisfied 10 9 11 10 10 10 8 10 11 11 10 10
Very dissatisfied 3 2 4 3 4 4 4 4 3 4 3 4
N 903 838 1132 889 911 847 882 975 1903 1935 2216 23354
Weighted to control for over-sampling of blacks in 1982 and 1987Source: General Social Surveys

38
Table 8 continuedB) The Percentage Very Satisfied by Different Demographic Characteristics % very satisfied with work
All Men Women Whites Non-whites Non-white Non-white Age <30 Age >=30 Men women
1972 49% 48 50 51 38 39 35 34 541973 50 50 51 50 47 41 56 36 551974 50 51 49 52 34 39 28 41 541975 55 56 55 57 44 51 37 42 611976 53 54 52 54 40 38 42 40 591977 49 48 51 50 45 53 35 36 541978 52 51 53 54 34 31 36 44 551980 47 46 48 48 37 40 46 37 511982 48 48 48 49 40 43 43 37 531983 53 51 56 54 45 43 45 42 581984 47 44 49 47 43 44 43 37 501985 49 46 53 49 48 52 36 37 531986 49 53 46 50 45 47 31 40 531987 47 48 45 49 35 34 34 35 501988 48 50 46 50 39 49 40 39 511989 49 47 50 50 35 37 26 37 521990 48 46 50 49 43 46 40 39 511991 46 49 43 49 32 39 26 40 481993 44 43 46 45 41 39 43 33 471994 47 47 47 49 35 37 33 36 491996 46 47 45 47 41 42 40 39 471998 48 45 50 51 37 40 34 42 50Average 49 49 49 50 40 42 38 38 53
N 23354 12204 11150 19927 3160 1721 2039 5945 17409
Note: average is simply the unweighted average of the year estimated reported in the table. Weights are used to control for statisticalover-sampling of minorities in some years. Source: General Social Surveys

39
Table 9. Job Satisfaction by Country (%)
International Social Survey Programme (ISSP), 1989
Completelysatisfied
Verysatisfied
Fairlysatisfied
Neither Dissatisfied N
W. Germany 9% 34 41 11 4 605UK 12 27 46 7 8 984USA 15 35 37 6 7 797Austria 17 29 39 11 4 814Hungary 6 7 63 19 6 564Netherlands 10 30 45 10 5 650Italy 17 17 47 10 10 581S. Ireland 18 33 41 5 4 474Norway 14 28 43 12 4 1057Israel 11 26 49 9 5 678All 13 27 45 10 6 7204

40
Table 10. Job Satisfaction by Country (%)
A) Eurobarometers, 1995-1996
Verysatisfied
Moderatelysatisfied
A littledissatisfied
Verydissatisfied
N
Belgium 44% 49 6 1 1011Denmark 50 45 3 2 997W. Germany 34 51 11 4 1025Greece 11 50 29 9 1003Italy 26 56 15 4 1028Spain 23 57 16 4 996France 22 60 14 5 999S. Ireland 57 38 4 1 1004Luxembourg 40 53 5 2 494Netherlands 46 46 7 1 1064Portugal 21 62 13 3 998UK 38 49 9 5 1064E. Germany 34 56 9 2 1047Finland 31 62 6 2 1059Sweden 39 53 5 2 1055Austria 44 45 9 1 1070All 35 52 10 3 15914
Notes: Results are weighted
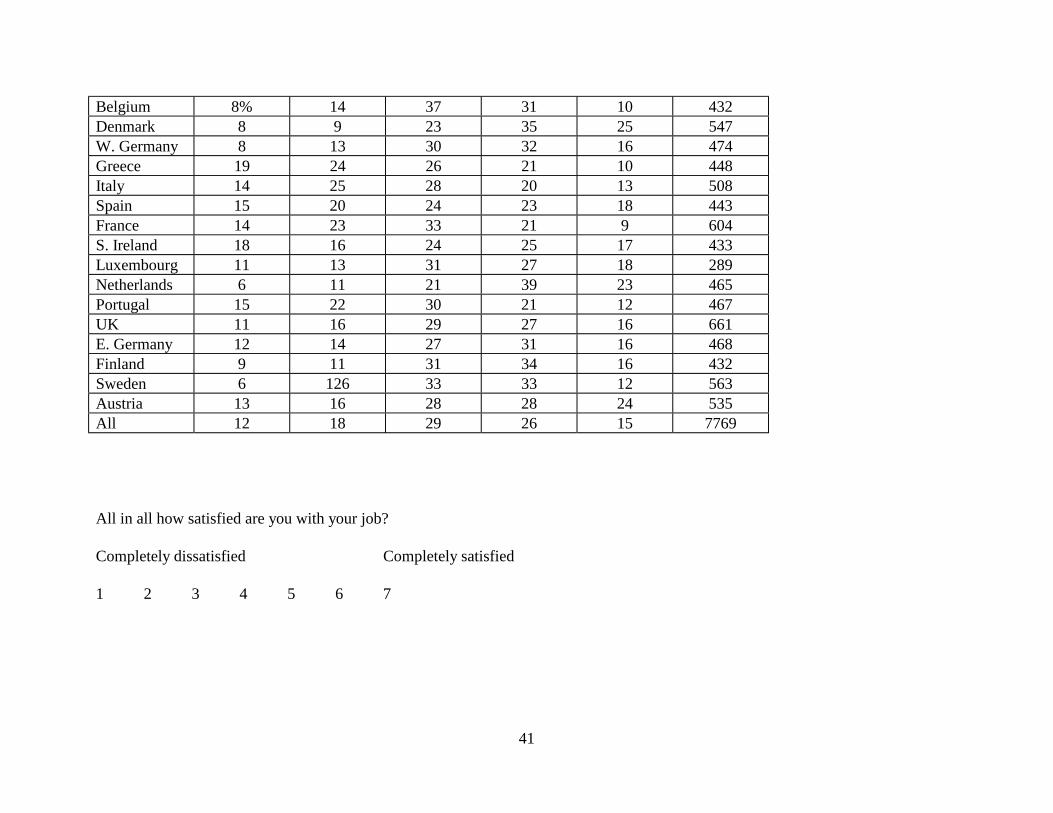
B) Eurobarometers, 1996
Dissatisfied1, 2 or 3
Neither4
Satisfied5
Satisfied6
Satisfied7
N
41
Belgium 8% 14 37 31 10 432Denmark 8 9 23 35 25 547W. Germany 8 13 30 32 16 474Greece 19 24 26 21 10 448Italy 14 25 28 20 13 508Spain 15 20 24 23 18 443France 14 23 33 21 9 604S. Ireland 18 16 24 25 17 433Luxembourg 11 13 31 27 18 289Netherlands 6 11 21 39 23 465Portugal 15 22 30 21 12 467UK 11 16 29 27 16 661E. Germany 12 14 27 31 16 468Finland 9 11 31 34 16 432Sweden 6 126 33 33 12 563Austria 13 16 28 28 24 535All 12 18 29 26 15 7769
All in all how satisfied are you with your job?
Completely dissatisfied Completely satisfied
1 2 3 4 5 6 7

42
Table 11
Job-Satisfaction Rankings – with regression controls for age, age squared, male
In this table, the integer 1 signifies the top-ranked nation for job satisfaction, number 2 meanssecond from top, etc.
A. Rankings Derived from World Values Surveys
All Nations Top-8 in OECD
1981 1991 1981 1991Italy 1 Denmark 1 Italy 1 Eire 1Netherlands 2 Canada 2 Netherlands 2 N. Ireland 2Denmark 3 Sweden 3 Norway 3 Norway 3Norway 4 Eire 4 Eire 4 USA 4Eire 5 Iceland 5 N. Ireland 5 Britain 5Canada 6 N Ireland 6 Britain 6 Netherlands 6N. Ireland 7 Norway 7 USA 7 Italy 7Sweden 8 USA 8 W. Germany 8 W. Germany 8Iceland 9 Belgium 9Britain 10 Britain 10USA 11 Netherlands 11Belgium 12 Italy 12W. Germany 13 West Germany 13Spain 14 Spain 14France 15 France 15Japan 16 Japan 16
B. Rankings Derived from ISSP Survey Data
1989 1997USA 1 Netherlands 1W. Germany 2 USA 2Norway 3 Norway 3Netherlands 4 W. Germany 4Great Britain 5 Italy 5Italy 6 Great Britain 6Hungary 7 Hungary 7
43
Table 12A. Job Security and Job Satisfaction in Nine Countries, 1989
Job securityJob satisfaction Strongly agree Agree Neither Disagree** AllCompletely satisfied 20% 10 9 8 13Very satisfied 32 28 21 19 27Fairly satisfied 38 49 47 45 45Neither 7 8 17 14 10Dissatisfied* 3 5 6 14 6All
Unweighted N 2196 2852 1029 951 7028
Notes: * dissatisfied includes fairly dissatisfied, very dissatisfied and completely dissatisfied ** disagree includes disagree and strongly disagree. Countries are UK, USA, Austria, Hungary,Netherlands, Italy, Eire, Norway, Israel. Source: ISSP 1989.
Table 12B. Job Security and Job Satisfaction in Seventeen Countries, 1997Job security
Job satisfaction Strongly agree Agree Neither Disagree** AllCompletely satisfied 24 11 9 8 14Very satisfied 33 34 27 21 31Fairly satisfied 31 40 43 42 39Neither 7 9 14 16 11Dissatisfied* 5 5 6 13 6
Unweighted N 3434 5079 2337 2471 13321
Notes: * dissatisfied includes fairly dissatisfied, very dissatisfied and completely dissatisfied ** disagree includes disagree and strongly disagree. Countries are UK, USA, Netherlands, Italy,Norway, Israel, West Germany, Sweden, New Zealand, Canada, Japan, Spain, France, Cyprus, Portugal,Denmark, Switzerland. Source: ISSP 1997.
Table 12C. Job Security and Job Satisfaction in Sixteen Countries, 1996 My job is secureJob satisfaction very quite a little not at All N score true true true all truecompletely satisfied 7 27 13 8 8 15 1196
6 34 31 22 17 26 21085 22 33 32 25 29 20794 10 15 24 24 18 1211
completely dissatisfied1,2,3 6 9 15 27 12 865All 31 36 18 15 - 7459
2526 2522 1356 1055 7459Notes: countries are Belgium, Denmark, W. Germany, Greece, Italy, Spain, France, Ireland,Luxembourg, Netherlands, Portugal, UK, E. Germany, Finland, Sweden, Austria. Results are weighted.Source: Eurobarometer 44.3OVR, February-April 1996

44
Table 13. Job Satisfaction Ordered Logit Equations
(1) (2) (3)1989 1997 UK 1989 & 1997
UK .2893 (2.87) .1195 (1.06)USA .4427 (3.75) .4286 (3.83)Netherlands .1369 (1.24) .6257 (6.38)Italy -.3625 (2.91) .0636 (0.55)Norway .3272 (3.27) .1139 (1.22)Age .0161 (6.28) .0124 (4.92) .0177 (4.16)Male -.1166 (1.95) -.1083 (1.93) -.1948 (1.98)Years schooling -.0059 (0.55) -.0090 (1.05) .0028 (0.11)Union member -.3569 (5.68) -.2383 (3.92) -.3968 (3.97)Strong agree secure job 1.7493 (9.83) 1.8244 (11.45) 2.3294 (9.05)Agree secure job 1.1452 (6.56) 1.1948 (7.84) 1.6174 (6.81)Neither agree/disagree .7605 (4.13) .8104 (5.05) 1.3687 (5.49)Disagree secure job .3454 (1.81) .4954 (2.95) .8999 (3.60)1997 dummy -.2108 (1.98)
Cut_1 -3.4904 -3.7938 -3.1296Cut_2 -2.4760 -2.6077 -1.9735Cut_3 -1.2097 -1.1967 -.5830Cut_4 -.1406 -.1081 .1959Cut_5 2.0699 1.9945 2.4040Cut_6 3.7672 3.7444 3.9620LR Chi2 364.4 361.9 157.7Pseudo R2 .0318 .0286 .0365N 3995 4428 1478
Notes: excluded categories, West Germany and strongly disagree secure job Source: ISSP 1989 and 1997 – t-statistics in parentheses.

45
Table 14. Further Job Satisfaction Ordered Logit Equations, 1995-1996
All Males Females Denmark .2082 (2.04) .0580 (0.43) .3941 (2.47)W. Germany -.4845 (4.83) -.6423 (4.90) -.2725 (1.71)Greece -1.4849 (14.11) -1.3942 (10.35) -1.6598 (9.62)Italy -.9707 (9.68) -.9426 (7.31) -.9598 (5.89)Spain -.9239 (9.26) -.8643 (6.83) -1.0504 (6.31)France -.7457 (7.53) -.6639 (5.00) -.7629 (4.99)Ireland .3639 (3.48) .4361 (3.22) .3241 (1.91)Luxembourg -.4446 (3.71) -.3708 (2.42) -.5379 (2.74)Netherlands -.0801 (0.81) -.3233 (2.55) .3282 (2.05)Portugal -.8311 (8.19) -.6439 (4.78) -1.0151 (6.41)GB -.3048 (2.95) -.3885 (2.83) -.1855 (1.14)E. Germany -.1502 (1.48) -.0858 (0.63) -.2258 (1.43)Finland -.2519 (2.49) -.4074 (3.00) -.0604 (0.38)Sweden -.0558 (0.55) .0345 (0.26) -.1729 (1.09)Austria -.0540 (0.54) -.0684 (0.52) -.0112 (0.07)Age -.0237 (2.54) -.0179 (1.45) -.0378 (2.57)Age2 .0002 (2.21) .0001 (0.96) .0004 (2.51)Male -.0463 (1.14) n/a n/aSelf-employed .3426 (4.87) .3837 (4.01) .3619 (3.18)16-19 years schooling -.0021 (0.04) .0125 (0.20) -.0834 (1.06)>=20 years schooling -.0385 (0.67) -.0355 (0.47) -.0911 (0.99)Supervisor .2550 (5.94) .3051 (5.57) .1795 (2.50)Public sector .1019 (2.05) -.0002 (0.00) .1907 (2.53)Job tenure .0003 (1.69) .0004 (1.92) .0002 (0.68)Commuting time -.0018 (3.55) -.0013 (2.05) -.0027 (3.19)Agree secure job .9183 (20.87) .9658 (16.26) .8547 (12.81)Secure job DK .3449 (4.91) .3613 (3.81) .3222 (3.04)No vibrations from hand tools -.0643 (1.33) -.053 (0.84) -.0772 (1.00)No noise .1369 (3.12) .0905 (1.48) .2293 (3.55)No high temperatures .0483 (1.10) .0784 (1.35) .0327 (0.47)No low temperatures .0582 (1.32) -.0371 (0.63) .1798 (2.63)No vapors or fumes .1560 (3.26) .2562 (4.10) .0191 (0.25)No dangerous substances -.0523 (1.06) -.0379 (0.61) -.0714 (0.86)No radiation -.0158 (0.29) .0159 (0.24) -.0860 (0.86)No painful or tiring positions .2193 (5.16) .2309 (3.99) .2037 (3.18)No carrying or moving loads .1592 (3.67) .1821 (3.01) .1697 (2.64)No repetitive arm movements. .0377 (0.89) .0272 (0.48) .0237 (0.37)No protective clothing -.1485 (3.33) -.1604 (2.81) -.1106 (1.50)No computers .0233 (0.54) -.0540 (0.93) .0971 (1.44)No work at high speed .1101 (2.40) .0967 (1.57) .1346 (1.90)No tight deadlines .1713 (3.83) .1947 (3.20) .1106 (1.64)No dealing with people -.1476 (3.00) -.1059 (1.67) -.2035 (2.52)

46
Not working at home -.1143 (2.69) -.0817 (1.42) -.2109 (3.22)No night work .0028 (0.05) .0006 (0.01) .0913 (1.05)No Saturdays -.0681 (1.38) -.1346 (2.12) .0359 (0.44)No Sundays .0846 (1.96) .1232 (2.18) .0544 (0.79)Work pace depends colleagues* -.0038 (0.10) .0303 (0.61) -.0622 (1.06)Work pace depends customers* -.0295 (0.70) -.0237 (0.43) .0771 (1.13)Work pace depends prodn. norms* -.1330 (3.25) -.0823 (1.58) -.2158 (3.16)Work pace depends on machine* -.0398 (0.83) .0297 (0.49) -.1639 (2.03)Work pace depends on boss* -.1562 (3.93) -.1485 (2.79) -.1649 (2.70)Equal opportunities at work .2228 (6.16) .1058 (2.15) .4404 (7.96)Boss a man .0705 (1.58) .1225 (1.64) .0513 (0.89)Health and safety a risk* .7246 (17.09) -.6837 (12.59) -.8296 (11.99)Can control temperature .1159 (2.68) .1209 (2.07) .1324 (2.03)Can control lighting .0305 (0.69) .0498 (0.84) .0164 (0.24)Can control ventilation .1217 (2.76) .1321 (2.22) .1048 (1.56)Can control position of desk .0638 (1.41) .0201 (0.32) .1299 (1.93)Can control position of seat .0500 (1.09) -.0212 (0.33) -.0501 (0.73)Can control equipment used .1689 (4.50) .1766 (3.56) .1720 (2.93)
Occupation dummies 10 10 10Industry dummies 10 10 10Size of establishment dummies 6 6 6
Cut_1 -3.8530 -3.9457 -3.6102Cut_2 -2.0830 -2.1414 -1.8544Cut_3 .9720 .9516 1.2252
Likelihood ratio -13472.18 -7708.3 -5658.9LR Chi2 3313.4 1894.4 1613.3Pseudo R2 .1095 .1094 .1248N 14505 8317 6189
Notes: excluded categories, Belgium, <16 years schooling*= a variable also included where the respondent reported they did not know the answerto this question.Source: Eurobarometer 44.3OVR, February-April 1996

47
Table 15. Job Security Ordered Logit Equations
(1) (2) (3)1989 1997 UK
1989 & 1997UK -1.1342 (11.52) -.9810 (8.74)USA -.6603 (5.67) -.2897 (2.56)Netherlands -.6940 (6.38) -.5204 (5.17)Italy .0590 (0.47) -.3374 (2.87)Norway -.6948 (6.99) -.2298 (2.40)Age .0100 (3.98) .0049 (1.95) -.0091 (2.21)Male -.1281 (2.16) -.1372 (2.44) -.3867 (4.07)Years schooling .0527 (4.82) .0480 (5.54) .1524 (3.57)Union member .2652 (4.26) .2254 (3.71) .0589 (0.60)1997 dummy 1.4944 (2.50)Education* 1997 dummy -.1736 (3.57)
Cut_1 -3.0292 -2.7722 -1.7530Cut_2 -1.4681 -1.2855 -.2031Cut_3 -.52265 -.2908 .6937Cut_4 1.2649 1.7274 2.6903LR Chi2 230.9 147.2 63.8Pseudo R2 .0208 .0122 .0146N 4041 4403 1503
Notes: Excluded country: West Germany.Source: ISSP 1989 and 1997 – t-statistics in parentheses.

48
Table 16. Mental well-being -- % saying ‘not at all’ – workers only
Q. Would you say that you have not at all, no more than usual, rather more than usual, much more than usual?a) …lost much sleep over worry, b)…been feeling unhappy and depressed, c)…been losing confidence in yourself,d)…been feeling you could not overcome your difficulties, e)…been feeling constantly under strain, f)…been thinking ofyourself as a worthless person?
Not lost much Not uhappy & Not losing Can overcome Not worthless Not constantly Stress Level sleep depressed confidence difficulties person under strain (semi-GHQ score)
Belgium 43% 56 62 57 67 42 .57Denmark 63 59 78 70 82 50 .51West Germany 52 48 70 60 77 40 .47Greece 38 46 77 53 90 42 .91Italy 34 38 62 43 77 31 1.35Spain 38 49 64 51 79 49 .89France 42 50 60 48 74 38 .99Eire 53 61 71 66 78 57 .33N. Ireland 50 56 71 67 77 50 .74Luxembourg 49 56 69 61 75 45 .65Netherlands 52 59 72 69 83 51 .61Portugal 39 50 71 60 76 47 .75Great Britain 55 53 68 65 81 47 .71East Germany 41 46 75 55 76 35 .64Finland 45 35 61 53 65 30 .82Sweden 61 58 79 67 83 49 .46Austria 47 50 66 60 70 52 .82European 15 46 49 67 56 78 42 .81N 7857 7853 7841 7835 7833 7847 7749
Notes: Semi-GHQ score calculated as the sum of each component where 0= not at all or no more than usual and 1 if rathermore than usual or much more than usual. The normal GHQ score is based on 12 questions not 6; hence we use the termsemi-GHQ. The semi-GHQ score in the final column must lie between zero (not stressed on any of the six questions) and 6(stressed on all six).Source: Eurobarometer 44.3OVR, February-April 1996

49
Table 17. Ordered Logit Mental Well-being Equations, 1996 (workers only)
Constantly Lose sleep Unhappy & Losing Not overcome under strain over worry depressed confidence difficulties
Age .0036 (1.37) .0167 (6.27) .0127 (4.75) .0073 (2.40) .0071 (2.49)Age left school .0216 (3.20) .0020 (0.29) .0042 (0.61) .0071 (0.89) .0117 (1.61)Male -.2513 (4.69) -.2794 (5.19) -.3802 (6.95) -.2523 (4.07) -.3699 (6.43)Ever unemployed last 5 yrs -.1549 (2.30) -.0910 (1.34) -.1296 (1.89) -.1893 (2.46) -.3047 (4.29)Private sector -.0300 (0.48) -.0776 (1.26) -.1165 (1.86) -.0148 (0.21) -.1497 (2.28)Financial situation very difficult -.5245 (5.24) -.5338 (5.33) -.5463 (5.41) -.3654 (3.41) -.7212 (7.06)Financial situation quite difficult -1.0288 (10.62) -.9976 (10.25) -.9876 (10.09) -.7823 (7.50) -1.2393 (12.43)Financial situation quite easy - 1.2099 (11.58) -1.2484 (11.82) -1.2555 (11.80) -1.0379 (9.04) -1.582 (14.44)Financial situation very easy -1.3380 (10.34) -1.4103 (10.60) -1.5012 (11.17) -1.2162 (7.98) -1.7853 (12.52)Job tenure months .0026 (0.76) -.0050 (1.47) -.0005 (0.15) .0033 (0.83) .0052 (1.41)Hours .0221 (10.65) .0100 (4.86) .0076 (3.63) .0000 (0.00) .0069 (3.18)Self-employed .0498 (0.29) .0313 (0.18) .0120 (0.06) -.1219 (0.61) -.0564 (0.30)Denmark -.1969 (1.45) -.5785 (4.15) .069 (0.48) -.5685 (3.52) -.3410 (2.27)West Germany -.0400 (0.28) -.4704 (3.36) .1995 (1.39) -.3247 (2.03) -.1623 (1.07)Greece -.0417 (0.29) .3188 (2.25) .4575 (3.14) -.6751 (4.04) .0535 (0.36)Italy .6665 (4.91) .4904 (3.64) .842 (6.03) .1563 (1.03) .6477 (4.52)Spain -.3471 (2.44) .2719 (1.95) .2961 (2.02) -.0836 (0.53) .2670 (1.79)France .0954 (0.73) -.0353 (0.27) .0942 (0.68) -.0739 (0.51) .1723 (1.24)Eire -.5837 (3.97) -.3505 (2.42) -.1743 (1.14) -.2824 (1.72) -.4486 (2.83)N. Ireland -.3542 (1.58) -.2512 (1.12) -.0481 (0.20) -.3782 (1.47) -.4592 (1.85)Luxembourg .0486 (0.30) .0350 (0.21) .1880 (1.12) -.0805 (0.44) .0233 (0.13)Netherlands -.0745 (0.52) .0368 (0.26) .2264 (1.53) -.1666 (1.03) -.1061 (0.68)Portugal -.4036 (2.86) -.0336 (0.24) .1034 (0.70) -.5425 (3.35) -.4270 (2.80)Great Britain -.0791 (0.58) -.3741 (2.69) .1784 (1.25) -.2219 (1.44) -.3362 (2.26)East Germany -.0368 (0.26) -.2058 (1.45) .1263 (0.85) -.7247 (4.26) -.2258 (1.46)Finland .4388 (3.06) .0132 (0.09) .8184 (5.55) .1243 (0.77) .2423 (1.57)Sweden -.3434 (2.59) -.7842 (5.76) -.1329 (0.95) -.8215 (5.19) -.4553 (3.15)Austria -.3922 (2.83) -.1086 (0.79) .2903 (2.03) .0332 (0.21) -.0312 (0.21)Job security decrease .3625 (4.83) .2798 (3.70) .2656 (3.47) .2304 (2.67) .3012 (3.74)

50
Job security no change .0180 (0.29) -.0372 (0.59) .0389 (0.61) -.0186 (0.25) .0749 (1.11)Job security DK -.0583 (0.47) -.1410 (1.11) -.0244 (0.19) -.3121 (2.09) -.0336 (0.25)Secure job – quite true .1383 (2.33) .1679 (2.79) .1113 (1.82) .2972 (4.19) .1793 (2.76)Secure job – a little true .3292 (4.52) .2934 (4.00) .3219 (4.35) .4450 (5.26) .4726 (6.09)Secure job – not at all true .5031 (6.03) .4268 (5.05) .5560 (6.56) .7855 (8.42) .5494 (6.23)Secure job – DK .1186 (0.87) .0698 (0.51) -.0203 (0.14) .0078 (0.04) .3066 (2.13)
Cut_1 .49356 -.01829 .1470 .23007 -.27718Cut_2 2.3541 1.8013 1.97202 .0604 1.6484Cut_3 4.3236 3.6653 3.7819 3.8172 3.6973
Log likelihood ratio -7412.8 -7272.1 7018.9 -5315.5 -6161.4Chi square 783.7 748.9 684.2 541.8 831.4Pseudo R2 .0502 .0490 .0465 .0485 .0632N 6903 6907 6904 6893 6891
Notes: excluded categories Belgium; secure job – very true; Job security no change last 5yrs: financial situation neither easynor difficult. All equations also include 13 occupation dummies, 11 industry dummies and 7 establishment size dummies.Source: Eurobarometer 44.3OVR, February-April 1996

51
Table 18. Mental Well-being Equations, 1996(workers only)
Worthless GHQ Work under Person Score great pressure
Ordered logit OLS ProbitAge .0106 (3.15) .0060 (3.41) -.0006 (0.91)Age left school .0044 (0.50) .0069 (1.51) .0058 (3.11)Male -.2171 (3.15) -.2385 (6.61) -.0190 (1.29)Ever unemployed last 5 yrs -.1438 (1.70) -.1322 (2.91) .0011 (0.06)Private sector -.1041 (1.33) -.0168 (0.40) .0344 (2.04)Financial situation very difficult -.3047 (2.63) -.6911 (10.15) -.0685 (2.53)Financial situation quite difficult - -.6574 (5.80) -1.0913 (16.68) -.1319 (5.06)Financial situation quite easy - -.8904 (7.09) -1.1080 (15.84) -.1606 (5.88)Financial situation very easy - -.9447 (5.72) -1.0778 (12.63) -.1655 (5.08)Job tenure months -.0023 (0.51) -.0024 (1.04) .0024 (2.57)Hours .0027 (1.02) .0075 (5.52) .0087 (14.99)Self-employed -.0141 (0.06) -.0403 (0.35) .0609 (1.26)Denmark -.6750 (4.01) -.0651 (0.71) .2589 (7.00)West Germany -.5545 (3.26) -.1474 (1.54) .1186 (3.02)Greece -1.4866 (7.34) .2045 (2.13) .0582 (1.47)Italy -.5337 (3.24) .6967 (7.55) .1356 (3.57)Spain -.7034 (4.03) .2343 (2.44) -.1071 (2.68)France -.5064 (3.28) .1943 (2.18) .0798 (2.16)Eire -.5616 (3.21) -.2732 (2.79) .1221 (3.00)N. Ireland -.5900 (2.15) .1361 (0.92) .3023 (5.19)Luxembourg -.3143 (1.62) .1205 (1.10) .0811 (1.80)Netherlands -.6556 (3.72) .1165 (1.23) .1506 (3.84)Portugal -.7828 (4.52) -.0528 (0.55) .0084 (0.21)Great Britain -.7583 (4.53) .0617 (0.66) .2871 (7.68)East Germany -.6779 (3.87) -.0991 (1.01) .0749 (1.86)Finland -.0199 (0.12) .1569 (1.58) .1397 (3.44)Sweden -.9674 (5.81) -.2090 (2.33) .3948 (11.27)Austria -.0761 (0.47) .1456 (1.54) .0732 (1.87)

52
Job security decrease .1547 (1.61) .2234 (4.41) .0717 (3.47)Job security no change -.0405 (0.50) -.0226 (0.55) -.0044 (0.27)Job security DK -.0687 (0.43) -.0794 (0.97) -.0498 (1.50)Secure job – quite true .2880 (3.63) -.0393 (0.99) .0336 (2.09)Secure job – a little true .4457 (4.72) .0591 (1.20) .0711 (3.51)Secure job – not at all true .5989 (5.73) .3591 (6.37) .0720 (3.12)Secure job – DK -.0197 (0.10) -.1556 (1.66) .0560 (1.45)
Cut_1/constant .98277 1.1425Cut_2 2.8386Cut_3 4.4813
Log likelihood ratio -4353.3 -4219.5Chi square 380.2 1043.9Pseudo R2 R2/ .0418 .1234 .1122F 14.42N 6892 6830 6792
Notes: excluded categories Belgium; secure job – very true; job security no change last 5yrs: financial situation neither easynor difficult. All equations also include 13 occupation dummies, 11 industry dummies and 7 establishment size dummiesWhere probits are used the procedure is dprobit in STATA.Source: Eurobarometer 44.3OVR, February-April 1996
53
Table 19. Changes in Mental Well-being -- % ‘saying ‘significant increase’ or ‘no change’ – workers only
(Q22) I would like you to compare your current job with what you were doing five years ago (even if in the same job) Foreach of the following things say whether there has been a significant increase compared to five years ago, a significantdecrease or little or no change – a) the effort you put into your job, b) the responsibility involved in your job, c) the stressinvolved in your job, d) the tightness of supervision over your job
Effort Responsibility Stress Tightness of supervision
Increase No change Increase No change Increase No change Increase NochangeBelgium 41% 55 40 56 35 58 21 70Denmark 45 46 50 45 45 45 12 74West Germany 56 39 50 45 49 44 23 64Greece 50 42 59 38 59 35 22 70Italy 47 48 54 40 51 42 24 67Spain 29 63 37 58 38 54 27 65France 52 41 50 43 44 48 29 60Eire 53 43 55 41 44 49 29 63N. Ireland 63 35 59 35 50 40 31 53Luxembourg 43 39 50 46 42 48 26 62Netherlands 50 41 61 34 43 46 22 50Portugal 35 55 46 49 42 52 23 70Great Britain 58 33 56 34 50 38 27 55East Germany 69 28 60 35 70 26 43 49Finland 58 35 57 37 47 46 28 61Sweden 53 42 55 40 47 44 22 64Austria 45 46 56 38 48 44 38 53European 15 50 43 51 43 48 44 26 62
N 7496 7509 7472 7171
Source: Eurobarometer 44.3OVR, February-April 1996

54
Table 20. Equations for Perceived Change in Stress Over the Last Five Years, 1996 (workers only)
Increased Increased Increased Increased Increased Stress Responsibility Effort Supervision AllProbit Probit Probit Probit [OLS]
Age -.0026 (3.61) -.0059 (8.17) -.0029 (4.03) -.0012 (2.00) -.0116 (6.23)Age left school .0013 (0.73) -.0000 (0.05) .0028 (1.52) -.0013 (0.82) .0019 (0.40)Male -.0409 (2.78) .0147 (1.00) -.0346 (2.35) .0340 (2.68) -.0139 (0.36)Ever unemployed last 5 yrs .0475 (2.57) .0347 (1.87) .0358 (1.94) .0237 (1.53) .1469 (3.07)Private sector -.0088 (0.52) .0036 (0.22) -.0029 (0.17) -.0083 (0.57) -.0238 (0.54)Financial situation very difficult -.0837 (3.01) -.0068 (0.25) -.0536 (1.93) -.0311 (1.36) -.1332 (1.79)Financial situation quite difficult-.1287 (4.84) -.0121 (0.46) -.0796 (3.00) -.0380 (1.72) -.2257 (12.11)Financial situation quite easy -.1516 (5.39) .0063 (0.22) -.0843 (2.98) -.0627 (2.72) -.2729 (0.52)Financial situation very easy -.1746 (5.20) -.0245 (0.70) -.1156 (3.39) -.0746 (2.69) -.3457 (3.02)Job tenure months .0031 (3.32) .0004 (0.48) .0014 (1.57) -.0012 (1.52) .0043 (1.79)Hours .0066 (11.55 .0047(8.24) .0064 (11.20) .0022 (4.50) .0179 (12.11)Self-employed -.0153 (0.32) -.0463 (0.96) .0112 (0.24) -.0284 (0.63) -.0642 (0.52)Denmark .1599 (4.32) .1307 (3.61) .0713 (1.94) -.0791 (2.50) .2868 (3.02)West Germany .1793 (4.68) .1221 (3.25) .1742 (4.65) .0351 (1.00) .5002 (5.04)Greece .2377 (6.22) .1903 (5.06) .0582 (1.50) .0169 (0.48) .4992 (4.98)Italy .2005 (5.38) .1752 (4.84) .0818 (2.19) .0647 (1.79) .5027 (5.03)Spain .0994 (2.50) .0054 (0.14) -.1020 (2.58) .1181 (3.16) .1051 (1.04)France .1290 (3.53) .1457 (4.13) .1453 (4.10) .1075 (3.13) .5101 (5.45)Eire .1466 (3.61) .1948 (5.05) .1552 (3.93) .1118 (2.92) .6056 (5.79)N. Ireland .1668 (2.72) .1992 (3.45) .2300 (3.96) .1265 (2.23) .7081 (4.42)Luxembourg .1130 (2.52) .1024 (2.31) .0478 (1.08) .0653 (1.56) .3245 (2.80)Netherlands .1528 (3.95) .2221 (6.08) .1364 (3.61) .0359 (1.02) .5269 (5.27)Portugal .0861 (2.18) .0790 (2.03) -.0570 (1.46) .0045 (0.13) .1180 (1.17)Great Britain .1994 (5.26) .2060 (5.69) .2114 (5.76) .0729 (2.05) .6761 (6.88)East Germany .3272 (8.74) .1872 (4.99) .2374 (6.26) .2133 (5.56) .9351 (9.21)Finland .1275 (3.16) .1943 (5.09) .1856 (4.76) .0939 (2.51) .5821 (5.62)Sweden .1393 (3.79) .1843 (5.27) .1369 (3.83) .0430 (1.28) .4931 (5.25)Austria .1365 (3.55) .1444 (3.89) .0131 (0.35) .1804 (4.90) .4665 (4.75)

55
Job security decrease .1111 (5.72) -.1607 (8.15) -.0069 (0.36) -.0318 (2.05) -.0821 (1.63)Job security no change -.1353 (8.31) -.2816 (17.01 -.1981 (12.18 -.1619 (11.67) -.7328 (17.24)Job security DK -.0445 (0.99) -.1870 (4.25) -.0515 (1.15) -.0430 (1.13) -.2164 (1.68)Fisherman .0166 (0.05) -.1222 (0.35) -.0594 (0.17) n/a -.3060 (0.40)Professional -.1128 (1.46) .0615 (0.80) -.0289 (0.38) .1107 (1.83) -.1655 (0.81)Owner of a shop -.1230 (1.84) -.0238 (0.36) -.0715 (1.09) .1259 (2.49) -.3490 (2.01)Business proprietor -.0818 (1.13) .0893 (1.27) .0301 (0.42) -.0456 (0.77) -.0189 (0.10)Employed professional -.1297 (1.53) .0583 (0.67) -.0065 (0.08) -.1210 (1.92) -.1987 (0.89)General management -.1874 (2.32) .1169 (1.42) .0201 (0.24) -.1258 (2.06) -.1638 (0.75)Middle management -.0973 (1.25) .0440 (0.57) .0247 (0.32) -.1117 (1.84) -.1166 (0.58)Employed at a desk -.1536 (2.00) -.0290 (0.37) -.0346 (0.45) -.1026 (1.66) -.2741 (1.37)Salesman -.1483 (1.89) -.0918 (1.15) -.0482 (0.61) -.0259 (0.39) -.2638 (1.28)Service employee -.1023 (1.31) -.0408 (0.52) -.0360 (0.47) -.0732 (1.15) -.2130 (1.06)Supervisor -.0539 (0.64) .1273 (1.56) .0091 (0.11) -.0478 (0.70) .0467 (0.21)Skilled manual -.1904 (2.53) -.1420 (1.85) -.0751 (1.00) -.0834 (1.34) -.4371 (2.21)Unskilled manual -.2467 (3.35) -.2376 (3.13) -.1511 (2.00) -.0890 (1.44) -.6579 (3.29)Mining and quarrying .1465 (1.27) .0461 (0.40) .1227 (1.07 ) .1369 (1.34) .3885 (1.32)Manufacturing .1179 (2.07) .0657 (1.21) .0690 (1.26 ) .0738 (1.45) .2930 (2.08)Electricity, gas & water .1405 (1.86) .0679 (0.92) .1627 (2.23 ) .1337 (1.91) .4159 (2.19)Construction .1417 (2.40) .0895 (1.58) .0931 (1.64 ) .0811 (1.51) .3553 (2.42)Wholesale & retail trade, repairs .1191 (2.12) .0245 (0.46) .0571 (1.07 ) .0569 (1.15) .2342 (1.69)Hotels & restaurants .0878 (1.37) .0027 (0.04) .0675 (1.09) -.0103 (0.19) .1398 (0.87)Transport & communications .1840 (3.02) .0238 (0.40) .0110 (0.19 ) .0496 (0.91) .2325 (1.52)Financial intermediation .2323 (3.67) .1541 (2.50) .1218 (1.95 ) .1007 (1.66) .5585 (3.41)Real estate & business activities .1803 (2.81) .0176 (0.28) .0613 (0.97 ) .0574 (0.97) .2687 (1.65)Public administration .1437 (2.49) .0504 (0.91) .0905 (1.63 ) .0715 (1.38) .2968 (2.07)Other services .1531 (2.74) .0715 (1.34) .1076 (2.02 ) .0417 (0.86) .3235 (2.35)1-10 workers .0698 (2.80) .0669 (2.71) .0703 (2.84) .0460 (1.97) .1904 (2.93)10-24 workers .1413 (4.93) .1100 (3.88) .1152 (4.03) .1029 (3.78) .3970 (5.34)25-49 workers .1475 (4.75) .0968 (3.15) .0869 (2.81) .0783 (2.66) .3309 (4.10)50-99 workers .1561 (4.74) .0945 (2.90) .0651 (1.97) .1150 (3.61) .3459 (4.04)100-499 workers .1788 (5.73) .1036 (3.34) .0896 (2.87) .1301 (4.30) .4183 (5.14)>=500 workers .1032 (3.01) .0933 (2.76) .0792 (2.32) .1192 (3.63) .3177 (3.58)

56
Size DK .0456 (0.72) -.0189 (0.30) -.0021 (0.03) .0331 (0.58) .0158 0.09)
Log likelihood ratio -4232.6 -4197.2 -4276.8 -3425.6Chi square/F-statistic 799.6 910.2 758.4 542.8 18.69Pseudo R2/R2 .0863 .0978 .0814 .0734 .1469N 6696 6727 6718 6456 6370
Notes: excluded categories Belgium; secure job – very true; job security no change last 5yrs: financial situation neither easynor difficult; agriculture, farmer, work at home alone; farmer; agriculture, forestry and fishing, works at home alone.
The final column, Increased All, has as its dependent variable the number 1 to 4. If the individual reported increased strainon all four categories, he or she is assigned 4; if he or she reported increased strain on three categories, a 3 is assigned; and soon. The aim of the column is to give a simple way of judging the size of personal characteristics’ effects.
Source: Eurobarometer 44.3OVR, February-April 1996
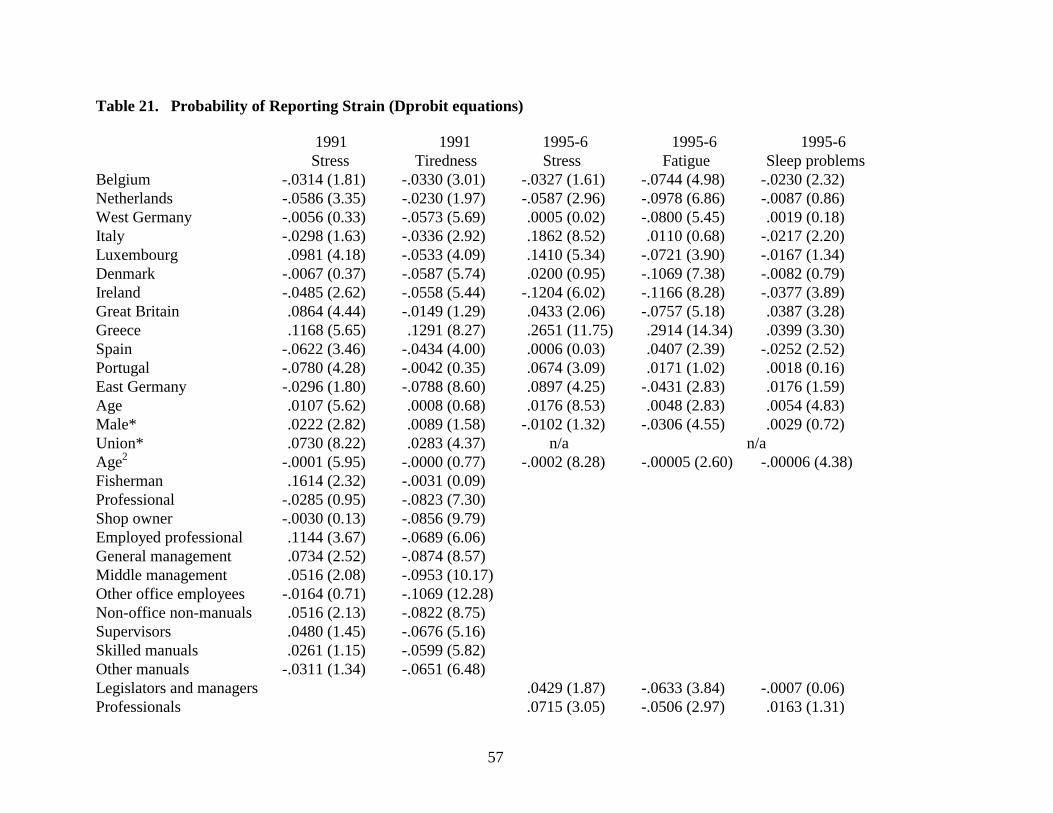
57
Table 21. Probability of Reporting Strain (Dprobit equations)
1991 1991 1995-6 1995-6 1995-6 Stress Tiredness Stress Fatigue Sleep problems
Belgium -.0314 (1.81) -.0330 (3.01) -.0327 (1.61) -.0744 (4.98) -.0230 (2.32)Netherlands -.0586 (3.35) -.0230 (1.97) -.0587 (2.96) -.0978 (6.86) -.0087 (0.86)West Germany -.0056 (0.33) -.0573 (5.69) .0005 (0.02) -.0800 (5.45) .0019 (0.18)Italy -.0298 (1.63) -.0336 (2.92) .1862 (8.52) .0110 (0.68) -.0217 (2.20)Luxembourg .0981 (4.18) -.0533 (4.09) .1410 (5.34) -.0721 (3.90) -.0167 (1.34)Denmark -.0067 (0.37) -.0587 (5.74) .0200 (0.95) -.1069 (7.38) -.0082 (0.79)Ireland -.0485 (2.62) -.0558 (5.44) -.1204 (6.02) -.1166 (8.28) -.0377 (3.89)Great Britain .0864 (4.44) -.0149 (1.29) .0433 (2.06) -.0757 (5.18) .0387 (3.28)Greece .1168 (5.65) .1291 (8.27) .2651 (11.75) .2914 (14.34) .0399 (3.30)Spain -.0622 (3.46) -.0434 (4.00) .0006 (0.03) .0407 (2.39) -.0252 (2.52)Portugal -.0780 (4.28) -.0042 (0.35) .0674 (3.09) .0171 (1.02) .0018 (0.16)East Germany -.0296 (1.80) -.0788 (8.60) .0897 (4.25) -.0431 (2.83) .0176 (1.59)Age .0107 (5.62) .0008 (0.68) .0176 (8.53) .0048 (2.83) .0054 (4.83)Male* .0222 (2.82) .0089 (1.58) -.0102 (1.32) -.0306 (4.55) .0029 (0.72)Union* .0730 (8.22) .0283 (4.37) n/a n/aAge2 -.0001 (5.95) -.0000 (0.77) -.0002 (8.28) -.00005 (2.60) -.00006 (4.38)Fisherman .1614 (2.32) -.0031 (0.09)Professional -.0285 (0.95) -.0823 (7.30)Shop owner -.0030 (0.13) -.0856 (9.79)Employed professional .1144 (3.67) -.0689 (6.06)General management .0734 (2.52) -.0874 (8.57)Middle management .0516 (2.08) -.0953 (10.17)Other office employees -.0164 (0.71) -.1069 (12.28)Non-office non-manuals .0516 (2.13) -.0822 (8.75)Supervisors .0480 (1.45) -.0676 (5.16)Skilled manuals .0261 (1.15) -.0599 (5.82)Other manuals -.0311 (1.34) -.0651 (6.48)Legislators and managers .0429 (1.87) -.0633 (3.84) -.0007 (0.06)Professionals .0715 (3.05) -.0506 (2.97) .0163 (1.31)

58
Technicians .0126 (0.57) -.0553 (3.35) .0186 (1.54)Clerks -.0517 (2.49) -.1119 (7.58) -.0223 (2.19)Service & sales workers -.0150 (0.71) -.0579 (3.62) .0033 (0.29)Craft & related trades -.0477 (2.34) -.0371 (2.32) -.0133 (1.29)Plant and machine operators .0115 (0.49) -.0033 (0.18) .0149 (1.17)Elementary occupations -.0924 (4.51) -.0434 (2.64) -.0079 (0.72)Armed forces -.0770 (1.76) -.0490 (1.42) -.0124 (0.54)
Age left school dummies 9 9 2 2 2
Log likelihood -6154.8 -3886.3 -9038.5 -7230.3 -3824.5N 12499 12499 15986 15986 15986Chi2 680.6 856.6 993.0 1358.7 278.1Pseudo R2 .0524 .0993 .0521 .0859 .0351
Source: Eurobarometer
Notes: 1991 QA7. In which ways does your work affect your health – a) stressful b) overall tiredness, work that is tootiring?Excluded category France, farmer/agricultureMethod of estimation is dprobit.Source: Eurobarometers #35A (ICPSR 9696) Spring 1991 and #44.2, November 1995 – January 1996
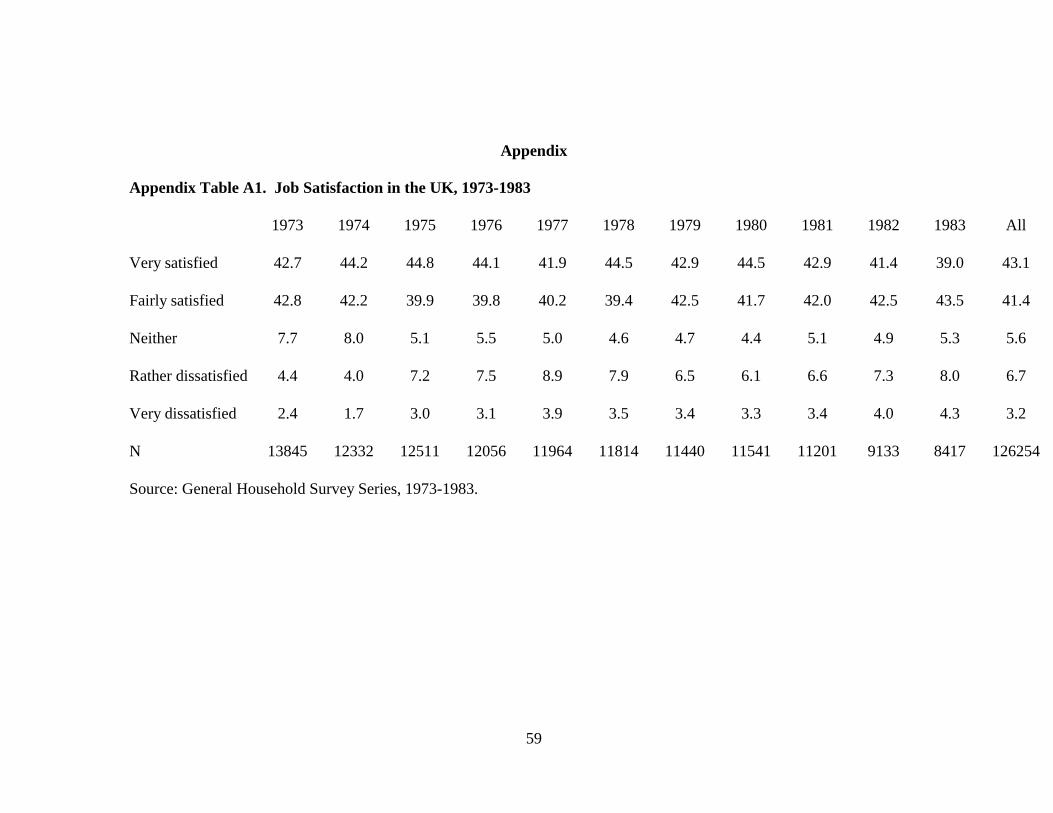
59
Appendix
Appendix Table A1. Job Satisfaction in the UK, 1973-1983
1973 1974 1975 1976 1977 1978 1979 1980 1981 1982 1983 All
Very satisfied 42.7 44.2 44.8 44.1 41.9 44.5 42.9 44.5 42.9 41.4 39.0 43.1
Fairly satisfied 42.8 42.2 39.9 39.8 40.2 39.4 42.5 41.7 42.0 42.5 43.5 41.4
Neither 7.7 8.0 5.1 5.5 5.0 4.6 4.7 4.4 5.1 4.9 5.3 5.6
Rather dissatisfied 4.4 4.0 7.2 7.5 8.9 7.9 6.5 6.1 6.6 7.3 8.0 6.7
Very dissatisfied 2.4 1.7 3.0 3.1 3.9 3.5 3.4 3.3 3.4 4.0 4.3 3.2
N 13845 12332 12511 12056 11964 11814 11440 11541 11201 9133 8417 126254
Source: General Household Survey Series, 1973-1983.
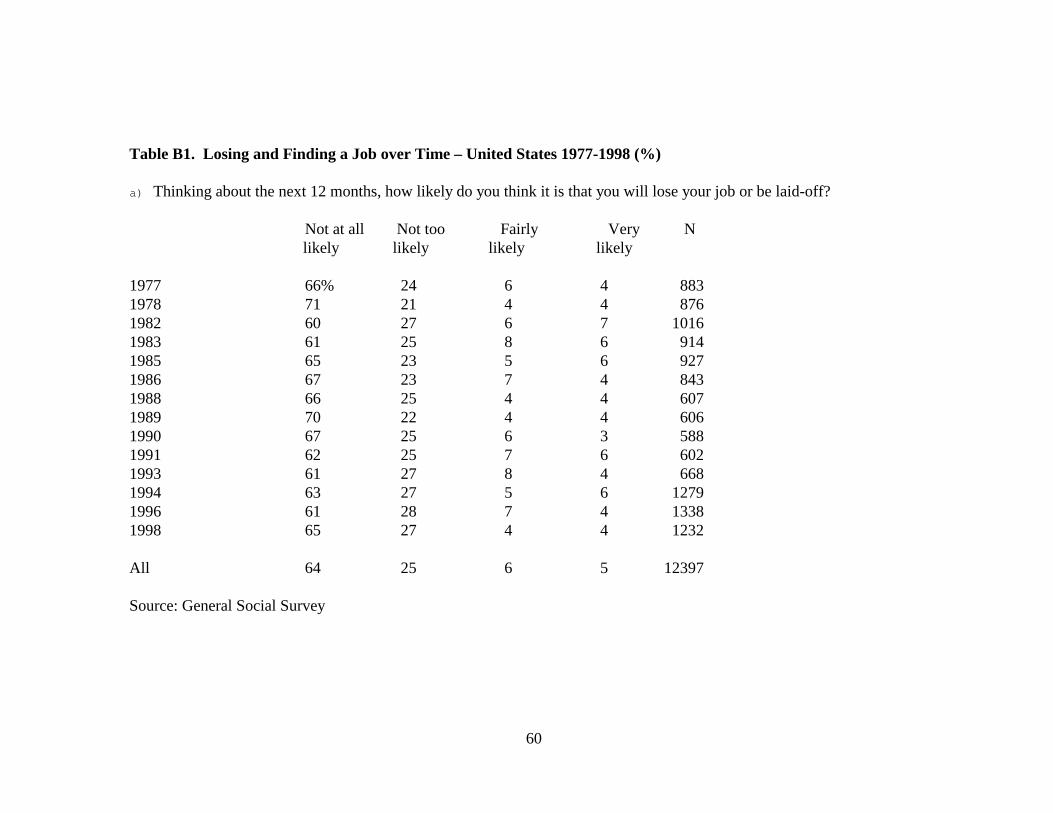
60
Table B1. Losing and Finding a Job over Time – United States 1977-1998 (%)
a) Thinking about the next 12 months, how likely do you think it is that you will lose your job or be laid-off?
Not at all Not too Fairly Very N likely likely likely likely
1977 66% 24 6 4 883 1978 71 21 4 4 876 1982 60 27 6 7 1016 1983 61 25 8 6 914 1985 65 23 5 6 927 1986 67 23 7 4 843 1988 66 25 4 4 607 1989 70 22 4 4 606 1990 67 25 6 3 588 1991 62 25 7 6 602 1993 61 27 8 4 668 1994 63 27 5 6 1279 1996 61 28 7 4 1338 1998 65 27 4 4 1232
All 64 25 6 5 12397
Source: General Social Survey

61
Table B1. Losing and Finding a Job over Time – United States 1977-1998 (%) (continued)
b) About how easy would it be for you to find a job with another employer with approximately the same income and fringe benefits you now have?
Not easy Somewhat Very Nat all easy easy
1977 42% 30 27 8781978 39 33 28 8651982 51 26 22 10091983 51 30 19 9081985 43 32 25 9171986 39 33 28 8471988 35 37 28 5981989 38 28 35 6001990 38 30 32 5891991 40 36 24 5961993 45 33 22 6651994 46 33 21 12671996 40 33 27 13311998 33 36 31 1221
All 42 32 26 12291
Source: General Social Surveys.

62
Table B2. Probability of a) Losing and b) Finding a Job in the USA, 1972-1996: ordered logits (Current workers only)
Losing a Job Finding a job(1) (2) (3) (4) (5) (6)
Age -.0089 (5.56) -.0085 (5.20) -.0075 (3.43) -.5975 (9.08) -.0268 (17.41) -.0278 (13.54)Male .0251 (0.64) -.0843 (1.96) -.0497 (0.87) -.1036 (2.87) .0429 (1.09) .0879 (1.70)Self-employed -.8079 (11.86) -.8650 (12.07) -.9076 (9.42) .5610 (10.13) .3701 (6.36) .2570 (3.38)Black .4577 (7.91) .5014 (8.24) .4958 (5.79) -.2428 (4.30) -.2421 (4.07) -.1837 (2.21)Other non-white .1529 (1.37) .1456 (1.27) .1407 (0.92) -.0056 (0.06) -.0589 (0.56) -.0685 (0.50)Time .0244 (6.83) .0274 (7.22) .0327 (6.27) -.0099 (3.10) -.0186 (5.46) -.0200 (4.34)Years of Schooling -.0656 (9.13) -.0500 (6.40) -.0527 (5.08) .0693 (10.53) .0618 (8.56) .0646 (6.80)Log state unemployment .5161 (7.21) .7064 (8.10) .7768 (6.55) -.5975 (9.08) -1.0182 (12.58) -1.0155 (9.34)Union .2550 (3.46) -.6222 (8.62)
Industry dummies (9) No Yes Yes No Yes YesState dummies (44) Yes Yes Yes Yes Yes Yes
Cut_1 .6832 .8692 1.1925 -1.7301 -2.8702 -2.7832Cut_2 2.2473 2.4527 2.7727 -.3095 -1.4008 -1.2670Cut_3 3.1030 3.3141 3.6608
Chi-Squared 448.9 639.3 424.5 669.81 1142.3 763.9Pseudo R2 .0214 .0305 .0350 .0284 .0484 .0551N 11058 11045 6471 10981 10967 6431
Notes: losing and finding a job variables not available in years 1972-1976, 1980, 1984 and 1987.Union status not available in 1972, 1974, 1977 & 1982.
63
References
Akerlof, George. A, Rose, Andrew K. and Yellen, Janet L. (1988). "Job Switching andJob Satisfaction in the US Labor Market", Brookings Papers on EconomicActivity, 2, 495-582.
Argyle, Michael. (1987). The Psychology of Happiness, Routledge, London.
Birdi, Kamal, Warr, Peter and Oswald, Andrew J. (1995). "Age Differences in ThreeComponents of Employee Well-being", Applied Psychology, 44, 345-373.
Blanchflower, David G. (1991). “Fear, Unemployment and Pay Flexibility”, EconomicJournal, 101, 483-496.
Blanchflower, David G. (2000). ‘Unemployment, Well-being and Wage Curves inEastern Europe’, mimeo, Dartmouth College.
Blanchflower, David G. and Freeman, Richard (1994). “Did the Thatcher ReformsChange British Labour Market Performance?”, in The UK Labour Market:Comparative Aspects and Institutional Developments, edited by Ray Barrell,Cambridge University Press, Cambridge and New York.
Blanchflower, David G. and Freeman, Richard (1997). “The Attitudinal Legacy ofCommunist Labor Relations”, Industrial and Labor Relations Review, 50, 4438-459.
Blanchflower, David G. and Oswald, Andrew J. (1999a). “The Rising Well-Being of theYoung”, in Youth Employment and Joblessness in Advanced Countries, edited byDavid G. Blanchflower and Richard Freeman, University of Chicago Press andNBER.
Blanchflower, David G., and Andrew J. Oswald (1999b), 'Well-being Over Time inBritain and the United States', NBER Working paper #7487.
Borjas, George (1979). “Job Satisfaction, Wages and Unions”, Journal of HumanResources, 14, 21-40.
Campbell, A. (1981). The Sense of Well-Being in America, McGraw Hill, New York.
Clark, Andrew E. (1996). “Job Satisfaction in Britain”, British Journal of IndustrialRelations, 34, 189-217.
Clark, Andrew E. (1998). “What Makes a Good Job? Evidence from OECD Countries”,discussion paper, December, LEO-CRESEP, University of Orleans, France.
Clark, Andrew E. and Oswald, Andrew J. (1994). "Unhappiness and Unemployment",Economic Journal, 104, 648-659.

64
Clark, Andrew E. and Oswald, Andrew J. (1996). "Satisfaction and Comparison Income",Journal of Public Economics, 61, 359-381.
Clark, Andrew E., Oswald, Andrew J. and Warr, Peter B. (1995). "Is Job Satisfaction U-Shaped in Age?", Journal of Occupational and Organizational Psychology, 69, 57-81.
Curtice, John (1993). “Satisfying Work – If You Can Get It”, in Roger Jowell, LindsayBrooks and Lizanne Dowds eds, International Social Attitudes: The 10th BSAReport, Dartmouth, Aldershot.
Diener, Edward (1984). "Subjective Well-Being", Psychological Bulletin, 93, 542-575.
Diener, Edward, Suh Eunkook M, Lucas Richard E., and Smith Heidi L. (1999)."Subjective Well-Being: Three Decades of Progress", Psychological Bulletin,forthcoming.
Di Tella, Rafael, MacCulloch, Robert, and Oswald, Andrew J. (2000), “Preferences overInflation and Unemployment: Evidence from Surveys of Happiness”, AmericanEconomic Review, forthcoming.
Easterlin, Richard (1974). "Does Economic Growth Improve the Human Lot? SomeEmpirical Evidence". In Nations and Households in Economic Growth: Essays inHonour of Moses Abramovitz, (ed. P. A. David and M. W. Reder). New York andLondon: Academic Press.
Frank, Robert H. (1985). Choosing the Right Pond, Oxford University Press, New Yorkand Oxford.
Freeman, Richard B. (1978). “Job Satisfaction as an Economic Variable”, AmericanEconomic Review, 68, 135-141.
Frey, Bruno S. and Stutzer, Alois (1999). “Happiness, Economy and Institutions”,Economic Journal, forthcoming.
Gardner, Jonathan and Oswald, Andrew J. (1999). “The Decline of Psychological HealthAmong Britain’s Public Sector Workers”, mimeo, University of Warwick.
Goldberg, D.P. (1972). The Detection of Psychiatric Illness by Questionnaire, Oxford,Oxford University Press.
Hamermesh, Daniel S. (1977). “Economic Aspects of Job Satisfaction”, in OrleyAshenfelter and Wallace Oates eds, Essays in Labor Market and PopulationAnalysis, Wiley, New York.
Hamermesh, Daniel S. (1998). “The Changing Distribution of Job Satisfaction”,University of Texas at Austin, mimeo.
Inglehart, Ronald (1990). Culture Shift in Advanced Industrial Society, PrincetonUniversity Press, Princeton.
Judge, T.A. and Watanabe, S. (1993). “Another Look at the Job Satisfaction - LifeSatisfaction Relationship”, Journal of Applied Psychology, 78, 939-948.
Kahneman, Daniel, Wakker, Peter P. and Sarin, Rakesh (1997). "Back to Bentham?Explorations of Experienced Utility", Quarterly Journal of Economics, 112, 375-406.
65
Levy-Garboua, L. and Montmarquette, C. (1997). “Reported Job Satisfaction: What Doesit Mean?”, LAMIA, University of Paris I, discussion paper 1997-1.
Ng, Yew-Kwang (1996). "Happiness Surveys: Some Comparability Issues and anExploratory Survey Based on Just Perceivable Increments", Social IndicatorsResearch, 38, 1-27
Ng, Yew-Kwang. (1997). "A Case for Happiness, Cardinalism, and InterpersonalComparability", Economic Journal, 107, 1848-1858.
OECD (1997). “Is Job Insecurity on the Rise in OECD Countries?”, OECD EmploymentOutlook.
Oswald, Andrew J. (1997). "Happiness and Economic Performance", Economic Journal,107, 1815-1831 .
Pavot, William et al (1991) "Further Validation of the Satisfaction with Life Scale:Evidence for the Cross-Method Convergence of Well-Being Measures", Journalof Personality Assessment, 57, 149-161.
Spector, Paul E. (1997). Job Satisfaction: Application, Assessment, Causes, andConsequences, Thousand Oaks, CA, Sage.
Spector, Paul E. and twenty nine co-authors (1999). “A Twenty-Two Nation Study ofWork Locus of Control, Well-being, and Individualism: How Generalisable areWestern Work Findings?”, mimeo, University of South Florida.
Sui, O. and Cooper, Cary L. (1998). “A Study of Occupational Stress, Job Satisfactionand Quitting Intentions in Hong Kong Firms: The Role of Locus of Control andOrganizational Commitment”, Stress Medicine, 14, 55-66.
Turnbull, Peter and Wass, Victoria (1999). “Redundancy and the Paradox of JobInsecurity”, mimeo, Cardiff Business School.
Van de Stadt, H., Kapteyn, Ari, and Van de Geer, S. (1985). “The Relativity of Utility:Evidence from Panel Data”, Review of Economics and Statistics, 67, 179-87.
Veenhoven, R. (1991). “Is Happiness Relative?”, Social Indicators Research, 24, 1-34.
Warr, Peter B. (1987). Work, Unemployment and Mental Health, Oxford UniversityPress, Oxford.
Warr, Peter, B. (1997). “Age, Work and Mental Health”, in K.W. Schale and C. Schoolereds, The Impact of Work on Older Adults, Springer, New York.
Worrall, Les and Cooper, Cary L. (1998). The Quality of Working Life, Institute ofManagement, London.


