

Investor Meeting Presentation HUGO BOSS © November 2013 2 / 54
Investor Meeting Presentation
November 2013
Investor Meeting Presentation HUGO BOSS © November 2013
Agenda
3 / 54
Nine Months Results
Strategy Update
Outlook

Investor Meeting Presentation HUGO BOSS © November 2013
Agenda
4 / 54
Nine Months Results
Strategy Update
Outlook

Ambitious medium-term targets
Investor Meeting Presentation HUGO BOSS © November 2013 5 / 54
750
529469354
269272
+13%
2008 2009
1,562
+14%*
1,686 1,729
2011 2015e … 2010
3,000
2012
2,346
2,059
EBITDA before special items
Sales Sales and EBITDA before special items (in EUR million)
* +10% fx-adjusted.

Investor Meeting Presentation HUGO BOSS © November 2013
Clear focus on execution of medium-term strategy
6 / 54
STRIVING FOR
OPERATIONAL
EXCELLENCE
STRENGTHENING
OUR
BRANDS
EXPLOITING
GLOBAL
GROWTH
OPPORTUNITIES
MAXIMIZING
CONSUMER FOCUS
TO DRIVE RETAIL

Investor Meeting Presentation HUGO BOSS © November 2013
Strong portfolio of attractive brands
7 / 54
fashion
statement casual
urban chic
modern
sophisticated
progressive
contemporary
modern
active
market
segment
luxury
premium

Investor Meeting Presentation HUGO BOSS ©
Integration of BOSS Selection in the core brand BOSS yields positive results
November 2013 8 / 54

Investor Meeting Presentation HUGO BOSS © November 2013 9 / 54
■ Modern technology and uncompromising
quality “handmade in Germany”
■ Combines excellent craftsmanship,
premium materials and tailor made
service with efficient industrial
manufacturing
■ Permanently offered in several European
flagship stores
■ Rollout in Asia and U.S. under way
Made to Measure demonstrates unrivalled tailoring competence

Investor Meeting Presentation HUGO BOSS ©
Jason Wu named Artistic Director of BOSS womenswear
November 2013 10 / 54

Investor Meeting Presentation HUGO BOSS © November 2013 11 / 54
Current campaign captures the BOSS womenswear brand essence

Investor Meeting Presentation HUGO BOSS © November 2013 12 / 54
BOSS fashion show, Shanghai
Power Station of Art Fall/Winter 2013
HUGO BOSS hosts spectacular fashion show in Shanghai

Investor Meeting Presentation HUGO BOSS ©
HUGO celebrates 20 years of innovating and challenging convention
November 2013 13 / 54

Investor Meeting Presentation HUGO BOSS © November 2013
BOSS Orange expands the casualwear concept with sophisticated fashion elements
14 / 54

Investor Meeting Presentation HUGO BOSS © November 2013
BOSS Green collection fuses smart sportswear with classic golf style
15 / 54

Investor Meeting Presentation
Successful product launches drive fragrance business
HUGO BOSS © November 2013 16 / 54

Investor Meeting Presentation HUGO BOSS © November 2013
Retail to remain the Group’s growth engine
17 / 54
Flagships in
mega-cities
Directly operated
stores
Controlled space
E-Commerce
M-Commerce
50 new stores and shop-in-shops to be opened in 2013
Controlled space
E-Commerce
M-Commerce

Investor Meeting Presentation HUGO BOSS © November 2013
Takeovers account for majority of new additions to retail universe
18 / 54
Number of own retail stores as of September 30, 2013 (December 31, 2012: 840)
* incl. Middle East and Africa.
TOTAL 992 (+152) Openings: 183
thereof takeovers: 110
Closings: 31 EUROPE* 570 (+101)
Openings: 108 thereof takeovers: 63
Closings: 7
ASIA/PACIFIC 226 (+2)
Openings: 22 thereof takeovers: 5
Closings: 20
AMERICAS 196 (+49) Openings: 53
thereof takeovers: 42
Closings: 4

Investor Meeting Presentation HUGO BOSS ©
Moscow store establishes own retail presence in Russia
November 2013 19 / 54
BOSS Flagship Store, Moscow
Kuznetsky Most Opening: September 2013
Net size: 693 sqm

Investor Meeting Presentation HUGO BOSS ©
Store base in Shanghai upgraded significantly
November 2013 20 / 54
BOSS Store, Shanghai
APM Mall Opening: August 2013
Net size: 482 sqm

Investor Meeting Presentation HUGO BOSS ©
Renovations offer attractive potential for productivity uplifts
November 2013 21 / 54
BOSS Store, New York
Columbus Circle Re-Opening: September 2013
Net size: 1,084 sqm

Investor Meeting Presentation HUGO BOSS © November 2013
Expansion of concession business model
22 / 54
■ Successful set-up of concession business model in the last year…
… further expanded in 2013.

Investor Meeting Presentation HUGO BOSS © November 2013
Franchise business in Singapore taken over in August
23 / 54
BOSS Store
Ngee Ann City, Takashimaya Singapore

Investor Meeting Presentation
Online to account for growing share of retail business
HUGO BOSS © November 2013 24 / 54
Investor Meeting Presentation HUGO BOSS © November 2013
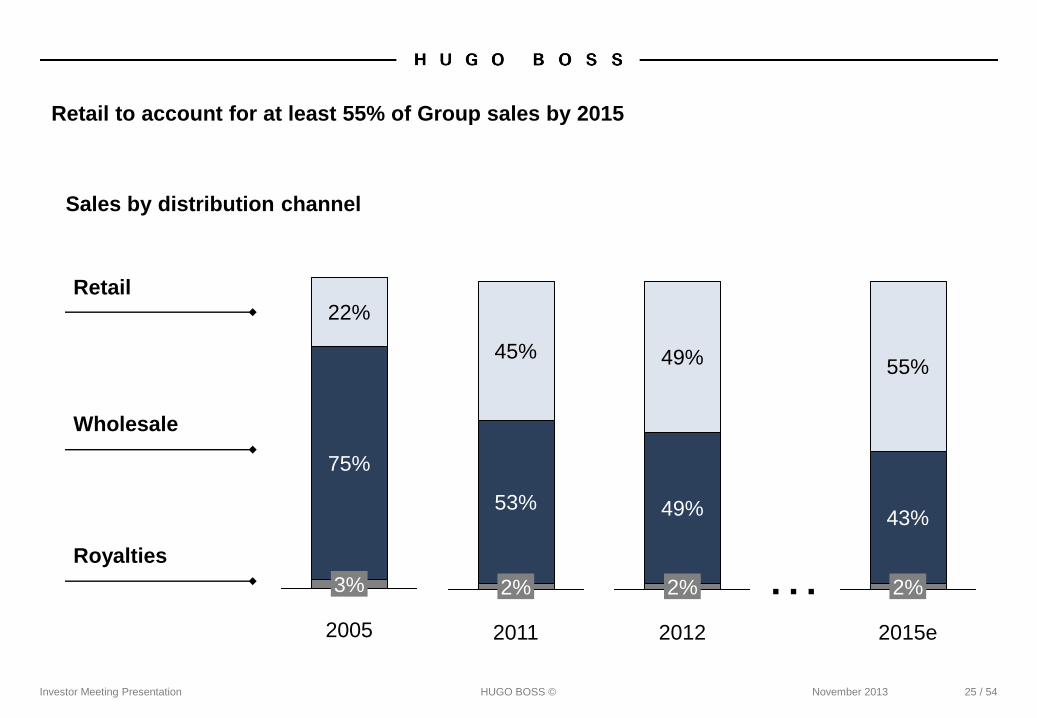
Retail to account for at least 55% of Group sales by 2015
25 / 54
Wholesale
Retail
Royalties
Sales by distribution channel
2005
3%
75%
22%
2011
2%
53%
45%
2012
2%
49%
49%
2015e
2%
43%
55%
…

Investor Meeting Presentation HUGO BOSS © November 2013
Continuous strive for operational excellence
26 / 54
■ Continued SAP rollout
■ Implementation of global retail merchandise
planning solution
■ Construction of flat-packed goods distribution
center on track for 2014 opening

Investor Meeting Presentation HUGO BOSS © November 2013
Agenda
27 / 54
Nine Months Results
Strategy Update
Outlook
Investor Meeting Presentation HUGO BOSS © November 2013
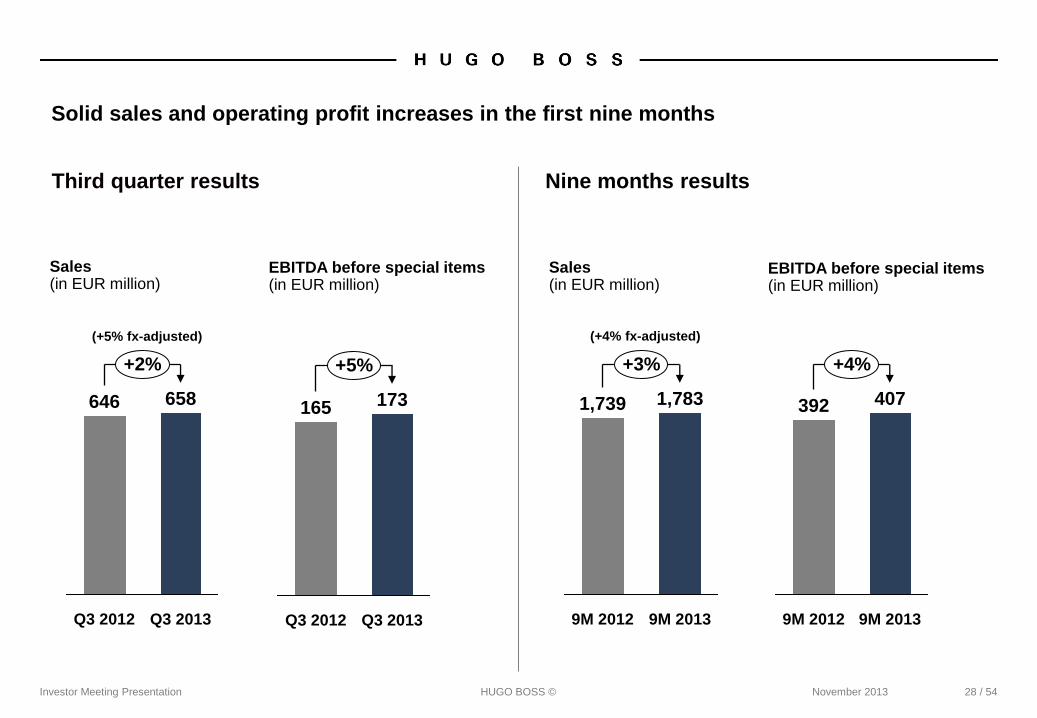
Solid sales and operating profit increases in the first nine months
28 / 54
+2%
Q3 2013
658
Q3 2012
646 165 173
Q3 2012
+5%
Q3 2013
(+5% fx-adjusted)
9M 2012
+3%
9M 2013
1,783 1,739
+4%
9M 2013
407
9M 2012
392
(+4% fx-adjusted)
EBITDA before special items (in EUR million)
Sales (in EUR million)
EBITDA before special items (in EUR million)
Sales (in EUR million)
Third quarter results Nine months results

Investor Meeting Presentation HUGO BOSS © November 2013 29 / 54
Improving growth dynamics in Europe
■ Sales momentum picks up over the course of
the quarter
■ Key markets recover from more difficult first
half year
■ Wholesale trading environment continues to
be challenging
in EUR
fx-adjusted
Sales growth (in %)
Sales (in EUR million)
9M 2013
1,091
9M 2012
1,051
Q3 2013
423
Q3 2012
398
5
4
8
6
Q3 2013 9M 2013

in EUR
fx-adjusted
Investor Meeting Presentation HUGO BOSS © November 2013 30 / 54
Mixed quarterly performance in the Americas
■ Tough prior year comparison base
■ Deteriorating wholesale sentiment
■ Solid own retail performance
Sales growth (in %)
Sales (in EUR million)
9M 2013
406
9M 2012
400
Q3 2013
143
Q3 2012
152
4
2
0
(6)
Q3 2013 9M 2013

in EUR
fx-adjusted
Investor Meeting Presentation HUGO BOSS © November 2013 31 / 54
Sales growth (in %)
Sales (in EUR million)
9M 2013
247
9M 2012
250
Q3 2013
78
Q3 2012
82
4
(1)
4
(5)
Q3 2013 9M 2013
Trends in Asia broadly unchanged compared to first half year
■ Chinese market environment remains
challenging
■ Robust growth in Hong Kong and Macau
■ Japanese business benefits from repatriation
of local demand

Investor Meeting Presentation HUGO BOSS ©
Retail sales growth accelerates in the third quarter
2
18
5
23
-10 -5 0 5 10 15 20 25
Group
Royalties (2)
(2)
Retail
Wholesale (8)
(10)
fx-adjusted
in EUR
November 2013
Sales growth by channel, y-o-y Q3 2013
(in %)
32 / 54
■ Wholesale development affected by difficult market situation as well as takeover effects
■ Third quarter own retail growth acceleration supported by improving comp store sales (up
4% in Q3, up 2% year-to-date)
■ Royalties sales increase in the nine months period driven by eyewear and kidswear
3
2
4
2
15
18
-10 -5 0 5 10 15 20
Retail
Wholesale (7)
(8)
Group
Royalties
fx-adjusted
in EUR Sales growth by channel, y-o-y 9M 2013
(in %)

Investor Meeting Presentation HUGO BOSS ©
■ Distribution channel mix
■ Reduction of mark downs
■ Non-recurrence of prior year inventory
devaluation effects
+340bp
Q3 2013
63.5
Q3 2012
60.1
9M 2013
63.6
9M 2012
61.1
+250bp
November 2013
Gross margin expands strongly
33 / 54
■ Distribution channel mix
■ Non-recurrence of prior year inventory
devaluation effects
Third quarter First nine months

Investor Meeting Presentation HUGO BOSS ©
■ Tight overhead cost management
limits increases in administration
costs
November 2013
■ Own retail expansion main driver of
higher selling and distribution
expenses
EBITDA margin increases despite own retail driven operating expense growth
34 / 54
*basic and diluted earnings per share.
■ Adverse exchange rate effects
impact financial result
in EUR million 9M 2013 9M 2012 Change in %Net sales 1,783.1 1,738.5 3Gross profit 1,134.7 1,061.7 7 in % of sales 63.6 61.1 250 bpSelling and distribution expenses (636.8) (573.3) (11)Administration costs and other operating income and expenses (160.5) (156.8) (2)
Operating result (EBIT) 337.4 331.6 2 in % of sales 18.9 19.1 (20) bp
Financial result (15.7) (15.0) (5)
Earnings before taxes 321.7 316.6 2 Income taxes (74.0) (76.0) 3
Net income 247.7 240.6 3Attributable to:Equity holders of the parent company 244.7 237.7 3
Earnings per share (EUR)* 3.55 3.44 3
EBITDA before special items 407.4 391.7 4 in % of sales 22.8 22.5 30 bp

Investor Meeting Presentation HUGO BOSS ©
Working capital efficiency at record levels
0
5
10
15
20
25
30
(270)bp
Q3 2013
18.3
Q2 2013
19.0
Q1 2013
20.0
Q4 2012
20.1
Q3 2012
21.0
Q2 2012
20.8
Q1 2012
20.2
… Q4 2009
24.6
Q3 2009
27.2
Q2 2009
28.5
Q1 2009
29.7
November 2013
Average trade net working capital as a
percentage of sales by quarter (in %)
35 / 54

Investor Meeting Presentation
fx-adjusted
HUGO BOSS ©
fx-adjusted
fx-adjusted
■ IT infrastructure and
supply chain
improvements
■ Declining wholesale
sales
■ Ongoing effective
supplier management
Inventories (in EUR million)
Trade
receivables (in EUR million)
Trade
payables (in EUR million)
447
418
(6)%
Sep. 30, 2012
Sep. 30, 2013
262
242
(8)%
Sep. 30, 2012
Sep. 30, 2013
199
205
+3%
Sep. 30, 2012
Sep. 30, 2013
(4)%
(5)%
November 2013
+3%
Broad based trade net working capital improvements
36 / 54
Trade net working capital down 11% to EUR 455 million

Investor Meeting Presentation HUGO BOSS ©
■ Increase due to own
retail expansion and
infrastructure projects
Investments (in EUR million)
■ Strong reduction due
to deconsolidation
effects
Net debt (in EUR million)
142
88
9M 2012 9M 2013
+63%
182
250
Sep. 30, 2013
(27)%
Sep. 30, 2012
■ Trade net working capital
improvements more than
offset higher investments
105102
9M 2013
+3%
9M 2012
November 2013
Free cash flow (in EUR million)
Free cash flow increases despite higher investments
37 / 54

Investor Meeting Presentation HUGO BOSS © November 2013
Agenda
38 / 54
Nine Months Results
Strategy Update
Outlook

Investor Meeting Presentation
Full year 2013 targets specified
HUGO BOSS ©
Growth of EBITDA before special items 10% to 12%
2013 Outlook
Sales growth (currency-adjusted) Between 6% and 8%
Capex Around EUR 150 million
on a comparable basis
November 2013
Own retail network Around 50 net organic openings
+ around 110 shop-in-shop takeovers
39 / 54
Growth of EBITDA before special items Between 6% and 8%

Investor Meeting Presentation HUGO BOSS © November 2013
Clear strategy execution drives Group results
40 / 54
■ HUGO BOSS has successfully reduced
dependence on the wholesale channel
■ Own retail focus deeply embedded across
the organization
■ Further extension of brand control key to
medium- and long-term growth

Investor Meeting Presentation HUGO BOSS © November 2013 41 / 54
BACKUP

Investor Meeting Presentation HUGO BOSS © November 2013
Five year overview
42 / 54
in EUR million 2012 2011 2010 2009 2008Earnings PositionSales 2,345.9 2,058.8 1,729.4 1,561.9 1,686.1Gross Profit 1,453.2 1,264.8 1,027.2 847.1 891.0EBITDA 525.1 468.0 340.1 226.5 235.8EBITDA before special items 529.3 469.5 353.7 269.2 272.2EBIT 433.2 394.6 267.9 157.4 174.8Net income attributable to equity holders of the parent company 307.4 284.9 188.9 105.5 112.0Financial Position and DividendFree cash flow 220.6 194.9 246.3 299.5 48.1Net debt 130.4 149.1 201.1 379.1 583.2Capital expenditures 165.8 108.5 55.6 48.3 118.8Depreciation/amortization 91.9 73.4 72.2 69.1 61.0Dividend 215.3 199.1 139.7 66.6 94.9Asset and Liability StructureTotal assets 1,584.5 1,425.9 1,342.8 1,065.4 1,161.6Shareholders' equity 637.9 523.2 361.2 205.5 202.9Trade net working capital 417.6 407.3 322.7 295.6 458.3Non-current assets 585.9 501.8 454.5 435.0 463.0Key RatiosGross profit margin in % 61.9 61.4 59.4 54.2 52.8Adjusted EBITDA margin in %* 22.6 22.8 20.5 17.2 16.2Total leverage** 0.2 0.3 0.6 1.4 2.1Equity ratio in % 40.3 36.7 26.9 19.3 17.5
* EBITDA before special items/Sales* * Net debt/EBITDA before special items and expenses for the "Stock Appreciation Rights Program"

Investor Meeting Presentation HUGO BOSS ©
Profit & loss statement
November 2013 43 / 54
*basic and diluted earnings per share.
in EUR million Q3 2013 Q3 2012 Change in % 9M 2013 9M 2012 Change in %
Net sales 657.9 646.3 2 1,783.1 1,738.5 3Cost of sales (227.3) (244.9) 7 (613.1) (642.8) 5Direct selling expenses (12.7) (12.6) (1) (35.3) (34.0) (4)
Gross profit 417.9 388.7 8 1,134.7 1,061.7 7in % of sales 63.5 60.1 340 bp 63.6 61.1 250 bp
Selling and distribution expenses (221.2) (193.2) (14) (636.8) (573.3) (11)Administration costs and other operating income and expenses (46.2) (52.7) 12 (160.5) (156.8) (2)
Operating result (EBIT) 150.5 142.8 5 337.4 331.6 2in % of sales 22.9 22.1 80 bp 18.9 19.1 (20) bp
Net interest income/expense (1.2) (4.2) 71 (7.1) (11.6) 39Other financial items (3.2) (2.6) (23) (8.6) (3.4) < (100)
Financial result (4.4) (6.8) 35 (15.7) (15.0) (5)
Earnings before taxes 146.1 136.0 7 321.7 316.6 2Income taxes (33.6) (32.6) (3) (74.0) (76.0) 3
Net income 112.5 103.4 9 247.7 240.6 3
Attributable to:Equity holders of the parent company 110.9 103.6 7 244.7 237.7 3Minority interests 1.6 (0.2) >100 3.0 2.9 5
Earnings per share (EUR)* 1.61 1.50 7 3.55 3.44 3
EBITDA before special items 173.1 165.4 5 407.4 391.7 4in % of sales 26.3 25.6 70 bp 22.8 22.5 30 bp

Investor Meeting Presentation HUGO BOSS © November 2013
Mixed regional profitability developments
*incl. Middle East and Africa.
44 / 54
■ Retail expansion and takeovers affect operating margin development in Europe
■ Moderate margin decline in the Americas despite decreased markdowns
■ Strong gross margin improvement and tight cost management support margin increase in Asia
Segment profit
in EUR million 9M 2013 in % of sales 9M 2012 in % of sales Change in %
Europe* 401.1 36.7 392.0 37.3 2Americas 106.3 26.2 106.3 26.6 0Asia/Pacific 87.1 35.3 87.0 34.8 0Royalties 32.7 84.2 33.8 88.7 (3)Segment profit operating segments 627.2 35.2 619.1 35.6 1Corporate units / consolidation 219.8 227.4 (3)EBITDA before special items 407.4 22.8 391.7 22.5 4

Investor Meeting Presentation HUGO BOSS © November 2013 45 / 54
0
10
20
30
40
50
0
5
10
15
20
25
30
Q2
2013
15%
2%
Q1
2013
15%
2%
FY
2012
19%
5%
Q4
2012
19%
4%
Q3
2012
15%
2%
Q2
2012
16%
4%
Q1
2012
27%
11%
FY
2011
35%
12%
Q4
2011
28%
10%
Q3
2011
30%
13%
Q2
2011
47%
16%
Q1
2011
38%
11%
FY
2010
30%
8%
Q4
2010
36%
8%
Q3
2010
36%
12%
Q2
2010
22%
6%
Q1
2010
24%
5%
Q3
2013
4%
23%
Retail
Retail l-f-l Sales growth retail and retail l-f-l*
*Both fx-adjusted
Own retail key contributor to Group performance

Investor Meeting Presentation HUGO BOSS © November 2013
Retail network significantly increased
*Europe incl. Middle East and Africa.
35 / 54
840
Sep. 30, 2013
992
Closings Asia/Pacific Americas Europe* Dec. 31, 2012
+108
+53 +22 (31)
+ 49 USA
+ 2 Canada
+ 1 Brazil
+ 1 Mexiko
Number of own retail stores:
+ 31 Spain
+ 24 UK
+ 23 Germany
+ 8 France
+ 4 Austria
+ 4 Belgium
+ 4 Netherlands
+ 3 Switzerland
+ 2 Ireland
+ 2 Italy
+ 1 Poland
+ 1 Portugal
+ 1 Russia
+ 8 China
+ 7 Australia
+ 4 Singapore
+ 3 Taiwan

Investor Meeting Presentation
Well-balanced sourcing structure*
HUGO BOSS © November 2013 47 / 54
20%
Own production
80%
Third party production
* In % of total sourcing volume, as of FY 2012.
52%
Eastern Europe
10%
Western Europe
4%
North Africa
3%
America
(incl. Turkey)
31%
Asia

Investor Meeting Presentation HUGO BOSS ©
HUGO BOSS offers attractive dividend policy
* As a percentage of net profit attributable to the shareholders of the parent company.
Dividend policy to pay out 60% to 80% of consolidated net profit
0
10
20
30
40
50
60
70
80
903.50
3.00
2.50
2.00
1.50
1.00
0.50
0.00
2012
3.12
70%
2011
2.88
70%
2010
2.02
75%
2009
0.96
64%
2008
1.37
85%
Dividend and payout ratio
in EUR
November 2013
in %*
48 / 54

Investor Meeting Presentation
Shareholder structure
HUGO BOSS © November 2013 49 / 54
42%
Free float
2%
Treasury shares
56%
Red & Black Holding GmbH
(Permira Ltd.)

Investor Meeting Presentation HUGO BOSS © November 2013
Level I ADR program introduced in 2013
50 / 54
ADR Details Benefits of ADRs for
U.S. investors
■ Clear and settle according to normal U.S.
standards
■ Offer the convenience of stock quotes and
dividend payments in U.S. dollars
■ Can be purchased/sold in the same way as
other U.S. stocks via a U.S. broker
■ Provide a cost-effective means of
international portfolio diversification
Market OTC
Symbol BOSSY
CUSIP 444560106
Ratio 5 : 1
Country Germany
Effective Date Jan 18, 2013
Underlying SEDOL B88MHC4
Underlying ISIN DE000A1PHFF7
Depositary BNY Mellon
Hong Kong
Joe Oakenfold
email: [email protected]
Tel: +852 2840 9717
New York
Ravi Davis
email: [email protected]
Tel: +1 212 815 4245
London
Mark Lewis
email: [email protected]
Tel: +44 (0)20 7964 6089
For questions about creating HUGO BOSS ADRs, please contact BNY Mellon:

Investor Meeting Presentation HUGO BOSS ©
Financial calendar 2013/2014
Date
November 2013
Event
51 / 54
March 13, 2014 Press and Analysts’ Conference
November 26, 2013 Investor Day, Hong Kong
May 7, 2014 First Quarter Results
May 13, 2014 Annual Shareholders’ Meeting
July 31, 2014 First Half Year Results
November 4, 2014 Nine Months Results

Investor Meeting Presentation HUGO BOSS © November 2013
Investor Relations contact
52 / 54
Dennis Weber, CFA
Head of Investor Relations
Phone: +49 (0) 7123 94 - 86267
E-Mail: [email protected]
Internet: www.hugoboss.com

Investor Meeting Presentation HUGO BOSS © November 2013
Forward looking statements contain risks
53 / 54
This document contains forward-looking statements that reflect management's current views with
respect to future events. The words "anticipate ", "assume ", "believe", "estimate", "expect",
"intend", "may", "plan", "project", "should", and similar expressions identify forward-looking
statements. Such statements are subject to risks and uncertainties. If any of these or other risks
and uncertainties occur, or if the assumptions underlying any of these statements prove incorrect,
then actual results may be materially different from those expressed or implied by such statements.
We do not intend or assume any obligation to update any forward-looking statement, which speaks
only as of the date on which it is made.


