Investigation of Earth radiation budget variability by cloud object
analysisSeiji Kato1, Kuan-Man Xu1, Takmeng Wong1, Patrick C. Taylor1,
Tristan S. L’Ecuyer2, Shengtao Dong3, Jenny Chen3, Sunny Sun-Mack3, Fred Rose3, Walter Miller3, and Yan Chen3
1NASA Langley Research Center2University of Wisconsin
3Science System & Applications Inc.
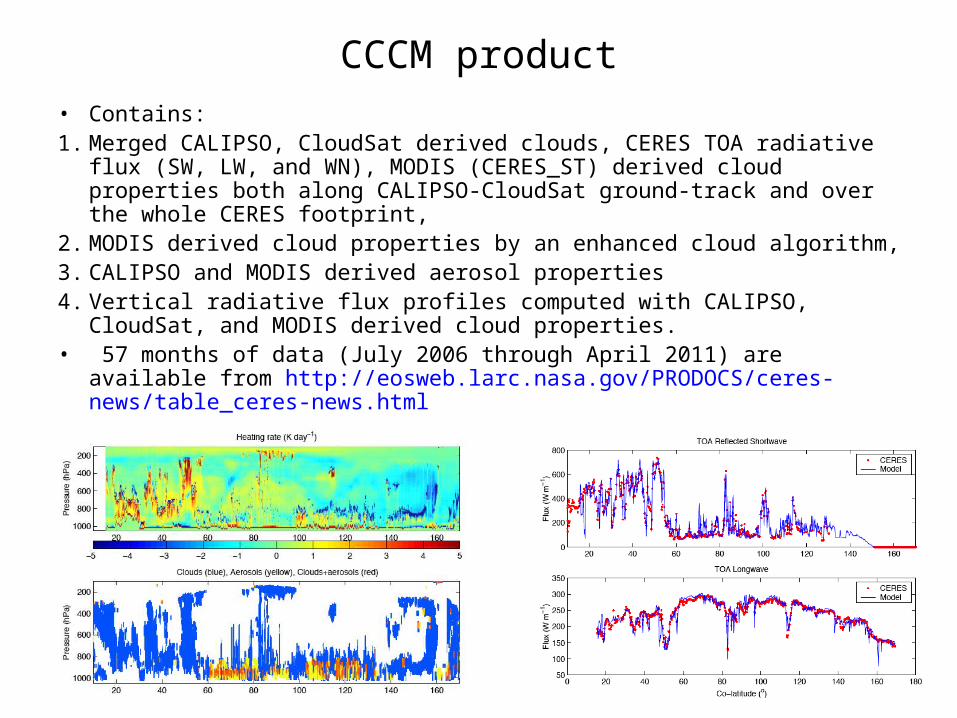
CCCM product• Contains: 1. Merged CALIPSO, CloudSat derived clouds, CERES TOA radiative flux (SW, LW,
and WN), MODIS (CERES_ST) derived cloud properties both along CALIPSO-CloudSat ground-track and over the whole CERES footprint,
2. MODIS derived cloud properties by an enhanced cloud algorithm, 3. CALIPSO and MODIS derived aerosol properties4. Vertical radiative flux profiles computed with CALIPSO, CloudSat, and MODIS
derived cloud properties.• 57 months of data (July 2006 through April 2011) are available from
http://eosweb.larc.nasa.gov/PRODOCS/ceres-news/table_ceres-news.html
Objectives and Scientific questions
• Understand radiation budget variability caused by clouds
• Reduces the uncertainty of cloud object analysis by CALIPSO and CloudSat observations
• How is the frequency of occurrence of cloud objects perturbation related to the variability of TOA radiation budget?
• How do cloud properties within cloud objects change with dynamical state or sea surface temperature?
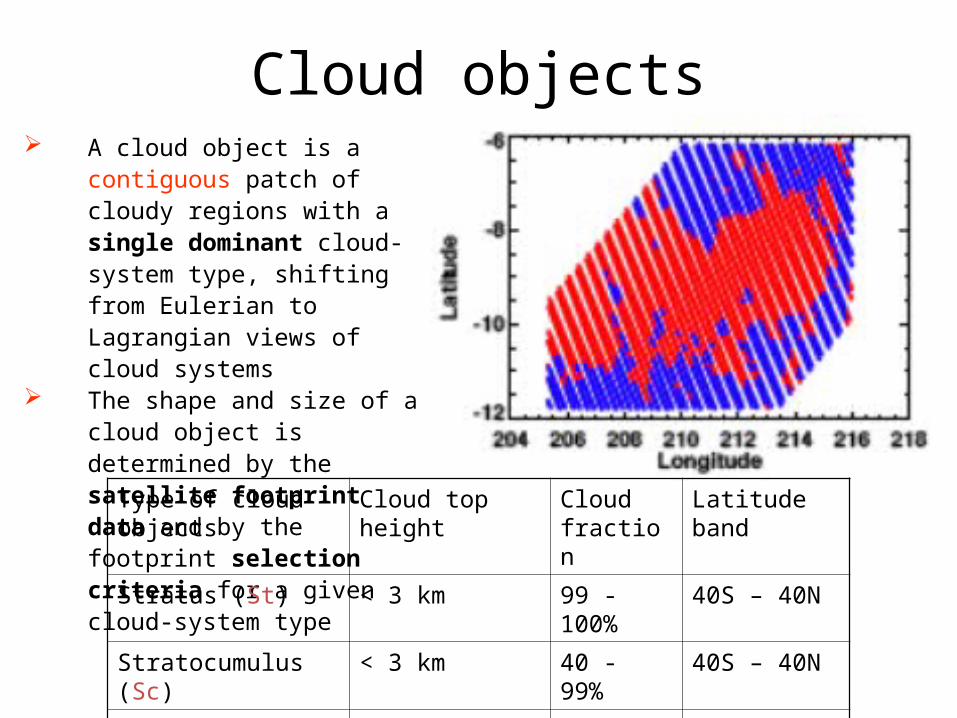
A cloud object is a contiguous patch of cloudy regions with a single dominant cloud-system type, shifting from Eulerian to Lagrangian views of cloud systems
The shape and size of a cloud object is determined by the satellite footprint data and by the footprint selection criteria for a given cloud-system type
Type of cloud objects Cloud top height Cloud fraction
Latitude band
Stratus (St) < 3 km 99 - 100% 40S – 40N
Stratocumulus (Sc) < 3 km 40 - 99% 40S – 40N
Cumulus (Cu) < 3 km 10 - 40% 40S – 40N
Cloud objects
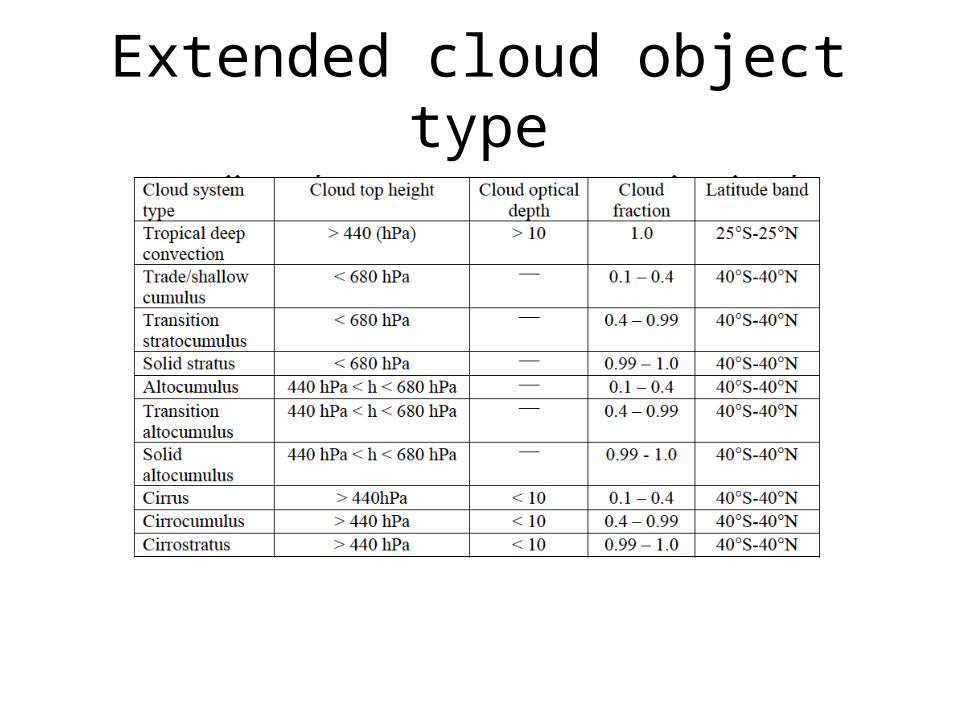
Extended cloud object type
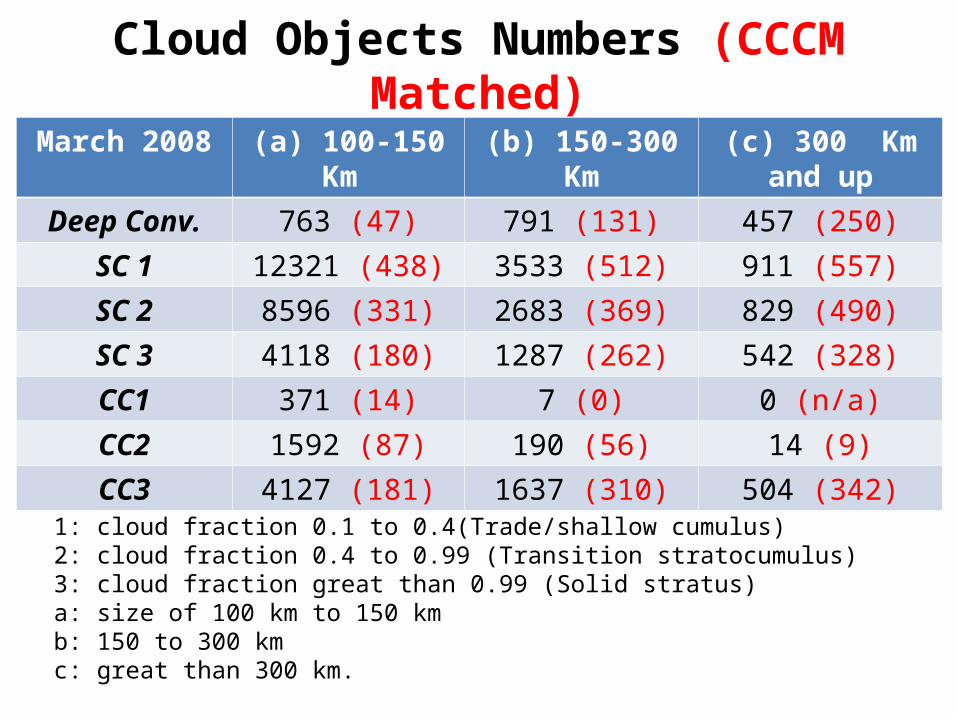
Cloud Objects Numbers (CCCM Matched)
March 2008 (a) 100-150 Km (b) 150-300 Km (c) 300 Km and up
Deep Conv. 763 (47) 791 (131) 457 (250)
SC 1 12321 (438) 3533 (512) 911 (557)
SC 2 8596 (331) 2683 (369) 829 (490)
SC 3 4118 (180) 1287 (262) 542 (328)
CC1 371 (14) 7 (0) 0 (n/a)
CC2 1592 (87) 190 (56) 14 (9)
CC3 4127 (181) 1637 (310) 504 (342)
1: cloud fraction 0.1 to 0.4(Trade/shallow cumulus)2: cloud fraction 0.4 to 0.99 (Transition stratocumulus)3: cloud fraction great than 0.99 (Solid stratus)a: size of 100 km to 150 kmb: 150 to 300 km c: great than 300 km.
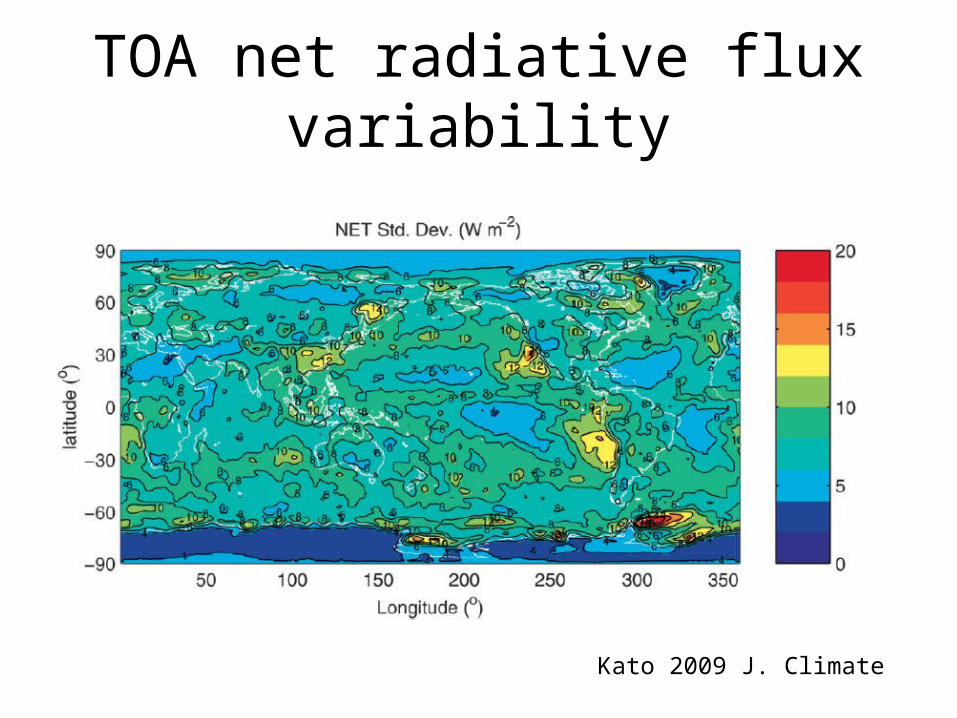
TOA net radiative flux variability
Kato 2009 J. Climate
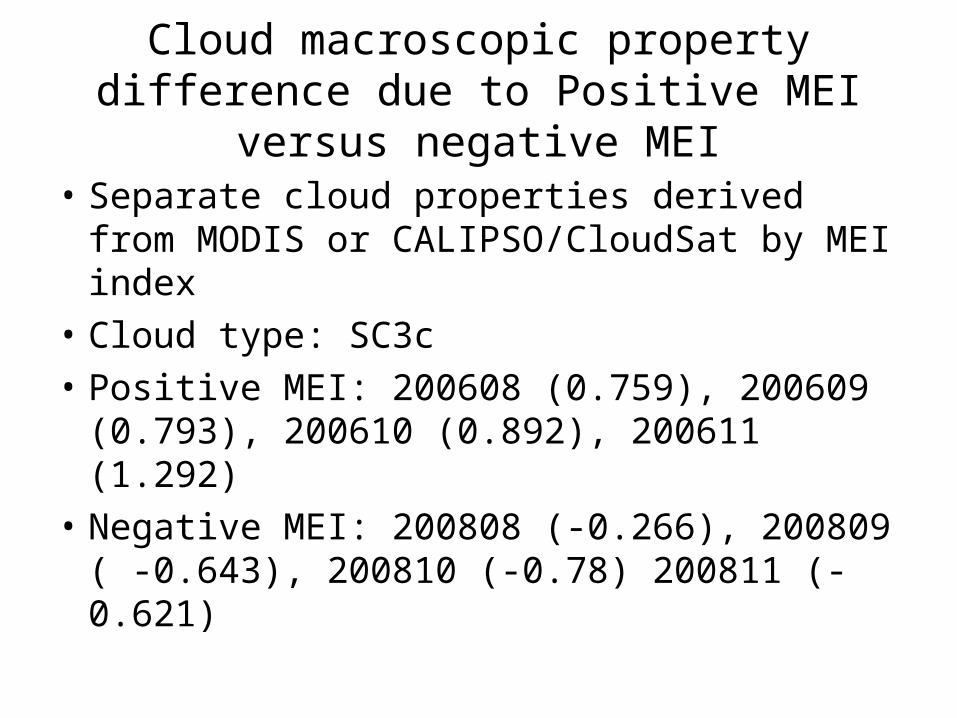
Cloud macroscopic property difference due to Positive MEI versus negative MEI
• Separate cloud properties derived from MODIS or CALIPSO/CloudSat by MEI index
• Cloud type: SC3c• Positive MEI: 200608 (0.759), 200609 (0.793),
200610 (0.892), 200611 (1.292)• Negative MEI: 200808 (-0.266), 200809 ( -
0.643), 200810 (-0.78) 200811 (-0.621)
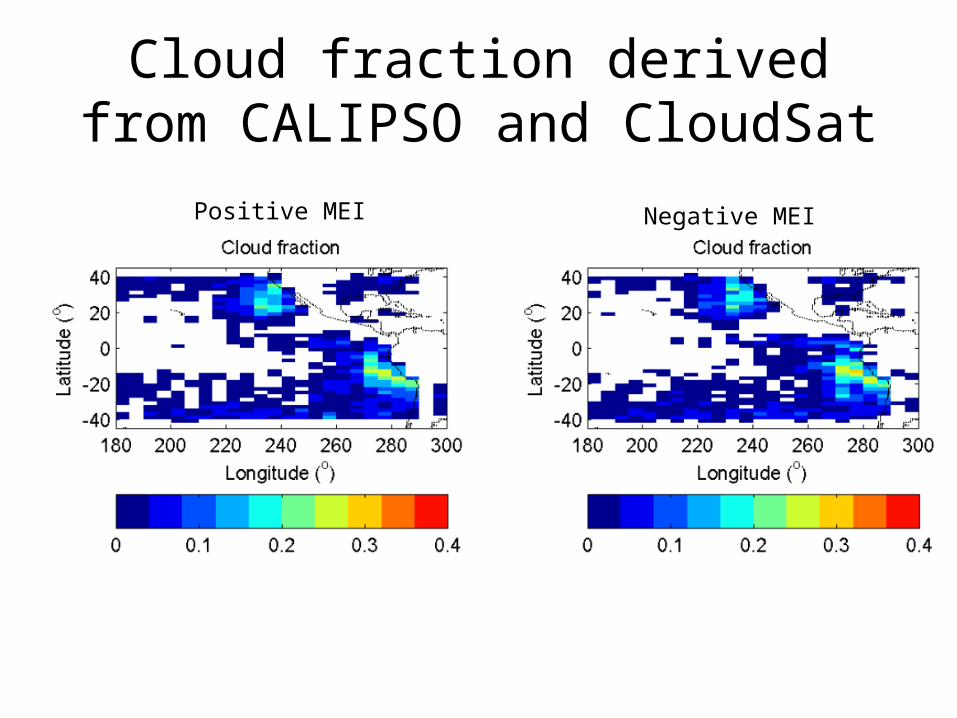
Cloud fraction derived from CALIPSO and CloudSat
Positive MEI Negative MEI
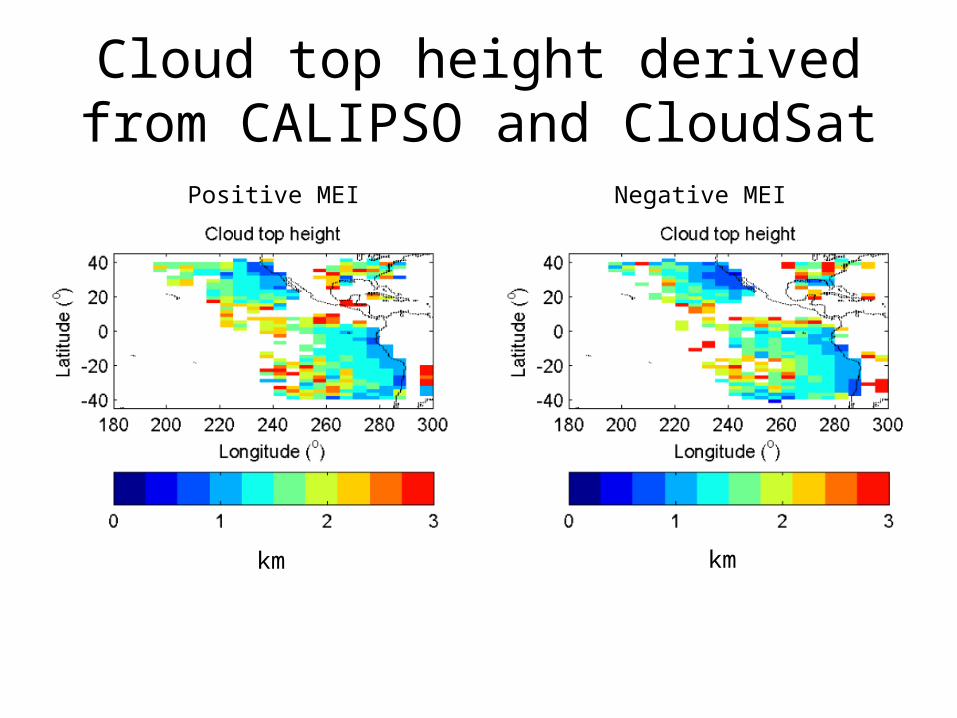
Cloud top height derived from CALIPSO and CloudSat
Positive MEI Negative MEI
km km
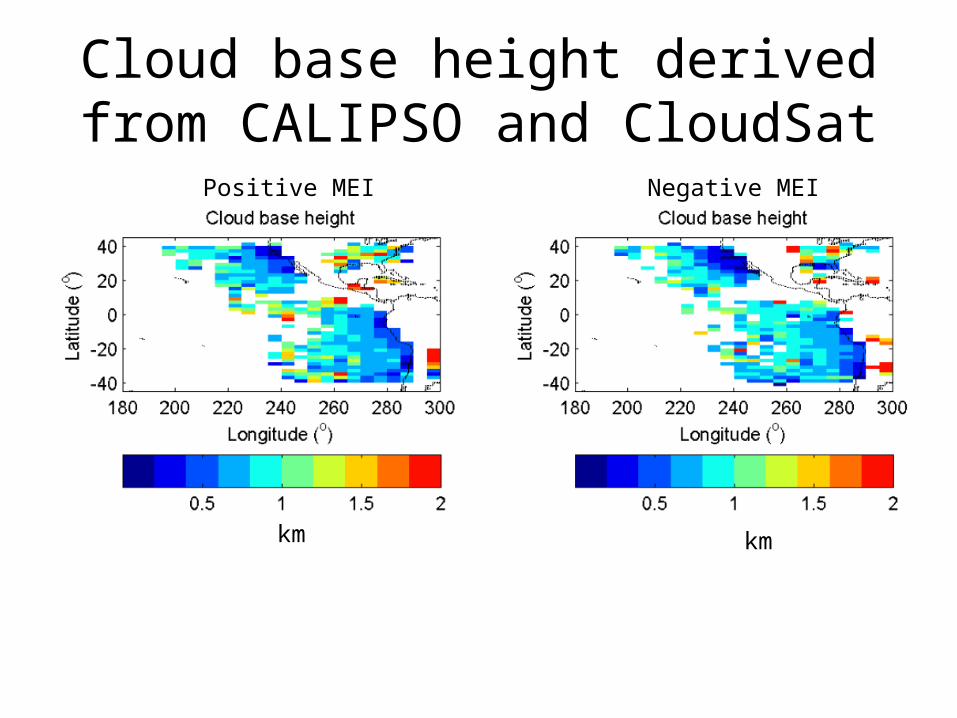
Cloud base height derived from CALIPSO and CloudSat
km km
Positive MEI Negative MEI
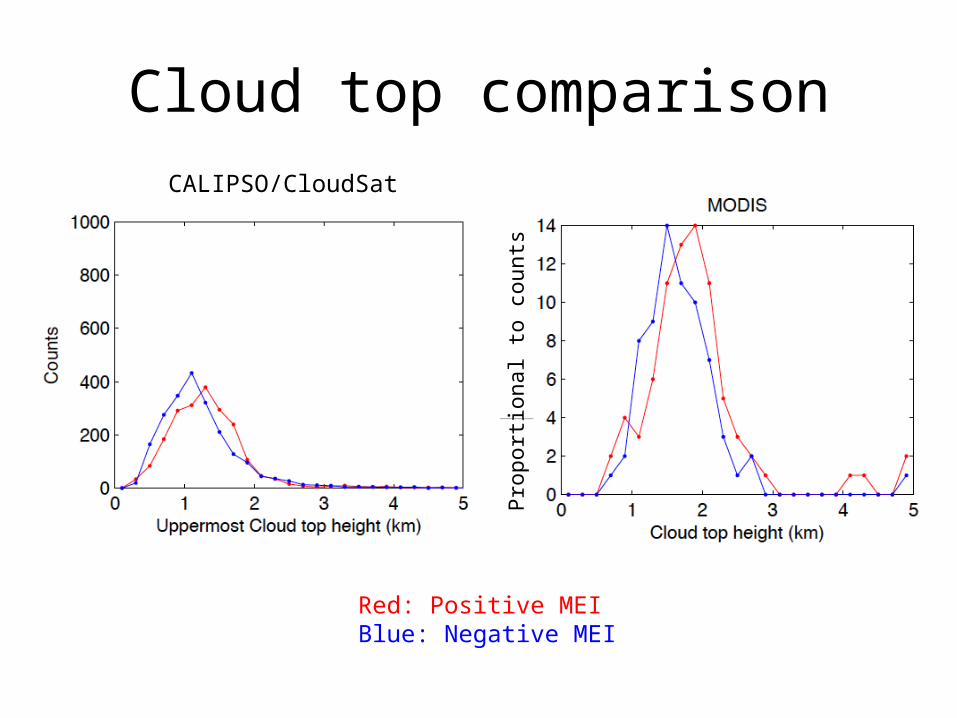
Cloud top comparisonCALIPSO/CloudSat
Red: Positive MEIBlue: Negative MEI
Pro
port
iona
l to
coun
ts
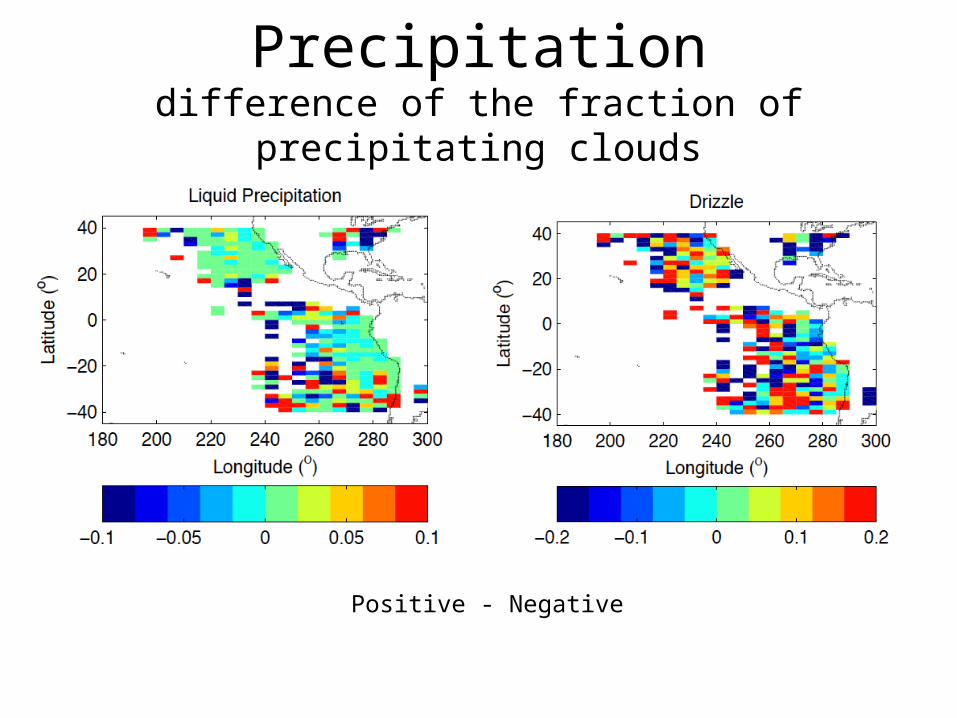
Precipitationdifference of the fraction of precipitating clouds
Positive - Negative
Initial task timeframe (tentative)
• January-May 2013: Cloud object subletting from SSF and CCCM
• April-July/2013: Initial analysis of cloud objects, comparison with previous results (Xu et al. 2007, 2006, 2007, 2008)
• Aug. – Dec./2013: Initial analysis of active sensor derived cloud properties
• Jan-Sep/2014: Understanding relationship between cloud objects and radiation variability.
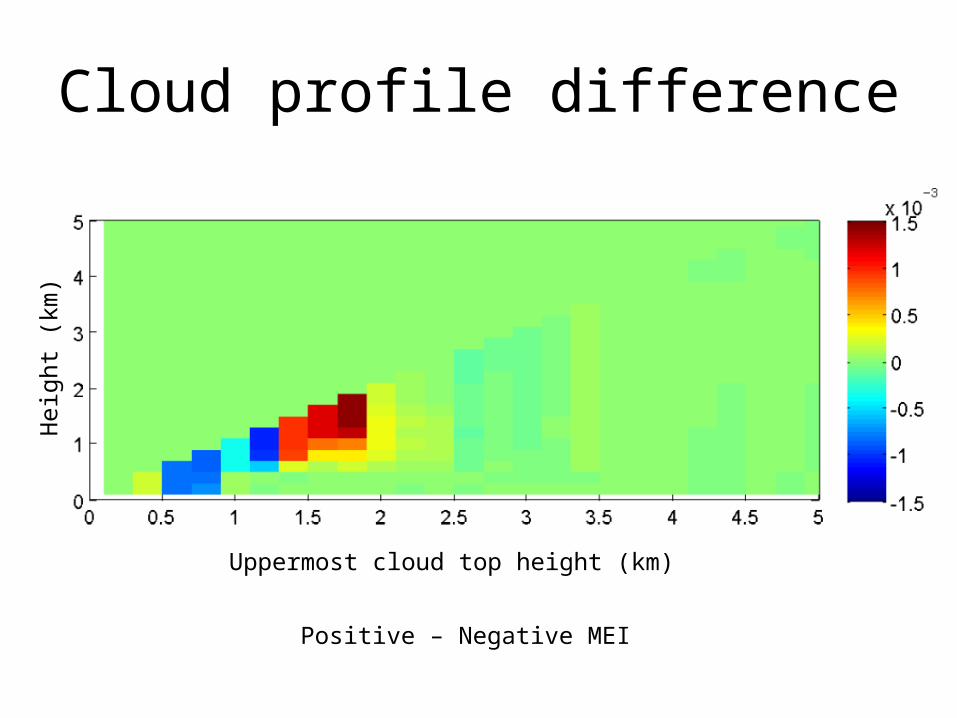
Cloud profile difference
Uppermost cloud top height (km)
Hei
ght (
km)
Positive – Negative MEI
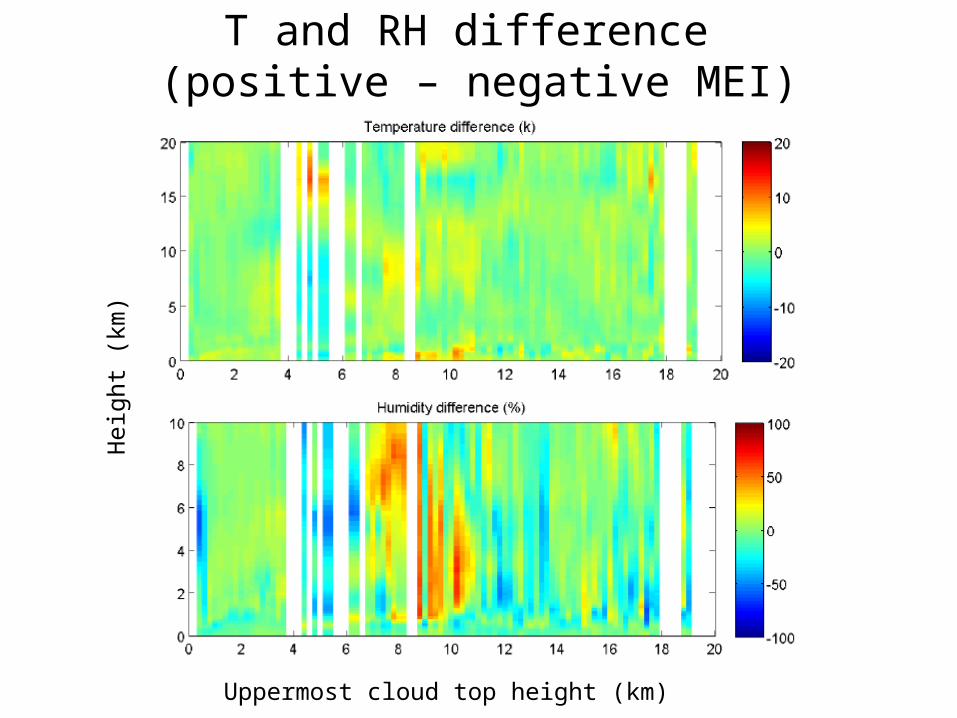
T and RH difference (positive – negative MEI)
Uppermost cloud top height (km)
Hei
ght (
km)
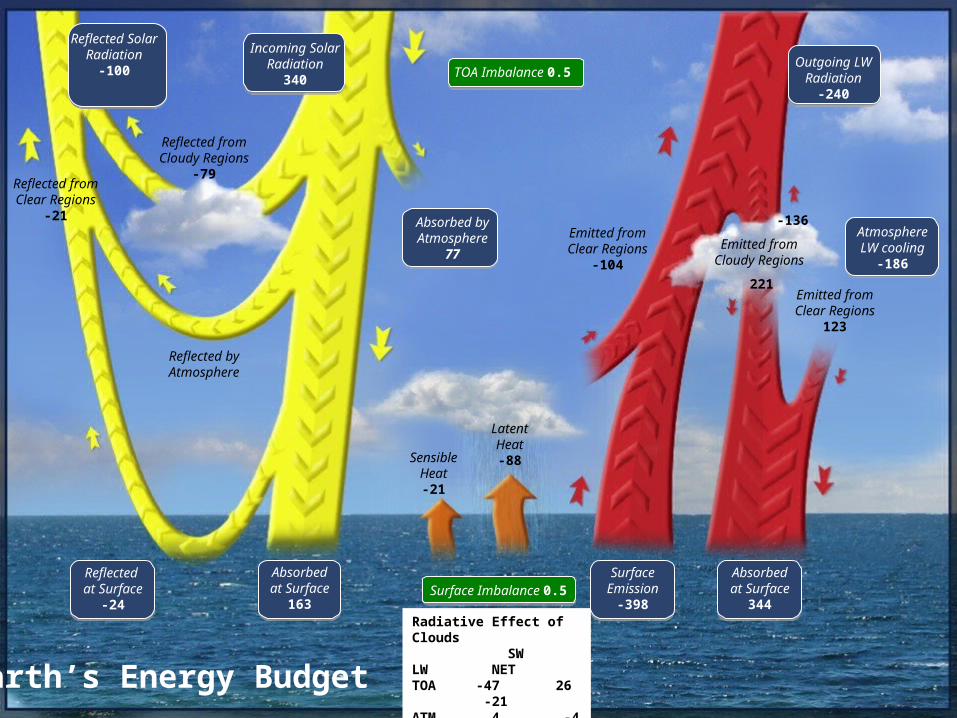
Reflected from Cloudy Regions
-79
Reflected by Atmosphere
Reflected from Clear
Regions-21
Reflected at Surface
-24
Absorbed at Surface
163
Absorbed by
Atmosphere77
Sensible Heat-21
Latent Heat-88
Emitted from Clear
Regions-104
Surface Emission
-398
Absorbed at Surface
344
-136
Emitted from Cloudy Regions
221
Atmosphere LW cooling
-186
Outgoing LW Radiation
-240
Incoming Solar Radiation
340
Reflected Solar
Radiation-100
Surface Imbalance 0.5
TOA Imbalance 0.5
Radiative Effect of Clouds SW LW NETTOA -47 26 -21ATM 4 -4 0SFC -51 30 -21
Emitted from Clear
Regions123
Earth’s Energy Budget


