
Introduction to Quality
and Process
Improvement
Hedieh K Eslamy, MD
Seattle Children’s Hospital
University of Washington, School of Medicine

Josie King’s Story
In January of 2001 Josie (18 months old) was admitted to Johns Hopkins after suffering first and second degree burns from climbing into a hot bath
She healed well and within weeks was scheduled for release
Two days before she was to return home she died of severe dehydration and misused narcotics
From Sorrel King’s speech to the IHI Conference in 2002
http://www.josieking.org/whathappened#sthash.GkB9vt2H.dp
uf

Overview
• Quality: definition, current and future states
• Quality improvement tools and methodologies
Lean: value stream mapping, 5S, pull
systems, and error proofing
Six sigma
7 Quality improvement tools & more …

Quality: Definitions
“The balance between health benefits and harm is
the essential core of a definition of quality”.
Donebadian 1980

Quality: Definitions
“Quality of care is the degree to which health
services for individuals increase the likelihood of
desired health outcomes and are consistent with
current professional knowledge.”
IOM, Lohr 1990

Quality and Safety in
Healthcare
Future state
Current state
Gap

QI Methodologies
Lean
Six Sigma

Lean- Definition • An improvement approach to improve flow and
eliminate waste (MUDA) that was developed by Toyota
Philosophy
Methodologies
• = Toyota Production System

5 Generic Elements in Lean
Organizations
1) Specify value
2) Identify and visualize value stream
3) Making the value steps flow
4) Pulling patients along their journey
5) Perfection
Womack, Jones 1996. “The Machin that Changed the World”. Simon and Schuster, New York

Lean: Management Principles
• Relentless elimination of waste and non-value-
adding activities

7 Wastes
Transportation
Inventory
Motion
Waiting
Oversupply
Overprocessing
Defects
An 8th waste is the wasted potential of people

Lean Methodologies
• Value stream mapping
• Visual Management: Five S
• Pull systems: Kanban, just-in-time
• Error-proofing

What Is Value?
• A capability provided to a customer
– of the highest quality
– at the right time
– at an appropriate price
as defined by the customer
• "Value" is what the customer is buying
Value Stream Mapping
• A special type of flowchart
• A visual map for analyzing the “current state” and
designing a “future state” for the series of steps in
a patient’s pathway
• A tool that allows you to see waste, and plan to
eliminate it

Visual Management: 5S
• A technique that results in a well-organized workplace complete with visual controls and order
• It’s an environment that has “a place for everything and everything in its place, when you need it”

Visual Management: 5S
• Sort (Seiri)
• Set in order (Seiton)
• Shine (Seiso)
• Standardize
(Seiketsu)
• Sustain (Shitsuke)

Pull System
• A system which will produce or process an item
only when the customer needs it or has
requested it
• A method of controlling resources by replacing
only what has been consumed

Pull System: Examples
• Using a signal to alert the MD to visit their patient
in the exam room following receipt of the signal
that the x-ray is ready for review
• 2-bin Kanban system to replenish medical
supplies

Pull System Signal: Kanban
• A signal for communication that allows the customer
to say, “I am ready for more” or “I need more”
• Signal can be a card, bin, empty space, cart, etc.
• Authorizes work to begin or supplies/equipment to be
moved

Just in time
• A production strategy that strives to improve a
business' return on investment by reducing in-
process inventory and associated carrying costs
• To meet JIT objectives, the process relies on
signals (Kanban) between different process
points, which tell production when to make the
next part

Levels of Quality System
Level 3
Level 2
Level 1
Level 4
Level 5 Prevent
Errors Eliminate opportunities
for errors
Self inspection
Work unit inspects
Company inspects
Customer inspects
Check
for
Errors
Detect
Errors

“Swiss Cheese Model” of
System Failure
System analogous to a stack of Swiss cheese
slices -> each a defensive layer
For an error to occur, the holes need to align
Reason, J. (1990) Human Error. Cambridge: University Press,Cambridge.

Error Proofing (Poka Yoke)
• Designing or modifying equipment or processes
so that defects cannot occur
• Look-alike packages for eye medications include
those for three different types of antibiotics and
an antiviral drug for the herpes virus
• Provide packaging that helps health care
providers and patients differentiate one drug
from another

Lean & Six Sigma
• Lean -> NO WASTE
• Six Sigma -> NO VARIANCE

Six Sigma: DMAIC Incremental process improvement methodology based on
Deming’s PDCA cycle using Six Sigma methodology
Define – Define the project goals and customer (internal
and external) deliverables
Measure – Measure the process to determine current
performance
Analyze – Analyze and determine the root cause(s) of the
defects.
Improve – Improve the process by eliminating defects
Control – Control future process performance

Kaizen & Kaizen Event
Kaizen – small, continuous improvements
Kaizen event - focused three to five day breakthrough events that
generally include the following activities:
Training
Defining the problem/goals
Documenting the current state
Brainstorming and developing a future state
Implementation
Developing a follow-up plan
Presenting results
Celebrating successes

QI Tools – American Society for Quality
Cause analysis
Evaluation and decision making
Process analysis
Data collection and analysis
Idea creation
Project planning and implementation

When to Use Each Tool Set?
Cause analysis – discover cause of a problem or solution
Evaluation and decision making – narrow a group of choices to best one OR evaluate the results
Process analysis – understand a process
Data collection and analysis – collect and analyze data
Idea creation – come up with new ideas OR organize many ideas
Project planning and implementation – manage improvement project
N Tague. The Quality Toolbox. 2nd Ed

N Tague. The Quality Toolbox. 2nd Ed
Idea creation
Brainstorming
Benchmarking
Affinity diagram
Eval. & decision making
Multivoting
Nominal group
technique
Prioritization matrix
Cause analysis
Fishbone diagram
Pareto chart
Scatter diagram
Stratification
5 Why’s Process analysis
Benchmarking
Flowchart Data collection &
analysis
Balanced scorecard
Benchmarking
Run chart
Control chart
Histogram
Pareto chart
Scatter diagram
Stratification
Project planning & implementation
Checklist
Flowchart
PDSA cycle
Project charter – A3 form

PDSA cycle & Model for
Improvement
Quality improvement in neonatal digital radiography: implementing the basic quality improvement tools. Eslamy, H. K.,Newman, B.,Weinberger, E.;
Semin. Ultrasound CT MR. 2014 Dec 03

7 Basic QI Tools
• cause-and-effect (fishbone) diagram
• check sheet
• control chart
• histogram
• Pareto chart
• scatter diagram
• stratification run chart
flow chart

Cause-and-effect (fishbone)
diagram
A diagram structured similar to a fish skeleton that sort ideas into categories
To structure a brainstorming session and identify the potential causes of a problem
Check sheet
An organized form for collecting and analyzing data
To record data so that patterns can be recognized
Flowchart
A diagram depicting the sequential steps in a process using connecting lines and a set
of conventional symbols
To identify the actual or target sequence of steps in a process
Histogram
A bar graph used to show frequency distribution of numerical data
To determine distribution of data and whether or not it is normally distributed
Pareto chart
A descending bar graph arranged with the tallest bar at the far left and the shortest bar
at the far right. The length of each bar represents the frequency (or percentage) of each
category
To focus on the most significant factors causing a problem
Scatter diagram
A graphical display of pairs of numerical data typically with the independent variable on
the x-axis and the dependent variable on the y-axis
To identify potential relationships between pairs of numerical data
Stratification
A technique used in combination with other tools. When data from a variety of sources
are grouped together the patterns in the data may be obscured. In stratification, the
data from different sources are separated
To separate the data from different sources so that patterns may be discerned
Run chart
A line graph with a performance measurement on the vertical axis and time on the
horizontal axis
To study variation in data over time and determine the effects of changes
Control chart
A run chart with statistically based upper and lower control limits
To recognize special and common causes of variation
Quality improvement in neonatal digital radiography: implementing the basic quality improvement tools. Eslamy, H. K.,Newman, B.,Weinberger, E.;
Semin. Ultrasound CT MR. 2014 Dec 03

Cause-and-effect Diagram
Quality improvement in neonatal digital radiography: implementing the basic quality
improvement tools. Eslamy, H. K.,Newman, B.,Weinberger, E.;
Semin. Ultrasound CT MR. 2014 Dec 03
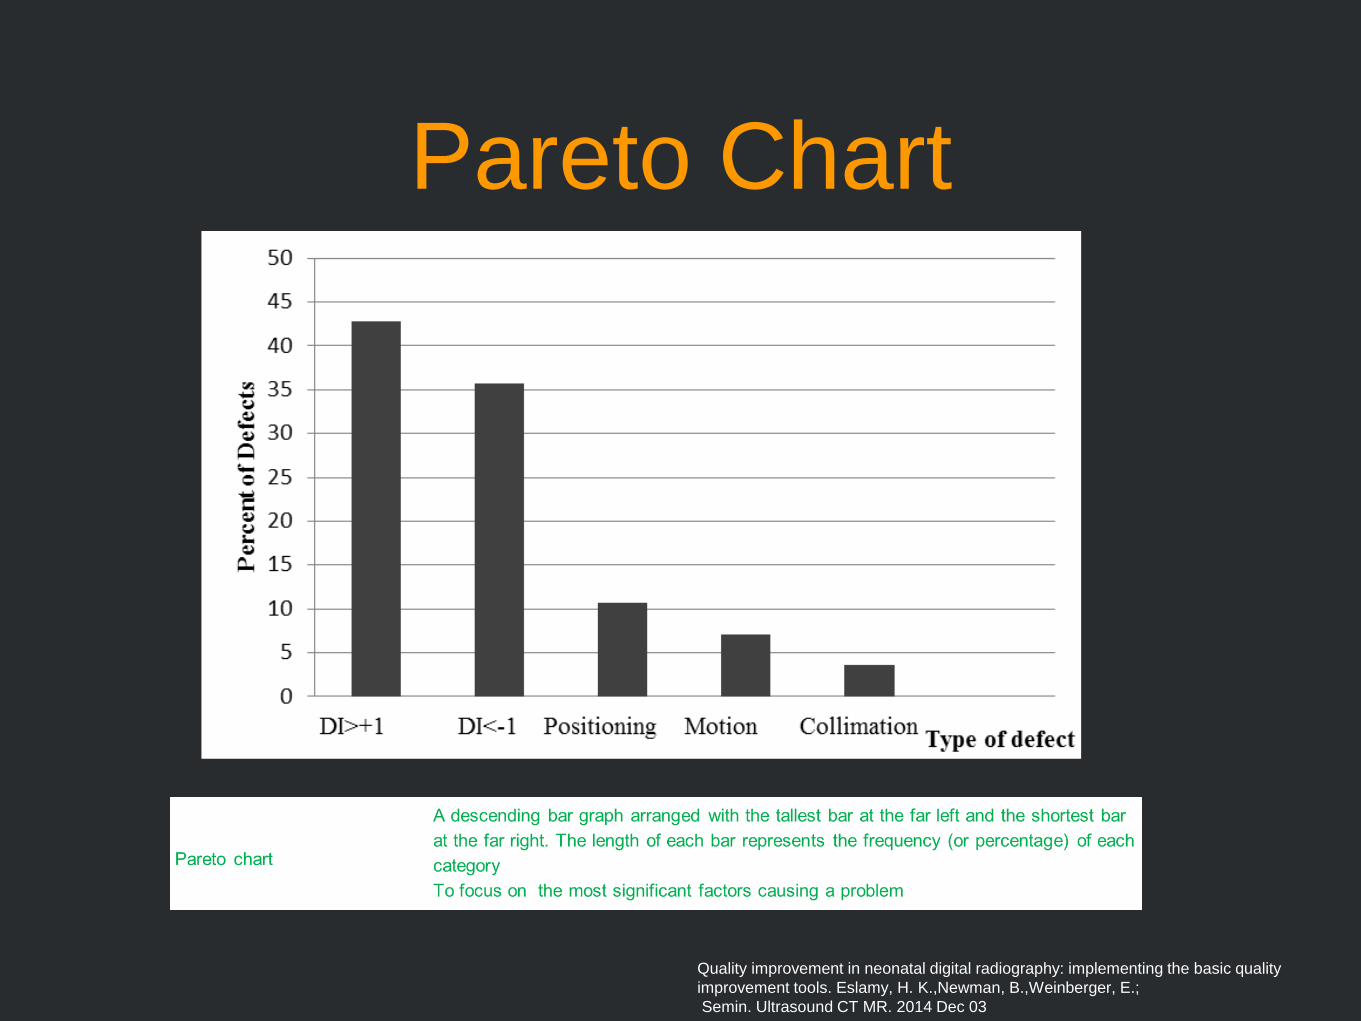
Pareto Chart
Quality improvement in neonatal digital radiography: implementing the basic quality
improvement tools. Eslamy, H. K.,Newman, B.,Weinberger, E.;
Semin. Ultrasound CT MR. 2014 Dec 03

Flow Chart
Quality improvement in neonatal digital radiography: implementing the basic quality
improvement tools. Eslamy, H. K.,Newman, B.,Weinberger, E.;
Semin. Ultrasound CT MR. 2014 Dec 03

Quality improvement in neonatal digital radiography: implementing the basic quality
improvement tools. Eslamy, H. K.,Newman, B.,Weinberger, E.;
Semin. Ultrasound CT MR. 2014 Dec 03

5 Why’s
Helps to identify the root causes of a problem
Simply ask “Why?” and write down the answer(s).
Continue to ask “Why?” for each new statement
until
“Why?” has been asked ≥ 5 times OR
A root cause is reached


