
Introduction to QGIS
Randal Hale - NRGS
1

Disclaimer:
I make no claims to any software, operating systems, companies, or programming languages.
I only lay claim to the cat pictured below.
2

Data:
Data was downloaded from the State of Hawaii, Office of Planning.
● http://planning.hawaii.gov/gis/download-gis-data/
This data is not warrantied. If you use it and accidentally drive into a volcano or find an ancient tiki idol and are struck by unexplainable bad luck…..well…...you were warned.
3

A Brief History……..
● Project began in 2002 as a GIS data viewer but has evolved into a fully functioning GIS Desktop that is Open Source
● Before the 2.0 release it was known as Quantum GIS and you will still hear people call it that
● Installation comes in 3 flavors - standalone and advanced for windows and packages for Linux:
● Operating Systems Supported:
4
Windows Mac Linux ……...and Android
● Open Source: GNU General Public License (GPL) “which guarantees end users (individuals, organizations, companies) the freedoms to use, study, share (copy), and modify the software.[1]
[1] “GNU General Public License”. http://en.wikipedia.org/wiki/GNU_General_Public_License. Retrieved 06 November 2013

What does it do? A Lot!
● View data – vector (SHP, MapInfo, SDTS, OGR[2] Simple Features Library and more); raster (GeoTiff, IMG, ArcInfo Grid, JPEG, PNG and more – anything supported by GDAL); GRASS raster and vector data; online data served as web services (WMS, WMTS, WCS, WFS, WFS-T, etc...)
● Explore data – QGIS Browser (think ArcCatalog); on-the-fly reprojections; identify and selection tools; annotation and labeling; edit/view/search attributes; save and restore projects
● Create, edit, manage and export data – digitizing vector data (OGR and GRASS formats); create and edit SHP and GRASS data; Georeference images (with plugin); GPS data tools; visualize and download OSM data; Export to PostGIS and Spatialite Databases
[2] “GDAL: FAQ - General”. http://trac.osgeo.org/gdal/wiki/FAQGeneral. Retrieved 06 November 2013
5

Intro to QGIS
I. Navigating the Interface
II. Project Configuration
III. Analysis
IV. Print Composer
6
Main topics covered during the workshop

Intro to QGIS
Topics:
● QGIS Interface
● QGIS Browser
● Saving QGIS Files
7
Main topics covered during the workshop

Navigating the Interface
Desktop - the main QGIS Interface will look and feel similar to ESRI’s ArcMap and several other GIS Desktop Programs.
Browser - the (data) browser can be accessed either from within Desktop as a panel or by using the Browser icon that will open a standalone version. This feature resembles ESRI's ArcCatalog except with more limited functions for reviewing data
8

Exercise 1
1. On your Desktop, look for the QGIS Desktop icon and double click on it to open. It is recommended you keep QGIS open at all times going forward so you can explore the interface
Give it a moment for the splash screen to show up. Times will Vary. Most of you are used to waiting for ArcMap.
2. Close the tip screen and leave open to follow along.
9
Notice that a tip screen pops up with the QGIS Desktop interface. This might provide helpful information as you are getting familiar with the program. You can turn it on/off under Settings > Options > General. Look for tips at startup.

Navigating the Interface: Desktop
QGIS interface is divided in 5 main areas: 1. Menu Bar; 2. Tool Bar; 3. Map Legend (Panel); 4. Map Canvas; 5. Status BarOther added features: 6. Manage Layers Bar; 7. Toolbox Panel; 8. Python Console
10
1
63 4
2
5
8
7

Navigating the Interface: Layers and Navigation
● Add vector Layer
● Add Raster Layer
● Add PostGIS Layer
● Add Spatialite Layer
● Add MSSQL Spatial Layer
● Add WMS/WMTS Layer
● Add WCS Layer
● Add WFS Layer
● Add Delimited Text Layer
● New Shapefile Layer/Spatialite Layer
● Create New GPX Layer
11
● Pan
● Pan Map to Selection
● Zoom In
● Zoom Out
● Zoom to Pixel Resolution
● Zoom to Full Extent
● Zoom to Selection
● Zoom to Layer
● Zoom to Last Extent
● Zoom to Next Extent
● Refresh

Navigating the Interface: Attributes
● Identify Features
● Run Feature Action
● Select Single Feature
● Deselect Features from All Layers
● Select Features using an Expression
● Open Attribute Table
● Open Field Calculator
● Measure Feature Tools
● Map Tips
● New Bookmark
● Show Bookmarks
● Annotation Tools12

Navigating the Interface: QGS Files
● QGIS can save user sessions
● Project > Save
● Save a .qgs file. Can be opened in a normal text editor13
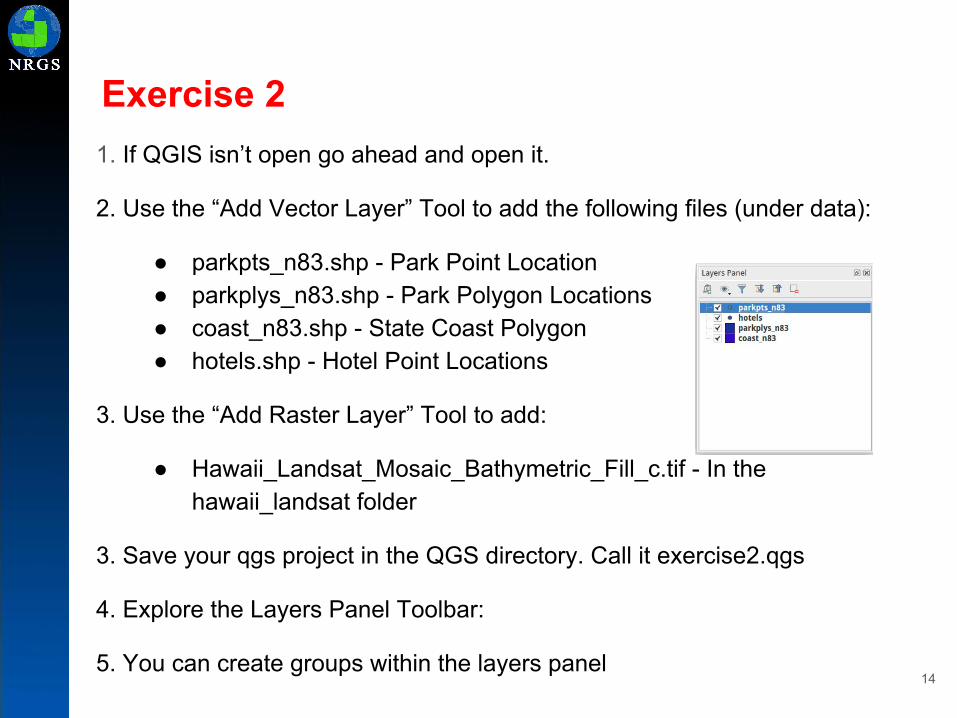
Exercise 21. If QGIS isn’t open go ahead and open it.
2. Use the “Add Vector Layer” Tool to add the following files (under data):
● parkpts_n83.shp - Park Point Location ● parkplys_n83.shp - Park Polygon Locations ● coast_n83.shp - State Coast Polygon● hotels.shp - Hotel Point Locations
3. Use the “Add Raster Layer” Tool to add:
● Hawaii_Landsat_Mosaic_Bathymetric_Fill_c.tif - In the hawaii_landsat folder
3. Save your qgs project in the QGS directory. Call it exercise2.qgs
4. Explore the Layers Panel Toolbar:
5. You can create groups within the layers panel14

Exercise 2
6. Create a group by pushing the Highlighted icon
7. Drag and drop your park layers into the New Group
8. Name the Group Parks (right click on group and rename)
9. Save!
10. Add the <RASTER FILE> Using the Add Raster Icon
15

Exercise 2
BONUS
1. Open the exercise2A.qgs file in the your qgs folder in your class data folder.
How did you fix it? In Arcmap you would get a red exclamation point next to your broken data layer.
2. Close and don’t save it. Open it in Notepad and find the line containing the landsat image (use find). Note you can fix your qgs file manually if needed. Close Notepad without saving the qgs file.
16

Navigating the Interface: Desktop
17
Broswer Tab
Drag and Drop onto Canvas
Right Click in Toolbar area to add browser or other panels to the Desktop
From the Manage Layers Toolbar and the Browser Panel you can add Shapefiles, Databases, WFS, WMS, and several other types of files.

Navigating the Interface: Browser
18
View metadata, attributes, and a preview of vector and raster data. Also, Manage WMS connections and create new shapefiles. However, new folders must be created in Windows explorer.

Intro to QGIS
I. Navigating the Interface
II. Project Configuration
III. Analysis
IV. Print Composer
19
Main topics covered during the workshop

Project Configuration
Topics:
● Settings
● Project Properties
● Coordinate Reference Systems (CRS)
● Panels, Toolbars, and Plugins
20
Exercise 3
1. Open exercise2.qgs. Save it as exercise3.qgs. Go to Settings > Options

Project Configuration: Settings > Options
21
Application Style, Fonts, Project File Behavior
Environment Variable for QGIS and Plugins
Feature Attributes and Table: Data Source
Vector and Raster Rendering Behaviors
Default Colors
Layer and Map Appearance
Identify and Measure Tool Settings
Defaults for Map Composer
Snapping and Digitizing Tool Settings
Raster and Pyramid Driver Options
Projection Information
Override Local Language Settings
Point to local WMS and cache settings
These change the default settings for ALL QGIS PROJECT FILES
QGIS is extremely customizable!

Project Configuration: Project Properties
22
Selection color; Project Path; Map Units, Precision
On the Fly reprojection
Choose which layers are identifiable
Assign Default symbols and set transparencies
Create a WMS/WFS from a QGIS Project
Write Python Macros
Relationships (joins) within the project
These change the default project setting for the CURRENT QGIS Project

Exercise 3
1. Save exercise2.qgs as exercise3.qgs2. In exercise 3, add the haw_centerlines.shp to your QGIS session. 3. Does it line up with your imagery? 4. Right Click the Layer and go to Properties > General and look at
the Coordinate Reference System.
23

Exercise 3
4. Click Cancel
5. Right click coast_83 in the Map Layers panel. Go to Properties > General and look at the Coordinate Reference System.
24

Project Configuration: CRS (or Projections)
25
Geographic Coordinate Systems:
Define Locations on a spherical model of the earth
Projected Coordinate Systems:
Define Locations on a flat model of the earth

Project Configuration: CRS
Geographic Coordinate Systems:
● Defines Locations with Latitude/Longitude values● Latitude runs north and south of the Equator (0° – 90° north and
south)● Longitude runs east and west of the Prime Meridian (0° - 180°)● Prime Meridian is Greenwich
26

Exercise 3
6. Open the prj file for haw_centerlines in notepad (or your favorite text editor). It should look something like:
7. What do you notice about the projection ? (HINT IT’S DIFFERENT) IT HAS A PROJECTION.
27
PROJCS["NAD_1983_StatePlane_Hawaii_1_FIPS_5101_Feet",GEOGCS["GCS_North_American_1983",DATUM["D_North_American_1983",SPHEROID["GRS_1980",6378137.0,298.257222101]],PRIMEM["Greenwich",0.0],UNIT["Degree",0.0174532925199433]],PROJECTION["Transverse_Mercator"],PARAMETER["False_Easting",1640416.666666667],PARAMETER["False_Northing",0.0],PARAMETER["Central_Meridian",-155.5],PARAMETER["Scale_Factor",0.9999666666666667],PARAMETER["Latitude_Of_Origin",18.83333333333333],UNIT["Foot_US",0.3048006096012192]]

Exercise 3
8. Right click on haw_centerlines in the Map Layer Panel and select “Save as…”
9. Save your new file to the data directory and name it hawaii_centerlines.shp
10. Make your CRS to be 26904 by clicking on the “Select CRS” button.
11. Click OK
You just reprojected a shapefile!
28

Exercise 3
12. Look for your new hawaii_centerlines layer in the map layer panel. Look for it on the map.
13. Right click hawaii_centerlines and go to > Properties > General and rename the layer to Hawaii Road Centerlines
29

Project Configuration: Panels, Toolbars, Plugins
Panels and Toolbars:
● Turn them on and off by going to View > Panels or Toolbars.
● Panels provide interactive“windows”. Examples: Layers,GPS Information, and toolbox
● Toolbars are a grouping of tools
● Panels/Toolbars can also be added/removed by right-clicking on the toolbar area
30
Panels on top...
...Toolbars on bottom

Project Configuration: Panels, Toolbars, Plugins
Plugins:● Plugins are addons that introduce new features or functions to
QGIS
● Adding, removing, activating and deactivating of plugins are all done through Plugins > Manage and Install Plugins...
● Implemented as either core or external plugins
● Core Plugins (Installed) are developed by the QGIS dev team and included in distribution
● External Plugins (Get more) or 3rd Party Plugins are stored in external repositories and maintained by authors
● Within the Plugin Manager under Settings, choose Check for updates on startup and then the frequency to keep them up to date
31

Project Configuration: Panels, Toolbars, Plugins
Useful Plugins to get you started:
● Group Stats Plugin gives you the ability to summarize data layers in tabular format● OpenLayers Plugin gives you access to open data layers to add as backdrops to your
maps. Examples include OpenstreetMap, Google Maps, Bing Maps and more.
32

Exercise 4
1. Save exercise3.qgs as exercise4.qgs
2. Go to Plugins > Manage and install plugins > Plugins. Scroll down the list to find or type in search “OpenLayers Plugin”. Click and install the plugin.
3. Install the “Group Stats Plugin”. Notice you get a new icon on the desktop >
4. Go to Vector > Group Stats > Group Stats. Some of you may be familiar with the Frequency functionality in ArcGIS Desktop. You may also be familiar that it is locked by license level.
So what if you wanted to summarize some data in QGIS? You have been asked to summarize the types of Hotels in the Hawaiian Islands.
33

Exercise 4
5. Open Group Stats.
6. You want to count the types of Hotels. Drag the Count Function into columns. Drag Type into Rows and Value. This will allow you to count the Types of Hotels and Display the Types in Rows.
34

Exercise 4
7. Click Calculate
35

Exercise 4
8. Enable the Spatial Query Plugin.
9. Select Hawaii using the select tool (hint highlight coast_n83 in your map layers).
36

Exercise 4
10. Go to Vector > Spatial Query > Spatial Query
11. Select all the Hotels that fall within the island of Hawaii.
37

Exercise 4
8. Take a look at the Plugins Menu. Look at Advanced Digitizing, Group Stats, Topology, Azimuth and Distance Plugin, AutoTrace, and finally Spatial Query
Note:
● Plugins can be poorly documented!● Some plugins can change your canvas projection!● Plugins extend the functionality of QGIS!● Most (if not all) are written in Python!● Sometimes they break between QGIS Upgrades! ● Overall they are a great addition to QGIS!
38

Intro to QGIS
I. Navigating the Interface
II. Project Configuration
III. Analysis
IV. Print Composer
39
Main topics covered during the workshop

Analysis
Topics:
● Data Layers
● Editing
● Symbolizing Layers
● Geoprocessing
○ GRASS
○ SAGA
○ GDAL
40

Exercise 5
1. Open exercise4.qgs and save it as exercise5.qgs
2. Right click coast_n83 and go to properties
41

Analysis: Data Layers - Vector
42
Vector Layer Properties:
This provides information about the layer as well as the ability to label and customize the layer's symbology.
Join Attribute table to layer
Add/Delete Fields; edit attribute table
Create a WMS/WFS from a QGIS Project
Add Graphic overlays to layer
Metadata
Display name, source info; CRS, scaling
Layer Symbology; Transparency
Label Style and Behavior
Perform Automated tasks

Analysis: Projections
43
Data projections: To jump back to projections. All Vector/Raster Data has a projection or CRS. The quickest way to check projections is to Right Click the data Layer > Properties > General

Analysis: Data Layers - Raster
Raster Layer Properties:
This provides information about the layer as well as the ability to set pyramid levels, adjust appearance, and view the histogram.
44
Pyramid Resolutions
View Histogram
Display name, source info; CRS, scaling
Band and Color Rendering
Transparency Options
Metadata

Analysis: Data Formats● Vector Layer Examples (OGR
vector formats)○ ESRI Shapefile○ Spatialite (SQLite)○ GPX○ Google KML
● Raster Layers○ GeoTiff○ PNG○ JPEG○ ESRI Grid○ Erdas IMG
● Web Services● Delimited Text Layer● ESRI's Geodatabase ● Databases: Oracle, SQL Server,
PostGIS, 45

Exercise 5
1. Right click on Hawiian Road Centerlines and go to > Properties.
2. Resize or move the Layer Properties window so you can see the data in the Map Canvas. Select Style then from Saved styles, select Residential. Change the width to 0.5. Click on Apply.
3. Click on Labels and click on the box next to Label this layer with. Click on the dropdown menu next to it and select FULLNAME then click on Apply to see the change in the Map Canvas.
4. In the same Label window, click on Buffer and click on the box next to Draw text buffer. Next, go to Rendering and scroll down until you see Merge connected lines to avoid duplicate labels. Click on OK.
5. Also turn on scale-based visibility. Set the Maximum to be 24000. Hit Apply. Save your QGIS file!
46

Exercise 5
6. Right Click coast_n83 and go to properties. Change the name to Coasts under the General Tab.
7. Go to the Styles Tab. Change the Fill.
47

Exercise 5
8. Save The style under the style button. Save your style by going to Style > Save Style > QGIS Layer Style File
Note: When you save a style QGIS will pick that style when you add this data to a new QGIS session. It’s very similar to ArcMap’s lyr files.
48

Analysis: Digitizing Tools
Digitizing Tools:
● Current Edits
● Toggle Editing
● Save Layer Edits
● Add Feature (points, lines, polygons)
● Digitize Curves
● Move Feature(s)
● Node Tool
● Delete Selected
● Cut Features
● Copy Features
● Paste Features 49

Analysis: Digitizing Tools
● Undo
● Redo
● Rotate Feature(s)
● Simplify Feature
● Add Ring
● Add Part
● Delete Part
● Reshape Feature
50
● Offset Curve
● Split Features
● Merge Selected Features
● Merge Attributes of
● Selected Features
● Rotate Point Symbols
Advanced Digitizing Tools:

Exercise 6
1. Save exercise5.qgs as exercise6.qgs
2. Be sure to turn on or add Hawaii_Landsat_Mosaic_Bathymetric_Fill_c.tif to your QGIS Project.
3. Go to Layer > Create Layer -> New Spatialite Layer
51

Analysis: Spatialite
SpatiaLite is an open source library intended to extend the SQLite core to support fully fledged Spatial SQL capabilities.
SQLite is intrinsically simple and lightweight:
● a single lightweight library implementing the full SQL engine● standard SQL implementation● no complex client/server architecture● a whole database simply corresponds to a single monolithic file (no
size limits)● any DB-file can be safely exchanged across different platforms,
because the internal architecture is universally portable● no installation, no configuration
SpatiaLite is smoothly integrated into SQLite to provide a complete and powerful Spatial DBMS (mostly OGC-SFS compliant).
52

Exercise 6
4. Make a polygon layer!
Pick a database name
Pick a layer name
Pick a type
Pick a CRS
Add one field - it’s required
Click add attribute to list!
Click OK
53

Exercise 6
54
1. Large magma chamber 2. Bedrock 3. Conduit (pipe) 4. Base 5. Sill 6. Dike 7. Layers of ash emitted by the volcano 8. Flank 9. Layers of lava emitted by the volcano 10. Throat 11. Parasitic cone 12. Lava flow 13. Vent 14. Crater 15. Ash cloud
The main Volcano is Mauna Loa

Exercise 6
5. Select your crater layer in the Map Layer Panel
6. On the digitizing toolbar click “Toggle Editing”
55

Exercise 6
7. Digitize a polygon around the main crater on Hawaii.
56

Exercise 6
8. Once you digitize your polygon - Record a name. Click OK
9. Right click your crater layer and open the attribute table
57

Analysis: Data Layers
Many Web Services such as ArcGIS Online, USGS National Map and more can be displayed if they are publicly available you you have the right address Information to the server.
QGIS supports these types of web services:
● WMS – Web Map Service● WMTS – Web Map Tile Service● WCS – Web Coverage Service● WFS – Web Feature Service● WFS-T – Web Feature Service-Transactional
Tools for these are found in the Manage Layers toolbar.
58

Analysis: Vector Geoprocessing
59

Analysis: Raster Processing
60

Analysis: Processing ToolboxEquivalent to Spatial Analyst
Provides seamless access to multiple software tools like:
● GRASS● SAGA● GDAL● LAS TOOLS● ORFEO● QGIS Core Functionality
Processing Models can be built very similar to ArcGIS’s Model Builder
Don’t forget PYTHON!
61

Intro to QGIS
I. Navigating the Interface
II. Project Configuration
III. Analysis
IV. Print Composer
62
Main topics covered during the workshop

Print Composer
Topics: ● Print Composer
● Adding your Map
● Adding Map Elements
● Saving your Map
63

Print Composer:
64
7
3
6
4
5
12
Print Composer interface: 1. Menu Bar; 2. Tool Bar; 3. Map Layout; 4. Command History; 5. Composition; 6. Item Properties; 7. Atlas Generation

Print Composer
● Saving Map Composition
● New Composer
● Duplicate Composer
● Composer Manager
● Load From Template
● Save as Template
● Export as image
● Export as SVG
● Export as PDF
● Revert Last Change
● Restore Last Change65
● Zoom to full Extent of Map Composition
● Zoom in
● Zoom out
● Refresh Display

Print Composer
The print composer provides growing layout and printing capabilities.
● “Window” to map canvas (ESRI = data frame)● Text labels (ESRI = annotation/text elements)● Images (graphics/pictures)● Basic shape elements● Attribute tables● HTML frames● Map elements (legends, scalebars, north arrows, and title)● To open a new print composer window click Project > New Print
Composer. ● You can have as many as the QGIS project can handle!
66

Print Composer: Map
67
Click on Add New Map button then draw a rectangle for where the Map Canvas will appear.

Print Composer: Map Elements
68
Add map elements by clicking On the icons or they are foundUnder Layout
These areas keep track of changesand allow you to customize mapElements. Atlas is similar to ESRIData Driven Pages.

Print Composer: Map Elements
Once the map has been added, decorations or elements can be added. Their properties, as well as the page properties, can be viewed and modified. The Print Composer tracks changes in the Command History window.
69
Composition Tab:● Set the Page Size
● Snap to Grid
● Snap to Extents
● Map Units: Inches or MM
Item Properties Tab:● Set the Font
● Set Scale Bar Properties
● Set Legend Properties
● Set Map Element Properties
Atlas Generation Tab:● Create Automated Map
Books

Print Composer: Saving
The Composer Manager is accessed from both the project and Print Composer. Project > Composer Manager or Composer > Composer Manager.
70
Maps saved to the QGIS project are listed in Composer Manager. New maps can be created here from either an empty composer or a template.
Exercise 7
1. Follow Along and Let’s make a map!
71

Have Questions? Need Support?:
The Google is your friend! Most searches will lead you to common support resources, like:
● Mailing Lists● Forums● StackExchange● Chat● Issue Tracker● Commercial Support (NRGS is on this list!)
Find links to all the above at:
http://www.qgis.org/en/site/forusers/support.html
72

Written By:
Randal Hale: [email protected]
Carol Kraemer: [email protected]
Contact Information:
http://www.northrivergeographic.com
73


