Interplanetary Coronal Mass Ejections from MESSENGER Orbital Observations at MercuryReka M. Winslow1, Noé Lugaz1 , Lydia C. Philpott2 , Nathan A. Schwadron1 , Charles J. Farrugia1 , Brian J. Anderson3, and Charles W. Smith1
(1) Institute for the Study of Earth, Oceans, and Space, University of New Hampshire ([email protected]), (2) Earth, Ocean and Atmospheric Sciences, University of British Columbia, (3) John Hopkins University Applied Physics Laboratory.
Poster based on: Winslow, R. M. et al. (2015), Interplanetary coronal mass ejections from MESSENGER orbital observations at Mercury, J. Geophys. Res. Space Physics, 120, doi:10.1002/2015JA021200.
SH53A-2469AGU Fall Meeting 2015
1. Summary
• Used observations from MESSENGER in orbit around Mercury to study interplanetary coronal mass ejections (ICMEs) near 0.3 AU.
• Cataloged over 60 ICMEs at Mercury between 2011 - 2014.
• Investigated key ICME property changes from Mercury to 1 AU.
Find: • Good agreement with previous studies for magnetic field strength dependence on dis-tance, and evidence that ICME deceleration con-tinues past the orbit of Mercury.
• This ICME database useful for multipoint spacecraft studies of recent ICMEs, as well as for model validation of ICME properties.
2. ICME Identification
• ICMEs identified using magnetic field measure-ments only, due to lack of solar wind data with MES-SENGER.
• Strict selection criteria: a) interplanetary shock observedb) shock followed by sheath and magnetic ejectac) event lasted for the duration of at least 1 MES-SENGER orbit through Mercury’s magnetosphered) event caused a visible distortion of the magneto-sphere
• Selection criteria biases towards fast ICMEs that are shock-driving and ICMEs with magnetic cloud-like characteristics.
• Also determined corresponding CME counter-part at the Sun for each event.Example ICME:
3. ICME Properties at Mercury
• ICME speed estimated from CME ejection time at the Sun, arrival time at Mercury, and Mercury’s heliocentric distance. -> This average speed is likely a maximum speed of the ICME at MESSENGER.
• Maximum ICME |B| observed is 310 nT.
• Fastest transit time from Sun to Mercury was 6 hr, longest transit time 52 hr.
• Fastest transit speed 2350 km/s, slowest transit speed 325 km/s.
• Large spread in transit times and speeds indicates that due to proximity to Sun, MESSENGER observed a wide range of ICMEs, even ones that maybe too slow or small to be detected at 1 AU.
4. Differences in ICME Properties Between Mercury and 1 AU
• Used existing databases of ICMEs at 1 AU for the same time period.
Main Results: , in good agreement with previous studies.
• ICME deceleration continues beyond the orbit of Mercury: (1) Shallow speed decrease with distance, (2) Average transit time from Sun to Mercury 20% faster than expected based on average transit times to 1 AU, (3) Significantly shallower ICME transit time dependence on initial CME speed observed at 1 AU compared to predictions based on MESSENGER ICME catalog.
• ICME magnetic shock compression ratio higher at MESSENGER (1.97) than at STEREO (1.64). ICME deceleration may explain the lower mean shock compression at 1 AU compared to that at Mercury.
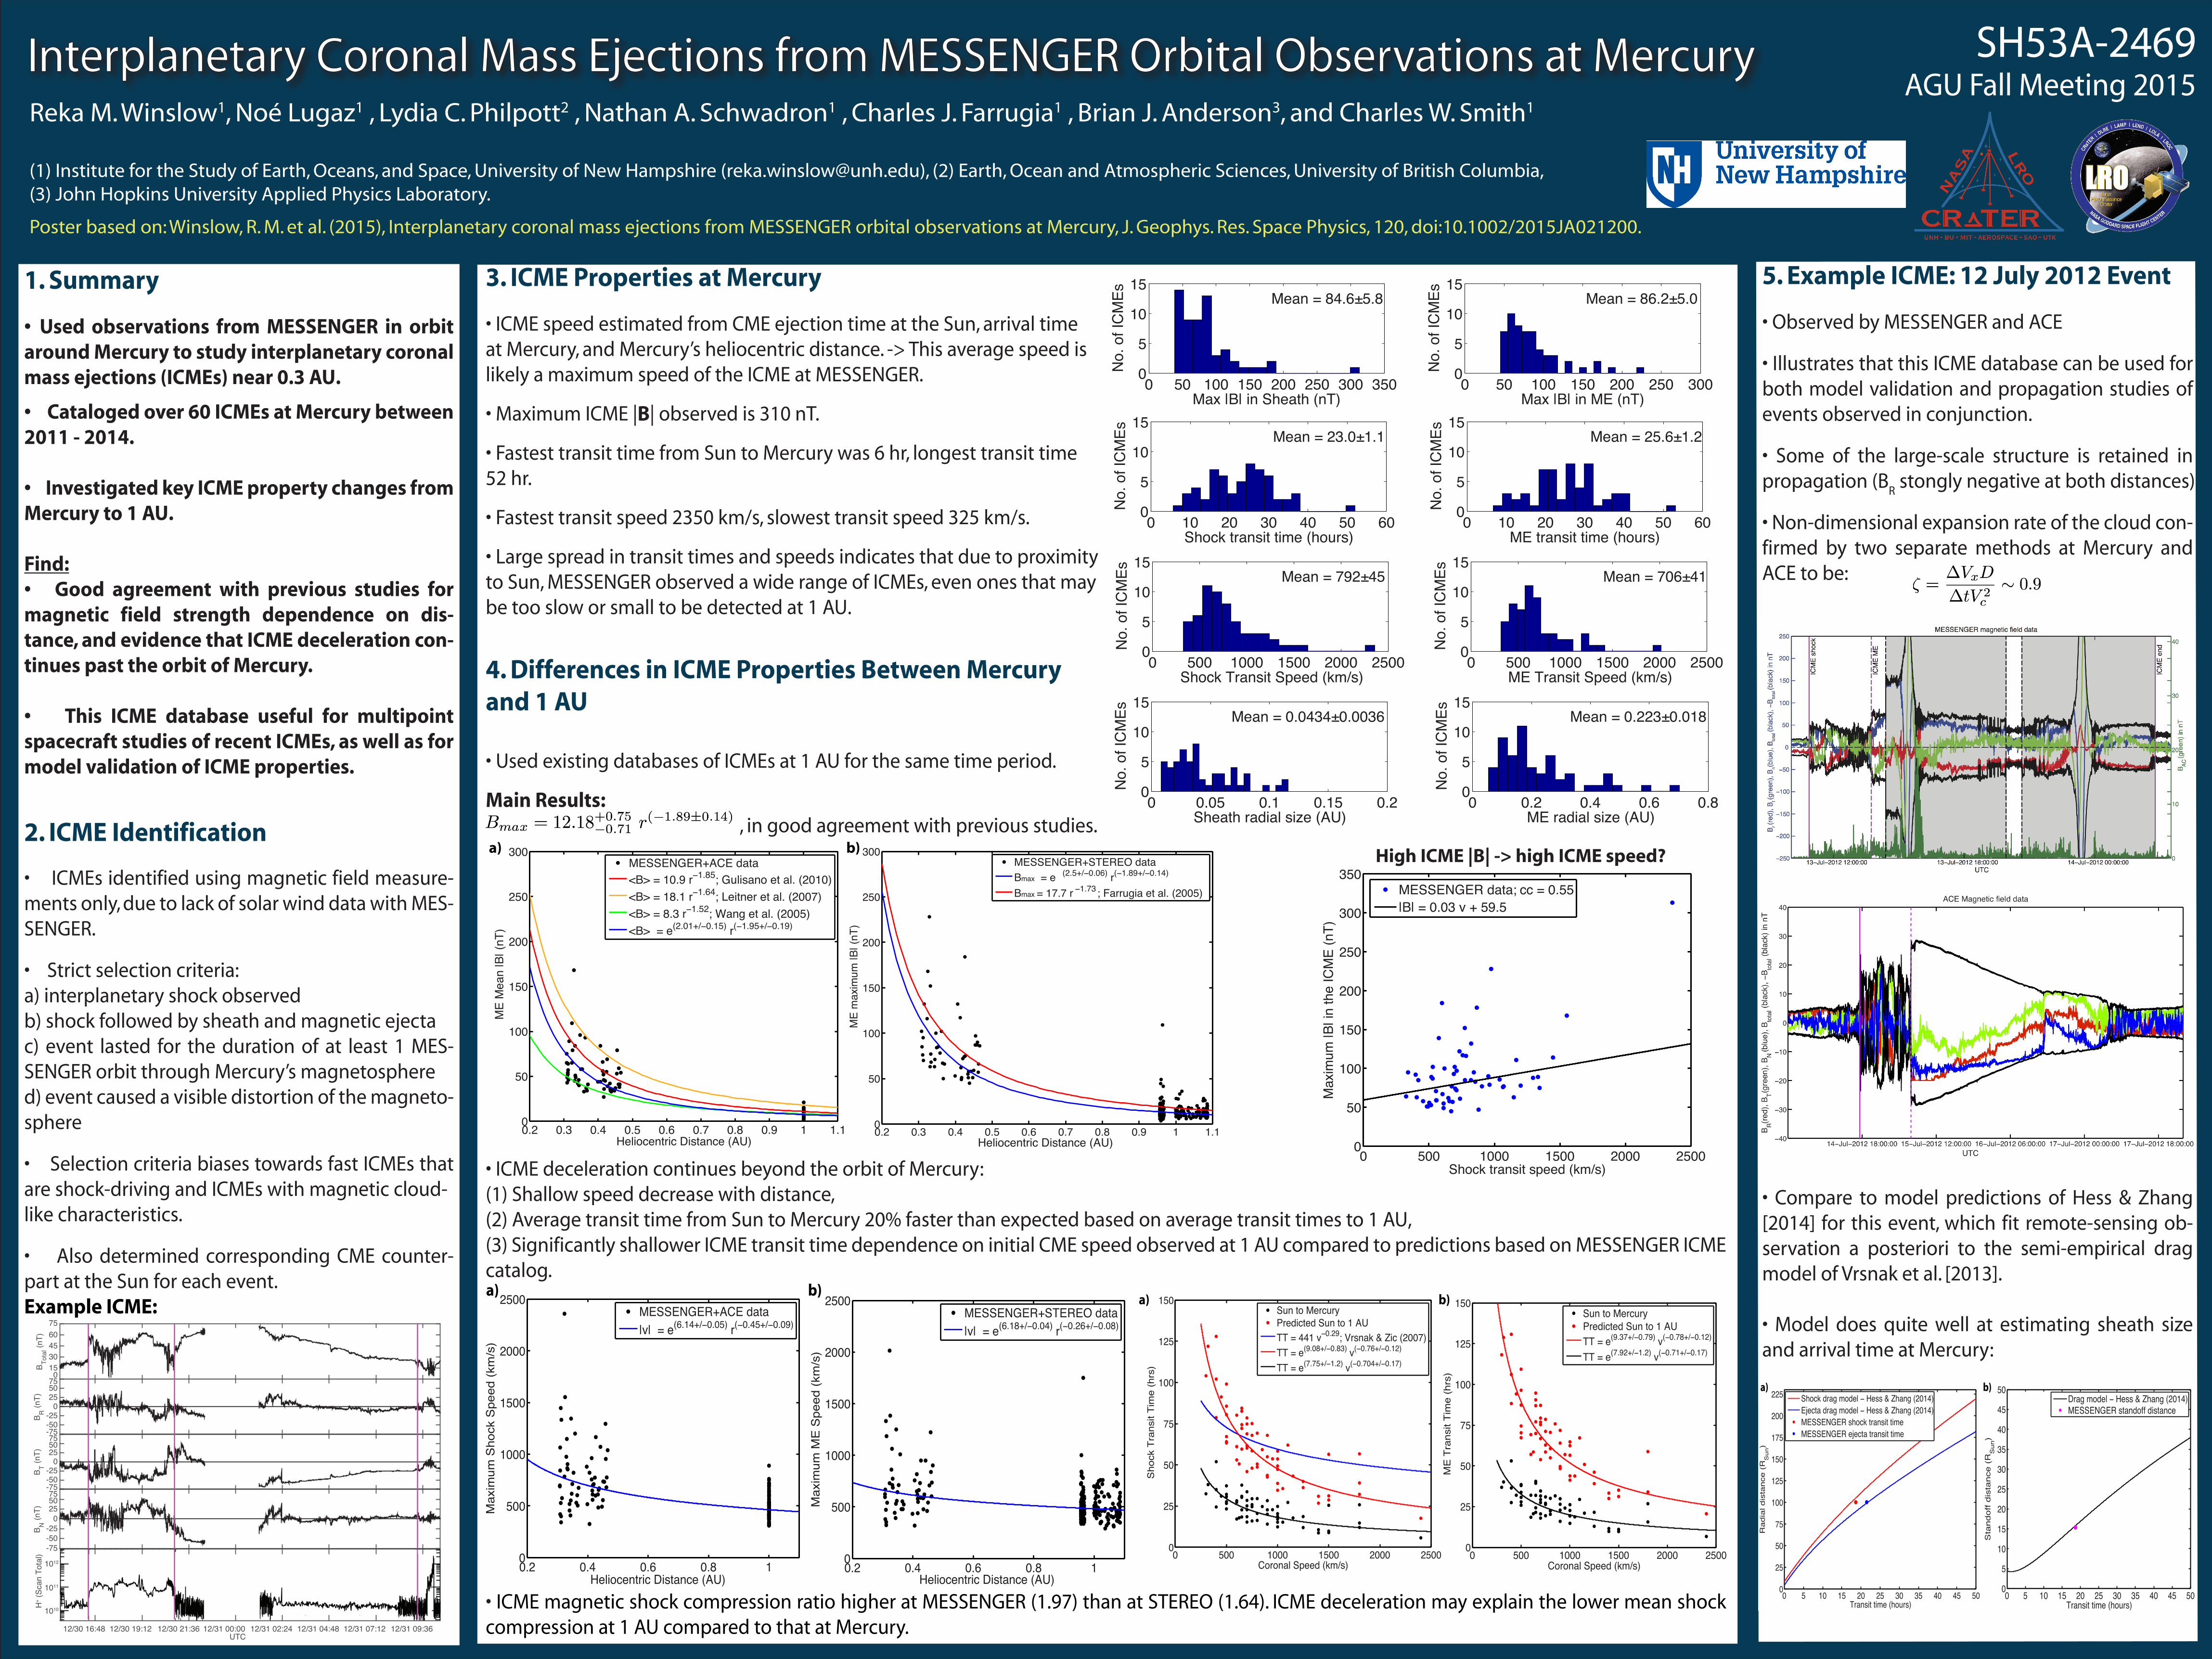
5. Example ICME: 12 July 2012 Event
• Observed by MESSENGER and ACE
• Illustrates that this ICME database can be used for both model validation and propagation studies of events observed in conjunction.
• Some of the large-scale structure is retained in propagation (B
R stongly negative at both distances)
• Non-dimensional expansion rate of the cloud con-firmed by two separate methods at Mercury and ACE to be:
• Compare to model predictions of Hess & Zhang [2014] for this event, which fit remote-sensing ob-servation a posteriori to the semi-empirical drag model of Vrsnak et al. [2013].
• Model does quite well at estimating sheath size and arrival time at Mercury:
0 50 100 150 200 250 3000
5
10
15
Max |B| in ME (nT)
No. o
f ICM
Es
Mean = 86.2±5.0
0 50 100 150 200 250 300 3500
5
10
15
Max |B| in Sheath (nT)
No. o
f ICM
Es
Mean = 84.6±5.8
0 10 20 30 40 50 600
5
10
15
Shock transit time (hours)
No. o
f ICM
Es
Mean = 23.0±1.1
0 10 20 30 40 50 600
5
10
15
ME transit time (hours)
No. o
f ICM
Es
Mean = 25.6±1.2
0 500 1000 1500 2000 25000
5
10
15
Shock Transit Speed (km/s)
No. o
f ICM
Es
Mean = 792±45
0 500 1000 1500 2000 25000
5
10
15
ME Transit Speed (km/s)
No. o
f ICM
Es
Mean = 706±41
0 0.2 0.4 0.6 0.80
5
10
15
ME radial size (AU)
No. o
f ICM
Es
Mean = 0.223±0.018
0 0.05 0.1 0.15 0.20
5
10
15
Sheath radial size (AU)
No. o
f ICM
Es
Mean = 0.0434±0.0036
a) b)
0.2 0.3 0.4 0.5 0.6 0.7 0.8 0.9 1 1.10
50
100
150
200
250
300
Heliocentric Distance (AU)
ME
Mean |B
(n
T)
|
MESSENGER+ACE data
<B> = 10.9 r−1.85
; Gulisano et al. (2010)
<B> = 18.1 r−1.64
; Leitner et al. (2007)
<B> = 8.3 r−1.52
; Wang et al. (2005)
<B> = e(2.01+/−0.15)
r(−1.95+/−0.19)
0.2 0.3 0.4 0.5 0.6 0.7 0.8 0.9 1 1.10
50
100
150
200
250
300M
E m
axim
um
|B
| (n
T)
MESSENGER+STEREO data
Bmax = e(2.5+/−0.06)
r(−1.89+/−0.14)
Bmax = 17.7 r−1.73
; Farrugia et al. (2005)
Heliocentric Distance (AU)
0 500 1000 1500 2000 25000
50
100
150
200
250
300
350
Shock transit speed (km/s)
Maxim
um
|B
| in
the IC
ME
(nT
)
MESSENGER data;
|B| = 0.03 v + 59.5
cc = 0.55
0.2 0.4 0.6 0.8 10
500
1000
1500
2000
2500
Ma
xim
um
Sh
ock S
pe
ed
(km
/s)
Heliocentric Distance (AU)
MESSENGER+ACE data
|v| = e(6.14+/−0.05)
r(−0.45+/−0.09)
0.2 0.4 0.6 0.8 10
500
1000
1500
2000
2500
Ma
xim
um
ME
Sp
ee
d (
km
/s)
MESSENGER+STEREO data
|v| = e(6.18+/−0.04)
r(−0.26+/−0.08)
a) b)
Heliocentric Distance (AU)
0 500 1000 1500 2000 25000
25
50
75
100
125
150
Coronal Speed (km/s)
ME
Tra
nsit T
ime
(h
rs)
Sun to Mercury
Predicted Sun to 1 AU
TT = e(9.37+/−0.79)
v(−0.78+/−0.12)
TT = e(7.92+/−1.2)
v(−0.71+/−0.17)
a) b)
0 500 1000 1500 2000 25000
25
50
75
100
125
150
Coronal Speed (km/s)
Shock T
ransit T
ime (
hrs
)
Sun to Mercury
Predicted Sun to 1 AU
TT = 441 v−0.29
; Vrsnak & Zic (2007)
TT = e(9.08+/−0.83)
v(−0.76+/−0.12)
TT = e(7.75+/−1.2)
v(−0.704+/−0.17)
0 5 10 15 20 25 30 35 40 45 500
25
50
75
100
125
150
175
200
225
Transit time (hours)
Rad
ial d
ista
nce
(RS
un)
Shock drag model − Hess & Zhang (2014)Ejecta drag model − Hess & Zhang (2014)MESSENGER shock transit timeMESSENGER ejecta transit time
0 5 10 15 20 25 30 35 40 45 500
5
10
15
20
25
30
35
40
45
50
Transit time (hours)
Sta
ndof
f dis
tanc
e (R
Sun
)
Drag model − Hess & Zhang (2014)MESSENGER standoff distance
a) b)
High ICME |B| -> high ICME speed?
UTC12/30 16:48 12/30 19:12 12/30 21:36 12/31 00:00 12/31 02:24 12/31 04:48 12/31 07:12
B Tota
l (nT)
01530456075
UTC12/30 16:48 12/30 19:12 12/30 21:36 12/31 00:00 12/31 02:24 12/31 04:48 12/31 07:12
B R (nT)
-75-50-25
0255075
UTC12/30 16:48 12/30 19:12 12/30 21:36 12/31 00:00 12/31 02:24 12/31 04:48 12/31 07:12
B T (nT)
-75-50-25
0255075
UTC12/30 16:48 12/30 19:12 12/30 21:36 12/31 00:00 12/31 02:24 12/31 04:48 12/31 07:12 12/31 09:36
B N (nT)
-75-50-25
0255075
1012
1011
1010 H+ (
Scan
Tot
al)


