INTERNATIONAL TECHNOLOGY ADOPTION & WORKFORCE ISSUES
RE
SE
AR
CH
M A Y 2 0 1 3
Table of Contents Slide #
Research Methodology 3 Key Findings Summary / Key Points by Country 4
Key Themes 5 Brazil 11 Canada 12 France 13 Germany 14 India 15 Japan 16 Mexico 17 Middle East (Oman, Saudi Arabia, UAE) 18 Thailand 19 United Kingdom 20
State of Tech UAlizaAon and Business PrioriAes 21 2013 Business PrioriSes 22
ExpectaSons for Business CondiSons 23 Importance of IT 24 2013 IT Spending 25 2013 IT PrioriSes 27 Overall Technology USlizaSon 29
Technology Focus: I. Cloud CompuAng; II. CyberSecurity 31 Cloud CompuSng AdopSon 32 Inhibitors to Cloud AdopSon 33 Overall Cybersecurity Threat Level 34 Reasons for Cybersecurity Concerns 36 Human Error as a Cybersecurity Concern 37
Slide # The IT Workforce Landscape 41
Management of the IT FuncSon 42 Usage of Outside IT Services 43 IT Staff Headcount 2012 and 2013 44 State of IT Skills Gaps 45 Business Areas Affected by IT Skills Gaps 46 Factors ContribuSng to IT Skills Gaps 48 Concern for Hiring IT Staff 49 IT Skills of Most Importance 50 Infrastructure / Endpoint Skills 51 InformaSon and Data Management Skills 52 ApplicaSons, Cloud and Internet Related Skills 53 “So] Skills” / Non-‐Technical Skills 54
IT Training and CerAficaAon 55 IT Staff Usage of IT Training Overall 56 IT Staff Usage of Specific IT Training Methods 57
OrganizaSons’ Policy for IT CerSficaSon 58 Importance of IT CerSficaSon 59 Value / Benefits of Having IT CerSfied Staff 60 Top IT CerSficaSons IT Staff Plan to Pursue 62
Appendix 64 Respondent Profile 65 Economic Data Summary by Country 66 Technology USlizaSon by Country 67 Worldwide IT Spending Forecast 2013 68 Global IT Growth Forecasts 69 AddiSonal Resources 70 Sizing the Global IT Workforce 71
About this Research CompTIA’s Interna'onal Technology Adop'on and Workforce Issues study was conducted to collect and share informaSon on technology adopSon and workforce trends across several countries. The objecSves of this research include: • Explore business and informaSon technology (IT) prioriSes among organizaSons • Examine the usage of key technologies/soluSons and IT services such as security and cloud compuSng • IdenSfy which IT skills are most important to employers and if there are any skills gap issues or staffing concerns • Evaluate professional development pracSces such as training and cerSficaSon The study consists of five secSons:
SecSon 1: Key Findings Summary SecSon 2: State of Tech USlizaSon and Business PrioriSes SecSon 3: Technology Focus: I. Cloud CompuSng; II. Cybersecurity SecSon 4: The IT Workforce Landscape SecSon 5: IT Training and CerSficaSon
The data for this study was collected via a quanStaSve online survey conducted February 22 to March 23, 2013 among 1,256 IT and business execuSves directly involved in selng or execuSng informaSon technology policies and processes within their organizaSons. See the Appendix for Respondent Profile details such as industry, company size, and job role. The 10 countries covered in this study include: Brazil (n=125); Canada (n=125); France (n=125); Germany (n=131); India (n=125); Japan (n=125); Mexico (n=125); Middle East (Oman, Saudi Arabia, United Arab Emirates) (n=125); Thailand (n=125); United Kingdom (n=125). Surveys were localized and translated to allow respondents to parScipate in their naSve language. AddiSonally, precauSons were taken to minimize misinterpretaSons of quesSons. However, research has shown, cultural differences exist and can affect responses to certain quesSon types, such as 5-‐point saSsfacSon raSng quesSons. Viewers of this report should keep that in mind when comparing results across countries. The margin of sampling error at 95% confidence for aggregate results is +/-‐ 2.8 percentage points. Sampling error is larger for subgroups of the data. As with any survey, sampling error is only one source of possible error. While non-‐sampling error cannot be accurately calculated, precauSonary steps were taken in all phases of the survey design, collecSon and processing of the data to minimize its influence. Note: because data collecSon occurred via an online survey, in countries where Internet penetraSon is lower among businesses, the non-‐sampling error could be higher. CompTIA is responsible for all content contained in this series. Any quesSons regarding the study should be directed to CompTIA Market Research staff at [email protected]. CompTIA is a member of the MarkeSng Research AssociaSon (MRA) and adheres to the MRA’s Code of Market Research Ethics and Standards.
SecSon 1 – Key Findings Summary
Key Themes from the Research
The importance of informaSon technology (IT) to business success conSnues to trend upwards. Strategic prioriSes increasingly include an IT component. Most businesses seek to improve their uSlizaSon of IT; few are exactly where they want to be in terms of effecSveness or efficiency. Emerging technologies, such as cloud compuSng, conSnue to see adopSon gains. Although as businesses rely more heavily on the “Internet of Things,” security, data loss and privacy concerns will affect more companies on more levels than ever before. The global economy remains fragile, but the IT sector should out-‐perform. Businesses in several countries project solid increases in IT spending, while 4 in 10 businesses expect to hire new IT staff over the next 12 months. For a number of reasons, IT skills gaps remain a challenge for most businesses. Few are exactly where they want to be with staff experSse and experience. Furthermore, more than half of businesses report being concerned about the quality and quanSty of IT talent available for hire. The majority of businesses expect IT cerSficaSons to increase in importance over the next two years. Similar percentages of execuSves believe it is important to test a]er training to confirm knowledge gains and teams of IT staff holding cerSficaSons benefit from a common foundaSon of knowledge.
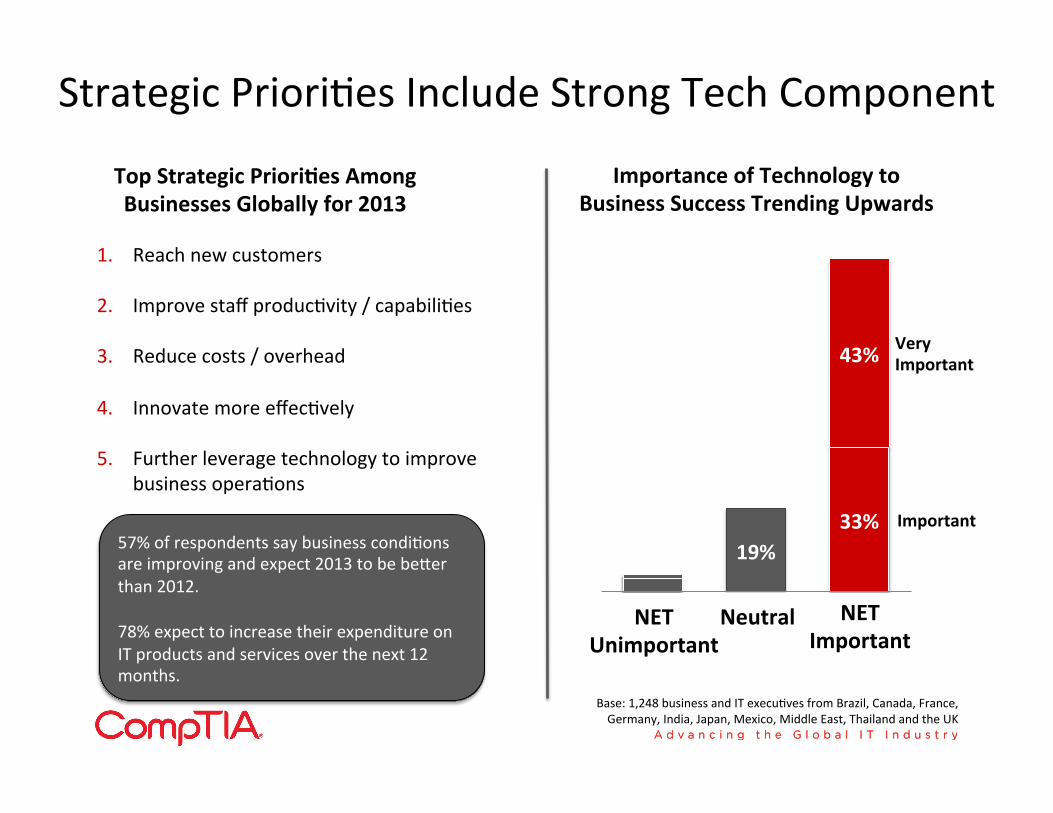
Strategic PrioriSes Include Strong Tech Component
Base: 1,248 business and IT execuSves from Brazil, Canada, France, Germany, India, Japan, Mexico, Middle East, Thailand and the UK
19% 33%
43% Very Important
Important
Top Strategic PrioriAes Among Businesses Globally for 2013
NET Unimportant
NET Important
Neutral
1. Reach new customers 2. Improve staff producSvity / capabiliSes 3. Reduce costs / overhead 4. Innovate more effecSvely 5. Further leverage technology to improve
business operaSons
57% of respondents say business condiSons are improving and expect 2013 to be beser than 2012. 78% expect to increase their expenditure on IT products and services over the next 12 months.
Importance of Technology to Business Success Trending Upwards
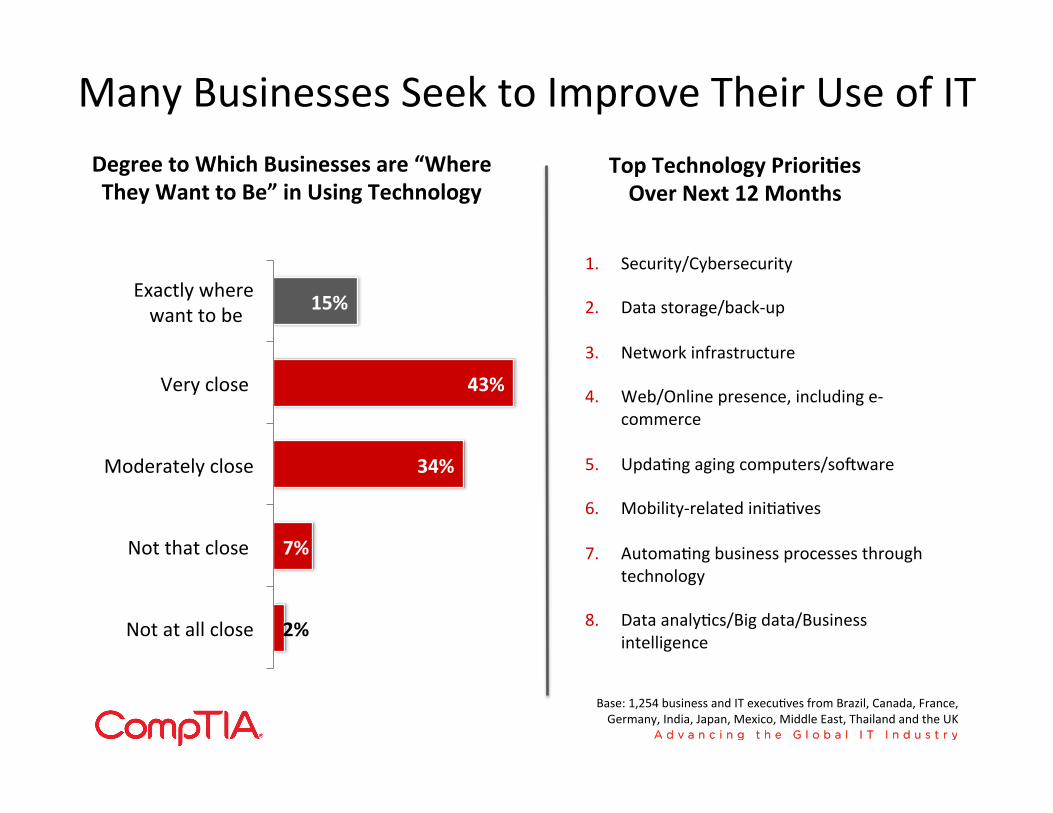
Many Businesses Seek to Improve Their Use of IT
2%
7%
34%
43%
15%
Not at all close
Not that close
Moderately close
Very close
Exactly where want to be
Degree to Which Businesses are “Where They Want to Be” in Using Technology
1. Security/Cybersecurity 2. Data storage/back-‐up
3. Network infrastructure
4. Web/Online presence, including e-‐commerce
5. UpdaSng aging computers/so]ware 6. Mobility-‐related iniSaSves
7. AutomaSng business processes through technology
8. Data analyScs/Big data/Business intelligence
Top Technology PrioriAes Over Next 12 Months
Base: 1,254 business and IT execuSves from Brazil, Canada, France, Germany, India, Japan, Mexico, Middle East, Thailand and the UK

4 in 10 Businesses Plan to Hire IT Staff in 2013; Many Expect Challenges in Finding Workers
7%
69%
24%
5%
56%
39%
Decrease in IT staff
No change
Increase in IT staff
Change in 2012
AnScipated 2013 Change
Base: 1,252 business and IT execuSves from Brazil, Canada, France, Germany, India, Japan, Mexico, Middle East, Thailand and the UK
42%
58%
NET concerned* about IT labor quanAty or quality
NET not that concerned about IT labor quanAty or quality
Concern Over Ability to Hire IT Staff
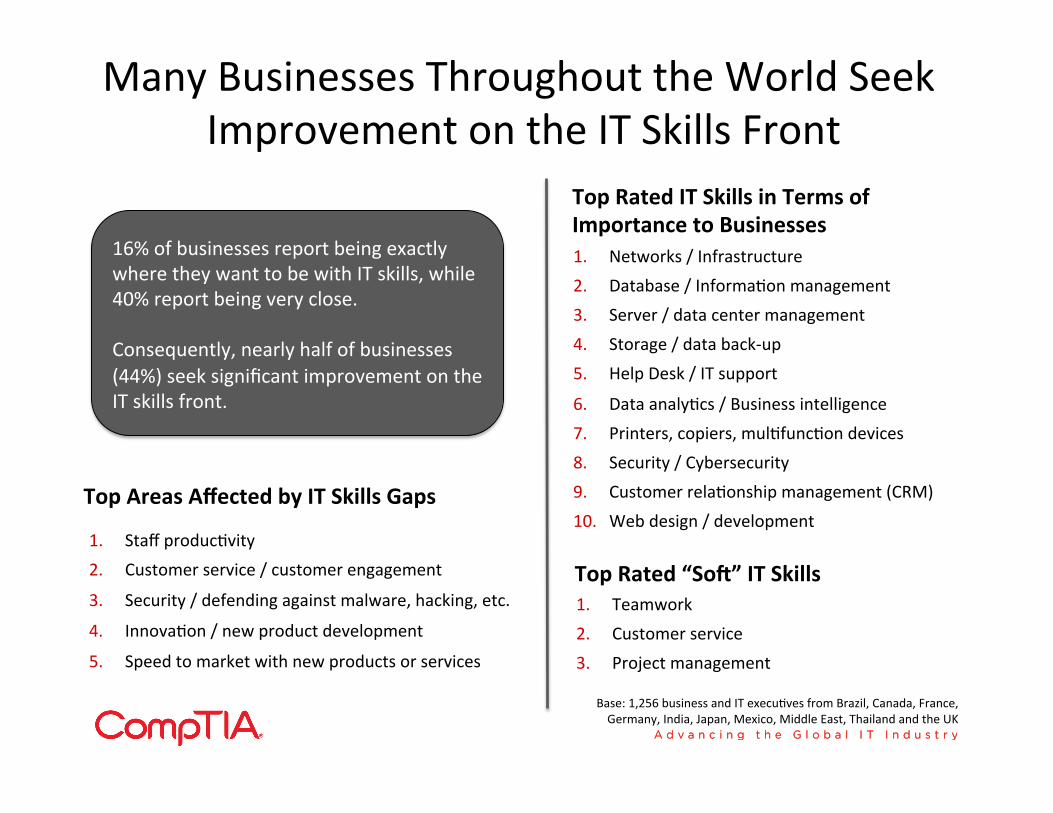
Many Businesses Throughout the World Seek Improvement on the IT Skills Front
16% of businesses report being exactly where they want to be with IT skills, while 40% report being very close. Consequently, nearly half of businesses (44%) seek significant improvement on the IT skills front.
1. Staff producSvity 2. Customer service / customer engagement
3. Security / defending against malware, hacking, etc.
4. InnovaSon / new product development
5. Speed to market with new products or services
Top Areas Affected by IT Skills Gaps
1. Teamwork 2. Customer service 3. Project management
Top Rated “Sof” IT Skills
1. Networks / Infrastructure 2. Database / InformaSon management 3. Server / data center management 4. Storage / data back-‐up 5. Help Desk / IT support
6. Data analyScs / Business intelligence 7. Printers, copiers, mulSfuncSon devices 8. Security / Cybersecurity 9. Customer relaSonship management (CRM) 10. Web design / development
Top Rated IT Skills in Terms of Importance to Businesses
Base: 1,256 business and IT execuSves from Brazil, Canada, France, Germany, India, Japan, Mexico, Middle East, Thailand and the UK
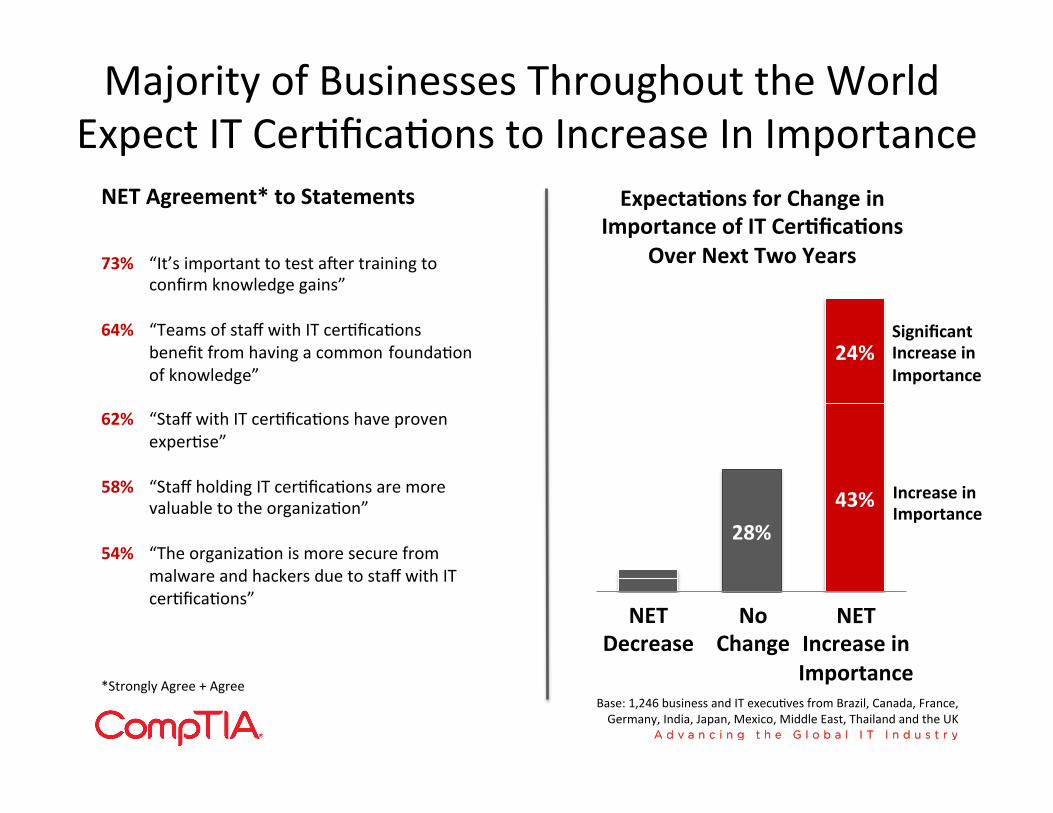
Majority of Businesses Throughout the World Expect IT CerSficaSons to Increase In Importance
28% 43%
24% Significant Increase in Importance
Increase in Importance
NET Decrease
NET Increase in Importance
No Change
73% “It’s important to test a]er training to confirm knowledge gains”
64% “Teams of staff with IT cerSficaSons
benefit from having a common foundaSon of knowledge”
62% “Staff with IT cerSficaSons have proven
experSse” 58% “Staff holding IT cerSficaSons are more
valuable to the organizaSon” 54% “The organizaSon is more secure from
malware and hackers due to staff with IT cerSficaSons”
NET Agreement* to Statements
*Strongly Agree + Agree Base: 1,246 business and IT execuSves from Brazil, Canada, France, Germany, India, Japan, Mexico, Middle East, Thailand and the UK
ExpectaAons for Change in Importance of IT CerAficaAons
Over Next Two Years

Key IT PrioriAes for Brazilian Businesses: 1. IT security 2. Data storage/back-‐up 3. Network infrastructure 4. UpdaSng aging computers/so]ware 5. AutomaSng business processes through technology
Key Points: Brazil Key Stats for Brazil
$12,000 GDP per capita (PPP) | world rank: 103rd
3.02% GDP growth forecast for 2013
85% % of Brazilian execuSves expecSng 2013 business condiSons to be beser than 2012
107.1m Total workforce
71% % of workforce employed in the services sector
0.759m EsSmate of IT workforce* in core IT occupaSons
49% % of Brazilian execuSves expecSng to increase IT staff headcount at their business
75.98m Internet users | world rank: 4th
244.36m Mobile phone users | world rank: 5th
84% NET % of Brazilian execuSves indicaSng IT is important to the success of their business
7.2% Planned increase in IT spending in 2013 (YOY)
Key Strategic PrioriAes for Brazilian Businesses: 1. Improve staff producSvity / capabiliSes 2. Reach new customers 3. Reduce costs / overhead
Cybersecurity: 88% of Brazilian execuSves believe the cybersecurity threat is in increasing. AddiSonally, 65% of Brazilian execuSves believe human error is a growing factor in security security incidents: Top human error related factors include: 1. Failure of end-‐users to follow security procedures and policies 2. General negligence / carelessness towards security
IT Skills Gaps: 86% of Brazilian execuSves indicate at least some degree of gaps in IT skills at their business exists. For 44%, the reported skills gaps are small, while for 42% the gaps are more extensive. Top negaSve effects of IT skills gaps at Brazilian businesses: 1. Lower staff producSvity 2. Less than ideal customer service and/or engagement
IT Training and CerAficaAon: 93% of IT staff at Brazilian businesses engaged in some type of IT training during the past 12 months. 1. 87% of Brazilian execuSves believe IT cerSficaSons will increase in
importance over the next two years 2. 76% of Brazilian execuSves agree (NET) that staff holding IT
cerSficaSons are more valuable to the organizaSon
*See appendix for definiSon of core IT occupaSons
Sources used for above stats: CompTIA, IMF, CIA World Factbook, IDC

Key IT PrioriAes for Canadian Businesses: 1. IT security 2. Web/Online presence / e-‐commerce 3. UpdaSng aging computers/so]ware 4. Data storage/back-‐up 5. Mobility (e.g. devices, apps)
Key Points: Canada Key Stats for Canada
$41,500 GDP per capita (PPP) | world rank: 24th
1.46% GDP growth forecast for 2013
58% % of Canadian execuSves expecSng 2013 business condiSons to be beser than 2012
18.8m Total workforce
76% % of workforce employed in the services sector
0.426m EsSmate of IT workforce* in core IT posiSons
35% % of Canadian execuSves expecSng to increase IT staff headcount at their business
26.96m Internet users | world rank: 16th
27.38m Mobile phone users | world rank: 37th
80% NET % of Canadian execuSves indicaSng IT is important to the success of their business
4.6% Planned increase in IT spending in 2013 (YOY)
Key Strategic PrioriAes for Canadian Businesses: 1. Reduce costs / overhead 2. Reach new customers 3. Improve staff producSvity / capabiliSes
Cybersecurity: 59% of Canadian execuSves believe the cybersecurity threat is increasing. AddiSonally, 38% of Canadian execuSves believe human error is a growing factor in security security incidents: Top human error related factors include: 1. Failure of end-‐users to follow security procedures and policies 2. Increased use of social media by staff
IT Skills Gaps: 90% of Canadian execuSves indicate at least some degree of gaps in IT skills at their business exists. For 39%, the reported skills gaps are small, while for 50% the gaps are more extensive. Top negaSve effects of IT skills gaps at Canadian businesses: 1. Lower staff producSvity 2. Less than ideal customer service and/or engagement
IT Training and CerAficaAon: 90% of IT staff at Canadian businesses engaged in some type of IT training during the past 12 months. 1. 61% of Canadian execuSves believe IT cerSficaSons will increase in
importance over the next two years 2. 62% of Canadian execuSves agree (NET) that staff holding IT
cerSficaSons have proven experSse
Sources used for above stats: CompTIA, IMF, CIA World Factbook, IDC
*See appendix for definiSon of core IT occupaSons

Key IT PrioriAes for French Businesses: 1. IT security 2. Data storage/back-‐up 3. UpdaSng aging computers/so]ware 4. Network infrastructure 5. Web/Online presence / e-‐commerce
Key Points: France Key Stats for France
$35,500 GDP per capita (PPP) | world rank: 37th
-‐0.07% GDP growth forecast for 2013
26% % of French execuSves expecSng 2013 business condiSons to be beser than 2012
29.6m Total workforce
72% % of workforce employed in the services sector
0.591m EsSmate of IT workforce* in core IT posiSons
27% % of French execuSves expecSng to increase IT staff headcount at their business
45.26m Internet users | world rank: 8th
59.84m Mobile phone users | world rank: 21st
63% NET % of French execuSves indicaSng IT is important to the success of their business
2.3% Planned increase in IT spending in 2013 (YOY)
Key Strategic PrioriAes for French Businesses: 1. Reduce costs / overhead 2. Reach new customers 3. Improve staff producSvity / capabiliSes
Cybersecurity: 38% of French execuSves believe the cybersecurity threat is increasing. AddiSonally, 29% of French execuSves believe human error is a growing factor in security security incidents: Top human error related factors include: 1. Increased use of social media by staff 2. Inadequate resources – not enough IT staff Sme to manage threats
IT Skills Gaps: 78% of French execuSves indicate at least some degree of gaps in IT skills at their business exists. For 50%, the reported skills gaps are small, while for 28% the gaps are more extensive. Top negaSve effects of IT skills gaps at French businesses: 1. Lower staff producSvity 2. Security / defending against malware, hacking, etc.
IT Training and CerAficaAon: 81% of IT staff at French businesses engaged in some type of IT training during the past 12 months. 1. 43% of French execuSves believe IT cerSficaSons will increase in
importance over the next two years 2. 66% of French execuSves agree (NET) that it’s important to test
a]er training to confirm knowledge gains
*See appendix for definiSon of core IT occupaSons
Sources used for above stats: CompTIA, IMF, CIA World Factbook, IDC

Key IT PrioriAes for German Businesses: 1. IT security 2. Data storage/back-‐up 3. Network infrastructure 4. UpdaSng aging computers/so]ware 5. Disaster recovery/Business conSnuity
Key Points: Germany Key Stats for Germany
$39,100 GDP per capita (PPP) | world rank: 26th
0.61% GDP growth forecast for 2013
40% % of German execuSves expecSng 2013 business condiSons to be beser than 2012
44.0m Total workforce
74% % of workforce employed in the services sector
0.708m EsSmate of IT workforce* in core IT posiSons
29% % of German execuSves expecSng to increase IT staff headcount at their business
65.13m Internet users | world rank: 5th
108.7m Mobile phone users | world rank: 10th
78% NET % of German execuSves indicaSng IT is important to the success of their business
4.3% Planned increase in IT spending in 2013 (YOY)
Key Strategic PrioriAes for German Businesses: 1. Reach new customers 2. Improve staff producSvity / capabiliSes 3. Reduce costs / overhead
Cybersecurity: 70% of German execuSves believe the cybersecurity threat is increasing. AddiSonally, 47% of German execuSves believe human error is a growing factor in security security incidents: Top human error related factors include: 1. General negligence / carelessness towards security 2. Increased use of social media by staff
IT Skills Gaps: 86% of German execuSves indicate at least some degree of gaps in IT skills at their business exists. For 41%, the reported skills gaps are small, while for 45% the gaps are more extensive. Top negaSve effects of IT skills gaps at German businesses: 1. Lower staff producSvity 2. Less than ideal customer service and/or engagement
IT Training and CerAficaAon: 84% of IT staff at German businesses engaged in some type of IT training during the past 12 months. 1. 59% of German execuSves believe IT cerSficaSons will increase in
importance over the next two years 2. 85% of German execuSves agree (NET) that it’s important to test
a]er training to confirm knowledge gains
Sources used for above stats: CompTIA, IMF, CIA World Factbook, IDC
*See appendix for definiSon of core IT occupaSons

Key IT PrioriAes for Indian Businesses: 1. IT security 2. Data storage/back-‐up 3. Data analyScs/Big data/Business intelligence 4. Network infrastructure 5. Web/Online presence / e-‐commerce
Key Points: India Key Stats for India
$3,900 GDP per capita (PPP) | world rank: 164th
5.68% GDP growth forecast for 2013
81% % of Indian execuSves expecSng 2013 business condiSons to be beser than 2012
498.4m Total workforce
28% % of workforce employed in the services sector
2.8m EsSmate of IT workforce* in core IT posiSons
61% % of Indian execuSves expecSng to increase IT staff headcount at their business
61.34m Internet users | world rank: 6th
893.86m Mobile phone users | world rank: 2nd
64% NET % of Indian execuSves indicaSng IT is important to the success of their business
7.6% Planned increase in IT spending in 2013 (YOY)
Key Strategic PrioriAes for Indian Businesses: 1. Reach new customers 2. Improve staff producSvity / capabiliSes 3. Innovate more effecSvely
Cybersecurity: 88% of Indian execuSves believe the cybersecurity threat is increasing. AddiSonally, 67% of Indian execuSves believe human error is a growing factor in security security incidents: Top human error related factors include: 1. Lack of security experSse with websites and applicaSons 2. Failure of IT staff to follow security procedures and policies
IT Skills Gaps: 71% of Indian execuSves indicate at least some degree of gaps in IT skills at their business exists. For 34%, the reported skills gaps are small, while for 38% the gaps are more extensive. Top negaSve effects of IT skills gaps at Indian businesses: 1. Lower staff producSvity 2. InnovaSon / new product development
IT Training and CerAficaAon: 97% of IT staff at Indian businesses engaged in some type of IT training during the past 12 months. 1. 81% of Indian execuSves believe IT cerSficaSons will increase in
importance over the next two years 2. 61% of Indian execuSves agree (NET) that staff holding IT
cerSficaSons are more valuable to the organizaSon
Sources used for above stats: CompTIA, IMF, CIA World Factbook, IDC
*See appendix for definiSon of core IT occupaSons
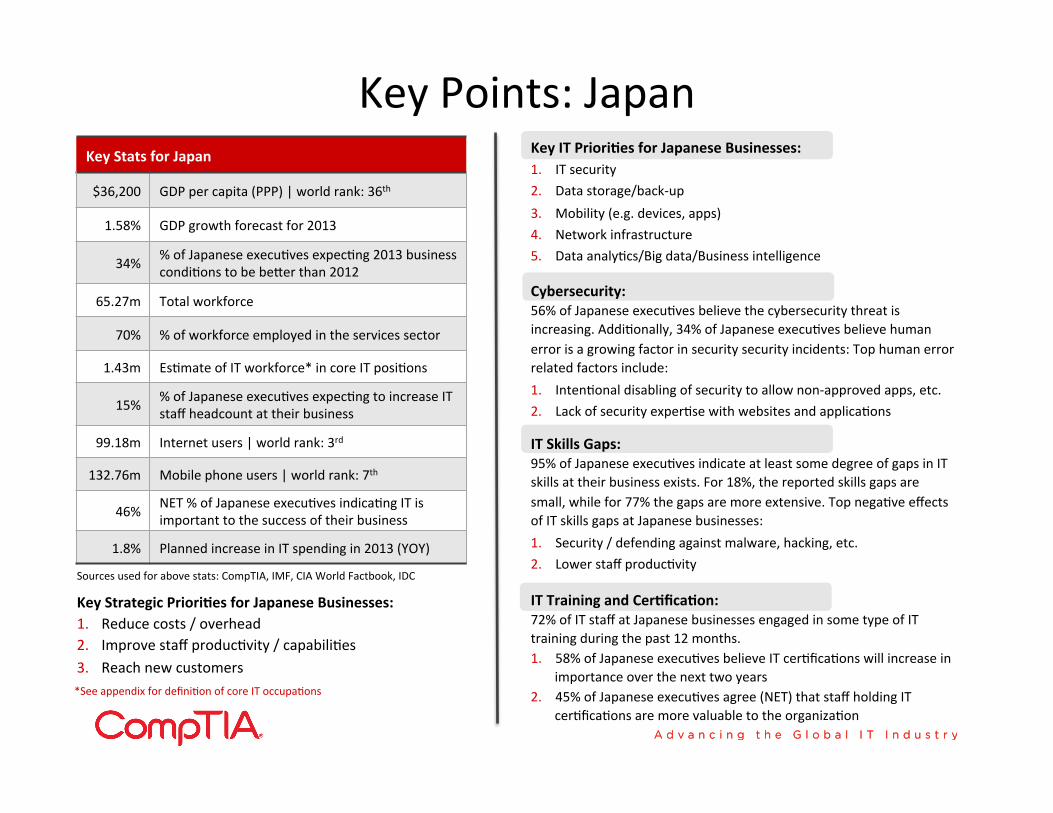
Key IT PrioriAes for Japanese Businesses: 1. IT security 2. Data storage/back-‐up 3. Mobility (e.g. devices, apps) 4. Network infrastructure 5. Data analyScs/Big data/Business intelligence
Key Points: Japan Key Stats for Japan
$36,200 GDP per capita (PPP) | world rank: 36th
1.58% GDP growth forecast for 2013
34% % of Japanese execuSves expecSng 2013 business condiSons to be beser than 2012
65.27m Total workforce
70% % of workforce employed in the services sector
1.43m EsSmate of IT workforce* in core IT posiSons
15% % of Japanese execuSves expecSng to increase IT staff headcount at their business
99.18m Internet users | world rank: 3rd
132.76m Mobile phone users | world rank: 7th
46% NET % of Japanese execuSves indicaSng IT is important to the success of their business
1.8% Planned increase in IT spending in 2013 (YOY)
Key Strategic PrioriAes for Japanese Businesses: 1. Reduce costs / overhead 2. Improve staff producSvity / capabiliSes 3. Reach new customers
Cybersecurity: 56% of Japanese execuSves believe the cybersecurity threat is increasing. AddiSonally, 34% of Japanese execuSves believe human error is a growing factor in security security incidents: Top human error related factors include: 1. IntenSonal disabling of security to allow non-‐approved apps, etc. 2. Lack of security experSse with websites and applicaSons
IT Skills Gaps: 95% of Japanese execuSves indicate at least some degree of gaps in IT skills at their business exists. For 18%, the reported skills gaps are small, while for 77% the gaps are more extensive. Top negaSve effects of IT skills gaps at Japanese businesses: 1. Security / defending against malware, hacking, etc. 2. Lower staff producSvity
IT Training and CerAficaAon: 72% of IT staff at Japanese businesses engaged in some type of IT training during the past 12 months. 1. 58% of Japanese execuSves believe IT cerSficaSons will increase in
importance over the next two years 2. 45% of Japanese execuSves agree (NET) that staff holding IT
cerSficaSons are more valuable to the organizaSon
Sources used for above stats: CompTIA, IMF, CIA World Factbook, IDC
*See appendix for definiSon of core IT occupaSons

Key IT PrioriAes for Mexican Businesses: 1. IT security 2. Network infrastructure 3. Data storage/back-‐up 4. Web/Online presence / e-‐commerce 5. Data analyScs/Big data/Business intelligence
Key Points: Mexico Key Stats for Mexico
$15,300 GDP per capita (PPP) | world rank: 83rd
3.39% GDP growth forecast for 2013
72% % of Mexican execuSves expecSng 2013 business condiSons to be beser than 2012
50 .01m Total workforce
63% % of workforce employed in the services sector
0.536m EsSmate of IT workforce* in core IT posiSons
45% % of Mexican execuSves expecSng to increase IT staff headcount at their business
31.02m Internet users | world rank: 12th
94.57m Mobile phone users | world rank: 13th
89% NET % of Mexican execuSves indicaSng IT is important to the success of their business
7.3% Planned increase in IT spending in 2013 (YOY)
Key Strategic PrioriAes for Mexican Businesses: 1. Leverage technology to improve business operaSons 2. Reach new customers 3. Improve staff producSvity / capabiliSes
Cybersecurity: 80% of Mexican execuSves believe the cybersecurity threat is increasing. AddiSonally, 52% of Mexican execuSves believe human error is a growing factor in security security incidents: Top human error related factors include: 1. Failure of end-‐users & IT staff to follow security procedures/policies 2. General negligence / carelessness towards security
IT Skills Gaps: 92% of Mexican execuSves indicate at least some degree of gaps in IT skills at their business exists. For 49%, the reported skills gaps are small, while for 43% the gaps are more extensive. Top negaSve effects of IT skills gaps at Mexican businesses: 1. Lower staff producSvity 2. Speed to market with new products or services
IT Training and CerAficaAon: 95% of IT staff at Mexican businesses engaged in some type of IT training during the past 12 months. 1. 83% of Mexican execuSves believe IT cerSficaSons will increase in
importance over the next two years 2. 69% of Mexican execuSves agree (NET) that staff holding IT
cerSficaSons are more valuable to the organizaSon
Sources used for above stats: CompTIA, IMF, CIA World Factbook, IDC
*See appendix for definiSon of core IT occupaSons
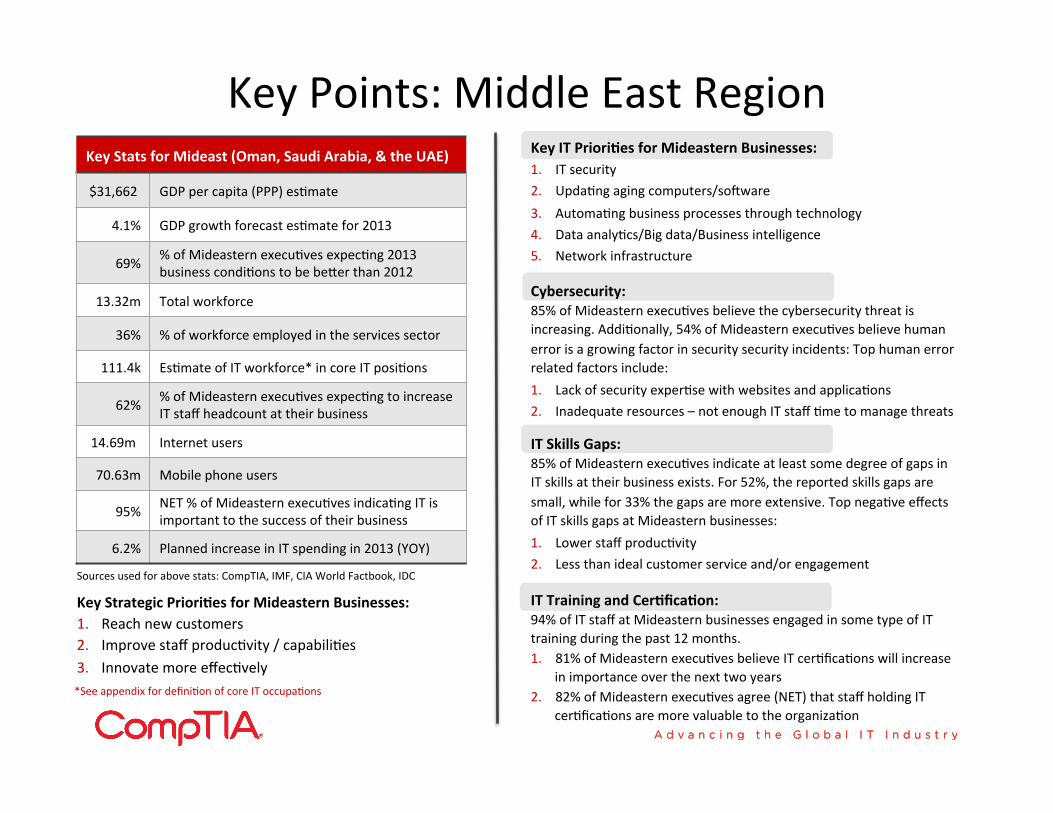
Key IT PrioriAes for Mideastern Businesses: 1. IT security 2. UpdaSng aging computers/so]ware 3. AutomaSng business processes through technology 4. Data analyScs/Big data/Business intelligence 5. Network infrastructure
Key Points: Middle East Region Key Stats for Mideast (Oman, Saudi Arabia, & the UAE)
$31,662 GDP per capita (PPP) esSmate
4.1% GDP growth forecast esSmate for 2013
69% % of Mideastern execuSves expecSng 2013 business condiSons to be beser than 2012
13.32m Total workforce
36% % of workforce employed in the services sector
111.4k EsSmate of IT workforce* in core IT posiSons
62% % of Mideastern execuSves expecSng to increase IT staff headcount at their business
14.69m Internet users
70.63m Mobile phone users
95% NET % of Mideastern execuSves indicaSng IT is important to the success of their business
6.2% Planned increase in IT spending in 2013 (YOY)
Key Strategic PrioriAes for Mideastern Businesses: 1. Reach new customers 2. Improve staff producSvity / capabiliSes 3. Innovate more effecSvely
Cybersecurity: 85% of Mideastern execuSves believe the cybersecurity threat is increasing. AddiSonally, 54% of Mideastern execuSves believe human error is a growing factor in security security incidents: Top human error related factors include: 1. Lack of security experSse with websites and applicaSons 2. Inadequate resources – not enough IT staff Sme to manage threats
IT Skills Gaps: 85% of Mideastern execuSves indicate at least some degree of gaps in IT skills at their business exists. For 52%, the reported skills gaps are small, while for 33% the gaps are more extensive. Top negaSve effects of IT skills gaps at Mideastern businesses: 1. Lower staff producSvity 2. Less than ideal customer service and/or engagement
IT Training and CerAficaAon: 94% of IT staff at Mideastern businesses engaged in some type of IT training during the past 12 months. 1. 81% of Mideastern execuSves believe IT cerSficaSons will increase
in importance over the next two years 2. 82% of Mideastern execuSves agree (NET) that staff holding IT
cerSficaSons are more valuable to the organizaSon
Sources used for above stats: CompTIA, IMF, CIA World Factbook, IDC
*See appendix for definiSon of core IT occupaSons
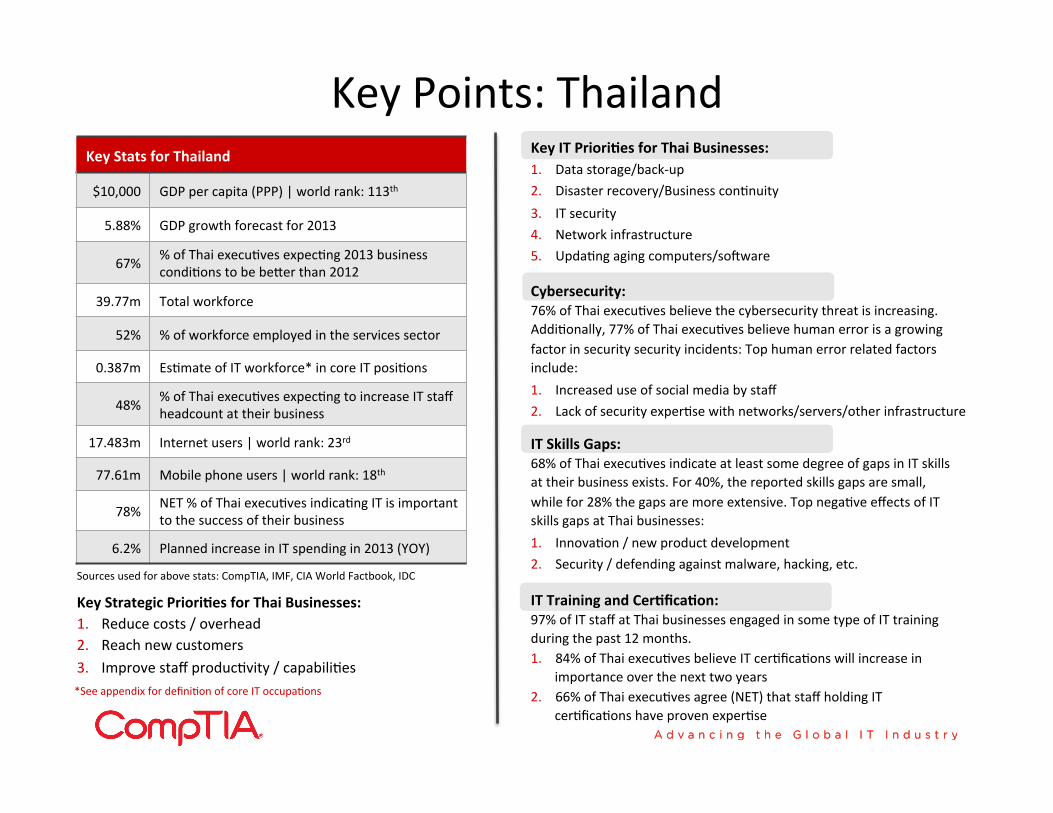
Key IT PrioriAes for Thai Businesses: 1. Data storage/back-‐up 2. Disaster recovery/Business conSnuity 3. IT security 4. Network infrastructure 5. UpdaSng aging computers/so]ware
Key Points: Thailand Key Stats for Thailand
$10,000 GDP per capita (PPP) | world rank: 113th
5.88% GDP growth forecast for 2013
67% % of Thai execuSves expecSng 2013 business condiSons to be beser than 2012
39.77m Total workforce
52% % of workforce employed in the services sector
0.387m EsSmate of IT workforce* in core IT posiSons
48% % of Thai execuSves expecSng to increase IT staff headcount at their business
17.483m Internet users | world rank: 23rd
77.61m Mobile phone users | world rank: 18th
78% NET % of Thai execuSves indicaSng IT is important to the success of their business
6.2% Planned increase in IT spending in 2013 (YOY)
Key Strategic PrioriAes for Thai Businesses: 1. Reduce costs / overhead 2. Reach new customers 3. Improve staff producSvity / capabiliSes
Cybersecurity: 76% of Thai execuSves believe the cybersecurity threat is increasing. AddiSonally, 77% of Thai execuSves believe human error is a growing factor in security security incidents: Top human error related factors include: 1. Increased use of social media by staff 2. Lack of security experSse with networks/servers/other infrastructure
IT Skills Gaps: 68% of Thai execuSves indicate at least some degree of gaps in IT skills at their business exists. For 40%, the reported skills gaps are small, while for 28% the gaps are more extensive. Top negaSve effects of IT skills gaps at Thai businesses: 1. InnovaSon / new product development 2. Security / defending against malware, hacking, etc.
IT Training and CerAficaAon: 97% of IT staff at Thai businesses engaged in some type of IT training during the past 12 months. 1. 84% of Thai execuSves believe IT cerSficaSons will increase in
importance over the next two years 2. 66% of Thai execuSves agree (NET) that staff holding IT
cerSficaSons have proven experSse
Sources used for above stats: CompTIA, IMF, CIA World Factbook, IDC
*See appendix for definiSon of core IT occupaSons

Key IT PrioriAes for BriAsh Businesses: 1. IT security 2. Data storage/back-‐up 3. Web/Online presence / e-‐commerce 4. Network infrastructure 5. Mobility (e.g. devices, apps). CollaboraSon (e.g. video conferencing).
Key Points: UK Key Stats for the United Kingdom
$36,700 GDP per capita (PPP) | world rank: 33rd
0.69% GDP growth forecast for 2013
37% % of BriSsh execuSves expecSng 2013 business condiSons to be beser than 2012
31.9m Total workforce
78% % of workforce employed in the services sector
0.731m EsSmate of IT workforce* in core IT posiSons
24% % of BriSsh execuSves expecSng to increase IT staff headcount at their business
51.44m Internet users | world rank: 7th
81.61m Mobile phone users | world rank: 17th
77% NET % of BriSsh execuSves indicaSng IT is important to the success of their business
2.8% Planned increase in IT spending in 2013 (YOY)
Key Strategic PrioriAes for BriAsh Businesses: 1. Reach new customers 2. Reduce costs / overhead 3. Improve staff producSvity / capabiliSes
Cybersecurity: 62% of BriSsh execuSves believe the cybersecurity threat is increasing. AddiSonally, 44% of BriSsh execuSves believe human error is a growing factor in security security incidents: Top human error related factors include: 1. General negligence / carelessness towards security 2. Failure of staff to get up to speed with new threats (e.g. mobility)
IT Skills Gaps: 85% of BriSsh execuSves indicate at least some degree of gaps in IT skills at their business exists. For 37%, the reported skills gaps are small, while for 48% the gaps are more extensive. Top negaSve effects of IT skills gaps at BriSsh businesses: 1. Lower staff producSvity 2. Less than ideal customer service and/or engagement. InnovaSon.
IT Training and CerAficaAon: 86% of IT staff at BriSsh businesses engaged in some type of IT training during the past 12 months. 1. 42% of BriSsh execuSves believe IT cerSficaSons will increase in
importance over the next two years 2. 58% of BriSsh execuSves agree (NET) that staff holding IT
cerSficaSons have proven experSse
Sources used for above stats: CompTIA, IMF, CIA World Factbook, IDC
*See appendix for definiSon of core IT occupaSons
SecSon 2 – State of Tech USlizaSon & Business PrioriSes
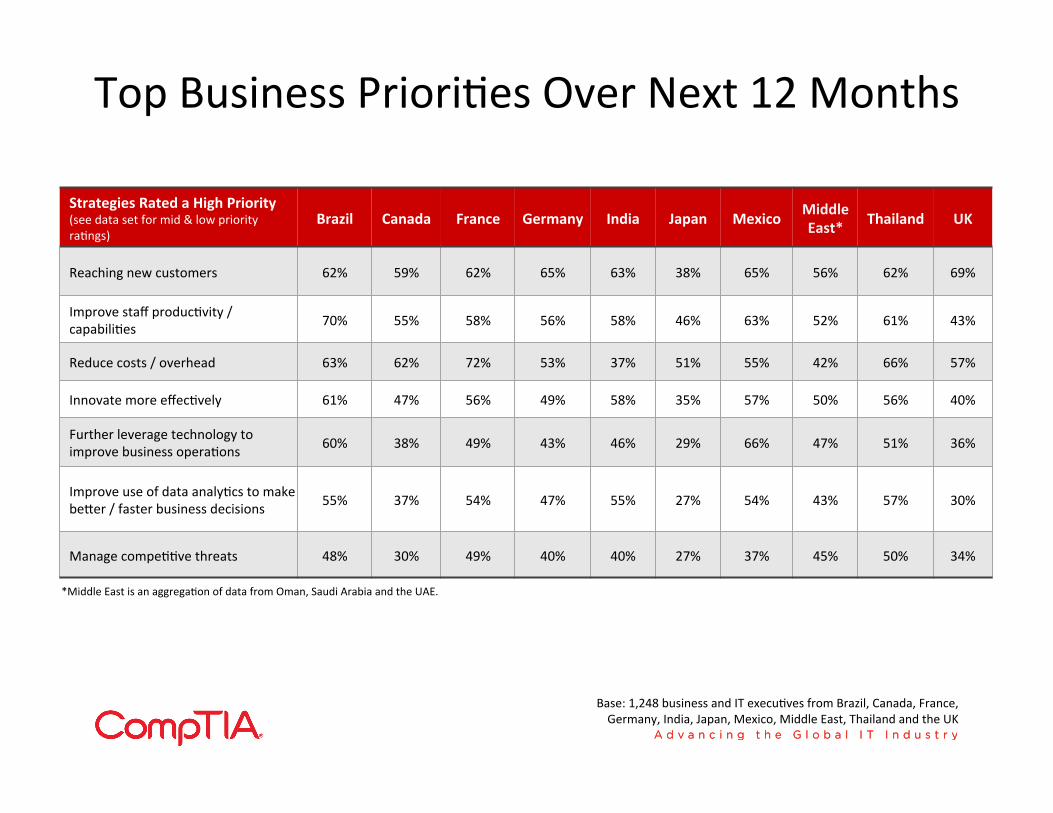
Top Business PrioriSes Over Next 12 Months
Strategies Rated a High Priority (see data set for mid & low priority raSngs)
Brazil Canada France Germany India Japan Mexico Middle East* Thailand UK
Reaching new customers 62% 59% 62% 65% 63% 38% 65% 56% 62% 69%
Improve staff producSvity / capabiliSes 70% 55% 58% 56% 58% 46% 63% 52% 61% 43%
Reduce costs / overhead 63% 62% 72% 53% 37% 51% 55% 42% 66% 57%
Innovate more effecSvely 61% 47% 56% 49% 58% 35% 57% 50% 56% 40%
Further leverage technology to improve business operaSons 60% 38% 49% 43% 46% 29% 66% 47% 51% 36%
Improve use of data analyScs to make beser / faster business decisions 55% 37% 54% 47% 55% 27% 54% 43% 57% 30%
Manage compeSSve threats 48% 30% 49% 40% 40% 27% 37% 45% 50% 34%
Base: 1,248 business and IT execuSves from Brazil, Canada, France, Germany, India, Japan, Mexico, Middle East, Thailand and the UK
*Middle East is an aggregaSon of data from Oman, Saudi Arabia and the UAE.
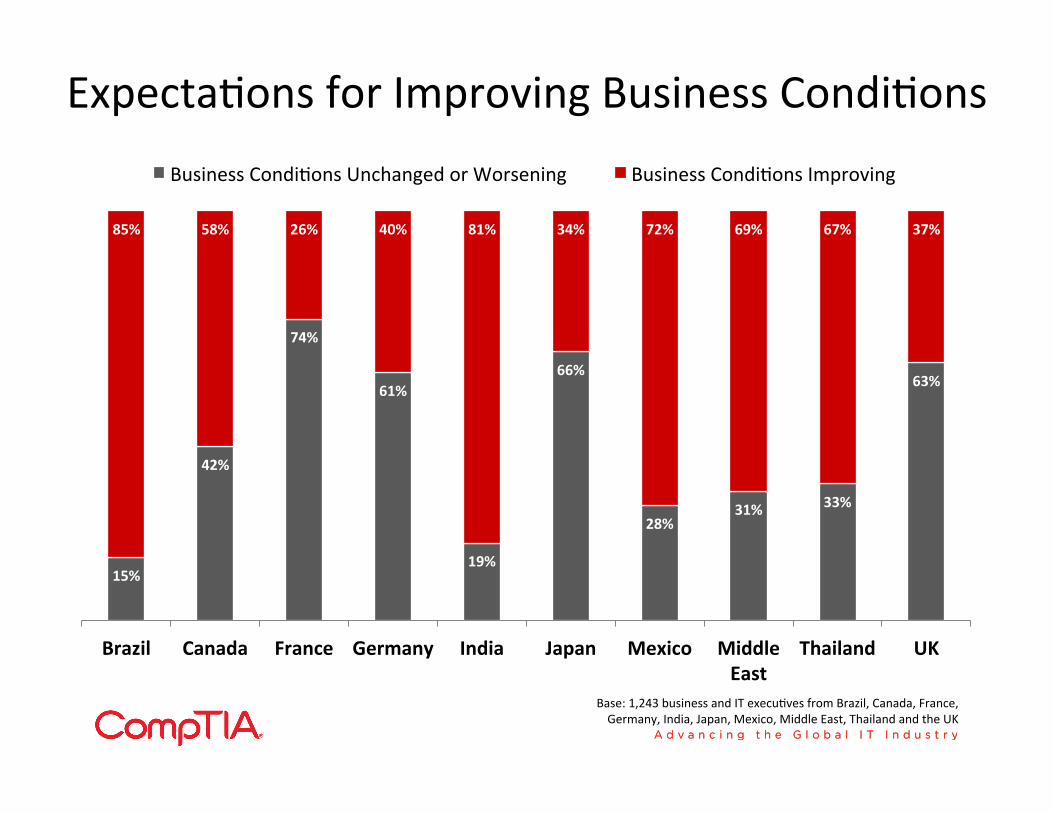
ExpectaSons for Improving Business CondiSons
15%
42%
74%
61%
19%
66%
28% 31% 33%
63%
85% 58% 26% 40% 81% 34% 72% 69% 67% 37%
Brazil Canada France Germany India Japan Mexico Middle East
Thailand UK
Business CondiSons Unchanged or Worsening Business CondiSons Improving
Base: 1,243 business and IT execuSves from Brazil, Canada, France, Germany, India, Japan, Mexico, Middle East, Thailand and the UK
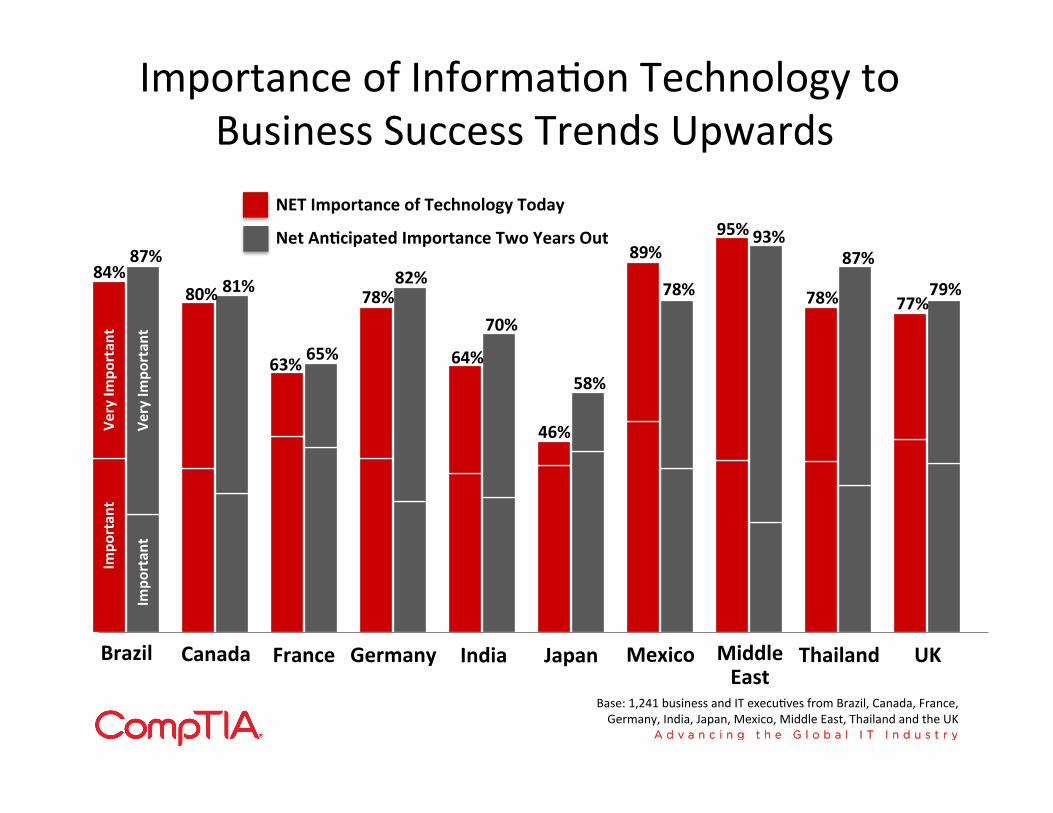
Importance of InformaSon Technology to Business Success Trends Upwards
Base: 1,241 business and IT execuSves from Brazil, Canada, France, Germany, India, Japan, Mexico, Middle East, Thailand and the UK
Brazil Canada France Germany India Japan Mexico Middle East
Thailand UK
84% 87%
80% 81%
63% 65%
78% 82%
64%
70%
46%
58%
89%
78%
95% 93%
78%
87%
77% 79%
Impo
rtan
t Ve
ry Im
portan
t
NET Importance of Technology Today
Net AnAcipated Importance Two Years Out
Impo
rtan
t Ve
ry Im
portan
t
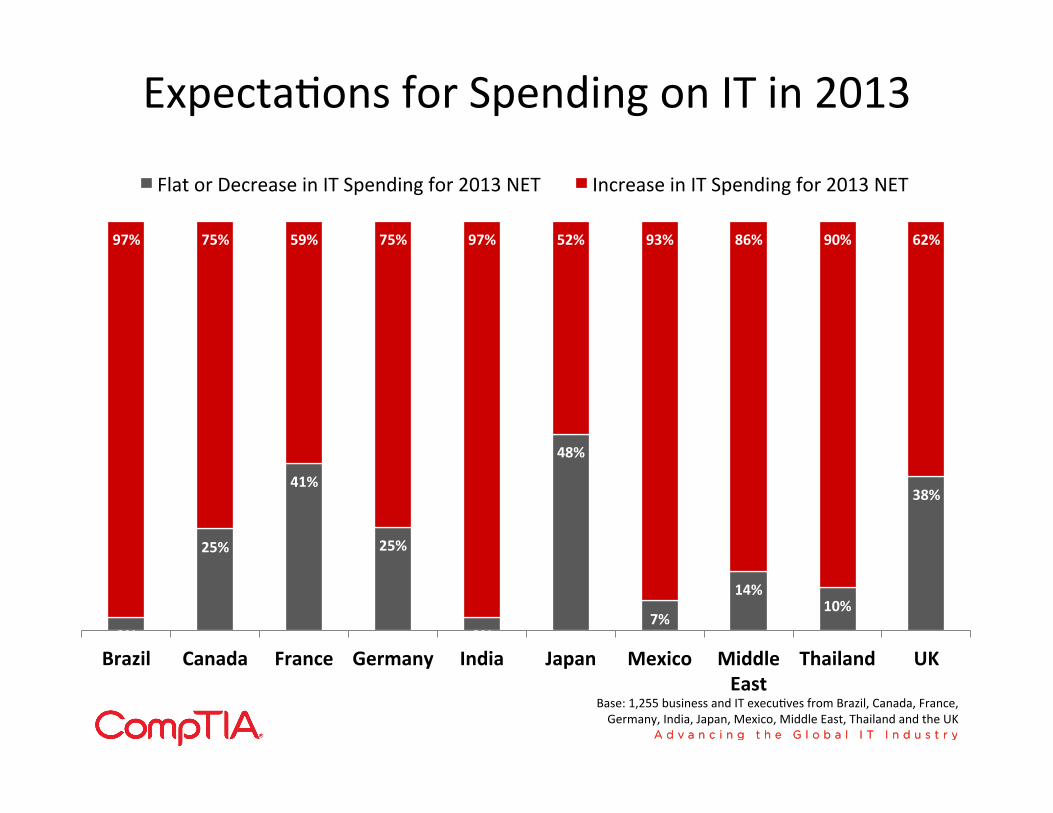
ExpectaSons for Spending on IT in 2013
3%
25%
41%
25%
3%
48%
7%
14% 10%
38%
97% 75% 59% 75% 97% 52% 93% 86% 90% 62%
Brazil Canada France Germany India Japan Mexico Middle East
Thailand UK
Flat or Decrease in IT Spending for 2013 NET Increase in IT Spending for 2013 NET
Base: 1,255 business and IT execuSves from Brazil, Canada, France, Germany, India, Japan, Mexico, Middle East, Thailand and the UK
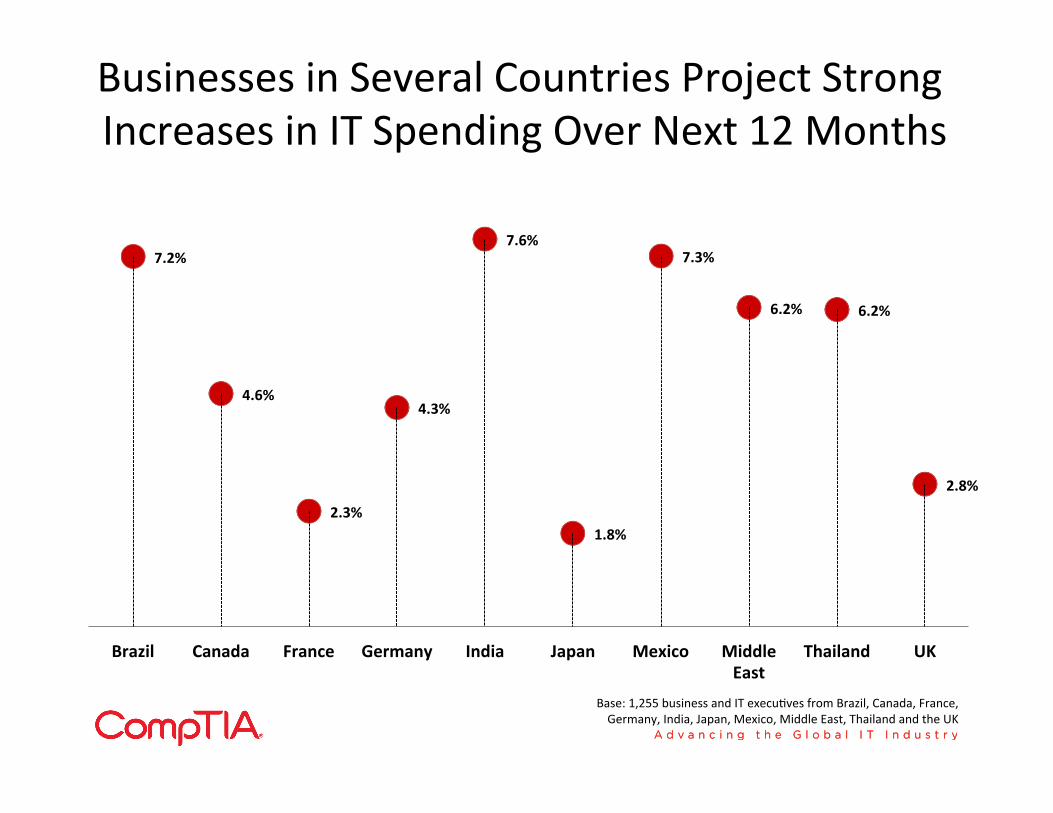
Businesses in Several Countries Project Strong Increases in IT Spending Over Next 12 Months
7.2%
4.6%
2.3%
4.3%
7.6%
1.8%
7.3%
6.2% 6.2%
2.8%
Brazil Canada France Germany India Japan Mexico Middle East
Thailand UK
Axis Title
Base: 1,255 business and IT execuSves from Brazil, Canada, France, Germany, India, Japan, Mexico, Middle East, Thailand and the UK
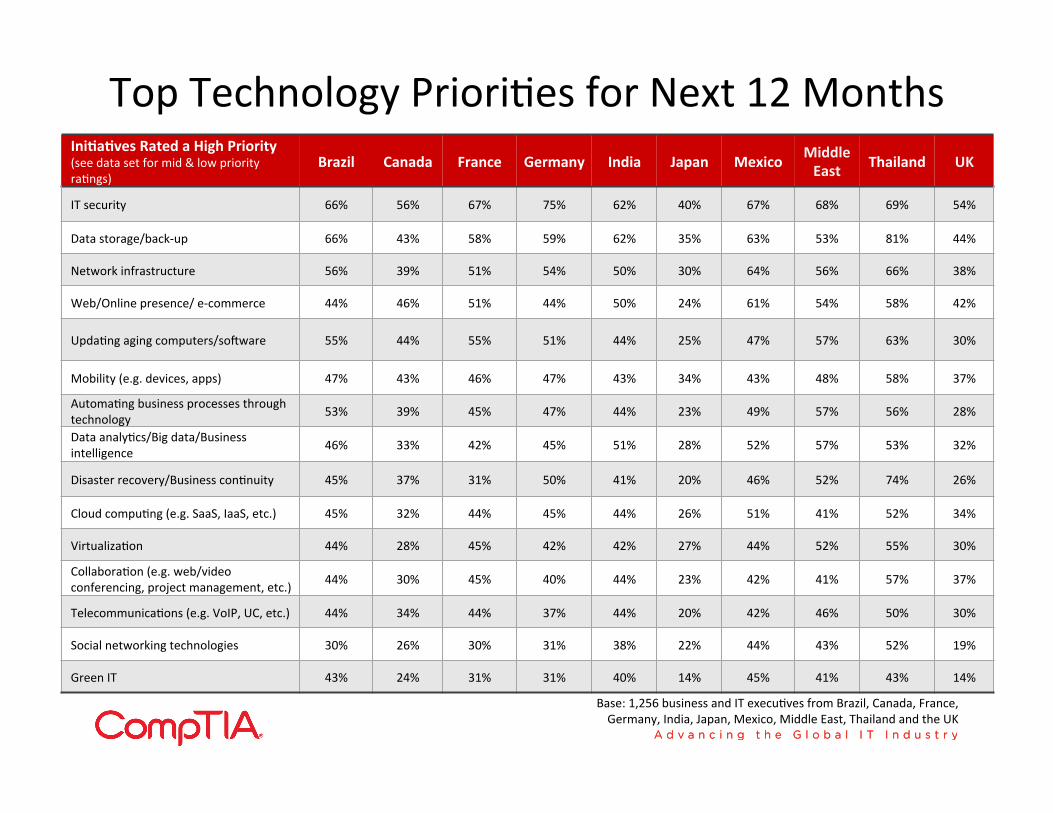
Top Technology PrioriSes for Next 12 Months IniAaAves Rated a High Priority (see data set for mid & low priority raSngs)
Brazil Canada France Germany India Japan Mexico Middle East Thailand UK
IT security 66% 56% 67% 75% 62% 40% 67% 68% 69% 54%
Data storage/back-‐up 66% 43% 58% 59% 62% 35% 63% 53% 81% 44%
Network infrastructure 56% 39% 51% 54% 50% 30% 64% 56% 66% 38%
Web/Online presence/ e-‐commerce 44% 46% 51% 44% 50% 24% 61% 54% 58% 42%
UpdaSng aging computers/so]ware 55% 44% 55% 51% 44% 25% 47% 57% 63% 30%
Mobility (e.g. devices, apps) 47% 43% 46% 47% 43% 34% 43% 48% 58% 37%
AutomaSng business processes through technology 53% 39% 45% 47% 44% 23% 49% 57% 56% 28%
Data analyScs/Big data/Business intelligence 46% 33% 42% 45% 51% 28% 52% 57% 53% 32%
Disaster recovery/Business conSnuity 45% 37% 31% 50% 41% 20% 46% 52% 74% 26%
Cloud compuSng (e.g. SaaS, IaaS, etc.) 45% 32% 44% 45% 44% 26% 51% 41% 52% 34%
VirtualizaSon 44% 28% 45% 42% 42% 27% 44% 52% 55% 30%
CollaboraSon (e.g. web/video conferencing, project management, etc.) 44% 30% 45% 40% 44% 23% 42% 41% 57% 37%
TelecommunicaSons (e.g. VoIP, UC, etc.) 44% 34% 44% 37% 44% 20% 42% 46% 50% 30%
Social networking technologies 30% 26% 30% 31% 38% 22% 44% 43% 52% 19%
Green IT 43% 24% 31% 31% 40% 14% 45% 41% 43% 14%
Base: 1,256 business and IT execuSves from Brazil, Canada, France, Germany, India, Japan, Mexico, Middle East, Thailand and the UK
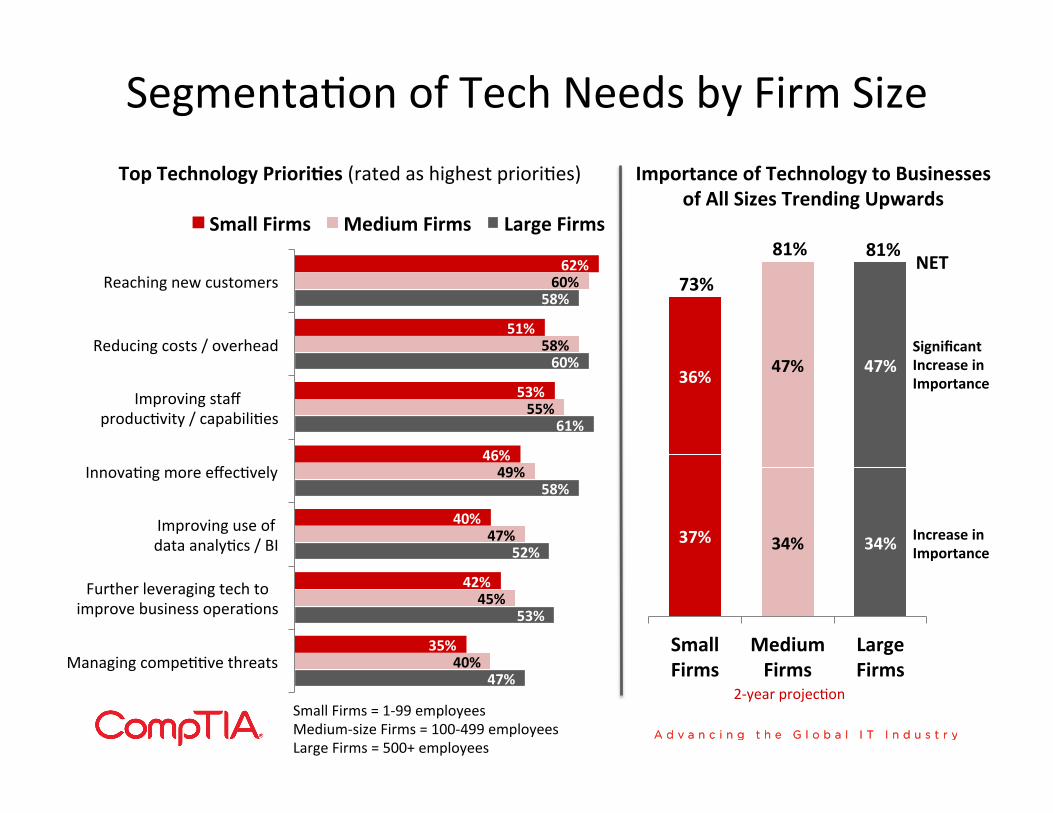
SegmentaSon of Tech Needs by Firm Size
47%
53%
52%
58%
61%
60%
58%
40%
45%
47%
49%
55%
58%
60%
35%
42%
40%
46%
53%
51%
62%
Managing compeSSve threats
Further leveraging tech to improve business operaSons
Improving use of data analyScs / BI
InnovaSng more effecSvely
Improving staff producSvity / capabiliSes
Reducing costs / overhead
Reaching new customers
Small Firms Medium Firms Large Firms
37% 34% 34%
36% 47% 47%
Small Firms
Medium Firms
Large Firms
Significant Increase in Importance
Increase in Importance
73%
81% 81% NET
Importance of Technology to Businesses of All Sizes Trending Upwards
Top Technology PrioriAes (rated as highest prioriSes)
Small Firms = 1-‐99 employees Medium-‐size Firms = 100-‐499 employees Large Firms = 500+ employees
2-‐year projecSon
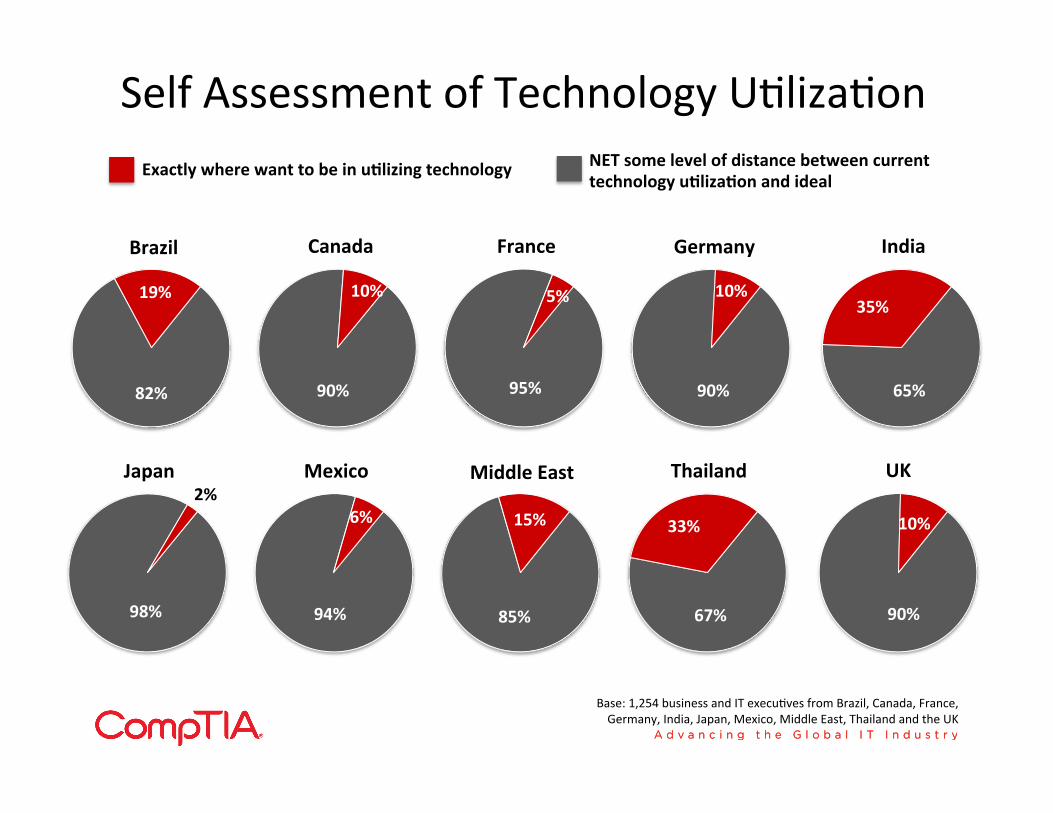
Self Assessment of Technology USlizaSon
82%
19%
90%
10%
95%
5%
90%
10%
65%
35%
98%
2%
94%
6%
85%
15%
67%
33%
90%
10%
Base: 1,254 business and IT execuSves from Brazil, Canada, France, Germany, India, Japan, Mexico, Middle East, Thailand and the UK
Exactly where want to be in uAlizing technology
Brazil Canada France Germany India
Japan Mexico Middle East Thailand UK
NET some level of distance between current technology uAlizaAon and ideal
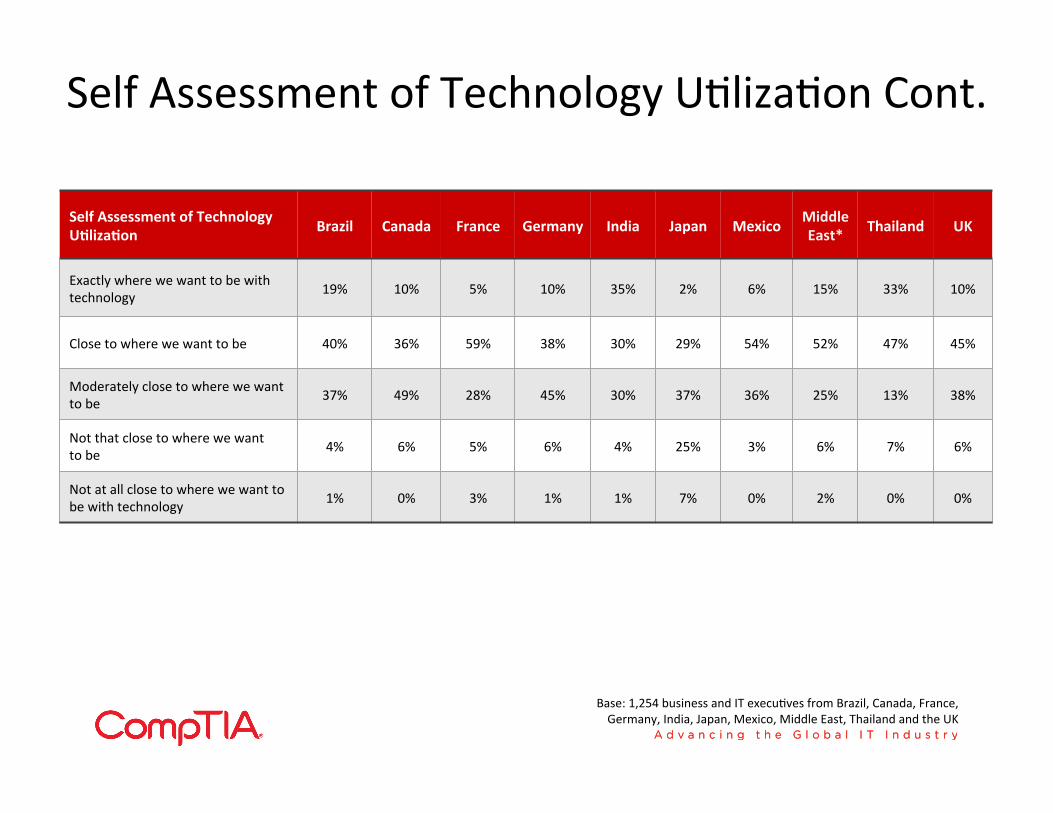
Self Assessment of Technology USlizaSon Cont.
Self Assessment of Technology UAlizaAon
Brazil Canada France Germany India Japan Mexico Middle East* Thailand UK
Exactly where we want to be with technology 19% 10% 5% 10% 35% 2% 6% 15% 33% 10%
Close to where we want to be 40% 36% 59% 38% 30% 29% 54% 52% 47% 45%
Moderately close to where we want to be 37% 49% 28% 45% 30% 37% 36% 25% 13% 38%
Not that close to where we want to be 4% 6% 5% 6% 4% 25% 3% 6% 7% 6%
Not at all close to where we want to be with technology 1% 0% 3% 1% 1% 7% 0% 2% 0% 0%
Base: 1,254 business and IT execuSves from Brazil, Canada, France, Germany, India, Japan, Mexico, Middle East, Thailand and the UK
SecSon 3 – Technology Focus
I. Cloud CompuSng
II. CyberSecurity
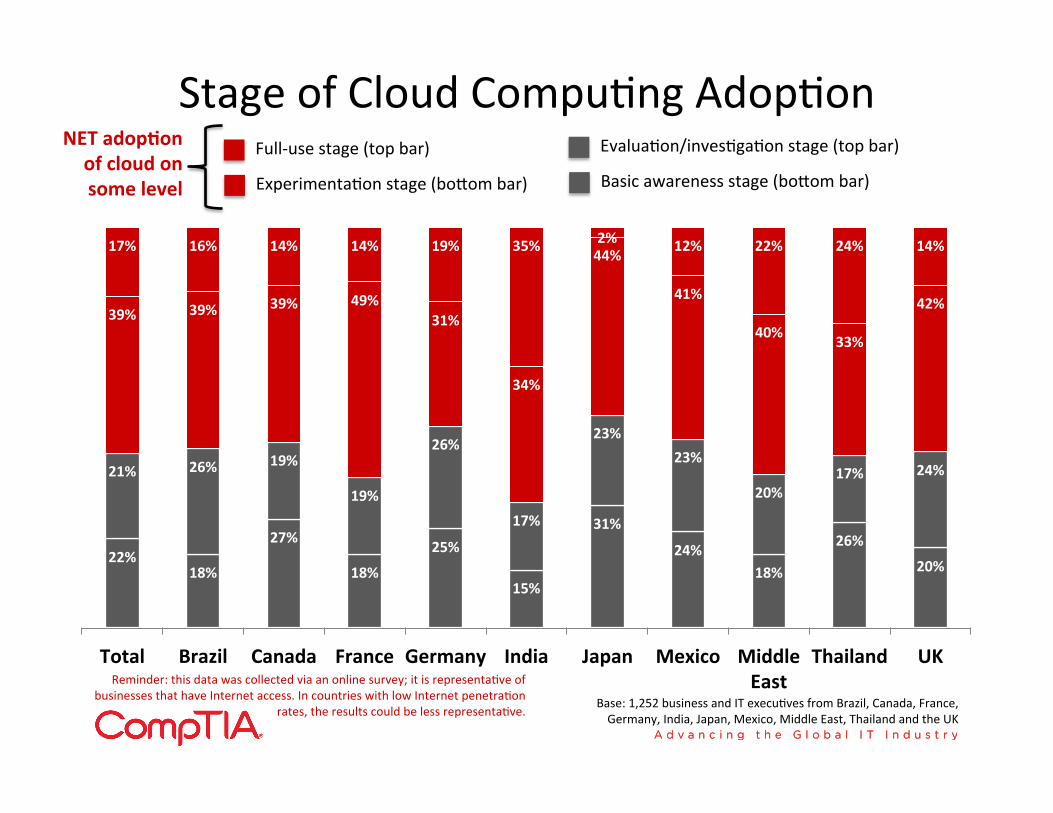
Stage of Cloud CompuSng AdopSon
22% 18%
27%
18%
25%
15%
31%
24% 18%
26%
20%
21% 26% 19%
19%
26%
17%
23% 23%
20% 17% 24%
39% 39% 39% 49% 31%
34%
44%
41%
40% 33%
42%
17% 16% 14% 14% 19% 35% 2% 12% 22% 24% 14%
Total Brazil Canada France Germany India Japan Mexico Middle East
Thailand UK
Base: 1,252 business and IT execuSves from Brazil, Canada, France, Germany, India, Japan, Mexico, Middle East, Thailand and the UK
Full-‐use stage (top bar)
ExperimentaSon stage (bosom bar)
EvaluaSon/invesSgaSon stage (top bar)
Basic awareness stage (bosom bar)
NET adopAon of cloud on some level
Reminder: this data was collected via an online survey; it is representaSve of businesses that have Internet access. In countries with low Internet penetraSon
rates, the results could be less representaSve.
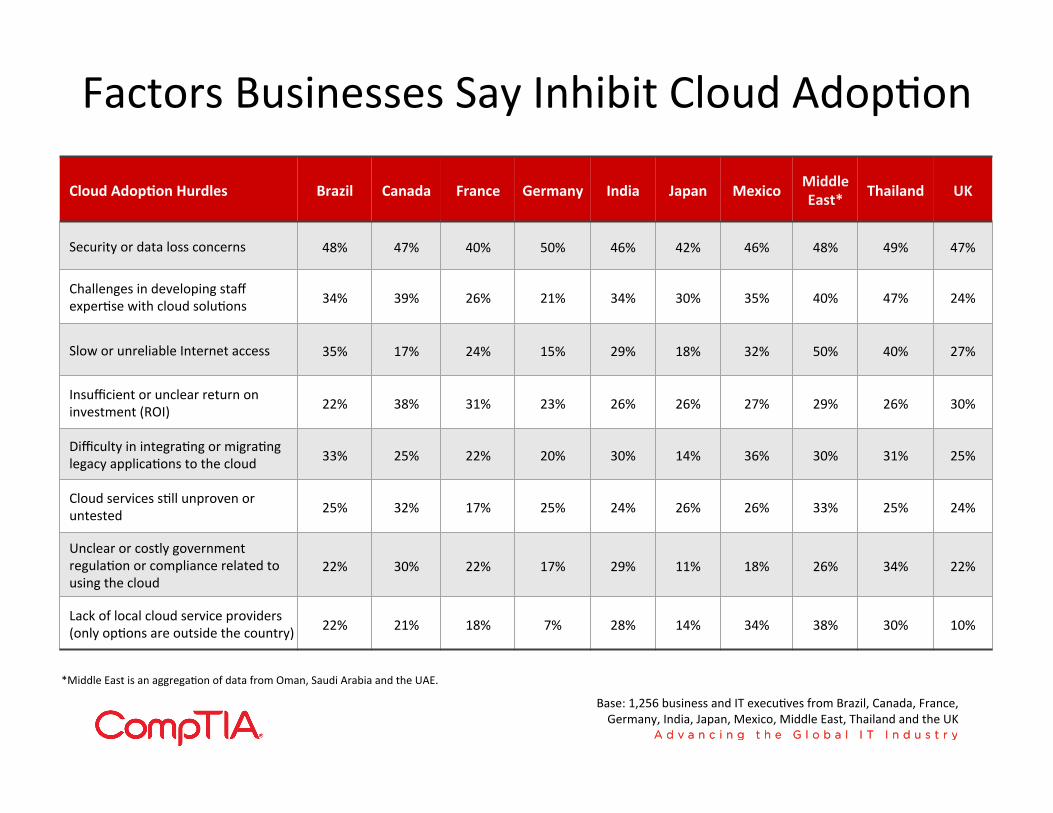
Factors Businesses Say Inhibit Cloud AdopSon
Cloud AdopAon Hurdles Brazil Canada France Germany India Japan Mexico Middle East* Thailand UK
Security or data loss concerns 48% 47% 40% 50% 46% 42% 46% 48% 49% 47%
Challenges in developing staff experSse with cloud soluSons 34% 39% 26% 21% 34% 30% 35% 40% 47% 24%
Slow or unreliable Internet access 35% 17% 24% 15% 29% 18% 32% 50% 40% 27%
Insufficient or unclear return on investment (ROI) 22% 38% 31% 23% 26% 26% 27% 29% 26% 30%
Difficulty in integraSng or migraSng legacy applicaSons to the cloud 33% 25% 22% 20% 30% 14% 36% 30% 31% 25%
Cloud services sSll unproven or untested 25% 32% 17% 25% 24% 26% 26% 33% 25% 24%
Unclear or costly government regulaSon or compliance related to using the cloud
22% 30% 22% 17% 29% 11% 18% 26% 34% 22%
Lack of local cloud service providers (only opSons are outside the country) 22% 21% 18% 7% 28% 14% 34% 38% 30% 10%
Base: 1,256 business and IT execuSves from Brazil, Canada, France, Germany, India, Japan, Mexico, Middle East, Thailand and the UK
*Middle East is an aggregaSon of data from Oman, Saudi Arabia and the UAE.
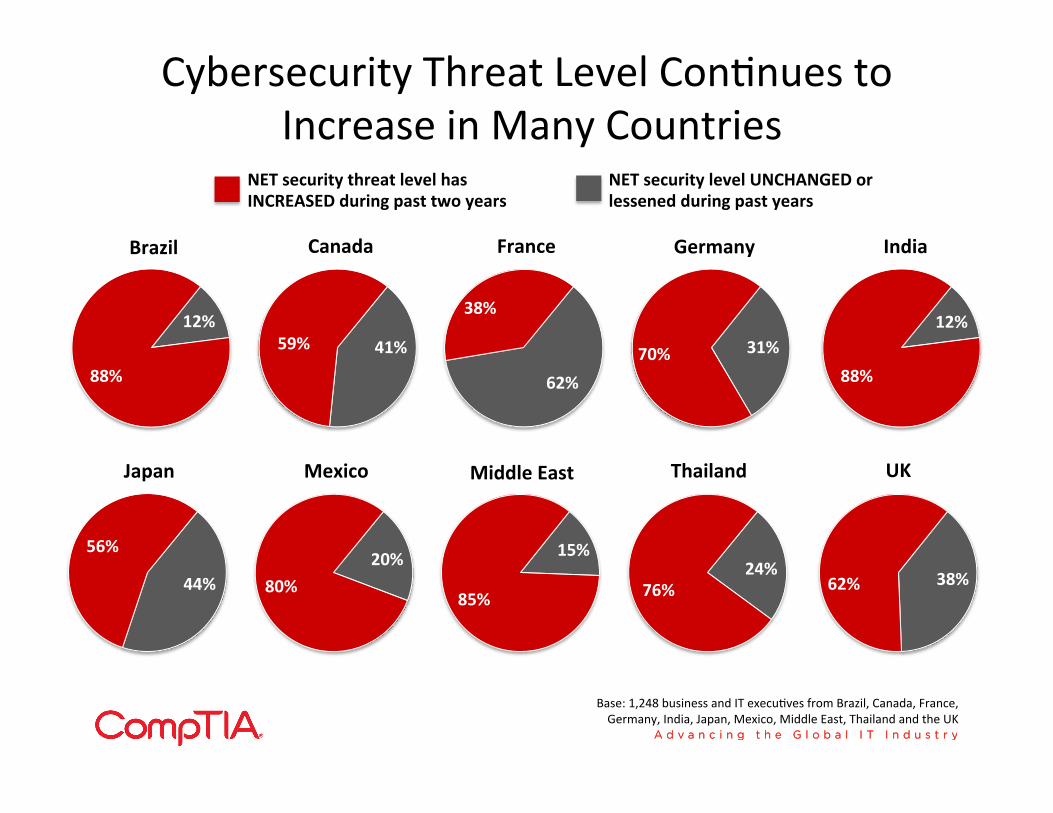
Cybersecurity Threat Level ConSnues to Increase in Many Countries
12%
88% 41% 59%
62%
38%
31% 70%
12%
88%
44%
56% 20%
80%
15%
85%
24% 76% 38% 62%
Base: 1,248 business and IT execuSves from Brazil, Canada, France, Germany, India, Japan, Mexico, Middle East, Thailand and the UK
NET security threat level has INCREASED during past two years
Brazil Canada France Germany India
Japan Mexico Middle East Thailand UK
NET security level UNCHANGED or lessened during past years
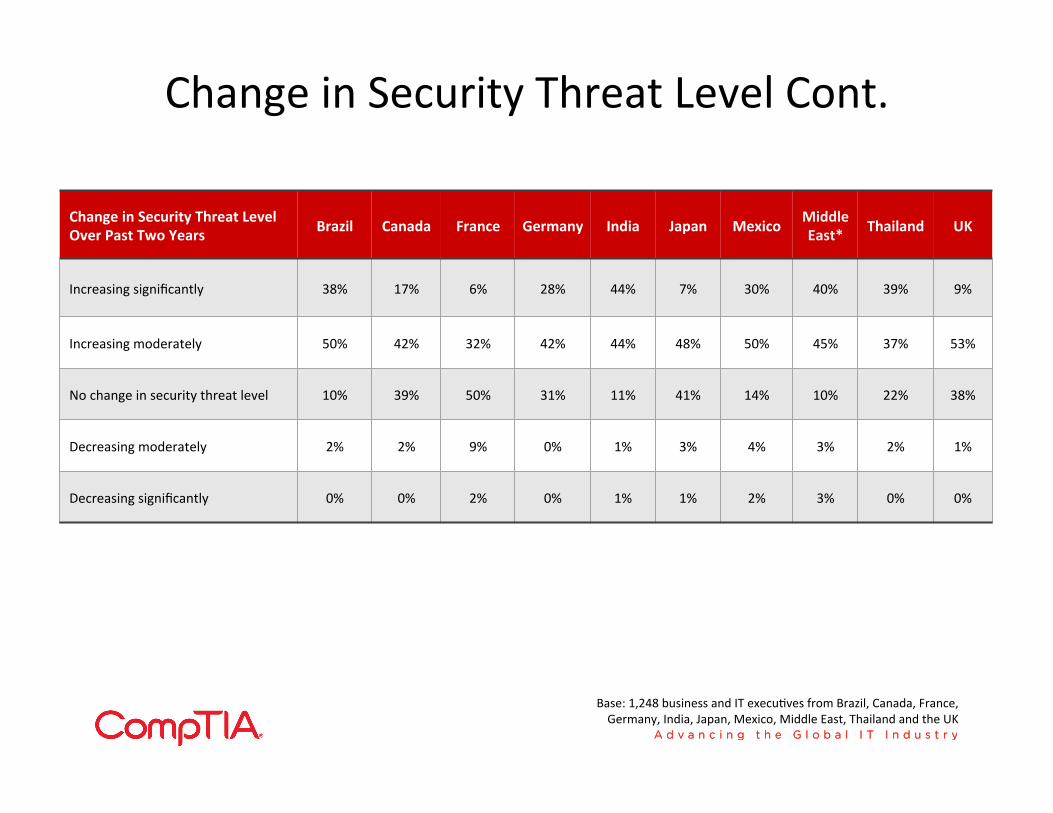
Change in Security Threat Level Cont.
Change in Security Threat Level Over Past Two Years
Brazil Canada France Germany India Japan Mexico Middle East* Thailand UK
Increasing significantly 38% 17% 6% 28% 44% 7% 30% 40% 39% 9%
Increasing moderately 50% 42% 32% 42% 44% 48% 50% 45% 37% 53%
No change in security threat level 10% 39% 50% 31% 11% 41% 14% 10% 22% 38%
Decreasing moderately 2% 2% 9% 0% 1% 3% 4% 3% 2% 1%
Decreasing significantly 0% 0% 2% 0% 1% 1% 2% 3% 0% 0%
Base: 1,248 business and IT execuSves from Brazil, Canada, France, Germany, India, Japan, Mexico, Middle East, Thailand and the UK
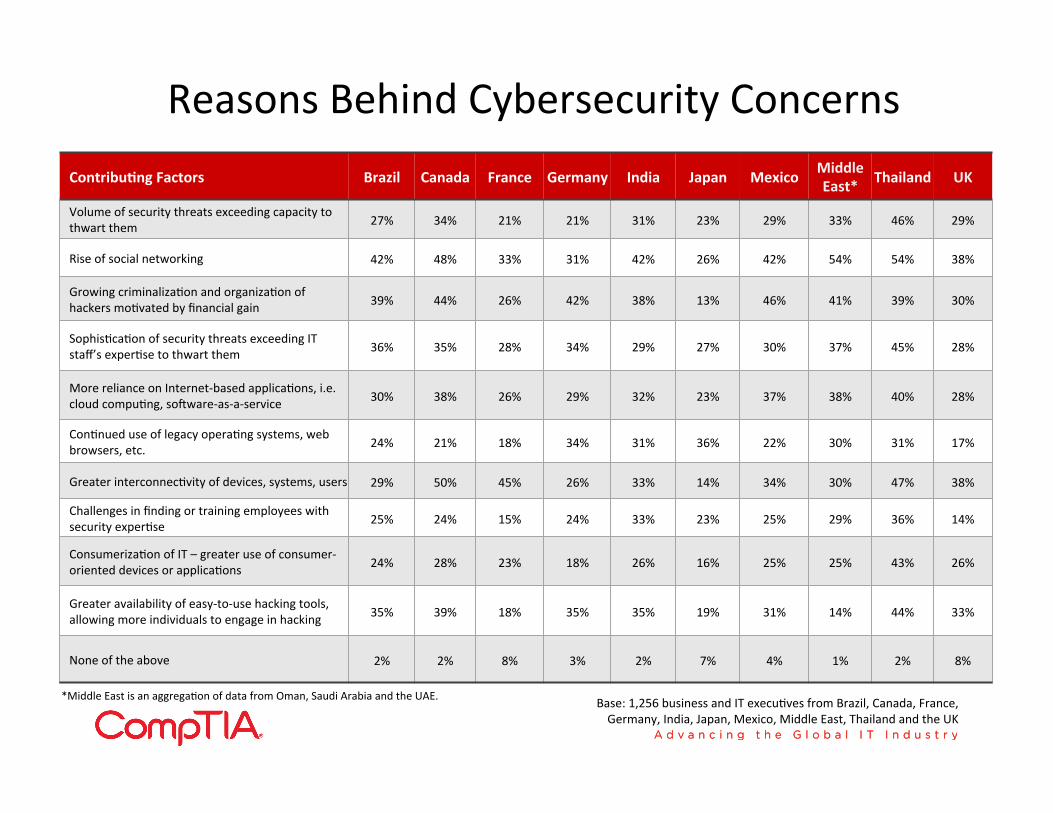
Reasons Behind Cybersecurity Concerns ContribuAng Factors Brazil Canada France Germany India Japan Mexico Middle
East* Thailand UK
Volume of security threats exceeding capacity to thwart them 27% 34% 21% 21% 31% 23% 29% 33% 46% 29%
Rise of social networking 42% 48% 33% 31% 42% 26% 42% 54% 54% 38%
Growing criminalizaSon and organizaSon of hackers moSvated by financial gain 39% 44% 26% 42% 38% 13% 46% 41% 39% 30%
SophisScaSon of security threats exceeding IT staff’s experSse to thwart them 36% 35% 28% 34% 29% 27% 30% 37% 45% 28%
More reliance on Internet-‐based applicaSons, i.e. cloud compuSng, so]ware-‐as-‐a-‐service 30% 38% 26% 29% 32% 23% 37% 38% 40% 28%
ConSnued use of legacy operaSng systems, web browsers, etc. 24% 21% 18% 34% 31% 36% 22% 30% 31% 17%
Greater interconnecSvity of devices, systems, users 29% 50% 45% 26% 33% 14% 34% 30% 47% 38%
Challenges in finding or training employees with security experSse 25% 24% 15% 24% 33% 23% 25% 29% 36% 14%
ConsumerizaSon of IT – greater use of consumer-‐oriented devices or applicaSons 24% 28% 23% 18% 26% 16% 25% 25% 43% 26%
Greater availability of easy-‐to-‐use hacking tools, allowing more individuals to engage in hacking 35% 39% 18% 35% 35% 19% 31% 14% 44% 33%
None of the above 2% 2% 8% 3% 2% 7% 4% 1% 2% 8%
*Middle East is an aggregaSon of data from Oman, Saudi Arabia and the UAE. Base: 1,256 business and IT execuSves from Brazil, Canada, France, Germany, India, Japan, Mexico, Middle East, Thailand and the UK
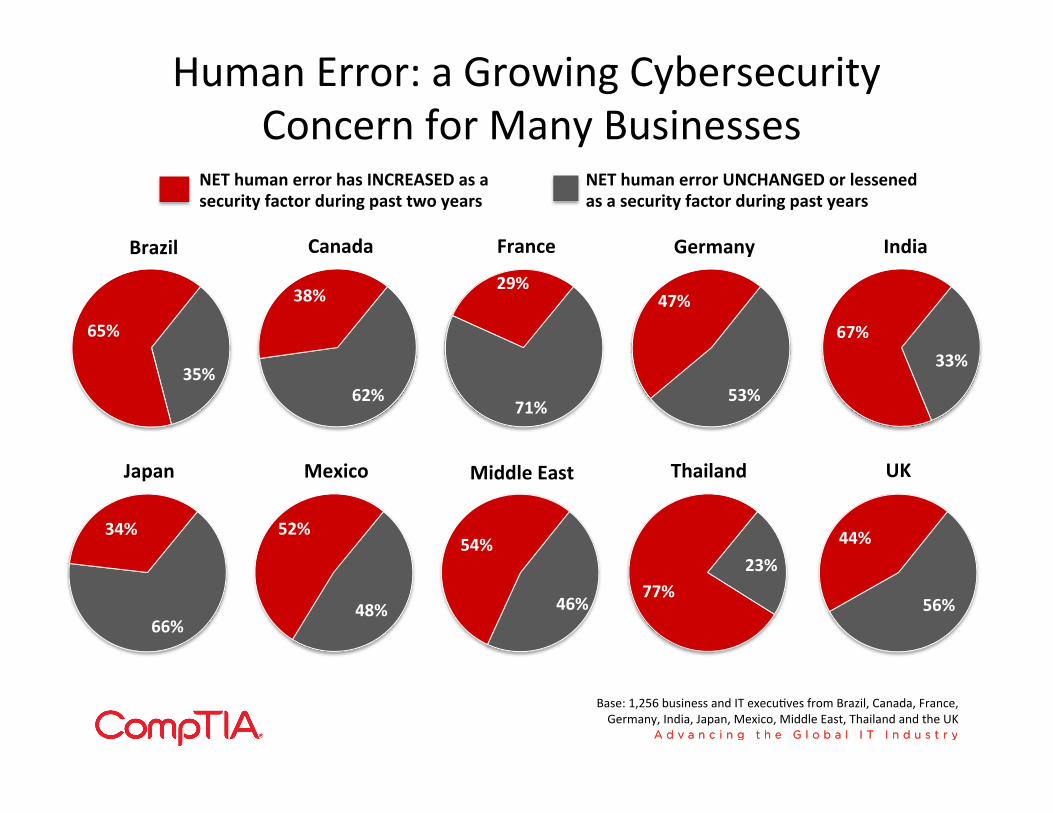
Human Error: a Growing Cybersecurity Concern for Many Businesses
35%
65%
62%
38%
71%
29%
53%
47%
33% 67%
66%
34%
48%
52%
46%
54% 23%
77% 56%
44%
Base: 1,256 business and IT execuSves from Brazil, Canada, France, Germany, India, Japan, Mexico, Middle East, Thailand and the UK
NET human error has INCREASED as a security factor during past two years
Brazil Canada France Germany India
Japan Mexico Middle East Thailand UK
NET human error UNCHANGED or lessened as a security factor during past years
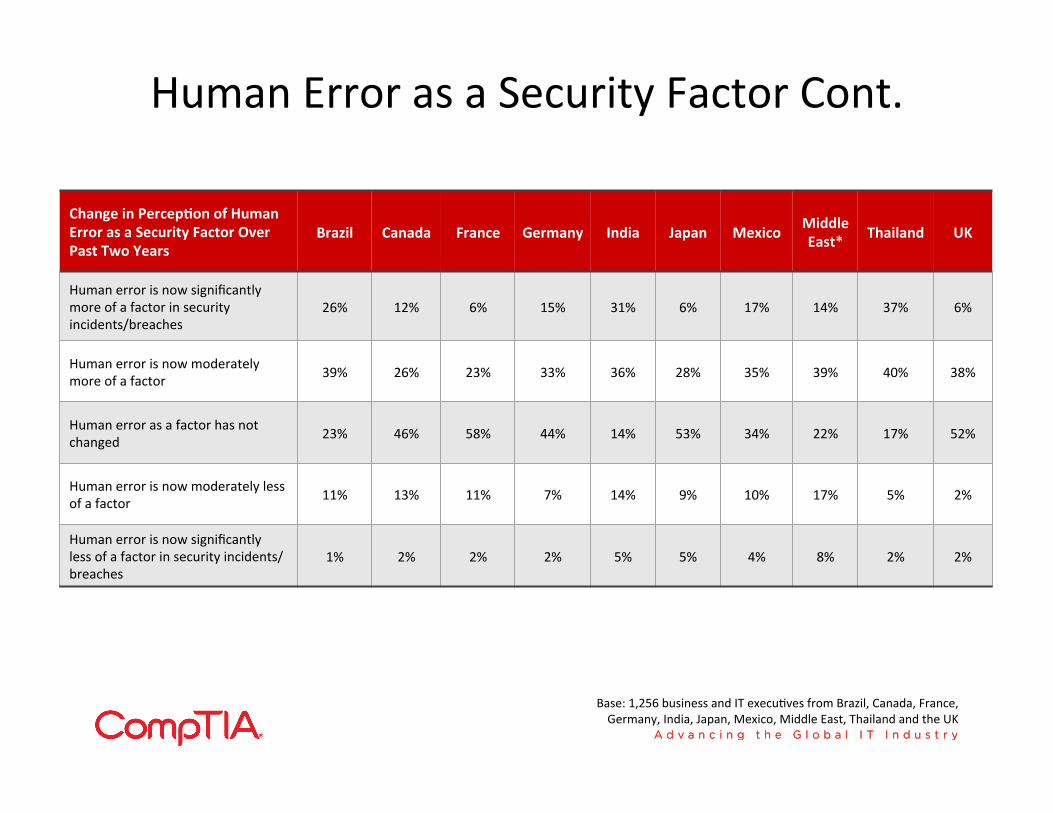
Human Error as a Security Factor Cont.
Change in PercepAon of Human Error as a Security Factor Over Past Two Years
Brazil Canada France Germany India Japan Mexico Middle East* Thailand UK
Human error is now significantly more of a factor in security incidents/breaches
26% 12% 6% 15% 31% 6% 17% 14% 37% 6%
Human error is now moderately more of a factor 39% 26% 23% 33% 36% 28% 35% 39% 40% 38%
Human error as a factor has not changed 23% 46% 58% 44% 14% 53% 34% 22% 17% 52%
Human error is now moderately less of a factor 11% 13% 11% 7% 14% 9% 10% 17% 5% 2%
Human error is now significantly less of a factor in security incidents/breaches
1% 2% 2% 2% 5% 5% 4% 8% 2% 2%
Base: 1,256 business and IT execuSves from Brazil, Canada, France, Germany, India, Japan, Mexico, Middle East, Thailand and the UK
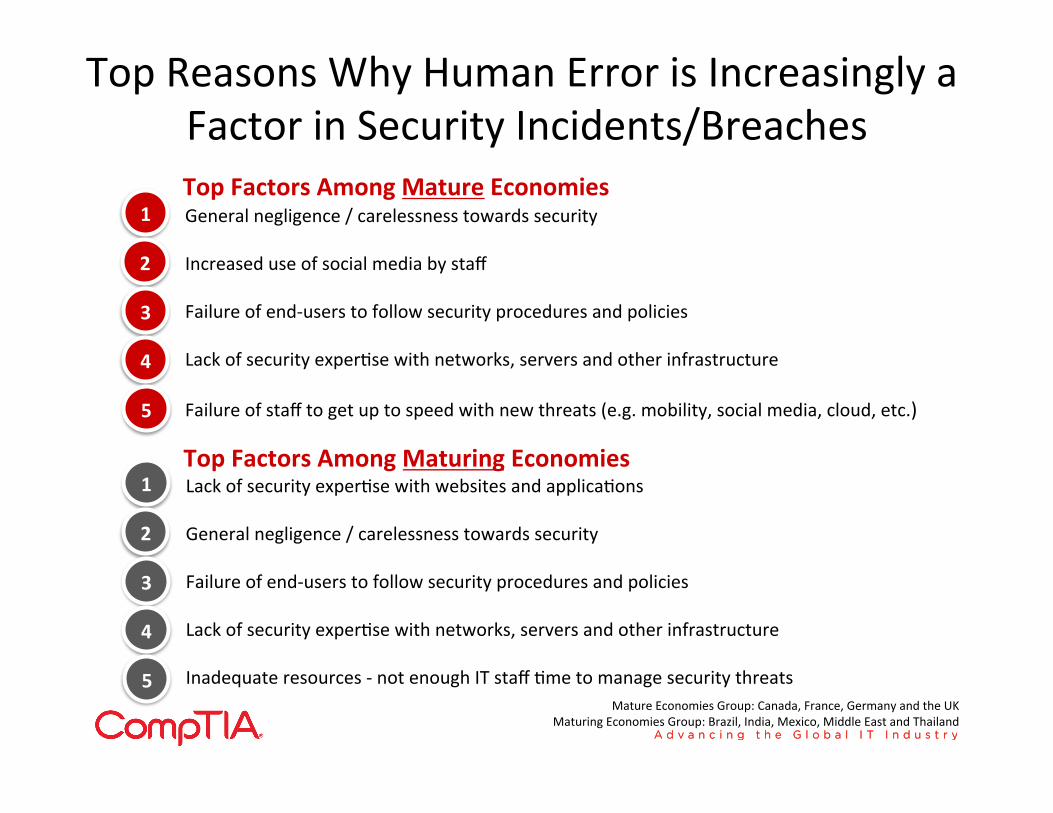
Top Reasons Why Human Error is Increasingly a Factor in Security Incidents/Breaches
General negligence / carelessness towards security
Increased use of social media by staff
Failure of end-‐users to follow security procedures and policies
Lack of security experSse with networks, servers and other infrastructure
Failure of staff to get up to speed with new threats (e.g. mobility, social media, cloud, etc.)
1
2
3
4
5
Top Factors Among Mature Economies
Lack of security experSse with websites and applicaSons
General negligence / carelessness towards security
Failure of end-‐users to follow security procedures and policies
Lack of security experSse with networks, servers and other infrastructure
Inadequate resources -‐ not enough IT staff Sme to manage security threats
1
2
3
4
5
Top Factors Among Maturing Economies
Mature Economies Group: Canada, France, Germany and the UK Maturing Economies Group: Brazil, India, Mexico, Middle East and Thailand
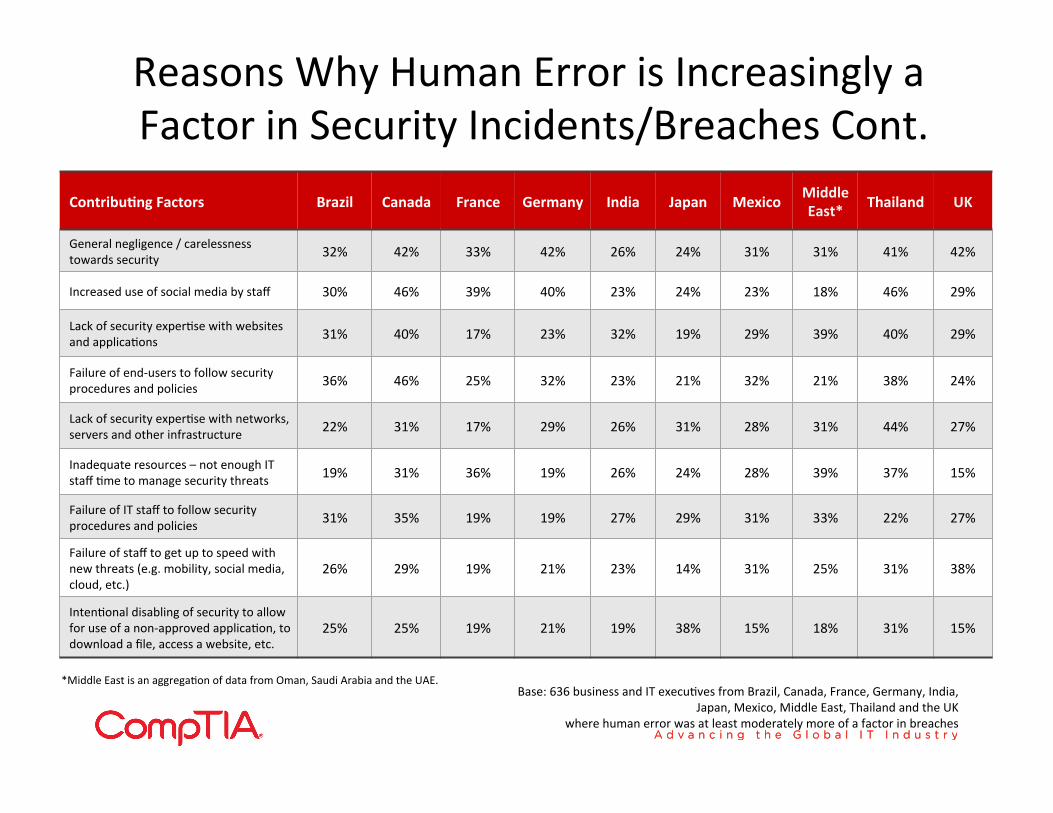
Reasons Why Human Error is Increasingly a Factor in Security Incidents/Breaches Cont.
ContribuAng Factors Brazil Canada France Germany India Japan Mexico Middle East* Thailand UK
General negligence / carelessness towards security 32% 42% 33% 42% 26% 24% 31% 31% 41% 42%
Increased use of social media by staff 30% 46% 39% 40% 23% 24% 23% 18% 46% 29%
Lack of security experSse with websites and applicaSons 31% 40% 17% 23% 32% 19% 29% 39% 40% 29%
Failure of end-‐users to follow security procedures and policies 36% 46% 25% 32% 23% 21% 32% 21% 38% 24%
Lack of security experSse with networks, servers and other infrastructure 22% 31% 17% 29% 26% 31% 28% 31% 44% 27%
Inadequate resources – not enough IT staff Sme to manage security threats 19% 31% 36% 19% 26% 24% 28% 39% 37% 15%
Failure of IT staff to follow security procedures and policies 31% 35% 19% 19% 27% 29% 31% 33% 22% 27%
Failure of staff to get up to speed with new threats (e.g. mobility, social media, cloud, etc.)
26% 29% 19% 21% 23% 14% 31% 25% 31% 38%
IntenSonal disabling of security to allow for use of a non-‐approved applicaSon, to download a file, access a website, etc.
25% 25% 19% 21% 19% 38% 15% 18% 31% 15%
Base: 636 business and IT execuSves from Brazil, Canada, France, Germany, India, Japan, Mexico, Middle East, Thailand and the UK
where human error was at least moderately more of a factor in breaches
*Middle East is an aggregaSon of data from Oman, Saudi Arabia and the UAE.
SecSon 4 – The IT Workforce Landscape
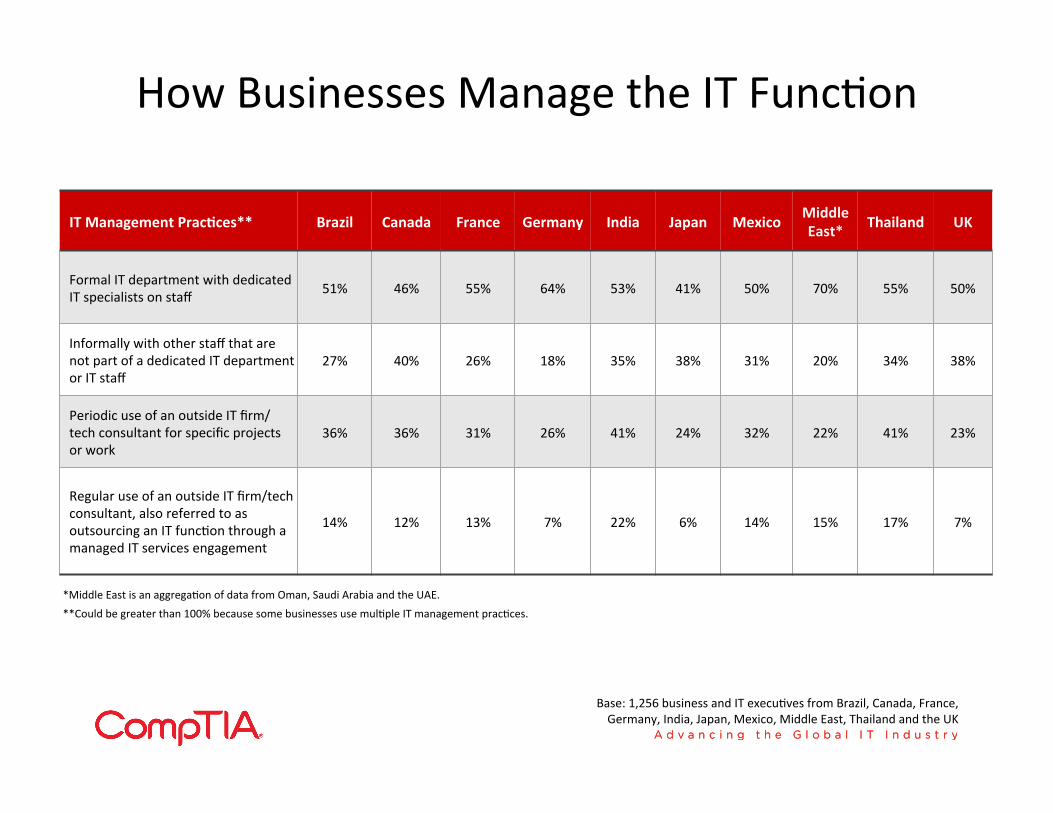
How Businesses Manage the IT FuncSon
IT Management PracAces** Brazil Canada France Germany India Japan Mexico Middle East* Thailand UK
Formal IT department with dedicated IT specialists on staff 51% 46% 55% 64% 53% 41% 50% 70% 55% 50%
Informally with other staff that are not part of a dedicated IT department or IT staff
27% 40% 26% 18% 35% 38% 31% 20% 34% 38%
Periodic use of an outside IT firm/ tech consultant for specific projects or work
36% 36% 31% 26% 41% 24% 32% 22% 41% 23%
Regular use of an outside IT firm/tech consultant, also referred to as outsourcing an IT funcSon through a managed IT services engagement
14% 12% 13% 7% 22% 6% 14% 15% 17% 7%
Base: 1,256 business and IT execuSves from Brazil, Canada, France, Germany, India, Japan, Mexico, Middle East, Thailand and the UK
**Could be greater than 100% because some businesses use mulSple IT management pracSces. *Middle East is an aggregaSon of data from Oman, Saudi Arabia and the UAE.
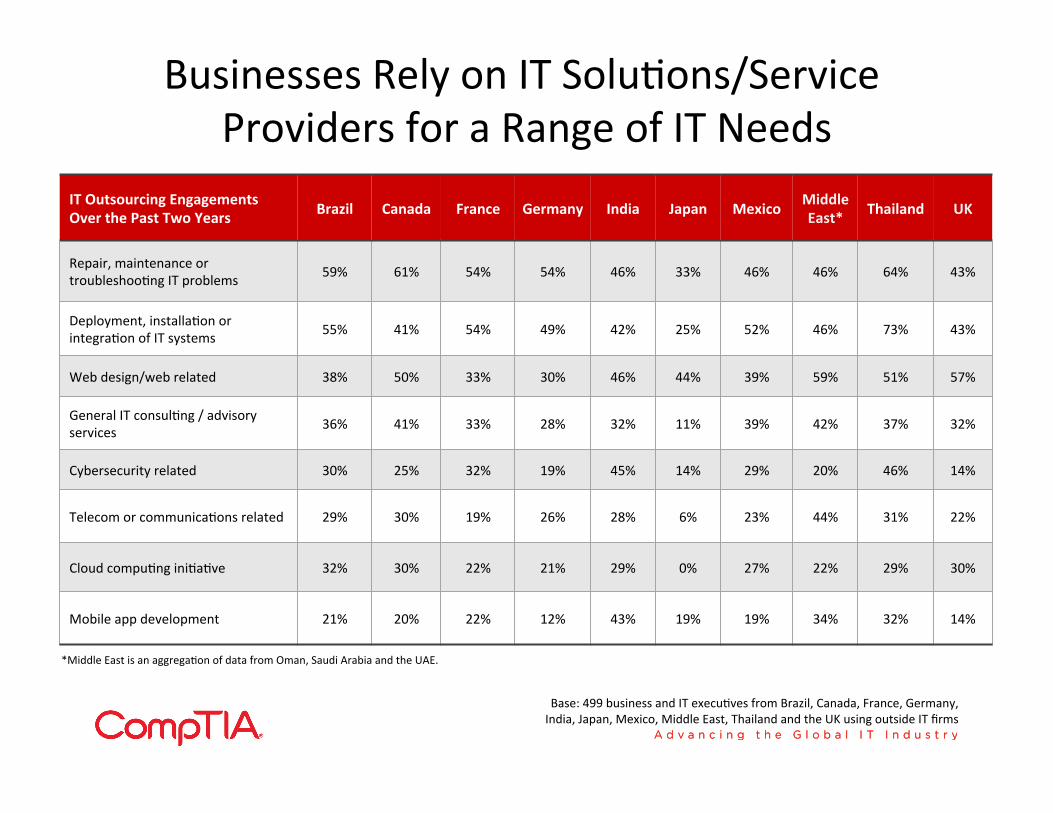
Businesses Rely on IT SoluSons/Service Providers for a Range of IT Needs
IT Outsourcing Engagements Over the Past Two Years
Brazil Canada France Germany India Japan Mexico Middle East* Thailand UK
Repair, maintenance or troubleshooSng IT problems 59% 61% 54% 54% 46% 33% 46% 46% 64% 43%
Deployment, installaSon or integraSon of IT systems 55% 41% 54% 49% 42% 25% 52% 46% 73% 43%
Web design/web related 38% 50% 33% 30% 46% 44% 39% 59% 51% 57%
General IT consulSng / advisory services 36% 41% 33% 28% 32% 11% 39% 42% 37% 32%
Cybersecurity related 30% 25% 32% 19% 45% 14% 29% 20% 46% 14%
Telecom or communicaSons related 29% 30% 19% 26% 28% 6% 23% 44% 31% 22%
Cloud compuSng iniSaSve 32% 30% 22% 21% 29% 0% 27% 22% 29% 30%
Mobile app development 21% 20% 22% 12% 43% 19% 19% 34% 32% 14%
Base: 499 business and IT execuSves from Brazil, Canada, France, Germany, India, Japan, Mexico, Middle East, Thailand and the UK using outside IT firms
*Middle East is an aggregaSon of data from Oman, Saudi Arabia and the UAE.
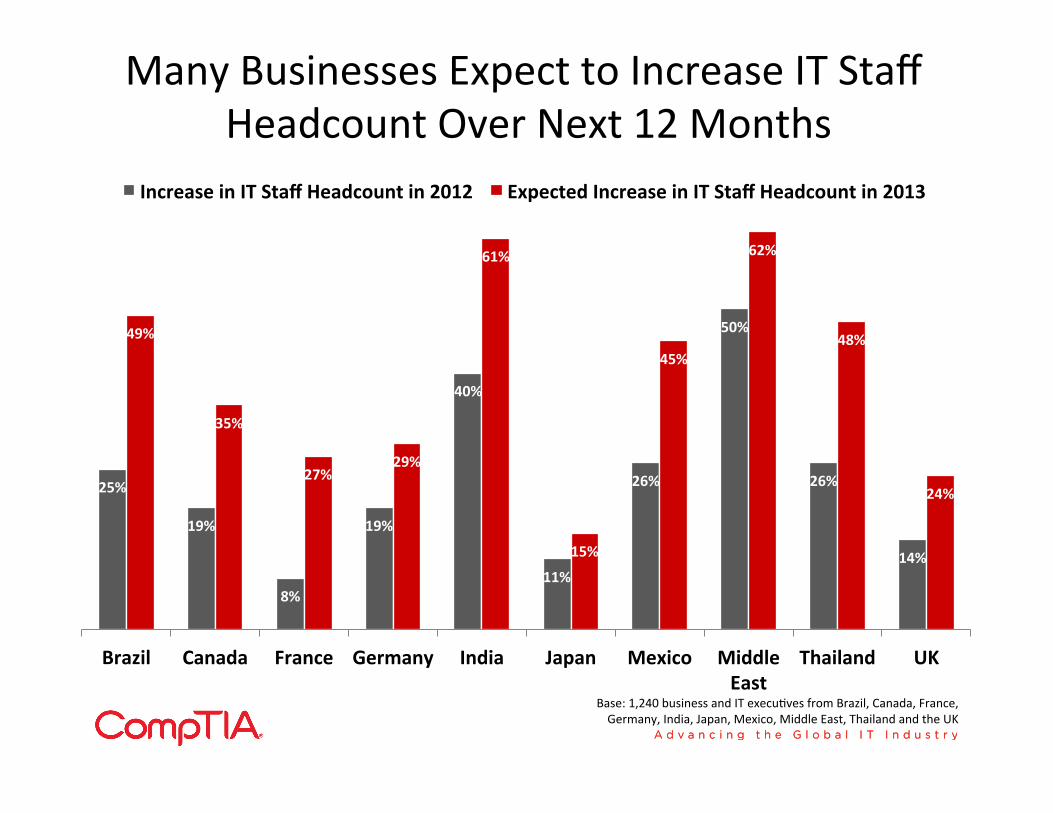
Many Businesses Expect to Increase IT Staff Headcount Over Next 12 Months
25%
19%
8%
19%
40%
11%
26%
50%
26%
14%
49%
35%
27% 29%
61%
15%
45%
62%
48%
24%
Brazil Canada France Germany India Japan Mexico Middle East
Thailand UK
Increase in IT Staff Headcount in 2012 Expected Increase in IT Staff Headcount in 2013
Base: 1,240 business and IT execuSves from Brazil, Canada, France, Germany, India, Japan, Mexico, Middle East, Thailand and the UK
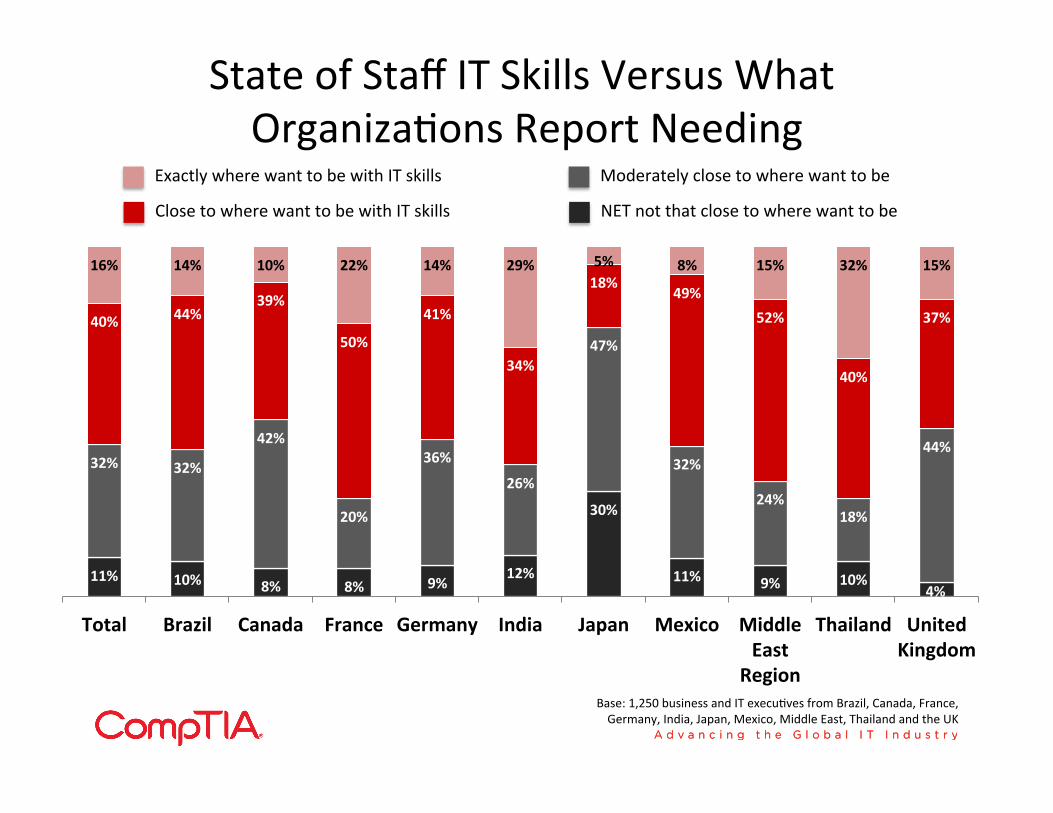
State of Staff IT Skills Versus What OrganizaSons Report Needing
11% 10% 8% 8% 9% 12%
30%
11% 9% 10% 4%
32% 32%
42%
20%
36%
26%
47%
32%
24% 18%
44%
40% 44% 39%
50%
41%
34%
18% 49%
52%
40%
37%
16% 14% 10% 22% 14% 29% 5% 8% 15% 32% 15%
Total Brazil Canada France Germany India Japan Mexico Middle East
Region
Thailand United Kingdom
Base: 1,250 business and IT execuSves from Brazil, Canada, France, Germany, India, Japan, Mexico, Middle East, Thailand and the UK
Exactly where want to be with IT skills
Close to where want to be with IT skills
Moderately close to where want to be
NET not that close to where want to be
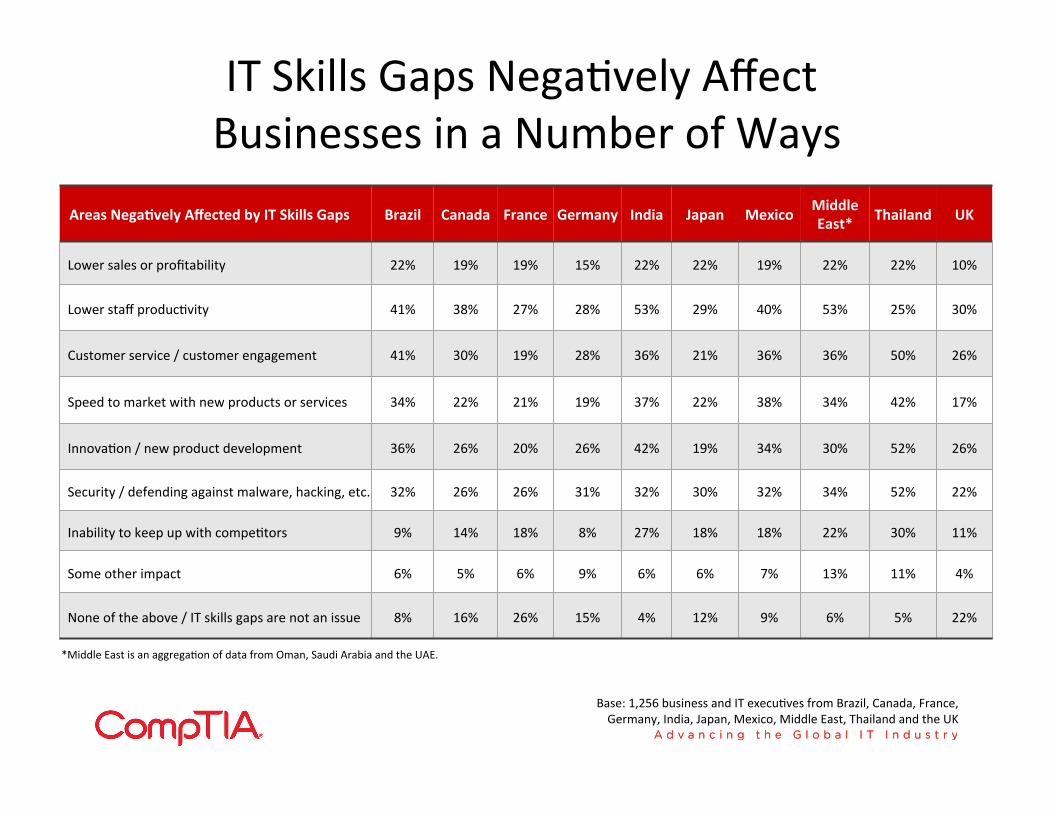
Areas NegaAvely Affected by IT Skills Gaps Brazil Canada France Germany India Japan Mexico Middle East* Thailand UK
Lower sales or profitability 22% 19% 19% 15% 22% 22% 19% 22% 22% 10%
Lower staff producSvity 41% 38% 27% 28% 53% 29% 40% 53% 25% 30%
Customer service / customer engagement 41% 30% 19% 28% 36% 21% 36% 36% 50% 26%
Speed to market with new products or services 34% 22% 21% 19% 37% 22% 38% 34% 42% 17%
InnovaSon / new product development 36% 26% 20% 26% 42% 19% 34% 30% 52% 26%
Security / defending against malware, hacking, etc. 32% 26% 26% 31% 32% 30% 32% 34% 52% 22%
Inability to keep up with compeStors 9% 14% 18% 8% 27% 18% 18% 22% 30% 11%
Some other impact 6% 5% 6% 9% 6% 6% 7% 13% 11% 4%
None of the above / IT skills gaps are not an issue 8% 16% 26% 15% 4% 12% 9% 6% 5% 22%
Base: 1,256 business and IT execuSves from Brazil, Canada, France, Germany, India, Japan, Mexico, Middle East, Thailand and the UK
IT Skills Gaps NegaSvely Affect Businesses in a Number of Ways
*Middle East is an aggregaSon of data from Oman, Saudi Arabia and the UAE.

Maturing Economy Businesses Report Greater NegaSve Effects of IT Skills Gaps
16%
13%
26%
20%
25%
26%
31%
21%
21%
36%
37%
39%
40%
42%
Lower sales or profitability
Inability to keep up with compeStors
Security / defending against malware, hacking, etc.
Speed to market with new products or services
InnovaSon / new product development
Customer service / customer engagement
Lower staff producSvity
Maturing Economies Mature Economies
Mature Economies Group: Canada, France, Germany and the UK Maturing Economies Group: Brazil, India, Mexico, Middle East and Thailand
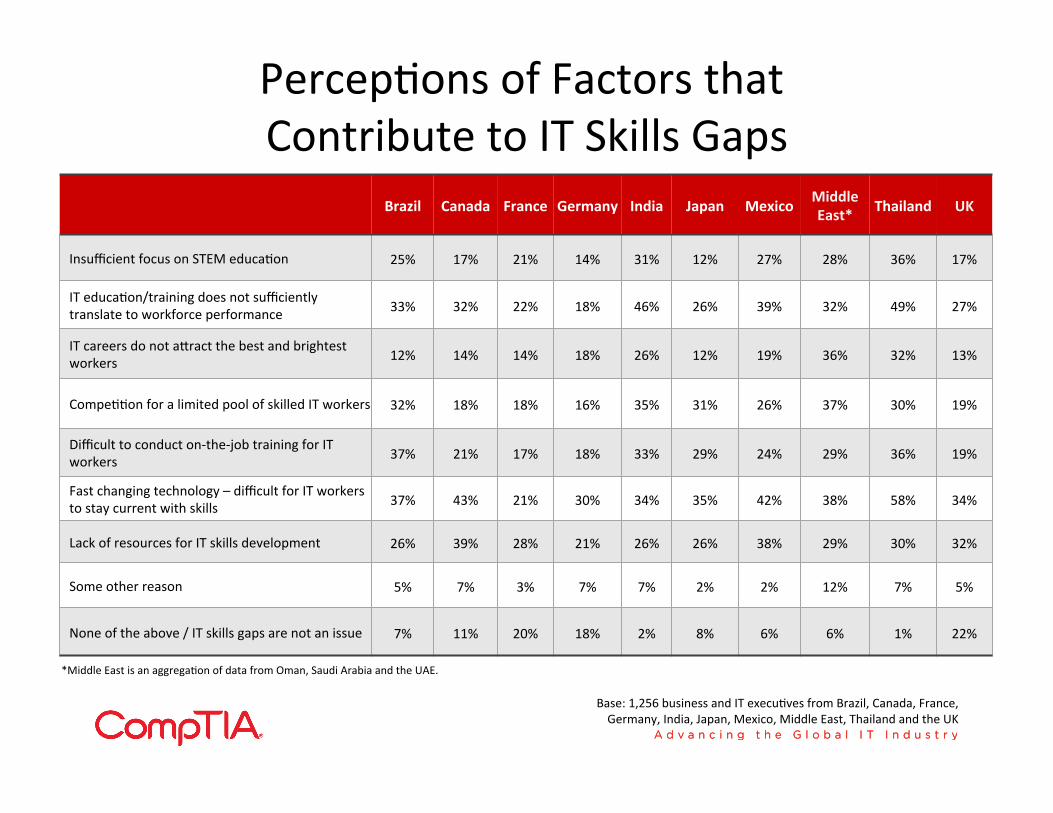
Brazil Canada France Germany India Japan Mexico Middle East* Thailand UK
Insufficient focus on STEM educaSon 25% 17% 21% 14% 31% 12% 27% 28% 36% 17%
IT educaSon/training does not sufficiently translate to workforce performance 33% 32% 22% 18% 46% 26% 39% 32% 49% 27%
IT careers do not asract the best and brightest workers 12% 14% 14% 18% 26% 12% 19% 36% 32% 13%
CompeSSon for a limited pool of skilled IT workers 32% 18% 18% 16% 35% 31% 26% 37% 30% 19%
Difficult to conduct on-‐the-‐job training for IT workers 37% 21% 17% 18% 33% 29% 24% 29% 36% 19%
Fast changing technology – difficult for IT workers to stay current with skills 37% 43% 21% 30% 34% 35% 42% 38% 58% 34%
Lack of resources for IT skills development 26% 39% 28% 21% 26% 26% 38% 29% 30% 32%
Some other reason 5% 7% 3% 7% 7% 2% 2% 12% 7% 5%
None of the above / IT skills gaps are not an issue 7% 11% 20% 18% 2% 8% 6% 6% 1% 22%
Base: 1,256 business and IT execuSves from Brazil, Canada, France, Germany, India, Japan, Mexico, Middle East, Thailand and the UK
PercepSons of Factors that Contribute to IT Skills Gaps
*Middle East is an aggregaSon of data from Oman, Saudi Arabia and the UAE.
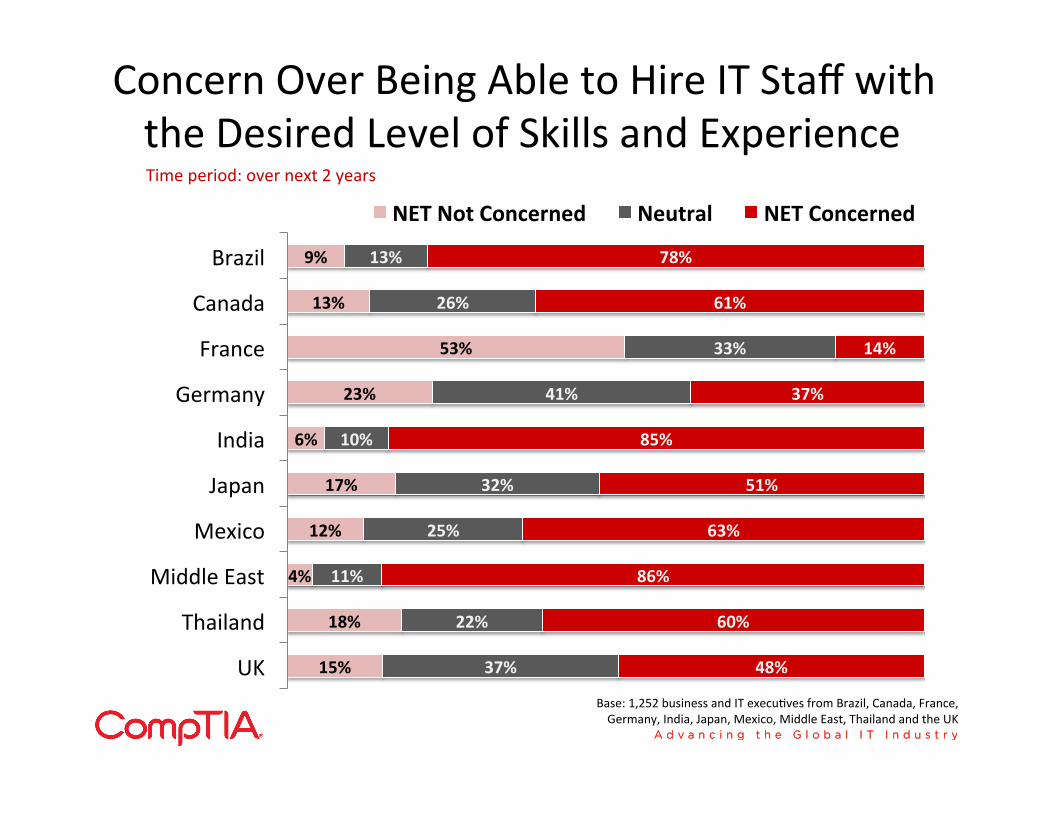
15%
18%
4%
12%
17%
6%
23%
53%
13%
9%
37%
22%
11%
25%
32%
10%
41%
33%
26%
13%
48%
60%
86%
63%
51%
85%
37%
14%
61%
78%
UK
Thailand
Middle East
Mexico
Japan
India
Germany
France
Canada
Brazil
NET Not Concerned Neutral NET Concerned
Base: 1,252 business and IT execuSves from Brazil, Canada, France, Germany, India, Japan, Mexico, Middle East, Thailand and the UK
Concern Over Being Able to Hire IT Staff with the Desired Level of Skills and Experience Time period: over next 2 years
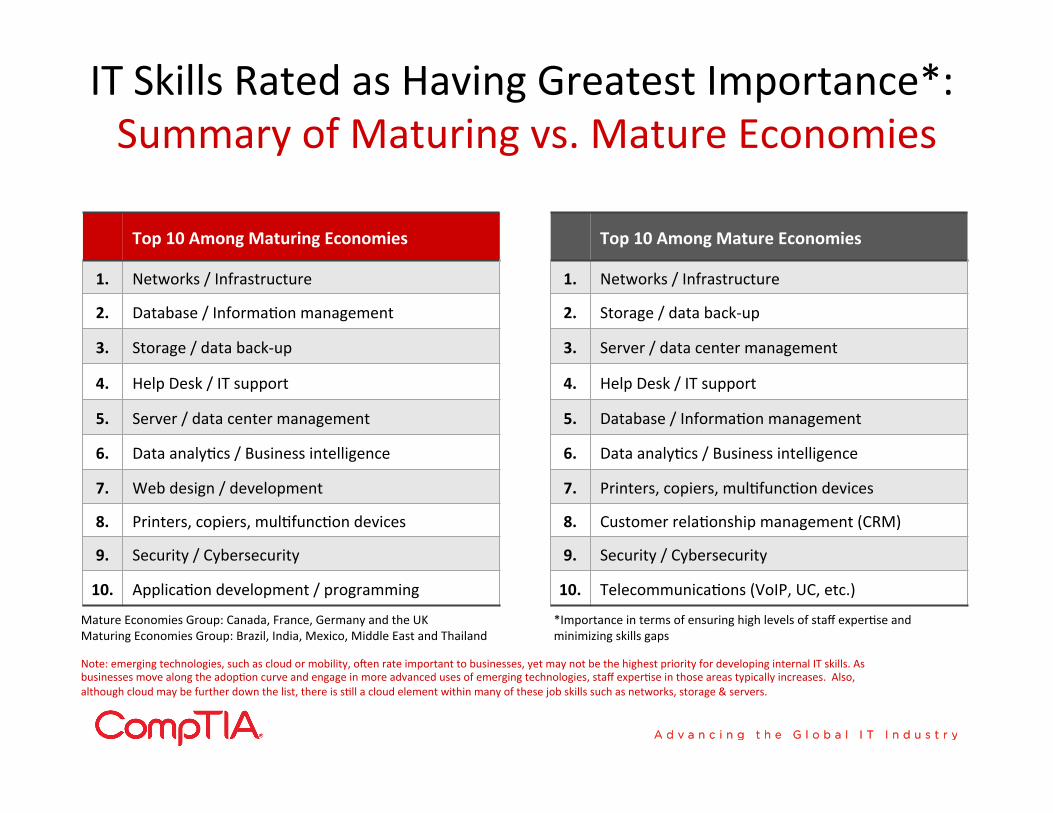
Top 10 Among Maturing Economies
1. Networks / Infrastructure
2. Database / InformaSon management
3. Storage / data back-‐up
4. Help Desk / IT support
5. Server / data center management
6. Data analyScs / Business intelligence
7. Web design / development
8. Printers, copiers, mulSfuncSon devices
9. Security / Cybersecurity
10. ApplicaSon development / programming
IT Skills Rated as Having Greatest Importance*: Summary of Maturing vs. Mature Economies
Top 10 Among Mature Economies
1. Networks / Infrastructure
2. Storage / data back-‐up
3. Server / data center management
4. Help Desk / IT support
5. Database / InformaSon management
6. Data analyScs / Business intelligence
7. Printers, copiers, mulSfuncSon devices
8. Customer relaSonship management (CRM)
9. Security / Cybersecurity
10. TelecommunicaSons (VoIP, UC, etc.)
Mature Economies Group: Canada, France, Germany and the UK Maturing Economies Group: Brazil, India, Mexico, Middle East and Thailand
*Importance in terms of ensuring high levels of staff experSse and minimizing skills gaps
Note: emerging technologies, such as cloud or mobility, o]en rate important to businesses, yet may not be the highest priority for developing internal IT skills. As businesses move along the adopSon curve and engage in more advanced uses of emerging technologies, staff experSse in those areas typically increases. Also, although cloud may be further down the list, there is sSll a cloud element within many of these job skills such as networks, storage & servers.
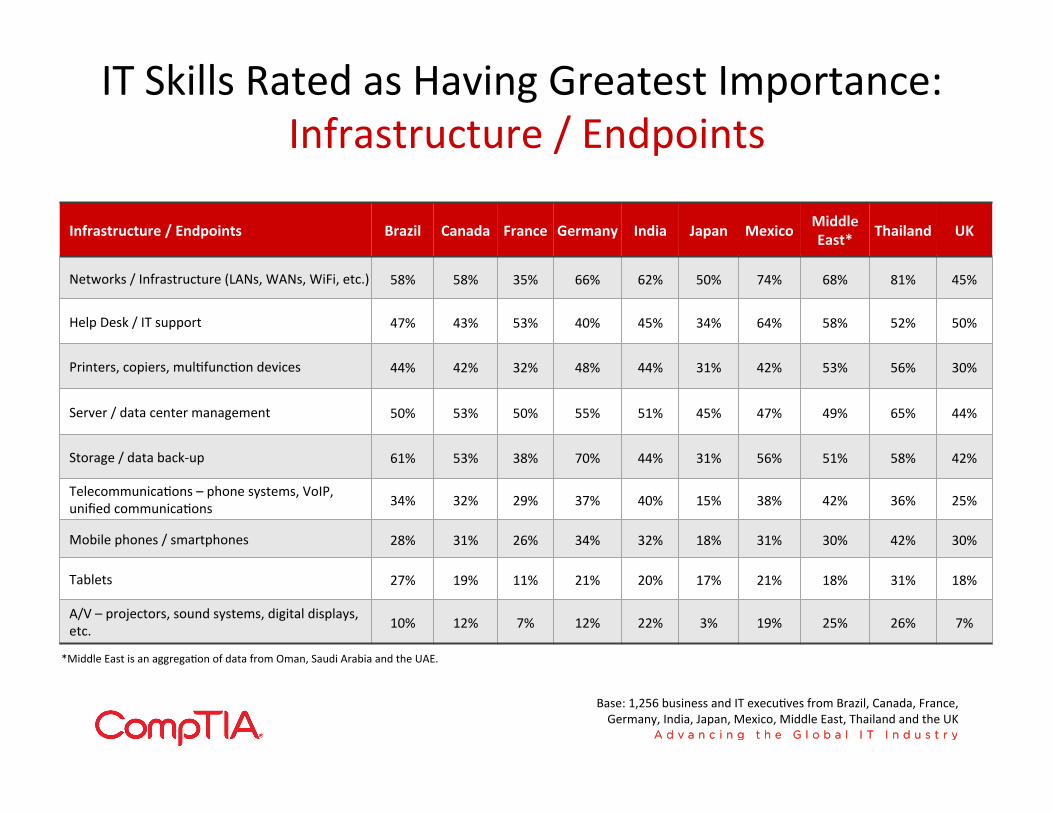
Infrastructure / Endpoints Brazil Canada France Germany India Japan Mexico Middle East* Thailand UK
Networks / Infrastructure (LANs, WANs, WiFi, etc.) 58% 58% 35% 66% 62% 50% 74% 68% 81% 45%
Help Desk / IT support 47% 43% 53% 40% 45% 34% 64% 58% 52% 50%
Printers, copiers, mulSfuncSon devices 44% 42% 32% 48% 44% 31% 42% 53% 56% 30%
Server / data center management 50% 53% 50% 55% 51% 45% 47% 49% 65% 44%
Storage / data back-‐up 61% 53% 38% 70% 44% 31% 56% 51% 58% 42%
TelecommunicaSons – phone systems, VoIP, unified communicaSons 34% 32% 29% 37% 40% 15% 38% 42% 36% 25%
Mobile phones / smartphones 28% 31% 26% 34% 32% 18% 31% 30% 42% 30%
Tablets 27% 19% 11% 21% 20% 17% 21% 18% 31% 18%
A/V – projectors, sound systems, digital displays, etc. 10% 12% 7% 12% 22% 3% 19% 25% 26% 7%
Base: 1,256 business and IT execuSves from Brazil, Canada, France, Germany, India, Japan, Mexico, Middle East, Thailand and the UK
IT Skills Rated as Having Greatest Importance: Infrastructure / Endpoints
*Middle East is an aggregaSon of data from Oman, Saudi Arabia and the UAE.
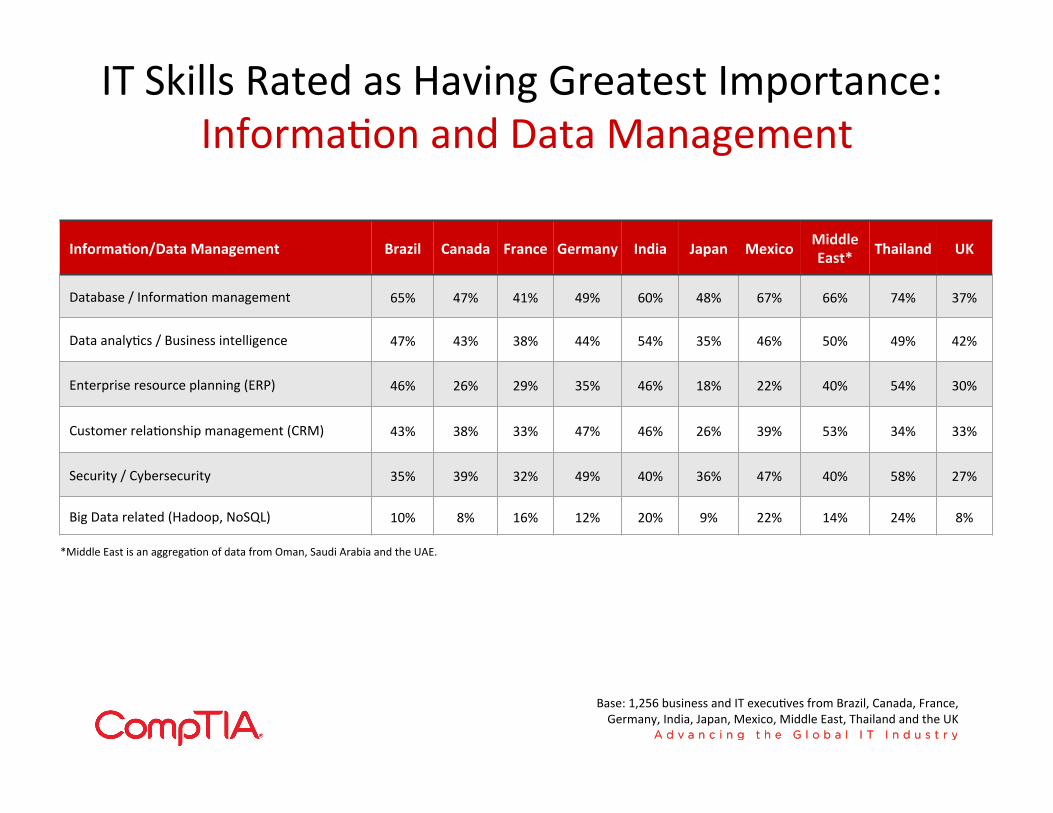
InformaAon/Data Management Brazil Canada France Germany India Japan Mexico Middle East* Thailand UK
Database / InformaSon management 65% 47% 41% 49% 60% 48% 67% 66% 74% 37%
Data analyScs / Business intelligence 47% 43% 38% 44% 54% 35% 46% 50% 49% 42%
Enterprise resource planning (ERP) 46% 26% 29% 35% 46% 18% 22% 40% 54% 30%
Customer relaSonship management (CRM) 43% 38% 33% 47% 46% 26% 39% 53% 34% 33%
Security / Cybersecurity 35% 39% 32% 49% 40% 36% 47% 40% 58% 27%
Big Data related (Hadoop, NoSQL) 10% 8% 16% 12% 20% 9% 22% 14% 24% 8%
Base: 1,256 business and IT execuSves from Brazil, Canada, France, Germany, India, Japan, Mexico, Middle East, Thailand and the UK
*Middle East is an aggregaSon of data from Oman, Saudi Arabia and the UAE.
IT Skills Rated as Having Greatest Importance: InformaSon and Data Management
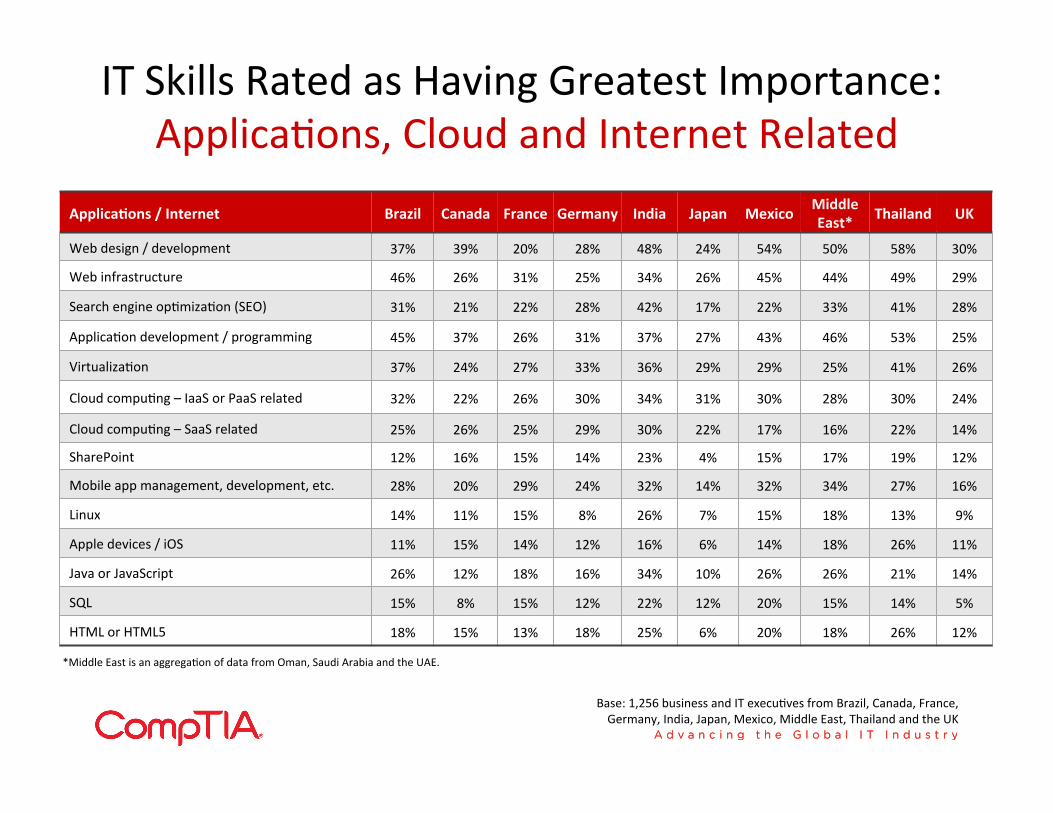
ApplicaAons / Internet Brazil Canada France Germany India Japan Mexico Middle East* Thailand UK
Web design / development 37% 39% 20% 28% 48% 24% 54% 50% 58% 30%
Web infrastructure 46% 26% 31% 25% 34% 26% 45% 44% 49% 29%
Search engine opSmizaSon (SEO) 31% 21% 22% 28% 42% 17% 22% 33% 41% 28%
ApplicaSon development / programming 45% 37% 26% 31% 37% 27% 43% 46% 53% 25%
VirtualizaSon 37% 24% 27% 33% 36% 29% 29% 25% 41% 26%
Cloud compuSng – IaaS or PaaS related 32% 22% 26% 30% 34% 31% 30% 28% 30% 24%
Cloud compuSng – SaaS related 25% 26% 25% 29% 30% 22% 17% 16% 22% 14%
SharePoint 12% 16% 15% 14% 23% 4% 15% 17% 19% 12%
Mobile app management, development, etc. 28% 20% 29% 24% 32% 14% 32% 34% 27% 16%
Linux 14% 11% 15% 8% 26% 7% 15% 18% 13% 9%
Apple devices / iOS 11% 15% 14% 12% 16% 6% 14% 18% 26% 11%
Java or JavaScript 26% 12% 18% 16% 34% 10% 26% 26% 21% 14%
SQL 15% 8% 15% 12% 22% 12% 20% 15% 14% 5%
HTML or HTML5 18% 15% 13% 18% 25% 6% 20% 18% 26% 12%
Base: 1,256 business and IT execuSves from Brazil, Canada, France, Germany, India, Japan, Mexico, Middle East, Thailand and the UK
*Middle East is an aggregaSon of data from Oman, Saudi Arabia and the UAE.
IT Skills Rated as Having Greatest Importance: ApplicaSons, Cloud and Internet Related
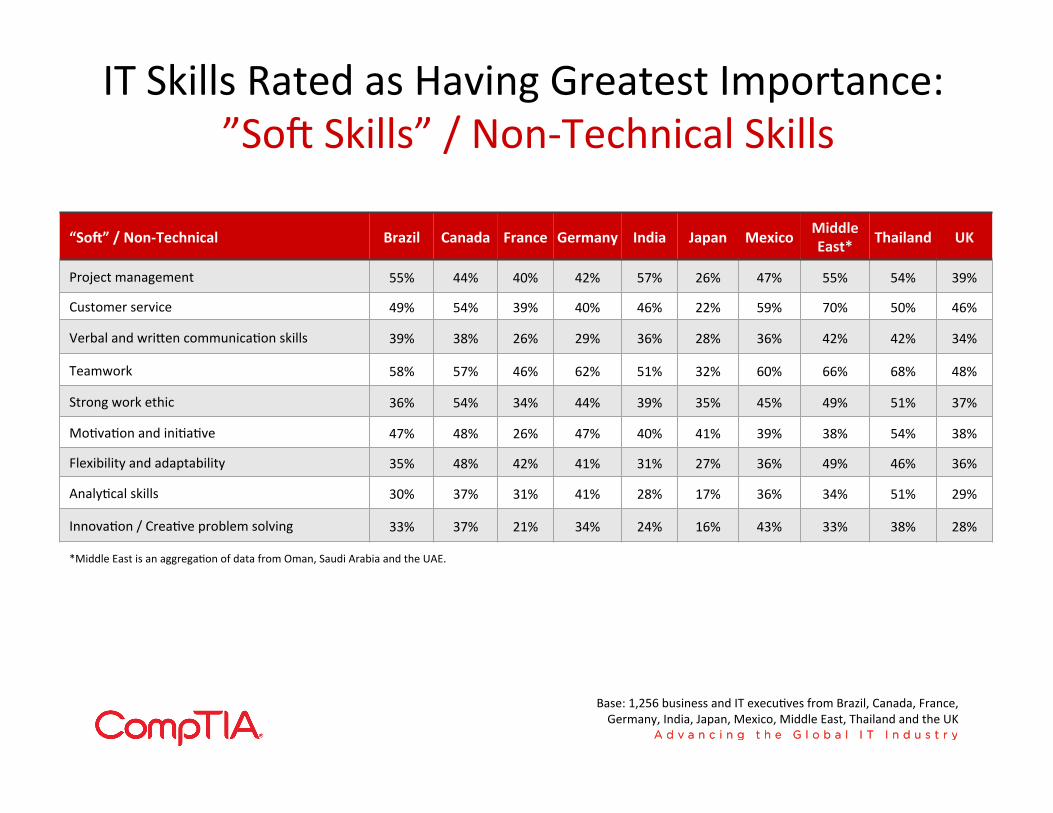
“Sof” / Non-‐Technical Brazil Canada France Germany India Japan Mexico Middle East* Thailand UK
Project management 55% 44% 40% 42% 57% 26% 47% 55% 54% 39%
Customer service 49% 54% 39% 40% 46% 22% 59% 70% 50% 46%
Verbal and wrisen communicaSon skills 39% 38% 26% 29% 36% 28% 36% 42% 42% 34%
Teamwork 58% 57% 46% 62% 51% 32% 60% 66% 68% 48%
Strong work ethic 36% 54% 34% 44% 39% 35% 45% 49% 51% 37%
MoSvaSon and iniSaSve 47% 48% 26% 47% 40% 41% 39% 38% 54% 38%
Flexibility and adaptability 35% 48% 42% 41% 31% 27% 36% 49% 46% 36%
AnalyScal skills 30% 37% 31% 41% 28% 17% 36% 34% 51% 29%
InnovaSon / CreaSve problem solving 33% 37% 21% 34% 24% 16% 43% 33% 38% 28%
Base: 1,256 business and IT execuSves from Brazil, Canada, France, Germany, India, Japan, Mexico, Middle East, Thailand and the UK
*Middle East is an aggregaSon of data from Oman, Saudi Arabia and the UAE.
IT Skills Rated as Having Greatest Importance: ”So] Skills” / Non-‐Technical Skills
SecSon 5 – IT Training & CerSficaSon
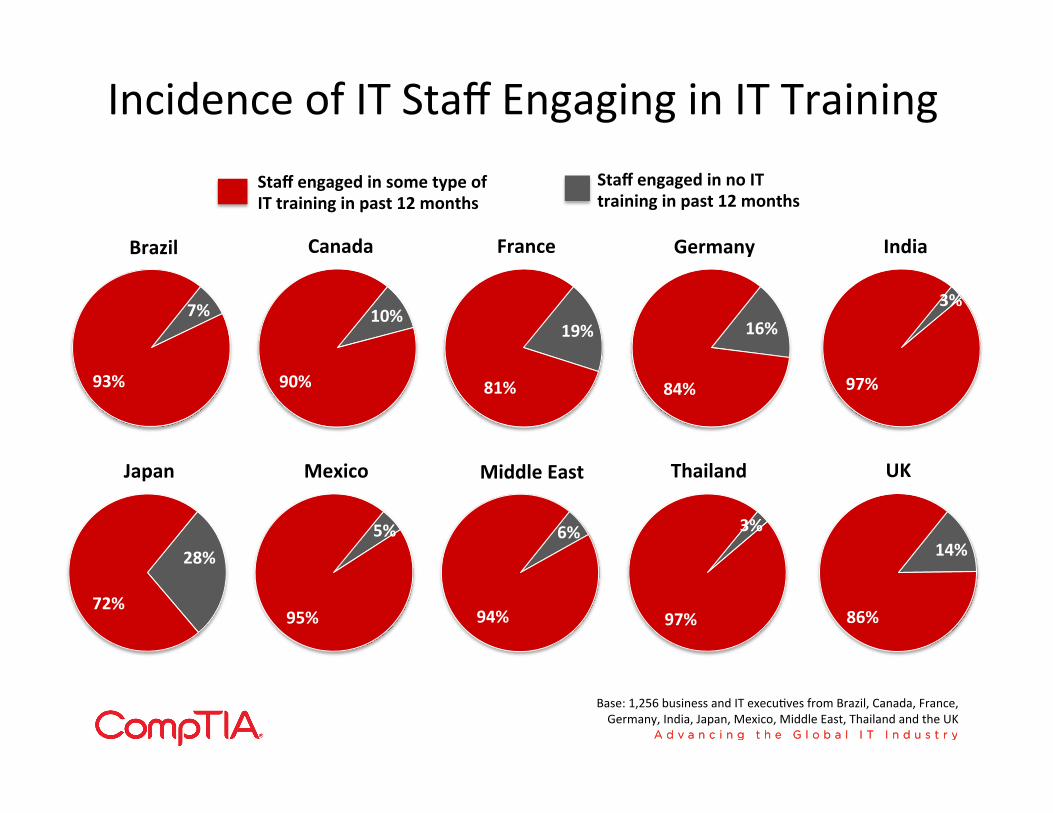
Incidence of IT Staff Engaging in IT Training
7%
93%
10%
90%
19%
81%
16%
84%
3%
97%
28%
72%
5%
95%
6%
94%
3%
97%
14%
86%
Base: 1,256 business and IT execuSves from Brazil, Canada, France, Germany, India, Japan, Mexico, Middle East, Thailand and the UK
Staff engaged in some type of IT training in past 12 months
Brazil Canada France Germany India
Japan Mexico Middle East Thailand UK
Staff engaged in no IT training in past 12 months
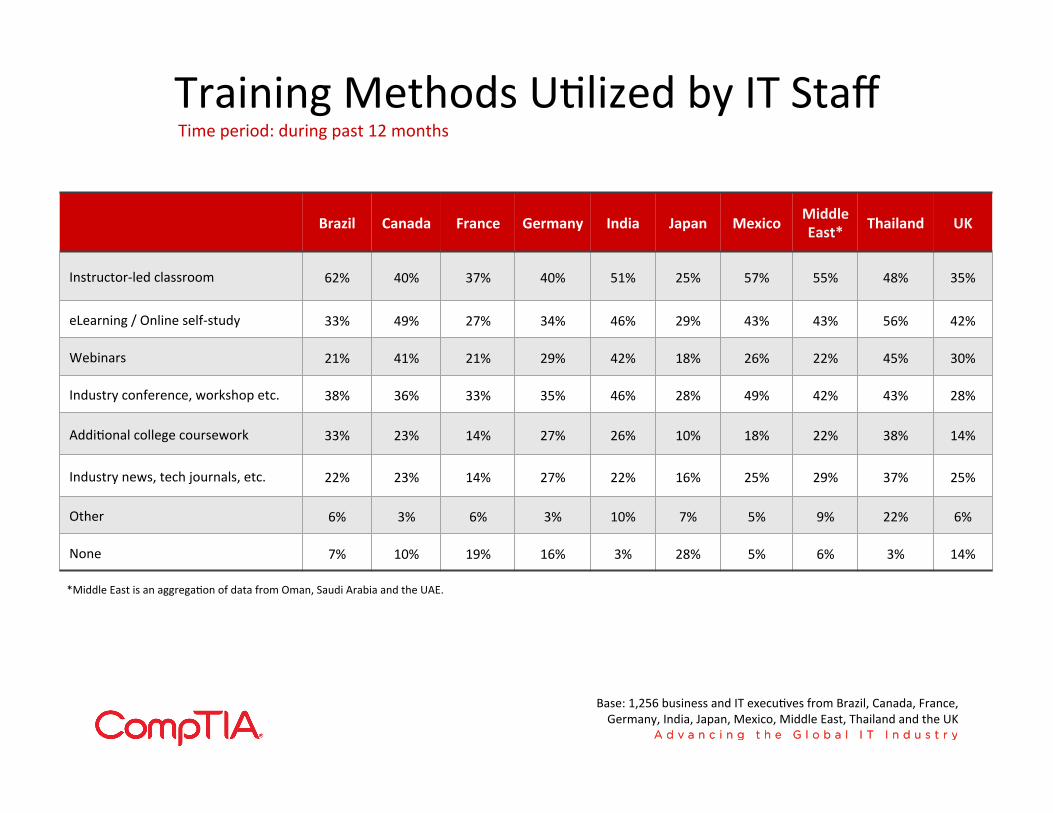
Training Methods USlized by IT Staff
Brazil Canada France Germany India Japan Mexico Middle East* Thailand UK
Instructor-‐led classroom 62% 40% 37% 40% 51% 25% 57% 55% 48% 35%
eLearning / Online self-‐study 33% 49% 27% 34% 46% 29% 43% 43% 56% 42%
Webinars 21% 41% 21% 29% 42% 18% 26% 22% 45% 30%
Industry conference, workshop etc. 38% 36% 33% 35% 46% 28% 49% 42% 43% 28%
AddiSonal college coursework 33% 23% 14% 27% 26% 10% 18% 22% 38% 14%
Industry news, tech journals, etc. 22% 23% 14% 27% 22% 16% 25% 29% 37% 25%
Other 6% 3% 6% 3% 10% 7% 5% 9% 22% 6%
None 7% 10% 19% 16% 3% 28% 5% 6% 3% 14%
Base: 1,256 business and IT execuSves from Brazil, Canada, France, Germany, India, Japan, Mexico, Middle East, Thailand and the UK
*Middle East is an aggregaSon of data from Oman, Saudi Arabia and the UAE.
Time period: during past 12 months
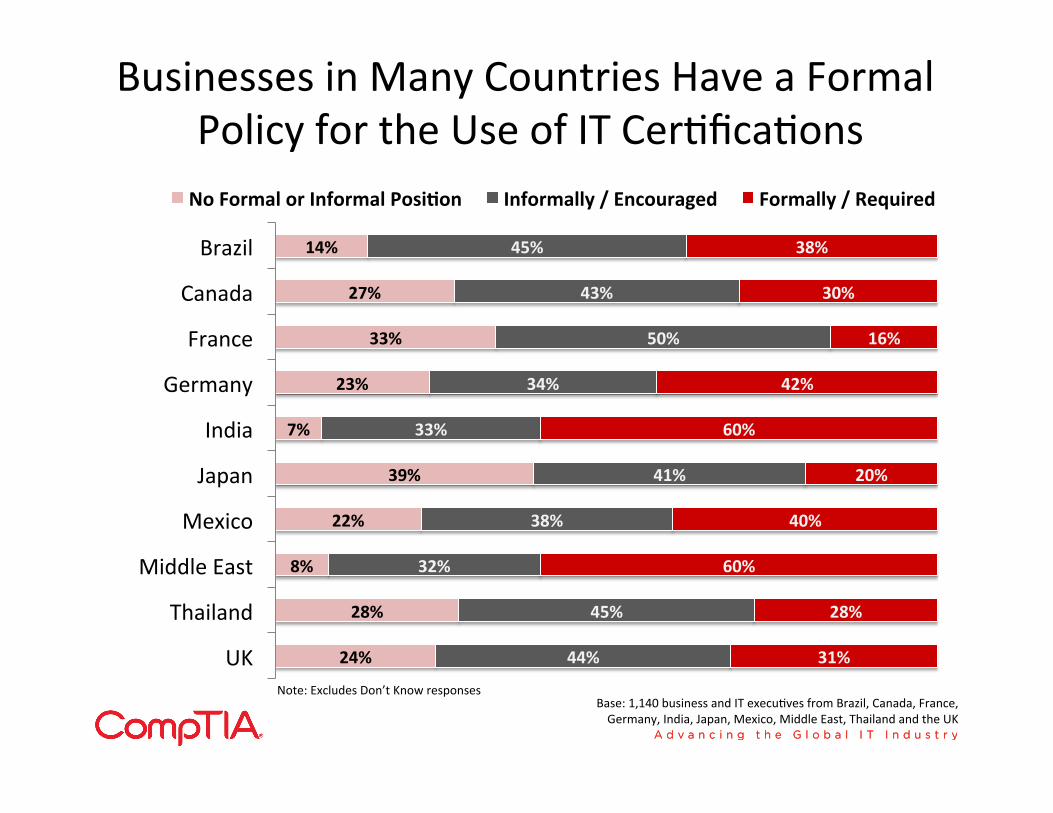
Businesses in Many Countries Have a Formal Policy for the Use of IT CerSficaSons
24%
28%
8%
22%
39%
7%
23%
33%
27%
14%
44%
45%
32%
38%
41%
33%
34%
50%
43%
45%
31%
28%
60%
40%
20%
60%
42%
16%
30%
38%
UK
Thailand
Middle East
Mexico
Japan
India
Germany
France
Canada
Brazil
No Formal or Informal PosiAon Informally / Encouraged Formally / Required
Note: Excludes Don’t Know responses Base: 1,140 business and IT execuSves from Brazil, Canada, France, Germany, India, Japan, Mexico, Middle East, Thailand and the UK
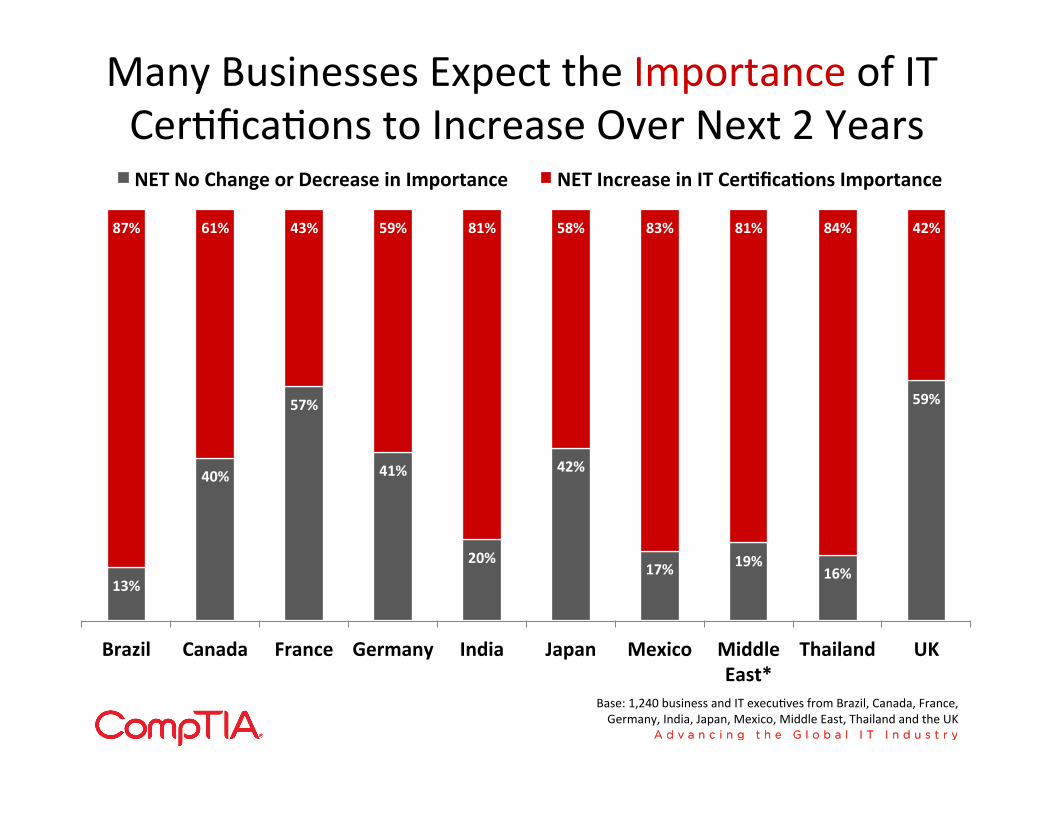
Many Businesses Expect the Importance of IT CerSficaSons to Increase Over Next 2 Years
13%
40%
57%
41%
20%
42%
17% 19% 16%
59%
87% 61% 43% 59% 81% 58% 83% 81% 84% 42%
Brazil Canada France Germany India Japan Mexico Middle East*
Thailand UK
NET No Change or Decrease in Importance NET Increase in IT CerAficaAons Importance
Base: 1,240 business and IT execuSves from Brazil, Canada, France, Germany, India, Japan, Mexico, Middle East, Thailand and the UK
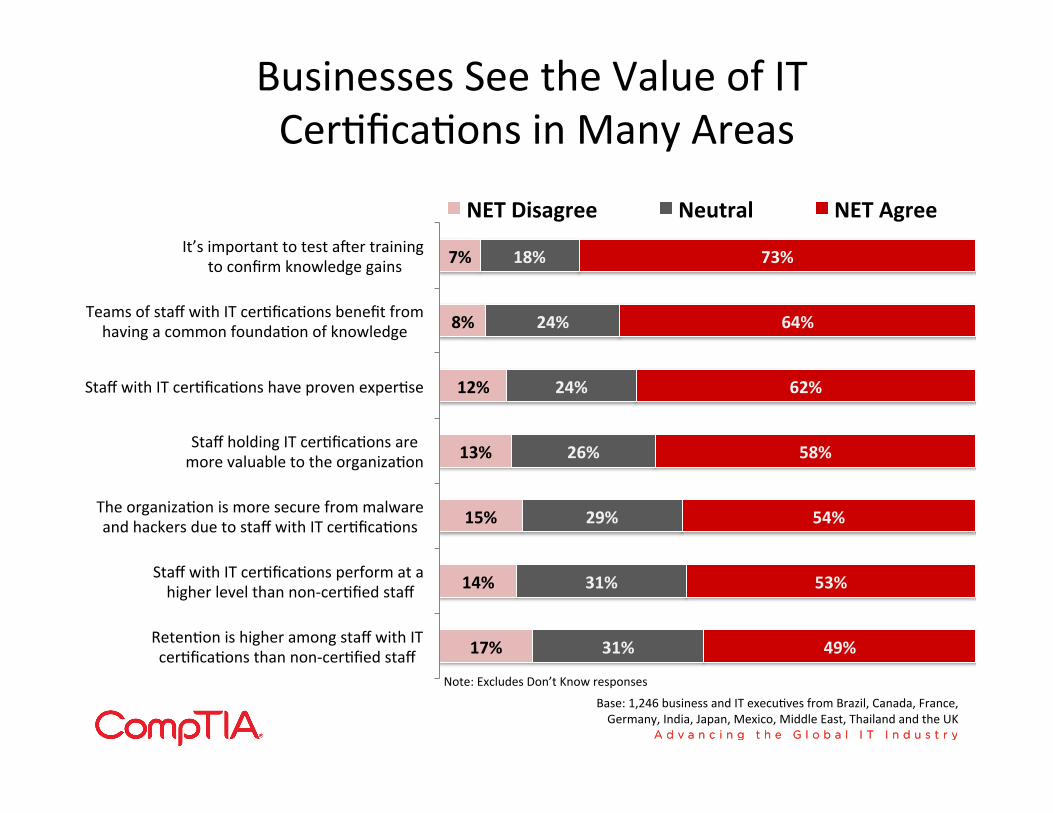
Businesses See the Value of IT CerSficaSons in Many Areas
17%
14%
15%
13%
12%
8%
7%
31%
31%
29%
26%
24%
24%
18%
49%
53%
54%
58%
62%
64%
73%
RetenSon is higher among staff with IT cerSficaSons than non-‐cerSfied staff
Staff with IT cerSficaSons perform at a higher level than non-‐cerSfied staff
The organizaSon is more secure from malware and hackers due to staff with IT cerSficaSons
Staff holding IT cerSficaSons are more valuable to the organizaSon
Staff with IT cerSficaSons have proven experSse
Teams of staff with IT cerSficaSons benefit from having a common foundaSon of knowledge
It’s important to test a]er training to confirm knowledge gains
NET Disagree Neutral NET Agree
Note: Excludes Don’t Know responses
Base: 1,246 business and IT execuSves from Brazil, Canada, France, Germany, India, Japan, Mexico, Middle East, Thailand and the UK
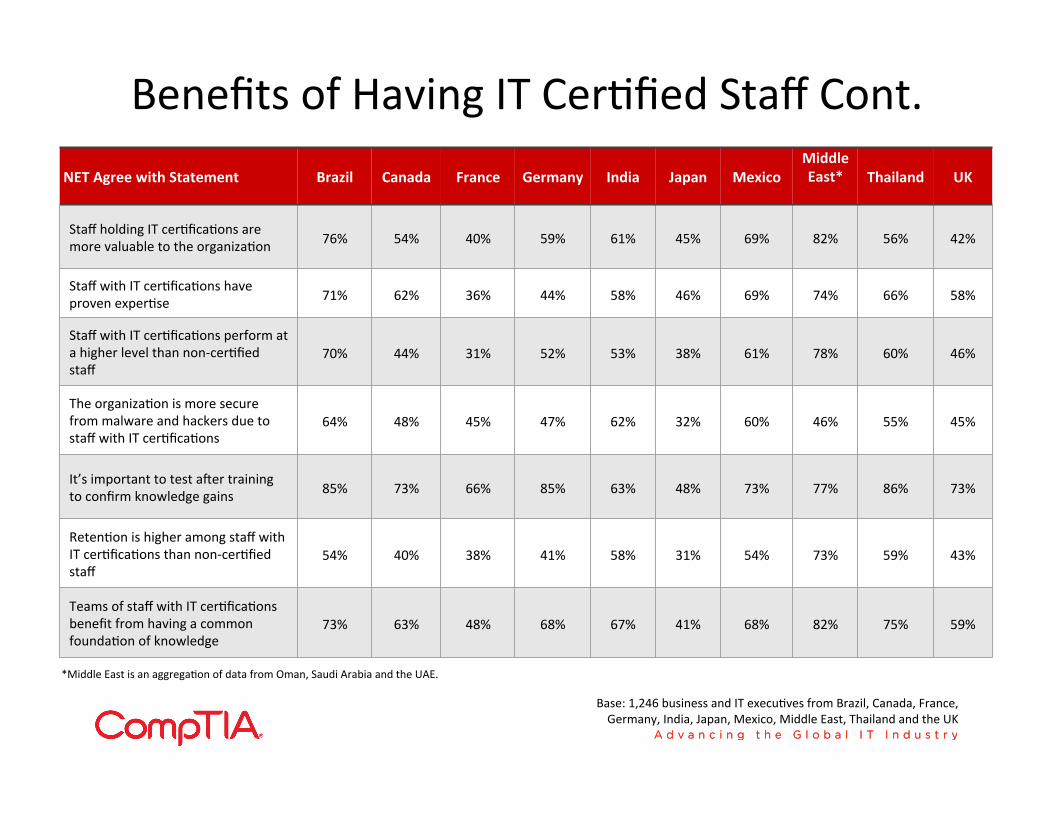
Benefits of Having IT CerSfied Staff Cont. NET Agree with Statement Brazil Canada France Germany India Japan Mexico
Middle East*
Thailand UK
Staff holding IT cerSficaSons are more valuable to the organizaSon 76% 54% 40% 59% 61% 45% 69% 82% 56% 42%
Staff with IT cerSficaSons have proven experSse 71% 62% 36% 44% 58% 46% 69% 74% 66% 58%
Staff with IT cerSficaSons perform at a higher level than non-‐cerSfied staff
70% 44% 31% 52% 53% 38% 61% 78% 60% 46%
The organizaSon is more secure from malware and hackers due to staff with IT cerSficaSons
64% 48% 45% 47% 62% 32% 60% 46% 55% 45%
It’s important to test a]er training to confirm knowledge gains 85% 73% 66% 85% 63% 48% 73% 77% 86% 73%
RetenSon is higher among staff with IT cerSficaSons than non-‐cerSfied staff
54% 40% 38% 41% 58% 31% 54% 73% 59% 43%
Teams of staff with IT cerSficaSons benefit from having a common foundaSon of knowledge
73% 63% 48% 68% 67% 41% 68% 82% 75% 59%
Base: 1,246 business and IT execuSves from Brazil, Canada, France, Germany, India, Japan, Mexico, Middle East, Thailand and the UK
*Middle East is an aggregaSon of data from Oman, Saudi Arabia and the UAE.
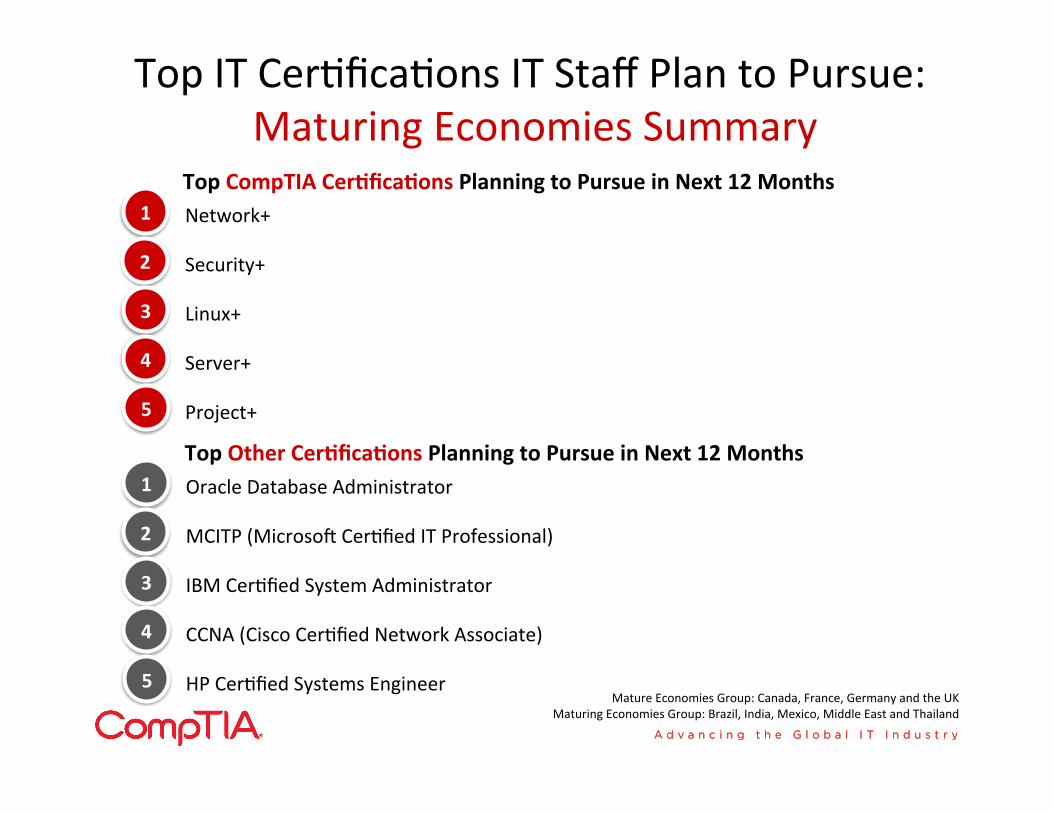
Top IT CerSficaSons IT Staff Plan to Pursue: Maturing Economies Summary
Network+
Security+
Linux+
Server+
Project+
1
2
3
4
5
Top CompTIA CerAficaAons Planning to Pursue in Next 12 Months
Oracle Database Administrator
MCITP (Microso] CerSfied IT Professional)
IBM CerSfied System Administrator
CCNA (Cisco CerSfied Network Associate)
HP CerSfied Systems Engineer
1
2
3
4
5
Top Other CerAficaAons Planning to Pursue in Next 12 Months
Mature Economies Group: Canada, France, Germany and the UK Maturing Economies Group: Brazil, India, Mexico, Middle East and Thailand
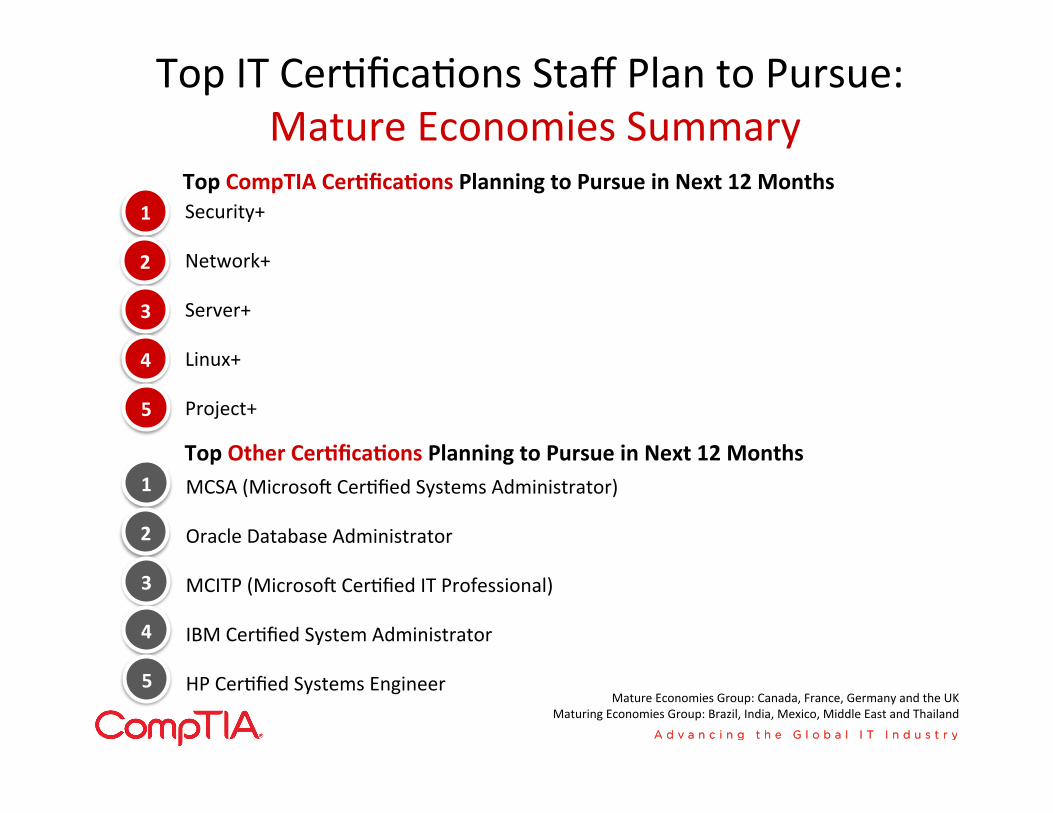
Top IT CerSficaSons Staff Plan to Pursue: Mature Economies Summary
Security+
Network+
Server+
Linux+
Project+
1
2
3
4
5
Top CompTIA CerAficaAons Planning to Pursue in Next 12 Months
MCSA (Microso] CerSfied Systems Administrator)
Oracle Database Administrator
MCITP (Microso] CerSfied IT Professional)
IBM CerSfied System Administrator
HP CerSfied Systems Engineer
1
2
3
4
5
Top Other CerAficaAons Planning to Pursue in Next 12 Months
Mature Economies Group: Canada, France, Germany and the UK Maturing Economies Group: Brazil, India, Mexico, Middle East and Thailand
Appendix
U.S. Member Profile
65
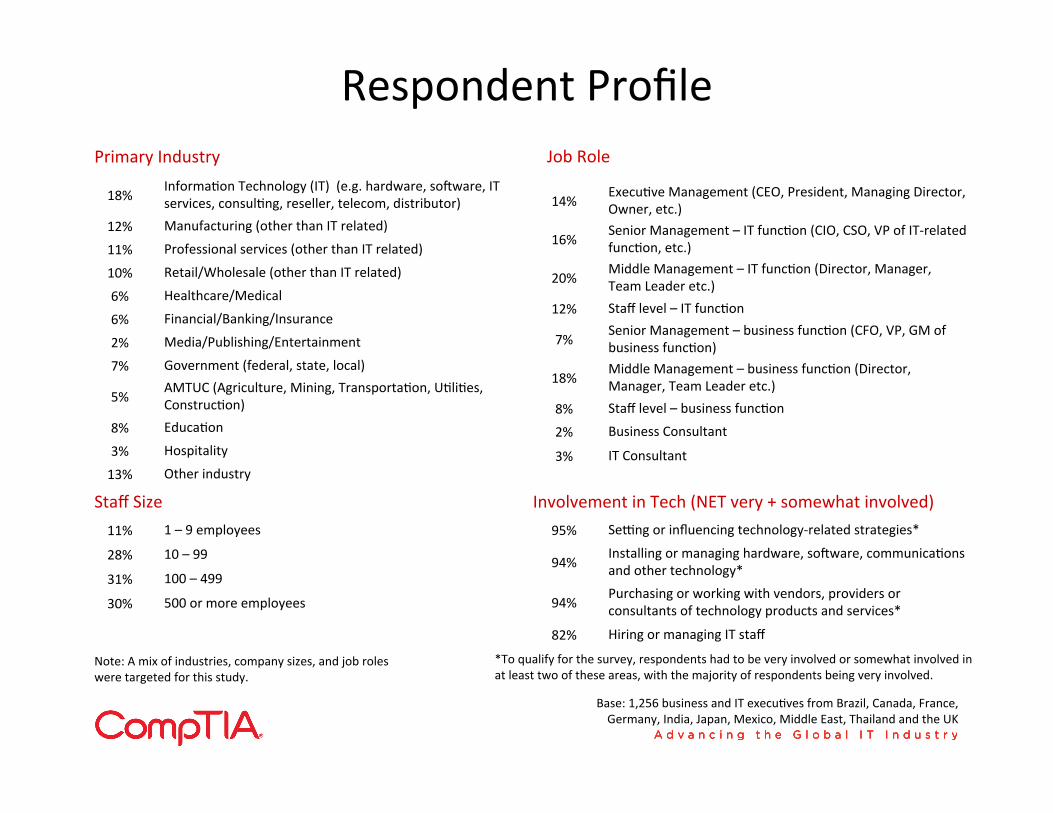
Respondent Profile
18% InformaSon Technology (IT) (e.g. hardware, so]ware, IT services, consulSng, reseller, telecom, distributor)
12% Manufacturing (other than IT related)
11% Professional services (other than IT related)
10% Retail/Wholesale (other than IT related)
6% Healthcare/Medical
6% Financial/Banking/Insurance
2% Media/Publishing/Entertainment
7% Government (federal, state, local)
5% AMTUC (Agriculture, Mining, TransportaSon, USliSes, ConstrucSon)
8% EducaSon
3% Hospitality
13% Other industry
Primary Industry
11% 1 – 9 employees
28% 10 – 99
31% 100 – 499
30% 500 or more employees
Staff Size
Base: 1,256 business and IT execuSves from Brazil, Canada, France, Germany, India, Japan, Mexico, Middle East, Thailand and the UK
14% ExecuSve Management (CEO, President, Managing Director, Owner, etc.)
16% Senior Management – IT funcSon (CIO, CSO, VP of IT-‐related funcSon, etc.)
20% Middle Management – IT funcSon (Director, Manager, Team Leader etc.)
12% Staff level – IT funcSon
7% Senior Management – business funcSon (CFO, VP, GM of business funcSon)
18% Middle Management – business funcSon (Director, Manager, Team Leader etc.)
8% Staff level – business funcSon
2% Business Consultant
3% IT Consultant
Job Role
95% Selng or influencing technology-‐related strategies*
94% Installing or managing hardware, so]ware, communicaSons and other technology*
94% Purchasing or working with vendors, providers or consultants of technology products and services*
82% Hiring or managing IT staff
Involvement in Tech (NET very + somewhat involved)
*To qualify for the survey, respondents had to be very involved or somewhat involved in at least two of these areas, with the majority of respondents being very involved.
Note: A mix of industries, company sizes, and job roles were targeted for this study.
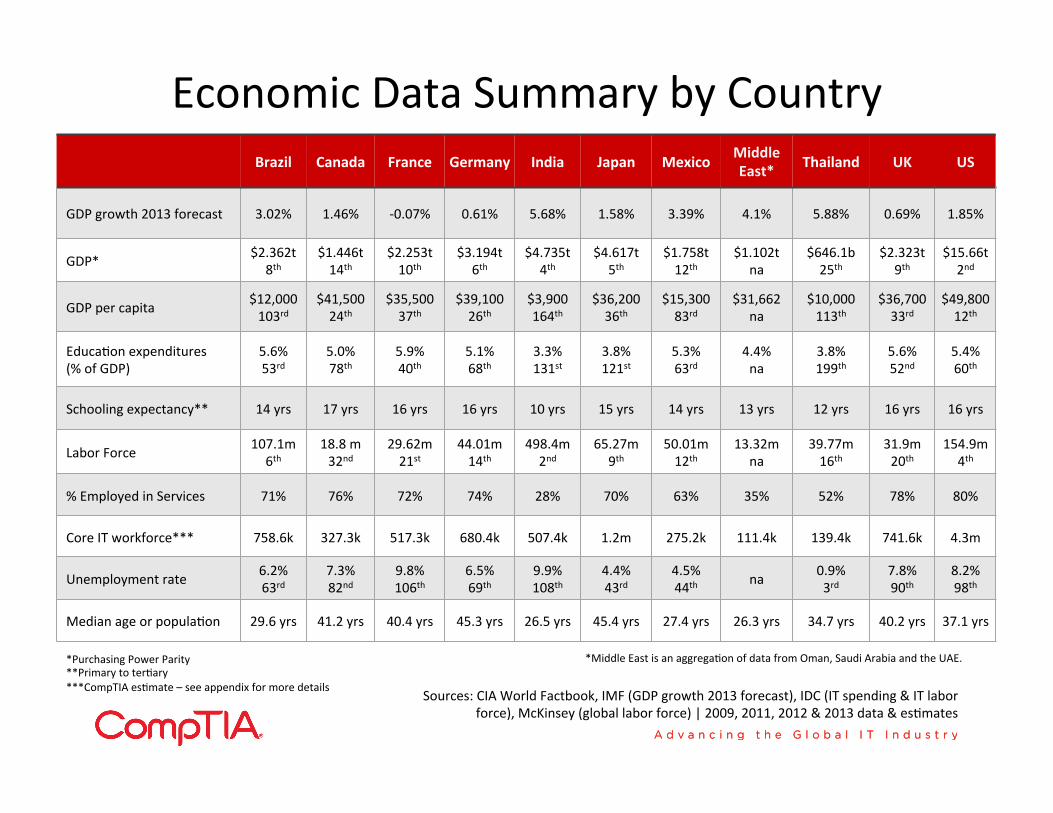
Economic Data Summary by Country Brazil Canada France Germany India Japan Mexico Middle
East* Thailand UK US
GDP growth 2013 forecast 3.02% 1.46% -‐0.07% 0.61% 5.68% 1.58% 3.39% 4.1% 5.88% 0.69% 1.85%
GDP* $2.362t 8th
$1.446t 14th
$2.253t 10th
$3.194t 6th
$4.735t 4th
$4.617t 5th
$1.758t 12th
$1.102t na
$646.1b 25th
$2.323t 9th
$15.66t 2nd
GDP per capita $12,000 103rd
$41,500 24th
$35,500 37th
$39,100 26th
$3,900 164th
$36,200 36th
$15,300 83rd
$31,662 na
$10,000 113th
$36,700 33rd
$49,800 12th
EducaSon expenditures (% of GDP)
5.6% 53rd
5.0% 78th
5.9% 40th
5.1% 68th
3.3% 131st
3.8% 121st
5.3% 63rd
4.4% na
3.8% 199th
5.6% 52nd
5.4% 60th
Schooling expectancy** 14 yrs 17 yrs 16 yrs 16 yrs 10 yrs 15 yrs 14 yrs 13 yrs 12 yrs 16 yrs 16 yrs
Labor Force 107.1m 6th
18.8 m 32nd
29.62m 21st
44.01m 14th
498.4m 2nd
65.27m 9th
50.01m 12th
13.32m na
39.77m 16th
31.9m 20th
154.9m 4th
% Employed in Services 71% 76% 72% 74% 28% 70% 63% 35% 52% 78% 80%
Core IT workforce*** 758.6k 327.3k 517.3k 680.4k 507.4k 1.2m 275.2k 111.4k 139.4k 741.6k 4.3m
Unemployment rate 6.2% 63rd
7.3% 82nd
9.8% 106th
6.5% 69th
9.9% 108th
4.4% 43rd
4.5% 44th na 0.9%
3rd 7.8% 90th
8.2% 98th
Median age or populaSon 29.6 yrs 41.2 yrs 40.4 yrs 45.3 yrs 26.5 yrs 45.4 yrs 27.4 yrs 26.3 yrs 34.7 yrs 40.2 yrs 37.1 yrs
Sources: CIA World Factbook, IMF (GDP growth 2013 forecast), IDC (IT spending & IT labor force), McKinsey (global labor force) | 2009, 2011, 2012 & 2013 data & esSmates
*Purchasing Power Parity **Primary to terSary ***CompTIA esSmate – see appendix for more details
*Middle East is an aggregaSon of data from Oman, Saudi Arabia and the UAE.
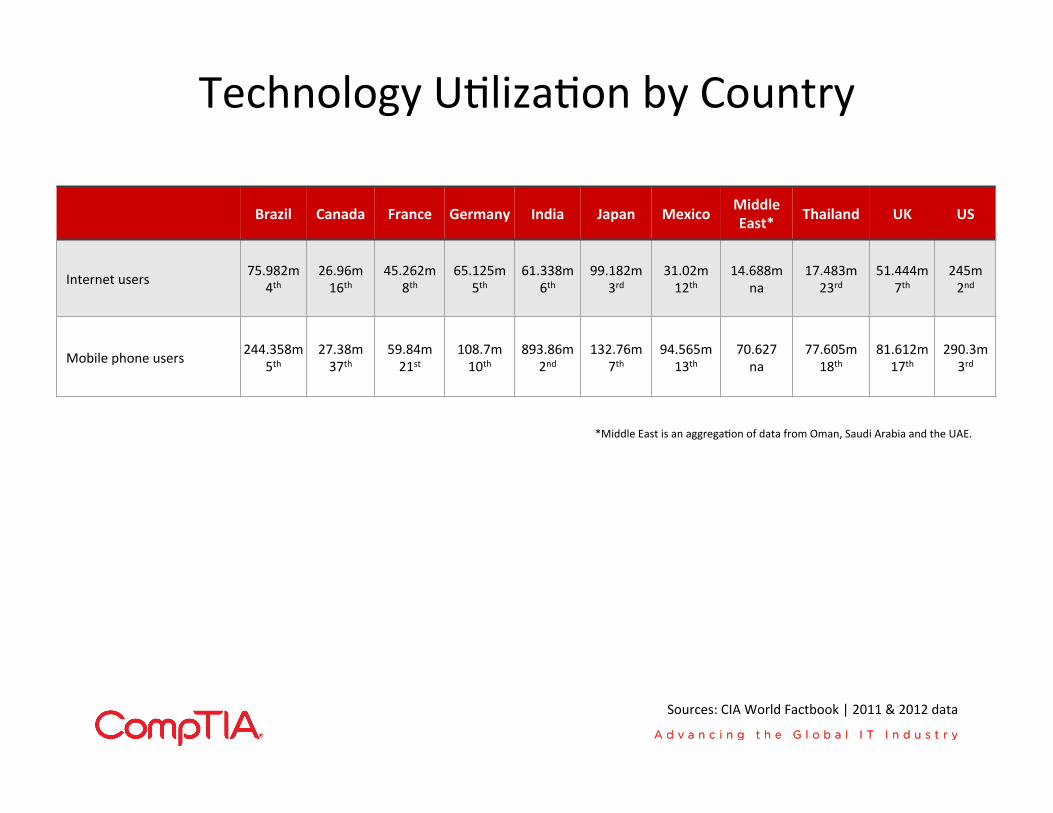
Technology USlizaSon by Country
Brazil Canada France Germany India Japan Mexico Middle East* Thailand UK US
Internet users 75.982m 4th
26.96m 16th
45.262m 8th
65.125m 5th
61.338m 6th
99.182m 3rd
31.02m 12th
14.688m na
17.483m 23rd
51.444m 7th
245m 2nd
Mobile phone users 244.358m 5th
27.38m 37th
59.84m 21st
108.7m 10th
893.86m 2nd
132.76m 7th
94.565m 13th
70.627 na
77.605m 18th
81.612m 17th
290.3m 3rd
Sources: CIA World Factbook | 2011 & 2012 data
*Middle East is an aggregaSon of data from Oman, Saudi Arabia and the UAE.
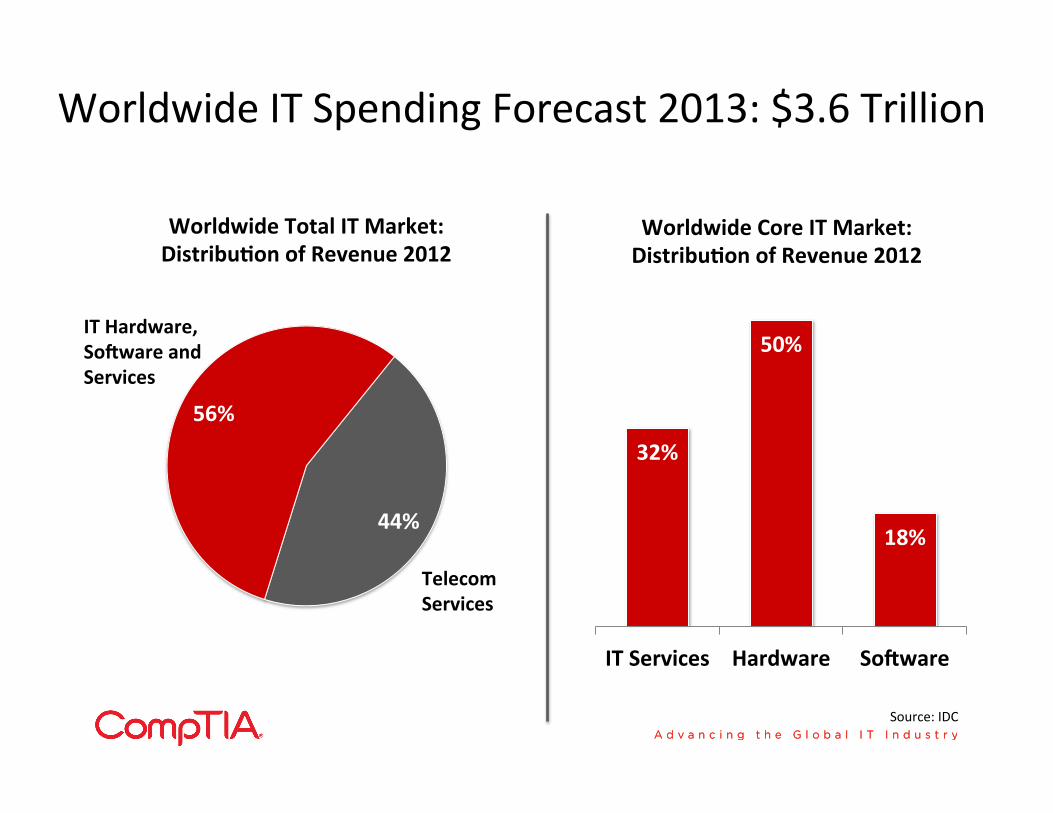
Worldwide IT Spending Forecast 2013: $3.6 Trillion
44%
56%
IT Hardware, Sofware and Services
Telecom Services
Worldwide Total IT Market: DistribuAon of Revenue 2012
32%
50%
18%
IT Services Hardware Sofware
Worldwide Core IT Market: DistribuAon of Revenue 2012
Source: IDC
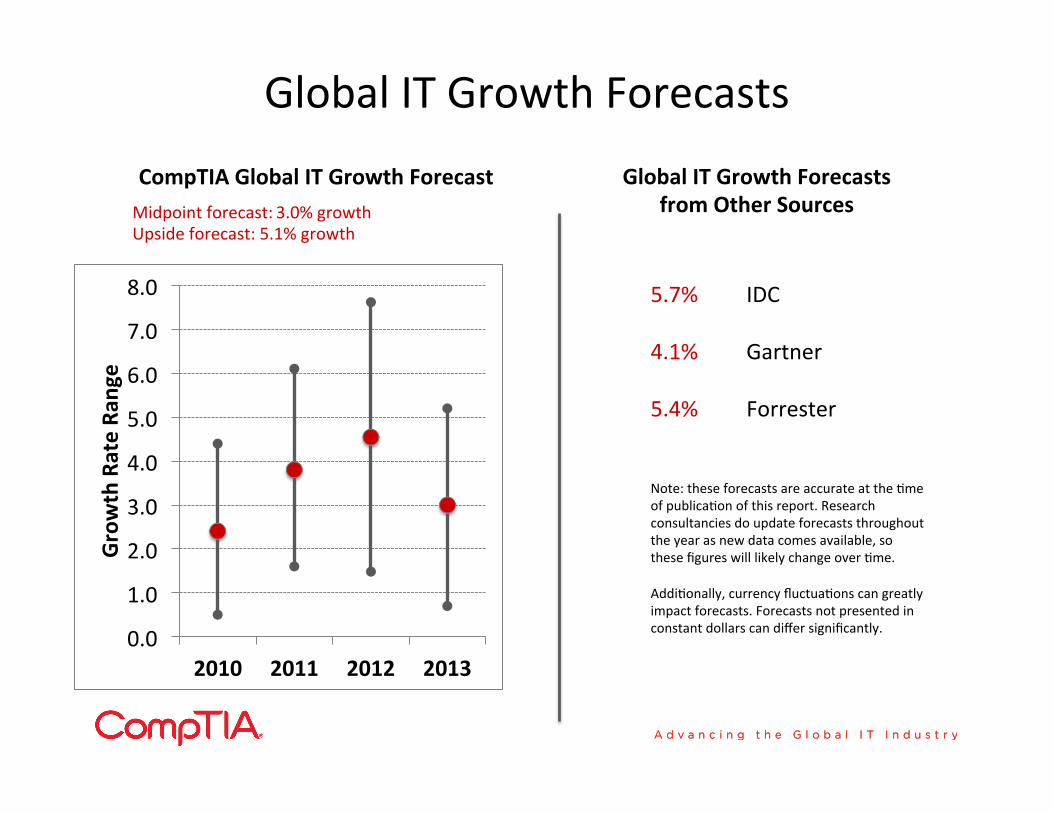
Global IT Growth Forecasts
0.0
1.0
2.0
3.0
4.0
5.0
6.0
7.0
8.0
2010 2011 2012 2013
Growth Rate Ra
nge
CompTIA Global IT Growth Forecast Midpoint forecast: 3.0% growth Upside forecast: 5.1% growth
Global IT Growth Forecasts from Other Sources
5.7% IDC
4.1% Gartner
5.4% Forrester
Note: these forecasts are accurate at the Sme of publicaSon of this report. Research consultancies do update forecasts throughout the year as new data comes available, so these figures will likely change over Sme. AddiSonally, currency fluctuaSons can greatly impact forecasts. Forecasts not presented in constant dollars can differ significantly.
AddiSonal Resources • CompTIA IT Career Insights study (annual profiling survey of CompTIA cerSficaSon holders)
• US full report: hsps://compSa.box.com/s/ca63b83841598300d401 • Japan summary: hsps://compSa.box.com/s/0mc7n6bhswd3km86otqy • South Africa summary: hsps://compSa.box.com/s/dvjk5psfmudqbdy0qtc4 • UK summary: hsps://compSa.box.com/s/r4zmwp0p7oppbbg8nmwt
• Other CompTIA industry research that is published, e.g. IT Industry Outlook 2013, Youth Opinions of Careers in IT, State of the IT
Skills Gap, Employer Percep'ons of IT Training and Cer'fica'on, IT Training and Cer'fica'on: Insights and Opportuni'es, 10th Annual Informa'on Security Trends, 2nd Annual Trends in Enterprise Mobility. CompTIA members and partners can access the full reports here:
• CompTIA Member Resource Center: hsp://www.compSa.org/members/research/KeyTopics/itworkforce.aspx • CompTIA Partner Portal: hsp://partners.compSa.org/delivery/research.aspx • Or visit the CompTIA website for more informaSon: hsp://www.compSa.org/research.aspx
• CompTIA educaSonal content and training resources, e.g. CompTIA Quick Start Guides to Cloud CompuSng, IT Security, Managed
IT Services, Unified CommunicaSons. • Visit the CompTIA website for more informaSon: hsp://www.compSa.org/training.aspx
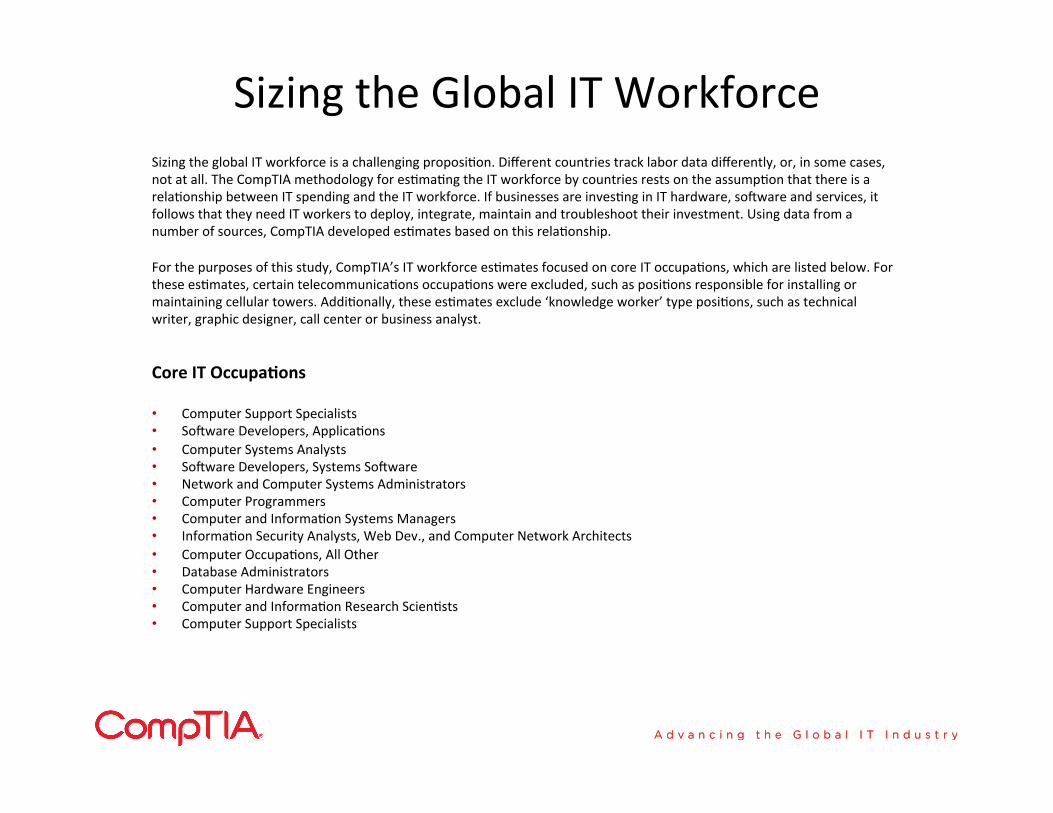
Sizing the Global IT Workforce
Core IT OccupaAons • Computer Support Specialists • So]ware Developers, ApplicaSons • Computer Systems Analysts • So]ware Developers, Systems So]ware • Network and Computer Systems Administrators • Computer Programmers • Computer and InformaSon Systems Managers • InformaSon Security Analysts, Web Dev., and Computer Network Architects • Computer OccupaSons, All Other • Database Administrators • Computer Hardware Engineers • Computer and InformaSon Research ScienSsts • Computer Support Specialists
Sizing the global IT workforce is a challenging proposiSon. Different countries track labor data differently, or, in some cases, not at all. The CompTIA methodology for esSmaSng the IT workforce by countries rests on the assumpSon that there is a relaSonship between IT spending and the IT workforce. If businesses are invesSng in IT hardware, so]ware and services, it follows that they need IT workers to deploy, integrate, maintain and troubleshoot their investment. Using data from a number of sources, CompTIA developed esSmates based on this relaSonship. For the purposes of this study, CompTIA’s IT workforce esSmates focused on core IT occupaSons, which are listed below. For these esSmates, certain telecommunicaSons occupaSons were excluded, such as posiSons responsible for installing or maintaining cellular towers. AddiSonally, these esSmates exclude ‘knowledge worker’ type posiSons, such as technical writer, graphic designer, call center or business analyst.


