
INTERFIBRE RELATIONSHIPS AND TEXTILE
MARKETING IN JAPAN
BY.
G.W. KITSON
Research Report NO. 95
July 1978
THE AGRICULTURAL ECONOMICS RESEARCH UNITLincoln College, Canterbury, NZ.
THE UNIT was established in 1962 at Lincoln College, University of Canterbury.Its major sources of funding have been annual grants from the Department 01Scientific and Industrial Research and the College. These grants have been supplemented by others from commercial and other organisations for specific researchprojects within New Zealand and overseas.
The Unit has on hand a programme of research in the fields of agriculturaleconomics and management, including production, marketing and policy, resourceeconomics, and the economics of location and transportation. The results of theseresearch studies are published as Research Reports as projects are completed. Inaddition, technical papers, discussion papers and reprints of papers published ordelivered elsewhere are available on request. For list of previous publications seeinside back cover.
The Unit and the Department of Agricultural Economics and Marketing and theDepartment of Farm Management and Rural Valuation maintain a close workingrelationship in research and associated matters. The combined academic staff ofthe Departments is around 25,
The Unit also sponsors periodic conferences and seminars on appropriate topics,sometimes in conjunction with other organisations.
The overall policy of the Unit is set by a Policy Committee consisting of theDirector, Deputy Director and appropriate Professors.
UNIT POLICY COMMITTEE: 1978
Professor J. B. Dent, B.Sc., M.Agr.Sc.Ph.D.(Farm Management and Rural Valuation)
Professor R J. Ross, M.Agr.Sc.(Agricultural Economics)
Dr P. D. Chudleigh, RSc., Ph.D.
UNIT RESEARCH STAFF: 1978
Direetor-Professor J. B. Dent, B.Sc., M.Agr.Sc., Ph.D.
Deputy DirectorP. D. Chudleigh, RSc., Ph.D.
Researc', Fellow in Agricultural PolicyJ. G. Pryde, O.B.E., M.A., F.N.Z.I.M.
Senior Research EconomistsW. A. N. Brown, MAgr.Sc., Ph.D.
G. W. Kitson, M.Hort.Sc.
Research EconomistsL. E. Davey, RAgr.Sc., M.Sc.
R. D. Lough, RAgr.Sc.S. K. Martin, REc., M.A.
R. G. Moffitt, RHort.Sc., N.D.H.S. L. Young, BA., M.A.
Analyst/ProgrammerS. A. Lines, RSc.
Post Graduate FellowsL. J. Hubbard, RSc.
R. D. Inness, BA(Hons.)A. M. M. Thompson, RSc.
H. T. Wickramasekera, M.Sc.(Agric.)
SecretaryJ. V. Boyd
TABLE OF CONTENTS
.y
L:j:ST OF TA!lLES
;LIST ,OF F,IGURES
PR.EFACE
ACKN01~;LE;DGEMENT~
SUMMARY
CHAPTj;:R
,1. THE ,JAJ;'ANES,E TEXTILE :MARKET AND INTER FIBRE
COMP!\.RI SONS
1.1 Introduction
1.2,G.ener'al cpnsumptipnTrends ,and PorecaS tsby Fibre Type
1.3 Japan's Textile,Exports and Imports and'Future Co'mpeti ti;vene,ss of the JapaneseTextile Industry , ' ,,'
1.4 J,apanese Imports of Products ContainingWool" " "
t.5 Japanese Carpet PeIl)and
1. 6 Summary.... \, ... ,..
2. TEX,TILE PISTRIBUTION, BUSINESS METHODS AND
MARKET DEVELOPMENT
PAGE
(iii)
(v)
(vi)
(viii)
(ix)
1
2
7
12
15
22
2.1
2.2
2.3
2.4
2.5
2.6
2.7
Introduction
T,extile Distribt:!tion in Aggregate Form
Fabric Whol~salers By Type
cparacteris.tics o.f Fabric Wholesalers
Business Transactions in Japanese TextileDistributiol)
Japanese Textile anp Clo.thing Retailing.
Summary
24
25
28
30
35
41
53
3. FIBRE
LEVE;L, ,
3.1
3.2
INTER-RELAT,IONSHIPS AT TlIE CORBORATE
IN JAPAN
r,ntroduction
Synthetics Companie,s, Mul tif,ibre Spinnersand Specialist Wool Spinners - FinancialStrengths and Inter-fibre Relationships
(ii:
54
55

68
72
PAGE
3.3 Recent Performance and Diversificationof Largest Textile Companies 61
3.4 Trends in Financial Structure of LargestTextile Companies 66
3.5 Inter-Company Synthetic Fibre RawMaterial Flows 66
3.6 Cost Changes and Inter-Fibre COnlp'etitic>nin Japan
3.7 Summary
APPENDICES:
I
II
III
IV
V
VI
Textile Demand Forecast Assumptions
Carpet Distribution System ill Japan "
Tqp 'I\yenty,Clothing Stores and'r,opTwenty Specialist Clothing Stores in Japan
,Retail Store . Trends and Compo~ition
Fibre a.nd'l'extil~: productio!1 in Japan byCompany Group and Fibre 'r,ype
Vertical Inte'gration in Synthetic FibreProduction in Japan
(ii)
75
77
78
80
83
84

LIST or TABLES
PAGE
1.1
1.2
1.3
1.4
1.5
1.6
1.7
1.8
Textile Consumption in Japan, U.S.A. and WestGermany.
Forecast of Japanese Textile Demandi:>y DifferentUses (Fibre Base).
Japane.se Demand Fore.cast:s by Differen.tTextiles(Fibre Base). ..'
Japanese Tei>tile Sl.lpplyand Demand Forecasts(Fibre Base).
Forecasts of Japanese Imports of Wool in VariousProcessed Forms.
Forecast of Domestic Demand for Carpet by Type(Fibre Base).
Forecast of Domestic Demand for Carpet Yarn byFibre Type (Fibre Base) .
U.S.A. and Japan Clothing and Carpet DomesticDemand (1974.).
3
4
6
11
13
16
17
18
1.9 Japanese Consumer Preferences for Wool or SyntheticCarpets. 21
2.1 Shusanchi Wholesalers - Breakdown of CommoditiesHandled and Sales Levels. 31
2.2 Sources of Supply of Shusanchi Wholesalers in MainTextile Centres. 32
2.3 Sales Breakdown of Shusanchi Wholesalers in MainTextile Centres. 34
2.4 Frequency of Returns to Wholesalers of UnsoldText:ile Products. 38
2.5 Average Payment P~riods Associated with PromissoryNotes in the Wholesale Text1leIndustry. 40
2.6 Trends in Sales of Clothing Stores by Type. 45
2.7 Price Indices for Clothing by Store Type (1974). 47
2.8 ProPQrtions of Different Clothing and Bedding SoldBy Different Outlets. 48
2.9 Significance of Different Clothing and Textile ItemsFor· Different Retail Outlets (1974). 49
(iii)

2.10
3.1
3.2
3.3
3.4
operating ratios of Retail Textile Stores inJapan (1975).
Japan's Largest Synthetic and Spinning Companies Group A~sociations.
Largest Synthetic and Spinning Companies Proportions of Sales of Various Fibres.
Wool Yarn and Textile Companies - Proportions ofOutput ·of Various Fibres (1972).
Synthetic Fibre and Spinning Company FinancialPerformances.
PAGE
51
56
58
60
62
3.5 Sales of Textiles and Non Textiles by Main Syntheticand Spinning Companies. 63
3.6
3.7
3.8
Business Activities of Main Synthetic TextileCompanies.
Synthetic Production Capacity by Company (1974).
Trends in Financial Structures of Synthetic andSpinning Companies.
Synthetic Textile Companies Self Supply of Inputs.
(iv)
64
65
67
69
1.1
1.2
1.3
2.1
2.2
2.3
LIST OF FIGURES
Trends. in Production of Synthetic Fibres in.Japan.
Ma.in TextileG60ds 8upplyand Demand Trends.
Trends in Comparative Wage Cost$ in Japan, Koreaand the U. S.A., Showing the Ifupactof ExchangeRate qhanges,
Distribution of Textile Goods in 1965.
Fabric bistribution in Japan.
Activities of Retailers by Characteristic.s ofCommodities Sold.
(v)
PAGE
5
8
9
26
29
44

This report is the latest in a series of studies
of the Japanese,textile industry. The obj.ective of
these studies has been to provide New Zealanders whose
activi;t:i,E'Sare ,relat~C1 in any w.ayto th~ Ja:pades$ textile
industry with a more substantial infrastructure of
knowledge on which to make informed judgements about their
activities. This includes New. Zealand trade and
industrial policy makers, those responsible for a.aminister
ing various export incentive schemes, markete:rs of wool
as a fibre :in Ja.panand marketers ofvari'ouswool textiles
and clothing in Japan including carpets and sheepskin and
suede clothing.
While the first publication in this series concent
rated its attention on wool and the wool textile industry,
this publication has aimed to define the relationship of
wool to other textiles especially to synthetic textiles.
In addition, it has paid greater attention, principally
in Chapters 1 and 3, to the role of wool in the future.
This has been achieved, for example, by presentation of
results of demand forecasts for various fibres and textile
products and by an analysis of recent changes in the
financial viability of various sectors of the Japanese
textile industry and the capacity of these sectors to
adjust to changed circumstances such as new energy cost
regimes, labour costs, and exchange rates.
Included in Chapter I is a special section on the
Japanese market for carpets providing information on
demand forecasts for carpets of different types and on
the market structure, as well as guidance for New Zealand
companies with an interest in developing that market.
Principal guidance on market development, however, comes
in Chapter 2, which describes the distribution system for
textiles and clothing in Japan. This is treated in a
(vi)
unique w~y. Considerable attention is given, for
example, to providing for the New Zealand exporter's
need to develop a "feel" for the market. Consequently,
reasons for various distribution complexities are
explained in some depth and, in the discussion of the
retail sector, considerable attention is given to
retailers' merchandising philosophies and the role of
different commodities in the business of various retailers.
Professor J.B. Dent,Director,Agricultural Economics Research Unit
(vii)

ACKNOWLEDGEMENTS
The series of publications on the Japanese textile
industry has been financed primarily by the New Zealand
Wool Board. The studies have also been substantially
assisted by the International Wool Secretariat (Japan)
who have provided valuabl~ comment on the conduct of
the research and most helpful liaison with Japanese industry.
Mr Watanabe of Toyobo Economics Research Institute has also
assisted this research materially by regular provision of
his Institute's excellent research publications.
Finally, when the task of translation has become
too burdensome my friend Hirotake Matsuoka has been a
most willing helper. I gratefully acknowledge the help
of all the above mentioned, but accept complete responsibility
for any errors or omissions.
Graham Kitson
(viii)

SU,MMARY
The objective of this pUblication has been to
provide New Zealanders with an improved understanding of
the Japanese textile industry, and to analyse the role of
wool relative to other fibres in the recent past and in
future industry and distribution systems.
Chapter 1 seeks to provide an overall picture of
changes in the relative importance of different fibres
in the Japanese market over recent years and in the future.
The picture which has emerged from this chapter is that
consumption of synthetic fibres has grown rapidly and
will continue to do SO in future, with polyesters in the
van. Consumption growth rates for chemical fibres such
as rayon and acetate staple on the other hand, are
expected to remain negative while growth in consumption
of natural fibres is expected to be related closely to
their suitability for blending with synthetic fibres.
Consumption growth rates for worsteds are expected to
become negative and for woollen yarn growth is expected
to be very low.
Although demand forecasts for woollen carpets
are more encouraging, it is expected that they will
become increasingly confined to the high price, high
quality sector of the market and that major use for
wool as a fibre in carpet consumption will be as a blend
with synthetic fibres.
Chapter 3, which deals with the roles of various
fibres more from the point of view of the textile manufact
uring industry, indicates that the fortunes of wool are
more intimately related to the activities and policies
of three large multi fibre spinning companies and one
synthetic fibre maker than they are to the specialist
wool spinning companies. This Chapter also notes that
the greater financial strengh of synthetic textile companies
(ixl

because o~ their closer involvement in large financial
groupings than either multifibre spinners or specialist
spinning companies, means that they have been able to
diversify more into non textile activities.. This has
meant they have been better able to withstand the impact
of recession. In addition to this, recent exchange rate
movements from a production cost point of view are
certain to favour synthetic fibre makers more than natural
fibre makers because the oil related inputs into synthetic)
fibre making are substantially greater than for natural
fibre spinning. Strengthening of the,yen against the
United States dollar has meant almost a 25 percent
reduction in the price for oil in Japan since early 1977.
The yen appreciation will, however, mean more
immediate problems of adjustment for the synthetics
industry than for wool. This is because nearly 30
percent of synthetic fibre and fabric production is
exported and cannot be protected from international
competition. For wool this ratio is only about 2 percent.
After the synthetics industry has completed the adjustment
to its reduced competitiveness internationally, it will
probably emerge considerably stronger than the natural
fibre sector of the Japanese textile industry. In
addition, the natural fibre sector in Japan will continue
to be subjected to greater pressure from the rapidly
developing economics of South East and East Asia than will
synthetiQs. This is because the labour cqmponent of
production costs is substantiallx greater for natural
fibres and because exchange rates favour exports of Japan's
Asian competitors. For synthetics Japan is less vulnerable
to competition. Capital requirements, technical capacity
and perhaps a.ccess to raw material stocks will restrain
the independE!Dt development of synthetic fibre industries
in these countries. Thus in the longer term the synthetics
fibre industry in Japan will become even more dominant in
Japan's textile industry overall. Furthermore, it could
be said that. the recent recession has probably only
(x)
accelerated this development.
Chapter 2, on the Japanese distribution system for
textiles and clothing, is included in part to complete the
discussion of Japanese textiles from the point of view of
the overall market in Chapter 1, and to the textile
manufacturing industry in Chapter 3, but more importantly
to act as a guide for New Zealand industry, particularly
those sectors which have market aspirations in Japan. Of
particular significance in this Chapter is the suggestion
that many New Zealanders fail to carry cut adequate research
in Japan before committing themselves to particular
distribution channels. In particular they should have
a better understanding of the various market niches for
their product type and make some judgements about which
niche is more appropriate for their particular product.
Having done this they will be better able to discuss
distribution strategies with potential wholesalers or
importers and thus come closer to making optimal
judgements in selection of distribution channels. Readers
whose particular interest is in clothing distribution will
find this Chapter particularly useful in describing market
niches and helpful in establishment of that most fundamental
tool of the marketing man, the intuitive feel of the market.
(xi)


1.
CHAPTER I
THE JAPANESE TEXTILE MARKET
AND INTER FIBRE COMPARISONS
1.1 INTRODUCTION
The objective of Chapter I is to provide New
Zealand textile marketing and processing organisations,
financial institutions, and New Zealand trade policy makers
with an understanding of the changes which have been
occurring over recent years in the Japanese textile market.
The principal elements of change, changes in energy costs,
changes in exchange rates and changes in labour costs have
resulted in long term structural or secular changes
as well as transitory cyclical changes.
A good deal of interest has been displayed in
New Zealand on the probable outcome of the interaction
of the various forces for change. At stake are corporate
decisions in areas such as investment in processing
facilities, its form, location and timing, and nat!onal
decisions on matters such as investment priorities and
incentives, international capital movements and tariff and
export incentive policies.
Chapter I in providing an indication of changes
which have been occurring and of forecasts of future
changes should be of some guidance to appropriate decision
makers. As well as dealing with inter fibre changes
this Chapter.also provides information on changes in
international competitiveness and on changes in different
end product demands, especially those demands associated
with imports. Finally, in recognition of the dominant
role played by carpet wools in the New Zealand wool industry,
Chapter I contains a section on current and forecasted
Japanese carpet demand and gives a guide on alternative
marketing policies for carpets in Japan based on information

2.
about the structure of the Japanese carpet market.
1.2 GENEFAL CONSUMPTION TRENDS AND FORECASTS
BY FIBRE TYPE
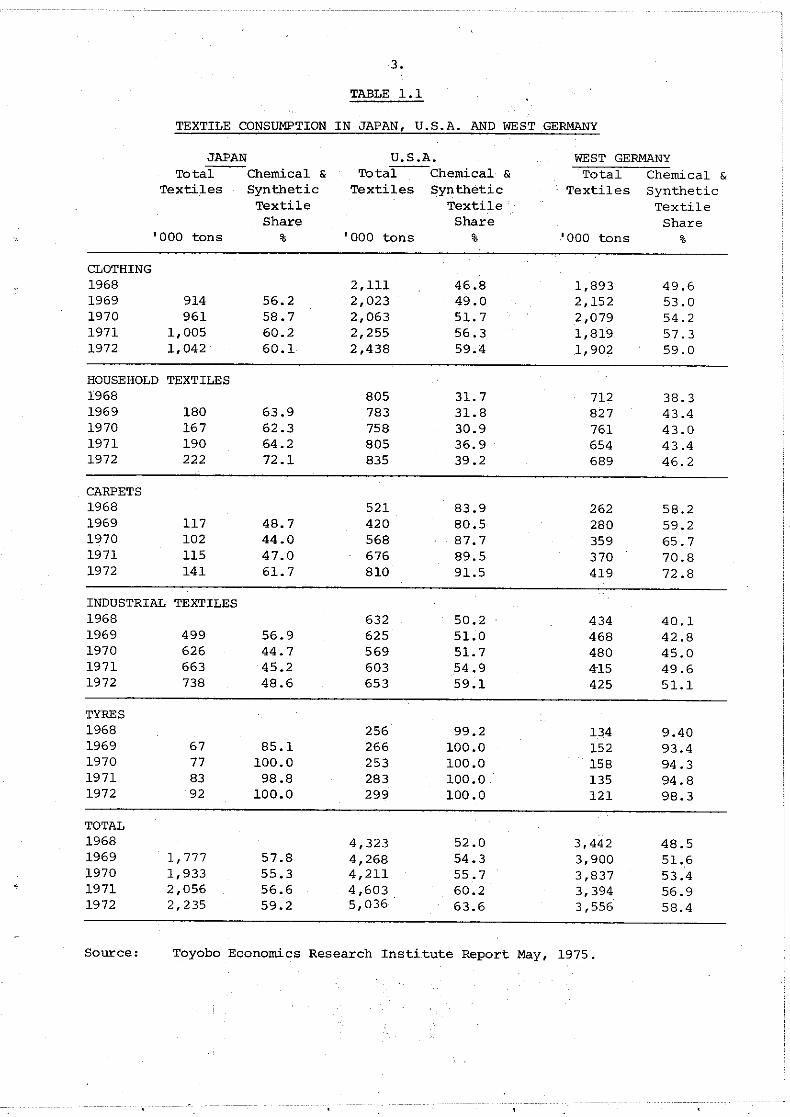
Table 1.1 compares past trends on consumption
of textiles for different end uses in Japan, the United
States and West Germany. This is followed by Table 1.2
which, although not directly comparable by category, shows
Japanese demand since 1972 and more significantly, a
forecast of demand to 1985.
The inter country comparison of Table 1.1 shows
that up to 1972 while growth in the proportion of chemical
and synthetic textiles has been similar in Japan to the
other two countries, there have been some interesting
differences between products. For example, growth of
chemical and synthetic fibres in the carpet sector has
been lower in Japan than in the other countries but
considerably higher in the household goods (curtains
and software) sector.
The forecasts shown in Table 1.2 do not
distinguish between chemical and synthetic fibres, and
natural fibres but they do indicate a resurgence in demand
growth in the 1980 to 1985 period especially for interior
goods and for clothing. Total annual demand on a fibre
basis is expected to be about 436,000 tons greater in 1985
than in the 1972-74 period.
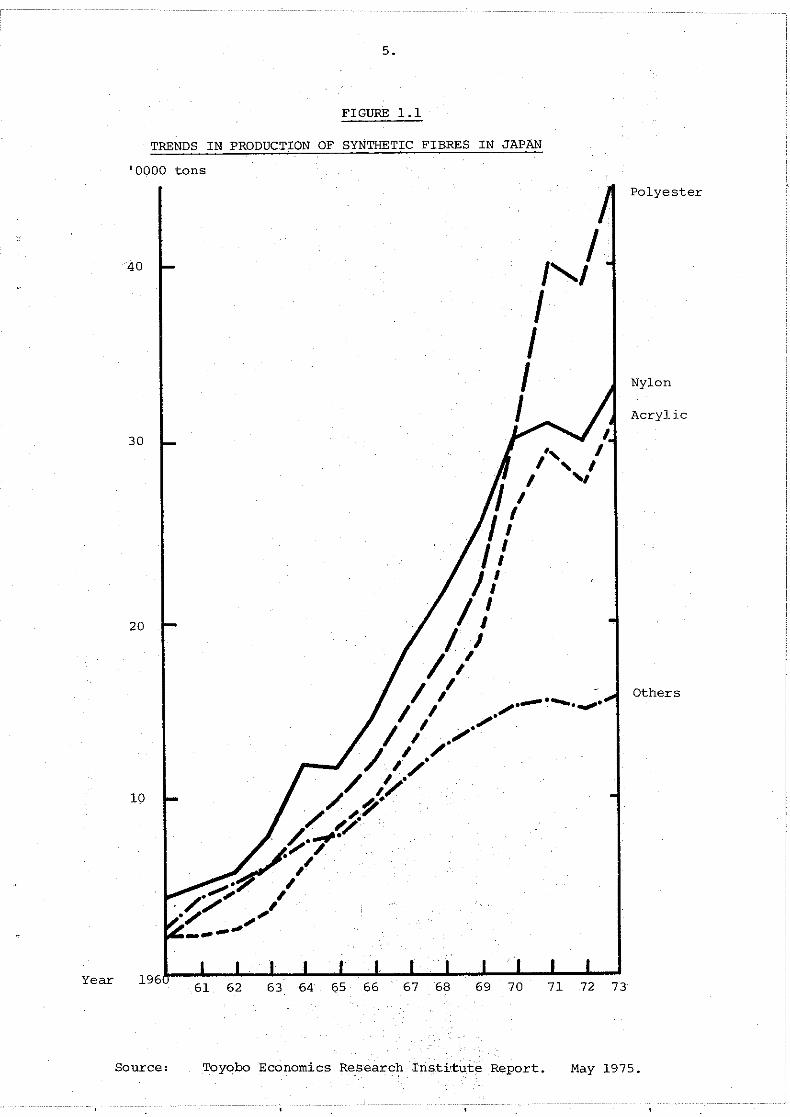
By fib~e type, production growth in synthetic
fibres in Japan has beengre,atestfor polyesters, nylon
and acrylics in that order.· This is illustrated both in
Figure 1.1 and in Ta.bl..e 1.3whiqh shows demand changes. -,' ,',.'.,'
and forecastsfornaturq.l and chemical fibre.s as well as
ratesfors;ynt;h~ticfrbr~l?rOquctionhaVe been parallelled'. ,.' -; ',.. ,", -', :',' - "'.' -'", ,
by high growth rates in demand, Furthermore, growth in
synthetic fibre demand has been greater than that of
3.
TABLE 1.1
TEXTILE CONSUMPTION IN JAPAN, U.S.A. AND WEST GERMANY
JAPAN U.S.A. WEST GERMANYTota-l--Chemical & Tota-l--Chemical & Total Chemical &
Textiles Synthetic Textiles Synthetic Textiles SyntheticTextile Textile TextileShare Share Share
'000 tons % '000 tons % '000 tons %
CLOTHING1968 2,111 46.8 1,893 49.61969 914 56.2 2,023 49.0 2,152 53.01970 961 58.7 2,063 51. 7 2,079 54.21971 1,005 60.2 2,255 56.3 1,819 57.31972 1,042 60.1 2,438 59.4 1,902 59.0
HOUSEHOLD TEXTILES1968 805 31. 7 712 38.31969 180 63.9 783 31.8 827 43.41970 167 62.3 758 30.9 761 43.01971 190 64.2 805 36.9 654 43.41972 222 72.1 835 39.2 689 46.2
CARPETS1968 521 83.9 262 58.21969 117 48.7 420 80.5 280 59.21970 102 44.0 568 87.7 359 65.71971 115 47.0 676 89.5 370 70.81972 141 61. 7 810 91.5 419 72.8
INDUSTRIAL TEXTILES1968 632 50.2 434 40.11969 499 56.9 625 51.0 468 42.81970 626 44.7 569 51. 7 480 45.01971 663 45.2 603 54.9 4-15 49.61972 738 48.6 653 59.1 425 51.1
TYRES1968 256 99.2 134 9.401969 67 85.1 266 100.0 152 93.41970 77 100.0 253 100.0 158 94.31971 83 98.8 283 100.0 135 94.81972 92 100.0 299 100.0 121 98.3
TOTAL1968 4,323 52.0 3,442 48.51969 1,777 57.8 4,268 54.3 3,900 51.61970 1,933 55.3 4,211 55.7 3,837 53.41971 2,056 56.6 4,603. 60.2 3,394 56.91972 2,235 59.2 5,036 63.6 3,556 58.4
Source: Toyobo Economics Research Institute Report May, 1975.

TABLE 1.2
FORECAST OF JAPANESE TEXTILE DEMAND BY DIFFERENT USES (FIBRE BASE)
1965 1970 ·1973 1974 72-74AVERAGE
1980 1985Average Annual
(Incr/Decr) Percent
70/6572-74//70
80//72-74
85/80
528.9 13.4
256.2 10.9
CLOTHING
. HOUSEHOLD
INTERIOR
INDUSTRIAL
696.6 992.9 1,206.6
.423.5 457.0 474.0
65.7 110.0 176.1
258.3 483.9 511.7
985.5
405.2
148.2
509.7
1,092.9
449.4
158.0
492.9
1,170.8
449.4
105.2
507.1
1,370.2
474.7
7.3
1.5
3.2
-0.6
12.8
0.6
.1.0
3.8
0.4
3.2
1.1
4.5
0.8
TOTAL 1,4442 2.043.9 2,368.8 2,048.6 2,193.2 2,332.5 2,629.9 7.2 2.4 0.9 2.4
Source: Toyobo Economics Research Institute Report, October, 1976.
5.
FIGURE 1.1
TRENDS IN PRODUCTION OF SYNTHETIC FIBRES IN JAPAN
'0000 tons
Polyester
40 /1"-'III Nylon
I Acrylic
I" I
'"I "1I
,f1//1
1/1//,
/"
Others_.-/
I .".. ._."..
/ ,' ""./"///
//~l// ,,}.~
~.~.-;'..
. /• I............ ,
.~/ ,.'.,....---
30
20
10
Year 196"-.-.........,II".;.-&.....-L_..L._.J;.._I-....,II,,.;.-.I_....L-..L.-.&.......61 62 63 64 65 66 67 68 69 70 71 72 73
Source: Toyqbo Economics ResearchJ:'nstii.tut-e Report. May 1975.
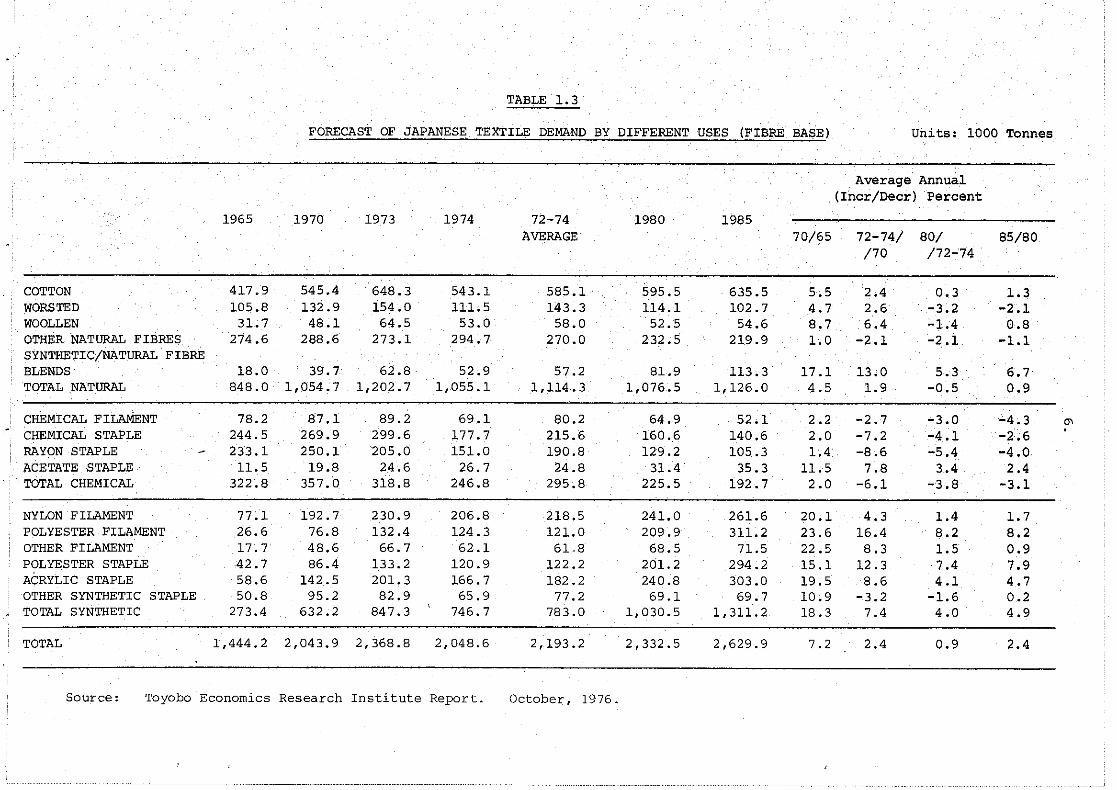
TABLE 1.3
FORECAST OF JAPANESE TEXTILE DEMAND BY DIFFERENT USES (FIB~ BASE) Units: 1000 Tonnes
Average Annual(Incr/Decr) Percent
1965 1970 1973 1974 72-74 1980 1985AVERAGE 70/65 72-74/ 80/ 85/80
/70 /72-'74·
COTTON 417 .9 545.4 648.3 543.1 585.1 595.5 635.5 5.5 2.4 0.3 1.3WORSTED 105.8 132.9 154.0 111.5 143.3 114.1 102.7 4.7 2.6 . -3.2 -2.1WOOLLEN 31.7 48.1 64.5 53.0 58.0 52.5 54.6 8.7 6.4 -1.4 0.8OTHER NATURAL FIBRES 274.6 288.6 273.1 294.7 270.0 232.5 219.9 1.0 -2.1 -2.1 -1.1SYNTHETIC/NATURAL FIBREBLENDS 18.0 39.7 62.8 52.9 57.2 81.9 113.3 17.1 13.0 5.3 6.7TOTAL .NATURAL 848.0 1,054,7 1,202.7 1,055.1 1,114.3 1,076.5 1,126.0 4.5 1.9 -0.5 0.9
CHEMICAL FILAMENT 78.2 87.1 89.2 69.1 80.2 64.9 52.1 2.2 -2.7 ~3.0 -'4.3 '"CHE.MICAL STAPLE 244.5 269.9 299.6 177.7 215.6 160.6 140.6 2.0 -7.2 ~4 .1 -2.6.
RAYON STAPLE 233.1 250.1 205.0 151.0 190.8 129.2 105.3 1.4 -8.6 -5.4 -4.0ACETATE STAPLE 11.5 19.8 24.6 26.7 24.8 31.4 35.3 11.5 7.8 3.4 2.4TOTAL CHEMICAL 322.8 357.0 318.8 246.8 295.8 225.5 192.7 2.0 ~6.1 -3.8 -3.1
NYLON FILAMENT 77 .1 192.7 230.9 206.8 218.5 241.0 261.6 20.1 4.3 1.4 1.7POLYESTER FILAMENT 26.6 76.8 132.4 124.3 121.0 209.9 311.2 23.6 16.4 8.2 8.2OTHER FILAMENT 17.7 48.6 66.7 62.1 61.8 68.5 71.5 22.5 8.3 1.5 0.9POLYESTER STAPLE 42.7 86.4 133.2 120.9 122.2 201.2 294.2 15.1 12.3 7.4 7.9ACRYLIC STAPLE 58.6 142.5 201.3 166.7 182.2 240.8 303.0 19.5 8.6 4.1 4.7OTHER SYNTHETIC STAPLE 50.8 95.2 82.9 65.9 77.2 69.1 69.7 10.9 -3.2 -1.6 0.2TOTAL SYNTHETIC 273.4 632.2 847.3 746.7 783.0 1,030.5 1,311.2 18.3 7.4 4.0 4.9
TOTAL 1,444.2 2,043.9 2,368.8 2,048.6 2,193.2 2,332.5 2,629.9 7.2 2.4 0.9 2.4
Source: Toyoba Economics Research Institute Report. October, 1976.
7.
natural fibres and chemical fibres with the latter forecast
to have negative growth rates in the future. For natural
fibres only synthetic blends appear to hold a great deal of
promise for the future with growth in demand forecast at
6.7 percent per annum between 1980 and 1985. In the same
period demand growth for woollen fibre is expected to be
0.8 per cent per annum and demand for worsted yarn is expected
to decrease by 2.1 percent per annum. The most dramatic
growth in demand by fibre type is expected to continue to
by in polyesters with 8.2 and 7.9 percent increase for
polyester filament and polyester staple respectively
forecast for the latter period in the table. Over the same
period the major competitor for wool, acrylic is expected
to experience an increase in demand of 4.7 percent per
annum.
1.3 JAPAN'S TEXTILE EXPORTS AND IMPORTS AND FUTURE
COMPETITIVENESS QF THE JAPANESE TEXTILE INDUSTRY
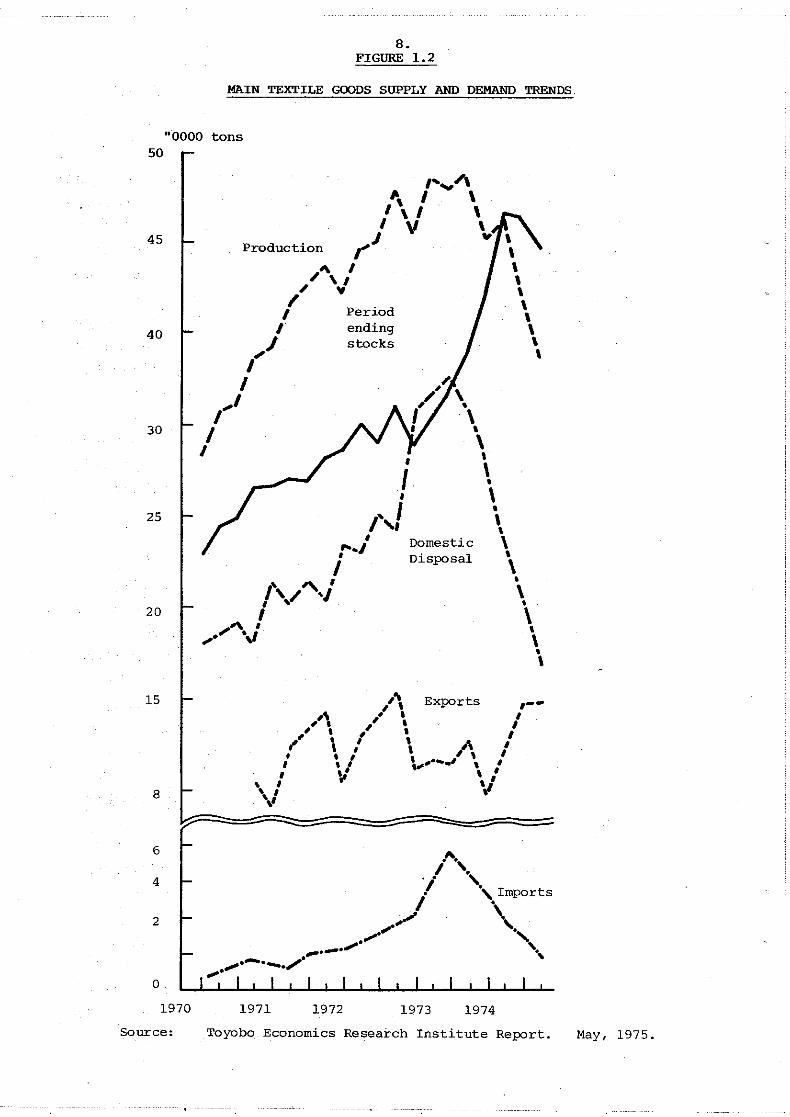
Recent trends in production, imports, exports and
stocks in the Japanese textile industry are charted in
Figure 1.2 This figure indicates the overwhelming import-
ance of the domestic market for Japanese produc~rs with
nearly 70 percent of production being sold domestically.
The significance of exports to Japanese producers becomes
more apparent in times of domestic recession in Japan as
is seen by rapid export growth coinciding with a fall in
domestic disposal in 1971/72 and again in 1974. Another
significant feature of this graph is the steady growth in
imports of textiles into Japan up until late 1973. This
trend is regarded as a secular change and is a reflection
of the falling level of international competitiveness of
the Japanese textile industry.
The principal components of Japan's loss of
competitiveness in textile production are labour costs ln
a relatively labour intensive industry and the increasing
value of the Japanese yen against foreign currencies. The
combined impact of these changes is clearly illustrated in
Figure 1.3.
8.FIGURE 1.2
MAIN TEXTILE GOODS SUPPLY AND DEMAND TRENDS
"0000 tons
DomesticDisposal
•I•t,!
•,.../,I
~ ,,'"/ 'I, ..
I" ."." \'
,......,/\"\ I \
, \ I \, V \
production,..J ..
/' ,/ V
I PeriodI ending
"I stocks
11
,11
II
50
20
25
30
45
40
15
8
," Exports , __,,\ ,I' I
, , ,', I, I,..'\" A I• ' , Fi, I, , ,, " _.....",, ,I \;t , '
... if ':\' r
"6
4
2
o
,...,. .1 .,.I ., Imports
I .,..,. \,. ......... "",....." '.,
.""............./.,.
1970 1971 1972 1973 1974
Source: Toyobo Economics Research Institute Report. May, 1975.

150
9 .
. FIGURE 1.3
TRENDS IN COMPARATIVE WAGE COSTS IN JAPAN, KOREA ANDTHE U.S.A. SHOWING THE IMPACT OF EXCHANGE RATE CHANGES
CD Japan
@ Republic of Korea (yarn)
@ United states
. @ Republic of Korea
® Republic of Korea (finished products)
100
501965 1966 1967 1968 '1969 1970 1971 1972 1973 1974
Note: Changes in the wholesale price indices (1970=100) of theRepublic of Korea and the United States as against theJapanese wholesal~ price-index after adjustment forchanges in the exchange rates.
Source: Fuji Bank Bulletin, July 1976.

10.
Although Figure 1.3 illustrates changes in
Japanese competitiveness up to 1974 only, it is clear
that continued appreciation of the Japanese yen through
1977 and 1978 has resulted in further erosion of Japanese
competitiveness in textile production. Furthermore, the
impact is likely to be substantially greater for natural
fibre based textiles than for synthetics because of the
relatively labour intensive nature of natural fibre
processing.
It also appears that Japan has been disadvantaged
more than the United States by the increases in prices for
oil and its derivatives over recent years. One estimate
has it that synthetic fibre feedstock prices in Japan have
increased to a level 20 percent higher than the United
States although this disadvantage would have been consider
ably eroded because of the recent substantial appreciation
of the yen against the. dollar where oil prices have been
dominated in U.s. dollars. For the same reason and
because of the substantially higher capital servicing
charges associated with newer plants in South East Asian
countries it would be expected that the Japanese synthetic
textile industry would retain its competitiveness against
South East Asian industries.
The wage competitiveness of the United States
compared with Japan is at first glance somewhat surprising.
However, when it is remembered that the American textile
industry is considerably biased .towards synthetic textile
production a relatively low labour input is understandable.
The impact of oil price, exchange rate, and labour cost changes
on various components of the Japanese textile industry will
be discussed further in Chapter III.
Future forecasts of Japan's total exports and
imports of textiles indicates a substantial decline in
exports and a substantial increase in imports. These
forecasts are summarised in Table 1.4
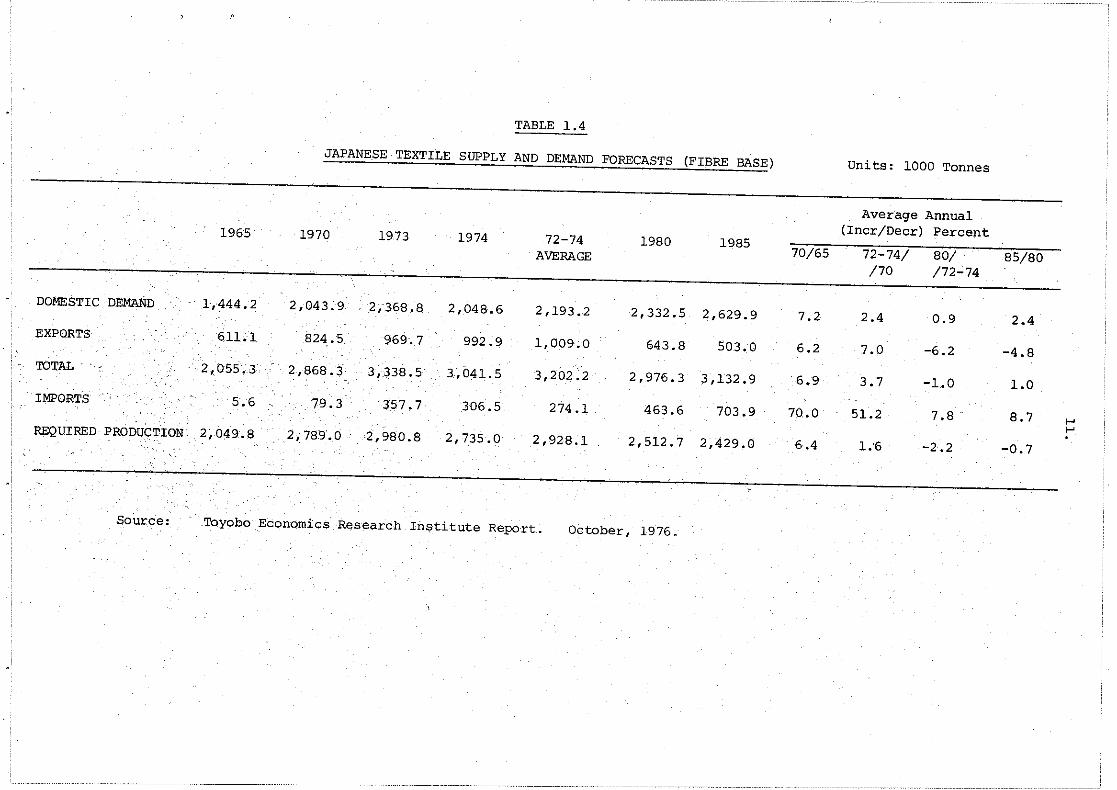
TABLE 1.4
JAPANESE TEXTILE SUPPLY AND DEMAND FORECASTS (FIBRE BASE) units: 1000 Tonnes
Average Annual(Incr/Decr) Percent1965 1970 1973 1974 72-74 1980 1985
70/65 72-74/ 80/ 85/80AVERAGE/70 /72-74
DOMESTIC DEMAND 1,444.2 2,043.9 2,-368.8 2,048.6 2,193.2 2,332.5 2,629.9 7.2 2.4 0.9 2.4EXPORTS 61Ll 824.5 969 •.7 992.9 1,009;0 643.8 503.0 6.2 7.0 -6.2 -4.8TOTAL 2,055.3 2,868.3 3,338.5 3,041.5 3,202:2 2,976.3 3,132.9 6.9 3.7 -1.0 1.0IMPORTS 5.6 79.3 357.7 306.5 274.1 463.6 703.9 70.0 51.2 7.8 8.7 ........REQUIRED PRODUCTION 2,049.8 2,789·.0 ·2,980.8 2,735.0 2,928.1 2,512.7 2,429.0 6 ;4 1;6 -2.2 -0.7
Sou:r::ce: Toyobo Economics Research In9titute Report. Ootober, 1976.
12.
In preparation of these forecasts a. number of
assumptions have been made about GNP and population growth
rates, wages growth rates, exchange rates and other
economic variables. These are summarised along with a
table of assumed prices for major fibres in Appendix I.
The statistic most likely to come under critical scrutiny
is the assumed exchange rate. From a rate of ¥295 per
US dollar in 1975 a rate of ¥300 has been assumed for
both target dates 1980 and 1985. In fact the actual
exchange rate in mid 1978 had fallen to around ¥210 and
there seems little prospect of it moving back towards ¥300
by 1980. An exchange rate nearer the actual 1978 level
would lead to overall lower levels of exports and higher
imports than those forecast. This would be especially
so for natural fibres whose raw material and energy cost
content (raw materials and energy would become cheaper
in yen) is considerably lower than for synthetic fibre
production.
1.4 JAPANESE IMPORTS OF PRODUCTS CONTAINING WOOL
Although levels of imports forecast for wool in
total are not encouraging (Table 1.3), forecaste~ levels
of wool processed in various ways are considerably higher
and provide some guidance on prospects for valued added
processing for the Japanese market. These forecasts are
summarised in Table 1.5
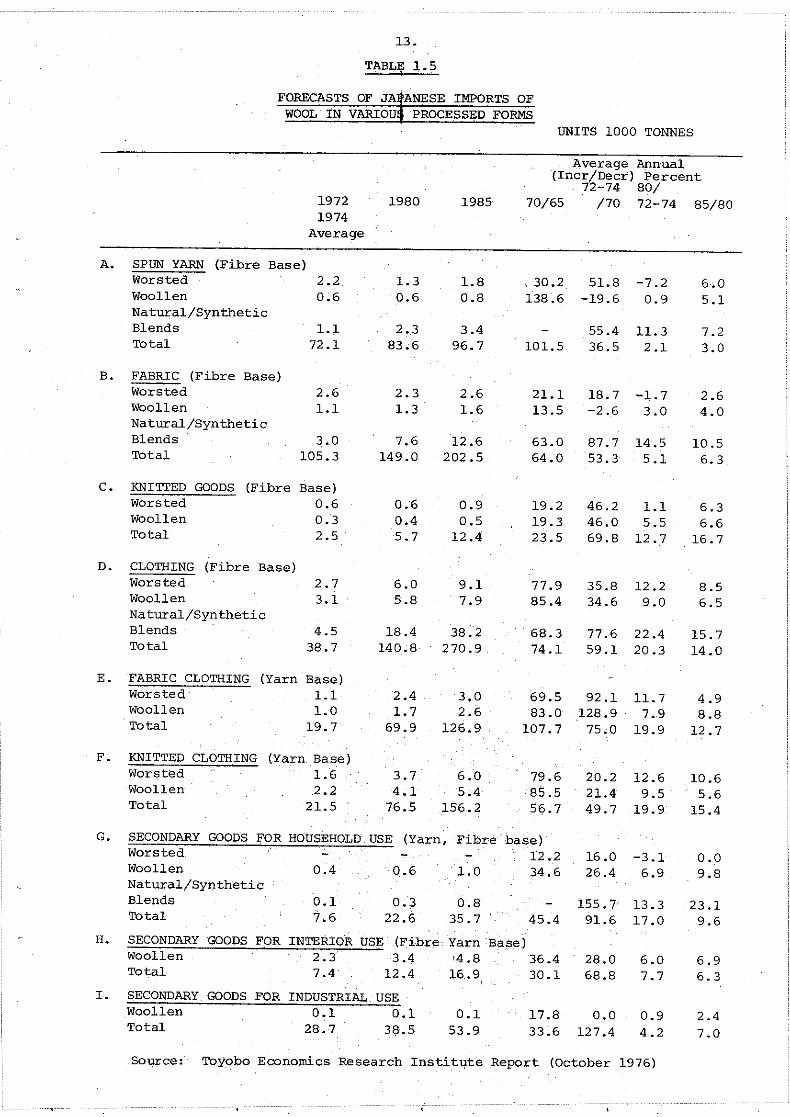
Forecast growth rates of Japanese imports of wool
in the nine different categories of processing listed in
this table are positive and reasonably substantial in all
cases except for worsted yarn and fabric in the period
between 1972-4 and 1980 and for worsteds classified as
secondary goods for household .use in both forecast periods.
Given the likely level of exchange rates, these forecasts
are again likely to be conservative. The rates of
increase forecast for worsted and woollens are, however,
nearly all cases less than the rates of increase forecast
for the category as a whole. This is due largely to higher
13.
TABLJt 1.5
FORECASTS OF JA ANESE IMPORTS OFWOOL IN VARIOU PROCESSED FORMS
UNITS 1000 TONNES
19721974
Average
1980 1985
Average Apnual(Incr/Decr) Percent
72-74 80/70/65 /70 72-74 85/80
A. SPUN YARN (Fibre Base)WorstedWoollenNatural/SyntheticBlendsTotal
2.20.6
1.172 .1
1.30.6
2.383.6
1.80.8
3.496.7
30.2138.6
101.5
51.8-19.6
55.436.5
-7.20.9
11. 32.1
7.23.0
B. FABRIC (Fibre Base)WorstedWoollenNatural/SyntheticBlendsTotal
2.61.1
3.0105.3
2.31.3
7.6149.0
2.61.6
12.6202.5
21.113.5
63.064.0
18.7-2.6
87.753.3
-1. 73.0
14.55.1
2.64.0
10.56.3
C. KNITTED GOODS (FibreWorstedWoollenTotal
Base)0.60.32.5
0.60.45.7
0.90.5
12.4
19.219.323.5
46.246.069.8
1.15.5
12.7
6.36.6
16.7
D. CLOTHING (Fibre Base)WorstedWoollenNatural/SyntheticBlendsTotal
2.73.1
4.538.7
6.05.8
18.4140.8
9.17.9
38.2270.9
77.985.4
68.374.1
35.834.6
77.659.1
12.29.0
22.420.3
8.56.5
15.714.0
E. FABRIC CLOTHINGWorstedWoollenTotal
(Yarn Base)1.11.0
19.7
2.41.7
69.9
3.02.6
126.9
69.583.0
107.7
92.1128.9
75.0
11. 77.9
19.9
4.98.8
12.7
F. KNITTEDWorstedWoollenTotal
CLOTHING (Yarn Base)1.62.2
21.5
3.74.1
76.5
6.05.4
156.2
79.685.556.7
20.221.449.7
12.69.5
19.9
10.65.6
15.4
0.09.8
23.19.6
16.0 -3.126.4 6.9
155.7' 13.391.6 17.045.4
base)12.234.6
0.835.7
·1.00 .. 6
0.322.6
0.17.6
0.4
SECONDARY GOODS FOR HOUSEHOLD USE (Yarn, FibreWorstedWoollenNatural/SYntheticBlendsTotal
G.
H. SECONDARYWoollenTotal
GOODS FOR INTERIOR USE (Fibre Yarn Base)2.3 3.4 '4.8 36.47.4 12 .4 16.. 9 30 . 1
28.068.8
6.07.7
6.96.3
1. SECONDARYWoollenTotal
GOODS FOR INDUSTRIAL USE0.1 0.1
28.7 38.50.1
53.917.833.6
0.0127.4
0.94.2
2.47.0
Source: Toyobo Economics .Research Instit~te Report (October 1976)

M.
levels of imports forecast for synthetics and for naturalfibre synthetic blends. The impact of the latter inraising the forecast levels for the total category areshown for categories A, B, D, and G. In all thesecases the natural fibre synthetic blends are substantiallyhigher than for worsted, woollen or total imports.
The forecast volumes shown in Table 1.5 tend tobe greater for products which have been processed to moreadvanced levels. For example, the forecast indicatesthat by 1980 woollen clothing imports will amount to 7900tonnes, nearly a threefold increase from the 1972-4 level.Worsted clothing increases are of similar proportionswith synthetic blend increases being much more dramatic atabout 9 times the 1972-4 level. Forecast volumes arealso substantial for knitted clothing, at 6,000 tonnesand 5,400 tonnes respectively, for worsted and woollens in1980, and for secondary goods for interior use with a 1980forecast for woollens of 4,80p tonnes.
The main implication of these forecasts for NewZealand is that while the total demand in Japan for wooland wool products is expected to grow at a relatively slowrate and for worsteds is expected to decrease (see Table1.3) there will be an increasing import demand in Japan forproducts containing wool. This is likely to be especiallytrue for synthetic blends. Growth in import demand forwool based products is likely to be reflected in growingdemand for wool as a raw material in South East Asiancountries which can add a low cost labour component to thewool in the processing phase. It may of course alsomean both greater opportunities for value added processingin New Zealand, especially at the higher quality end ofthe market and increased opportunities for New Zealandinvestment in South East Asian textile producing operations.
15.
1.5 JAPANESE CARPET DEMAND
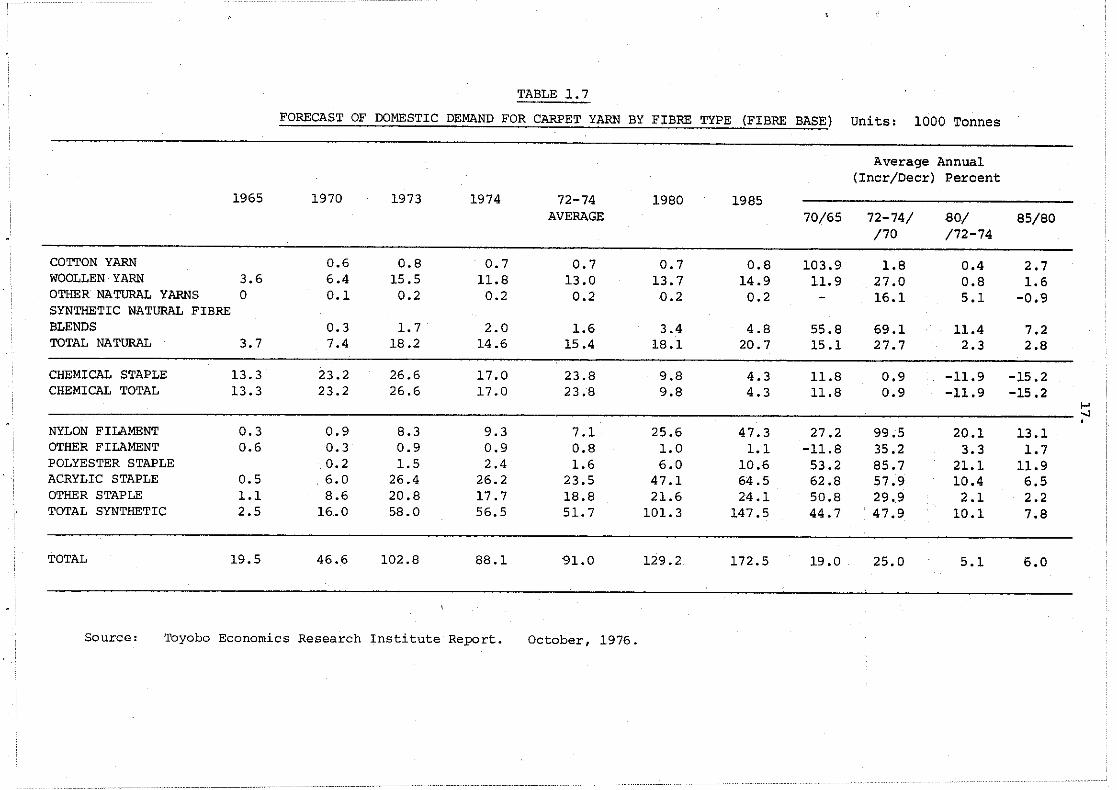
Forecasts of demand by carpet type and by fibre
type are shown separately in Tables 1.6 and 1.7.
Both tables indicate substantial growth in total
demand for carpets with a 5.1 percent per annum growth
forecast for the period between 1972-4 and 1980 and 6.0
percent between 1980 and 1985. Growth for tufted carpet
is expected to be much greater than for needle punch carpet.
Among fibres,forecast demand growth rates are much higher
for synthetics than for natural fibres with nylon filament
and polyester staple being growth leaders. Among
natural fibres principal growth is expected to occur in
synthetic blends with an annual growth rate of 7.2 percent
in the 1980-85 period and a 1.6 percent annual growth rate
in the same period for wool. As a result of the greater
growth projected for synthetics over wool carpet the latter's
share of total carpet demand is expected to fall from 14.2
percent in the 1972-4 period to 8.6 percent in 1985.
Table 1. 7 also shows that the relati-,~,<,ly slowr;growth in demand for chemical fibres (rayon in particular)
in carpet use over recent years will become SUbstantially
negative in both forecast periods.
Some appreciation of the relative levels of market
penetration of carpets and clothing in Japan and the United
States is shown in Table 1.8.
As would be expected from the population differences,
the Japanese market in 1974 for both clothing and for carpet
was substantially smaller than the United States market.
However, in terms of consumption per person Japanese
clothing demand was only marginally smaller than the United
States. Carpet yarn use per head in Japan, on the other
hand was only one quarter of that of the United States in
1974. In 1972 it was only about one eighth of the United
States level and one sixth of the United Kingdom level.
Evidence presented and the data on the past levels
of carpet consumption in Japan shown in Table 1.7 indicate
not only that there has been a rapid increase in carpet

TABLE 1.6
FORECAST OF OOMESTIC DEMAND FOR CARPETYARNBX TYPE (FIBRE BASE)
Units: 1000 Tonnes
Average Annual
1965 1970 1973 1974 72-74 1980 1985 (Incr/Decr) Percent
AVERAGE 70/65 72-74/ 80/ 85/80/70 /72-74
TUFTED 5.3 15.9 54.0 48.3 46.0 82.2 120.0 24.7 42.5 8.6 7.9
NEEDLEPUNCH 0 8.6 20.5 16.3 17.8 19.5 22.1 27.6 1.3 2.5
OTHER 14.2 22.1 28.3 23.5 27.1 27.5 30.4 9.2 7.1 0.2 2.1....a-
TOTAL CARPET19.5 46.6 102.8 88.1 91.0 129.2 172 .5 19.0 25.0 5.1 6.0
YARN
Source: Toyobo Economics Research Institute Report. October, 1976.
Source: Tbyobo Economics Research Institute Report. October, 1976.

18.
TABLE 1.8
U.S.A. AND JAPAN CLOTHING AND CARPET
DOMESTIC DEMAND (1974)
JAPAN U'S.A.
TOTAL (l000 Tonnes)CLOTHING 985.5 1,919.2
CARPET YARN USE 88.1 680.7
TUFTED 48.3 630.5
NEEDLEPUNCH 16.3 20.1
OTHER 23.5 30.0
PER PERSON (Kg)
CLOTHING 8.9 9.06
CARPET YARN USE 0.80 3.21
TUFTED 0.44 2.98
NEEDLEPUNCH 0.15 0.09
OTHER 0.21 0.14
Source: Toyobo Economics Research Institute Report. October, 1976.

19.
consumption in Japan but also that considerable potential
remains for further consumption growth. How far Japan
will go in approaching carpet consumption levels of the
united States and the United Kingdom can only be speculated
upon. Tables 1.6 and 1.7 indicate an approximate
doubling of the total market between 1974 and 1985, and
while household consumption may appear to be constrained
by low levels of living space in Japanese homes, continued
growth in incomes in Japan and government house building
programmes will almost certainly see an expansion of
living space per person although it is unlikely that this
statistic will reach the levels of most advanced western
countries.
Furthermore, the seasonal nature of household
carpet consumption in Japan will continue to impose
distribution constraints on marketing of carpets in Japan.
Because carpet consumption is principally for room warmth
peak demand for carpets is Autumn and Winter. Consequently
department stores provide floor space for only these
periods and wholesalers must adjust the inventory and trade
financing policies to allow for this. The problem is
exaggerated because of the bulky nature of carpets and
the premium on storage space in Japan. New Zealand
companies with aspirations of sharing in the growth of
the Japanese carpet market would be well advised to study
the implications of these and other more general character
istics of the Japanese distribution system.
Appendix II, providing a schematic outline of the
distribution system for carpets in Japan, shows that the
household share of the market is about 70 percent with the
other 30 percent being sold to institutions. The principal
retail outlets are interior decorating specialists, who
are thought to have a sixty percent share of the market,
supermarket chains, and department stores who tend to
specialise in imported higher quality carpets.

20.
From evidence available it is probable that
woollen carpets and possibly woollen synthetic blends
belong in the category of higher quality carpets in Japan.
Table 1.9, for example, summarises the results of attitude
surveys carried out in 1974 and 1975.
Table 1.9 shows that there is overall a stronger
preference for wool over synthetics for carpet use. Although
this preference fell between 1974 and 1975 for male~ it
remained strong for females and actually increased among
females in the younger age groups. It is also interesting
to note that females showed a stronger preference than males
for synthetic carpets but at a much lower level than for
wool carpets. This merely reflects the greater level of
decisiveness among females than males, the latter recording
generally higher percentages of "no preference" answers
than females.
These comparisons also contrast with similar
surveys carried out in 1972 and 1973. These earlier surveys
showed that preferences for wool had narrowed between these
two years. Between 1973 and 1974, however this fall in
preference for wool had reversed substantially with 45.8
percent of males in 1974 preferring wool compared with
31.8 percent and 44.2 percent of females (1974) compared
with 41.3 percent in 1973.
The preferences for wool shown in these surveys
do not, however, appear to be reflected in a rapid growth
in demand for woollen carpets. As noted earlier, Toyobo
Economics Research Institute forecasts indicate an annual
growth in demand of only 1.6 percent per annum in the period
1980-85. In formulating the forecast for wool carpet
consumption the Toyobo report notes that because of the
resilience and other qualities of wool, demand for Wilton
carpet has stabilised at a relatively high price. It
expects that wool carpet will in future become concentrated
and stabilised in the higher price and quality end of the
market. Thus it appears that while there are strong

TABLE 1.9
JAPANESE CONSUMER PREFERENCES FOR WOOL OR SYNTHETIC CARPETS
AGE GROUP1974
PREFER WOOL1975 1974
PREFER SYNTHETIC1975
MALE FEMALE MALE FEMALE MALE FEMALE MALE FEMALE
15 - 19 41.4 36.0 39.6 51.5 13.8 16.0 12.5 20.4
20 - 24 51.7 41.4 31.5 47.1 10.3 31.0 18.5 24.3
25 - 29 54.5 48.0 36.5 49.6 15.2 26.0 9.5 26.4 '"I-'.30 - 34 51.4 31.4 35.9 4 7.0 28.6 33.3 16.3 32.2
35 - 39 38.7 53.3 43.1 45.8 22.6 26.7 10.8 26.3
40 - 49 44.1 48.1 34.6 55.1 14.0 24.2 20.3 20.5
50 - 64 39.6 48.1 33.9 40.7 18.8 17.3 11.0 16.1
TOTAL 45.8 44.2 36.0 48.1 17.2 24.4 14.5 22.9
Source: Yomo Kogyo Tokei Shiryohen 1976. (Wool Industry Statistics 1976) Japan Wool Spinners' Association

22.
consumer preferences for woollen carpet in Japan that this
in its own righ~and possibly the constraint of higher
production cost, will tend to push these carpets to the
higher priced end of the market. While this does not
provide a comprehensive review of evidence on which to
base a marketing strategy for Japan, it does indicate that
department stores and specialist high quality retail stores
should attract most attention in marketing of New Zealand
woollen carpets in Japan. Exploration of alternative or
complementary strategies may be appropriate for both
synthetic blends of various ratios and for institutional
market.
1.6 SUMMARY
Chapter I has sought to provide an overall picture
of changes in the relative importance of different fibres in
the Japanese textile market in the recent past and in the
future. The general picture which has emerged is that
the rapid growth of synthetic textiles in fibre consumption
in Japan will continue into the future with polyesters
playing the leading role and acrylic also exhibiting sub-
stantial growth. Growth rates in demand for chemical
fibres overall is expected to continue to be negative
although there will be continued growth in demand for acetate
staple although from a low base figure.I;
Positive growth in demand for natural fibres in the
future is expected to be sustained largely only by substantial
growth in demand for blends of natural and synthetic fibres.
The role for wool in the Japanese market is not
expected to be one of growing significance. Worsted yarn
in particular is expected to come under increasing pressure
and woollen yarn is expected to show only low growth in
demand. The position of wQol in the supstantial growth
forecast for natural fibre synthetic blends has not been
specified in forecast data reported here.
In addition to the further decline in import
ance of wool relative to synthetics in demand in Japan,
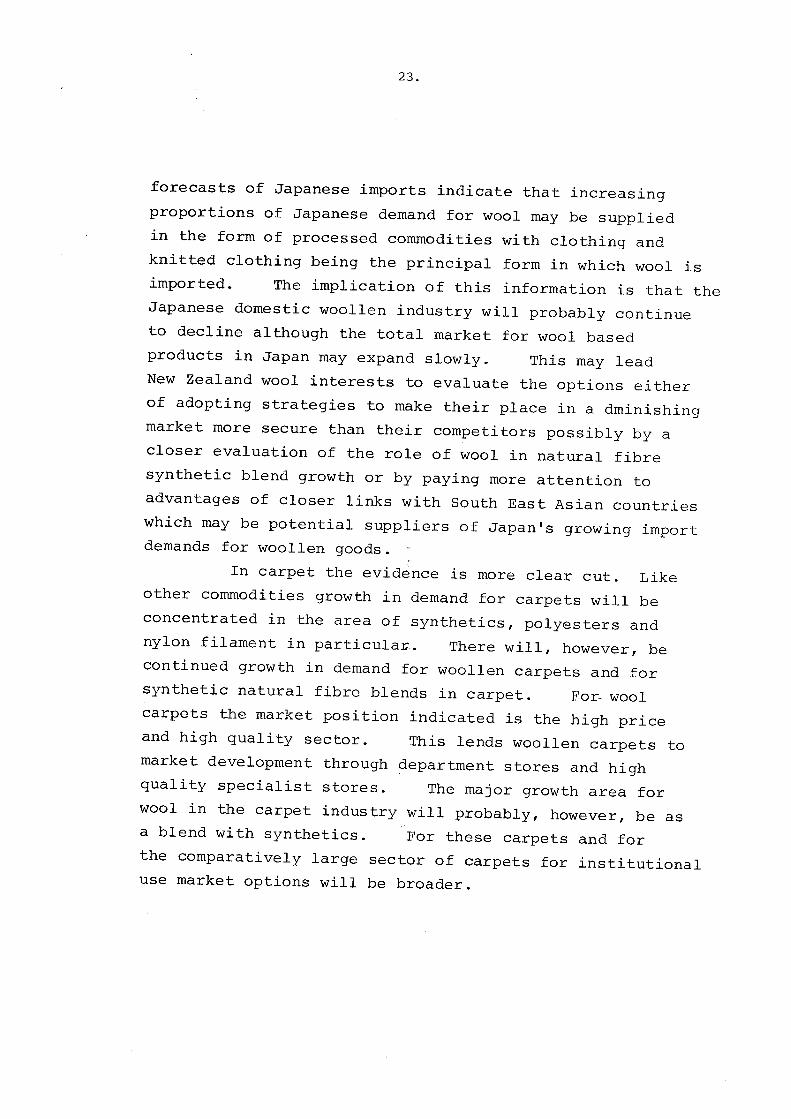
23.
forecasts of Japanese imports indicate that increasing
proportions of Japanese demand for wool may be supplied
in the form of processed commodities with clothing and
knitted clothing being the principal form in which wool is
imported. The implication of this information is that the
Japanese domestic woollen industry will probably continue
to decline although the total market for wool based
products in Japan may expand slowly. This may lead
New Zealand wool interests to evaluate the options either
of adopting strategies to make their place in a dminishing
market more secure than their competitors possibly by a
closer evaluation of the role of wool in natural fibre
synthetic blend growth or by paying more attention to
advantages of closer links with South East Asian countries
which may be potential suppliers of Japan's growing import
demands for woollen goods.
In carpet the evidence is more clear cut. Like
other commodities growth ln demand for carpets will be
concentrated in the area of synthetics, polyesters and
nylon filament in particula~. There will, however, be
continued growth in demand for woollen carpets and for
synthetic natural fibre blends in carpet. For wool
carpets the market position indicated is the high price
and high quality sector. This lends woollen carpets to
market development through department stores and high
quality specialist stores. The major growth area for
wool in the carpet industry will probably, however, be as
a blend with synthetics. For these carpets and for
the comparatively large sector of carpets for institutional
use market options will be broader.

24.
CHAPTER 2
TEXTILE DISTRIBUTION, BUSINESS METHODS
AND MARKET DEVELOPMENT
2.1 INTRODUCTION
Over recent years New Zealand companies have
become increasingly involved in export of textile products
and clothing, especially sheepskin and leather clothing,
to Japan. Most of these companies have been sensitive
to the fact that the Japanese market has a number of
unique and distinctive characteristics. This has lead
many to leave judgement about their place in the Japanese
market completely in the hands of other people, very often
Japanese general trading companies. This in turn has
often lead to development of less than optimal distribution
systems in Japan from the New Zealand point of view.
Furthermore, because they have been unable to develop an
understanding for the way in which various forces in the
market interact, New Zealanders have found it difficult
both to visualise the best market strategy for Japan in
the context of their other markets, and to adjust to or
anticipate changes in the market in Japan.
Although Chapter 2 cannot hope to remedy all the
deficiencies in New Zealanders' understanding of the
Japanese textile and clothing market, its purpose is to
fill in some of the more important gaps in this understanding.
In particular it will, by looking at Japanese textile
distribution from the points of view of Japanese companies,
attempt to throw light on the most difficult and hazy area
of Japanese distribution, the systems of rebates and
discounts and the use of promissory notes and extended
credit periods. It will also attempt to identify the
1. This Chapter should be read in conjunction with otherpublications on the. Japanese distribution system.

25.
various commercial forces which operate in Japanese
textile and clothing distribution and the way in which
they interact.
In addition to being useful for New Zealand
textile and clothing exporters this Chapter is expected
to be of use to other groups. For example, an under
standing of the forces at work in textile and clothing
distribution should be useful for New Zealand marketers
of wool and woollen yarn in anticipating market changes.
It should also be useful to trade policy makers in New
Zealand, particularly those whose interest is developing
appropriate export development incentives.
Chapter 2 will begin by presenting a schematic
description of the Japanese textile goods distribution
system. It will then describe the roles of the various
types of business firms in Japanese textile wholesaling
and the ways in which they relate in business. Finally,
it will look separately at the textile and clothing retail
industry defining the different types of retail store and
characteristics such as their product type, sales levels,
store sizes and financial efficiency. This section will
also present listings of the top 20 clothing stores by
sales and the top 20 specialist clothing stores.
2.2 TEXTILE DISTRIBUTION IN AGGREGATE FORM
Figure 2.1 provides an overall picture of the
structure of textile distribution in Japan. This figure
describes the flow of textile goods through the various
stages of processing from the yarn manufacturers through
retailers to consumers. While the use of a table which
was appropriate for 1965 may seem to lack credibility,
more up to date information would show a flow of product
which is almost unchanged but which is deficient in prov
ision of details of values involved at the various stages.
Thus, while the values in Figure 2.1 may be out of date,
they do provide an appreciation of the relative significance

26.
FIGURE 2.1
DISTRIBUTION OF TEXTILE GOODS 1965
Units: ¥100 million
ndustry andent Demand
ry Processedxports 4475
20% ofail sales)
2253
Yarn IManufacturers
99]1.--.....,.r-----,.,- -....,.-.....T'----.....--.......
Wool Rayon & Synthetics Silk HempStaple Fibre 2736 979 78
3386
Cotton
I I IA98 I I I
."EXPORT 1318
~7400 1200
Weavers (Fabric ~~~~II 1.1 Knittina Cos.
T1 1IDyeing I ~ewing
~ 2500
- 1st WholesalerSeconda. 19,000 .Good E
1".
6200
<. ",econaary Other IWholesaler 9,300 --.. Governm
2000
9300
'-Small
Large Scale Department storeRetailers (504 shops)
19,800Retailer (2171 stores) = (Approx
13 100 3000 3700all ret
I~ • ~M"",",Textile Expend-iture 73400
""
l.Yarn WholesaleStage(Ito oroshi)12850
2.Half-finishedGoods.Wholesale Stage22800(Seihinka Orosh1
3.Finished goodsWhol'esaleStage(Seihin Oroshi)25200
Total 1 +2 + 3
Retail
61,000
= 19,800
total Distripution= 81,000
Source: Torihi~i Joken Ho Jltsuno(A~tual·State of Tran8~ction
Conditions) M.I~T.I. 1972.

27.
of different types of yarn and the relative sizes ofdifferent classes of manufacturers and distributors.
According to Figure 2.1 woollen yarn production in 1965 accounted for 22.7 percent of all yarn product-ion by value. This compares with 47.1 percent forsynthetics and 34.0 percent for cotton. Later informationcalculated on a weight rather than a value basis indicatesthat the wool share of yarn output was 9 percent, synthetics41.1 percent, cotton 30 percent, and chemical fibres(rayon and acetate) 9.8 percent. The differences inpercentages between 1965 and the more recent (1974) figuresindicates both the growth in relative importance ofsynthetics and the lower price/weight regime of synthetic2yarn.
The total value of textile goods distributedin 1965 was about $NZ 274,000 million. Of this 24.4percent of this value was added at retail level, 15.7percent at the yarn wholesale level, 28.1 percent bywholesalers of semi finished goods and 31.8 percent bywholesalers of finished goods.
Other points of note in Figure 2.1 are that insome cases goods are returned to their sources_ Thisusually indicates that a certain function, for exampledyeing, is done on a commission basis and after completionis returned to the weaver or wholesaler. The generallength of the processing distribution chain is also ofinterest. In some cases tertiary wholesalers mayexist to lengthen the chain even further. In additionwholesalers may be differentiated further by theirfunction. This becomes especially apparent in thedistribution of fabrics. This is illustrated in thenext section.
2. More recent figures come from Toyobo EconomicsResearch Institute Report, October 1976.
28.
2.3 FABRIC WHOLESALERS BY TYPE
Figure 2.2 identifies in particular various
classifications of wholesalers with different charact-
eristics. The key to these characteristics lies in the
names by which they are known. For example, "kaiSugi oroshi"
or sub wholesaler, literally means a wholesaler (oroshi) who
buys by succession. Moto oroshi means a basic or funda
mental wholesaler and this implies that he has other
wholesalers under his influence, while the term shusanchi
oroshi refers to a wholesaler who assembles the fabric
at a collection point and further distributes it.
Central roles in distribution are played by
moto wholesalers and shusanchi wholesalers. Most of the
former are actually the textile departments of General
Trading Companies of the sort represented in New Zealand
and have head offices either in rokyo or Osaka. The
dominant role of these companies is in activities such as
trade financing and planning of dyeing requirements of the
market. Their preferential access to finance through
their close association with the' banking system gives them
a powerful position in an economy whose distribution system
is characterised by the length of credit terms.? Their
function in planning of dyeing will be performed after
consultation with shusanchi wholesalers and the sewing mills.
Shusanchi wholesalers may themselves perform the same
function as moto wholesalers but they will principally sell
to a smaller wholesaler or to a~etailer. They may at
times sell (or buy) direct to (or from) a sewing mill.
Their main relationship with the sewing mill, which is
usually very small in scale, will however, be consignment
of fabric for processing.
3. For further discussion of the relationship betweentrading companies see "Structure and Corporate Relationships in the Japanese Wool and Wool TextileIndustries" A.E.R.U. Market Research Report No 9.p.46-Sl.

FIGURE 2.2
FABRIC DISTRIBUTION IN JAPAN
FABRIC DEALER
SHOSHA/WHOLESALER(Moto Oroshi)
SpinningCompany
RETAILER
CO-OPERATIVES' CONSUMER(Mainly Civil Servants)
LOCAL WHOLESALER(Shusanchi OroShi)It!~~~----t---~~S!E~WUIlN~G~M~IUL~L~J
SpecialityCompany
SUB WHOLESALER(Kaitsuigi Oroshi)
Main Sales Route
___•• Other Sales Route
--...
---+ Consignment of goods forprocessing
CONSUMER
Source: Torihiki Joken Jitsuno(Actual State of Transaction Conditions) M.I.T.I. 1972

30.
2.4 CHARACTERISTICS OF FABRIC WHOLESALERS
The previous section has noted the pivotal role
of shusanchi wholesalers in textile distribution in Japan.
Figure 2.2 reconfirms that the bulk of the fabric distributed
in Japan passes through their hands. As a consequence
they are representative of many of the most notable
features of Japanese textile distribution. This section
will highlight some of these characteristics.
The first point of note is that shusanchi
wholesalers like many other commercial organisations in
Japan carry with them a number of regional distinctions or
specialties. These specialties are illustrated in Table
2.1.
Table 2.1 shows that TOkyo wholesalers tend to
specialise in western style process goods, Osaka in
suiting fabric, Nagoya in bedding and Kyoto in traditional
Japanese style fabrics. Such specialisation among
wholesalers reflects regional production patterns. Table
2.1 also indicates that substantial regional differences
exist in sizes of companies, with Osaka for example, having
higher sales levels per company than other cities with
Kyoto the smallest sales levels.
The complexity of Japanese textile and clothing
distribution is well known. Tables 2.2 and 2.3 showing
the significance of different sources of supply of shusanchi
wholesalers and their sales breakdown helps illustrate this
complexity as well as illustrating again some interesting
regional distinctions. The dominant supplier to
shusanchi wholesalers in all cases but Tokyo is the moto
whole;s~l~r. When the percentage of purchases from that
source-is combined with purchases from sub wholesalers the
dominance of>purchases by shusanchi wholesalers from other','",. , .
wholesalers becomes \ even more clear cut. In Kyoto, for
example, this reaches 50 percent. Purchases directly from
spinning companies are greater in Tokyo and Osaka. In this
case the spinning company has probably had fabric woven for
;
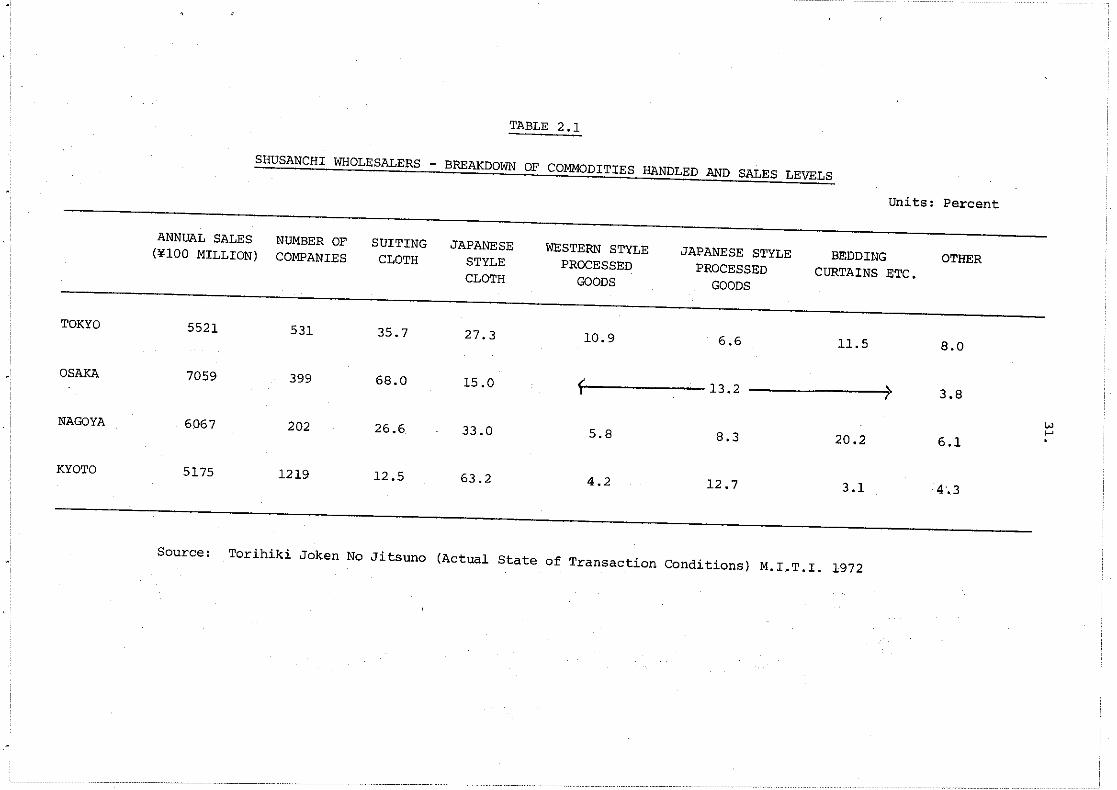
TABLE 2.1
SHUSANCHI WHOLESALERS - BREAKDOWN OF COMMODITIES HANDLED AND SALES LEVELS
Units: Percent
ANNUAL SALES(¥lOO MILLION)
NUMBER OFCOMPANIES
SUITINGCLOTH
JAPANESESTYLECLOTH
WESTERN STYLEPROCESSED
GOODS
JAPANESE STYLEPROCESSED
GOODS
BEDDINGCURTAINS ETC.
OTHER
Source: Torihiki Joken No Jitsuno (Actual State of Transaction Conditions) M.I.T.I. 1972
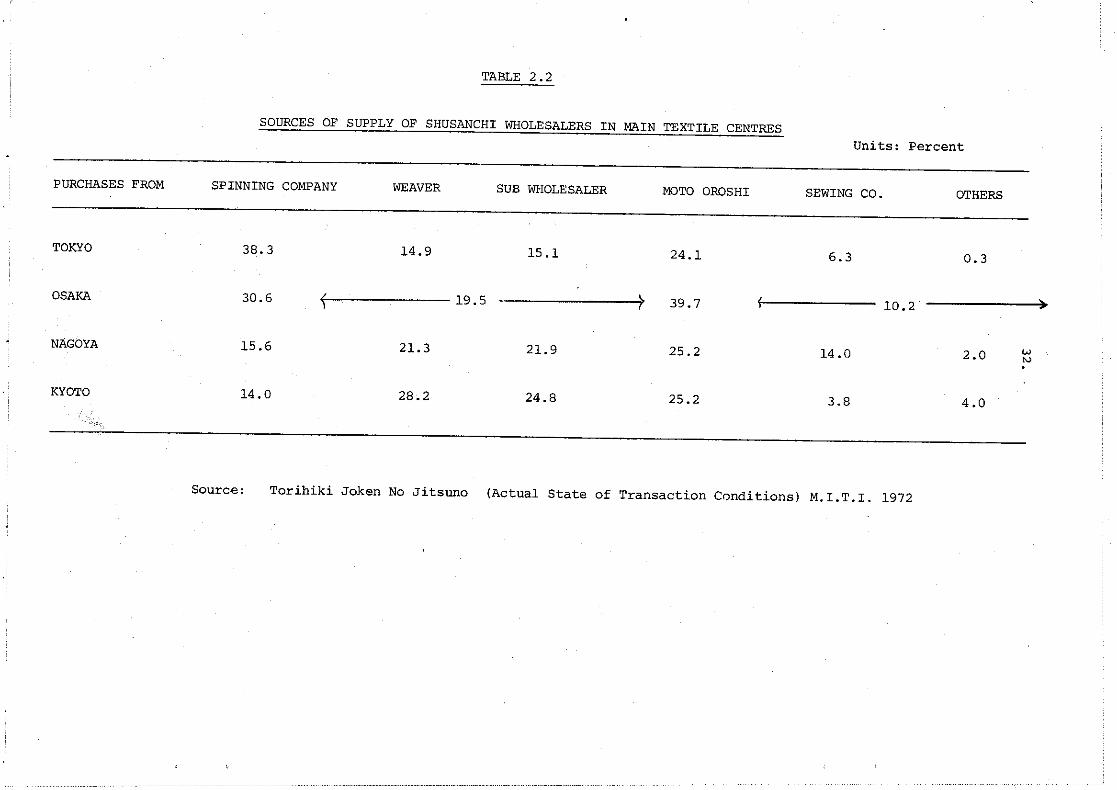
TABLE 2.2
SOURCES OF SUPPLY OF SHUSANCHI WHOLESALERS IN MAIN TEXTILE CENTRESUnits: Percent
PURCHASES FROM SPINNING COMPANY WEAVER SUB WHOLESALER MOTO OROSHI SEWING CO. OTHERS
TOKYO 38.3 14.9 15.1 24.1 6.3 0.3
OSAKA 30.6 ( 19.5 > 39.7 ( 10.2 )-,
NAGOYA 15.6 21.3 21.9 25.2 14.0 2.0 w
'".KYOTO 14.0 28.2 24.8 25.2 3.8 4.0
'-'J.-.
Source: Torihiki Joken No Jitsuno (Actual State of Transaction Conditions) M.I.T.I. 1972

33.
it on a commission basis by a weaver.Table 2.3 also indicates that high proportions
of sales by shusanchi wholesalers are sales to otherwholesalers. This is especially true for Osaka whereover 50 percent of sales are to other wholesalers. Inother centres sales to retailers are dominant.
These two tables jointly indicate that thedistribution/processing chain is longer in Osaka overallthan for the other three centres with high proportions ofshusanchi wholesalers'purchases coming from other wholesalers. This characteristic is a reflection of Osaka'sdominance in the textile trade and its reputation of beingthe centre of commerce in Japan.
While a number of general functions of fabricwholesalers in Japan would be familiar to people in thetextile trade in New zealand, they differ in their relativesignificance to the operation of the business. From thediscussion of shusanchi wholesalers presented so far in thissection it will be clear that the Japanese distributionsystem for textiles and clothing is considerably longer andmore complicated than is normal for New Zealand. Some ofthese complications are a reflection of methods_of transacting business especially of the critical role of tradecredits and subsequent risk taking in Japanese distribution.This will become more apparent in the next section as willthe relative significance of the principal functions ortextile who,lesalers in Japan. These can be described asfollows:
(a) Marketing of new products. This is a functionwhich is required for each new season as fashionschange and includes such activities as demonstration of new designs and taking provisional ordersfor these. These orders are usually communicatedto manufacturers such as weavers as firm orders.They then begin production runs. Because thisactivity involves considerable risk to wholesalers
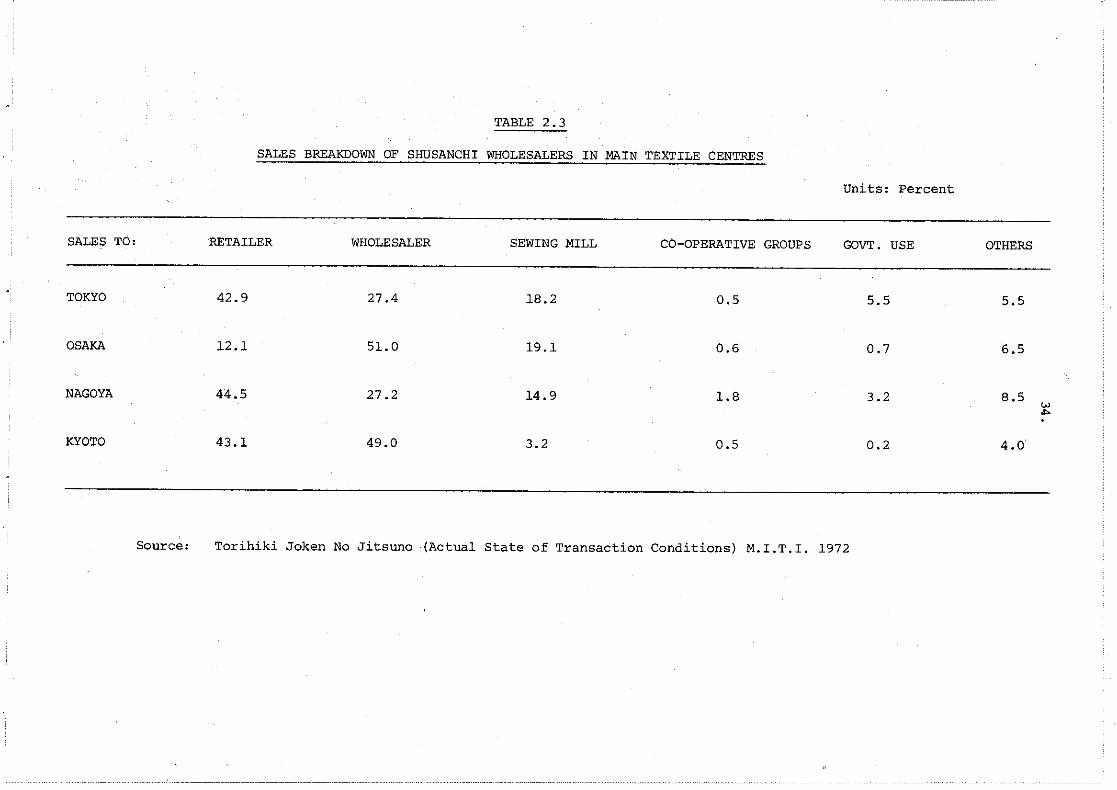
TABLE 2.3
SALES BREAKDOWN OF SHUSANCHI WHOLESALERS IN MAIN TEXTILE CENTRES
Units: Percent
SALES TO: RETAILER WHOLESALER SEWING MILL CO-OPERATIVE GROUPS GOVT. USE OTHERS
TOKYO 42.9 27.4 18.2 0.5 5.5 5.5
OSAKA 12.1 51.0 19.1 0.6 0.7 6.5
NAGOYA 44.5 27.2 14.9 1.8 3.2 8.5w
"'"KYOTO 43.1 49.0 3.2 0.5 0.2 4.0
Source: Torihiki Joken No Jitsuno(Actua1 State of Transaction Conditions} M.I.T.I. 1972
35.
the element of faith, and moral obligation andthe consequent need for close personal relationships features prominently in Japanese distribution.
(bl Pricing. The wholesaler usually establishesthe retail price for the retailer at the sametime establishing the retailers mark-up. Thisactivity is imposed upon the wholesaler largelybecause it is also his function as the principalrisk taker in the distribution system, to assessthe probable demand for the product and besensitive to competitive elements in the market.
(cl Information communication. The function of thewholesaler in assessing demand and marketdevelopments is a continuous one and it is partof his function to communicate such changes bothto and from retailers and backwards along theprocessing/distribution chain. In fact thisfunction is to protect his own position andespecially to minimise returns of unsold goodsfrom retailers.
2.5 BUSINESS TRANSACTIONS IN JAPANESE TEXTILEDISTRIBUTION
The methods used to transact business in Japanlie at the heart of the problem of developing an understand-ing of the Japanese distribution system. Foreigners withany curiosity about the Japanese distribution system quicklylearn that distribution channels are long and complex. Alittle more experience will, however, teach them that thereare considerable variations in distribution systems fromcommodity to commodity and that the complexities tend to begreater where the type of commodity concerned has a longerhistory of sale in Japan. Textiles belong to this latter

36.
be described
sales existtransacting
These can
category and can be compared with more recently developed
goods such as electronics.
That the distribution chain for textiles is
long in Japan has been noted in the previous section.
This section deals more with the complexities of distribution
in Japan. As such it is hoped that it will indicate to
New Zealanders with aspirations of selling in Japan, that
the Japanese system is different ~nd places distinct
constraints on their activities. With an understanding
of this New Zealanders will be in a much stronger position
to provide appropriate motivation for Japanese distributors
and could be more discriminating in their selection of
distributors. Such an understanding would without doubt
do a great deal to ensure their success in the Japanese
market and cope with its downturns.
This section will deal with the characteristics
of Japanese textile distribution which appear as complexities
to the eyes of most New Zealanders. These include the
various methods of sale, the use of rebates and trade
discounts, the return of unsold goods to wholesalers, and
use of extended periods of credit formalised by the
exchange of promissory notes.
Three common methods of
in the Japanese textile industry.
as follows:
(a) Straight purchasing. This is a straightforward
method of sale although it is nearly always
associated with extended payment periods and is
subject to other variations such as the payment
of rebates.
(b) Sales on a consignment basis. This is more
common where sales are through department
stores and are imposed by these retail outlets
who use the power inhe~ent in their pre-eminent
37.
position in quality goods retailing in Japan.
(c) "Digestion stocking" (shoka shire) is usually a
variation of the sales on consignment method
and again is imposed largely by department stores.
The term in fact means the regular replacement
of stocks as they are sold. This is an
obligation of the wholesaler and it means that
the retailer is able to use a higher proportion
of his total space as sales space rather than
having to carry a lot of stocks on his premises.
The system of rebates of various types applying
to sales is another feature of distribution in Japan, and
textile distribution is no exception. The complicating
feature of rebate usage is that rebates are very flexible
and seldom formalised and the criterion for use of
rebates is the competitive status of the particular trade.
Furthermore, the use of rebates is closely linked with the
establishment and maintenance of close personal contact
with retailers so that the rebate strategy and business
entertainment sales strategy are often difficult to
distinguish.
Trade discounts in textile distribution are,
however, less common. Of 318 wholesale companies covered
by the M.l.T.l. study referred to earlier, only 17 percent
applied volume discounts on sales. 4 As indicated earlier,
delivery frequency is extremely high and if anything it
tends to become more frequent because of the growth in
diversity of merchandise carried by retailers who, because
of space limitations, must carry lower volumes of
individual merchandise lines as their range of stock
increases. The M.l.T.l. survey indicated that 52 percent
of wholesale companies surveyed had some individual
customers to which they had to deliver each day. The most
4. Torihiki Joken No Jitsuno (Actual State of TransactionConditions) M.l.T.l. 1972.
38.
common frequency, however, was one delivery for every two
to seven days.
Return of unsold goods is a constant problem of
wholesalers and the problem is highlighted in relations
with department stores. In fact, from the survey more
than 10 percent of all sales to department stores were
returned to wholesalers for 42 percent of all wholesalers
surveyed. The costs associated with returns of unsold
goods are also covered by wholesalers in about 60 percent
of cases. Further details of unsold goods returned are
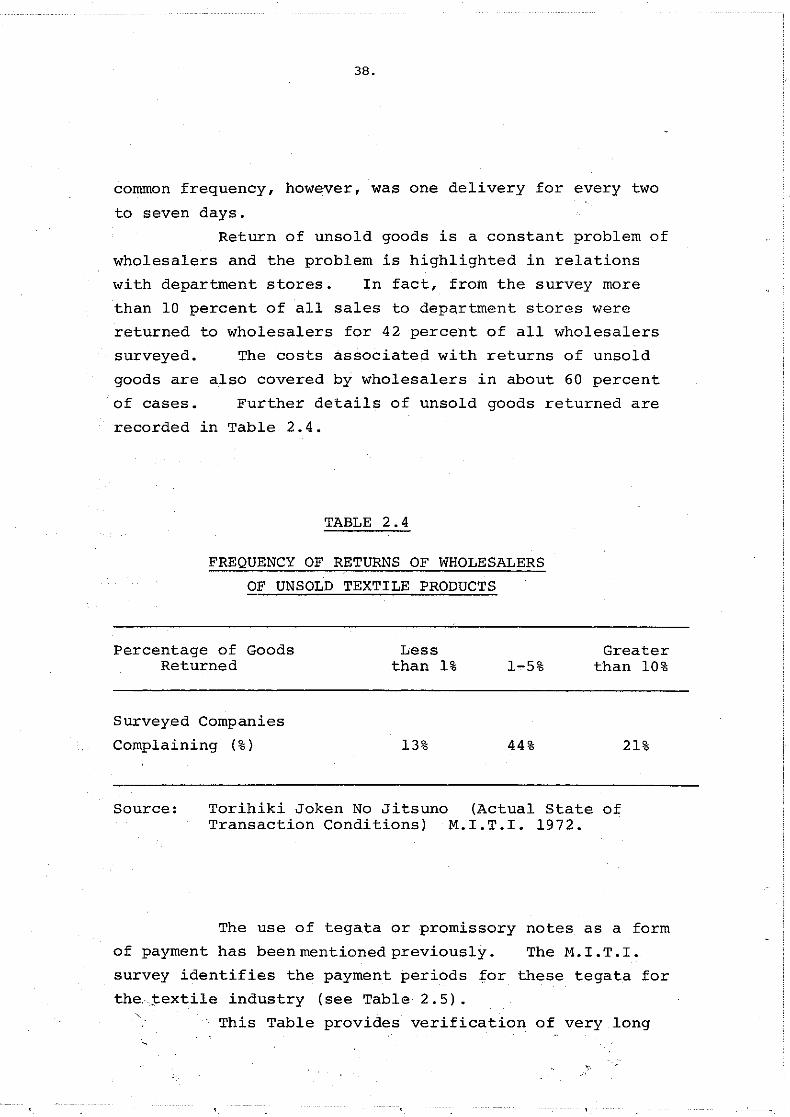
recorded in Table 2.4.
TABLE 2.4
FREQUENCY OF RETURNS OF WHOLESALERS
OF UNSOLD TEXTILE PRODUCTS
Percentage of GoodsReturned
Surveyed Companies
Complaining (%)
Lessthan 1%
13%
1-5%
44%
Greaterthan 10%
21%
Source: Torihiki Joken No Jitsuno (Actual State ofTransaction Conditions) M.I.T.I. 1972.
The use of tegata Or promissory notes as a form
of payment has been mentioned previously. The M. I. T. I.
survey identifies the payment periods ~or these tegata for
the.~extile industry (see Table 2.5).
This Table provides verification of very long
39.
payment periods common in textile product distribution withmost wholesalers giving trade credits in excess of 90 daysand many in excess of 120 days. However, wholesalers doreceive trade credits for their purchases as well andthese are usually for periods even greater than those whichthey give to their own buyers. Many use this financialleverage in a trade promotional way by leaving money in aretailers account in the form of a n sales credit n.
As has been noted earlier, the general tradingcompany (moto wholesaler in textile distribution) plays asignificant role in financing textile distribution.Rather than taking promissory notes to banks to beconverted to cash at a discounted rate, holders actuallytake them to general trading companies for this purpose.The trading companies then consolidate the notes into asingle trading company note which can in turn be readilydiscounted by trading banks at the Bank of Japan.
The advantage of this system for the bank isthat it transfers the risk of holding small company notesto the trading company. To the smaller client theadvantage is that he can borrow at better rates from thetrading company than the bank and without compensatingbalances. For the trading company the advantage isthat since its popular image and ranking in industry isdetermined by its sales volume these financial activitiesmake a direct contribution to this.
The other unique feature of Japanese textiledistribution is that of sending a wholesale companyemployee to the retail outlet to act as a sales clerk.The M.I.T.I. Survey indicated that 27 percent of wholesalerssurveyed did this. In most cases the retailer was adepartment store. Of wholesalers performing this function74 percent indicated that they were forced to do so becauseof competitive pressures, or they had been asked, or morecorrectly that they chose to do so because they felt theirown sales staff to be more knowledgeable and more highlymotivated.

40.
TABLE 2.5
AVERAGE PAYMENT PERIODS ASSOCIATED WITH
PROMISSORY NOTES IN THE WHOLESALE TEXTILE INDUSTRY
PERCENTAGE OF FIRMS GIVING CREDITTokyo Osaka Nagoya
o - 30 days 1 2 1
31 - 60 days 7 8 17
61 - 90 days 22 20 23
91 -120 days 43 36 33
over 120 days 26 34 26
Source: Torihiki Joken No Jitsuno (Actual State ofTransactions Conditions) M.I.T.I. 1972
The power of the department store in distribution
compared with the wholesalers is also indicated in other ways.
It is common for example, for department stores to ask the
wholesale company sales clerk to perform other retail functions
such as price labelling and display of merchandise. Similarly
it is not uncommon for a wholesaler to be asked to support
department store promotions by selling below cost. The
alternative to the wholesaler may be return of unsold goods
and/or a loss of prospective business through the department
store. For seasonal commodities this will mean a loss of
department store sales ·space for the next selling season.
The competitive relationship between the department
store and wholesaler in some ways is again a reflection of
Japan's dualistic economic structure with the department
store being equivalent to the large efficient company in the
manufacturing sector and the wholesaler equivalent to the
small subcontract manufacturer. In this case, however, the
power of the department store is not so much its relationship
with large financial institutions but its traditional signific-

41.
ance in retailing in Japan and especially the productquality image associated with it.
This section has attempted to provide readers withan understanding of the fundamental features of Japanesetextile distribution. Rather than simply stating that theJapanese distribution system is long and complex it hasattempted to describe why it is complex. Moreover, insteadof merely describing the complexities it has, by outliningthe results of the M.I.T.I. survey, evaluated these complexities. It would be wrong, however, to suggest that it hasbeen comprehensive in its coverage of the complexities ofJapanese distribution or that it provides a completeunderstanding of fundamentals. Such an exercise wouldprobably be of academic interest only to readers whoseobjective is to market successfully in Japan.
Nor has this section attempted to provide a formulafor marketing success in Japan. It is not likely thatmany New Zealand businesses will need to use the businesstechniques described. However, it is significant thatthey should be aware of them for this awareness will makethem more sensitive to the conditions under which theirJapanese trading partners operate and should thereforemake them better able to judge the relative credibilityand qualities of Japanese business firms. Furthermore,an indication of knowledge of the Japanese system byNew Zealand companies should result in greater respect fromthe Japan side and lead to a more rapid development of closehuman understanding, so critical in Japanese business.
2.6 JAPANESE TEXTILE AND CLOTHING RETAILINGPerhaps the most elusive and perplexing aspect
of Japanese business for the £oreign businessman wishing tosell conSumer goods or partly finished goods in Japan is theidentification of the market niche into which his commoditywill best fall, and indeed, identification of what niches
42.
do actually exist. The toreign businessman usually reliessolely on his importer or wholesaler for this identification.This carries with it two principal dangers. The first isthat it assumes that the wholesaler is able to identify theappropriate market niche. The second is that it assumesthe wholesaler himself is able to place the product in theappropriate niche. Because of the need to develop closepersonal relationships in Japanese business the wholesalergenerally has considerable limitations on the number andrange of retailers (or wholesalers further down thedistribution chain) he is able to influence. If he doesmake a commitment to a new product he will generally bemaking a judgement about his ability to sell the productthrough his own chain, rather than through the best or evenan appropriate chain. This limitation remains even ifhe is able to identify the best chain.
Consequently, in order merely to identify asuitable importer or wholesaler it is important forforeign businessmen to establish some sensitivity for theappropriate market niche for their product. Furthermore,identification of the market niche for one's own andcompetitive products is an essential weapon in the armouryof many marketing men in their "intuitive" decision makingabout marketing activities.
The problem of building up a feel for the market ina country like Japan is, for many New Zealanders whoseexperience is usually confined to the domestic market, orat most to markets where English is the standard language,is very great. Not only is the Japanese market vast but,because of language, cultural and regional differences ithas many strange and new dimensions. Coming to gripswith these takes a great deal of time. A number ofaids do exist-but these are mainly in the form ofstatistical descriptions of markets. These, althoughvaluable, often leave the reader little better off in hisunderstanding of the real character of the market. Thissection in addition to providing a statistical description
43.
of textile and clothing retailing will attempt, by describ
ing characteristics such as the significance of different
sorts of commodities to different types of retail outlet,
to provide a greater insight to this market than is possible
through a purely statistical description.
This will begin by reference to Figure 2.3. This
figure relates the volume of textile retail sales generally
to the frequency of demand for the product type and shows
where supermarkets, department stores and specialist
retailers fit into this relationship.
Fig~re 2.3 indicates that there is a general gradient
from supermarket~which tend to concentrate on sales of
volume textile goods such as tea towels or daily use clothing
such as business shirts, through to department stores
(moderate volume sales and moderately frequently used goods).
to specialist retail stores whose predominant sales are of
goods with low use frequencies and with low sales volumes.
Appendix III provides further information about
these store types by listing for all Japan both the top
twenty retail clothing stores ranked by sales, and the top
twenty specialist retail clothing stores. It is notable
that none of the specialist clothing stores in ~975 had
sales large enough place them in the top twenty in total.
Top sales rankings are dominated by department stores and
supermarkets. These two tables, by describing store
types, specialty areas of activity, and numbers of stores
in the chain, also provide useful information for New
Zealand organisations with more specific and advanced
marketing plans in Japan.
The classification of retail stores used in Appendix
III is also followed in Table 2.6, which shows trends in
sales by the various types of retail outlet. This table
indicates principally the dominance, albeit declining, of
specialist retail stores at Over 40 percent of all sales,
and the growth in importance of both supermarkets and
department stores in the 1970-75 period. The share of
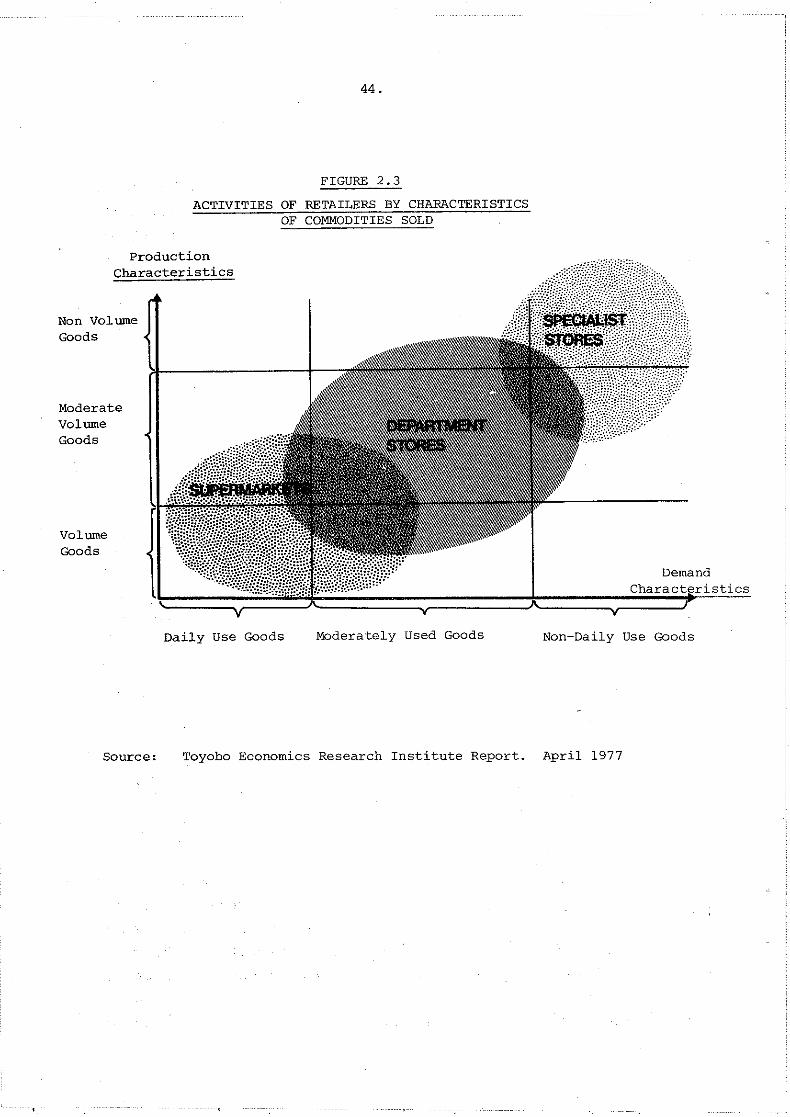
44.
FIGURE 2.3
ACTIVITIES OF RETAILERS BY CHARACTERISTICSOF COMMODITIES SOLD
ProductionCharacteristics
DemandCharacteristics
IvvvI.
VolumeGoods
Non VolumeGoods
ModerateVolumeGoods
Daily Use Goods Moderately Used Goods Non-Daily Use Goods
Source: Toyobo Economics Research Institute Report. April 1977

T!\,BLE 2.6
TRENDS IN SALES OF CLOTHING BY STORE TYPE
Units: ¥100 Million
AVERAGE ANNUAL INCREASE RATE1970 1971 1972 1973 1974 1975
1970-1975 1970-1973 1973-1975
SUPERMARKETS 9,192 11,003 12,780 15,878 18,752 21,152 18.1 20.0 15.4(24.6) (26.0) (26.6) (27.8) (28.0) (28.6)
DEPARTMENT STORES 7,664 8,799 10,374 13,061 15,752 17,500 18.0 19.4 15.8(20.5) (20.8) (22.1) (22.9) (23.5) (23.6) ..
'"SPECIALIST RETAILERS 18,063 19.869 21,995 24,910 28,746 31,276 11.6 11. 3 12.1
(48.3) (46.9) (45.3) (43.5) (42.9) (42.3)
DISCOUNT STORES 1,669 1,797 1,949 2,139 2,461 2,646 9.7 8.6 11.2(4.5) (4.2) (4.0) (3.8) (3.6) (3.6 )
OTBERS 810 892 992 1,124 1,306 1,383 11.3 11.5 10.9(2.1) (2.1) (2.0) (2.0) (1. 9)
TOTAL 37,398(100)
42,360(100)
48,035(100)
57,112(100)
67,017(100)
73,957(100)
14.6 15.2 13 .8
NOTE: Others include small neighbourhood consumers co-op stores, agriculture co-cps andwelfare establishments within companies etc.
SOURCE: Toyobo Economics Research Institute Report. April, 1977.

46.
clothing sales by supermarkets of nearly 30 percent may
seem surprisingly high. However, it should be remembered
that for many of these clothing sales were once their basic
activity and that they have diversified from this into food
and other product lines.
An indication of pricing policies pursued by
different types of retail outlet is provided in Table 2.7.
This table shows prices in index form for a range of
clothing types and bedding.
Table 2.7 introduces a further category of retail
store. The ordinary retail store described in this table
includes the specialist store noted in earlier tables. A
glance at this table shows that in all cases supermarket
prices are cheaper than those of their of the other two
categories, usually by a substantial margin. This is a
reflection of the high volume lower margin policies of
supermarkets. For all of the twenty three items listed
but five, department store prices were highest, a
reflection of the link between prestigious image associated
with department stores, and price. In many cases,
however, the difference in price between department stores
and ordinary retail stores is quite small. ~he overall
price difference from highest to lowest, however, was very
large with women's dresses differing by up to 63.8 percent
in price and the general spread being of the order of" 30-50
percent.
Tables 2.8 and 2.9, with the same three clas
retail store, show firstly the importance of different
sorts of retail outlet in selling a wide range of clothing
and bedding items (Table 2.8) and, secondly, the relative
significance of different clothing and textile items in
the sales of different types of retail outlet. To some
degree Table 2.9, as well as ranking the importance of
different items for different retail outlets, shows the
proportion of the particular items handled by the retail
outlet concerned. Table 2.8, however, shows all items of
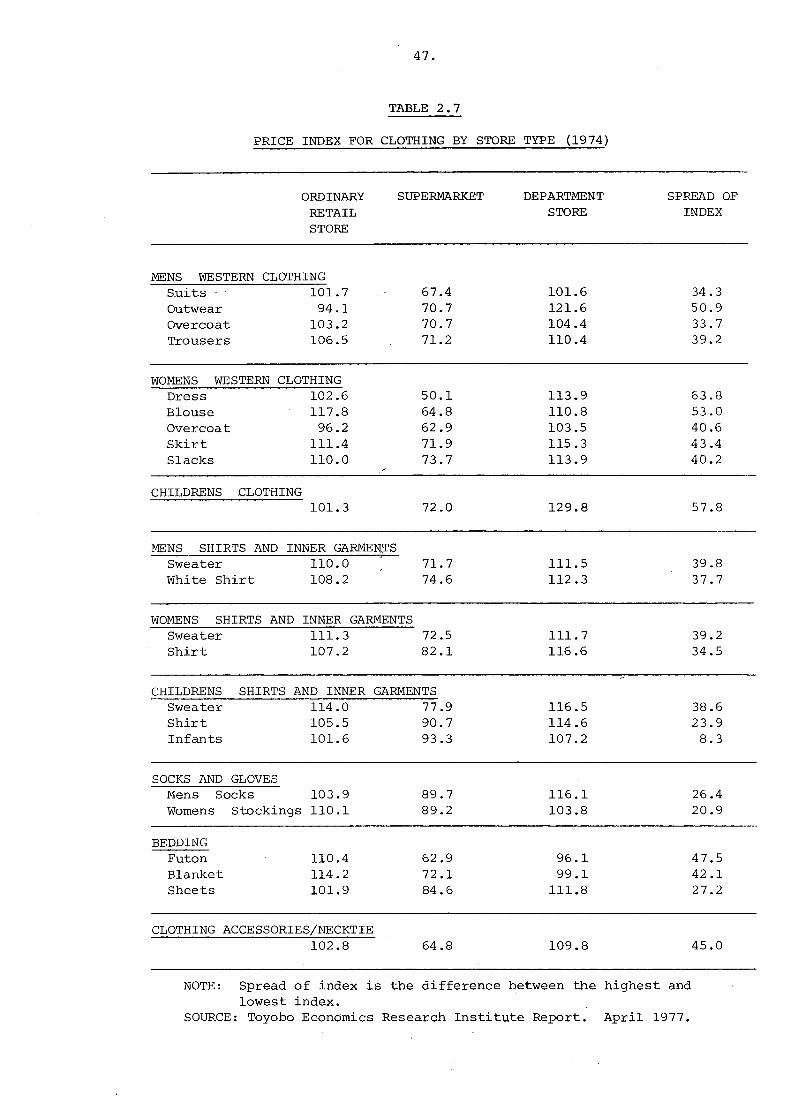
47.
TABLE 2.7
PRICE INDEX FOR CLOTHING BY STORE TYPE (1974)
MENS WESTERNSuitsOutwearOvercoatTrousers
ORDINARYRETAILSTORE
CLOTHING101. 794.1
103.2106.5
SUPERMARKET
67.470.770.771.2
DEPARTMENTSTORE
101.6121.6104.41l0.4
SPREAD OFINDEX
34.350.933.739.2
101.3CHILDRENS CLOTHING
WOMENS WESTERNDressBlouseOvercoatSkirtSlacks
CLOTHING102.6117.8
96.2l11A1l0.0
50.1 113.9 63.864.8 1l0.8 53.062.9 103.5 40.671.9 115.3 43.473.7 113.9 40.2
72.0 129.8 57.8
MENS SHIRTS AND INNER GARME~~S
Sweater 110.0 'White Shirt 108.2
WOMENS SHIRTS AND INNER GARMENTSSweater 111.3Shirt 107.2
71. 774.6
72 .582.1
1l1.5112.3
111.7116.6
39.837.7
39.234.5
CHILDRENSSweaterShirtInfants
SHIRTS AND INNER114.0105.5101.6
GARMENTS77.990.793.3
116.5114.6107.2
38.623.98.3
SOCKS AND GLOVESMens Socks 103.9Womens Stockings 110.1
BEDDINGFutonBlanketSheets
1l0.4114.2101.9
89.789.2
62.972 .184.6
116.1 26.4103.8 20.9
96.1 47.599.1 42.1
111.8 27.2
CLOTHING ACCESSORIES/NECKTIE102.8 64.8 109.8 45.0
NOTE: Spread of index is the difference between the highest andlowest index.
SOURCE: Toyobo Economics Research Institute RepOrt. April 1977.

48.
TABLE 2.8
PROPORTIONS OF DIFFERENT CLOTHING AND BEDDINGSOLD BY DIFFERENT OUTLETS
ORDINARY SUPERMARKETSRETAILERS
DEPARTMENTSTORES
OTHERS
JAPANESE CLOTHINGMensWomensChildrens'
MENS WESTERN CLOTHINGSuitsJacketsOvercoatsSports Trousers
WOMENS WESTERN CLOTHINGSuitsBlousesOvercoatsSkirtsSlacks
MENS SHIRTS AND INNER GARMENTSSweatersWhite Shirts
56.060.753.9
44.535.337.346.5
44.436.230.733.741.5
35.729.4
7.13.04.6
2.48.36.2
15.1
5.115.45.3
20.020.5
17.119.6
28.624.536.5
38.736.850.732.3
43.741.655.840.732.9
41.346.6
8.311.8
5.0
14.419.65.86.1
6.86.88.25.65.1
5.94.4
WOMENS SHIRTS AND INNER GARMENTSSweaters 38.7Shirts 31.0
18.730.4
37.832.1
4.86.5
CHILDRENS SHIRTS AND INNERSweatersShirtsInfants Inner Garments
SOCKS AND GLOVESMens SocksWomens Stockings
BASIC YARNS AND FABRICSsilk FabricCotton FabricChemical Fibre FabricWoollen FabricWool Yarn
BEDDINGFutonBlanketsSheets
CLOTHING ACCESSORIESHatsNeck Ties
GARMENTS29.428.133.7
35.134.2
57.855.656.459.359.3
60.652.946.5
33.928.8
30.040.430.2
29.833.3
1.616.314.3
7.17.1
10.912.617.4
16.98.8
36.127.233.7
28.822.2
17.820.022.625.325.3
16.622.726.7
42.459.2
4.54.32.4
6.310.3
22.88.16.78.38.3
11.911.89.4
6.83.2
Source: Toyobo Economics Research Institute Report. April 1977.

TABLE 2.9
SIGNIFICANCE OF DIFFERENT CLOTHING AND TEXTILE ITEMS FOR DIFFERENT RETAIL OUTLETS (1974)
ORDINARY RETAILERS SUPERMARKETS DEPARTMENT STORES
RANK OF COMMODITY SHARE OF COMMODITY SHARE OF COMMODITY SHARE OFCOMMODITY NAME MARKET NAME MARKET NAME MARKET
IN TURNOVER (PURCHASES) (PURCHASES) (PURCHASES)% % %
1 Woollen Yarn 64.6 Chi1drens Shirts 40.4 Neckties 59.2
2 Wornens Japanese Clothing 60.7 Womens stockings 33.3 Womends Overcoats 55.8
3 Futon 60.6 Womens Shirts 30.4 Mens Overcoats 50.7
4 Woollen Fabric 59.3 Infants Shirts & Inner ...Garments 30.2 White Shirts 43.7 '".
5 Silk Fabric 57.8 Childrens Sweaters 30.0 Womens Suits 43.7
6 Chemical Fibre Fabric 56.4 Mens Socks 29.8 Hats 42.4
7 Mens Japanese Clothing 56.0 Womens Slacks 20.5 Womens Blouses 41.6
8 Cotton Fabric 55.6 Womens Skirts 20.0 Mens Sweaters 41.3
9 Childrens Japanese Clothing 53.9 Mens White Shirts 19.6 Wornens Skirts 40.7
10 Blankets 52.9 Womens Sweaters 18.7 Suits 38.7
Note:Source:
A Futon is a bedding quiltToyobo Economics Research Institute Reports. April 1977.

50.
significance while 2.10 shows only the top ranked ten itemsfor each of the three types of retail outlet.
In general ordinary retail stores dominate thesales of most items. Exceptions are dress accessoriessuch as hats and neckties, children's sweaters and innergarments, women's shirts, men's sweaters and white shirts,women's blouses, overcoats· and skirts, and men' s ~ ackets ,all of which department stores dominanted in 1974. Thesupermarket share of sales of various items was in allcases but children's shirts, lower than either of theother two main outlets, although quite high proportions oftotal sales are evident for a number of items includingmen's and women's stockings, children's clothing andwomen's inner garments, shirts and slacks. The relativeimportance of these items is reflected in Table 2.10.
As a consequence of this series of tables thepattern emerges of supermarkets clearly concentrating onvolume sales of everyday items which can be sold atrelatively low prices. The distinction in merchandisingphilosophy between ordinary retail stores and departmentstores is not so clear, although price information presentedearlier indicates that department stores are geI).erally moreexpensive than ordinary retail stores and that they tend toconcentrate somewhat on more exotic items. In theclothing area this is frequently manifest in very elegantdisplays of goods with famous foreign brands. This istestimony to the great significance placed by Japaneseconsumers on product image and is further related to theenormous expenditures in Japan on media advertising.
Further verification of thegeneral·distinctionsbetween the merchandising policies of different types ofretail store is provided in Table 2.10 which shows thevarious profit and cost ratios per unit of support fordifferent store types.
Major distinctions in Table 2.10 are between smalland medium sized stores with various specialty activities in

TABLE 2.10
OPERATING RATIOS OF RETAIL TEXTILE STORES IN JAPAN (1975)Units: Percent
STORE TYPE GROSS PROFITON SALES
PERSONNEL EXPENSESTO SALES RATIO
MANAGEMENT EXPENSESTO SALES RATIO
RATE OF OPERATINGPROFIT ON SALES
A. SMALL & MEDIUM SIZED STORESTraditional Clothing 31.6 11.4 27.0 4.6Mens Clothing 41.4 14.9 36.8 4.6Womens & Childrens Clothing 33.0 11.6 28.5 4.5Haberdashery 29.3 11.1 25.7 3.6Bedding 34.4 13.3 29.9 4.5General Clothing 27.4 10.4 23.5 3.9Clothing Supermarkets 21.8 8.9 19.4 2.9Average for all Medium & SmallStores 29.5 11.1 25.3 4.2 en.....
B. LARGE RETAIL STORESDepartment Stores 23.2 9.9 20.2 3.0General Supermarkets 22.4 8.4 18.7 3.7Monthly Credit Stores 32.1 10.6 25.0 7.1Average for all Large Scale Stores 23.3 9.3 19.7 3.6
Source: Toyobo Economic Research Institute Report. April 1977.
52.
the clothing and textile area, and large retail stores.
In the latter group, however, ratios relate to total store
activities rather than to activities in the textile and
clothing departments alone. They are therefore not
directly comparable with much of the data presented earlier.
On the other hand, Table 2.11 distinguishes in a more
detailed way between different store types especially in
the small and medium store range.
Table 2.10 generally indicates that larger stores
operate on lower margins than smaller stores. This is
true for both gross profit margins and operating profit
margins (profit on sales less management expenses) . In
the case of supermarkets, higher operating profits are
achieved, than for department stores, despite lower
gross profits on sales, an indication of their relatively
lower costs. Clothing supermarkets, however, worked on
gross profit margins even lower than general supermarkets.
Highest margins and costs are apparent for specialist mens'
clothing stores. Personnel expenses as a proportion of
total management expenses are greater for large stores
than small and medium stores. This is largely as a
result of the influence of department stores fo~ which this
ratio was 49.0 percent as against the average for all large
stores of 47.2 percent and for general supermarkets alone
of 44.9 percent. For small and medium sized stores this
average overall was 43.9 percent. The very high
personnel cost ratio for department stores, is is reflection
in part of the particularly personalised service provided
by department stores. The outstanding feature of·this
service, to the foreigner at least, is the presence of
\nifo;rmed young girls, saying "welcome" and "thankyou" to
customers arriving and leaving the store, operating lifts,
and wiping the moving handrails at the bottom of escalators.
In summary, it has been the objective of this
section on Japanese clothing and textile retailing to
provide New Zealand manufacturers and exporters with some
53.
insight to the real character of the Japanese market.
This has been done by heavier emphasis upon non statistical
characteristics of the market than is normally available.
It is nevertheless, supported by a number of statistical
tables within the main body of the text and by a number
of statistical tables presented as appendices. Appendix
IV, for example, describes trends in physical areas of
different stores, trends in employee numbers for different
store types and the proportions of store numbers and
sales among different sizes of different retail store
types.
2.7 SUMMARY
Chapter 2 has attempted to provide readers with an
understanding of the Japanese distribution system for'
textiles and clothing which is more than superficial. It
has aimed to do this by presentation of material which is
not purely statistical. By describing business practices
prevalent, inter-relationships between distributors of
various types and by descriptions of aspects of retailing
such as various proportions of different commodities
handled, it is hoped that this section will provide readers
with some depth of understanding of Japanese distribution
systems. If so, this will help them to become more
discreet in their selection of distributors as well as
providing them with a useful tool for management of their
marketing activities, - a better Understanding of various
forces at work in the market place will bean aid to better
informed decision making. This is true for both
marketers of final consumer goods and of unprocessed and
semi processed fibres and textiles.
54.
CHAPTER 3
FIBRE INTER-RELATIONSHIPS ~~NG LARGE TEXTILE
MANUFA9TURING),yQMPANIES IN JAPANc',' . ····i/;- :""\~.. ~.,,
3.1 INTRODUCTION
Of future concern to policy makers in the New
Zealand wool industry is the significance of wool relative
to other fibres in major markets for wool. The situation
is confused considerably where textile manufacturing
companies use a range of different fibres in their operations.
This chapter will attempt to clarify a pumber of factors
which lead to this confusion and define the role of wool in
Japan from the point of view of the industry rather than the
market. Firstly, it analyses a number of important
aspects of the relationship between fibres by noting in
particular, the relationship between fibres for the largest
sixteen textile manufacturing companies in Japan. The
financial strengths of major companies are analysed in the
context of their relationships with large financial or
zaikai groupings. The significance of specialist wool
spinning companies and their financial strengths will be
compared with multi-fibre textile manufacturers. A'." '",,'" ,"'i.":':'
further section concentrates on the structut"E,"'bf the
synthetic textile industry in Japan and r~ports on some of
the more significant developments which have been occurring
in that industry over recent years. Finally, the impact
of changes in 0.+1 prices, exchange'rates and labour costs
will be discus~~d with particular referehce t6, the
competitive relationship between wool ~n~ synthetic fibres.
As a result oft:~ilil:,\chapter it is anticipated that
the reader will have a bett~r appreciation ,of th'i' relative
significance of different fibres in the Japanese t~xtile
industry, wool in particular. This chapter, together
with information presentedin'Chapter 1 on the forecasts for
55.
different fibre and textile end product usage (including
carpets), should provide a useful guide for New Zealand
trade and industrial policy makers on the future signifi~
cance of Japan as a market for New Zealand wool and
processed and semi processed wool products.
3.2 SYNTHETICS COJl!,FANIES, MULTIFIBRE SPINNERS AND
SPECIALIST WOOL SPINNERS - FINANCIAL STRENGTHS AND
INTER~FIBRE RELATIONSHIPS
One of the most significant indicators of financial
strengths of companies in Japan is the strength of their
association with the large financial or Zaikai groupings of
companies. These groupings number only seven and are
distinguished in a number of ways, principally by the fact
that pivotal roles in group activities are played by city
banks with enormous financial capacity as well as trust
companies, insurance companies and other financial
institutions. The Zaikai groupings also have trading
arms in the form of general trading companies, one of
whose functions it is to provide short and medium term
credit facilities to smaller companies. The f~nancial
facilities of both banks and trading companies favour
companies which are committed, usually through export
supply channels or output sales channels, to the zaikai
group.
Of the sixteen largest synthetic and spinning
companies nine have direct and strong zaikai affiliations.
These sixteen companies are classified as seven synthetic
and nine spinning companies. Their associations are
listed in Table 3.1.
Table 3.1 indicates that all but one of the
synthetic fibre companies are group members of large
Zaikai or financial groupings. By contrast, only three
of the nine spinning companies are Zaikai group members.
This is a reflection principally of their longer standing

TABLE 3.1
JAPAN'S LARGEST SYNTHETIC AND SPINNING COMPANIES - GROUP ASSOCIATIONS
A..:..~--=:S:::EV-=EN;.:......::.S Y.::.N:.:.T.::.H:::E.::.T.::..::.IC.::._C.::.O::.:M:.:.P:..:A:.:.N:;..I::.:E::.:S=Toray
Teijin, Asahi ChemicalUnitika
Kuraray
Mitsubishi RayonToho Rayon
NINE SPINNING COMPANIES
Kanebo
Toyobo
NittoboKurabo
Nisshin
Daiwa
Shikishima
Omikenshi
ZAIKAI ASSOCIATIONMitsui
Sanwa
Sumitomo
Sanwa
Puyo
Sanwa
Mi tSubis!J.i
'"'"
Source: Toyobo Economic Research Institute Report. May 1975.

57.
The growth base
From this base they
The importance of
apparent from Table
and their history of financial strength.
for most of them was cotton spinning.
have built up financial independence.
the cotton base to these companies is
3.2
Table 3.2 shows that of the nine spinning companies in
the Toyobo Research Institute listing, all except Kurabo,
have a substantial output of cotton fibre. In Kurabo's
case 70 percent of its total output by value is of mixed
fibres, again with a substantial cotton content. For
three of the spinning companies, Toyobo, Kanebo and Nisshin,
the synthetic output now forms a greater proportion of
output by value than cotton. For one other, Daiwa,
the proportions are equal. It is also notable that
the spinning companies which have diversified most into
synthetics, Kanebo, Toyobo, and Nisshin are the biggest of
all spinning companies with respect to their turnover
while those companies whose cotton output still dominates
remain at the bottom of the turnover list for spinning
companies. Another point from this table is that the
largest companies are nearly all synthetic fibre specialist
companies and only one of these, Unitika, has moved into
other fibres to any extent.
Of the spinning companies who have moved into wool
production, once again the most significant are the larger
ones, Kanebo, and Toyobo. The only other spinning company
with a significant proportion of wool output is Kurabo. Of
companies who are classified as wool specialist companies
only the two largest in 1972, Hayashi Spinning Company and
Japan Wool Textile Company had total turnovers of greater
than ¥30,000 million. These could have been included
in Table 3.2,where textile manufacturers are ranked by
turnove~ at the bottom .of the list. Appendix V provides
a summary of zaikai group involvement by companies and shows
that 39.7 percent of all listed textile companies had no
group affiliations and that 46.7 percent did. The, . -.

units: percent
TABLE 3.2
LARGEST SYNTHETIC AND SPINNING COMPANIES - PROPORTIONS OF SALES OF VARIOUS FIBRES
(RANKING BY SALES 1972)
TURNOVER OTHER TOTAL MIXED¥100 MILLION POLYESTER NYLON ACRYLIC SYNTHETIC SYNTHETIC COTTON WOOL SILK FIBRES
FIBRES
TORAY 298.4 43 31 12 86
ASAHI CHEM. 273.0 13 27 25 65
KANEBO 248.3 38 19 13 5
UNITlKA 213.8 64 10 7
TEIJIN 213.6 66 15 3 90 U1(J)
TOYOBO 205.7 64 22 11 .MITSUBISHI RAYON 148.2 49 12 61
KURARAY 116.7 48 37 85
NISSHIN 70.5 42 36
KURABO 67.4 23 70
FUJI 62.3 27 47
DAIWA 58.3 41 41
NITTO 51;5 28 33
TOHO RAYON 44.6 64 84 4
SHIKISHlMA 39.9 37
OMlKENSHI 34.1 29 39 32
Sources: Various

59.
strongest of the
main strengths
Thebalance are described as unquoted.
groups was the Sanwa Zaikai which has its
in the Osaka region.
A comparative analysis of wool yarn and textile
companies is presented in Table 3.3. This Table confirms
that these "specialist" wool companies are very small by
comparison both with the synthetic textile companies and
spinning companies. They do tend to specialise more
in woollen yarn or fabric in their principal output than
larger textile companies although a few, especially
Kanematsu, have a very high proportion of synthetics in
their total output. They also tend to produce higher
proportions of fabric than specialist synthetic or cotton
fibre companies.
Because of the very large difference in total turnover
between the large synthetics and spinning companies and the
wool specialist companies, even small proportions of wool
in the total output of the large companies makes them very
significant in total wool output. In fact, analysis
shows that the woollen yarn output of the seven synthetics
and nine spinning companies was around ¥85,OOO million in
1972 while that of all the specialist woollen companies
was only ¥63,OOO million. Even the inclusion of the
specialist carpet and felt companies in this analysis makes
little difference to this balance.
Company directories also show that the group associat
ions of specialist woollen companies are few and weak.
Only Daito Woollen (Mitsui Group) and Nankai Worsted (Fuyo
Group) have any group associations although a number of the
specialist woollen companies have affiliate relationships
with trading companies. These relationships would imply
trading obligations but not necessarily advantages in
securing finance.
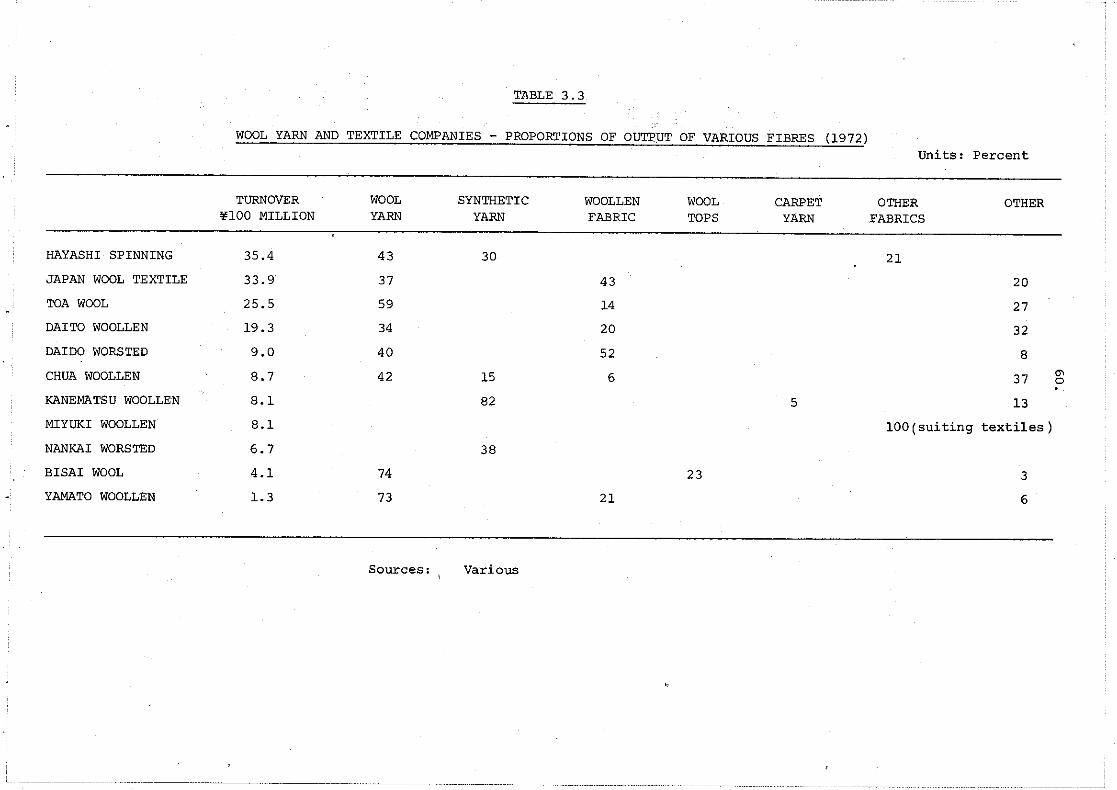
TABLE 3.3
WOOL YARN AND TEXTILE COMPANIES - PROPORTIONS OF OUTPUT OF VARIOUS FIBRES (1972)Units: percent
TURNOVER WOOL SYNTHETIC WOOLLEN WOOL CARPET OTHER OTHER..100 MILLION YARN YARN FABRIC TOPS YARN FABRICS
HAYASHI SPINNING 35.4 43 30 21
JAPAN WOOL TEXTILE 33.9 37 43 20
TOA WOOL 25.5 59 14 27
DAlTO WOOLLEN 19.3 34 20 32
DAIDO WORSTED 9.0 40 52 8
CHUA WOOLLEN 8.7 42 15 6 37 '"0.KANEMATSU WOOLLEN 8.1 82 5 13
MIYUKI WOOLLEN 8.1 100 (sui ting textiles)
NANKAI WORSTED 6.7 38
BISAI WOOL 4.1 74 23 3
YAMATO WOOLLEN 1.3 73 21 6
Sources: Various
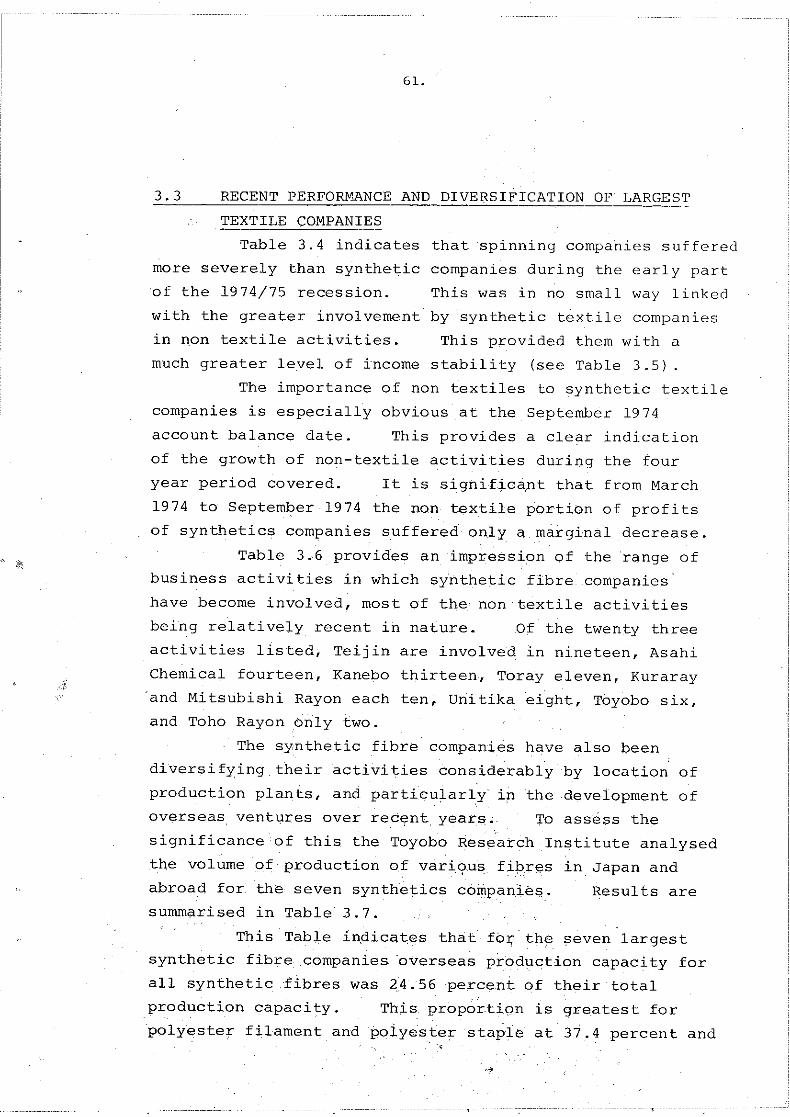
61.
3.3 RECENT PERFO~ANCE AND DIVE~SIFICATION OF LARGEST
TEXTILE COMPANIES
Table 3.4 indicates that spinning companies suffered
more severely than synthetic companies during the early part
of the 1974/75 recession. This was in no small way linked
with the greater involvement by synthetic textile companies
in non textile activities. This provided them with a
much greater level of income stability (see Table 3.5) .
The importance of non textiles to synthetic textile
companies is especially obvious at the September 1974
account balance date. This provides a clear indication
of the growth of non-textile activities during the four
year period covered. It is significa;1t that from March
1974 to September 1974 the non textilepQrtion of profits
of synthetics companies suffered only a marginal decrease.
Table 3.6 provides an impression of the range of
business activities in which synthetic fibre companies
have become involved, most of the non textile activities
being relatively recent in nature. Of the twenty three
activities listed, Teijin are involved in nineteen, Asahi
Chemical fourteen, Kanebo thirteen, Toray eleven, Kuraray
and Mitsubishi Rayon each ten, Unitika eight, Toyobo six,
and Toho Rayon only two.
The synthetic fibre companies have also been
diversifying their activit~esconsiderablyby location of
production plants, and particularly ip the development of
overseas ventures over rec'i'nt, year!?:., To assess the
significance of this the Toyobo Research Institute analysed
the volume of production of various fibres in Japan and
abroad for the seven synthetics companies. Results are
summarised in Table 3.7.
This Table indicateS that fOr the seven largest
synthetic fibre companies 'overseas production capacity for
all synthetic fibres was 24.56 percent of their total
production capacity. This proportion is greatest for
polyester filament and polyester staple at 37.4 percent and<,,,.
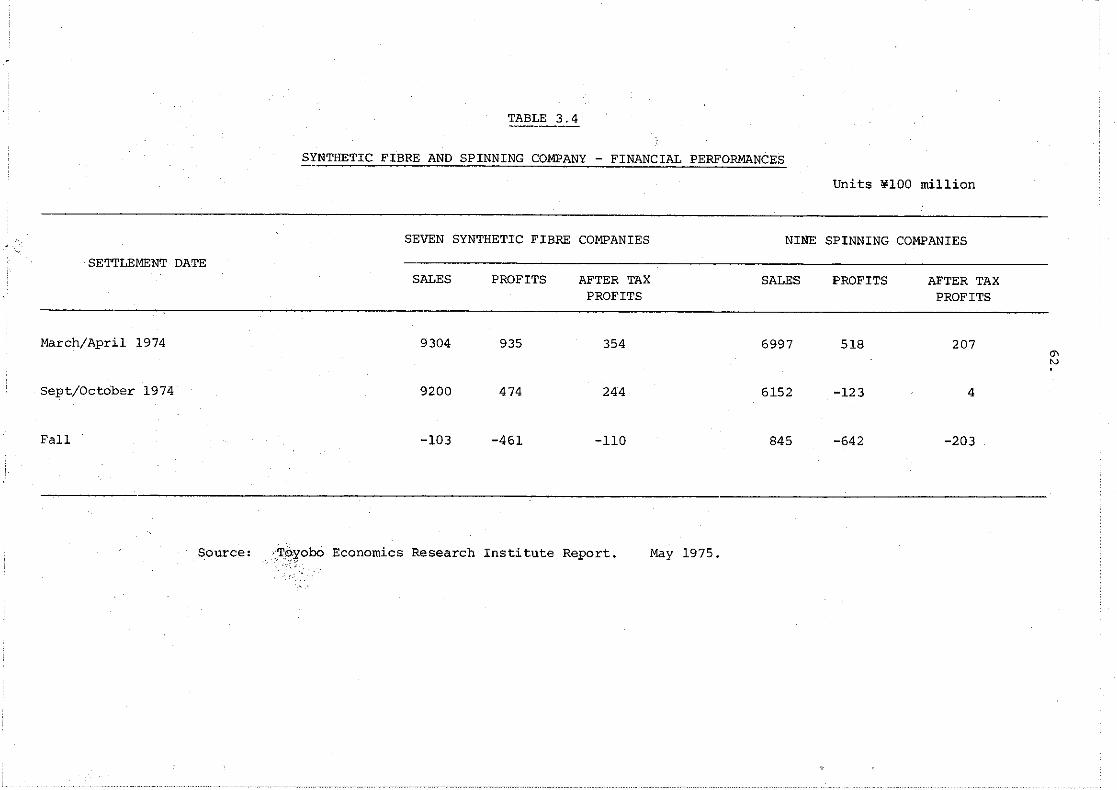
TABLE 3.4
SYNTHETIC FIBRE AND SPINNING COMPANY - FINANCIAL PERFORMANCES
Units ¥lOO million
Sourc.e: .Tbcyobo Economics Research Institute Report." """'"
May 1975.
TABLE 3.5
SALES OF TEXTILES AND NON TEXTILES BY MAIN SYNTHETIC AND SPINNING COMPANIESunits: ¥100 million
ACCOUNTS SETTLEMENT PERIOD SEVEN SYNTHETICS COMPANIES NINE SPINNING COMPANIES
TEXTILES NON TEXTILES TOTAL TEXTILES NON TEXTILES TOTAL
September 1970
September 1974
( ) Brackets: % of total sales
5430
(87.1)
6948
(75.5)
805
(12.9)
2253
(24.5)
6234
9200
3500
(90.7)
5285
(85.9)
358
(9.3)
867
(14.1)
3859
6152
'"w.
Source: Toyobo Economics Research Institute Report. May 1975.
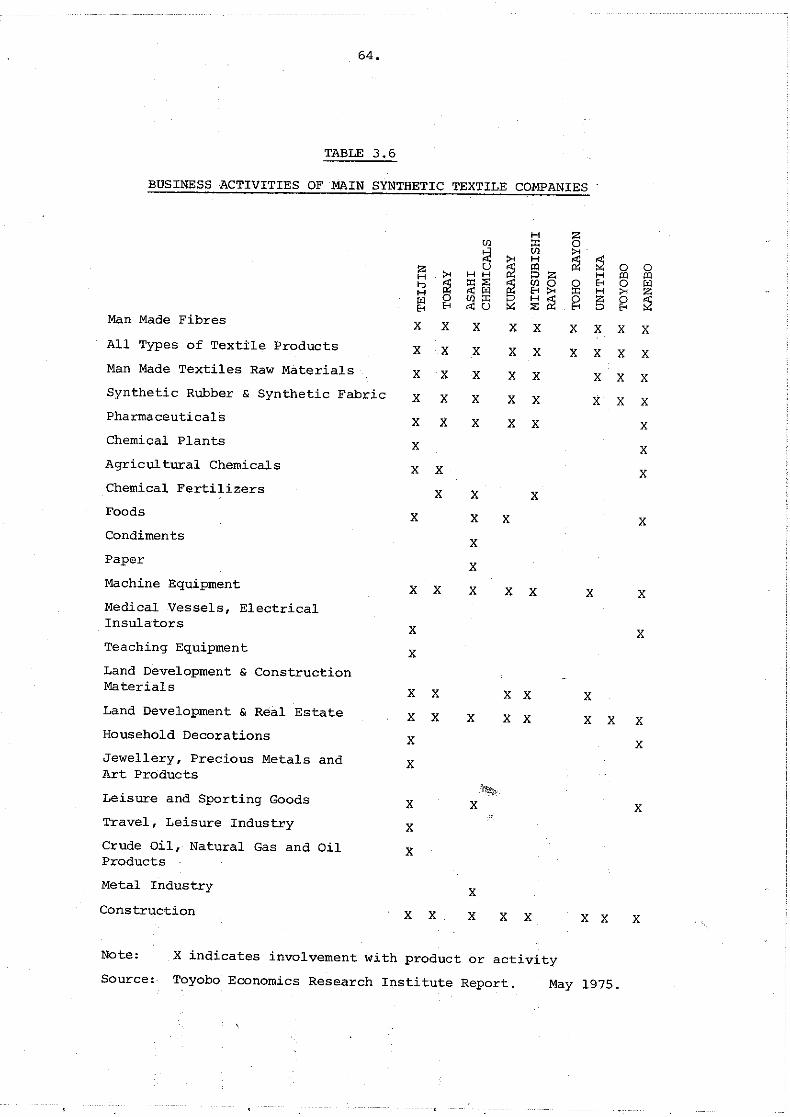
64.
TABLE 3.6
BUSINESS ACTIVITIES OF MAIN SYNTHETIC TEXTILE COMPANIES .
H ZUl :z: 0
~Ul
~~H
~Z U <I1 0 0>< H H ::> Z H <I1 <I1H
~ :z: :E:~
Ul 0 0""'
0 "'..,,,; "' ""'
>< :z: H >< ZH 0 Ul :z: H~ ~
Z 0~~ ""'
,,; U ~ :E: ::>""'Man Made Fibres X X X X X X X X X
All Types of Textile Products X X X X X X X X X
Man Made Textiles Raw Materials X X X X X X X X
Synthetic Rubber & Synthetic Fabric X X X X X X X X
Pharmaceuticals X X X X X X
Chemical Plants X X
Agricultural Chemicals X X X
Chemical Fertilizers X X X
Foods X X X X
Condiments X
Paper X
Machine Equipment X X X X X X X
Medical Vessels, ElectricalInsulators X X
Teaching Equipment X
Land Development & ConstructionMaterials X X X X XLand Development & Real Estate X X X X X X X X
Household Decorations X X
Jewellery, Precious Metals and XArt Products
Leisure and Sporting Goods X X X,Travel, Leisure Industry X
Crude oil, Natural Gas and Oil XProducts
Metal Industry X
Construction X X X X X X X X
Note: X indicates involvement with product or activity
Source: Toyobo Economics Research Institute Report. May 1975.
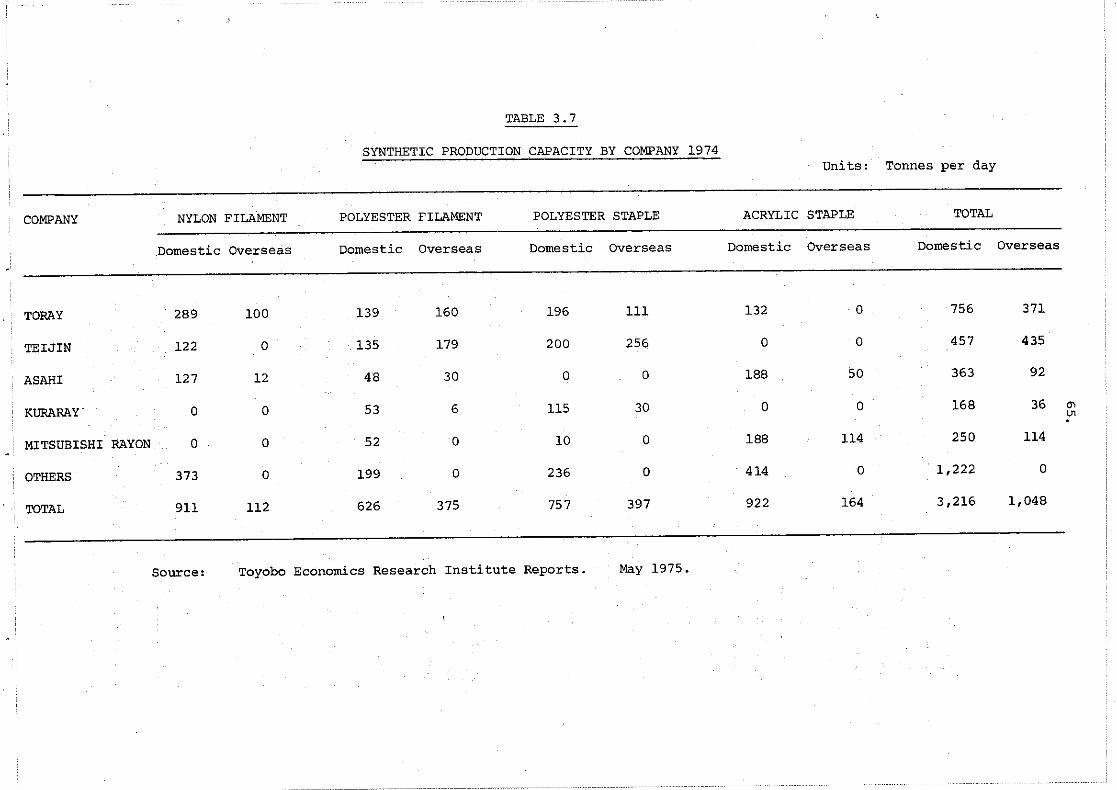
TABLE 3.7
SYNTHETIC PRODUCTION CAPACITY BY COMPANY 1974Units: Tonnes per day
COMPANY NYLON FILAMENT
Domestic Overseas
POLYESTER FILAMENT
Domestic Overseas
POLYESTER STAPLE
Domestic Overseas
ACRYLIC STAPLE
Domestic Overseas
TOTAL
Domestic Overseas
TORAY 289 100 139 160 196 III 132 a 756 371
TEIJIN 122 a 135 179 200 256 0 0 457 435
ASAHI 127 12 48 30 0 0 188 50 363 92
KURARAY· 0 0 53 6 115 30 0 0 168 36 (J\U1
MITSUBISHI RAYON 0 0 52 0 10 0 188 114 250 114
OTHERS 373 0 199 0 236 0 414 0 1,222 0
TOTAL 911 112 626 375 757 397 922 164 3,216 1,048
Source: Toyobo Economics Research Institute Reports. May 1975.
66.
34.4 percent respectively. By company, Toray and Teijin
have built up considerably more overseas production capacity
than other synthetics producers, although Japan's principal
acrylics producers, Mitsubishi Rayon and Asahi Chemical,
have both established overseas acrylics ventures over
recent years.
Table 3.7 also shows the overall dominance of
polyesters in production capacity among the largest
synthetics companies. Polyester filament and staple
jointly constitute 50.5 percent of the production
capacity of these companies.
3.4 TRENDS IN FINANCIAL STRUCTURES OF LARGE TEXTILE
COMPANIES
Changes in the comparative financial structures of
synethetics and spinning companies are summarised in
Table 3.8.
This Table shows principally that the equity
situation of spinning companies from September 1970 to
September 1974 slipped much more for spinning companies than
for synthetic companies, with the percentage of owned
capital falling by about five percentage points for the
former and only about two percentage points for the latter.
Both groups increased their fixed assets and capital invest
ments by similar amounts over this period but the spinning
companies increased both long and short term borrowing by
much greater proportions than synthetic companies, (109.6
percent and 108.0 percent respectively for spinning
companies, compared with 70.2 percent and 72.8 percent for
synthetic companies).
3.5 INTER-COMPANY SYNTHETIC FIBRE RAW MATERIAL FLOWS
The level of vertical integration of activities in
the synthetic textile industry is of interest for several
reasons. Firstly, it is.an indication of the financial
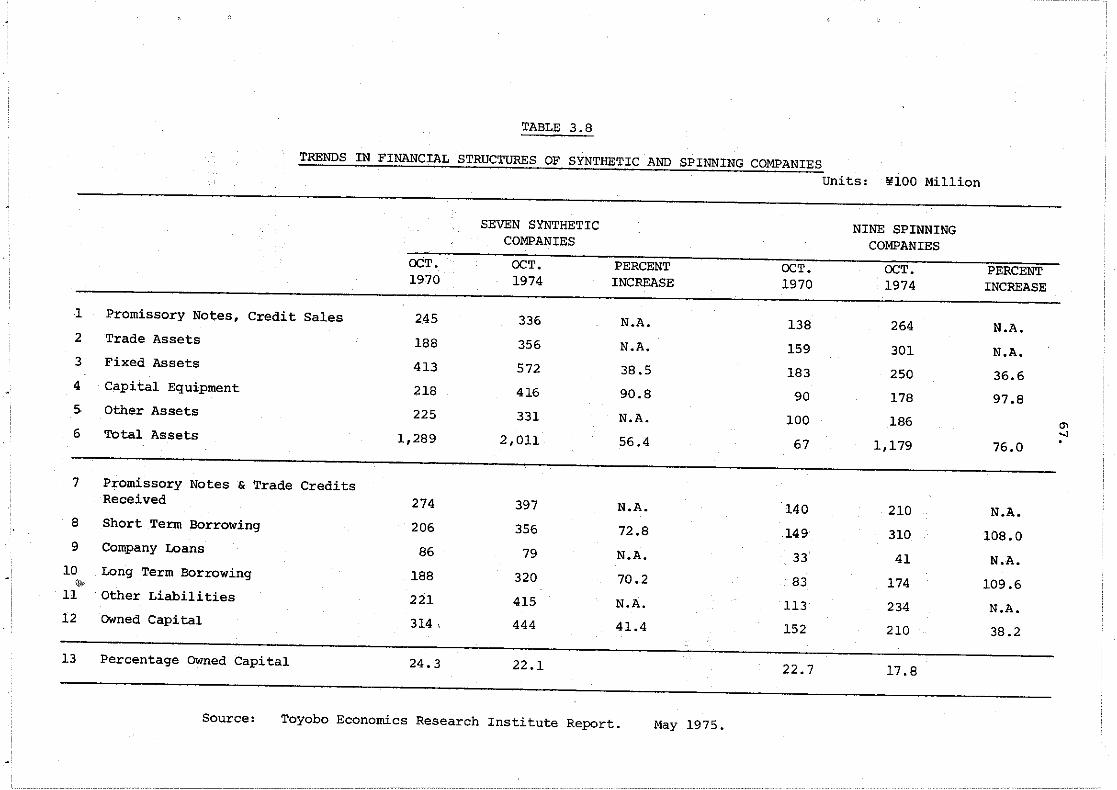
TABLE 3.8
TRENDS IN FINANCIAL STRUCTURES OF SYNTHETIC AND SPINNING COMPANIESUnits: ¥100 Million
SEVEN SYNTHETIC NINE SPINNINGCOMPANIES COMPANIES
OCT. OCT. PERCENT OCT. OCT. PERCENT1970 1974 INCREASE 1970 1974 INCREASE
1 Promissory Notes, Credi t Sales 245 336 N.A. 138 264 N.A.
2 Trade Assets 188 356 N.A. 159 301 N.A.
3 Fixed Assets 413 572 38.5 183 250 36.6
4 Capital Equipment 218 416 90.8 90 178 97.8
5· Other Assets 225 331 N.A. 100 186 0'...,6 Total Assets 1,289 2,011 56.4 67 1,179 76.0
.
7 Promissory Notes & Trade CreditsReceived 274 397 N.A. 140 210 N.A.
8 Short Term Borrowing 206 356 72.8 149 310 108.0
9 Company Loans 86 79 N.A. 33 41 N.A.
10 Long Term Borrowing 188 320 70.2 83 174 109.6
""11 Other Liabilities 221 415 N.A. 113 234 N.A.
12 OWned Capital 314, 444 41.4 152 210 38.2
13 Percentage Owned Capital 24.3 22.1 22.7 17.8
Source: Toyobo Economics Research Institute Report. May 1975.
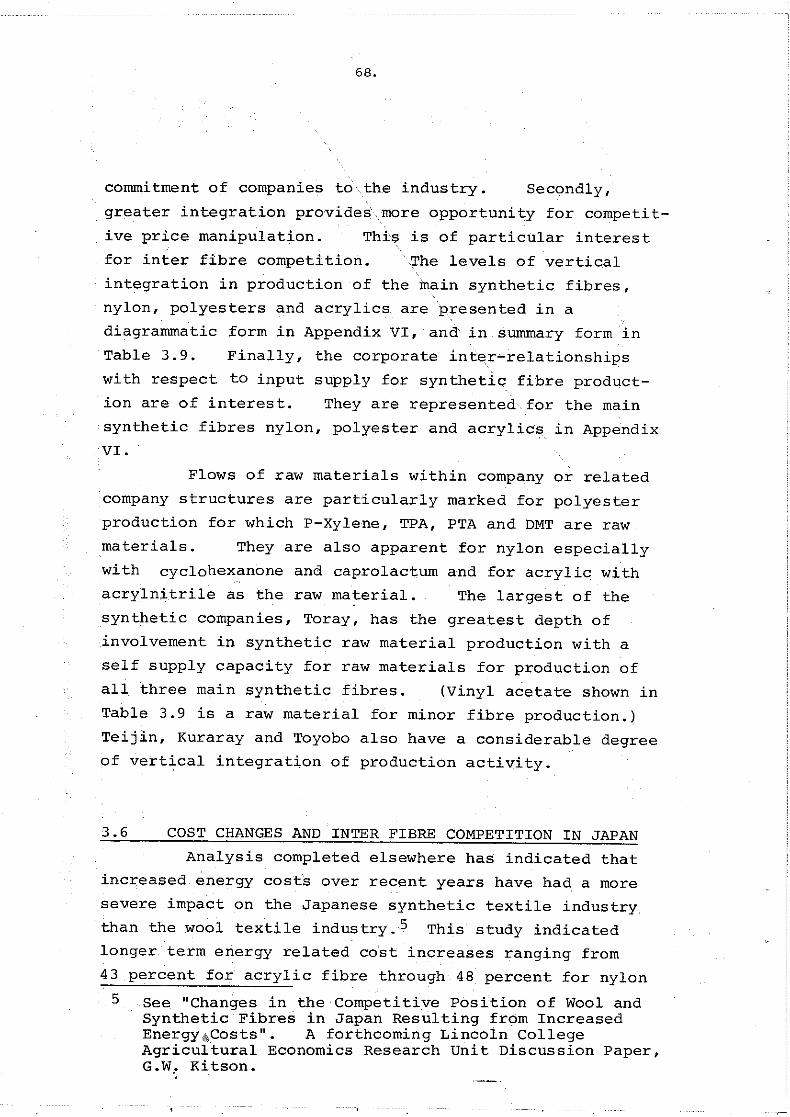
68.
commitment of companies to the industry. Secondly,
greater integration provides'more opportunity for competi t-
ive price manipulation. This is of particUlar interest
for inter fibre competition. 'The levels of vertical
integration in production of the main synthetic fibres,
nylon, polyesters and acrylics are 'presented in a
diagrammatic form in Appendix VI, and in summary form in
Table 3.9. Finally, the corporate inter~relationships
with respect to input supply for synthetic fibre product
ion are of interest. They are represented.for the main
synthetic fibres nylon, pOlyester and acrylics in Appendix
VI.
Flows of raw materials within company or related
company structures are particularly marked for polyester
production for which p-Xylene, TPA, PTA and DMT are raw
materials. They are also apparent for nylon especially
with cyclohexanone and caprolactum and for acrylic with
acrylnitrile as the raw material. The largest of the
synthetic companies, Toray, has the greatest depth of
involvement in synthetic raw material production with a
self supply capacity for raw materials for production of
all three main synthetic fibres. (Vinyl acetate shown in
Table 3.9 is a raw material for minor fibre production.)
Teijin, Kuraray and Toyobo also have a considerable degree
of vertical integration of production activity.
3.6 COST CHANGES AND INTER FIBRE COMPETITION IN JAPAN
Analysis completed elsewhere has indicated that
increased energy costs over recent years have had a more
severe impact on the Japanese synthetic textile industry
than the wool textile industry.S This study indicated
longer term energy related cost increases ranging from
43 percent for acrylic fibre through 48 percent for nylon
5 See "Changes in the Competitive Position of Wool andSynthetic Fibres in Japan Resulting from IncreasedEnergy"Costs". A forthcoming Lincoln CollegeAgriCUltural Economics Research unit Discussion Paper,G.W,' Kitson.
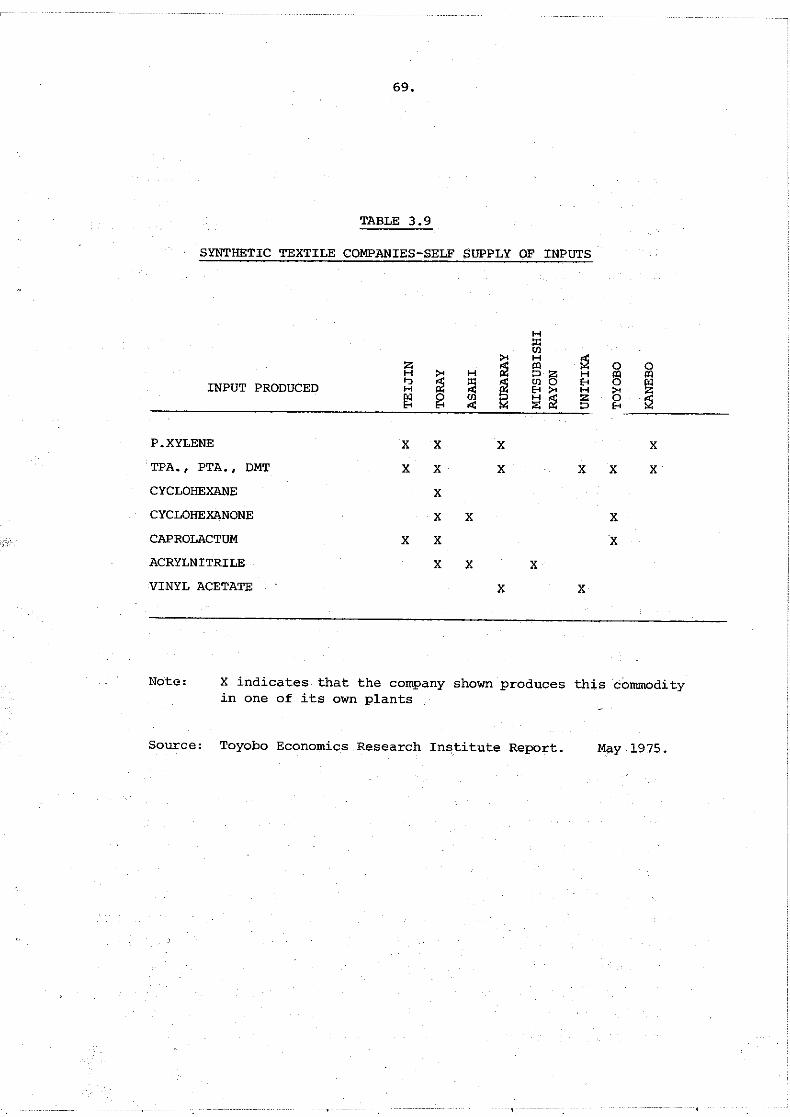
69.
TABLE 3.9
SYNTHETIC TEXTILE COMPANIES-SELF SUPPLY OF INPUTS
H:x:'">< H
~z fii III 0 0H >< H D 15 H III III..,
fii :x:
~'" 8 0 I>'l
INPUT PRODUCED H <Ii 8>< H >< ZI>'l 0 '" !;jfii Z 0 .~8 8 <Ii D 8
P.XYLENE X X X X
TPA., PTA. I DMT X X X X X X
CYCLOHEXANE X
CYCLOHEXANONE X X X
CAPROLACTUM X X X
ACRYLNITRILE X X X
VINYL ACETATE X X
Note: X indicates that the company shown produces this commodityin one of its own plants
Source: Toyobo Economics Research In~titute Report. May 1975.

70.
and 84 percent and 90 percent respectively for polyester
filament and staple. The study also indicated that the
synthetic textile industy isa considerably more substantial
user of energy direct and indirect t~an wool and other
natural fibres. This is true even at the fibre spinning
level where it was shown that one unit of energy used in
woollen yarn production produces 36 percent more final
product than the same energy used in synthetic fibre spinning.
An anomaly in Japan to the increases in energy
costs generated by oil price increases of recent years,
however, is the decline in the value of the American dollar
against the yen. Chapter One noted that in the period from
early 1977 to mid 1978 the dollar declined by almost 25
percent against the yen. Because oil prices over this
period have been relatively static in u.s. dollar terms,
this has meant substantial decreases in yen prices of oil.
While most of the advantages of this decrease in price has
so far accrued to Japanese oil refining companies in the
form of windfall profits, some advantage will undoubtedly
accrue, if it has not already done so, for industry in
the form of price reductions for synthetic fibre feedstocks
and in the form of lower energy costs in processing. This
will result in some of the cost advantage enjoyed by the
woollen industry in Japan being eroded. The principal
reason for this is that energy related costs for wool
spinning are substantially less than for synthetic fibre
making. For example, it has been shown that direct energy
costs in wool spinning amount to only 5 percent of total
direct costs of production. For polyester filament this
ratio is about 23 percent. Furthermore, the raw material
costs of polyester filament production in Japan after the
principal oil price increase was about 46 percent of direct
production cost. This component of costs could also be
expected to decrease with lower oil prices. Consequently,
'nearly 70 percent of the total direct costs involved in,producing polyester filament would be Subject to a price
decrease as a consequence of the appreciation of the yen

71.
compared with the U.S. dollar. This compares with only 5
percent for wool spinning for direct energy inputs and an
additional amount for lower raw material input prices, as
the yen has strengthened against most other currencies also.
The extent to which exchange rate movements have been
translated into lower yen prices for raw wool is not easy
to determine because marketing systems for wool would
suggest that some of the currency movement would result in
higher producer prices. In any case the very high labour
cost component in wool spinning in Japan (60 percent of all
direct production costs) means that the potential impact
of lower yen prices for raw wool is rather limited. The
same data also leads to the conclusion that labour cost
increases in yarn making in Japan would have a sUbstantially
smaller effect on synthetic fibre making than on wool
spinning. For example, the direct labour costs involved
in polyester filament production have been estimated at
25 percent, compared with 60 percent for wool spinning.
Exchange rate changes also of course affect the
international competitiveness of final products. It is
likely that the full impact of the appreciated yen rate
will be more severe on the synthetics textile inaustry in
Japan than on the woollen and'worsted industry. This is
very largely because the synthetics industry relies
considerably more on foreign markets than does wool. It
has been estimated for example, that exports of fibres
and fabrics account for nearly 30 percent of total synthetic
production but only about 2 percent for wool. Furthermore,
this loss of competitiveness can be more easily overcome on
one's own domestic market through various marketing
activities and import control procedures than on the world
market. Domestic market protection is also a more
acceptable policy if its objective is to buy some time to
adjust to a new situation. However, the control on
textile imports recently requested by the Japanese industry'
will not help the synthetics industry compete on the

72.
world market. In addition it is likely that raw material
and energy cost savings also induced by exchange rate
movements will take some time to reach synthetic textile
makers as, in the short term at least, they will show up
more as extra profits of oil refining companies.
The net effect of increases in oil prices and
labour costs and exchange rate movements on the competitive
position of the synthetics and wool textile industries is
therefore a little uncertain. From a production cost
point of view, oil price increases since 1973 were of
considerable benefit to the wool industry. Although
subsequent changes in exchange rates should have the effect
of negating part of this cost advantage, they have left
both the wool and synthetics industry considerably worse
off in their ability to compete internationally. While
the adjustments required by the synthetics industry to cope
with this new competitive situation will be more immediate
and severe because of its heavier reliance on exports, the
synthetics industry does reap considerably more cost
advantage from yen appreciation than wool and, given equal
protection from imports, the synthetics industry will
become increasingly competitive with wool on the-Japanese
domestic market. Labour cost increases in the Japanese
textile industry will enhance this process.
3.7 SUMMARY
This chapter has attempted to identify the
significance of various industrial fibres in the Japanese
textile industry with the particular objective of assessing
the significance of wool. This has lead to an analysis
of the role wool plays in the output of multi fibre textile
companies and to an analysis of the financial strengths of
these companies· and the specialist wool companies. This
chapter has further discussed changes that have been
occurring in the textile industry in Japan over recent

73.
years and how various sectors of the industry have been
adjusting to these changes. It concluded by reviewing
the impact of various changing elements of cost on the.
industry, noting in particular that cost advantages
gained by wool over synthetics as a result of oil price
increases have probably been partially eroded by more
recent exchange rate movements and increases in labour
costs, although the synthetics industry will have more
severe adjustment problems than wool because of its much
heavier reliance on exports in its product sales.
A number of other points of significance to New
Zealand trade and industrial policy makers as well as New
Zealanders trading with Japan in wool and textiles have
emerged. The first is that Japanese textile manufacturers
can be classified broadly into three groups, synthetic
textile makers, multi fibre spinning companies and specialist
spinning companies including wool spinners. Of these,
wool yarn output is dominated by only four companies,
Kanebo, Unitika, Toyobo and Kurabo, all of whom are multi
fibre spinners apart from Unitika which is classified as
a synthetics textile company. For these four companies
in aggregate, wool yarn output amounts to nearl~ 60 percent
of all wool yarn output in Japan but only 11.5 percent of
the total output of these companies. Specialist wool
spinning companies account for only a little over 40 percent
of total wool yarn production in Japan.
Most of the multi fibre spinning companies have
diversified into other fibres from a cotton spinning base
and have a relatively long history of financial independence.
Synthetic fibre makers on the other hand, have much closer
links with large financial or Zaikai groupings. This
has been to their advantage over recent years because it
has given them greater growth capacity which they have used
in substantial investment in non textile activities and
investment in textiles outside of Japan. The synthetics
companies have also exhibited a greater degree of vertical
integration of production activities with very strong

74.
packwards financial links into synthetic fipre raw material
production, especially .for polyesters.
As a result of their greater financial strength
and diversity, synthetics makers should have Peen in a
much stronger position than multi fipre spinners to
withstand the impact of recession. Consequently, the
financial position of the multi fibre spinners has
deteriorated more than the synthetics textile makers,
initially at least.
Specialist wool companies have even fewer links with
Zaikai groupings and their financial position is likely to
have deteriorated even further. Thus it is probable that
not only has the extended recession had a more severe
impact on the main companies which use wool, the three
multi fibre spinners and specialist wool spinners, but
also, principally because of exchange rate movements,
synthetics makers will emerge from the depression in a
stronger position relative to wool spinners than they
entered it.
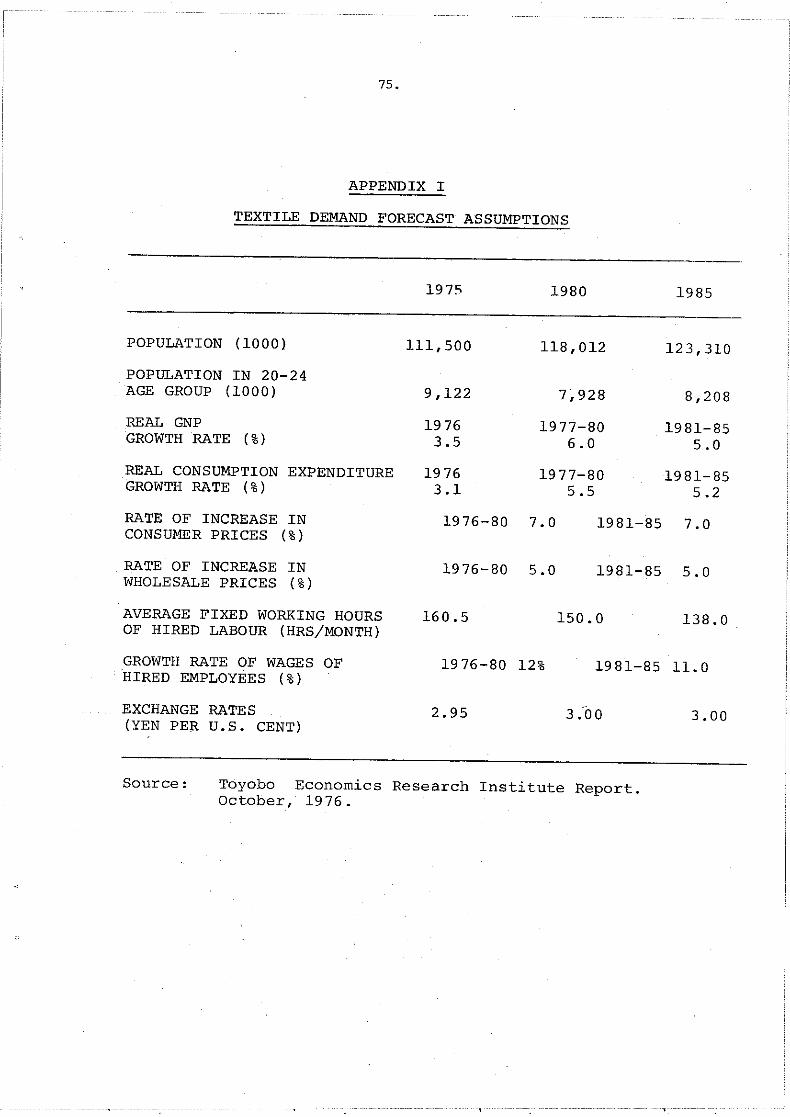
75.
APPENDIX I
TEXTILE DEMAND FORECAST ASSUMPTIONS
1975 1980 1985
POPULATION (1000) 111,500 118,012 123,310
POPULATION IN 20-24AGE GROUP (1000) 9,122 7,928 8,208
REAL GNP 1976 1977-80 1981-85GROWTH RATE (%) 3.5 6.0 5.0
REAL CONSUMPTION EXPENDITURE 1976 1977-80 1981-85GROWTH RATE (%) 3.1 5.5 5.2
RATE OF INCREASE IN 1976-80 7.0 1981-85 7.0CONSUMER PRICES (%)
RATE OF INCREASE IN 1976-80 5.0 1981-85 5.0WHOLESALE PRICES (%)
AVERAGE FIXED WORKING HOURS 160.5 150.0 138.0OF HIRED LABOUR (HRS/MONTH)
GROWTH RATE OF WAGES OF 1976-80 12% 1981-85 11. 0HIRED EMPLOYEES (% )
EXCHANGE RATES 2.95 3.-00 3.00(YEN PER U.S. CENT)
Source: Toyobo Economics Research Institute Report.October, 1976.

76.
APPENDIX I (Contd)
ASSUMED PRICE LEVELS OF MAJOR FIBRES
U.S. COTTON SLM 1/16"(cents/pound)
AUSTRALIAN WOOL(Aust. cent/kilo)
RAYON FILAMENT 120D(Yen/500 grams)
RAYON STAPLE 1.5D(Yen/kg)
NYLON FILAMENT 70D(Yen/kg)
POLYESTER FILAMENT 75D(Yen/kg)
POLYESTER STAPLE 1.5D(Yen/kg)
ACRYLIC STAPLE 3D(Yen/kg)
1974
56.1
294
315
299
680
780
430
460
1980
65.0
350
425
480
800
760
500
550
1985
85.0
460
550
650
1,000
900
600
700
Source: Toyobo Economics Research Institute Report.October, 1976.

77.
APPENDIX II
THE CARPET DISTRIBUTION SYSTEM IN JAPAN
epart~ent stores--~·'(including install
ment sale stores)
Supermarkets
Furniture retailers
Bedding retailers
Exclusive contractsSpecialised trading &':=+=======91Merchan~ising r
Exclusivecontracts
Floor 'materialdealers
Tatami-mat dealers
Wholesalers
I Furniture I....W_h_o_l_e_s_a_l_e_r_s _
Textile productsholesalers
1..._O_t_he_r_s -..,.1
Carpet flooringspecialistsContract work
Construction Firms
30% 70%
Clothing materialretailers
Interior decoratingspecialists
OthersBrokers
Growing Household demand
Household marketKitchen Livingroom
Institutional marketGovernment offices Schools
Stores Hospitals Companies Parlor Guest-room
Offices Hotels Study Hall
Leisure facilities
etc.
User's needs
New Quality Function quality Decorative Quality Durability
Fire resistance
Usage specialization product specialization
Source: Focus Japan, liThe AgO:r:all, April 1974 (Jetro).
78 •
. APPENDIX TII .
TOP TWENTY CLOTHING STORES AND TOP ~ffiNTY SPECIALIST
CLOTHING STORES IN JAPAN
A. TOP 20 CLOTHING STORES SALES (l975)
RANK STORE NAME SALES STORE TYPE NO OF STORES('£100 MILL)
1 MITSUKOSHI 1751 Dept. Store 14
2 DAI-EI 1668 Supermarket 129
3 NICHII 1402 Supermarket 115
4 DAlMARU 1294 Department Store 6
5 NAGASAKIYA 1248 Supermarket 84
6 SEIBU 1105 Department Store 10
7 TAKASHlMAYA 1043 Department Store 5
8 JASCO 957 Supermarket 101
9 ITO YOKADO 955 Supermarket 57
10 MATSUZAKAYA 954 Department Store 8
11 ISETAN 866 Department Store 5
12 SEIYU 862 Supermarket 121
13 UNY 783 Supermarket 114
14 HANKYU 693 Department Store 6
15 TOKYU 688 Department Store 4
16 MARUI 682 Discount Store 34
17 IZUMIYA 558 Supermarket 48
18 SOGO 529 Department Store 3
19 UNIDO 518 Supermarket 35
20 JUJIYA 409 Supermarket 30
Source: Toyobo Economics Research Institute Report.April 1977.

79.
APPENDIX III (Contd)
B. TOP 20 SPECIALIST CLOTHING STORE SALES (1975)
RANK STORE SALES STORE SPECIALTY LINES(¥100 MILL.) NUMBER
1 SUZUYA 370 47 Women's
2 SAN AI 293 20 Womer! s
3 YAMATO 280 75 Traditional
4 MITSUMINE 172 32 Gentl emen ': S
5 RINDAIYA 163 80 Traditional
6 MAMINA 155 24 Women's
7 ROBERTO 132 121 Gentlemen's
8 ISHOKU 123 59 Gentlemenl,s
9 SAGABI 120 70 Traditional
lQ TAKAHISA 110 69 Gentlemen's
II TAMAYA 101 21 Women's
12 MARUYAMA 88 62 Traditional
13 GINZA MAGEE 87 51 Women's
14 HIYOSHIYA 85 40 Women's
15 KANEMURI 82 NA -Traditional
16 SANMATSU 82 31 Traditional
17 LILIAN 80 105 Women's
18 SHINJUKU TAKANO 75 8 Women's
19 TOKYO MASUIWAYA 65 28 Traditional
20 SUZUTAN 52 38 Women's
TOTAL 2715
Source: Toyobo Economics Research Institute Report. April 1977.
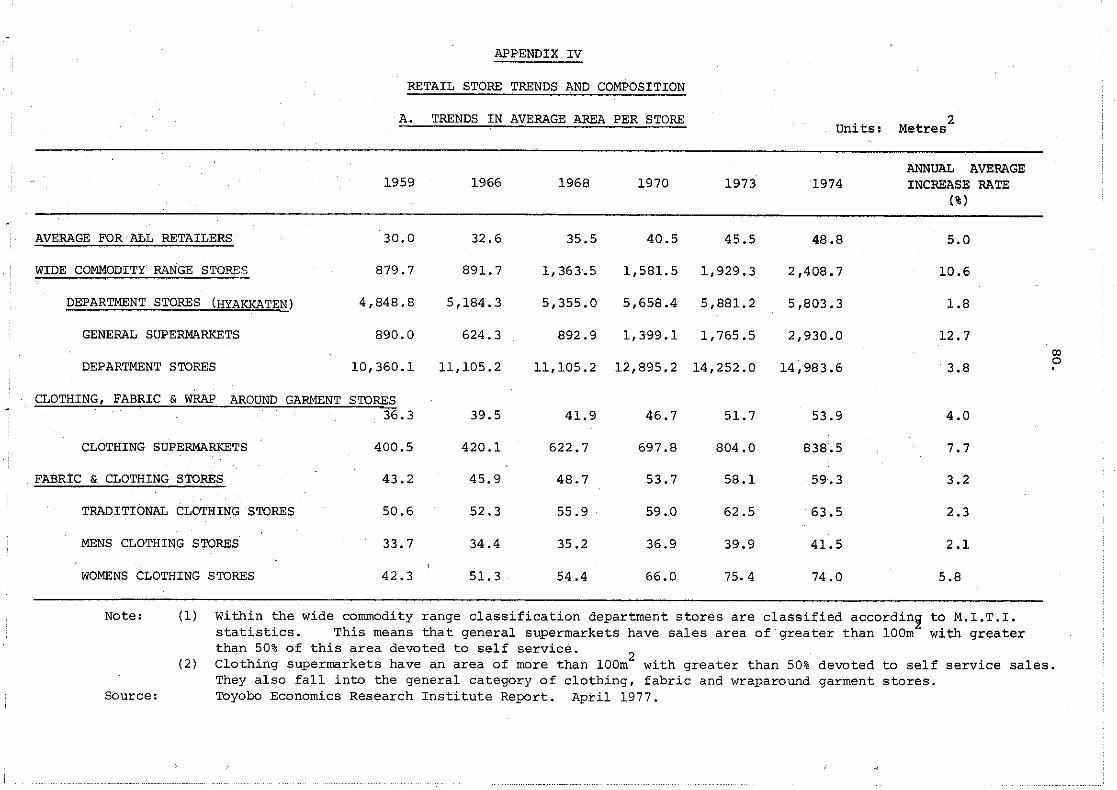
APJ;'ENDIX IV
RETAIL STORE TRENDS AND COMPOSITION
A. TRENDS IN AVERAGE AREA PER STOREunits:
2Metres
1959 1966 1968 1970 1973 1974ANNUAL AVERAGEINCREASE RATE
(% )
AVERAGE FOR'ALL RETAILERS
WIDE COMMODITY RANGE STOP."S
DEPARTMENT STORES (HYAKKATEN)
GENERAL SUPERMARKETS
30.0
879.7
4,848.8
890.0
32.6
891. 7
5,184.3
624.3
35.5
1,363.5
5,355.0
892.9
40.5 45.5
1,581.5 1,929.3
5,658.4 5,881.2
1,399.1 1,765.5
48.8
2,408.7
5,803.3
2,930.0
5.0
10.6
1.8
12.7
DEPARTMENT STORES 10,360.1 11,105.2 11,105.2 12,895.2 14,252.0 14,983.6 3.8(Xlo.
CLOTHING, FABRIC & WRAP AROUND GARMENT STORES36.3 39.5 41.9 46.7 51.7 53.9 4.0
CLOTHING SUPERMARKETS
FABRIC &, CLOTHING STORES
TRADITIONAL CLOTHING STORES
MENS CLOTHING STORES
WOMENS CLOTHING STORES
400.5
43.2
50.6
33.7
42.3
420.1
45.9
52.3
34.4
51. 3
622.7
48.7
55.9
35.2
54.4
697.8
53.7
59.0
36.9
66.0
804.0
58.1
62.5
39.9
75.4
838.5
, 59.3
63.5
41.5
74.0
7.7
3.2
2.3
2.1
5.8
Note:
Source:
(1)
(2 )
Within the wide commodity range classification department stores are classified accordin~ to M.I.T.I.statistics. This means that general supermarkets have sales area of greater than 100m with greaterthan 50% of this area devoted to self service. 2Clothing supermarkets have an area of more than 100m with greater than 50% devoted to self service sales.They also fall into the general category of clothing, fabric and wraparound garment stores.Toyobo Economics Research Institute Report. April 1977.
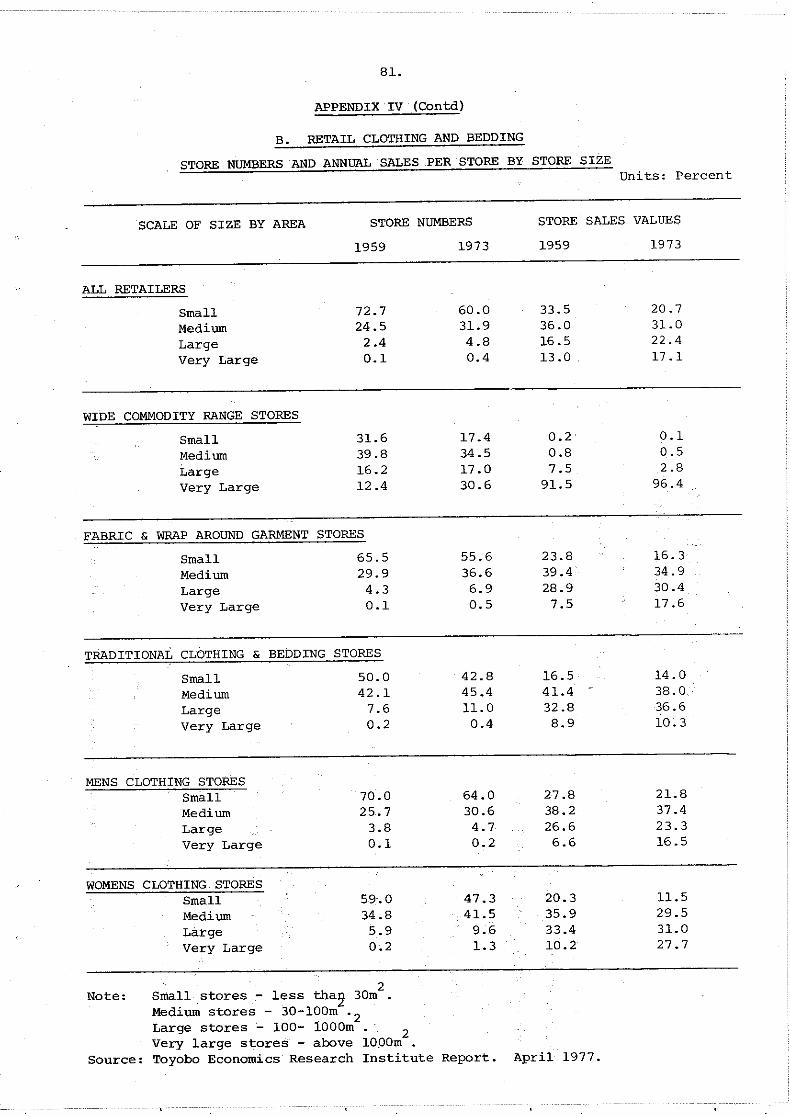
81.
APPENDIX IV (Contd)
B. RETAIL CLOTHING AND BEDDING
STORE NUMBERS AND ANNUAL SALES PER STORE BY STORE SIZEunits: Percent
SCALE OF SIZE BY AREA STORE NUMBERS STORE SALES VALUES
1959 1973 1959 1973
ALL RETAILERS
Small 72.7 60.0 33.5 20.7Medium 24.5 31.9 36.0 31.0Large 2.4 4.8 16.5 22.4Very Large 0.1 0.4 13 .0 17.1
WIDE COMMODITY RANGE STORES
Small 31.6 17.4 0.2 0.1Medium 39.8 34.5 0.8 0.5Large 16.2 17.0 7.5 2.8Very Large 12.4 30.6 91.5 96.4
FABRIC & WRAP AROUND GARMENT STORES
Small 65.5 55.6 23.8 16.3Medium 29.9 36.6 39.4 34.9Large 4.3 6.9 28.9 30.4Very Large 0.1 0.5 7.5 17.6
TRADITIONAL CLOTHING & BEDDING STORES
Small 50.0 42.8 16.5 14.0Medium 42.1 45.4 41.4 - 38.0Large 7.6 11.0 32.8 36.6Very Large 0.2 0.4 8.9 10.3
MENS CLOTHING STORESSmall 70.0 64.0 27.8 21.8Medium 25.7 30.6 38.2 37.4Large 3.8 4.7 26.6 23.3Very Large 0.1 0.2 6.6 16.5
WOMENS CLOTHING STORESSmall 59.0 47.3 20.3 11.5Medium 34.8 41.5 35.9 29.5Large 5.9 9.6 33.4 31.0Very Large 0.2 1.3 10.2 27.7
Note: Small stores - less tha9 30m2
Medium stores - 30-100m .2Large stores - 100- 1000m .
2Very large stores - above 1000m
Source: Toyobo Economics Research Institute Report. April 1977.

APPENDIX IV (Contd)
C. TRENDS IN AVERAGE EMPLOYEES PER STORESUnits: People
1959 1966 1968 1970 1973 1974
AVERAGE FOR ALL RETAILERS 2.9 3.0 3.3 3.4 3.5 3.5
WIDE COMMODITY RANGE STORES 55.7 57.3 76.3 77 .8 86.4 97.4
DEPARTMENT STORES (HXAKKATEN) 308.7 339.3 302.1 282.0 265.3 235.8
GENERAL SUPERMARKETS 63.9 43.1 44.6 58.0 67.4 97.8
DEPARTMENT STORES 602.5 619.6 567.7 561.2 552.7 554.7'"N.
CLOTHING, FABRIC AND WRAP AROUND STORES
3.6 3.7 3.7 3.6 3.6 3.5
CLOTHING SUPERMARKETS 30.5 29.1 32.5 26.5 25.1 23.9
FABRIC & CLOTHING STORES 4.4 4.4 4.4 4.3 4.7 3.9
TRADITIONAL CLOTHING & BEDDING STORES
4.5 4.6 4.6 4.3 4.3 4.1
MENS CLOTHING STORES 4.2 4.0 4.0 3.7 3.7 3.4 '
WOMENS CLOTHING STORES 4.4 4.6 4.6 4.8 4.7 4.3
Source: Toyobo Economic Research Institute Report. April 1977.

83.
Aj;>PENDIX V
FIBRE AND TEXTILE PRODUCTION IN JAPAN
BY TYPE AND COMPANY GROUP
1)2)3)4)5)6)7)
Fibre &
SanwaMitsuiSumitomoMitsubishiFuyoToyotaDKBOther - quotedOther - unquoted
Textile¥ Million
506,032366,893296,451210,535177,304
18,5048,063
1,345,051459,905
(14 .9%)(10.8%)( 8.8%)( 6.2%)( 5.2%)( 0.6%)( 0.2%)(39.7%)
N.B.
a)
b)
3,388,738 (100.0%)
Total demand of cotton in 1972 was 821,000 tons or¥181,322 million, 100% of which was imported.Total demand of wool in 1971 was 309,000 tons or¥96,867 million, 100% of which was imported.
BREAKDOWN OF FIBRE AND TEXTILE COMPANIES' TURNOVER IN 1971:
¥ Million
SilkSpinningWeavingDyeing
CottonSpinningWeavingDyeing
Wool ,SpinningWeavingDyeing
Hemp & JuteSpinningWeaving
.SyntheticFibre ManufacturingSpinningRayon ManufacturingAcetate Manufacturing
ClothesOthers
Source: M. I . T. I .
15,650340,042
75,300
315,566214,935172,301
-332,027117,279
41,345
22,5895,774
669,308410,557
93,46324,500
430,992 (12,7%)
702,301 (20.7%)
480,625 (14.2%)
28,363 (0.8%)
1,197,828 (35.4%)451,819 (13.3%)
96.810 ( 2.9%)
3,388,738 (100.0%)


APPENDIX VI (Contd)
FLOW CHART FOR ACRYLIC FIBRE PRODUCTION (AUGUST 1974)
PROPYLENE ACRYLNITRYL
(1000 tons/yr.)
ACRYLIC FIBRE
(tons/day)
Sumitomo Chemical wAsahi Chemical":::,..~--::::::::/"/- 186.6
Tonen Petrochemica~~
Asahi Chemical192
CD
'"-Toyo Beslon
133
. - Nippon Exlan188
~ ~~~~~-~Kanegafuchi Chemical63
.L --''--::-_·~_''· Toray. 132
\ Kanebo Acrylic30
'Toyo Chemical- 43.8
,Ni tto Chemical142.4
"\Showa Denko56.8
- Sumitomo Chemical,/ 140
----------,Mi tsubishi Chemical'~'="c---------,Mi tsubishi Rayon,/ 96.8 '\ . 181
Showa Denko
AMONIA
Chisso
Mi tsui Petrochemical'
Sumitomo Chemical
Mitsubishi Chemical
Nitto Chemical
Tokai Ryuan
Japan PetrochemicaL:. \--',
Shuso Petrochemical·· ..
Mi tsui Toatsu
Source: Toyobo Economics Research Institute Report. May 1975.
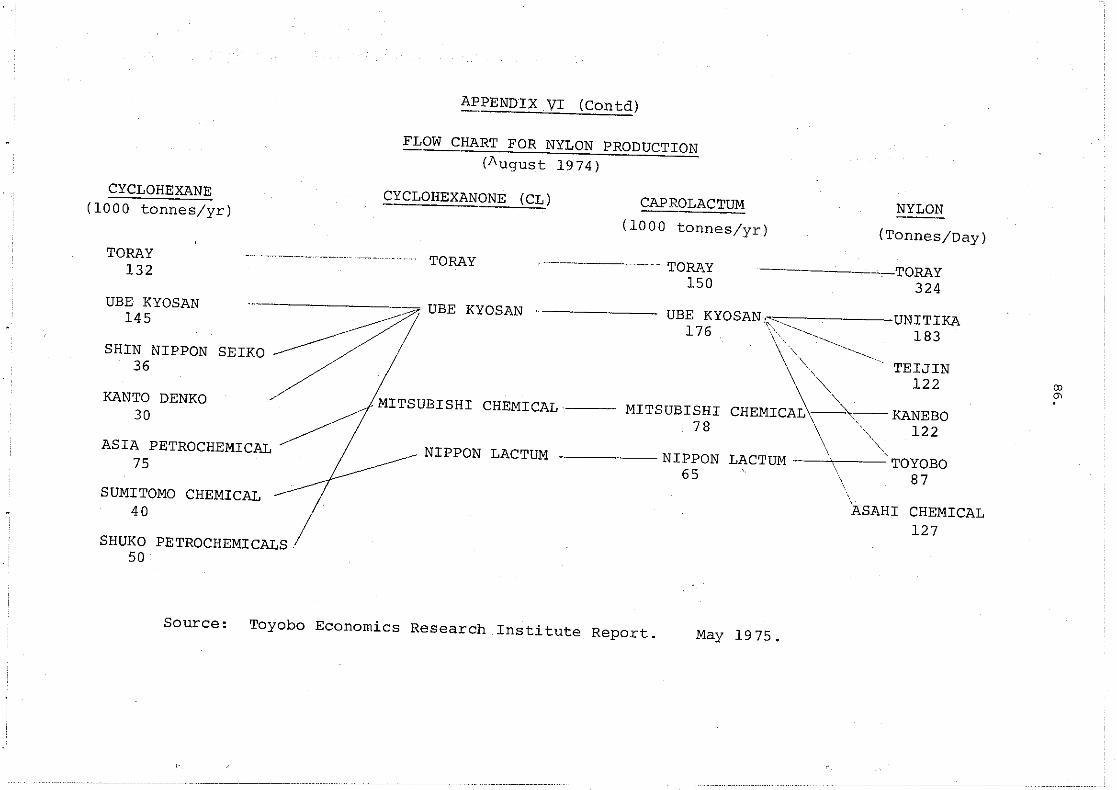
APPENDIX VI (Contd)
FLOW CHART FOR NYLON PRODUCTION(August 1974)
CYCLOHEXANE(l000 tonnes/yr)
CYCLOHEXANONE (CL) CAP ROLACTUM
(l000 tonnes/yr)
NYLON
(Tonnes/Day)
TORAY132
TORAY ---------- TORAY150
TORAY324
KANTO DENKO30
ASIA PETROCHEMICAL~75
MITSUBISHI CHEMICAL ,---
())
0'>
UBE KYOSAN ,'""'------UNITIKA'\". ..........
176 '\" ~,---_ 183" ~
''"'' ----~-, TEIJIN
\ '" 122MITSUBISHI CHEMICA~ '""" KANEBO
7B \ "'_" 122_ NIPPON LACTUM ----- NIPPON LACTUM ----'\~\--'TOYOBO
65 \ 87
-- --", UBE KYOSAN -------
SEIKO~UBE KYOSAN
145
SHIN NIPPON36
SUMITOMO CHEMICAL /40
SHUKO PETROCHEMICALS50
ASAHI CHEMICAL127
Source: Toyobo Economics Research Institute Report. May 1975.

RECENT PUBLICAnONS
RESEARCH REPORTS
48. Proceedings of an NZ. Seminar on Project Evaluation inAgriculture and Related Fields, R. C. Jensen (ed.), 1968.
58. Tower Silo Farming in New Zealand~Part II: EconomicPossibilities, D. McClatchy, 1969.
59. Productivity and Income of New Zealand Agriculture,1921-67, D. D. Hussey and B. P. Philpott.
60. Current Trends in New Zealand Beef Production andDisposal, D. McClatchy.
61. Land Development by the State: An Economic Analysisof the Hindon Block, Otago, E. D. Parkes.
62. An Economic Analysis of Soil Conservation and LandRetirement on South Island High Country, R. W. M.Johnson, 1970.
63. A Regional Analysis of Future Sheep Production ill NewZealand, R. W. M. Johnson, 1970.
64. An Economic Assessment of the Middle Class and UpperMiddle Class Market in Malaya as a Potential Outlet forNew Zealand Meat and Dairy Products, K. Y. Ha, 1970.
65. Capital Formatioll in New Zealand Agriculture, 1947-67.R. W, M. Johnson, 1970.
66. Distribution Costs and Efficiency for Fresh Emil andVegetables. G. W. Kitson, 1971.
67. The Optimisnt of a Sixteen Sector Model fif the NewZealand Economy, T. R. O'Malley, 1973.
68. An Analysis of Lands and Survey Development Projecfs./945-69, H. J. Plunkett, 1972.
69. Quantitative Techniques for Forecasting: A Review ~1Jith
Applications to New Zealand Wool Prices for 1974-5,Joan Rodgers, 1974.
70. A Practical Guide to Tax Planning using Procedures forIncome Equalisation, P. 1. Charlton, 1975. .
71. Srudies in Costs ot Production: Process Peas and Be.ans,1974-75, W. O. McCarthy, R. G. Moffitt, P. W. Cosgriffand P. D. Chudleigh, 1975.
72. Location of Farm Advisory Officers if! New Zealandan Application of Facility Location Analysis, Joan R.Rodgers, Owen McCarthy and Vicki Mabin, 1975.
73. The Ambulance Facility Location Problem-a Survey ofMethods and a Simple Application, Janet Gough'andW.O. McCarthy, 1975.
74. Studies in Costs ot Production: Town Milk Supply Farms/973-74, R. J. Gillespie, 1976.
75. Stabilising Post-Tax Incomes of New Zealand SheepFarms, P. D. Chudleigh, M. J. Blackie and J. B. Dent,1976.
76. Studies in Costs of Production: Tmvn Milk SupplyFarms, 1974-75, R. J. Gillespie, 1976.
77. Studies in Costs ot Production: Town Milk. SupplyFarms, 1975-76, R. J. Gillespie, 1977.
7i:!. Response Patterns to a Mail Survey of New ZealandFarmers, T.1. Ambler, 1977.
79. Wine: A Consumer Survey of Christchurch Households,R. J. Brodie and M. J. Mellon, 1977.
~O. The Energy Requirement of Farming in New Zealand.W. A. N. Brown and R. G. Pearson, 1977.
~1. Survey of New Zealand Farmer Intentions. Expectations.and Opinions, April-May 1977, J. G. Pryde, 1977.
H2. Meat: A Consumer Survey of Christchurch Households,R. J. Brodie, 1977.
H3. Mark.eting Costs tor New Zealand Wool: 1970-71 to/975-76, P. D. Chudle;gh, 1977.
84. National Wheatgrowers' Survey No.1, 1976-77, R. G.Moffitt. and L. E. Davey, 1977.
85. Shipping New Zealand's Agricultural Exports: Background and Issues, P. D. Chudleigh, 1978.
86. Current Cost Depreciation Methods and the Valuation ofFarm Tractors and Headers, L. E. Davey, 1978.
87. Optimum-Seeking Designs for Simulation Experimentswith Models at Agricultural Systems, S. R. Harrison,1978.
8B. Production and Supply Relationships in the New ZealandBeet and Sheep Industries. K. B. Woodford and L. D.Woods, 1978.
89. Computer Simulation Models of Pasture Producti.on inCanterbury: Description and User's Manual, G. W. Fick,1978.
90. A Transport Survey of South Island Farmers, T. 1.Ambler and S. J. Filan, 1978.
91. Bread: A Consumer Survey of Christchurch Households,R. J. Brodie and M. J. Mellon, 1978.
92. An Economic .Survey of New Zealand Wheargro)1'ers.Survey No.2. 1977-78, 1978.
93. An Economic Survey of New Zealand TowIl Milk Producers, 1976-77, 1978.
94. Marketing Costs for New Zealand Meat Exports, 1970/71to 1975/76, P. D. Chudleigh, M. Clemes, L. D. Woods.1978.
95. lnterfibre Relationships and Textile Marketing in Japan,G. W. Kitson, 1978.
MARKET RESEARCH REPORTS
I. P:ocessing ~lan.t Location Studies: I: Theory and aSimple AppLIcatIOn to N.Z. Wool Selling Centres. W. O.McCarthy, J. L Rodgers and C. R. Higham, 1972.Processing Plant Location Studies: II: Policy Alternativesfor N.Z. Wool Selling Centres, C. R. Higham, J. L.Rodgers and W. O. McCarthy, 1972.
3. Doing Business in Japan, W. O. McCarthy (ed.), 1972.4. The Japanese Distribution System and Implications for
New Zealand Traders, G. W. Kitson, 1973.5. Prospects and Strategies in Promoting Tourism Be/ll'cen
Japan and New Zealand, G. W. Kitson, 1973.6. M~rket Assessment, W. O. McCarthy (ed.), 1973.7. 9Ptimum Site, Number and Location of Freezing Works
In the SOUl.h Island, New Zealand - A Spatial Analysis,R. J. Brodie and W. O. McCarthy, 1974.
8. The Japanese Food Market and Implications for NewZealand, G. W. Kitson, 1975.
9. Structure and Corporate Relationships in the JapaneseWool and Wool Textile Industries, G. W. Kitson, 1976.
. DISCUSSION PAPERS
24. New Zealand, The Ten, and Future Market Strategiesc.c.c. Bullet;n, No, 559, W. O. McCarthy, 1972. '
25. The Wool Acquisition Controversy. c.c.c. Bulletin, No.577, W, 0, McCarthy, 1974.
26. Productivity, c.c.c. Bulletin, No. 579, B. J. Ross, 1974.27. Investment On the Rural Scene, paper presented to N.Z.
Inst. of Valuers Seminar, B. J. Ross, 1974.28. The Oil Crisis and International Economics Stability. B.
J. Ross, 1974.
29. Christchurch Tomorrow-A discussion of the future development ot Christchurch as a Regional Centre, J. W,Wood, 1975.
30. Use made of Transport by Farmers: A Pilot Survey withFindings Relating to Ashburton County, New Zealand,T. I. Ambler, 1975.
31. A Postal Sample Survey of Sheep Farmer Attitudes (0
Incentives and Obstacles Lo increasing Farm Output andother Agricultural Policy Issues. J. G. Pryde, 1975.
32. Proceedings ot a Seminar on Costs Beyond the FarmGate, 12th March 1976, J. G. Pryde, W. O. McCarthy,D. L. Fyfe (eds.), 1976.
33. A Postal Survey of the Opinions at a Group ot FarmManagement Society Members on Incentives and Obstaclesto Increasing Farm Output, J. G. Pryde, 1976.
34. A Statistical Analysis of Sources of Variance of Incomeon Sheep Farms in New Zealand. P. D. Chudleigh andS. J. Filan, 1976.
35. Rate Regulation and Economic Efficiency in Rural RoadGoods Transport, T. L Ambler, 1976.
36. Proceedings of a Seminar on Wool Marketing in the1980's-Held at Lincoln College 21 October, 1976, W. O.McCarthy and J. G. Pryde (eds.), 1976.
37. Some Economic Aspects of Conference and Non-Conference Wool Shipping, P. D. Chudleigh, 1976.
38. A Comment on Fisheries and Agricultural Trade Relationships between New Zealand and Japan, G. W. Kitson,1978.
Additional copies of Research Reports, apart from complimentary copies, are available at $2.00 each.Discussion Papers are $1.00 (except No. 32 and No. 36 which are $3.00). Remittance should accompany ordersaddresed to: Bookshop, Lincoln College, Canterbury, New Zealand.


