INTEGRATED LASER SCANNER AND INTENSITY IMAGE CALIBRATION AND ACCURACY ASSESSMENT
Jafar Amiri Parian, Armin Gruen
Institute of Geodesy and Photogrammetry Swiss Federal Institute of Technology (ETH) Zurich
(parian, agruen)@geod.baug.ethz.ch
KEY WORDS: Laser Scanner, Panoramic Image, Calibration, Sensor, Modeling, Accuracy, Test
ABSTRACT:
Nowadays, the use of laser scanner devices as an active technique for acquiring 3D information is growing fast. The huge amount of object points produced with less effort than other 3D acquisition techniques is one of the reasons for interest. For accurate measurements a sophisticated sensor model and calibration procedure is an important prerequisite of such an efficient system. Thecalibration and accuracy assessments of the measurement system reflect the reliability and correctness of the system output. For the calibration and accuracy assessments of the laser scanner system we use the laser’s intensity image and a sensor model,which we developed by extending our mathematical model for linear array based rotating panoramic cameras. The sensor model describes substantial deviations from the pinhole model using additional parameters. With additional parameters the following errors in laser scanners can be modeled: eccentricity of the scan center, collimation and horizontal axis error, tumbling error and resolution of horizontal and vertical rotation. In this paper we present the results of calibration with additional parameters for the Imager 5003 of Zoller+Fröhlich GmbH, which indicate a subpixel accuracy level for such a highly dynamic system. Finally we will demonstratethe system’s accuracy in 3D point positioning by means of a testfield. The result shows the efficiency of our approach for laserscanner modeling.
1. INTRODUCTION
With the development of digital technology, very fast and precise terrestrial laser scanners (Fröhlich and Mettenleiter, 2004) have been developed. Very precise depth information with high point densities and sampling rates of up to 600 kHz can be acquired, however in many cases poor intensity images are acquired compared with area array CCD and panoramic cameras. Since the principle of operation is the same as linear array based rotating panoramic cameras the acquired intensity images can also be processed similar to the images of panoramic cameras. The panoramic camera principle consists of a linear array, which is mounted on a high precision turntable parallel to the rotation axis. By rotation of the turntable, the linear array sensor captures the scenery as a continuous set of vertical scan lines. Our camera calibration, procedure and results have been reported in Amiri Parian and Gruen, 2003; 2004a; 2004b; 2005.
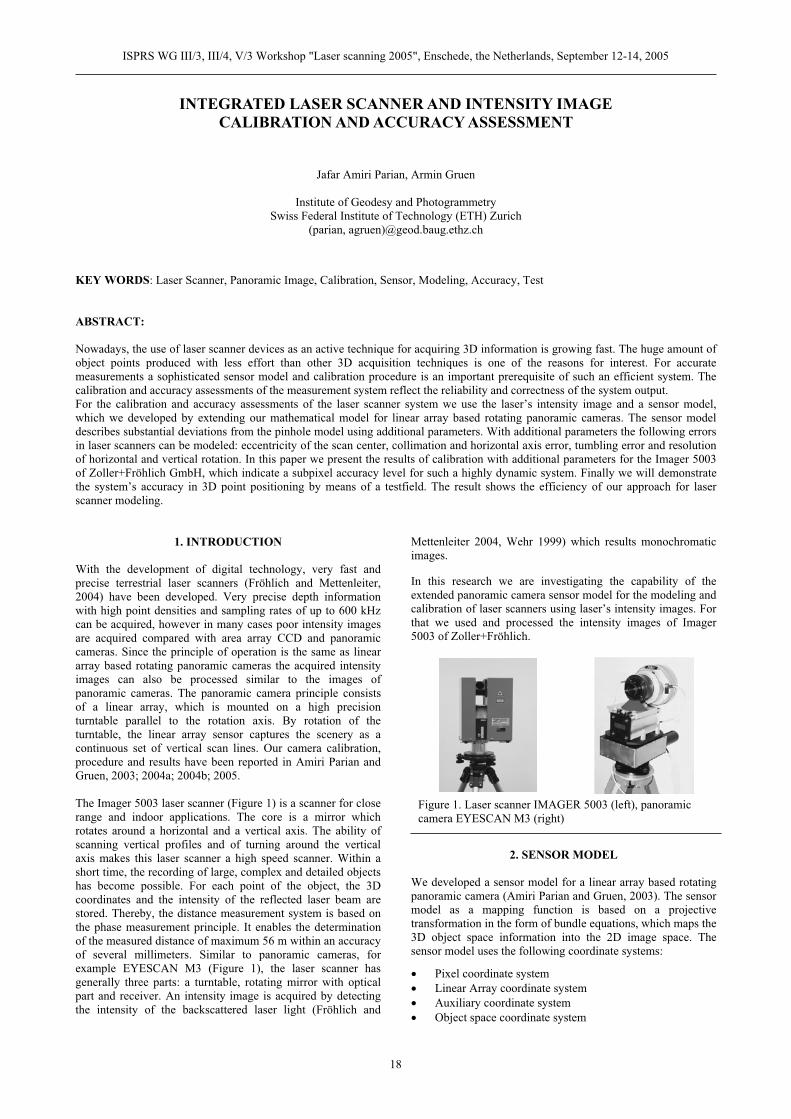
The Imager 5003 laser scanner (Figure 1) is a scanner for close range and indoor applications. The core is a mirror which rotates around a horizontal and a vertical axis. The ability of scanning vertical profiles and of turning around the vertical axis makes this laser scanner a high speed scanner. Within a short time, the recording of large, complex and detailed objects has become possible. For each point of the object, the 3D coordinates and the intensity of the reflected laser beam are stored. Thereby, the distance measurement system is based on the phase measurement principle. It enables the determination of the measured distance of maximum 56 m within an accuracy of several millimeters. Similar to panoramic cameras, for example EYESCAN M3 (Figure 1), the laser scanner has generally three parts: a turntable, rotating mirror with optical part and receiver. An intensity image is acquired by detecting the intensity of the backscattered laser light (Fröhlich and
Mettenleiter 2004, Wehr 1999) which results monochromatic images.
In this research we are investigating the capability of the extended panoramic camera sensor model for the modeling and calibration of laser scanners using laser’s intensity images. For that we used and processed the intensity images of Imager 5003 of Zoller+Fröhlich.
Figure 1. Laser scanner IMAGER 5003 (left), panoramic camera EYESCAN M3 (right)
2. SENSOR MODEL
We developed a sensor model for a linear array based rotating panoramic camera (Amiri Parian and Gruen, 2003). The sensor model as a mapping function is based on a projective transformation in the form of bundle equations, which maps the 3D object space information into the 2D image space. The sensor model uses the following coordinate systems:
Pixel coordinate system Linear Array coordinate system Auxiliary coordinate system Object space coordinate system
ISPRS WG III/3, III/4, V/3 Workshop "Laser scanning 2005", Enschede, the Netherlands, September 12-14, 2005
18
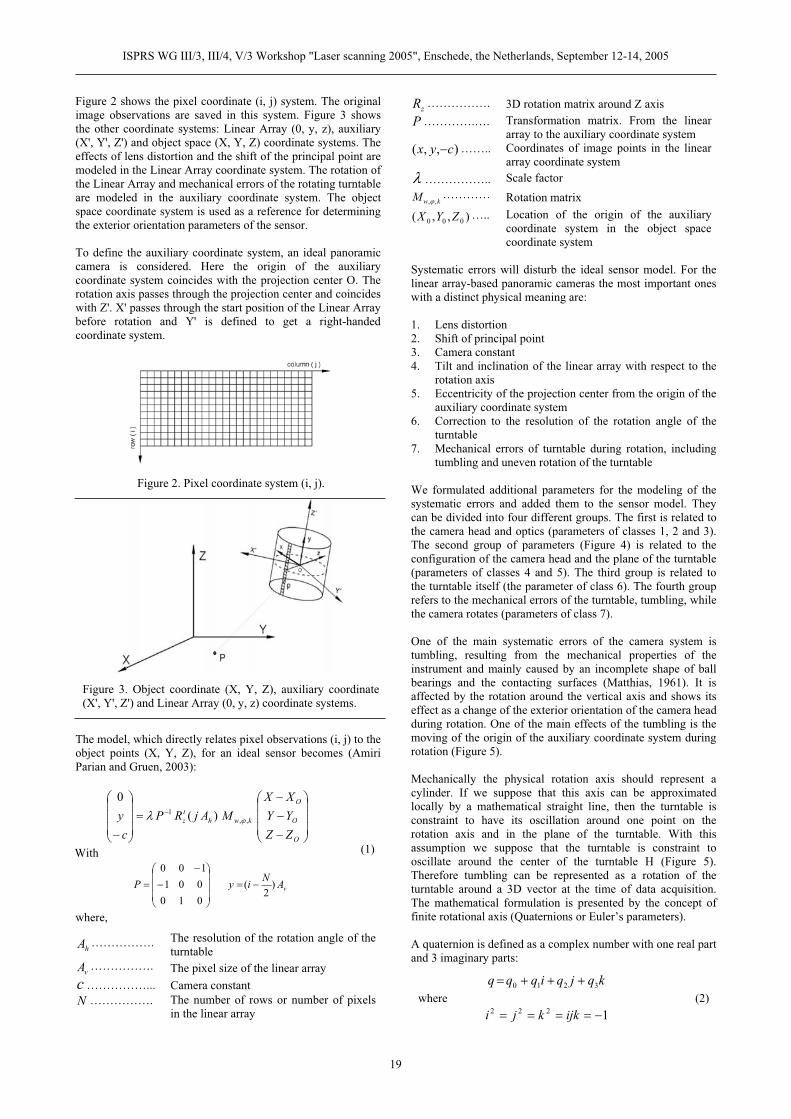
Figure 2 shows the pixel coordinate (i, j) system. The original image observations are saved in this system. Figure 3 shows the other coordinate systems: Linear Array (0, y, z), auxiliary (X', Y', Z') and object space (X, Y, Z) coordinate systems. The effects of lens distortion and the shift of the principal point are modeled in the Linear Array coordinate system. The rotation of the Linear Array and mechanical errors of the rotating turntable are modeled in the auxiliary coordinate system. The object space coordinate system is used as a reference for determining the exterior orientation parameters of the sensor.
To define the auxiliary coordinate system, an ideal panoramic camera is considered. Here the origin of the auxiliary coordinate system coincides with the projection center O. The rotation axis passes through the projection center and coincides with Z'. X' passes through the start position of the Linear Array before rotation and Y' is defined to get a right-handed coordinate system.
Figure 2. Pixel coordinate system (i, j).
Figure 3. Object coordinate (X, Y, Z), auxiliary coordinate (X', Y', Z') and Linear Array (0, y, z) coordinate systems.
The model, which directly relates pixel observations (i, j) to the object points (X, Y, Z), for an ideal sensor becomes (Amiri Parian and Gruen, 2003):
O
O
O
kwhtz
ZZYYXX
MAjRPcy ,,
1 )(0
With
vANiyP )2
(010001100
(1)
where,
hA ……………. The resolution of the rotation angle of the turntable
vA ……………. The pixel size of the linear array c……………... Camera constant N ……………. The number of rows or number of pixels
in the linear array
zR ……………. 3D rotation matrix around Z axis P………….…. Transformation matrix. From the linear
array to the auxiliary coordinate system ),,( cyx …….. Coordinates of image points in the linear
array coordinate system …………….. Scale factor
kwM ,,………… Rotation matrix
),,( 000 ZYX ….. Location of the origin of the auxiliary coordinate system in the object space coordinate system
Systematic errors will disturb the ideal sensor model. For the linear array-based panoramic cameras the most important ones with a distinct physical meaning are:
1. Lens distortion 2. Shift of principal point 3. Camera constant 4. Tilt and inclination of the linear array with respect to the
rotation axis 5. Eccentricity of the projection center from the origin of the
auxiliary coordinate system 6. Correction to the resolution of the rotation angle of the
turntable 7. Mechanical errors of turntable during rotation, including
tumbling and uneven rotation of the turntable
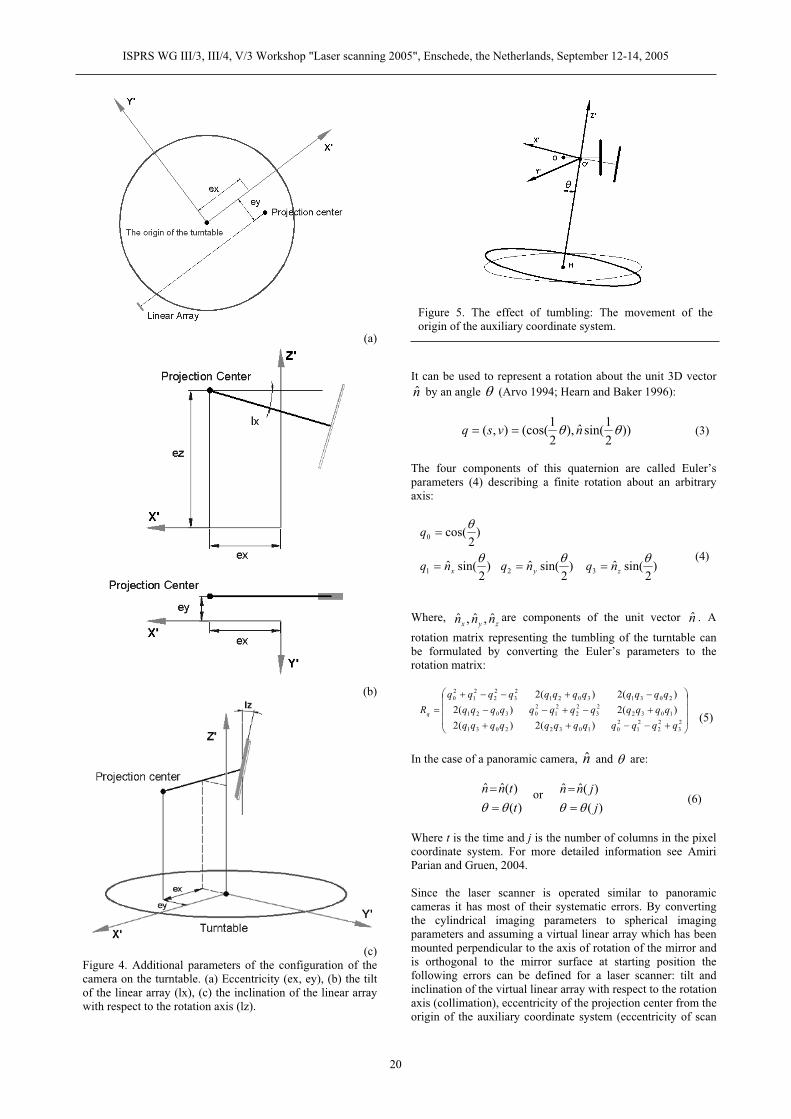
We formulated additional parameters for the modeling of the systematic errors and added them to the sensor model. They can be divided into four different groups. The first is related to the camera head and optics (parameters of classes 1, 2 and 3). The second group of parameters (Figure 4) is related to the configuration of the camera head and the plane of the turntable (parameters of classes 4 and 5). The third group is related to the turntable itself (the parameter of class 6). The fourth group refers to the mechanical errors of the turntable, tumbling, while the camera rotates (parameters of class 7).
One of the main systematic errors of the camera system is tumbling, resulting from the mechanical properties of the instrument and mainly caused by an incomplete shape of ball bearings and the contacting surfaces (Matthias, 1961). It is affected by the rotation around the vertical axis and shows its effect as a change of the exterior orientation of the camera head during rotation. One of the main effects of the tumbling is the moving of the origin of the auxiliary coordinate system during rotation (Figure 5).
Mechanically the physical rotation axis should represent a cylinder. If we suppose that this axis can be approximated locally by a mathematical straight line, then the turntable is constraint to have its oscillation around one point on the rotation axis and in the plane of the turntable. With this assumption we suppose that the turntable is constraint to oscillate around the center of the turntable H (Figure 5). Therefore tumbling can be represented as a rotation of the turntable around a 3D vector at the time of data acquisition. The mathematical formulation is presented by the concept of finite rotational axis (Quaternions or Euler’s parameters).
A quaternion is defined as a complex number with one real part and 3 imaginary parts:
kqjqiqqq 3210
where1222 ijkkji
(2)
ISPRS WG III/3, III/4, V/3 Workshop "Laser scanning 2005", Enschede, the Netherlands, September 12-14, 2005
19
(a)
(b)
(c)Figure 4. Additional parameters of the configuration of the camera on the turntable. (a) Eccentricity (ex, ey), (b) the tilt of the linear array (lx), (c) the inclination of the linear array with respect to the rotation axis (lz).
Figure 5. The effect of tumbling: The movement of the origin of the auxiliary coordinate system.
It can be used to represent a rotation about the unit 3D vector n̂ by an angle (Arvo 1994; Hearn and Baker 1996):
))21sin(ˆ),
21(cos(),( nvsq (3)
The four components of this quaternion are called Euler’s parameters (4) describing a finite rotation about an arbitrary axis:
)2
sin(ˆ)2
sin(ˆ)2
sin(ˆ
)2
cos(
321
0
zyx nqnqnq
q
(4)
Where, zyx nnn ˆ,ˆ,ˆ are components of the unit vector n̂ . A
rotation matrix representing the tumbling of the turntable can be formulated by converting the Euler’s parameters to the rotation matrix:
23
22
21
2010322031
103223
22
21
203021
2031302123
22
21
20
)(2)(2)(2)(2)(2)(2
qqqqqqqqqqqqqqqqqqqqqqqqqqqqqqqqqqqq
Rq (5)
In the case of a panoramic camera, n̂ and are:
)()(ˆˆttnn or
)()(ˆˆjjnn
(6)
Where t is the time and j is the number of columns in the pixel coordinate system. For more detailed information see Amiri Parian and Gruen, 2004.
Since the laser scanner is operated similar to panoramic cameras it has most of their systematic errors. By converting the cylindrical imaging parameters to spherical imaging parameters and assuming a virtual linear array which has been mounted perpendicular to the axis of rotation of the mirror and is orthogonal to the mirror surface at starting position the following errors can be defined for a laser scanner: tilt and inclination of the virtual linear array with respect to the rotation axis (collimation), eccentricity of the projection center from the origin of the auxiliary coordinate system (eccentricity of scan
ISPRS WG III/3, III/4, V/3 Workshop "Laser scanning 2005", Enschede, the Netherlands, September 12-14, 2005
20
center from rotation axis and horizontal axis error), horizontal and vertical resolution of rotation angle and mechanical errors of the turntable during rotation, especially tumbling (trunnion axis error).
3. RESULTS
3.1. Laser scanner calibration
We show the effect of the extended sensor model for the calibration of a laser scanner. For this purpose single image calibration was performed. Table 1 shows the characteristics of the intensity image and some initial additional parameters.
Table 1. Specifications of the Imager 5003 laser scanner and its intensity image
Number of rows of intensity image 10’000
Number of columns of intensity image 20’264
Horizontal resolution 0.018 degree
Vertical resolution 0.018 degree
Imaging geometry Spherical
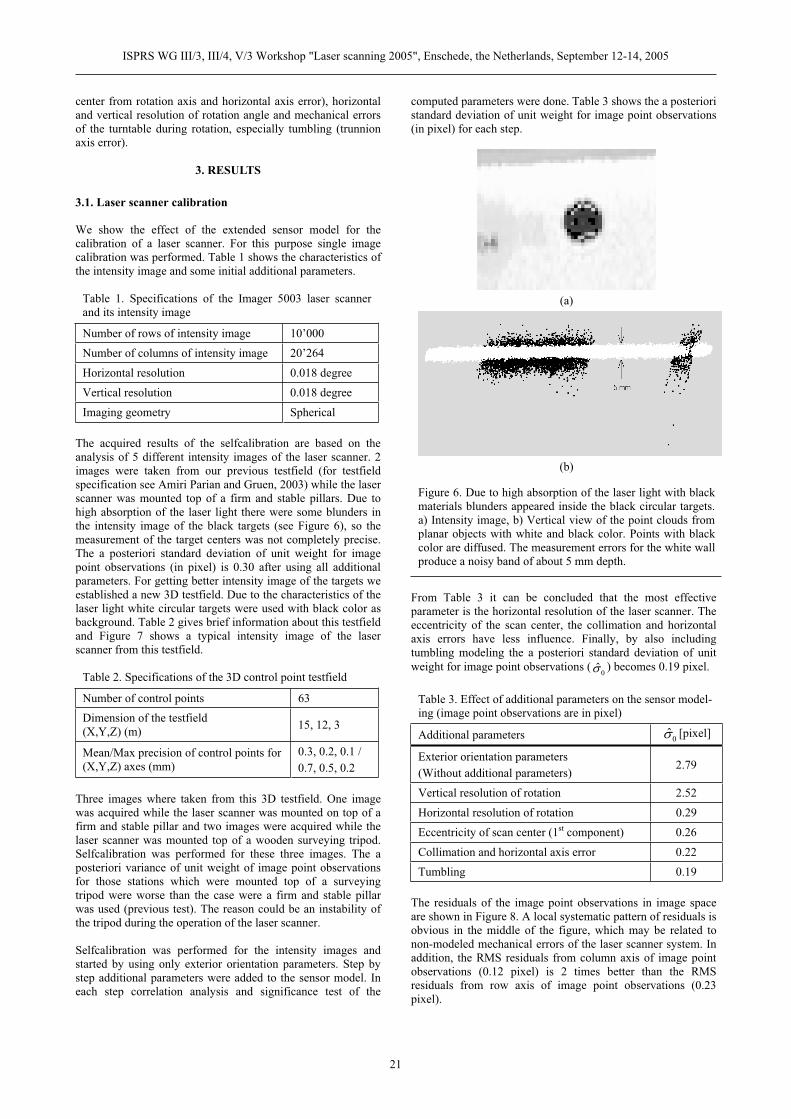
The acquired results of the selfcalibration are based on the analysis of 5 different intensity images of the laser scanner. 2 images were taken from our previous testfield (for testfield specification see Amiri Parian and Gruen, 2003) while the laser scanner was mounted top of a firm and stable pillars. Due to high absorption of the laser light there were some blunders in the intensity image of the black targets (see Figure 6), so the measurement of the target centers was not completely precise. The a posteriori standard deviation of unit weight for image point observations (in pixel) is 0.30 after using all additional parameters. For getting better intensity image of the targets we established a new 3D testfield. Due to the characteristics of the laser light white circular targets were used with black color as background. Table 2 gives brief information about this testfield and Figure 7 shows a typical intensity image of the laser scanner from this testfield.
Table 2. Specifications of the 3D control point testfield
Number of control points 63 Dimension of the testfield (X,Y,Z) (m) 15, 12, 3
Mean/Max precision of control points for (X,Y,Z) axes (mm)
0.3, 0.2, 0.1 / 0.7, 0.5, 0.2
Three images where taken from this 3D testfield. One image was acquired while the laser scanner was mounted on top of a firm and stable pillar and two images were acquired while the laser scanner was mounted top of a wooden surveying tripod. Selfcalibration was performed for these three images. The a posteriori variance of unit weight of image point observations for those stations which were mounted top of a surveying tripod were worse than the case were a firm and stable pillar was used (previous test). The reason could be an instability of the tripod during the operation of the laser scanner.
Selfcalibration was performed for the intensity images and started by using only exterior orientation parameters. Step by step additional parameters were added to the sensor model. In each step correlation analysis and significance test of the
computed parameters were done. Table 3 shows the a posteriori standard deviation of unit weight for image point observations (in pixel) for each step.
(a)
(b)
Figure 6. Due to high absorption of the laser light with black materials blunders appeared inside the black circular targets. a) Intensity image, b) Vertical view of the point clouds from planar objects with white and black color. Points with black color are diffused. The measurement errors for the white wall produce a noisy band of about 5 mm depth.
From Table 3 it can be concluded that the most effective parameter is the horizontal resolution of the laser scanner. The eccentricity of the scan center, the collimation and horizontal axis errors have less influence. Finally, by also including tumbling modeling the a posteriori standard deviation of unit weight for image point observations (
0ˆ ) becomes 0.19 pixel.
Table 3. Effect of additional parameters on the sensor model-ing (image point observations are in pixel)
Additional parameters 0ˆ [pixel]
Exterior orientation parameters (Without additional parameters)
2.79
Vertical resolution of rotation 2.52
Horizontal resolution of rotation 0.29
Eccentricity of scan center (1st component) 0.26
Collimation and horizontal axis error 0.22
Tumbling 0.19
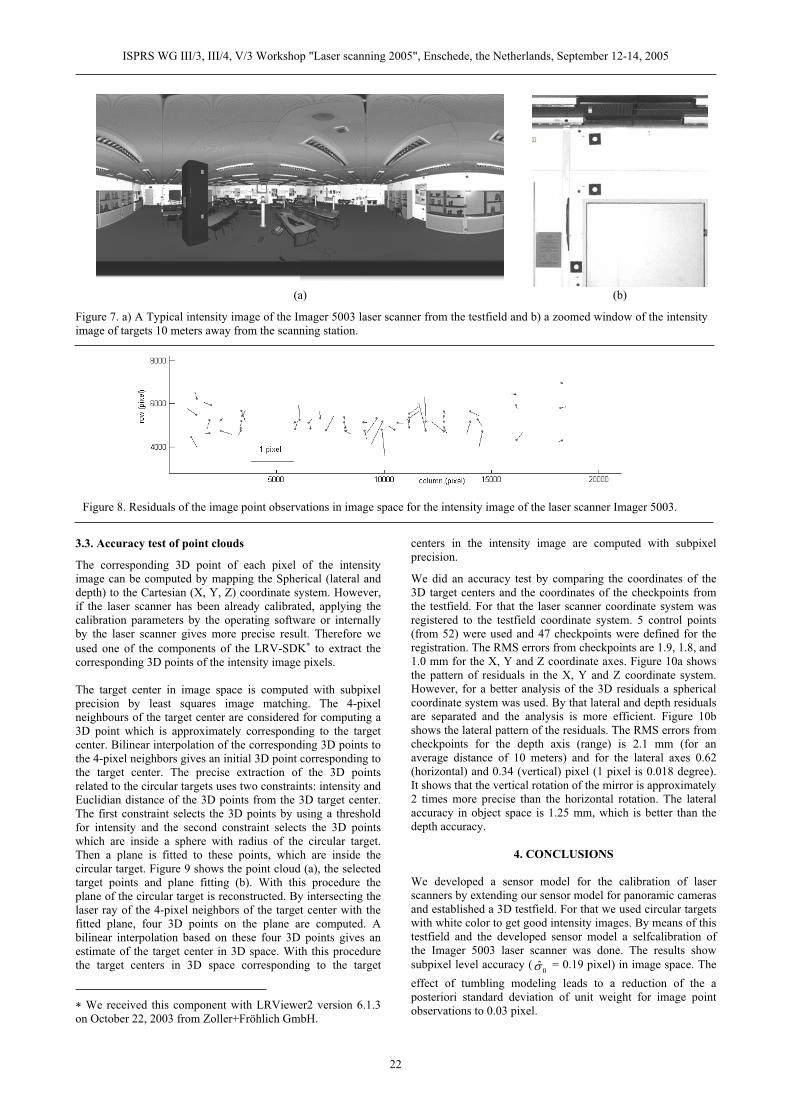
The residuals of the image point observations in image space are shown in Figure 8. A local systematic pattern of residuals is obvious in the middle of the figure, which may be related to non-modeled mechanical errors of the laser scanner system. In addition, the RMS residuals from column axis of image point observations (0.12 pixel) is 2 times better than the RMS residuals from row axis of image point observations (0.23 pixel).
ISPRS WG III/3, III/4, V/3 Workshop "Laser scanning 2005", Enschede, the Netherlands, September 12-14, 2005
21
(a) (b)
Figure 7. a) A Typical intensity image of the Imager 5003 laser scanner from the testfield and b) a zoomed window of the intensity image of targets 10 meters away from the scanning station.
Figure 8. Residuals of the image point observations in image space for the intensity image of the laser scanner Imager 5003.
3.3. Accuracy test of point clouds
The corresponding 3D point of each pixel of the intensity image can be computed by mapping the Spherical (lateral and depth) to the Cartesian (X, Y, Z) coordinate system. However, if the laser scanner has been already calibrated, applying the calibration parameters by the operating software or internally by the laser scanner gives more precise result. Therefore we used one of the components of the LRV-SDK to extract the corresponding 3D points of the intensity image pixels.
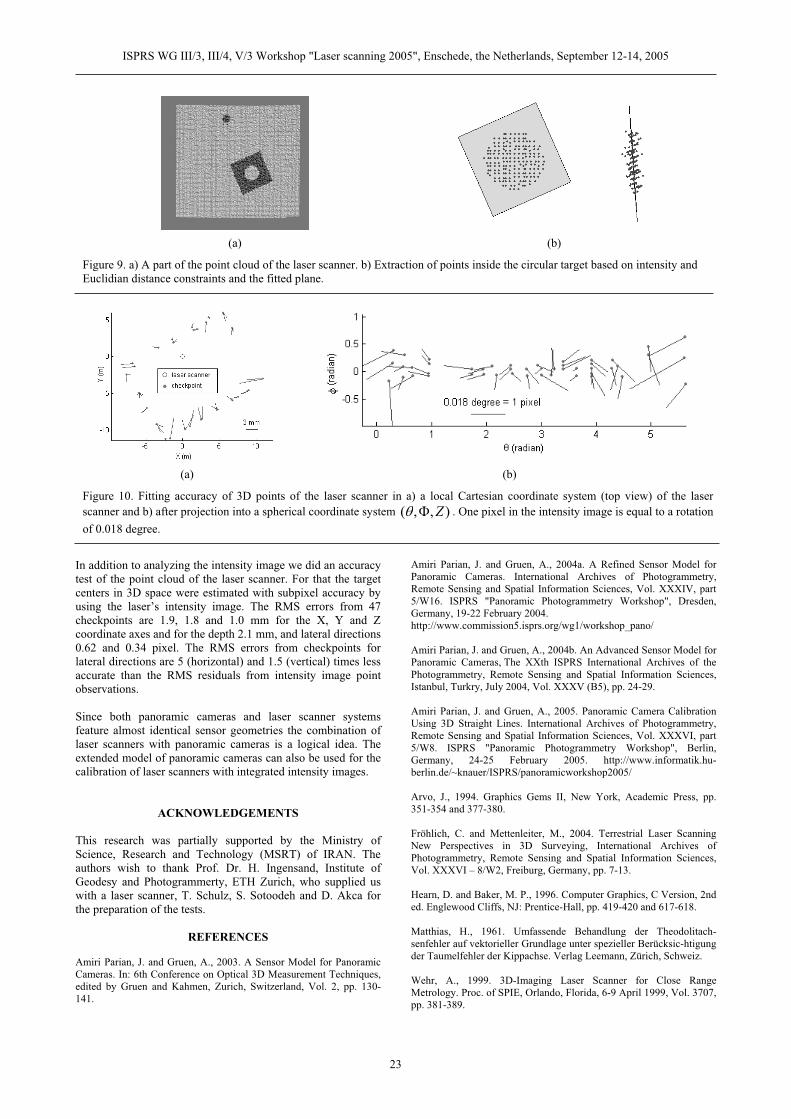
The target center in image space is computed with subpixel precision by least squares image matching. The 4-pixel neighbours of the target center are considered for computing a 3D point which is approximately corresponding to the target center. Bilinear interpolation of the corresponding 3D points to the 4-pixel neighbors gives an initial 3D point corresponding to the target center. The precise extraction of the 3D points related to the circular targets uses two constraints: intensity and Euclidian distance of the 3D points from the 3D target center. The first constraint selects the 3D points by using a threshold for intensity and the second constraint selects the 3D points which are inside a sphere with radius of the circular target. Then a plane is fitted to these points, which are inside the circular target. Figure 9 shows the point cloud (a), the selected target points and plane fitting (b). With this procedure the plane of the circular target is reconstructed. By intersecting the laser ray of the 4-pixel neighbors of the target center with the fitted plane, four 3D points on the plane are computed. A bilinear interpolation based on these four 3D points gives an estimate of the target center in 3D space. With this procedure the target centers in 3D space corresponding to the target
We received this component with LRViewer2 version 6.1.3 on October 22, 2003 from Zoller+Fröhlich GmbH.
centers in the intensity image are computed with subpixel precision.
We did an accuracy test by comparing the coordinates of the 3D target centers and the coordinates of the checkpoints from the testfield. For that the laser scanner coordinate system was registered to the testfield coordinate system. 5 control points (from 52) were used and 47 checkpoints were defined for the registration. The RMS errors from checkpoints are 1.9, 1.8, and 1.0 mm for the X, Y and Z coordinate axes. Figure 10a shows the pattern of residuals in the X, Y and Z coordinate system. However, for a better analysis of the 3D residuals a spherical coordinate system was used. By that lateral and depth residuals are separated and the analysis is more efficient. Figure 10b shows the lateral pattern of the residuals. The RMS errors from checkpoints for the depth axis (range) is 2.1 mm (for an average distance of 10 meters) and for the lateral axes 0.62 (horizontal) and 0.34 (vertical) pixel (1 pixel is 0.018 degree). It shows that the vertical rotation of the mirror is approximately 2 times more precise than the horizontal rotation. The lateral accuracy in object space is 1.25 mm, which is better than the depth accuracy.
4. CONCLUSIONS
We developed a sensor model for the calibration of laser scanners by extending our sensor model for panoramic cameras and established a 3D testfield. For that we used circular targets with white color to get good intensity images. By means of this testfield and the developed sensor model a selfcalibration of the Imager 5003 laser scanner was done. The results show subpixel level accuracy (
0ˆ = 0.19 pixel) in image space. The effect of tumbling modeling leads to a reduction of the a posteriori standard deviation of unit weight for image point observations to 0.03 pixel.
ISPRS WG III/3, III/4, V/3 Workshop "Laser scanning 2005", Enschede, the Netherlands, September 12-14, 2005
22
(a) (b)
Figure 9. a) A part of the point cloud of the laser scanner. b) Extraction of points inside the circular target based on intensity and Euclidian distance constraints and the fitted plane.
(a) (b)
Figure 10. Fitting accuracy of 3D points of the laser scanner in a) a local Cartesian coordinate system (top view) of the laserscanner and b) after projection into a spherical coordinate system ),,( Z . One pixel in the intensity image is equal to a rotation of 0.018 degree.
In addition to analyzing the intensity image we did an accuracy test of the point cloud of the laser scanner. For that the target centers in 3D space were estimated with subpixel accuracy by using the laser’s intensity image. The RMS errors from 47 checkpoints are 1.9, 1.8 and 1.0 mm for the X, Y and Z coordinate axes and for the depth 2.1 mm, and lateral directions 0.62 and 0.34 pixel. The RMS errors from checkpoints for lateral directions are 5 (horizontal) and 1.5 (vertical) times less accurate than the RMS residuals from intensity image point observations.
Since both panoramic cameras and laser scanner systems feature almost identical sensor geometries the combination of laser scanners with panoramic cameras is a logical idea. The extended model of panoramic cameras can also be used for the calibration of laser scanners with integrated intensity images.
ACKNOWLEDGEMENTS
This research was partially supported by the Ministry of Science, Research and Technology (MSRT) of IRAN. The authors wish to thank Prof. Dr. H. Ingensand, Institute of Geodesy and Photogrammerty, ETH Zurich, who supplied us with a laser scanner, T. Schulz, S. Sotoodeh and D. Akca for the preparation of the tests.
REFERENCES
Amiri Parian, J. and Gruen, A., 2003. A Sensor Model for Panoramic Cameras. In: 6th Conference on Optical 3D Measurement Techniques, edited by Gruen and Kahmen, Zurich, Switzerland, Vol. 2, pp. 130-141.
Amiri Parian, J. and Gruen, A., 2004a. A Refined Sensor Model for Panoramic Cameras. International Archives of Photogrammetry, Remote Sensing and Spatial Information Sciences, Vol. XXXIV, part 5/W16. ISPRS "Panoramic Photogrammetry Workshop", Dresden, Germany, 19-22 February 2004. http://www.commission5.isprs.org/wg1/workshop_pano/
Amiri Parian, J. and Gruen, A., 2004b. An Advanced Sensor Model for Panoramic Cameras, The XXth ISPRS International Archives of the Photogrammetry, Remote Sensing and Spatial Information Sciences, Istanbul, Turkry, July 2004, Vol. XXXV (B5), pp. 24-29.
Amiri Parian, J. and Gruen, A., 2005. Panoramic Camera Calibration Using 3D Straight Lines. International Archives of Photogrammetry, Remote Sensing and Spatial Information Sciences, Vol. XXXVI, part 5/W8. ISPRS "Panoramic Photogrammetry Workshop", Berlin, Germany, 24-25 February 2005. http://www.informatik.hu-berlin.de/~knauer/ISPRS/panoramicworkshop2005/
Arvo, J., 1994. Graphics Gems II, New York, Academic Press, pp. 351-354 and 377-380.
Fröhlich, C. and Mettenleiter, M., 2004. Terrestrial Laser Scanning New Perspectives in 3D Surveying, International Archives of Photogrammetry, Remote Sensing and Spatial Information Sciences, Vol. XXXVI – 8/W2, Freiburg, Germany, pp. 7-13.
Hearn, D. and Baker, M. P., 1996. Computer Graphics, C Version, 2nd ed. Englewood Cliffs, NJ: Prentice-Hall, pp. 419-420 and 617-618.
Matthias, H., 1961. Umfassende Behandlung der Theodolitach-senfehler auf vektorieller Grundlage unter spezieller Berücksic-htigung der Taumelfehler der Kippachse. Verlag Leemann, Zürich, Schweiz.
Wehr, A., 1999. 3D-Imaging Laser Scanner for Close Range Metrology. Proc. of SPIE, Orlando, Florida, 6-9 April 1999, Vol. 3707, pp. 381-389.
ISPRS WG III/3, III/4, V/3 Workshop "Laser scanning 2005", Enschede, the Netherlands, September 12-14, 2005
23


