
Prepared by Aon Benfield Analytics
Insurance Risk Study Brian Alvers 2014 Analytics Insights Conference July 22 - 24

Aon Benfield | Analytics
Proprietary & Confidential 2
Objective
Insurance Risk Study determines credible global insurance volatility benchmarks for use in underwriting risk modeling
Motivation: robust empirical quantification of all aspects of underwriting risk
Systemic volatility parameters by country, by line
– Forty nine countries, 90% of global premium
– Results for eight core lines of business
– Available as input to any simulation tool
Loss ratio correlation between lines within country
Correlation between macroeconomic and insurance variables
Aon Benfield approach to growth strategies
Insurance profitability, economic variables, and demographics by country
Detailed country profile of six individual insurance markets
Recognized by major US rating agencies
Published annually in September
Eighth edition released in 2013
Aon Benfield Insurance Risk Study Informed Parameterization of Risk Models
Aon Benfield | Analytics
Proprietary & Confidential 3
Introduction
Convergence of capital markets and insurance markets a reality for property catastrophe
– Pension fund, high-net worth individual, hedge fund and other capital
– Made it cheap to transfer catastrophe risk into the capital markets
Exciting prospect: extension to other, largely non-catastrophe driven perils
– Requires capital market and investor acceptance of underlying risk modeling
– Just what the Aon Benfield Insurance Risk Study has been focused on since 2006
For the first time, we are reporting combined ratios by country in order to identify potential growth opportunities
– Plus six in-depth country studies
Study is the cornerstone of Aon Benfield Analytics’ integrated and comprehensive risk modeling and risk assessment capabilities
– Reinsurance optimization framework
– ERM and economic capital modeling

Aon Benfield | Analytics
Proprietary & Confidential 4
Agenda
Section 1 Global Risk Parameters
Section 2 U.S. Reserve Adequacy and Risk
Section 3 Global Correlation Between Lines
Section 4 Macroeconomic Correlation
Section 5 Global Premium, Profitability and Opportunities
Section 6 Extending Insurance-Linked Securities

Section 1: Global Risk Parameters

Aon Benfield | Analytics
Proprietary & Confidential 6
Systemic Insurance Risk
Asset portfolio theory: risk does not diversify beyond systemic market risk
Insurance risk by line shows same behavior
– Risk does not completely diversify with increasing volume
• Naïve insurance risk model incorrectly assumes risk decreases to zero
– Level of systemic insurance risk varies by line
– Aon Benfield Insurance Risk Study determines level of systemic insurance risk by line
Asset Portfolio Risk Insurance Portfolio Risk
Aon Benfield | Analytics
Proprietary & Confidential 7
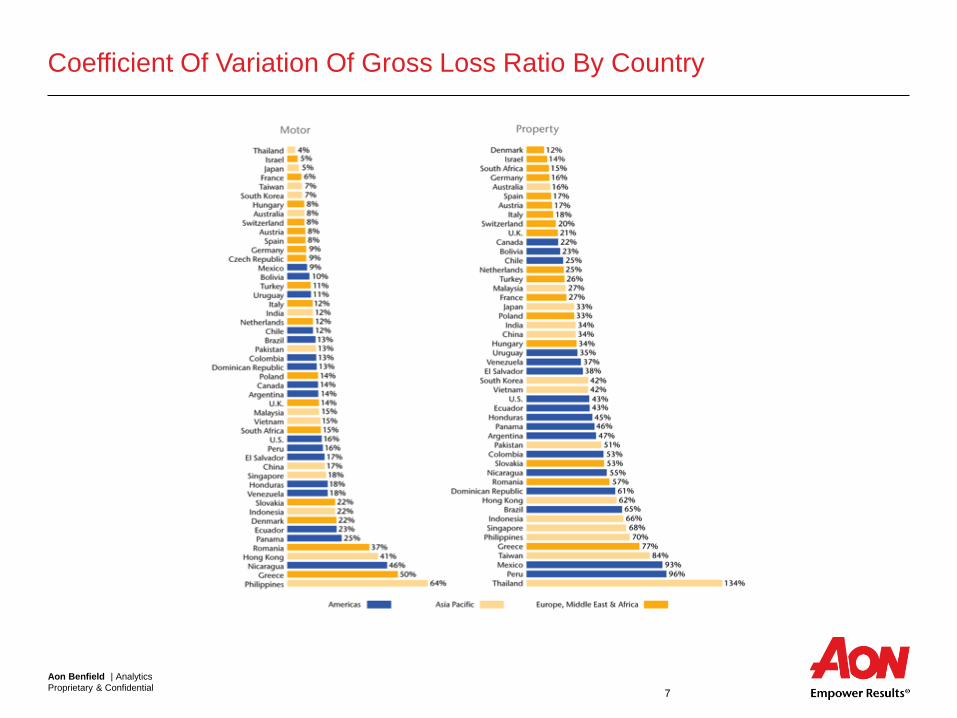
Coefficient Of Variation Of Gross Loss Ratio By Country

Aon Benfield | Analytics
Proprietary & Confidential 8
U.S. Risk Parameters Coefficient Of Variation Of Gross Loss Ratio, 1992-2012

Aon Benfield | Analytics
Proprietary & Confidential 9
Impact Of The Pricing Cycle
Aon Benfield | Analytics
Proprietary & Confidential 10
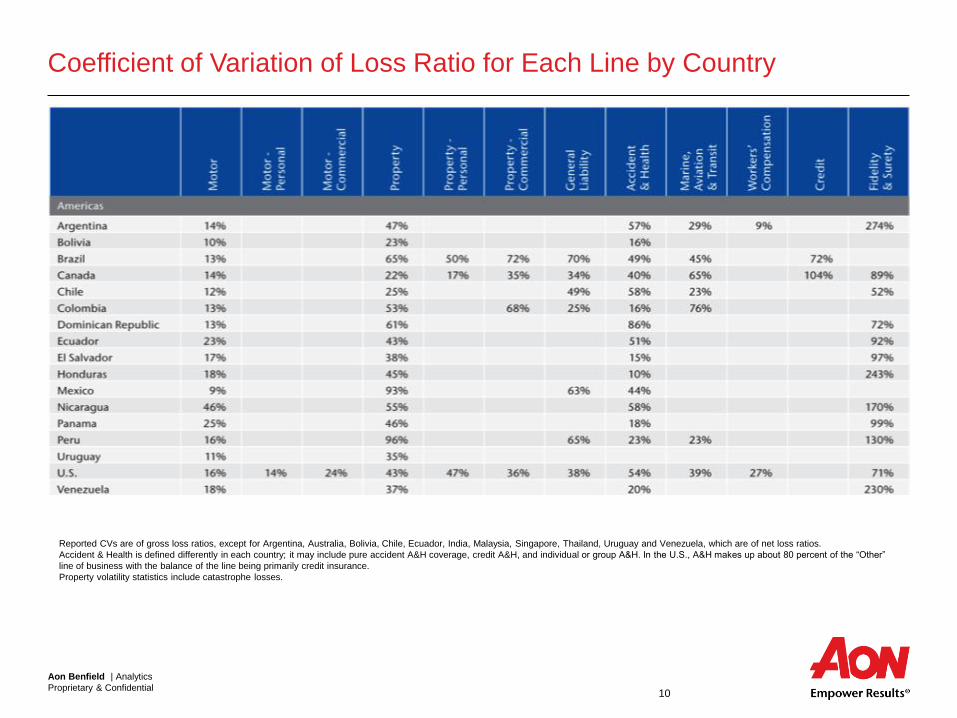
Coefficient of Variation of Loss Ratio for Each Line by Country
Reported CVs are of gross loss ratios, except for Argentina, Australia, Bolivia, Chile, Ecuador, India, Malaysia, Singapore, Thailand, Uruguay and Venezuela, which are of net loss ratios.
Accident & Health is defined differently in each country; it may include pure accident A&H coverage, credit A&H, and individual or group A&H. In the U.S., A&H makes up about 80 percent of the “Other”
line of business with the balance of the line being primarily credit insurance.
Property volatility statistics include catastrophe losses.
Aon Benfield | Analytics
Proprietary & Confidential 11
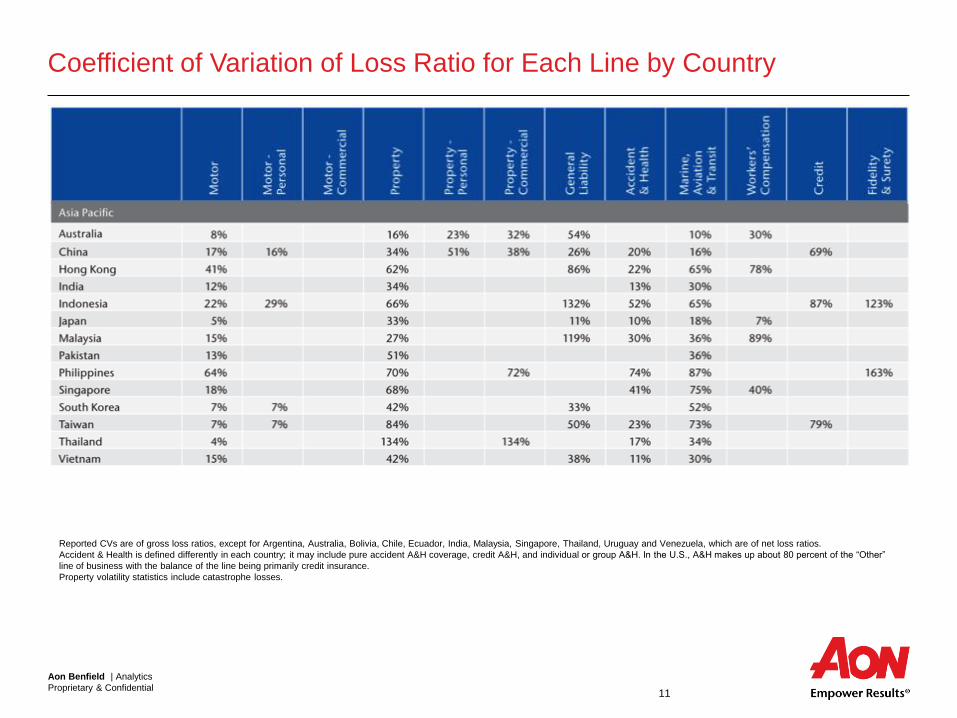
Coefficient of Variation of Loss Ratio for Each Line by Country
Reported CVs are of gross loss ratios, except for Argentina, Australia, Bolivia, Chile, Ecuador, India, Malaysia, Singapore, Thailand, Uruguay and Venezuela, which are of net loss ratios.
Accident & Health is defined differently in each country; it may include pure accident A&H coverage, credit A&H, and individual or group A&H. In the U.S., A&H makes up about 80 percent of the “Other”
line of business with the balance of the line being primarily credit insurance.
Property volatility statistics include catastrophe losses.

Aon Benfield | Analytics
Proprietary & Confidential 12
Coefficient of Variation of Loss Ratio for Each Line by Country
Reported CVs are of gross loss ratios, except for Argentina, Australia, Bolivia, Chile, Ecuador, India, Malaysia, Singapore, Thailand, Uruguay and Venezuela, which are of net loss ratios.
Accident & Health is defined differently in each country; it may include pure accident A&H coverage, credit A&H, and individual or group A&H. In the U.S., A&H makes up about 80 percent of the “Other”
line of business with the balance of the line being primarily credit insurance.
Property volatility statistics include catastrophe losses.

Section 2: U.S. Reserve Adequacy and Risk

Aon Benfield | Analytics
Proprietary & Confidential 14
U.S. P&C Industry Reserve Development (2002 – 2013)
2013 development per P&C Industry data as compiled by SNL through May 6, 2014
Total favorable development in 2013 of USD14.8 Billion
*Adjustments include Financial Lines development in 2008-2009 and AIG adverse development in 2010.
(22.3)
(14.1)
(10.5)
(0.6)
7.0 8.3
14.5
18.515.7
12.7 12.2 14.8
(25.0)
(20.0)
(15.0)
(10.0)
(5.0)
-
5.0
10.0
15.0
20.0
25.0
2002 2003 2004 2005 2006 2007 2008 2009 2010 2011 2012 2013
Calendar Year
One Year Reserve Development ($B)
Adjusted *
Aon Benfield | Analytics
Proprietary & Confidential 15
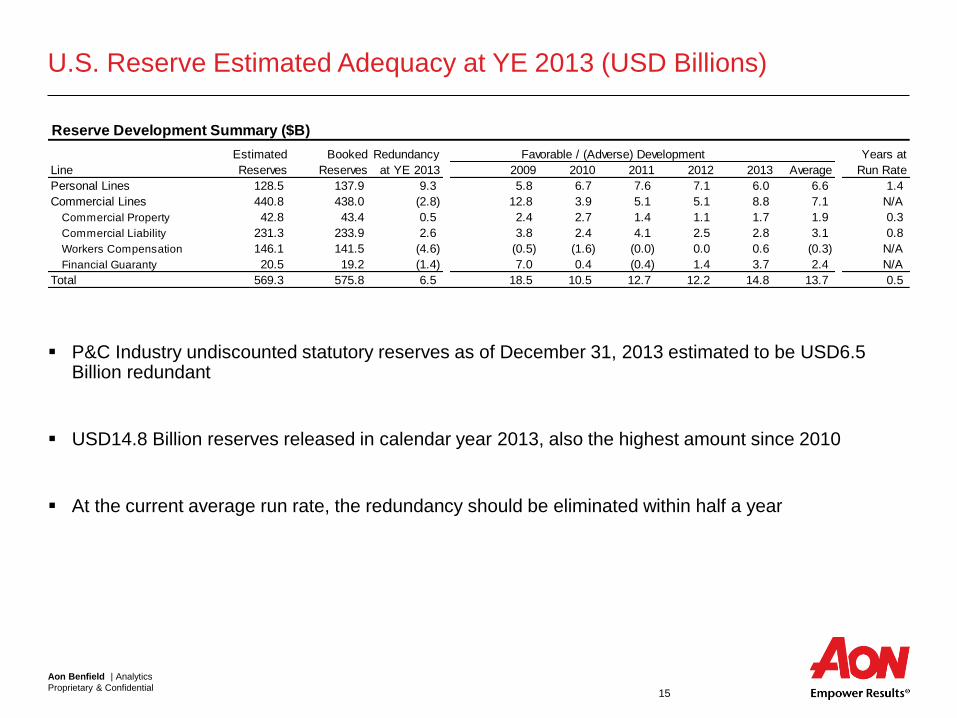
U.S. Reserve Estimated Adequacy at YE 2013 (USD Billions)
P&C Industry undiscounted statutory reserves as of December 31, 2013 estimated to be USD6.5 Billion redundant
USD14.8 Billion reserves released in calendar year 2013, also the highest amount since 2010
At the current average run rate, the redundancy should be eliminated within half a year
Reserve Development Summary ($B)
Estimated BookedEst. Redundancy Favorable / (Adverse) Development Years at
Line Reserves Reserves at YE 2013 2009 2010 2011 2012 2013 Average Run Rate
Personal Lines 128.5 137.9 9.3 5.8 6.7 7.6 7.1 6.0 6.6 1.4
Commercial Lines 440.8 438.0 (2.8) 12.8 3.9 5.1 5.1 8.8 7.1 N/A
Commercial Property 42.8 43.4 0.5 2.4 2.7 1.4 1.1 1.7 1.9 0.3
Commercial Liability 231.3 233.9 2.6 3.8 2.4 4.1 2.5 2.8 3.1 0.8
Workers Compensation 146.1 141.5 (4.6) (0.5) (1.6) (0.0) 0.0 0.6 (0.3) N/A
Financial Guaranty 20.5 19.2 (1.4) 7.0 0.4 (0.4) 1.4 3.7 2.4 N/A
Total 569.3 575.8 6.5 18.5 10.5 12.7 12.2 14.8 13.7 0.5

Aon Benfield | Analytics
Proprietary & Confidential 16
Drivers of 2013 Reserve Adequacy Deterioration All Lines
The total amount of industry reserve redundancy declined USD2.7B during 2013
Waterfall exhibit shows that the decline is driven by:
– Large amount of reserves released during 2013 of USD14.8B, offset by
– Favorable loss emergence from prior years worth USD11.9B
Most of the reserve cushion of USD6.5B at YE2013 has already been released as of Q1 2014, with
USD5.4B in reserve releases
+9.2
+6.5
(14.8)
+11.9 +0.2
-10
-5
0
5
10
15
YE2012Reserve
Redundancy
ReservesRelease During
2013
Prior YearFavorable Loss
Emergence
Accident Year2013
Redundancy
YE2013Reserve
Redundancy
Drivers of 2013 Reserve Adequacy DeteriorationAll Lines ($B)
Aon Benfield | Analytics
Proprietary & Confidential 17
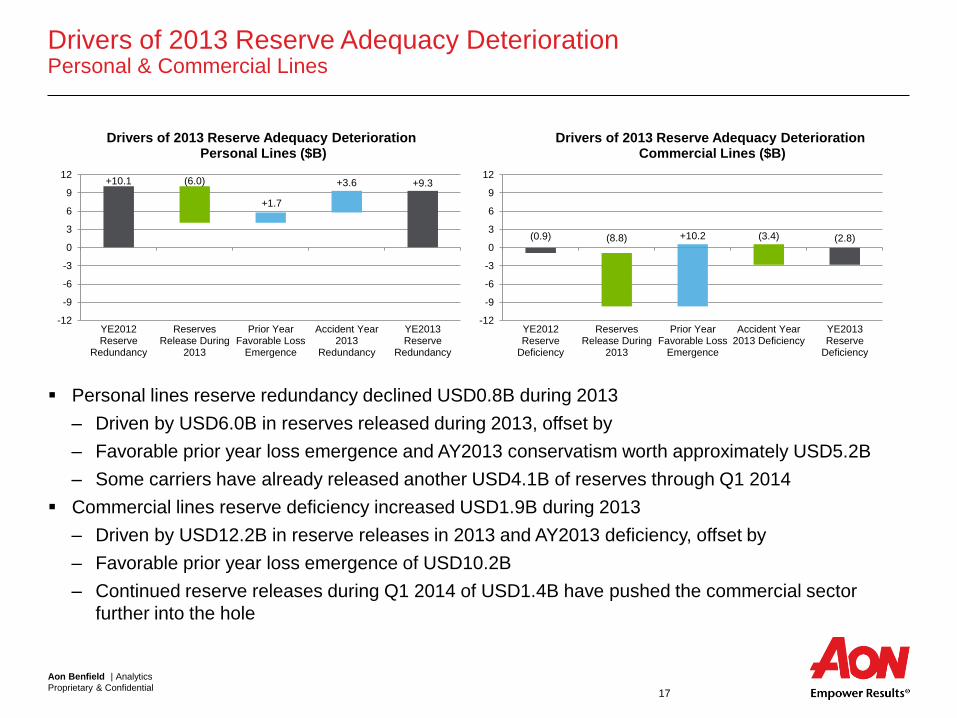
Drivers of 2013 Reserve Adequacy Deterioration Personal & Commercial Lines
Personal lines reserve redundancy declined USD0.8B during 2013
– Driven by USD6.0B in reserves released during 2013, offset by
– Favorable prior year loss emergence and AY2013 conservatism worth approximately USD5.2B
– Some carriers have already released another USD4.1B of reserves through Q1 2014
Commercial lines reserve deficiency increased USD1.9B during 2013
– Driven by USD12.2B in reserve releases in 2013 and AY2013 deficiency, offset by
– Favorable prior year loss emergence of USD10.2B
– Continued reserve releases during Q1 2014 of USD1.4B have pushed the commercial sector
further into the hole
+10.1 +9.3(6.0)
+1.7
+3.6
-12
-9
-6
-3
0
3
6
9
12
YE2012Reserve
Redundancy
ReservesRelease During
2013
Prior YearFavorable Loss
Emergence
Accident Year2013
Redundancy
YE2013Reserve
Redundancy
Drivers of 2013 Reserve Adequacy Deterioration Personal Lines ($B)
(0.9) (2.8)(8.8) +10.2 (3.4)
-12
-9
-6
-3
0
3
6
9
12
YE2012Reserve
Deficiency
ReservesRelease During
2013
Prior YearFavorable Loss
Emergence
Accident Year2013 Deficiency
YE2013Reserve
Deficiency
Drivers of 2013 Reserve Adequacy Deterioration Commercial Lines ($B)
Aon Benfield | Analytics
Proprietary & Confidential 18
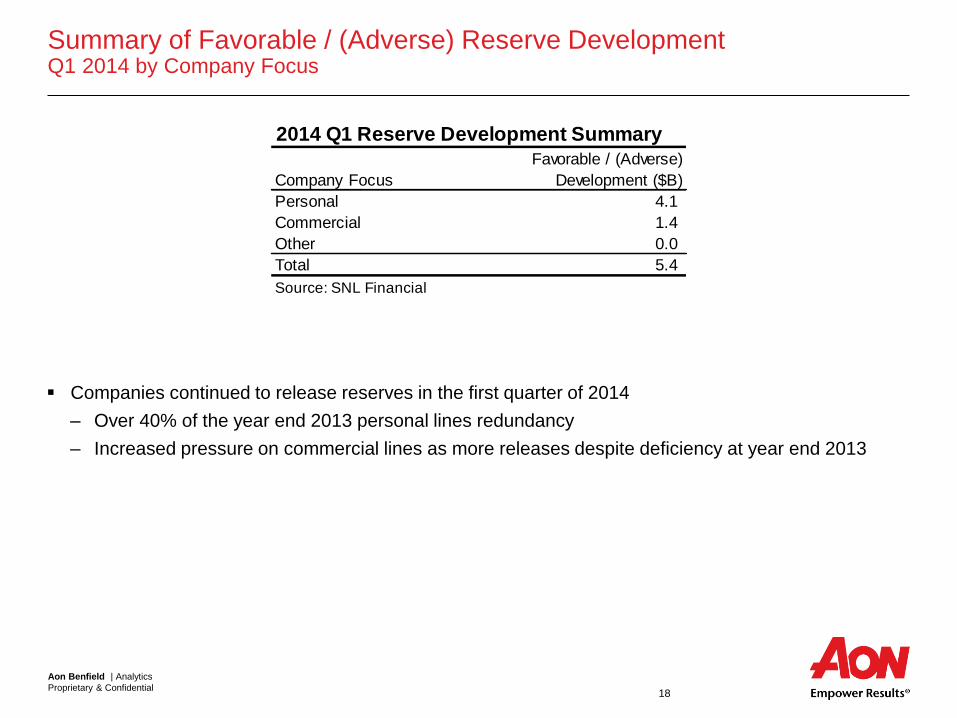
Summary of Favorable / (Adverse) Reserve Development Q1 2014 by Company Focus
Companies continued to release reserves in the first quarter of 2014
– Over 40% of the year end 2013 personal lines redundancy
– Increased pressure on commercial lines as more releases despite deficiency at year end 2013
2014 Q1 Reserve Development Summary
Company Focus
Favorable / (Adverse)
Development ($B)
Personal 4.1
Commercial 1.4
Other 0.0
Total 5.4
Source: SNL Financial

Aon Benfield | Analytics
Proprietary & Confidential 19
U.S. Reserve Volatility By Line, By Carried Reserve Size
U.S. Reserve Volatility by Line, by Reserve Size
One Year Reserve CV Ultimate Reserve CV
Line
Small
$10M - $100M
Medium
$100M - $500M
Large
> $500M
Small
$10M - $100M
Medium
$100M - $500M
Large
> $500M
All Lines 11.1% 8.4% 5.8% 13.8% 10.6% 7.4%
Homeow ners 16.7% 12.6% 10.0% 19.2% 14.4% 11.0%
Private Passenger Auto 8.9% 6.5% 3.0% 11.2% 7.7% 3.5%
Commercial Auto 12.5% 6.8% 4.4% 16.0% 9.0% 5.9%
Commercial Multi Peril 12.5% 10.6% 6.7% 16.4% 14.4% 8.5%
Workers Compensation 7.3% 5.3% 2.4% 9.7% 7.1% 3.7%
Medical PL - CM 17.8% 13.0% 7.6% 21.2% 15.8% 9.8%
Other Liability - CM 14.3% 15.1% 11.3% 17.2% 18.6% 14.1%
Other Liability - Occ 15.2% 11.9% 5.9% 19.0% 14.9% 8.8%
Products Liability - Occ 18.0% 12.7% 4.3% 23.5% 19.5% 11.0%
Ultimate reserve CV calculated using average of Mack and ODP Bootstrap methods applied to paid loss triangles by line. One-year reserve CV uses
average of the Merz-Wuthrich and ODP Bootstrap methods. All methods adjusted to account for tail factor volatility and reserves more than 10 years
old.

Section 3: Global Correlation Between Lines
Aon Benfield | Analytics
Proprietary & Confidential 21
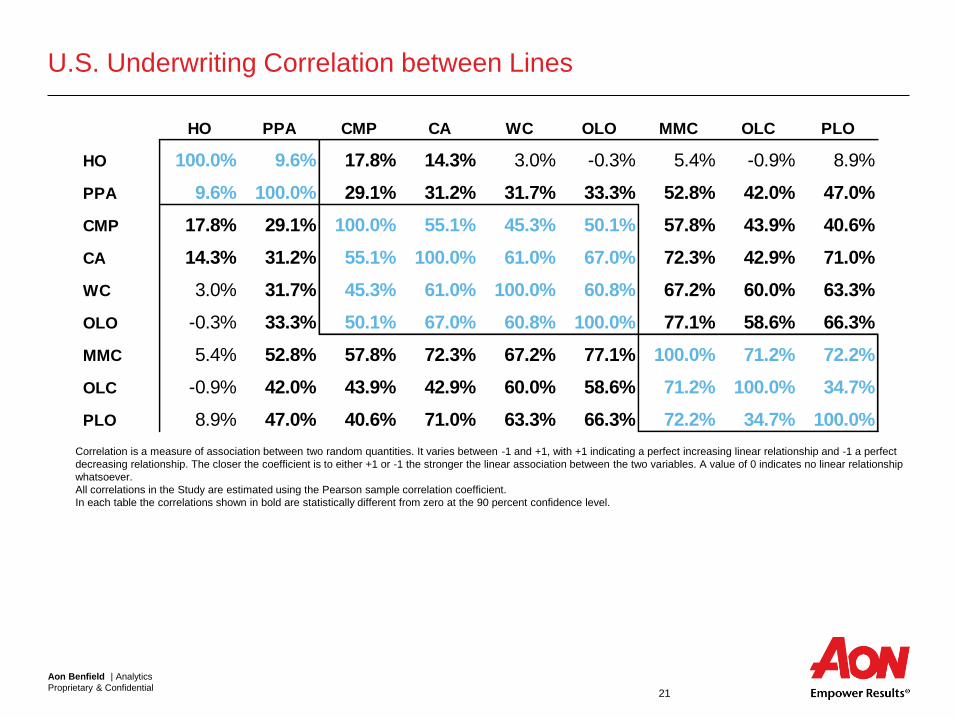
U.S. Underwriting Correlation between Lines
HO PPA CMP CA WC OLO MMC OLC PLO
HO 100.0% 9.6% 17.8% 14.3% 3.0% -0.3% 5.4% -0.9% 8.9%
PPA 9.6% 100.0% 29.1% 31.2% 31.7% 33.3% 52.8% 42.0% 47.0%
CMP 17.8% 29.1% 100.0% 55.1% 45.3% 50.1% 57.8% 43.9% 40.6%
CA 14.3% 31.2% 55.1% 100.0% 61.0% 67.0% 72.3% 42.9% 71.0%
WC 3.0% 31.7% 45.3% 61.0% 100.0% 60.8% 67.2% 60.0% 63.3%
OLO -0.3% 33.3% 50.1% 67.0% 60.8% 100.0% 77.1% 58.6% 66.3%
MMC 5.4% 52.8% 57.8% 72.3% 67.2% 77.1% 100.0% 71.2% 72.2%
OLC -0.9% 42.0% 43.9% 42.9% 60.0% 58.6% 71.2% 100.0% 34.7%
PLO 8.9% 47.0% 40.6% 71.0% 63.3% 66.3% 72.2% 34.7% 100.0%
Correlation is a measure of association between two random quantities. It varies between -1 and +1, with +1 indicating a perfect increasing linear relationship and -1 a perfect
decreasing relationship. The closer the coefficient is to either +1 or -1 the stronger the linear association between the two variables. A value of 0 indicates no linear relationship
whatsoever.
All correlations in the Study are estimated using the Pearson sample correlation coefficient.
In each table the correlations shown in bold are statistically different from zero at the 90 percent confidence level.

Aon Benfield | Analytics
Proprietary & Confidential 22
Volatility and Correlation Link to Volume
Volatility decreases as volume
grows, as impact of process
risk diversifies away, leaving
systemic/parameter risk
Correlation between segments
increases as volume grows, as
impact of process risk diversifies
away
Segment Volume
Volatility
Correlation
Aon Benfield | Analytics
Proprietary & Confidential 23
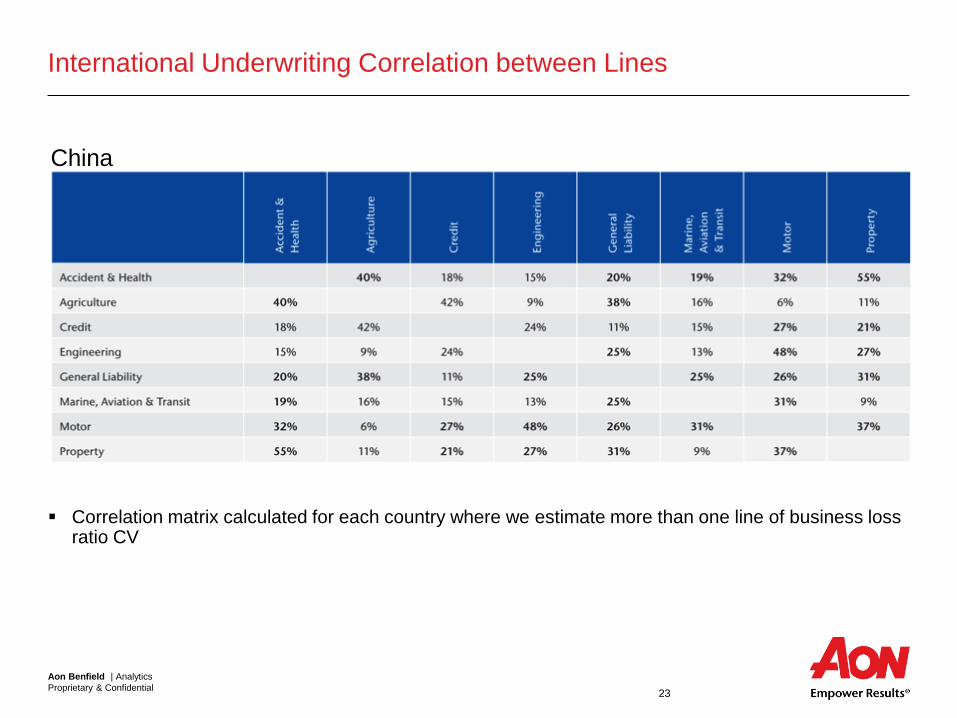
International Underwriting Correlation between Lines
Correlation matrix calculated for each country where we estimate more than one line of business loss ratio CV
China

Section 4: Macroeconomic Correlation

Aon Benfield | Analytics
Proprietary & Confidential 25
U.S. Macroeconomic Correlation
Aon Benfield | Analytics
Proprietary & Confidential 26
U.S. Macroeconomic Correlation Highlights
CPI and PPI highly correlated, but not strong with other factors
GDP growth shows strong negative correlation with changes in unemployment
Treasury yields and corporate bond spreads are inversely related
VIX is sensitive to fear and directionally has the appropriate signs:
– Positive correlation with spreads and unemployment
– Negative correlation with GDP and equity returns

Section 5: Global Premium, Profitability and Opportunities
Aon Benfield | Analytics
Proprietary & Confidential 28
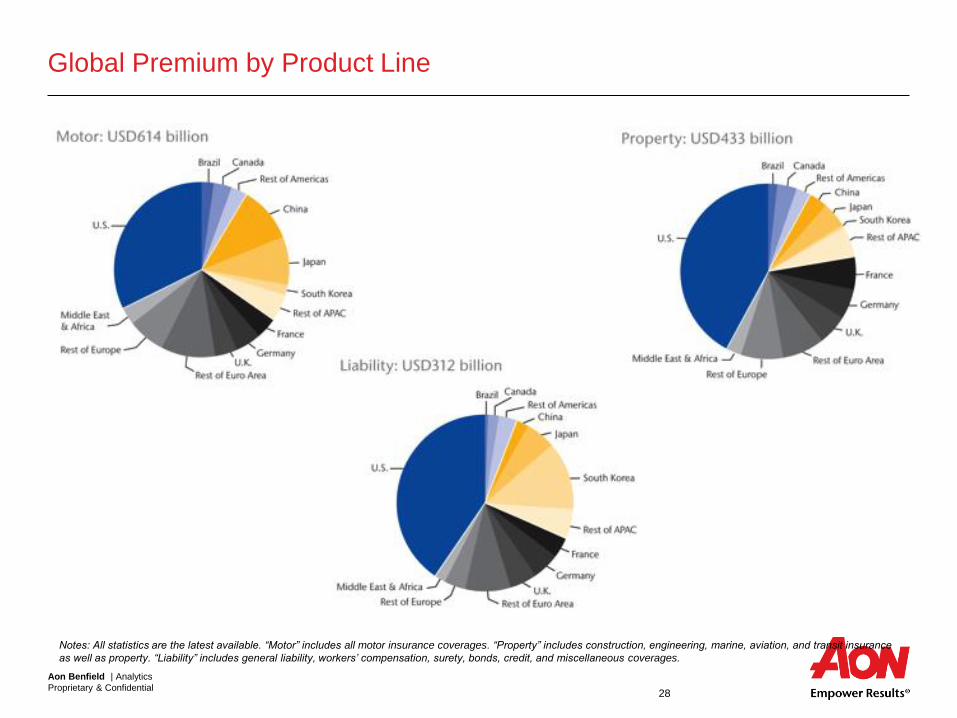
Global Premium by Product Line
Notes: All statistics are the latest available. “Motor” includes all motor insurance coverages. “Property” includes construction, engineering, marine, aviation, and transit insurance
as well as property. “Liability” includes general liability, workers’ compensation, surety, bonds, credit, and miscellaneous coverages.

Aon Benfield | Analytics
Proprietary & Confidential 29
Top 50 P&C Markets by Gross Written Premium
Aon Benfield | Analytics
Proprietary & Confidential 30
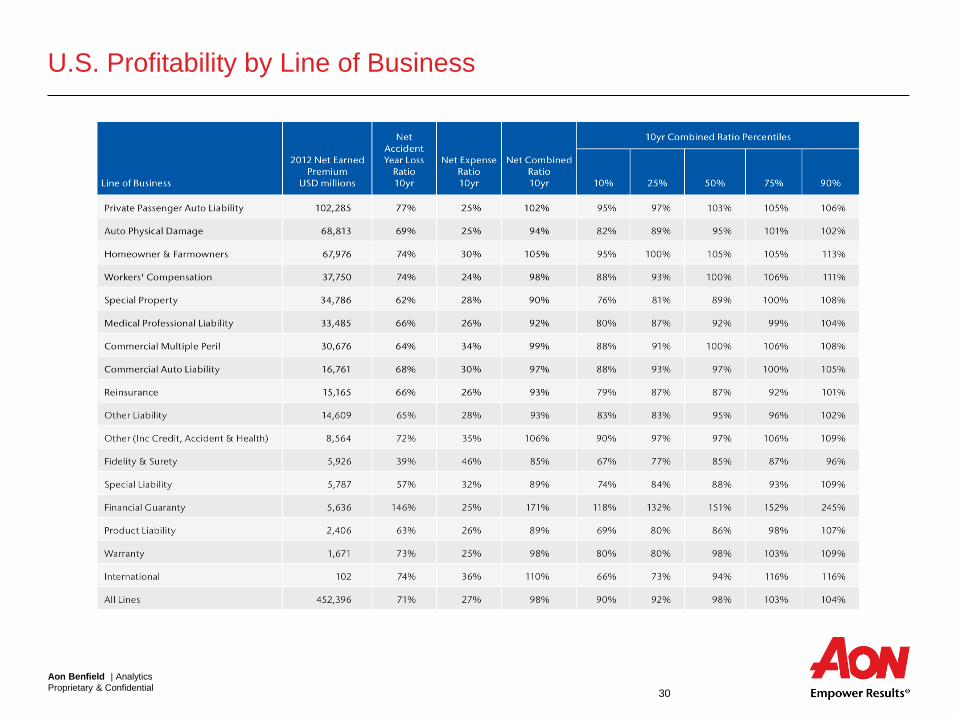
U.S. Profitability by Line of Business
Aon Benfield | Analytics
Proprietary & Confidential 31
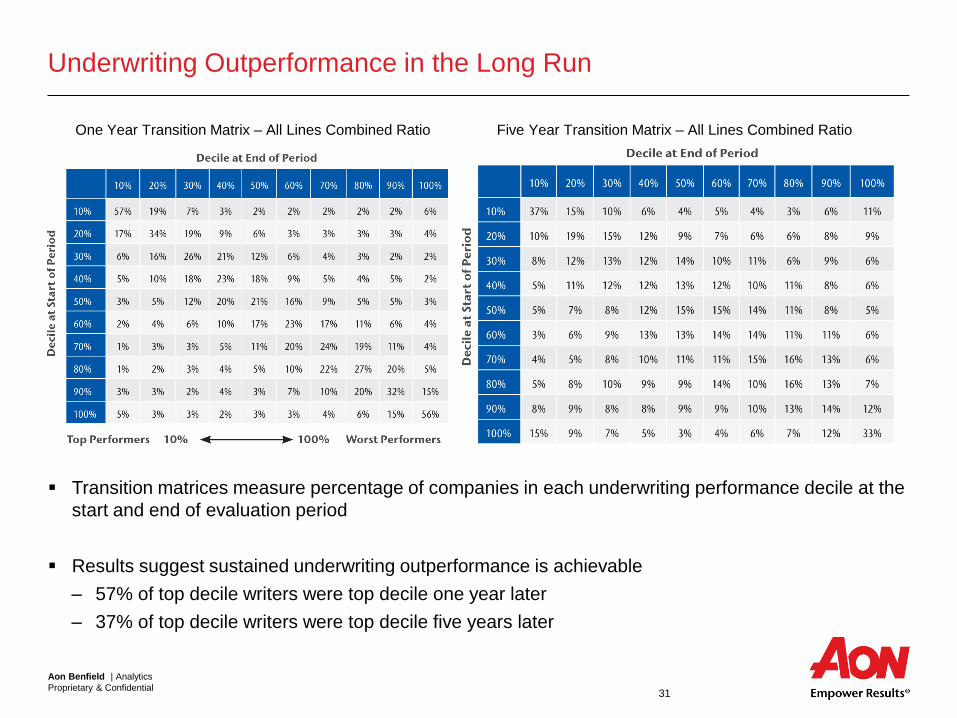
Underwriting Outperformance in the Long Run
One Year Transition Matrix – All Lines Combined Ratio Five Year Transition Matrix – All Lines Combined Ratio
Transition matrices measure percentage of companies in each underwriting performance decile at the
start and end of evaluation period
Results suggest sustained underwriting outperformance is achievable
– 57% of top decile writers were top decile one year later
– 37% of top decile writers were top decile five years later

Aon Benfield | Analytics
Proprietary & Confidential 32
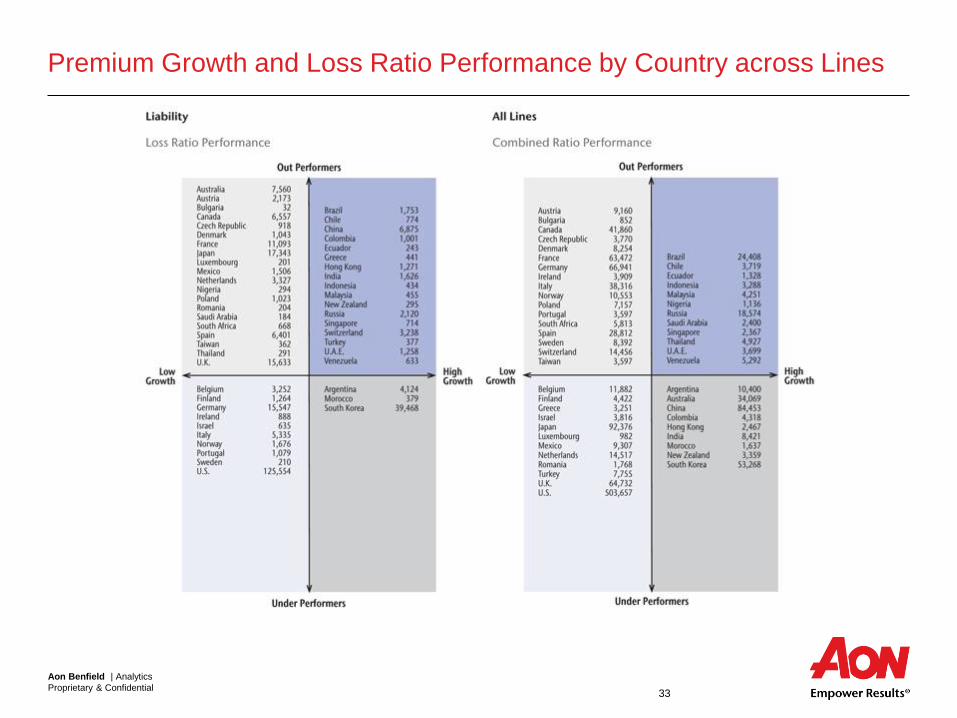
Premium Growth and Loss Ratio Performance by Country across Lines
Aon Benfield | Analytics
Proprietary & Confidential 33
Premium Growth and Loss Ratio Performance by Country across Lines

Aon Benfield | Analytics
Proprietary & Confidential 34
Aon Benfield Country Opportunity Index

Aon Benfield | Analytics
Proprietary & Confidential 35
Contender Geography Growth, Profitability and Volatility

Aon Benfield | Analytics
Proprietary & Confidential 36
Contender Geography Demographics

Aon Benfield | Analytics
Proprietary & Confidential 37
Contender Geography Credit Rating and Risk Perspectives
Aon Benfield | Analytics
Proprietary & Confidential 38
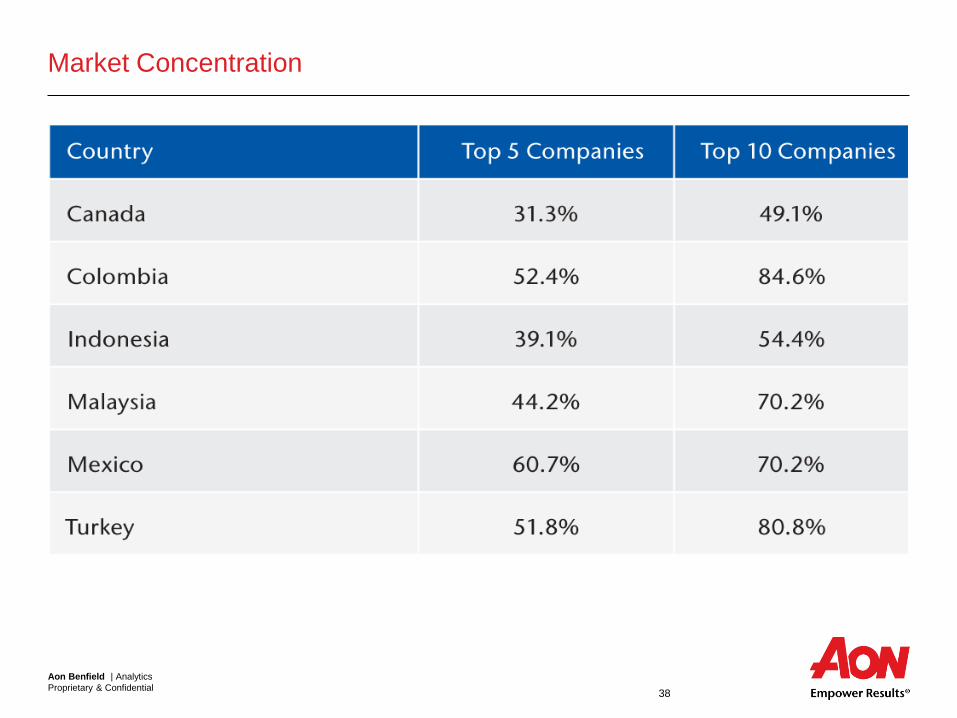
Market Concentration

Section 6: Extending Insurance-Linked Securities
Aon Benfield | Analytics
Proprietary & Confidential 40
Characteristics of Property Cat Risk
Natural Demand Property values and demographics have driven huge concentrations in the industry relative to even today’s very adequate capital levels, which in turn drives a natural demand for risk transfer products.
Loss Modeling The development of computer models for natural catastrophes, on-going since the late 1980’s, has created a generally accepted “currency” to value the loss potential a given risk portfolio. Modeling has been successful in part because natural catastrophe events are driven by laws of nature and are not social science phenomenon with changing, reflexive and reactive parameters and causes.
Loss Triggers Modeling, and the physical drivers of loss, also allows for a range of non-indemnity loss triggers.
Rating Agency Capital Rating agency capital models have separated out catastrophe risk and assigned a clearly defined capital charge specifically to cover it, unencumbered by complications of diversification benefits and other technicalities. The rating agency credit is often as much, or greater than, a company’s own economic capital model credit.
Credit Risk Purchasers of traditional covers are always concerned with the credit risk of the product they purchase, especially for top layers, as well as the historical volatility in pricing and availability. As a result, they are open to alternative solutions and find fully collateralized ILS structures very attractive.

Aon Benfield | Analytics
Proprietary & Confidential 41
Characteristics of Property Cat Risk, ctd.
Default Profile The loss profile of high layer catastrophe programs mirrors bond default profiles very closely: there is a low probability of a loss, but given a loss a reasonably high probability of a total loss, producing a loss profile familiar to fixed income investors.
Equity Tranche As a result of the loss profile, there is no need for an equity tranche in a cat bond. Equity tranches are a big complication in many (non-insurance) securitizations because they create a Variable Interest Entity (VIE) residual interest that generally remains on the balance sheet of the issuer.
Uncorrelated Returns The loss profile of cat bonds is manifestly uncorrelated with other asset classes, at least a priori. Investors saw the attractiveness of the ILS asset class during the financial crisis (collateral trust problems notwithstanding, but these problems have now been solved).
Quick Emergence Major property catastrophe risk events are headline news; the fact of a loss or potential loss emerges very quickly, indeed instantaneously for earthquakes.
Quick Loss Settlement Losses from property catastrophe events generally reach their final settlement valuation in a matter of months. There are very few issues with late reported claims or slow loss development.

Aon Benfield | Analytics
Proprietary & Confidential 42
Lines Potentially Suitable for Non-Cat Securitizations
Characteristic
Property
Risk
Workers
Comp
Commercial
Auto
Medical
PL Vanilla GL D&O Aviation
General Comments
Poor to
moderate data
Large losses
Data rich
Detailed rating
Good
exposures
Same as WC
Extends
personal auto
Frequency
risk = tort
reform
Data rich
Detailed rating
Heterogeneous
Data rich
Systemic?
Data rich
Already cat like
Natural Demand
(Reinsurance
purchased)
High limit
occurrence
Occ and
cat with
MOAL
Some occ Moderate
occ / agg
Little for low
limits
Little, unapp-
etizing product
Substantial; but
traditional is
cheap
Loss Modeling Evolving, no
standard
Predictive
models
Predictive
models
Good, but
tort risk
Predictive
models
Varies by
primary carrier
Very good;
AeroMetrica
Uncorrelated Returns / Terror / Terror ? / Terror
Quick Emergence Slow
Good:
claims
made
Moderate Good: claims
made Fast
Quick Loss Settlement
Slow, but
consistent;
BobCat
solution
Moderate
Slow
CWA vs
CWOP
Moderate Moderate Moderate
Aon Benfield | Analytics
Proprietary & Confidential 43
Contacts
Brian Alvers, FCAS, MAAA
Head of Actuarial - Americas
Aon Benfield Analytics
+1.312.381.5355


