© Fraunhofer Portugal
Instrumented Timed Up and Go:
Fall Risk Assessment based on Inertial Wearable
Sensors
Presented by:
Joana Silva([email protected])
MeMeA’16– May, 15-18 • Benevento, Italy
Joana Silva and Inês Sousa
© Fraunhofer Portugal
2
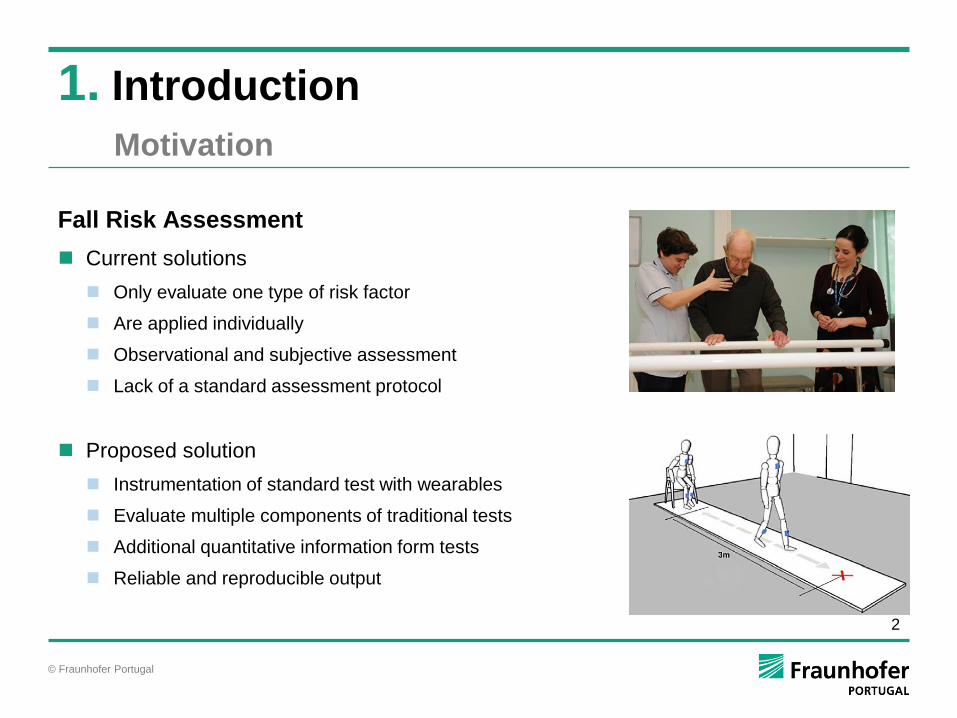
Fall Risk Assessment
Current solutions
Only evaluate one type of risk factor
Are applied individually
Observational and subjective assessment
Lack of a standard assessment protocol
Proposed solution
Instrumentation of standard test with wearables
Evaluate multiple components of traditional tests
Additional quantitative information form tests
Reliable and reproducible output
1. Introduction
Motivation
© Fraunhofer Portugal
3
Traditional Time-Up and Go Test
Total time to perform the test is recorded
Reported to be predictive of fall with 81% sensibility and 39% specificity
Instrumented Time-Up and Go Test
Analysis of each component of the test (stand, walk, turn, walk back and sit)
Salarian et al.
iTUG to access mobility in Parkinson patients with 7 IMU
Greene et al.
iTUG to extract temporal and angular velocity parameters with 2 inertial sensors
Purpose of this study
iTUG to extract meaningful features from smartphone built-in IMU
1. Introduction
Fall Risk Assessment
© Fraunhofer Portugal
4
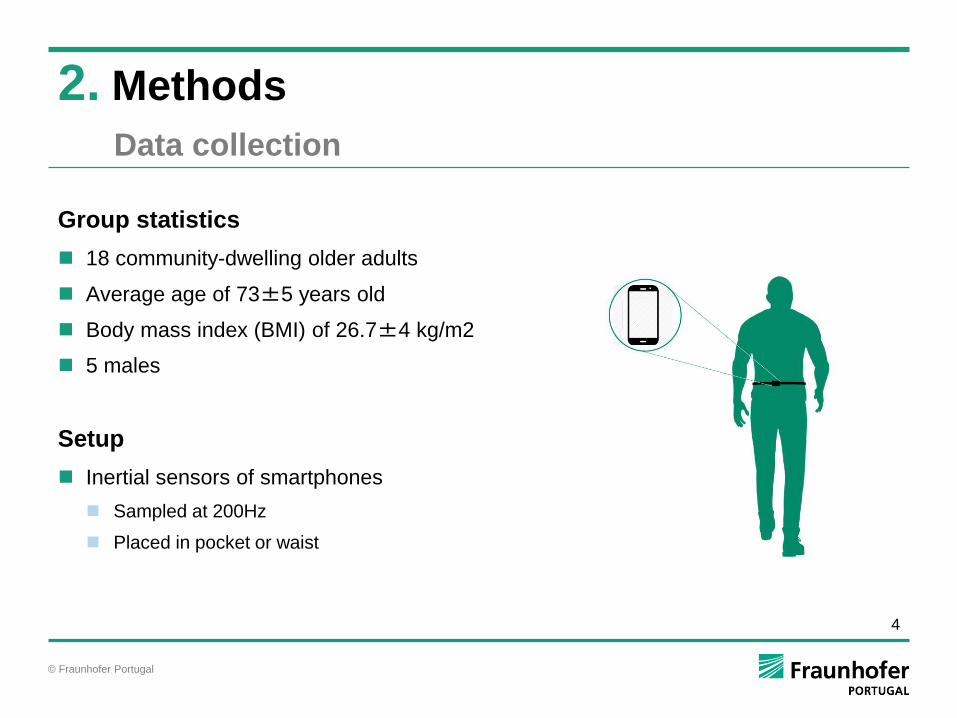
Group statistics
18 community-dwelling older adults
Average age of 73±5 years old
Body mass index (BMI) of 26.7±4 kg/m2
5 males
Setup
Inertial sensors of smartphones
Sampled at 200Hz
Placed in pocket or waist
2. Methods
Data collection
© Fraunhofer Portugal
5
Questionnaires
Iconographic Falls Efficacy Scale (FES) evaluates fear of falling in performing daily activities
Medical History questionnaire about chronic diseases, vision, audition, exercise profile
History of falls in the last 12 months
Functional Tests
Tinetti Performance Oriented Mobility Assessment (POMA) assess gait and balance abilities
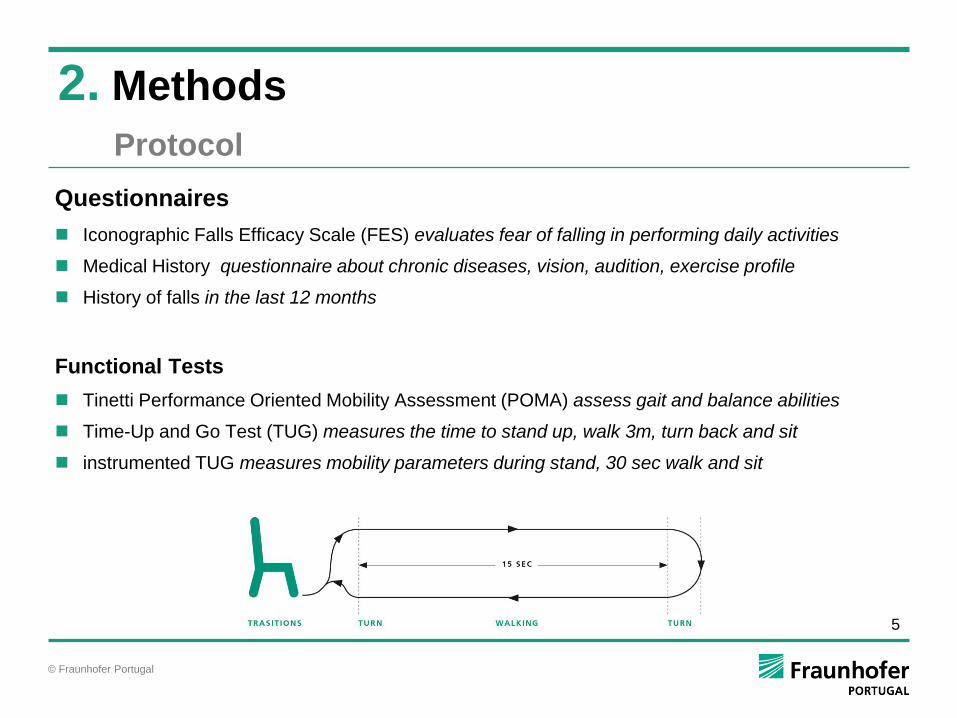
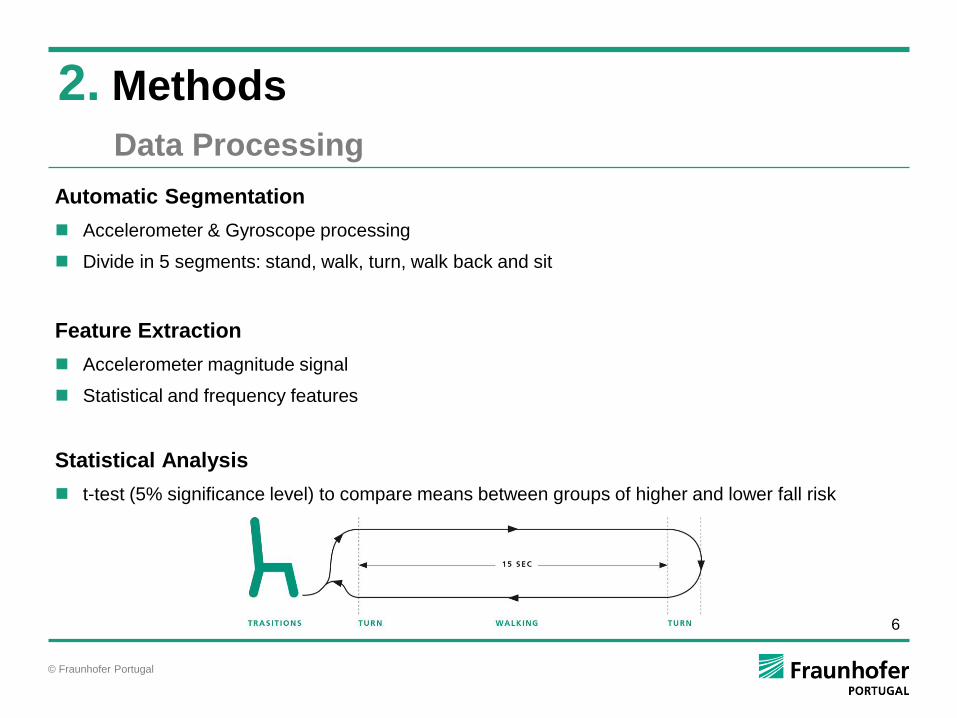
Time-Up and Go Test (TUG) measures the time to stand up, walk 3m, turn back and sit
instrumented TUG measures mobility parameters during stand, 30 sec walk and sit
2. Methods
Protocol
© Fraunhofer Portugal
6
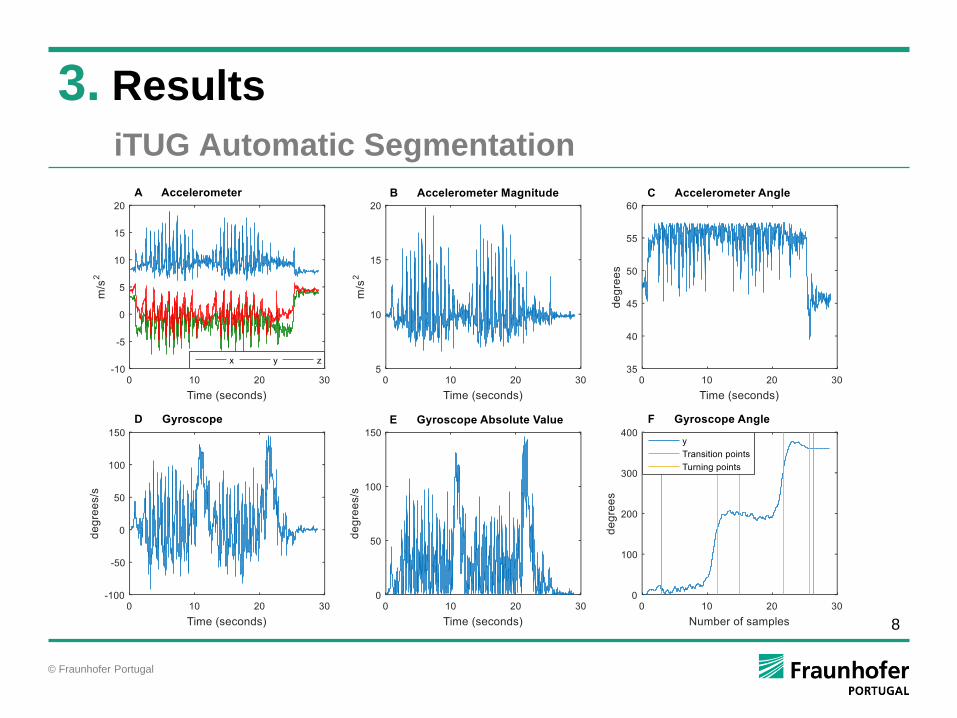
Automatic Segmentation
Accelerometer & Gyroscope processing
Divide in 5 segments: stand, walk, turn, walk back and sit
Feature Extraction
Accelerometer magnitude signal
Statistical and frequency features
Statistical Analysis
t-test (5% significance level) to compare means between groups of higher and lower fall risk
2. Methods
Data Processing
© Fraunhofer Portugal
7
3. Results
Standard Tests Results
ParticipantNumber of falls in
previous 12 months
Iconographic Tinetti
FESTinetti POMA
TUG time
(seconds)
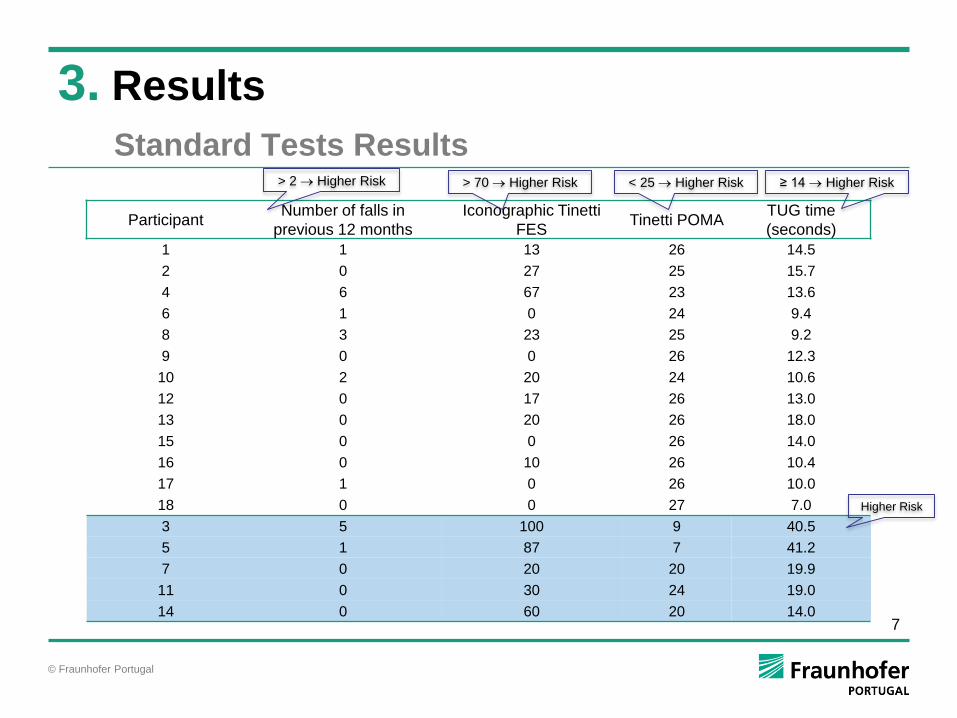
1 1 13 26 14.5
2 0 27 25 15.7
4 6 67 23 13.6
6 1 0 24 9.4
8 3 23 25 9.2
9 0 0 26 12.3
10 2 20 24 10.6
12 0 17 26 13.0
13 0 20 26 18.0
15 0 0 26 14.0
16 0 10 26 10.4
17 1 0 26 10.0
18 0 0 27 7.0
3 5 100 9 40.5
5 1 87 7 41.2
7 0 20 20 19.9
11 0 30 24 19.0
14 0 60 20 14.0
< 25 Higher Risk
Higher Risk
≥ 14 Higher Risk> 70 Higher Risk> 2 Higher Risk
© Fraunhofer Portugal
8
3. Results
iTUG Automatic Segmentation
© Fraunhofer Portugal
9
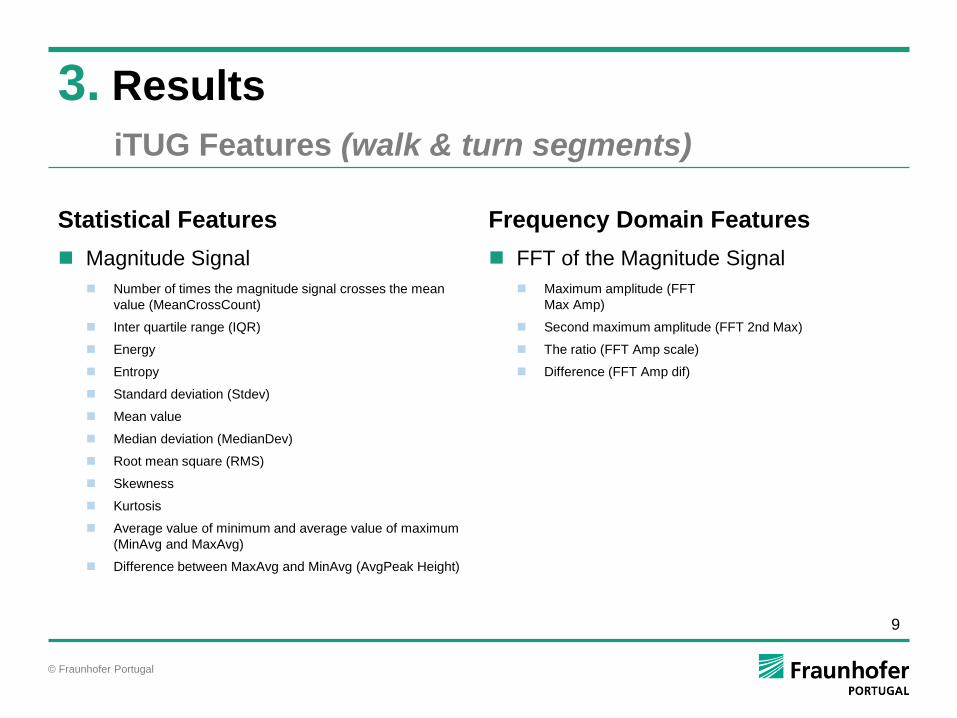
Statistical Features
Magnitude Signal
Number of times the magnitude signal crosses the mean
value (MeanCrossCount)
Inter quartile range (IQR)
Energy
Entropy
Standard deviation (Stdev)
Mean value
Median deviation (MedianDev)
Root mean square (RMS)
Skewness
Kurtosis
Average value of minimum and average value of maximum
(MinAvg and MaxAvg)
Difference between MaxAvg and MinAvg (AvgPeak Height)
Frequency Domain Features
FFT of the Magnitude Signal
Maximum amplitude (FFT
Max Amp)
Second maximum amplitude (FFT 2nd Max)
The ratio (FFT Amp scale)
Difference (FFT Amp dif)
3. Results
iTUG Features (walk & turn segments)
© Fraunhofer Portugal
10
3. Results
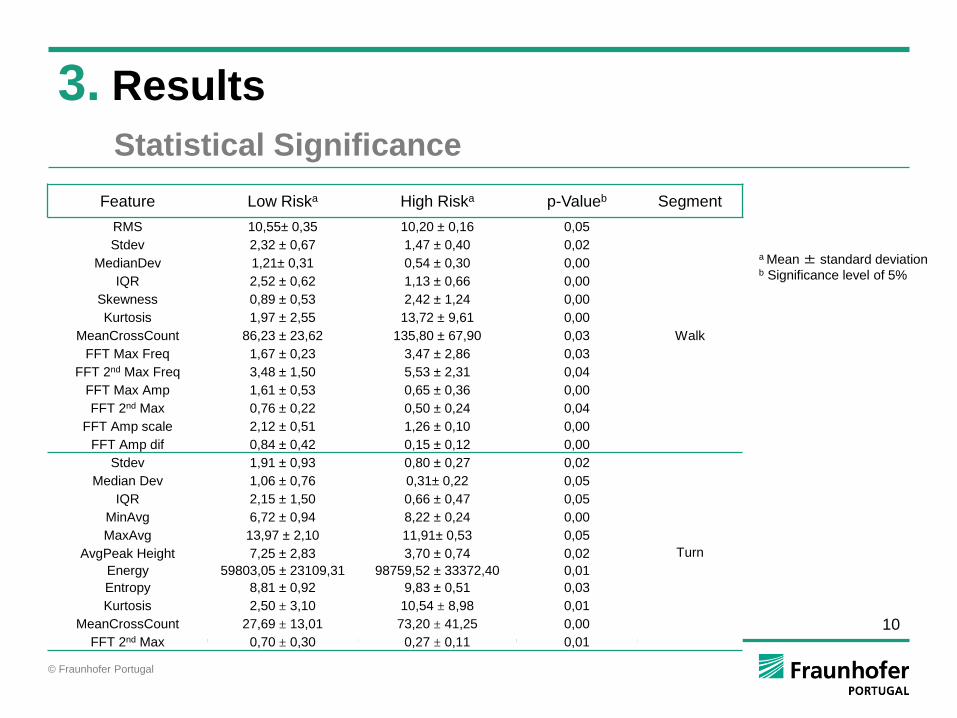
Feature Low Riska High Riska p-Valueb Segment
RMS 10,55± 0,35 10,20 ± 0,16 0,05
Walk
Stdev 2,32 ± 0,67 1,47 ± 0,40 0,02
MedianDev 1,21± 0,31 0,54 ± 0,30 0,00
IQR 2,52 ± 0,62 1,13 ± 0,66 0,00
Skewness 0,89 ± 0,53 2,42 ± 1,24 0,00
Kurtosis 1,97 ± 2,55 13,72 ± 9,61 0,00
MeanCrossCount 86,23 ± 23,62 135,80 ± 67,90 0,03
FFT Max Freq 1,67 ± 0,23 3,47 ± 2,86 0,03
FFT 2nd Max Freq 3,48 ± 1,50 5,53 ± 2,31 0,04
FFT Max Amp 1,61 ± 0,53 0,65 ± 0,36 0,00
FFT 2nd Max 0,76 ± 0,22 0,50 ± 0,24 0,04
FFT Amp scale 2,12 ± 0,51 1,26 ± 0,10 0,00
FFT Amp dif 0,84 ± 0,42 0,15 ± 0,12 0,00
Stdev 1,91 ± 0,93 0,80 ± 0,27 0,02
Turn
Median Dev 1,06 ± 0,76 0,31± 0,22 0,05
IQR 2,15 ± 1,50 0,66 ± 0,47 0,05
MinAvg 6,72 ± 0,94 8,22 ± 0,24 0,00
MaxAvg 13,97 ± 2,10 11,91± 0,53 0,05
AvgPeak Height 7,25 ± 2,83 3,70 ± 0,74 0,02
Energy 59803,05 ± 23109,31 98759,52 ± 33372,40 0,01
Entropy 8,81 ± 0,92 9,83 ± 0,51 0,03
Kurtosis 2,50 ± 3,10 10,54 ± 8,98 0,01
MeanCrossCount 27,69 ± 13,01 73,20 ± 41,25 0,00
FFT 2nd Max 0,70 ± 0,30 0,27 ± 0,11 0,01
a Mean ± standard deviation b Significance level of 5%
Statistical Significance
© Fraunhofer Portugal
11
The TUG test was instrumented with wearable inertial sensors.
Three phases of the TUG were automatically segmented (stand, walk and turn).
Statistical and frequency domain features were extracted for each segment.
Overall, features from the walking and turning phases present different groups of
high and low fall risk.
This study indicates that the iTUG is a viable tool for fall risk assessment, with
potential to be implemented in clinical or hospital environments.
The test is quick and the instrumentation is easy and do not require any specialized
technician to perform it.
4. Conlcusions
© Fraunhofer Portugal
12
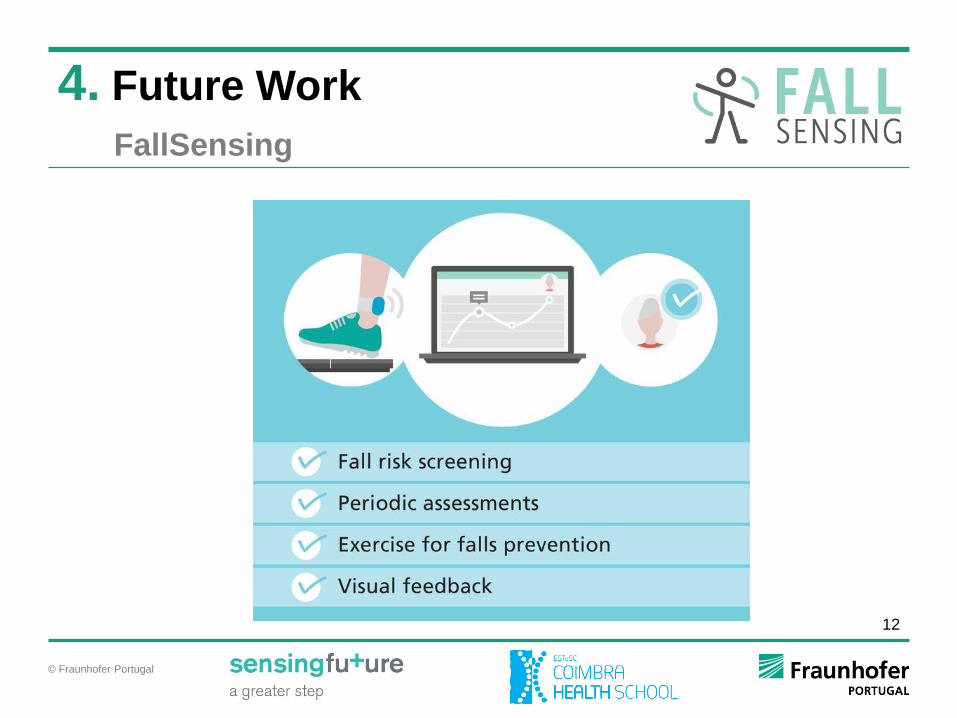
4. Future Work
FallSensing


