INSTITUTIONAL EQUITY RESEARCH
Page | 1 | PHILLIPCAPITAL INDIA RESEARCH
Engineers India (ENGR IN) Early beneficiary of an impending OMC refining up‐cycle INDIA | CAPITAL GOODS | Company Update
18 January 2016
Up‐cycle in India’s oil‐refining sector We believe India’s oil marketing companies (OMCs) are in a unique position to invest in new oil refineries because their business models are delinked from upstream (insulating their cash flows from the impact of a sharp decline in oil prices) and due to strong domestic demand for fuel (+10%YoY in FY16YTD). As a result, the three OMCs (HPCL, BPCL and IOCL) should add 80mmtpa of refining capacities over the next ten years, implying a 35% increase in India’s current refining capacity. Given the execution lead‐times of 5‐7/3‐5 years for greenfield/brownfield refineries, orders for EPC consulting packages should pick up pace in FY17‐18. India last saw such an up‐cycle in refining in 2000. Implementation of tighter emission norms presents a near‐term opportunity India has decided to adopt Bharat Stage (BS)‐6 emission norms for passenger and commercial vehicles by 2020. To adopt these norms, OMCs will have to spend (capex) ~Rs 290bn. Since the execution of a Hydrogen Treatment Unit (HTU) typically takes 36 months, orders for consultancy projects should begin in FY18. EIL will be an early‐cycle beneficiary; we see 21% CAGR in order inflows over FY16‐18 With its consultancy‐based business model, EIL will be an early beneficiary of a pickup in oil refining capex. Over the next five years, we expect a total opportunity of Rs 75bn because of capacity expansions by OMCs, coupled with investments in ancillary units and petrochemical facilities. Our FY16‐18 estimates incorporate 21% CAGR in EIL’s order inflows, implying that only 35% of the total Rs 75bn will be ordered in FY17‐18. An additional Rs 8‐10bn opportunity should accrue to EIL because of upgradations to BS‐6 norms, even though these orders will be back ended in FY18. We are confident that EIL will have a higher strike rate in orders due to its near monopolistic market share amongst OMCs. Increased volumes to drive a 520bps margin expansion; 14% CAGR in earnings Despite a modest revenue CAGR of 9% over FY16‐18, EIL’s EBITDA margins should expand 520bps because of a strong 18% CAGR in its high‐margin consultancy segment revenues (69% of total revenues). Increased capacity utilization should be the primary driver of margins; this, coupled with the benefit of a potential write‐back of Rs 400mn for its turnkey segment, should lead to 30%/14% EBITDA/PAT CAGRs. PE rerating strongly linked to order inflows EIL’s stock price is very sensitive to order inflows (seen in FY08, FY11, FY15; chart on page 8). Its long‐term average, ex‐cash, one‐year forward PE is 20x, while it rerates to 1+SD (32x) in years that have high order inflows. The stock currently trades at ex‐cash PERs of 30x/24x on our FY17/18 estimates. Upgrade to Buy with a revised target price of Rs 246 While EIL’s stock price has risen 11% in the last three months, we see scope for further rerating because of increased visibility due to the imminent oil‐refining order up‐cycle, leading to a 21% CAGR in order inflows in FY16‐18 coupled with 520bps margin expansion. We arrive at our revised target price of Rs 246 (Rs 185 earlier) by ascribing a 30x PE to our core (ex‐cash) September 2017 earnings (average FY17/18) and adding a cash value of Rs 71/share. Our target multiple is at a slight discount to the stock’s 1+SD. Near term risks persists In the near term, we expect a downgrade in consensus estimates. Our FY17 earnings are 25% below street estimates mainly because of lower other income.
Buy (Upgrade) CMP RS 210 TARGET RS 246 (+17%) COMPANY DATA O/S SHARES (MN) : 337MARKET CAP (RSBN) : 76MARKET CAP (USDBN) : 1.1352 ‐ WK HI/LO (RS) : 252 / 157LIQUIDITY 3M (USDMN) : 4.1PAR VALUE (RS) : 5 SHARE HOLDING PATTERN, % Sep 15 Jun 15 Mar 15PROMOTERS : 69.4 69.4 69.4FII / NRI : 7.0 7.9 9.0FI / MF : 13.1 12.5 11.0NON PRO : 1.2 1.3 1.3PUBLIC & OTHERS : 9.8 9.6 9.9 PRICE PERFORMANCE, %
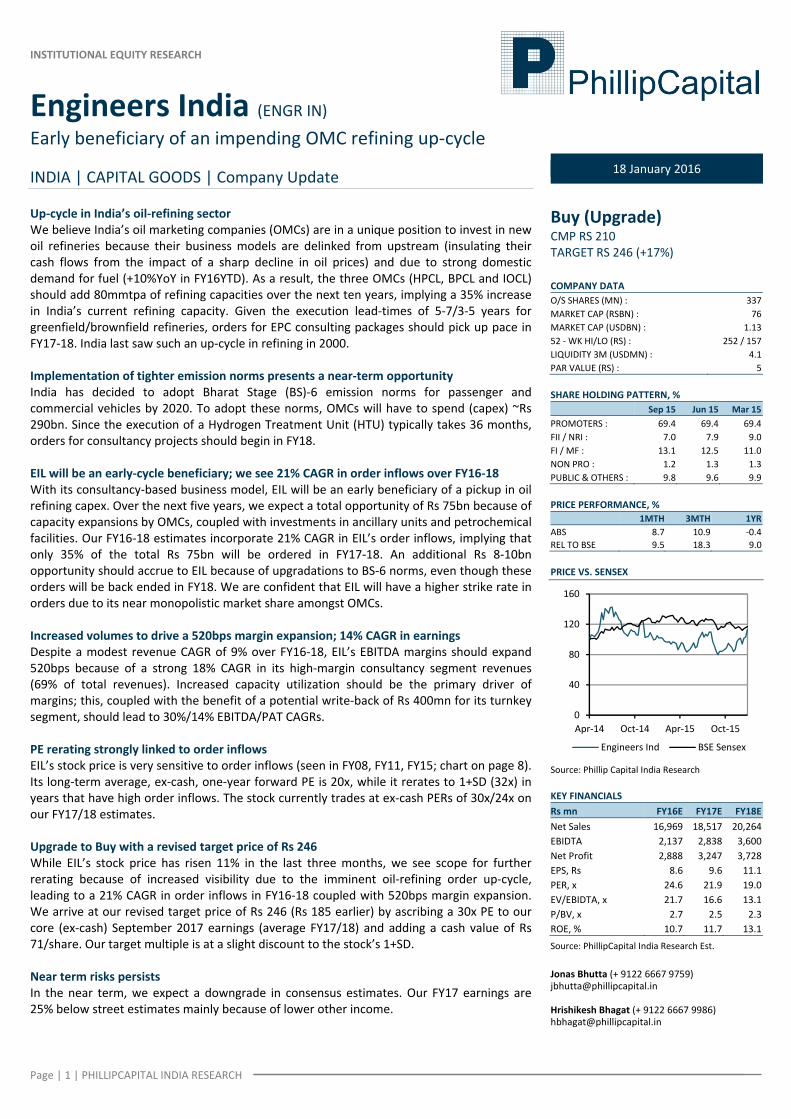
1MTH 3MTH 1YRABS 8.7 10.9 ‐0.4REL TO BSE 9.5 18.3 9.0 PRICE VS. SENSEX
Source: Phillip Capital India Research KEY FINANCIALS Rs mn FY16E FY17E FY18ENet Sales 16,969 18,517 20,264EBIDTA 2,137 2,838 3,600Net Profit 2,888 3,247 3,728EPS, Rs 8.6 9.6 11.1 PER, x 24.6 21.9 19.0 EV/EBIDTA, x 21.7 16.6 13.1 P/BV, x 2.7 2.5 2.3 ROE, % 10.7 11.7 13.1
Source: PhillipCapital India Research Est. Jonas Bhutta (+ 9122 6667 9759) [email protected] Hrishikesh Bhagat (+ 9122 6667 9986) [email protected]
0
40
80
120
160
Apr‐14 Oct‐14 Apr‐15 Oct‐15
Engineers Ind BSE Sensex

Page | 2 | PHILLIPCAPITAL INDIA RESEARCH
ENGINEERS INDIA COMPANY UPDATE
Focus charts and tables OMC's 2025 capacity addition plans…
Incremental capacity add by
2025 (mmtpa) Capex (Rsbn)HPCL 21 586BPCL 23 640IOCL 36 845Total 80 2,071
Source: PhillipCapital Research, Company, Media articles
...and capex by oil refineries to upgrade to BS VI… Expected capex by Oil refineries to upgrade to BS VI compliant fuel Rs bnIOC 120HPCL 40BPCL 50MRPL 45CPCL 10NRL 25Total 290
...will lead to a 21%CAGR in EIL’s FY16‐18 order inflows... …and +520bps EBITDA margins on higher capacity utilisation
Source: PhillipCapital Research, Company, Media articles EIL’s PE has expanded when order inflows were high… … and stock rerates to valuation of 1+SD
Source: PhillipCapital India Research, Bloomberg, Company, Media articles
0
5
10
15
20
25
30
35
40
45
FY07
FY08
FY09
FY10
FY11
FY12
FY13
FY14
FY15
FY16e
FY17e
FY18e
Order inflo
w (R
sbn) 21% CAGR 23.5%
26.5%
13.7%12.6%
15.3%
17.8%
10%
15%
20%
25%
30%
FY13 FY14 FY15 FY16e FY17e FY18e
0
5
10
15
20
25
30
35
40
0
10000
20000
30000
40000
50000
Apr‐06
Oct‐06
Apr‐07
Oct‐07
Apr‐08
Oct‐08
Apr‐09
Oct‐09
Apr‐10
Oct‐10
Apr‐11
Oct‐11
Apr‐12
Oct‐12
Apr‐13
Oct‐13
Apr‐14
Oct‐14
Apr‐15
Oct‐15
PE (x)
Order in
flow (R
smn)
Order Inflow PE (rhs)
AVG.
SD +1
SD ‐10
10
20
30
40
50
60
70
Apr‐02
Apr‐03
Apr‐04
Apr‐05
Apr‐06
Apr‐07
Apr‐08
Apr‐09
Apr‐10
Apr‐11
Apr‐12
Apr‐13
Apr‐14
Apr‐15
P/E (x)

Page | 3 | PHILLIPCAPITAL INDIA RESEARCH
ENGINEERS INDIA COMPANY UPDATE
India to see robust additions in new oil refining capacities Indian OMC’s expansion plans not linked to decline in oil prices Despite the sharp decline in oil prices in the past 18 months, Indian OMC’s will continue to invest in expansion of refining capacities based on robust domestic demand for fuels and because their business models are delinked from upstream operations. FY16 YTD domestic demand for Indian petroleum products is up 10% mmt FY13 FY14 FY15 8MFY15 8MFY16LPG 15.6 16.3 18.0 11.6 12.5% Ch yoy 2% 4% 10% 8%Kerosene 7.5 7.2 7.1 4.7 4.6% Ch yoy ‐9% ‐4% ‐1% ‐4%Diesel 69.1 68.4 69.4 45.8 48.7% Ch yoy 7% ‐1% 2% 6%Petrol 15.7 17.1 19.1 12.5 14.3% Ch yoy 5% 9% 11% 15%Naphtha+NGL 12.3 11.3 11.1 7.1 8.7% Ch yoy 10% ‐8% ‐2% 22%ATF 5.3 5.5 5.7 3.8 4.0% Ch yoy ‐5% 4% 4% 7%LDO 0.4 0.4 0.4 0.2 0.3% Ch yoy ‐4% ‐3% ‐5% 14%Lubes/Grease 3.2 3.3 3.3 2.2 2.1% Ch yoy 21% 3% 0% ‐7%FO/LSHS 7.7 6.2 6.0 3.9 4.2% Ch yoy ‐18% ‐19% ‐4% 7%Bitumen 4.7 5.0 5.1 3.0 3.3% Ch yoy 1% 7% 1% 10%Petcoke 10.1 11.8 14.6 9.1 11.2% Ch yoy 65% 16% 24% 23%Others 5.5 6.0 5.9 4.0 4.4% Ch yoy 12% 8% ‐1% 10%Total 157 158 166 108 119% Ch yoy 6% 1% 4% 10%
Source: MoPNG The capacity addition plans of all OMCs will be bunched up We expect India’s three OMCs (HPCL, BPCL and IOCL) to add 80mmtpa of new refining capacity by 2025 – this will lead to a 35% growth in the country’s refining capacity over the next 10 years. Given execution lead times of 5‐7/3‐5 years for greenfield/brownfield expansions, orders for these projects should begin in FY17‐18. We expect OMCs to set up 80mmtpa of refining capacities by 2025
Source: PhillipCapital India Research, Company
230
80
310
0
50
100
150
200
250
300
350
FY15 FY15‐25 FY25

Page | 4 | PHILLIPCAPITAL INDIA RESEARCH
ENGINEERS INDIA COMPANY UPDATE
Company‐wise capacity addition plans; total opportunity of Rs 75bn for EIL
Capacity (mmtpa) Opportunity Commissioning From To Capex (Rsbn) for EIL (Rsbn) By
A) IOCL‐Refining capex Gujarat 13.7 18.0 108 2.7 CY20 Panipat 15.0 20.2 150 3.8 CY22 Mathura 8.0 11.0 75 1.9 CY20 Baruani 6.0 9.0 75 1.9 CY20 Haldia 7.5 8.0 13 0.3 CY20 Paradip 15.0 20.0 125 3.1 CY25 West Coast Greenfield 15.0 300 10.5 Planned Paradip Petcoke Gasification 150 3.8 Planned IOCL Total refining capex 65 101 995 27.9
B) IOCL Petchem capex Panipat Cracker 0.9 1.2 ‐ CY20 Paradip PPU 0.7 32 0.8 CY18 Paradip ethylene glycol 0.4 38 1.0 CY22 Paradip PX/PTA 90 2.3 CY22 IOCL Total Petchem capex 160 4.0
C) BPCL Refining capex Kochi Expansion 9.5 15.5 165 CY20
Numaligarh Expansion 3.0 9.0 180 9.0Env clearance pending
Bina Creeping Expansion 6.0 7.8 35 0.9 CY18 Bina Phase II 7.8 15.0 200 10.0 FY22 Mumbai Expansion 12.0 14.0 60 1.5BPCL Total Refining capex 38 61 640 21.4
D) BPCL Petchem capex Kochi Propylene unit 46 1.2BPCL Total Petchem capex 46 1.2
E) HPCL Refining capex Vizag Expansion 8.3 15.0 150 7.5 FY21 Mumbai Expansion 6.5 9.5 42 1.1 FY20
Barmer Greenfield Refinery 9.0 372 11.2Pending State Clearance
Bhatinda Refinery Expansion 9.0 11.3 22 0.5 FY23 HPCL Total Refining capex 24 45 586 20
TOTAL (A+B+C+D+E) 127 207 2,426 75
Source: PhillipCapital India Research, Company Investments on tighter emission norms will also drive near term OMC capex The Government of India recently decided to adopt BS‐6 emission norms by 2020 (bypassing BS‐5). Its earlier target for adoption of BS‐6 norms was 2024. Since the average time for setting up a Hydrogen Treatment Unit (HTU) is about 36 months, we expect orders for consultancy and EPC to be awarded in FY17‐18. EIL’s share could be 3‐4% of the total capex of Rs 290bn. India will skip BS‐5 – will go from BS‐4 to BS‐6 emission norms by 2020 g/km Stage Date CO HC HC+nox Nox PM PNPetrol BS IV 2010 0.5 0 0.3 0.25 0.025BS VI 2020 0.5 0 0.17 0.08 0.005 6X10^11Diesel BS IV 2010 1 0.1 0 0.08 0BS VI 2020 1 0.1 0 0.06 0.005 6X10^11
Source: PhillipCapital India Research, Company

Page | 5 | PHILLIPCAPITAL INDIA RESEARCH
ENGINEERS INDIA COMPANY UPDATE
Oil refineries will incur a capex of Rs 290bn to upgrade to BS‐6 compliant fuel Rs bn IOC 120 HPCL 40 BPCL 50 MRPL 45 CPCL 10 NRL 25 Total 290
Source: PhillipCapital India Research, Company
EIL will be an early‐cycle beneficiary of refining capex EIL not only provides consultancy services for pre‐project activities, but also for project execution. EIL provides end‐to‐end consultancy services from pre project to commissioning
Source: PhillipCapital India Research, Company Legacy knowhow gives EIL a competitive advantage EIL has been a consultant or EPC contractor in nearly 100mmtpa out of the 135mmtpa capacity of government‐owned OMCs. This experience and knowledge gives EIL a considerable advantage vs. its competitors, especially because 49mmtpa out of the 80mmtpa planned capacity is likely to be brownfield.
Process Design Engineering Procurement Construction Management
CommissioningProject Management
Specialised servicesCertification

Page | 6 | PHILLIPCAPITAL INDIA RESEARCH
ENGINEERS INDIA COMPANY UPDATE
21% CAGR in FY16‐18 order inflow We foresee a Rs 75bn opportunity over next five years for consultancy projects Based on the pipeline of projects, we expect the total opportunity for EIL’s high‐margin consultancy business at Rs 75bn over the next five years. This translates to about 3% of the total capex of Rs 2.43tn to be undertaken by 2025 on capacity expansions. The changeover in emission norms (to BS‐6 from BS‐4) should add another Rs 8‐10bn. However, orders for emission projects could be back‐ended towards FY18. Our inflows assume just 35% of the Rs 75bn orders in FY17‐18 We estimate that just 35% of the total Rs 75bn order inflow opportunity fructifies in FY17‐18. EIL’s near monopolistic market share amongst the OMCs will ensure a high strike rate. Pick up in new orders from refineries to drive a 21%CAGR in EIL’s High margin consultancy segment will be a beneficiary FY16‐18 order inflows
Source: PhillipCapital India Research, Company
0
5
10
15
20
25
30
35
40
45
FY07
FY08
FY09
FY10
FY11
FY12
FY13
FY14
FY15
FY16e
FY17e
FY18e
Order inflo
w (R
sbn) 21% CAGR
8 16
12 7 9 6
13
5
19
10
20 17
8
16 31
8
32
1
1
7
4
6
6 6
‐
5
10
15
20
25
30
35
40
45
FY07
FY08
FY09
FY10
FY11
FY12
FY13
FY14
FY15
FY16e
FY17e
FY18e
Order inflo
w (R
sbn)
Consultancy Turnkey
Page | 7 | PHILLIPCAPITAL INDIA RESEARCH
ENGINEERS INDIA COMPANY UPDATE
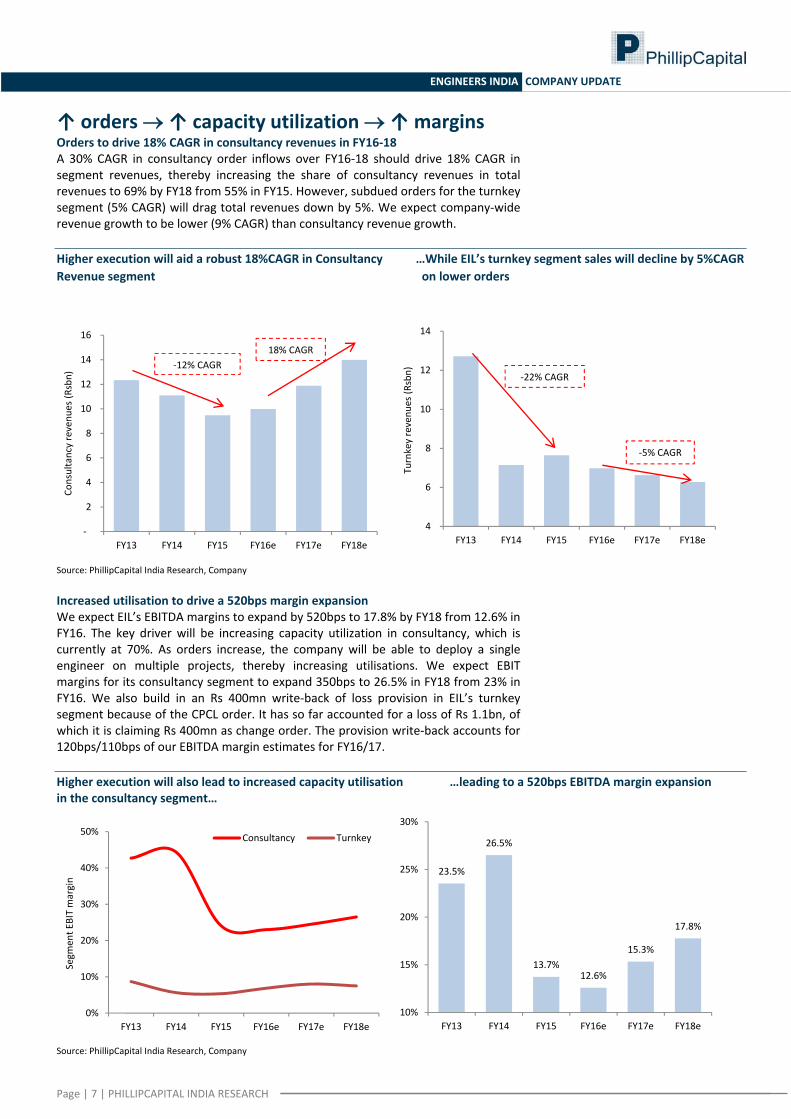
↑ orders → ↑ capacity utilization → ↑ margins Orders to drive 18% CAGR in consultancy revenues in FY16‐18 A 30% CAGR in consultancy order inflows over FY16‐18 should drive 18% CAGR in segment revenues, thereby increasing the share of consultancy revenues in total revenues to 69% by FY18 from 55% in FY15. However, subdued orders for the turnkey segment (5% CAGR) will drag total revenues down by 5%. We expect company‐wide revenue growth to be lower (9% CAGR) than consultancy revenue growth. Higher execution will aid a robust 18%CAGR in Consultancy …While EIL’s turnkey segment sales will decline by 5%CAGR Revenue segment on lower orders
Source: PhillipCapital India Research, Company Increased utilisation to drive a 520bps margin expansion We expect EIL’s EBITDA margins to expand by 520bps to 17.8% by FY18 from 12.6% in FY16. The key driver will be increasing capacity utilization in consultancy, which is currently at 70%. As orders increase, the company will be able to deploy a single engineer on multiple projects, thereby increasing utilisations. We expect EBIT margins for its consultancy segment to expand 350bps to 26.5% in FY18 from 23% in FY16. We also build in an Rs 400mn write‐back of loss provision in EIL’s turnkey segment because of the CPCL order. It has so far accounted for a loss of Rs 1.1bn, of which it is claiming Rs 400mn as change order. The provision write‐back accounts for 120bps/110bps of our EBITDA margin estimates for FY16/17. Higher execution will also lead to increased capacity utilisation …leading to a 520bps EBITDA margin expansion in the consultancy segment…
Source: PhillipCapital India Research, Company
‐
2
4
6
8
10
12
14
16
FY13 FY14 FY15 FY16e FY17e FY18e
Consultancy revenu
es (R
sbn)
18% CAGR‐12% CAGR
4
6
8
10
12
14
FY13 FY14 FY15 FY16e FY17e FY18e
Turnkey revenu
es (R
sbn) ‐22% CAGR
‐5% CAGR
0%
10%
20%
30%
40%
50%
FY13 FY14 FY15 FY16e FY17e FY18e
Segm
ent E
BIT margin
Consultancy Turnkey
23.5%
26.5%
13.7%12.6%
15.3%
17.8%
10%
15%
20%
25%
30%
FY13 FY14 FY15 FY16e FY17e FY18e

Page | 8 | PHILLIPCAPITAL INDIA RESEARCH
ENGINEERS INDIA COMPANY UPDATE
Operating cash‐flow generation despite equity investment in fertiliser plant We expect EIL to remain FCF positive over the next three years despite (1) the need to invest Rs 3.4bn as its share of equity infusion for the Ramagundam fertiliser project and (2) lower interest income because of withdrawals from high‐return instruments such as FMPs. EIL will generate FCF despite investments in fertilizer plant
Source: PhillipCapital India Research, Company
PE rerating strongly linked to order inflows Average PE of 32x in times of high order inflows EIL’s valuations have a strong correlation to order inflows. Its average one‐year ex‐cash PE multiple over the past ten years has been 20x. However, in periods of high order inflows (see chart below, circled red) the PE multiple of the company expands and trades above 1+SD valuations of 32x PE. EIL’s PE re‐rates in periods of high order inflows
Source: PhillipCapital India Research, Company We assign a target PE of 30x to September 2017 earnings As we expect orders to pick up over the next three years, we see scope for rerating from current valuations of 30x FY17 and 24x FY18E PE (core EPS). We assign a target PE of 30x to the average of our FY17 and FY18 core earnings (ex‐cash) and add Rs 71/share as the value of cash to EIL’s core business value to arrive at our target price
13
7 7
8
5
9
‐
2
4
6
8
10
12
14
FY13 FY14 FY15 FY16e FY17e FY18e
FCF/share (Rs)
0
5
10
15
20
25
30
35
40
0
10000
20000
30000
40000
50000
Apr‐06
Oct‐06
Apr‐07
Oct‐07
Apr‐08
Oct‐08
Apr‐09
Oct‐09
Apr‐10
Oct‐10
Apr‐11
Oct‐11
Apr‐12
Oct‐12
Apr‐13
Oct‐13
Apr‐14
Oct‐14
Apr‐15
Oct‐15
PE (x)
Order in
flow (R
smn)
Order Inflow PE (rhs)

Page | 9 | PHILLIPCAPITAL INDIA RESEARCH
ENGINEERS INDIA COMPANY UPDATE
of Rs 246. Our target multiple is at a slight discount to the stock’s 1+SD valuations in periods of high order inflows. Average Ex‐cash PE of 20x but stock trades at 1+SD of 32x during years of high order inflows
Source: PhillipCapital India Research, Company Near‐term risks persist EIL’s near‐term stock performance is likely to be affected by downgrades to consensus estimates. Our FY17 earnings are already 25% lower than consensus, primarily because we assume lower other income as the company withdrew from high interest‐yielding instruments in FY16, which we believe is not yet factored into consensus earnings. We have cut our FY17E by 17% due to lower other income
____New Estimates_____ _____Old Estimates_____ __Change in estimates_
(Rs mn) FY16e FY17e FY16e FY17e FY16e FY17eRevenues 16,969 18,517 17,235 18,548 ‐2% 0%EBITDA 2,137 2,838 1,938 3,183 10% ‐11%Margins(%) 12.6% 15.3% 11.2% 17.2% 135 bps ‐183 bpsPAT 2,888 3,247 2,910 3,904 ‐1% ‐17%EPS 8.6 9.6 8.6 11.6 ‐1% ‐17%
Source: PhillipCapital India Research Estimates Our FY17e are 25% below consensus ____PC estimate_____ _____Consensus_____ ______Deviation_____(Rs mn) FY16e FY17e FY16e FY17e FY16e FY17eRevenues 16,969 18,517 17,770 20,104 ‐5% ‐8%EBITDA* 2,137 2,838 2,524 3,925 ‐15% ‐28%Margins(%) 12.6% 15.3% 14.2% 19.5% ‐161 bps ‐419 bpsPAT 2,888 3,247 3,320 4,334 ‐13% ‐25%EPS 8.6 9.6 9.9 12.9 ‐13% ‐25%
Source: PhillipCapital India Research Estimates.
*Bloomberg EBITDA includes other income
AVG.
SD +1
SD ‐10
10
20
30
40
50
60
70
Apr‐02
Nov
‐02
Jun‐03
Jan‐04
Aug‐04
Mar‐05
Oct‐05
May‐06
Dec‐06
Jul‐0
7
Feb‐08
Sep‐08
Apr‐09
Nov
‐09
Jun‐10
Jan‐11
Aug‐11
Mar‐12
Oct‐12
May‐13
Dec‐13
Jul‐1
4
Feb‐15
Sep‐15
P/E (x)

Page | 10 | PHILLIPCAPITAL INDIA RESEARCH
ENGINEERS INDIA COMPANY UPDATE
Financials
Income Statement Y/E Mar, Rs mn FY15 FY16e FY17e FY18eNet sales 17,130 16,969 18,517 20,264Growth, % ‐6 ‐1 9 9Total income 17,130 16,969 18,517 20,264Raw material expenses ‐5,835 ‐6,770 ‐6,630 ‐6,708Employee expenses ‐5,919 ‐5,979 ‐6,591 ‐7,267Other Operating expenses ‐3,023 ‐2,082 ‐2,457 ‐2,689EBITDA (Core) 2,353 2,137 2,838 3,600Growth, % (51.3) (9.2) 32.8 26.8Margin, % 13.7 12.6 15.3 17.8Depreciation ‐196 ‐261 ‐294 ‐322EBIT 2,157 1,876 2,544 3,278Growth, % (54.0) (13.0) 35.6 28.8Margin, % 12.6 11.1 13.7 16.2Interest paid 0 0 0 0Other Non‐Operating Income 2,731 2,396 2,259 2,236Pre‐tax profit 4,663 4,272 4,803 5,514Tax provided ‐1,583 ‐1,384 ‐1,556 ‐1,787Profit after tax 3,080 2,888 3,247 3,728Net Profit 3,080 2,888 3,247 3,728Growth, % (31.4) (12.6) 12.4 14.8Net Profit (adjusted) 3,304 2,888 3,247 3,728Unadj. shares (m) 337 337 337 337Wtd avg shares (m) 337 337 337 337 Balance Sheet Y/E Mar, Rs mn FY15 FY16e FY17e FY18eCash & bank 23,729 24,545 23,859 23,868Debtors 4,261 4,184 4,312 4,441Inventory 8 8 9 10Loans & advances 1,315 1,524 1,663 1,820Other current assets 3,235 3,203 3,450 3,728Total current assets 32,548 33,464 33,293 33,866Investments 1,404 1,404 2,904 3,804Gross fixed assets 4,391 5,082 5,582 6,082Less: Depreciation ‐1,694 ‐1,955 ‐2,249 ‐2,571Add: Capital WIP 191 0 0 0Net fixed assets 2,888 3,127 3,333 3,511Total assets 39,159 40,314 41,848 43,501Current liabilities 7,803 8,338 8,640 9,067Provisions 5,186 4,928 5,360 5,882Total current liabilities 12,989 13,266 14,000 14,950Non‐current liabilities 0 0 0 0Total liabilities 12,989 13,266 14,000 14,950Paid‐up capital 2,176 2,176 2,176 2,176Reserves & surplus 23,994 24,873 25,673 26,376Shareholders’ equity 26,170 27,049 27,849 28,551Total equity & liabilities 39,159 40,314 41,848 43,501 Source: Company, PhillipCapital India Research Estimates
Cash Flow Y/E Mar, Rs mn FY15 FY16e FY17e FY18ePre‐tax profit 4,663 4,272 4,803 5,514Depreciation 196 261 294 322Chg in working capital ‐1,454 434 ‐212 ‐137Total tax paid ‐1,024 ‐1,641 ‐1,125 ‐1,265Cash flow from operating activities 2,381 3,326 3,761 4,434Capital expenditure ‐588 ‐500 ‐500 ‐500Chg in investments 5,962 0 ‐1,500 ‐900Cash flow from investing activities 5,374 ‐500 ‐2,000 ‐1,400Free cash flow 7,755 2,826 1,761 3,034Debt raised/(repaid) 0 0 0 0Dividend (incl. tax) ‐2,343 ‐2,009 ‐2,447 ‐3,025Other financing activities 325 0 0 0Cash flow from financing activities ‐1,706 ‐2,009 ‐2,447 ‐3,025Net chg in cash 6,049 817 ‐686 9 Valuation Ratios
FY15 FY16e FY17e FY18ePer Share data EPS (INR) 9.8 8.6 9.6 11.1Growth, % (31.4) (12.6) 12.4 14.8Book NAV/share (INR) 77.7 80.3 82.7 84.8FDEPS (INR) 9.8 8.6 9.6 11.1CEPS (INR) 11.1 9.4 10.5 12.0CFPS (INR) (1.0) 2.8 4.5 6.5DPS (INR) 6.0 5.1 6.3 7.7Return ratios Return on assets (%) 8.0 7.3 7.9 8.7Return on equity (%) 12.6 10.7 11.7 13.1Return on capital employed (%) 12.1 10.9 11.8 13.2Turnover ratios Asset turnover (x) 5.7 4.5 4.7 4.7Sales/Total assets (x) 0.4 0.4 0.5 0.5Sales/Net FA (x) 6.4 5.6 5.7 5.9Working capital/Sales (x) (0.2) (0.3) (0.2) (0.2)Working capital days (88.9) (93.5) (90.0) (89.2)Liquidity ratios Current ratio (x) 2.5 2.5 2.4 2.3Quick ratio (x) 2.5 2.5 2.4 2.3Dividend cover (x) 1.6 1.7 1.5 1.4Net debt/Equity (%) (90.7) (90.7) (85.7) (83.6)Valuation PER (x) 21.5 24.6 21.9 19.0Price/Book (x) 2.7 2.6 2.5 2.5Yield (%) 2.8 2.4 3.0 3.7EV/Net sales (x) 2.8 2.7 2.5 2.3EV/EBITDA (x) 20.1 21.7 16.6 13.1EV/EBIT (x) 21.9 24.7 18.5 14.4
Page | 11 | PHILLIPCAPITAL INDIA RESEARCH
ENGINEERS INDIA COMPANY UPDATE
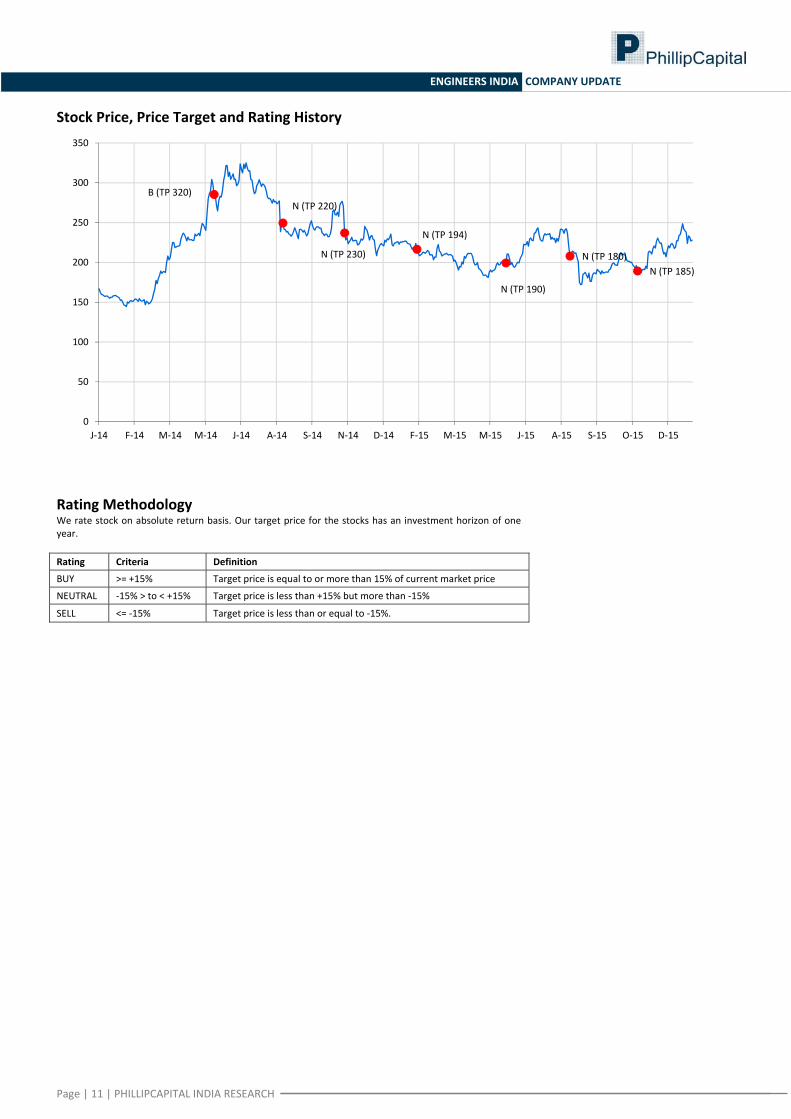
Stock Price, Price Target and Rating History
Rating Methodology We rate stock on absolute return basis. Our target price for the stocks has an investment horizon of one year. Rating Criteria Definition
BUY >= +15% Target price is equal to or more than 15% of current market price
NEUTRAL ‐15% > to < +15% Target price is less than +15% but more than ‐15%
SELL <= ‐15% Target price is less than or equal to ‐15%.
B (TP 320)N (TP 220)
N (TP 230)
N (TP 194)
N (TP 190)
N (TP 180)N (TP 185)
0
50
100
150
200
250
300
350
J‐14 F‐14 M‐14 M‐14 J‐14 A‐14 S‐14 N‐14 D‐14 F‐15 M‐15 M‐15 J‐15 A‐15 S‐15 O‐15 D‐15

Page | 12 | PHILLIPCAPITAL INDIA RESEARCH
ENGINEERS INDIA COMPANY UPDATE
Contact Information (Regional Member Companies)
SINGAPORE Phillip Securities Pte Ltd
250 North Bridge Road, #06‐00 RafflesCityTower, Singapore 179101
Tel : (65) 6533 6001 Fax: (65) 6535 3834 www.phillip.com.sg
MALAYSIA Phillip Capital Management Sdn Bhd B‐3‐6 Block B Level 3, Megan Avenue II,
No. 12, Jalan Yap Kwan Seng, 50450 Kuala Lumpur Tel (60) 3 2162 8841 Fax (60) 3 2166 5099
www.poems.com.my
HONG KONG Phillip Securities (HK) Ltd
11/F United Centre 95 Queensway Hong Kong Tel (852) 2277 6600 Fax: (852) 2868 5307
www.phillip.com.hk
JAPAN Phillip Securities Japan, Ltd
4‐2 Nihonbashi Kabutocho, Chuo‐ku Tokyo 103‐0026
Tel: (81) 3 3666 2101 Fax: (81) 3 3664 0141 www.phillip.co.jp
INDONESIA PT Phillip Securities Indonesia
ANZTower Level 23B, Jl Jend Sudirman Kav 33A, Jakarta 10220, Indonesia
Tel (62) 21 5790 0800 Fax: (62) 21 5790 0809 www.phillip.co.id
CHINA Phillip Financial Advisory (Shanghai) Co. Ltd.
No 550 Yan An East Road, OceanTower Unit 2318 Shanghai 200 001
Tel (86) 21 5169 9200 Fax: (86) 21 6351 2940 www.phillip.com.cn
THAILAND Phillip Securities (Thailand) Public Co. Ltd.
15th Floor, VorawatBuilding, 849 Silom Road, Silom, Bangrak, Bangkok 10500 Thailand
Tel (66) 2 2268 0999 Fax: (66) 2 2268 0921 www.phillip.co.th
FRANCE King & Shaxson Capital Ltd.
3rd Floor, 35 Rue de la Bienfaisance 75008 Paris France
Tel (33) 1 4563 3100 Fax : (33) 1 4563 6017 www.kingandshaxson.com
UNITED KINGDOM King & Shaxson Ltd.
6th Floor, Candlewick House, 120 Cannon Street London, EC4N 6AS
Tel (44) 20 7929 5300 Fax: (44) 20 7283 6835 www.kingandshaxson.com
UNITED STATES Phillip Futures Inc.
141 W Jackson Blvd Ste 3050 The Chicago Board of TradeBuilding
Chicago, IL 60604 USA Tel (1) 312 356 9000 Fax: (1) 312 356 9005
AUSTRALIA PhillipCapital Australia
Level 37, 530 Collins Street Melbourne, Victoria 3000, Australia
Tel: (61) 3 9629 8380 Fax: (61) 3 9614 8309 www.phillipcapital.com.au
SRI LANKA Asha Phillip Securities Limited
Level 4, Millennium House, 46/58 Navam Mawatha, Colombo 2, Sri Lanka
Tel: (94) 11 2429 100 Fax: (94) 11 2429 199 www.ashaphillip.net/home.htm
INDIA PhillipCapital (India) Private Limited
No. 1, 18th Floor, Urmi Estate, 95 Ganpatrao Kadam Marg, Lower Parel West, Mumbai 400013 Tel: (9122) 2300 2999 Fax: (9122) 6667 9955 www.phillipcapital.in
Management(91 22) 2300 2999
Kinshuk Bharti Tiwari (Head – Institutional Equity) (91 22) 6667 9946(91 22) 6667 9735
Research Engineering, Capital Goods Midcap
Dhawal Doshi (9122) 6667 9769 Jonas Bhutta (9122) 6667 9759 Amol Rao (9122) 6667 9952Nitesh Sharma, CFA (9122) 6667 9965 Hrishikesh Bhagat (9122) 6667 9986
Portfolio StrategyAgri Inputs Infrastructure & IT Services Anindya Bhowmik (9122) 6667 9764Gauri Anand (9122) 6667 9943 Vibhor Singhal (9122) 6667 9949
Deepan Kapadia (9122) 6667 9992 TechnicalsBanking, NBFCs Subodh Gupta, CMT (9122) 6667 9762Manish Agarwalla (9122) 6667 9962 Logistics, Transportation & MidcapPradeep Agrawal (9122) 6667 9953 Vikram Suryavanshi (9122) 6667 9951 Production ManagerParesh Jain (9122) 6667 9948 Ganesh Deorukhkar (9122) 6667 9966
MetalsConsumer, Media, Telecom Dhawal Doshi (9122) 6667 9769 Database ManagerNaveen Kulkarni, CFA, FRM (9122) 6667 9947 Yash Doshi (9122) 6667 9987 Deepak Agarwal (9122) 6667 9944Jubil Jain (9122) 6667 9766Manoj Behera (9122) 6667 9973 Oil & Gas Editor
Sabri Hazarika (9122) 6667 9756 Roshan Sony 98199 72726CementVaibhav Agarwal (9122) 6667 9967 Pharma Sr. Manager – Equities Support
Surya Patra (9122) 6667 9768 Rosie Ferns (9122) 6667 9971Economics Mehul Sheth (9122) 6667 9996Anjali Verma (9122) 6667 9969
Sales & Distribution Ashvin Patil (9122) 6667 9991 Sales Trader Zarine Damania (9122) 6667 9976Shubhangi Agrawal (9122) 6667 9964 Dilesh Doshi (9122) 6667 9747 Kishor Binwal (9122) 6667 9989 Suniil Pandit (9122) 6667 9745Sidharth Agrawal (9122) 6667 9934 ExecutionBhavin Shah (9122) 6667 9974 Mayur Shah (9122) 6667 9945
Corporate Communications
Vineet Bhatnagar (Managing Director)
Jignesh Shah (Head – Equity Derivatives)
Automobiles
Page | 13 | PHILLIPCAPITAL INDIA RESEARCH
ENGINEERS INDIA COMPANY UPDATE
Disclosures and Disclaimers PhillipCapital (India) Pvt. Ltd. has three independent equity research groups: Institutional Equities, Institutional Equity Derivatives, and Private Client Group. This report has been prepared by Institutional Equities Group. The views and opinions expressed in this document may, may not match, or may be contrary at times with the views, estimates, rating, and target price of the other equity research groups of PhillipCapital (India) Pvt. Ltd.
This report is issued by PhillipCapital (India) Pvt. Ltd., which is regulated by the SEBI. PhillipCapital (India) Pvt. Ltd. is a subsidiary of Phillip (Mauritius) Pvt. Ltd. References to "PCIPL" in this report shall mean PhillipCapital (India) Pvt. Ltd unless otherwise stated. This report is prepared and distributed by PCIPL for information purposes only, and neither the information contained herein, nor any opinion expressed should be construed or deemed to be construed as solicitation or as offering advice for the purposes of the purchase or sale of any security, investment, or derivatives. The information and opinions contained in the report were considered by PCIPL to be valid when published. The report also contains information provided to PCIPL by third parties. The source of such information will usually be disclosed in the report. Whilst PCIPL has taken all reasonable steps to ensure that this information is correct, PCIPL does not offer any warranty as to the accuracy or completeness of such information. Any person placing reliance on the report to undertake trading does so entirely at his or her own risk and PCIPL does not accept any liability as a result. Securities and Derivatives markets may be subject to rapid and unexpected price movements and past performance is not necessarily an indication of future performance.
This report does not regard the specific investment objectives, financial situation, and the particular needs of any specific person who may receive this report. Investors must undertake independent analysis with their own legal, tax, and financial advisors and reach their own conclusions regarding the appropriateness of investing in any securities or investment strategies discussed or recommended in this report and should understand that statements regarding future prospects may not be realised. Under no circumstances can it be used or considered as an offer to sell or as a solicitation of any offer to buy or sell the securities mentioned within it. The information contained in the research reports may have been taken from trade and statistical services and other sources, which PCIL believe is reliable. PhillipCapital (India) Pvt. Ltd. or any of its group/associate/affiliate companies do not guarantee that such information is accurate or complete and it should not be relied upon as such. Any opinions expressed reflect judgments at this date and are subject to change without notice.
Important: These disclosures and disclaimers must be read in conjunction with the research report of which it forms part. Receipt and use of the research report is subject to all aspects of these disclosures and disclaimers. Additional information about the issuers and securities discussed in this research report is available on request.
Certifications: The research analyst(s) who prepared this research report hereby certifies that the views expressed in this research report accurately reflect the research analyst’s personal views about all of the subject issuers and/or securities, that the analyst(s) have no known conflict of interest and no part of the research analyst’s compensation was, is, or will be, directly or indirectly, related to the specific views or recommendations contained in this research report.
Additional Disclosures of Interest: Unless specifically mentioned in Point No. 9 below: 1. The Research Analyst(s), PCIL, or its associates or relatives of the Research Analyst does not have any financial interest in the company(ies) covered in
this report. 2. The Research Analyst, PCIL or its associates or relatives of the Research Analyst affiliates collectively do not hold more than 1% of the securities of the
company (ies)covered in this report as of the end of the month immediately preceding the distribution of the research report. 3. The Research Analyst, his/her associate, his/her relative, and PCIL, do not have any other material conflict of interest at the time of publication of this
research report. 4. The Research Analyst, PCIL, and its associates have not received compensation for investment banking or merchant banking or brokerage services or for
any other products or services from the company(ies) covered in this report, in the past twelve months. 5. The Research Analyst, PCIL or its associates have not managed or co‐managed in the previous twelve months, a private or public offering of securities for
the company (ies) covered in this report. 6. PCIL or its associates have not received compensation or other benefits from the company(ies) covered in this report or from any third party, in
connection with the research report. 7. The Research Analyst has not served as an Officer, Director, or employee of the company (ies) covered in the Research report. 8. The Research Analyst and PCIL has not been engaged in market making activity for the company(ies) covered in the Research report. 9. Details of PCIL, Research Analyst and its associates pertaining to the companies covered in the Research report: Sr. no. Particulars Yes/No
1 Whether compensation has been received from the company(ies) covered in the Research report in the past 12 months for investment banking transaction by PCIL
No
2 Whether Research Analyst, PCIL or its associates or relatives of the Research Analyst affiliates collectively hold more than 1% of thecompany(ies) covered in the Research report
No
3 Whether compensation has been received by PCIL or its associates from the company(ies) covered in the Research report No4 PCIL or its affiliates have managed or co‐managed in the previous twelve months a private or public offering of securities for the
company(ies) covered in the Research report No
5 Research Analyst, his associate, PCIL or its associates have received compensation for investment banking or merchant banking or brokerage services or for any other products or services from the company(ies) covered in the Research report, in the last twelve months
No
Independence: PhillipCapital (India) Pvt. Ltd. has not had an investment banking relationship with, and has not received any compensation for investment banking services from, the subject issuers in the past twelve (12) months, and PhillipCapital (India) Pvt. Ltd does not anticipate receiving or intend to seek compensation for investment banking services from the subject issuers in the next three (3) months. PhillipCapital (India) Pvt. Ltd is not a market maker in the securities mentioned in this research report, although it, or its affiliates/employees, may have positions in, purchase or sell, or be materially interested in any of the securities covered in the report.
Suitability and Risks: This research report is for informational purposes only and is not tailored to the specific investment objectives, financial situation or particular requirements of any individual recipient hereof. Certain securities may give rise to substantial risks and may not be suitable for certain investors. Each investor must make its own determination as to the appropriateness of any securities referred to in this research report based upon the legal, tax and accounting considerations applicable to such investor and its own investment objectives or strategy, its financial situation and its investing experience. The value of any security may be positively or adversely affected by changes in foreign exchange or interest rates, as well as by other financial, economic, or political factors. Past performance is not necessarily indicative of future performance or results.
Page | 14 | PHILLIPCAPITAL INDIA RESEARCH
ENGINEERS INDIA COMPANY UPDATE
Sources, Completeness and Accuracy: The material herein is based upon information obtained from sources that PCIPL and the research analyst believe to be reliable, but neither PCIPL nor the research analyst represents or guarantees that the information contained herein is accurate or complete and it should not be relied upon as such. Opinions expressed herein are current opinions as of the date appearing on this material, and are subject to change without notice. Furthermore, PCIPL is under no obligation to update or keep the information current.Without limiting any of the foregoing, in no event shall PCIL, any of its affiliates/employees or any third party involved in, or related to computing or compiling the information have any liability for any damages of any kind including but not limited to any direct or consequential loss or damage, however arising, from the use of this document.
Copyright: The copyright in this research report belongs exclusively to PCIPL. All rights are reserved. Any unauthorised use or disclosure is prohibited. No reprinting or reproduction, in whole or in part, is permitted without the PCIPL’s prior consent, except that a recipient may reprint it for internal circulation only and only if it is reprinted in its entirety.
Caution: Risk of loss in trading/investment can be substantial and even more than the amount / margin given by you. The recipient should carefully consider whether trading/investment is appropriate for the recipient in light of the recipient’s experience, objectives, financial resources and other relevant circumstances. PCIPL and any of its employees, directors, associates, group entities, or affiliates shall not be liable for losses, if any, incurred by the recipient. The recipient is further cautioned that trading/investments in financial markets are subject to market risks and are advised to seek trading/investment advice before investing. There is no guarantee/assurance as to returns or profits or capital protection or appreciation. PCIPL and any of its employees, directors, associates, group entities, affiliates are not inducing the recipient for trading/investing in the financial market(s). Trading/Investment decision is the sole responsibility of the recipient.
For U.S. persons only: This research report is a product of PhillipCapital (India) Pvt Ltd., which is the employer of the research analyst(s) who has prepared the research report. The research analyst(s) preparing the research report is/are resident outside the United States (U.S.) and are not associated persons of any U.S.‐regulated broker‐dealer and therefore the analyst(s) is/are not subject to supervision by a U.S. broker‐dealer, and is/are not required to satisfy the regulatory licensing requirements of FINRA or required to otherwise comply with U.S. rules or regulations regarding, among other things, communications with a subject company, public appearances, and trading securities held by a research analyst account.
This report is intended for distribution by PhillipCapital (India) Pvt Ltd. only to "Major Institutional Investors" as defined by Rule 15a‐6(b)(4) of the U.S. Securities and Exchange Act, 1934 (the Exchange Act) and interpretations thereof by the U.S. Securities and Exchange Commission (SEC) in reliance on Rule 15a 6(a)(2). If the recipient of this report is not a Major Institutional Investor as specified above, then it should not act upon this report and return the same to the sender. Further, this report may not be copied, duplicated, and/or transmitted onward to any U.S. person, which is not a Major Institutional Investor.
In reliance on the exemption from registration provided by Rule 15a‐6 of the Exchange Act and interpretations thereof by the SEC in order to conduct certain business with Major Institutional Investors, PhillipCapital (India) Pvt Ltd. has entered into an agreement with a U.S. registered broker‐dealer, Marco Polo Securities Inc. ("Marco Polo"). Transactions in securities discussed in this research report should be effected through Marco Polo or another U.S. registered broker dealer PhillipCapital (India) Pvt. Ltd. Registered office: No. 1, 18th Floor, Urmi Estate, 95 GanpatraoKadamMarg, Lower Parel West, Mumbai 400013


