
Insert picture(s) hereAmy Simpson, Ph.D., P.E.
Gonzalo Rada, Ph.D., P.E.
Beth Visintine, Ph.D.
Jonathan Groeger
Rutting as a Performance Indicator

MAP-21
Moving Ahead for Progress in the 21st Century First “long-term” highway authorization since 2005 (10
extensions to SAFETEA-LU) $105 billion for FYs 2013 and 2014 Performance-based management of national highway
system Performance measures established 18 months after
enactment Prior to enactment, FHWA undertook study,
“Improving FHWA’s Ability to Assess Highway Infrastructure Health”
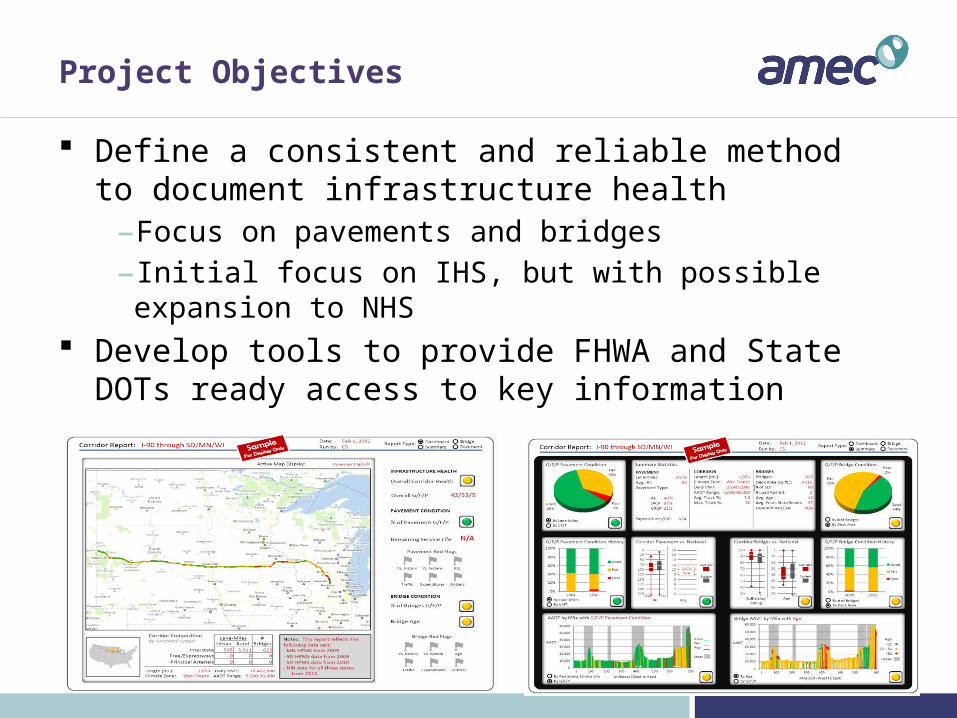
Project Objectives
Define a consistent and reliable method to document infrastructure health
–Focus on pavements and bridges
–Initial focus on IHS, but with possible expansion to NHS Develop tools to provide FHWA and State DOTs ready
access to key information

Project Approach
Track #1 – Develop an approach for categorizing pavement and bridges as Good / Fair / Poor, that can be used consistently across the country.
Track #2 – Develop an approach for assessing the Overall Health of a multi-state highway corridor.

Goals of the Pilot Study
Validate IRI as a Tier 1 measure Advance potential Tier 2 and Tier 3 measures Key questions
–Do different data sources tell us the same thing?
–Do different metrics help us better understand pavement conditions?
Goal Area Tier 1 Tier 2 Tier 3
Pavement Preservation
IRI Functional condition based on Tier 1 plus HPMS distress data
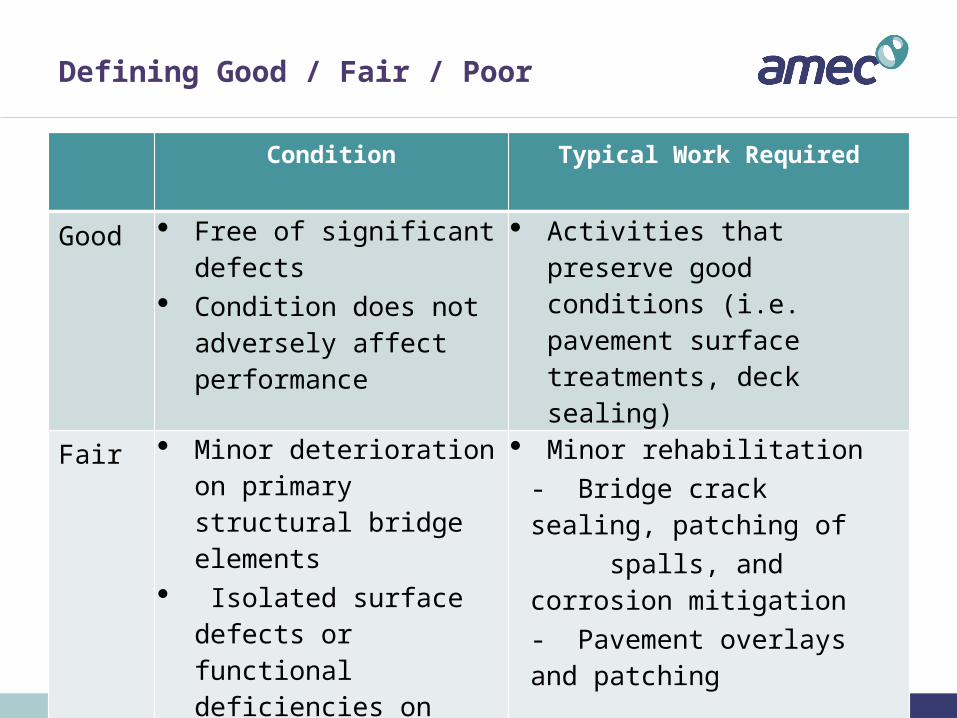
Defining Good / Fair / Poor
Condition Typical Work Required
Good Free of significant defects Condition does not
adversely affect performance
Activities that preserve good conditions (i.e. pavement surface treatments, deck sealing)
Fair Minor deterioration on primary structural bridge elements
Isolated surface defects or functional deficiencies on pavements
Minor rehabilitation - Bridge crack sealing, patching of spalls, and corrosion mitigation - Pavement overlays and patching
Poor Advanced deterioration Conditions impact
structural capacity
Structural repairs, major rehabilitation, reconstruction, or replacement

Pilot Study Corridor
874 miles
AADT from 5,000 to 90,000
Urban and Rural
Variety of surface types

Pilot Study Data
National Data - HPMS data in 2010+ format State Data
–Documentation
–Inventory
–Pavement Management Field data
–Collected in eastbound direction only
–Rutting, roughness, cracking, faulting
–Rolling wheel deflectometer

Observations from Pilot Study
IRI is feasible for use as a Tier 1 G/F/P Ride Quality indicator
−Reasonable correlation between sources
−Make sure data collection/processing consistent
IRI does not provide complete picture, other measures require additional work
Additional work performed to investigate bias observed in rutting and identify improvements in HPMS data
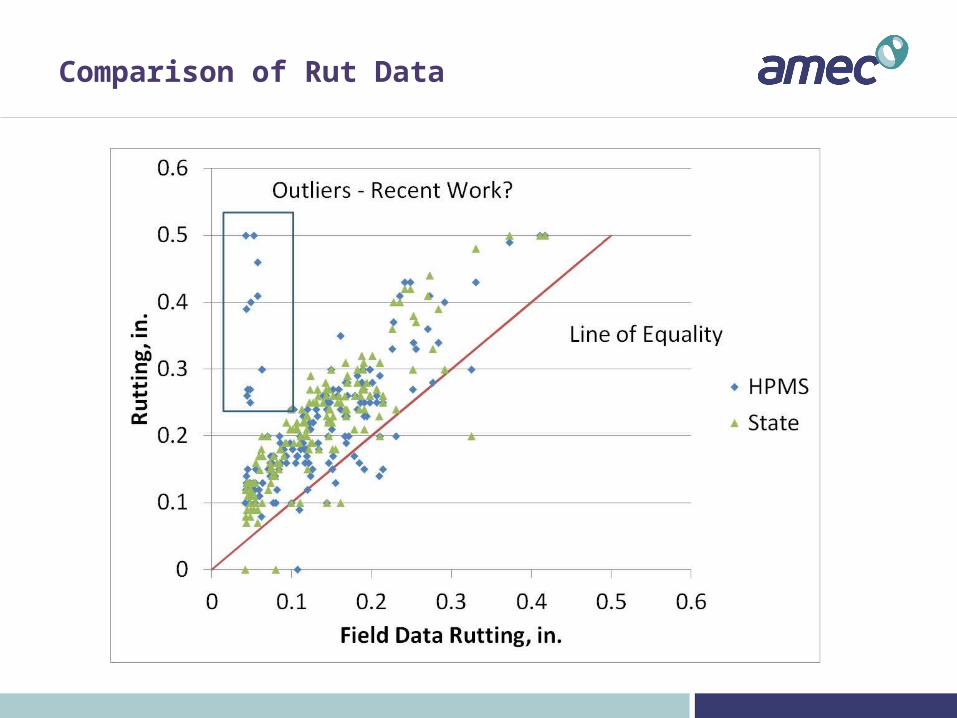
Comparison of Rut Data

South Dakota

Minnesota

Outline of Data Review
Data Collection Recommendations Data Processing Recommendations Data Quality Control Data Storage Recommendations Condition Rating
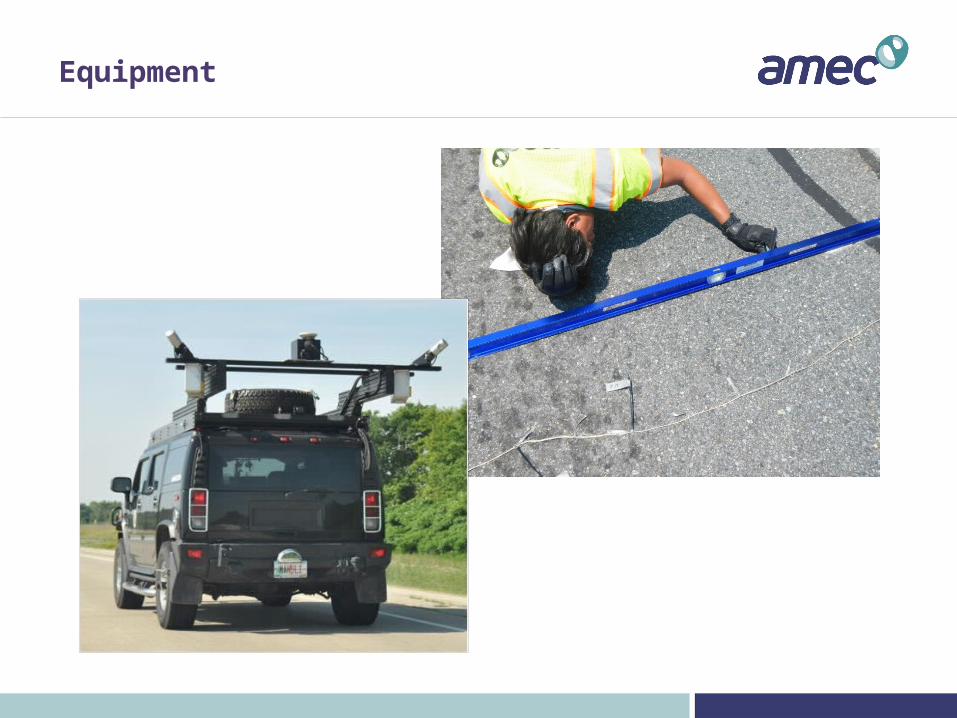
Equipment

Transverse Spacing

Longitudinal Sampling Interval

Longitudinal Sampling Interval

Data Collection Recommendations
AASHTO PP70-10: Width should cover at least 13 ft
Maximum spacing between data points of 0.4 inch
Maximum spacing between profiles of 10 ft

Profile Filtering – Moving Average
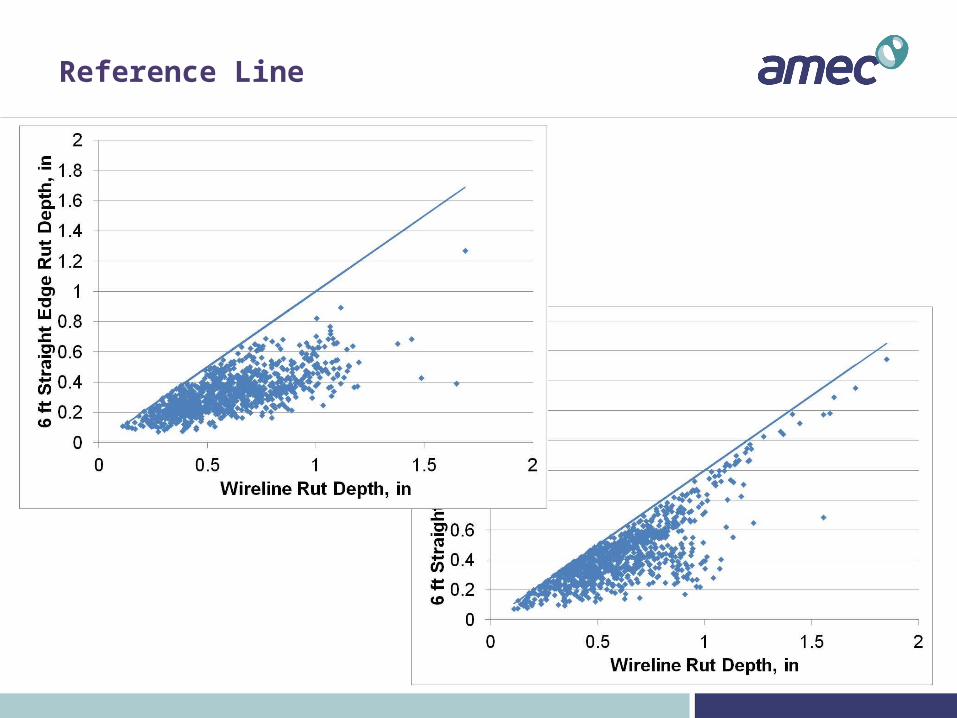
Reference Line

Gage Width

Data Processing Recommendations
2-inch moving average filter applied to transverse profile
Use lane width wireline reference
Gage width from 1.2 to 1.5 inches

Data Quality Control
Initial system validation reviewing each component
Routine checks of components, AASHTO PP70-10
Systematic reviews of collected data

Base Length

Data Storage Recommendations
Data Elements
– Average, minimum, maximum, and standard deviation of rut depth
– Cross-slope
Base length of 0.1-mile
Metadata stored should include the full transverse profile
Quality control elements identifying level of review

Condition Ratings
FHWA Pavement Health Track (PHT) identifies terminal rut of 0.4
AASHTO ME identifies rut < 0.25 as adequate and rut > 0.4 as inadequate
Condition Distress Range Percentage of Corridor
Good Rut < 0.25 inch 96%Fair 0.25 inch ≤ Rut ≤ 0.4 inch 3%Poor Rut > 0.4 inch 1%

Field Validation
20 segments reviewed within MN
–7 Good
–7 Fair
–6 Poor 71% agreement between
condition rating Based on field validation,
threshold values remain as preliminary until further research completed

Acknowledgements
• FHWA Office of Asset Management
• Pilot States – SD, MN, WI – thank you!
• Technical Working Group – WA, SD, NC, VA, MO, WI, FHWA
• 2nd TWG – CT, KS, NC, OH, RI, FHWA, 2 Academia, 1 Consultant
• Study Team
• AMEC Environment & Infrastructure, Inc.
• Cambridge Systematics, Inc.
• Data Collection Vendors
• Mandli Communications (pavement)
• Applied Research Associates, Inc. (RWD)
• Googe: FHWA Infrastructure Health Pilot Study or FHWA Asset Management Publications


