
INNOVATIVE LEARNING ANALYTICS FOR EVALUATING EFFECTIVENESS OF FPI 1
Innovative Learning Analytics for
Evaluating Effectiveness of
First Principles of Instruction
Theodore W. Frick
Professor Emeritus
Department of Instructional Systems Technology
School of Education, Indiana University Bloomington, USA
Rodney D. Myers
Instructional Consultant
School of Education, Indiana University Bloomington, USA
Cesur Dagli
Research Analyst
Office of Analytics & Institutional Effectiveness
Virginia Polytechnic Institute and State University, USA
Featured Research Paper
Presented at the Annual Conference of the
Association for Educational Communications and Technology (AECT)
Chicago, IL, Nov. 2-6, 2021

INNOVATIVE LEARNING ANALYTICS FOR EVALUATING EFFECTIVENESS OF FPI 2
Innovative Learning Analytics for Evaluating Effectiveness of
First Principles of Instruction
Abstract (211 words)
In this naturalistic study, we tracked 172,108 learning journeys of students who were interacting
with an online resource, the Indiana University Plagiarism Tutorials and Tests (IPTAT) at
https://plagiarism.iu.edu. IPTAT was designed using First Principles of Instruction (FPI;
Merrill, 2020). Students who used IPTAT were mostly from university and advanced high
school courses taught in 186 countries and territories. Instructors expected their students to pass
one of trillions of difficult Certification Tests (CT) provided through IPTAT. Each CT assessed
student ability to classify samples of writing as word-for-word plagiarism, paraphrasing
plagiarism, or no plagiarism—when given original source materials. In 51,738 successful
learning journeys, students who had passed a CT viewed an average of 130 IPTAT webpages
designed with FPI. In the 120,370 unsuccessful learning journeys, students had viewed an
average of 26 webpages designed with FPI. Analysis of Patterns in Time (Frick, 1990) revealed
that successful students were about 5 times as likely to have selected webpages designed with
FPI when compared with those in unsuccessful learning journeys. These results support the
extraordinary effectiveness of First Principles of Instruction for design of online learning in a
massive, open, online course (MOOC). These findings further demonstrate the value of an
innovative approach to learning analytics, Analysis of Patterns in Time (APT).
Keywords
Online learning; learning journeys; innovative learning analytics; MOOC; First Principles of
Instruction; Analysis of Patterns in Time; instructional effectiveness; recognizing plagiarism;
certification tests; mastery learning; web-based instruction.

INNOVATIVE LEARNING ANALYTICS FOR EVALUATING EFFECTIVENESS OF FPI 3
Theoretical Framework
Michael Scriven (1967) has been often cited for first introducing the terms formative vs.
summative methods when evaluating curriculum in education. Broadly conceived, these
methods of evaluation are distinguished by their purpose. Formative evaluation is used to
improve something during its development, whereas summative evaluation is used to determine
its merit or worth when that development is completed. Worthen and Sanders (1987) also made
this distinction, emphasizing that formative evaluation entails asking questions such as “What is
working?”, “What needs to be improved?”, and “How can it be improved?” (p. 36). Reigeluth
and Frick (1999) recommended ways that formative research methodology can be used to
evaluate instructional-design theories. They stated:
The underlying logic of formative research … is that if you create an accurate
application of an instructional-design theory (or model), then any weaknesses
that are found in the application may reflect weaknesses in the theory, and any
improvements identified for the application may reflect ways to improve the
theory. (p. 636)
The broader issue is praxiology in educology, according to Steiner (1988). In 1964
Steiner had introduced the term educatology for the study of education, but soon after shortened
it to educology (e.g., see Frick, 2019, 2020). Disciplined inquiry about education, if adequate,
results in qualitative, quantitative, and performative educology (Steiner, 1988). Educology is in
essence “recorded signs of knowing about education” (Frick, 2021, p. 28).
Quantitative knowledge is comprised of scientific, praxiological, and philosophical
theories which have been verified by appropriate research methods. These theories are about
universals. Universals are not limited to time or place (Steiner, 1988). A praxiological theory is

INNOVATIVE LEARNING ANALYTICS FOR EVALUATING EFFECTIVENESS OF FPI 4
thus comprised of statements consisting of recorded signs about means-ends relationships that
are universal. Such means-ends relationships are not limited to time or place. Instructional-
design theories are, therefore, a type of praxiological educology. ID theories specify ways of
effectively guiding student learning that can have broad generalizability (e.g., see Frick &
Reigeluth, 1992).
David Merrill posited what he termed First Principles of Instruction (FPI; 2002, 2013,
2020). First Principles can be considered as an instructional-design theory, and hence also are
part of praxiological theory in educology. Merrill (2020) defined a principle
as a relationship between learning outcomes and instructional strategies that is
always true under appropriate conditions regardless of the methods or models
used to implement it. Rather than methods or models of instruction
themselves, principles are the relationships that may underlie any model or
method. (p. 2)
Overview of this Study
Merrill’s First Principles of Instruction had been applied in 2015 when redesigning the
online Indiana University Plagiarism Tutorials and Tests (IPTAT). The praxiological study
described in this article is a form of summative evaluation (Scriven, 1967; Worthen & Sanders,
1987). We used a method to verify praxiological theory called Analysis of Patterns in Time
(APT; Frick, 1990; Frick et al., 2022; Frick & Reigeluth, 1992; Myers & Frick, 2015). What is
further innovative in this study is the use of Google Analytics 4 to track individual student
interaction with IPTAT. GA4 created the temporal maps needed for APT—that is, big data
collected on 172,108 learning journeys through IPTAT during early 2021. GA4 segmenting and
matching tools were subsequently applied to count event patterns within those temporal maps

INNOVATIVE LEARNING ANALYTICS FOR EVALUATING EFFECTIVENESS OF FPI 5
which indicated student experience of First Principles of Instruction and their learning outcomes.
Results from GA4 queries were then exported to a Microsoft Excel spreadsheet to perform
further computations needed for APT.
Primary Research Question
Student learning achievement in IPTAT was measured by well-established and reliable
Certification Tests (Frick & Dagli, 2016). These allowed us to address the primary research
question:
To what extent do First Principles of Instruction promote student learning achievement in
IPTAT?
Merrill (2020) had further hypothesized that
when a given instructional program or practice implements one or more of
these First Principles, there will be an increase in learning and performance.
Obviously, the support for this hypothesis can only come from evaluation
studies for a given instructional product or research comparing the use and
misuse of these principles. (p. 3)
Indeed, the IPTAT is “a given instructional product” which, in this case, happens to be a
massive, open, online course (MOOC; Frick & Dagli, 2016).
Methods
Redesign of IPTAT in 2015
Frick et al. (2018) described 14 years of IPTAT development and use historically. While
originally designed for students in the Instructional Technology program at Indiana University,
IPTAT has subsequently been adopted by many instructors worldwide. These instructors want
their students to avoid committing plagiarism, and typically they expect their students to pass an

INNOVATIVE LEARNING ANALYTICS FOR EVALUATING EFFECTIVENESS OF FPI 6
IPTAT Certification Test as a course requirement. Frick et al. (2022) indicated that IPTAT had
been accessed over 125 million times since its inception, and that from 2016 through 2020 nearly
750,000 students had passed one of trillions of IPTAT’s difficult Certification Tests.
A team had significantly redesigned IPTAT in 2015 by applying First Principles of
Instruction (Merrill, 2002, 2013, 2020). Merrill’s First Principles of Instruction as applied to
IPTAT included:
• Authentic problems or tasks for students to do, arranged from simple to complex (e.g.,
https://plagiarism.iu.edu/tutorials/index.html);
• Activation of student learning by helping students connect new learning with what they
already know or believe (e.g., https://plagiarism.iu.edu/tutorials/task1/activation.html);
• Demonstration of what is to be learned, by showing a variety of examples (e.g.,
https://plagiarism.iu.edu/tutorials/task1/demonstration.html);
• Application of what is being learned, so students can try themselves and feedback is
provided (e.g., https://plagiarism.iu.edu/practiceTest.php?task=1&item=1); and
• Integration of what has been learned into students’ own lives (e.g.,
https://plagiarism.iu.edu/tutorials/task1/integration.html).
Examples of application of First Principles are illustrated by hyperlinks to webpages above.
Since this design has been described in more detail elsewhere, readers are referred to Frick et al.
(2018, 2022). Since IU technology services had discontinued their in-house Web statistics, the
design team incorporated Google Analytics in the new version of IPTAT, which went live on
January 2, 2016.

INNOVATIVE LEARNING ANALYTICS FOR EVALUATING EFFECTIVENESS OF FPI 7
Analysis of Patterns in Time
The primary research method we used to evaluate the effectiveness of First Principles of
Instruction in IPTAT was Analysis of Patterns in Time (Frick, 1990; Frick et al., 2022; Myers &
Frick, 2015). APT is an innovative learning analytics method. APT has been used in many past
studies (space prevents a detailed description here). Instead, we describe in detail below how we
leveraged Google Analytics to do APT when supplemented by spreadsheet calculations.
Frick et al. (2022) used the metaphor of the Oregon Trail, comparing how early settlers
followed it by walking and riding in covered wagons with how modern-day transportation
systems can be used to make this trip. They introduced the concept of learning journeys and
briefly summarized the limitations of traditional quantitative and qualitative approaches. They
described APT as an alternative, which instead uses temporal maps as the primary data
collection source. APT thus allows researchers to document what happens during learning
journeys. If enough learning journeys are sampled, researchers can make predictions about
patterns of student success and failure that are associated with various instructional strategies.
The important discovery in early 2020 by Frick et al. (2022) was that Google Analytics
has been implementing many ideas from the original APT, which had been invented decades
earlier (Frick, 1983, 1990). GA tracking effectively creates APT temporal maps, and if used
creatively, GA can subsequently do segmenting and matching within temporal maps, resulting in
counts of event occurrences that have been previously tracked on user interaction with a website
such as IPTAT. Results from GA reports can then be transferred to a spreadsheet, where cell
formulae are created to do further APT computations needed for forming likelihoods and odds
ratios.

INNOVATIVE LEARNING ANALYTICS FOR EVALUATING EFFECTIVENESS OF FPI 8
Google Analytics 4 for Collecting Big Data
Google Analytics 4 (GA4) was used for tracking student interaction with the IPTAT
website. GA4 stored their interaction trails as client sessions. Session records are indeed
temporal maps as described by Frick et al. (2008, 2022) and Myers and Frick (2015). GA4
allowed us to subsequently segment those student learning journeys based on their navigation
through IPTAT and whether or not they passed Certification Tests (CTs). IPTAT also stored
records of CT results, which served to triangulate our measures of student success.
Using GA4 to Carry Out APT Queries
Caveat: It took us some time to discover how to adapt GA4 in order to do Analysis of
Patterns in Time. We were breaking new ground and not even sure we could do APT with GA4
when we started. Once we better understood how GA4 tracks and counts events, as well as how
it identifies clients (active users), then we were able to proceed as described below. While GA4
by itself cannot do all of APT, it can greatly facilitate the counting process. Additional APT
calculations such as means, likelihoods, and odds ratios can subsequently be calculated with a
spreadsheet. We hope that our descriptions below will help guide others to use this approach to
research on instructional effectiveness.
Setting up Website Tracking for GA4. IPTAT users were tracked since 2016 via
Universal Analytics (UA), an earlier version of Google Analytics. Starting in early December,
2020, we connected the existing UA tracking system to the new GA4 tracking system, and then
enabled new GA4 tracking records.
When initially setting up Google Analytics, a snippet of JavaScript code was provided
that contained our unique website ID, which we inserted into our HTML templates for webpages
to be tracked. Whenever anyone accesses a particular webpage, their browser executes the

INNOVATIVE LEARNING ANALYTICS FOR EVALUATING EFFECTIVENESS OF FPI 9
JavaScript code when the page is displayed. This code sends information to Google’s tracking
system which includes the hashed client-ID of the user, webpage URL (path), HTML title of the
page, IP address of the client device, and the current date and time. Specific website users
remain anonymous, since their device’s IP address and client-ID are encrypted in GA tracking
records to help protect user privacy. GA normally can determine when the same device accesses
a different webpage at a later time through use of browser cookies stored on that device. If users
disable cookies or clear them from their browsers, then GA tracking methods are thwarted. Once
tracking of a website is enabled, GA reporting tools can be used to analyze what users have done
on the website. Google provides authentication methods for GA administration normally by
using one’s Gmail account. This further restricts who can access the tracking data on a particular
website.
When we initially built the IPTAT website at https://plagiarism.iu.edu we created page
names that corresponded to various First Principles of Instruction and other important activities
(e.g., /activation*, /demonstration*, /masteryTest*, /practice*, /plagiarismTestUG*, /mail*, etc.).
Note that the asterisks (*) used here are wildcards for variations of webpage filenames. For
example, any filename that contained ‘/activation’ would correspond to use of the FPI activation
principle in IPTAT design.
We originally intended this file naming convention for our own benefit as website
developers. Fortuitously, this also simplified subsequent APT queries with GA4 tools when
specifying segments and matching conditions. For example, all FPI activation events can be
identified by matching webpage filenames that contain the string, ‘/activation’. Or we can
determine from GA4 that whenever a ‘/mail*’ webpage was accessed, this meant that a student

INNOVATIVE LEARNING ANALYTICS FOR EVALUATING EFFECTIVENESS OF FPI 10
had just passed a Certification Test (CT) and clicked the button to email it to themselves. Note
that this particular webpage can only be accessed immediately after a student has passed a CT.
GA4 Real-time Reports. As can be seen in Figure 1, GA4 tools include a real-time view
of the IPTAT website. In this example, 104 different users (GA clients) had been accessing
IPTAT in the previous 30 minutes. The world map indicates where the majority of those users
are currently located. At 11:30 a.m. on March 25, 2021, most were from the U.S., Philippines,
China, India, and Africa. Not shown in Figure 1 are additional statistics that include which
webpages were accessed most frequently, conversion events, and more.
[Insert Fig. 1 about here.]
Figure 1
GA4 Realtime View of IPTAT Website Usage
Creating New GA4 Events and Conversions. GA4 tracks a number of events by default
that include pageviews, clicks, scrolling, and client session starts. To do APT, we needed to
create new events according to pageviews of First Principles of Instruction. For example, we
created an event category called Activation as illustrated in Figure 2.
[Insert Fig. 2 about here.]

INNOVATIVE LEARNING ANALYTICS FOR EVALUATING EFFECTIVENESS OF FPI 11
Figure 2
GA4 Event Creation for the FPI Activation Principle
The matching condition for an Activation event was whenever the ‘page_location’
parameter contained “/activation”. All of the IPTAT webpages that we specifically designed
using the FPI Activation principle contain this string in their filename paths (e.g.,
https://plagiarism.iu.edu/tutorials/task4/activation2.html). In early December, 2020, we defined
similar matching conditions accordingly for other FPI events. Once these new FPI events were
created, they were further marked as GA4 conversions (i.e., FPI goals achieved by IPTAT users).
[Insert Table 1 about here.]
Table 1
GA4 Events Created and Marked as Conversions (Goals)
Event Name
Marked as
conversion
Activation TRUE
Application TRUE
click FALSE
Demonstration TRUE
file_download FALSE
first_visit FALSE
Integration TRUE

INNOVATIVE LEARNING ANALYTICS FOR EVALUATING EFFECTIVENESS OF FPI 12
Mastery_Test TRUE
page_view TRUE
Pass_GR_Test TRUE
Pass_UG_Test TRUE
Plagiarism_Patterns TRUE
Plagiarism_Test TRUE
scroll FALSE
session_start FALSE
Test_Feedback TRUE
Once these new FPI events (conversions) were created, then they could be tracked via
GA4. In essence, by creating new events in GA4, we taught it how to classify various FPI
webpages by appropriate categories (Frick, 1990; Myers & Frick, 2015). In Table 1, event
names that begin with capital letters are ones we created, and uncapitalized event names are
events that GA4 provides and tracks by default. Note, for example, we had created ‘Activation’
as new event and marked it as a conversion (= TRUE). We marked the GA4 event, ‘page_view’
also as a conversion, whereas other uncapitalized event names were not, such as ‘scroll’ (=
FALSE). Once new GA4 events have been created, they will be tracked as such, unless they are
later unmarked as conversions.
This was a very important initial step. Note further that the ‘page_view’ event is counted
for all webpages tracked by GA4, including those which we did not classify as instances
designed specifically using First Principles of Instruction. We initially configured GA4 this way
because we later intended to do Analysis of Patterns in Time. This method of designing
naturalistic research is an innovative approach via GA4, although APT itself is a research
method that has been around for decades (Frick, 1990).

INNOVATIVE LEARNING ANALYTICS FOR EVALUATING EFFECTIVENESS OF FPI 13
GA4 Analysis Reports. Once new events are created and tracked, as described above,
the real power of GA4 can be utilized with its Analysis Tool. We illustrate here how we used the
analytic technique “Segment overlap” in order to do APT of IPTAT usage.
[Insert Fig. 3 about here.]
Figure 3
GA4 Analysis Setup to Do APT of IPTAT
First, we named this analysis “Pass and Not Pass.” We set the custom date range to cover
IPTAT events between Jan. 1 and Mar. 25, 2021, illustrated in Figure 3.

INNOVATIVE LEARNING ANALYTICS FOR EVALUATING EFFECTIVENESS OF FPI 14
Next, we added two segments: Pass and Not Pass. We segmented users according to
whether their learning journeys were successful or not. See Figures 4 and 5.
[Insert Fig. 4 and 5 about here.]
Figure 4
GA4 Definition of Segment for Users Who Pass a CT
Figure 5
GA4 Definition for Users Who Do Not Pass a CT
The Pass segment includes users when their pageview path contains “/mail” at any point
in their learning journeys. The Not Pass segment excludes users whose learning journeys contain
“/mail” pageviews at any point. This results in two mutually exclusive and exhaustive subsets of
users—those who passed a CT and those who did not.
As illustrated in Figure 3, once these two new segments were defined, we dragged them
to the right-hand column for SEGMENT COMPARISONS. We had already selected the

INNOVATIVE LEARNING ANALYTICS FOR EVALUATING EFFECTIVENESS OF FPI 15
Segment overlap TECHNIQUE. We had dragged “Event name” into the BREAKDOWN area.
For VALUES we had dragged “Active users” and “Conversions” to the VALUES area. These
were the criteria used for creating the GA4 report illustrated in Figure 6.
[Insert Fig. 6 about here.]
Figure 6
Part of the GA4 Report from Segment Overlap Analysis of IPTAT Users Who Passed and Did
Not Pass: Jan. 1–Mar. 25, 2021
From the Venn diagram in Figure 6, we can see that the Not Pass segment and the Pass
segment do not overlap. We can further see that there are a total of 120,370 Active users who
did Not Pass. These numbers are identical for the Not Pass ONLY segment because Pass and
Not Pass are non-overlapping sets (we had defined them this way in order to do APT properly).

INNOVATIVE LEARNING ANALYTICS FOR EVALUATING EFFECTIVENESS OF FPI 16
We can further see that none of the active users included in the Not Pass segment had passed an
Undergraduate Certification Test (Pass_UG_Test), as it should be. As discussed above,
Conversion events were defined for respective webpages designed with First Principles of
Instruction.
We can further see in Figure 6 that 51,738 Active users did Pass a CT who had
11,213,605 Conversions (as marked in Table 1). Note that 40,685 users passed an
Undergraduate CT. Not all of the results are shown in Figure 6, the remainder of which can be
viewed via scrolling the report in GA4 (including 11,195 Active users who passed a Graduate
level CT). We now have the basic numbers to complete the APT.
In summary, we have described the methods by which we obtained results from 172,108
learning journeys through IPTAT between Jan. 1 and Mar. 25, 2021. We have provided
considerable detail, since we needed to be rather creative in adapting use of GA4 in order to do
APT. We would not expect most readers to know how to do this or to discover it by themselves.
While we clearly understood our goals, it took considerable experimentation to get GA4 to count
the patterns we needed for doing APT. This was made easier nonetheless by our webpage
naming conventions which paralleled our application of First Principles of Instruction in
redesigning IPTAT in 2015.
Results
While Figure 6 illustrates a breakdown of IPTAT results by event names, we had first
done a more basic APT query, as illustrated in Figure 7. We used the GA4 Segment Overlap
tool to produce the initial report. We set our SEGMENT COMPARISONS to Pass and Not Pass,
but we did no BREAKDOWNs, and for VALUES we chose the METRICS: Active users,
Sessions, Conversions, and User Engagement.
INNOVATIVE LEARNING ANALYTICS FOR EVALUATING EFFECTIVENESS OF FPI 17
[Insert Figure 7 about here.]
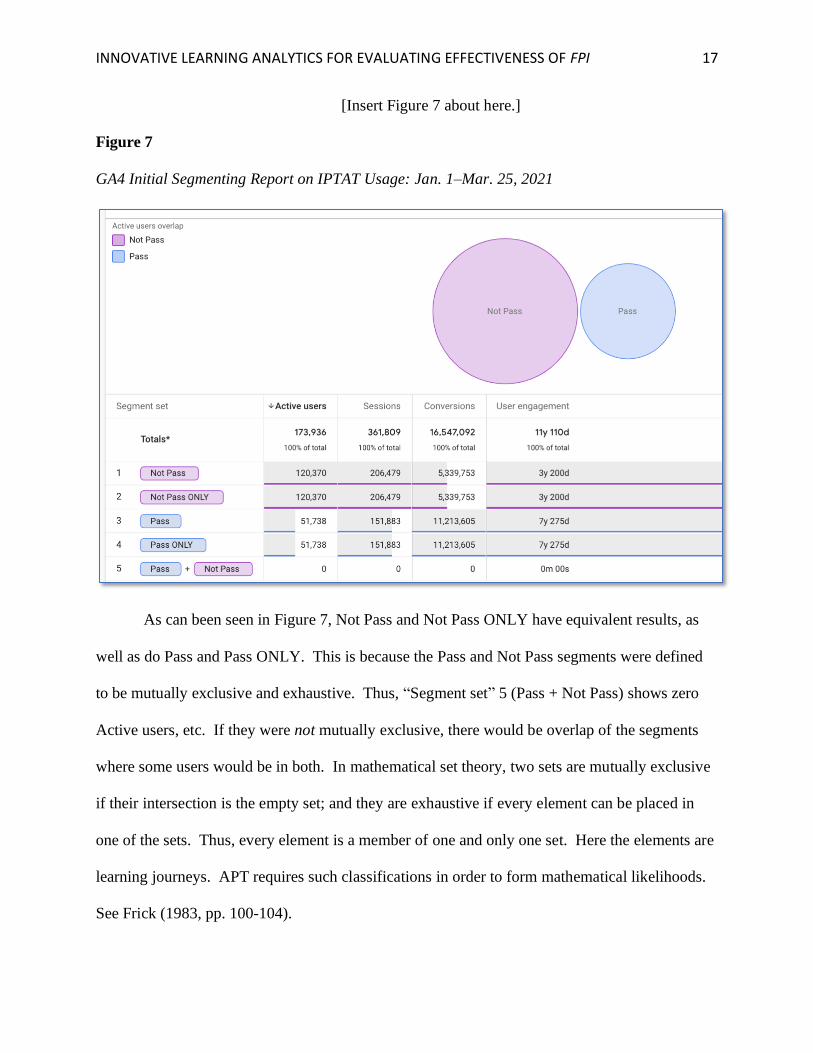
Figure 7
GA4 Initial Segmenting Report on IPTAT Usage: Jan. 1–Mar. 25, 2021
As can been seen in Figure 7, Not Pass and Not Pass ONLY have equivalent results, as
well as do Pass and Pass ONLY. This is because the Pass and Not Pass segments were defined
to be mutually exclusive and exhaustive. Thus, “Segment set” 5 (Pass + Not Pass) shows zero
Active users, etc. If they were not mutually exclusive, there would be overlap of the segments
where some users would be in both. In mathematical set theory, two sets are mutually exclusive
if their intersection is the empty set; and they are exhaustive if every element can be placed in
one of the sets. Thus, every element is a member of one and only one set. Here the elements are
learning journeys. APT requires such classifications in order to form mathematical likelihoods.
See Frick (1983, pp. 100-104).

INNOVATIVE LEARNING ANALYTICS FOR EVALUATING EFFECTIVENESS OF FPI 18
We then downloaded the report in Figure 7 to a CSV file and imported it into Excel as a
new worksheet. Then we removed the redundant information, as illustrated in Table 2.
[Insert Table 2 about here.]
Table 2
GA4 Results from Segment Overlay Analysis on IPTAT Usage Jan. 1–Mar. 25, 2021
GA4
Segment
Student
Learning
Journeys
Sessions
(Temporal
Maps)
IPTAT
Conversions
(Goals)
IPTAT User
Engagement
(Total Seconds)
Not Pass 120,370 206,479 5,339,753 111,972,074
Pass 51,738 151,883 11,213,605 244,731,764
Grand Total 172,108 358,362 16,553,358 356,703,838
We also adjusted the totals by computing them in Excel. According to GA4, the
“Totals*” reported in Figures 6 and 7 “may include duplicate values and may differ slightly from
other reports.” Presumably, the counts of events within segments are accurate. We discuss this
further in the section below on how GA4 determines Active users. We prefer to call these
student learning journeys that contain one or more APT temporal maps.
Cross-Validation of GA4 Results with IPTAT Records
We wondered about the accuracy of GA4 tracking, so we triangulated GA4 data with
IPTAT data collected by PHP scripts and stored in a MySQL database on Indiana University
computers completely independent of GA tracking, which stores sessions on Google’s servers.
We first used the GA4 User Explorer tool to look at unique user sessions. We were able
to match IU records by searching for the date and time that the user activated their IPTAT
registration, which executes a script, https://plagiarism.iu.edu/mainLogin.php?action=activate*.
By searching our MySQL record of the date and time the user activation was completed with the
INNOVATIVE LEARNING ANALYTICS FOR EVALUATING EFFECTIVENESS OF FPI 19
GA4 date and time when this webpage was accessed, we could identify the specific user by
finding a match. Our records include the user’s e-mail and name when registering, as well as
when they passed a Certification Test if they had done so. It is important to note that GA does
not store this information in their tracking records, and so does not identify the actual clients.
We do, however, in our MySQL database.
We did find matches of randomly selected GA sessions via the User Explorer tool and
our IU MySQL records. We also wanted to determine if the Active user counts matched our
MySQL counts for the same time intervals. Between Jan. 1 and Mar. 25, our MySQL records
indicated that 56,328 users had passed a CT. We note that GA4 determined that there were
51,738 Active users who were segmented on the basis of whether they accessed the
/mailCertificate*.php file when clicking the button after passing the test. Thus, the GA4 count is
an underestimate of the actual number of IPTAT users who passed a CT. Our PHP scripts record
this certificate information in MySQL regardless of whether or not a user clicks the button to e-
mail their certificate. Not all users do so, since they know that they can also do this later via
IPTAT’s “Retrieve and Validate Certificates” functionality. Moreover, users can thwart GA
tracking by using Web browsers that disable or block cookies or by other software that does so
(e.g., Bitdefender plugins).
The good news is that GA4 underestimates the number of successful Active users by a
relatively small percentage (by about eight percent in this study). If GA4 had overestimated this
number, that would be problematic. This cross-validation of GA4 results through triangulation
with IU MySQL records was reassuring. We could not do this kind of triangulation for
unsuccessful users, since IPTAT does not keep records of users who do not register, and who
therefore cannot pass a CT. We assume that the GA4 counts of unsuccessful Active users would

INNOVATIVE LEARNING ANALYTICS FOR EVALUATING EFFECTIVENESS OF FPI 20
likewise be a small underestimate. In any case, with such large numbers of users these
underestimates would not likely make appreciable differences in likelihood (or odds) ratios
determined via APT methods.
Using Excel to Compute APT Likelihood Ratios
We next created Excel cell formulae that generated results reported in Table 3.
[Insert Table 3 here]
Table 3
Further Excel Results Computed from Table 2 to Derive Measures for APT of IPTAT Usage
GA4
Segment
Mean GA4
Sessions
(Temporal
Maps)
Mean
IPTAT
Goals per
User
Mean User
Engagement
(Minutes)
IPTAT
Conversions
(Goals) Odds
(P:NP)
IPTAT
Engagement
Odds
(P:NP)
Not Pass (NP) 1.715 44.361 15.504 1 1
Pass (P) 2.936 216.738 78.837 4.886 5.085
Grand Total 2.076 95.901 34.443 ~ ~
In Table 3, learning journeys in which users passed a CT contained an average of 216.7
conversions, compared with 44.4 IPTAT goals achieved during unsuccessful learning journeys
where no CTs were passed. These means were computed by dividing the IPTAT conversions in
Table 2 by the respective numbers of student learning journeys for each segment type. The
means for temporal maps and user engagement were similarly computed. Thus, we can see that
for learning journeys in which a CT was passed, users viewed nearly 4.9 times as many IPTAT
webpages as did those in which a CT was not passed (216.738/44.361). Similarly, successful
learning journeys were about 5.1 times longer in duration on average than were unsuccessful
ones.

INNOVATIVE LEARNING ANALYTICS FOR EVALUATING EFFECTIVENESS OF FPI 21
Readers should note the IPTAT conversions (goals achieved) included not only views of
webpages designed with First Principles of Instruction, but also other IPTAT webpages
(page_views). See Table 1.
As illustrated in Figure 6, we had done a more refined analysis of successful and
unsuccessful learning journeys, where we obtained counts of specific types of FPI webpages.
These results were likewise exported to a spreadsheet. See Table 4.
[Insert Table 4 about here.]
Table 4
GA4 Results on First Principles of Instruction (FPI) Goals Achieved: Jan. 1–Mar. 25, 2021
Segment Event Type
Not Pass
Conversions (NP)
Pass
Conversions (P)
Activation 132,964 281,842
Demonstration 122,563 248,741
Application 1,122,483 2,567,555
Integration 72,889 165,763
Mastery_Test 269,600 554,058
Plagiarism_Test 541,670 1,015,221
Test_Feedback 544,265 1,158,220
Plagiarism_Patterns 327,080 750,651
FPI Totals 3,133,514 6,742,051
Total Learning Journeys
(Active Users) 120,370 51,738
FPI Conversions
per Journey 26.032 130.311
FPI Odds (P:NP) 5.006
It is evident in Table 4 that the FPI Application principle was experienced more often
than other FPI principles in both successful and unsuccessful student learning journeys. But the
number of learning journeys for students who did not pass a CT (120,370) was much greater than
those for students who did pass (51,738). This is why we need to compute FPI conversions per

INNOVATIVE LEARNING ANALYTICS FOR EVALUATING EFFECTIVENESS OF FPI 22
learning journey, prior to computing APT odds ratios. Students who did not pass a CT viewed
an average of 26 IPTAT webpages designed with First Principles of Instruction, whereas those
who did pass a CT viewed about 130 FPI-designed webpages. Thus, successful student learners
experienced about five times as many First Principles in their learning journeys through IPTAT.
It is not that unsuccessful students did not view any FPI webpages, but their learning journeys
were much shorter (about 15 minutes per journey) and they selected about one-fifth as many
FPI-designed pages, whereas successful students spent nearly 79 minutes on average, as
indicated in Table 3. These results are consistent with Merrill’s hypothesis that “when a given
instructional program or practice implements one or more of these First Principles, there will be
an increase in learning and performance” (2020, p. 3).
Our APT results on IPTAT usage indicate a five-fold increase in pages viewed that were
designed with First Principles of Instruction in learning journeys where students pass a difficult
Certification Test, when compared with students who do not pass. This is a large difference.
Each CT is comprised of ten randomly selected questions from a large pool of items. There are
literally trillions of unique CTs. The tests are difficult for most students—on average, about 14
percent of CT’s attempted are passed. To pass a CT a student must answer at least nine
questions correctly. Students who correctly answer fewer than nine questions do not pass.
IPTAT utilizes a mastery learning approach. Students are free to navigate IPTAT
however they choose, and they can take as many CTs as needed until they pass. The large
majority of students who use IPTAT do so because it is an assignment by their teacher or school.
Historically, about 81 percent of those students eventually do pass a CT. As Table 4 indicates,
those learning journeys which end in passing a Certification Test are, on average, associated with
student selection of about five times as many IPTAT webpages designed with First Principles

INNOVATIVE LEARNING ANALYTICS FOR EVALUATING EFFECTIVENESS OF FPI 23
and spend about five times as much time learning. Student persistence and effort matter, and
instruction designed with First Principles matters too.
What Are GA4 Active Users, APT Temporal Maps, and IPTAT Learning Journeys?
As discussed earlier, as users continue from one session to the next on the same device
and browser, GA4 utilizes a hashed client-ID, normally stored in a browser cookie. However, if
the same person changes devices and locations, they may be recognized with a different client-
ID by GA4. IPTAT does not share user login information with GA4 tracking (see
https://plagiarism.iu.edu/privacy.html). Thus, in the present study, we follow Frick et al. (2022)
by referring to student learning journeys, which consist of one or more temporal maps. A user
with the same GA4 client-ID may have one or more sessions in which they interact with IPTAT.
“A session ends after 30 minutes of inactivity on the part of the user” (Google Analytics 4,
2020).
APT has referred to temporal maps historically, which is a record of a sequence of
temporal events for a given person or situation. For examples of temporal maps, see Frick et al.
(2008), Frick and Myers (2015), and Frick et al. (2022). Thus, it makes sense to treat GA4
sessions as APT temporal maps. In Table 3 the segment of users who pass an IPTAT CT interact
with IPTAT on average for 2.9 sessions (temporal maps), when compared with users who do not
pass a CT who experience on average 1.7 temporal maps per learning journey.
GA4 refers to Active users as unique users who have initiated sessions within a specified
time frame. Uniqueness is determined by client-ID as discussed above. In the present study, we
treat an IPTAT learning journey as a set of one or more GA4 sessions (i.e., temporal maps) with
the same client-ID. An IPTAT learning journey is thus associated with a unique client-ID during
the timeframe beginning on January 1 through March 25, 2021.
INNOVATIVE LEARNING ANALYTICS FOR EVALUATING EFFECTIVENESS OF FPI 24
Discussion
Generalizability of Findings
Results from the present study are consistent with an earlier two-year Big Study that
Frick et al. (2022) conducted on IPTAT using a prior version of Google Analytics, known as
Universal Analytics (UA). On the other hand, we used GA4, a relatively new version of GA that
became available in October, 2020.
In the Frick et al. (2022) study, they reported results on more than 936,000 learning
journeys. According to UA tracking, those students were located in 213 countries and territories
worldwide. Those 390,000+ users who registered for IPTAT reported ages mostly between 14
and 44 years old. In the present study, GA4 tracked more than 172,000 IPTAT learning journeys
(Active users) for nearly three months, with 65,000+ IPTAT registrants. Notably, there were
nearly twice as many other students who did not register to take IPTAT tests. According to GA4
tracking, these users were located in 186 different countries and territories worldwide. In both
studies, when students registered for IPTAT, the large majority were doing so because it was a
requirement by their teacher or school, and they were mostly college and advanced high school
students (adults).
Frick et al. (2022) reported that successful students were between three and four times as
likely to choose webpages designed with First Principles, when compared with those who did not
pass Certification Tests. On the other hand, with GA4, we found the same odds ratio to be about
five to one. Why the difference? In UA, when doing APT, Frick et al. (2022) used unique
pageviews. In other words, if a user viewed the same webpage two or more times in a given GA
session (APT temporal map), it was counted as one page view. They noted that pageviews were
typically much higher than unique pageviews, but preferred to count the latter in their analyses.

INNOVATIVE LEARNING ANALYTICS FOR EVALUATING EFFECTIVENESS OF FPI 25
In the present study, we used GA4, which does not provide unique pageview statistics in results.
All pageview events are counted in GA4 results, most likely because GA4 is not limited to
websites.
GA4 can be used with all kinds of apps; and the broader concept is views. Looking at a
webpage is but one kind of view event. In GA4, a view could be when a user looks at a
particular screen display on their smartphone while using a grocery shopping app to order food
for later pickup—that is, not using a Web browser such as Safari or Chrome at all.
We are not overly concerned about the differences in approaches in UA and GA4. The
patterns are clear and consistently repeatable across time. Students who pass CTs view many
more webpages designed with FPI—whether it is four or five times more likely, it still makes a
very large practical difference. After all, if you were purchasing a car and had a choice between
a model that is four or five times more likely to get you to your destination, when compared to
other models, which car would you choose?
We note that the reliability of a car is a highly important consideration (e.g., not breaking
down and needing to be repaired as often), but it is not the only criterion for making a decision
between models. Perhaps one would choose the car with the nicer sound system and posh
leather seats. Perhaps one would be willing to spend more money on car repairs and take longer
to arrive at their destination because of more mechanical breakdowns. But if the goal is to get
there with the least amount of car repairs and frustration, a rational person would choose the car
with greater reliability—that is, a car which is more effective and efficient. This is a
praxiological issue, as discussed in the earlier theoretical framework.
A further difference between the present study and Frick et al. (2022) is the average
amount of engagement time per learning journey. In our study, we found that engagement

INNOVATIVE LEARNING ANALYTICS FOR EVALUATING EFFECTIVENESS OF FPI 26
averaged about 79 minutes per journey, whereas Frick et al. reported a mean of about 98 minutes
for successful students, and we found that unsuccessful students spent about 15 minutes, whereas
they found about 21 minutes on average per learning journey. These appear to be substantial
differences on use of the same MOOC. We note however that GA4 tracks user engagement
somewhat more precisely—referring to engaged sessions. GA4 can apparently discriminate
whether the app being used is the user’s focus. When a user switches away from the app being
tracked, GA4 does not consider this to be active user engagement. For example, during IPTAT,
a student might switch away to read and respond to their text messages or e-mail for several
minutes, and then resume interacting with IPTAT. In UA this would not be specifically tracked,
unless the user had switched away for more than 30 minutes, in which case the IPTAT session
would be terminated (as it also would be in GA4). However, in GA4 engaged time will
apparently only accrue when the app being tracked is the user’s focus. We believe that this is the
most likely explanation of the differences between our results and those of Frick et al. (2022).
Thus, we conclude here that the GA4 results are better indicators than UA when student
engagement time is being considered.
If generalizability of empirical research results is considered with respect to repeatability
of findings and applicability to a wide range of student learners, then results from the present
study and the Frick et al. (2022) study can be considered as highly generalizable. When taken
together, based on more than two years of IPTAT usage, these APT results apply to a worldwide
audience of adult learners who can read and comprehend English and who have computer
technology to access the World Wide Web. These observed learning patterns have been highly
consistent since 2016, as Frick et al. (2022) have noted.
Statistical inference, as a form of generalizability, is discussed below.

INNOVATIVE LEARNING ANALYTICS FOR EVALUATING EFFECTIVENESS OF FPI 27
Temporal Retrodiction from APT, Not Causal Inferences
Frick (1990) noted that causal inferences are not warranted from APT results unless
additional factors are considered. He provided the example of dawn and sunrise. Dawn is a
good predictor of sunrise, but dawn does not necessarily cause sunrise. Scientific theory that
involves Newton’s laws and optical refraction of light is preferable for explaining cause and
effect of dawn and sunrise. Nonetheless, sunrise is highly predictable following dawn. And we
can make decisions based on predictability of events, even if we cannot provide causal
explanations.
Thus, we should not conclude that First Principles of Instruction cause student learning
success (passing a Certification Test). But from APT results, we can conclude that success is
more likely when students have greater exposure to instruction designed with First Principles, at
least for IPTAT usage.
APT queries can be predictive or retrodictive, as explained by Frick et al. (2022). Based
on present conditions, prediction is forecasting what is likely to happen in the future.
Meteorologists do this when predicting that there is a 40% chance of rain tomorrow evening in
Toronto.
On the other hand, retrodiction is looking backward in time. Given that some event is
observed now, what has happened at an earlier time? This is what we did in the present study.
We observed when students passed a Certification Test during their learning journeys and
compared them to others who did not pass in their learning journeys. Then we looked backwards
in time and counted how often each of these two groups chose parts of IPTAT designed with
FPI. Myers and Frick (2015) likewise did this in their study of the Diffusion Simulation Game.
They classified how well each student had done at the end of a game, categorizing them

INNOVATIVE LEARNING ANALYTICS FOR EVALUATING EFFECTIVENESS OF FPI 28
according to how many adopters each player had achieved. Then they observed prior game
strategies players utilized. This also was a retrodictive approach to APT.
In short, APT is a descriptive-correlational approach to empirical research, not unlike
what epidemiologists do when attempting to predict whether someone is likely to get cancer.
What events precede cancer? For decades, epidemiologists and medical scientists knew that
people who smoked cigarettes heavily earlier in their lives were between five and ten times more
likely to contract lung cancer later in their lives than were nonsmokers. However, proving the
causal relationship was more challenging until the role of carcinogens was identified as a
significant factor, when researchers had a better understanding of biochemistry, pathology, and
cell biology. Nonetheless, people were advised to refrain from smoking based on the temporal
relationship.
Causal inferences are not warranted by correlation alone, as research methodologists and
statisticians have reminded us for decades (e.g., Kirk, 1999).
Descriptive versus Inferential Statistics
Statisticians distinguish between descriptive and inferential statistical methods (e.g.,
Kirk, 2013; Tabachnick & Fidell, 2018). “Descriptive statistics are tools for depicting or
summarizing data so that they can be more readily comprehended” (Kirk, 1999, p. 7). He goes
on to say that
it is usually impossible for researchers to observe all the elements of a
population. Instead they observe a sample of elements and generalize from the
sample to all the elements—a process called induction. They are aided in this
process by inferential statistics, which are tools for inferring the properties of
INNOVATIVE LEARNING ANALYTICS FOR EVALUATING EFFECTIVENESS OF FPI 29
one or more populations from an inspection of samples drawn from the
population. (pp. 7–8)
While APT clearly is a form of descriptive statistics, with such big data as collected via
GA4 on IPTAT usage, the question of inductive inference arises. While the sample in this study
is quite large, it was not randomly selected from the population of all potential students who
might use IPTAT. Therefore, inferential statistics do not appear to be applicable.
In the present study, we did not estimate standard errors of means by using theoretical
sampling distributions (such as Gaussian), which are based on sample size and expected
variation among samples. One might ask, is the difference between those who pass and those
who do not pass with respect to their use of FPI statistically significant? This is another way to
ask: to what extent would the observed results be expected to occur by chance, and the
difference we are seeing is due to sampling error?
We do not believe that this is the most important question. Teachers and instructional
designers often want to know whether or not what they do is effective. Does it work? Or how
well does it work? As in a weather forecast, we typically want to know if it is accurate—
whether we can depend on it and make plans accordingly. This is the more relevant question. In
our study, we emphasize practical significance rather than statistical significance. In real life,
something that is five times more effective is a big difference, practically speaking. When
sample sizes are extremely large, trivial differences can be statistically significant—that is, have
no practical consequences.
In the case of implementation of First Principles of Instruction in IPTAT, they have
worked well for over five years. At the time of this writing, over one million students have
registered for IPTAT and over 800,000 have passed one or more Certification Tests since 2016.
INNOVATIVE LEARNING ANALYTICS FOR EVALUATING EFFECTIVENESS OF FPI 30
This is a very large sample, though not random. Is it the population? No, but the predictions in
terms of odds ratios have been very stable. Will the sun rise tomorrow morning? We do not
know for sure, but it is highly predictable, based on a very large number of past observations.
Moreover, as Frick (1983) noted, the standard error of estimate decreases as a function of
sample size—inversely proportional to the square root of the number of elements in the sample
(see Kirk, 1999, p. 289). In the present study, we have 172,108 elements. Since GA4 does not
provide standard deviations, we can compute a margin of error estimate for proportions, similar
to that reported in survey results. If we convert the rates within passing and not passing
segments to proportions, the likelihood of experiencing an FPI event in a successful learning
journey is 0.83333 (130/156) and for an unsuccessful one is 0.16667 (26/156). See Table 3. The
likelihood ratio is still 5:1, as it should be. The margin of error is 0.00176 for these proportions
at the 95% confidence interval (with N = 172,108). See, for example, Kirk (1999, p. 365).
From a Bayesian perspective of probability theory, we are stating the following about the
likelihood ratio, LR, assuming a flat prior distribution (e.g., see Schmitt, 1969, pp. 83-89):
p (FPI | Pass) = 0.8333
p (FPI | Not Pass) = 0.1667
LR = 0.8333/0.1667 = 5.0
APT is grounded in set theory and probability theory in mathematics. The margin of
error in estimating the likelihoods (p) is very small in our study, plus or minus 0.00176, based on
observed proportions with an overall sample size of 172,108 learning journeys.
APT and Praxiological Theory
Analysis of Patterns in Time does not identify patterns all by itself. Researchers must
specify APT queries, and then APT accordingly segments temporal maps, finds matches, and

INNOVATIVE LEARNING ANALYTICS FOR EVALUATING EFFECTIVENESS OF FPI 31
counts occurrences of those events. While examining individual temporal maps may provide
leads on what patterns to tell APT to look for, theory should be driving the process. Kurt Lewin
has been often quoted for saying, “Nothing is as practical as a good theory” (Greenwood &
Levin, 1998, p. 19).
The present study was guided by instructional theory—in particular, First Principles of
Instruction. And design of instruction was driven by a practical need: IPTAT was designed with
the goal of helping students learn to recognize basic kinds of plagiarism from non-plagiarism.
Designers wanted IPTAT to be effective, that is, achieve its goal, and they wanted it to work via
the Web so it would be easily accessible by students in the Instructional Systems Technology
program at Indiana University. When IPTAT was designed in 2002, instructional theory about
how to teach concepts was applied. In 2015, when IPTAT was redesigned, the design team
specifically chose First Principles of Instruction for theoretical guidance. And most importantly,
that FPI theory not only influenced how we structured our website and named webpages in 2015,
it also guided which patterns we specified in APT to be counted in the present study.
The results provided in Table 4 did not “emerge from the data,” nor did artificial
intelligence algorithms discover those patterns. The segment event types listed in Table 4 are
identified by names of First Principles. The additional mastery tests and Certification Tests were
designed to assess how well students had learned to recognize plagiarism. The tests themselves
and feedback on test results are further instantiations of the FPI Application principle. The
plagiarism patterns to which test feedback adaptively links are further instances of the FPI
Demonstration principle.
In short, theory not only guided the instructional design of IPTAT, that instructional
theory also guided the search for patterns of instructional effectiveness. APT was the particular

INNOVATIVE LEARNING ANALYTICS FOR EVALUATING EFFECTIVENESS OF FPI 32
research methodology that guided how to find those patterns, and APT in turn was developed
retroductively from general systems theory, information theory, and set theory and probability
theory from mathematics (Frick, 1983, 1990). The patterns themselves are qualitative—the
event patterns are not numbers, rather they are named. The results of APT are quantitative—
numerical counts of patterns of event occurrences in temporal maps. Those counts are used to
form proportions (or likelihoods) and likelihood ratios (odds).
Numerous researchers have noted the need to leverage the power of learning analytics for
evaluating instructional designs (Gašević et al., 2015; Ifenthaler, 2017; Klein & Hess, 2019;
Mangaroska & Giannakos, 2019; Phillips & Ozogul, 2020). By explicitly designing the IPTAT
using FPI and showing that successful learners experienced more instances of instruction based
on FPI than unsuccessful learners, we have added support to Merrill’s hypothesis regarding the
effectiveness of FPI while also demonstrating how learning analytics (in the form of APT) can
be used to test instructional design theory. Recent reviews of learning analytics research have
noted the need to integrate education theories and learning analytics (Phillips & Ozogul, 2020;
Romero & Ventura, 2020; Wong et al., 2019), and the present study illustrates a pathway toward
“a synergistic relationship between instructional design and learning analytics” (Ifenthaler, 2017,
p. 202).
Conclusion
What’s New?
Frick et al. (2022) described Analysis of Patterns in Time as an innovative learning
analytics method to evaluate instructional effectiveness. They illustrated the use of Google
Analytics for doing APT on IPTAT website usage in 2019 and 2020. Specifically, they used
Universal Analytics (UA) tools to do the counting.
INNOVATIVE LEARNING ANALYTICS FOR EVALUATING EFFECTIVENESS OF FPI 33
The present study was conducted in early 2021, providing new data. More importantly,
our study utilized a newer version, referred to as Google Analytics 4 (GA4), to do both tracking
of user interactions with IPTAT in 2021 and for subsequent analytic procedures. To our
knowledge, this has never been done before in educational research.
We found similar patterns as did Frick et al. (2022). In this sense our study is a
replication. However, APT odds ratios were based on total pageviews, rather than unique
pageviews as did Frick et al. Odds ratios in our study were about five to one, whereas they were
between three and four to one in the earlier study. We further found smaller average engagement
times than did Frick et al., most likely explained by GA4’s more precise tracking methods, which
can detect when IPTAT was the user’s focus and excludes time spent using other apps when
switching away from IPTAT for short intervals of time.
Perhaps most important, we have demonstrated how GA4 can be used to do APT when
supplemented by additional spreadsheet computations. We have gone into considerable detail in
describing our methods, since they are likewise innovative, further extending those discovered
by Frick et al. (2022).
Overall IPTAT Success: Considerations for Future Studies
An additional question that we have not addressed thus far: Of those IPTAT users who
tried a Certification Test, what proportion passed one? This question is a bit tricky, because it
depends on the timeframe selected. There will be some students who registered for IPTAT and
tried Certification Tests during the timeframe, did not pass a CT in that interval, but may pass at
a later date. For example, a student could register on March 24, try a test, and not pass. This
student works on IPTAT tutorials, takes more tests, and finally passes one on April 15 on their
fourth attempt, spreading their effort over several weeks. This is an ultimately successful

INNOVATIVE LEARNING ANALYTICS FOR EVALUATING EFFECTIVENESS OF FPI 34
student, but who was not successful during the timeframe selected in a GA4 analysis, January 1
through March 25, 2021, and hence was counted in the ‘Not Pass’ segment. There were also
students who registered prior to the timeframe, for example, on December 28, 2020 and took
some tests and did tutorials, but did not pass a test until January 2. These students were
successful during the selected timeframe, but who did most of the work with IPTAT before that
timeframe.
Thus, we need to ask this question more carefully. Of those IPTAT users who tried a
Certification Test between January 1 and March 25, 2021, how many passed? We did a further
GA4 analysis and found that there were 56,511 students who tried one or more CTs during that
timeframe, and of those, 51,738 passed a CT. When segmenting in GA4, this is a subset
relationship. Those Active users who passed are a subset of those who attempted CTs (i.e., who
were segmented by “Test Feedback” conversions in their learning journeys—see Table 1). This
is an overall success rate of 91.6% according to GA4 tracking during this timeframe. However,
there could be students who did not pass a CT during that timeframe, but who pass at a later date.
If so, how long should we wait? We have observed some students who register for IPTAT at the
beginning of the semester but do not pass a CT until the end of the semester. We know also that
GA4 tracking results can be underestimates, as discussed above, and that some students use
multiple devices at different locations and who may be tracked as different active users in GA4.
If we use our MySQL records, we observe that 65,420 students successfully registered
for IPTAT, and we further know that 56,328 users passed one or more CTs during the same
timeframe (Jan. 1 through Mar. 25). From this perspective, 86.1% were successful who had
registered during this timeframe. We have included students who registered but did not pass
during that time frame, but who may later pass a CT afterwards—hence, they were considered
INNOVATIVE LEARNING ANALYTICS FOR EVALUATING EFFECTIVENESS OF FPI 35
unsuccessful during the selected timeframe. Those students were eventually successful, just not
in the timeframe in which we had segmented them.
And what about students who do not register with IPTAT and who never take any CTs?
They may do most of the tutorials and learn to recognize plagiarism, but we have no MySQL
records on them. From a GA4 perspective these kinds of students were included in the Not Pass
segment. We cannot separate those who may later intend to register to take CTs from those who
have no interest in passing a CT and never register for IPTAT. In any case, since they did not
register, IPTAT has no records of these users, whereas GA4 does track them.
Although relatively minor when there are such large numbers overall, these are some of
the limitations of the IPTAT analyses in the current summative evaluation study. In future
studies, users could be required to register for IPTAT before being allowed to do any of the
tutorials. It would also be possible to share IPTAT registration data with Google Analytics by
setting up GA4 tracking to make this possible. This, however, then raises a privacy issue for
IPTAT users who currently remain anonymous in GA4. IPTAT could be modified, as Frick and
Dagli (2016) suggested, so that it does all the tracking instead of leveraging Google Analytics to
do so. But then this would mean that further APT software would need to be developed in order
to do the kinds of analyses that we have done in this study with GA4. These are all possibilities,
but there are tradeoffs and considerable development expenses to consider. With such big data,
it is unlikely that these minor limitations would make a practical difference in the conclusions
reached. These observed patterns are further consistent with the Big Study done by Frick et al.
(2022), which was based on two years of IPTAT usage, and nearly two million temporal maps
with over 390,000 registered users, which in turn was consistent with usage patterns in the three
years before that.

INNOVATIVE LEARNING ANALYTICS FOR EVALUATING EFFECTIVENESS OF FPI 36
Final Remarks
Our goal has been to help students learn to recognize plagiarism. We have provided
IPTAT as a MOOC since 2002 at no charge to users. The current version of IPTAT has been
effective for about 92 percent of students who used it and tried the Certification Tests in early
2021. Students who passed a test selected and interacted with about five times as many IPTAT
webpages designed with First Principles of Instruction, when compared with those students who
had not passed. Student effort and engagement matter, and so do First Principles of Instruction.
Compliance with Ethical Standards
• Disclosure of potential conflicts of interest. The authors have no conflicts of interest to
declare that are relevant to the content of this article. This study was not funded. The
authors did not receive support from any organization for conducting this study.
• Research involving human participants and/or animals. This study has been approved
and granted exemption for human subjects research by the Indiana University
Institutional Review Board, Protocol No. 1304011238.
• Informed consent. No informed consent was required for this study by the Indiana
University Institutional Review Board, Protocol No. 1304011238. The Privacy Policy for
the Indiana University Plagiarism Tutorials and Tests is stated at
https://plagiarism.iu.edu/privacy.html. In compliance with the Privacy Policy, we share
only aggregate, non-personally identifiable information about participants in this study.

INNOVATIVE LEARNING ANALYTICS FOR EVALUATING EFFECTIVENESS OF FPI 37
References
Frick, T. W. (1983). Nonmetric temporal path analysis: An alternative to the linear models
approach for verification of stochastic educational relations [Unpublished doctoral
dissertation]. Indiana University Graduate School.
Frick, T. W. (1990). Analysis of patterns in time (APT): A method of recording and quantifying
temporal relations in education. American Educational Research Journal, 27(1), 180-
204.
Frick, T. W. (2019). Importance of educology for improving education systems. In J. M. Spector,
B. B. Lockee, & M. D. Childress (Eds.), Learning, Design, and Technology: An
International Compendium of Theory, Research, Practice and Policy: Systems thinking
and change. (E. G. Kowch, Vol. ed.). Springer. https://doi.org/10.1007/978-3-319-17727-
4_92-1
Frick, T. W. (2020). What should be the content for student learning? In B. Hokanson, G.
Clinton, A. Tawfik, A. Grincewicz, & M. Schmidt (Eds.), Educational technology
beyond content. Educational communications and technology: Issues and innovations,
(pp. 27-41). Springer. https://doi.org/10.1007/978-3-030-37254-5_3
Frick, T. W. (2021). Educology is interdisciplinary: What is it? Why do we need it? Why
should we care? In B. Hokanson, M. Exter, A. Grincewicz, M. Schmidt, & A. Tawfik
(Eds.), Intersections across disciplines: Interdisciplinarity and learning, (Chapter 3, pp.
27-42). Springer. https://doi.org/10.1007/978-3-030-53875-0_3
Frick, T. W., & Dagli, C. (2016). MOOCs for research: The case of the Indiana University
Plagiarism Tutorials and Tests. Technology, Knowledge and Learning, 21, 255-276.
https://doi.org/10.1007/s10758-016-9288-6

INNOVATIVE LEARNING ANALYTICS FOR EVALUATING EFFECTIVENESS OF FPI 38
Frick, T. W., Dagli, C., Kwon, K., & Tomita, K. (2018). Indiana University plagiarism tutorials
and tests: 14 years of worldwide learning online. In B. Hokanson, B. Clinton, & K.
Kaminski (Eds.), Educational technology and narrative: Story and instructional design,
(Chapter 16, pp. 191-205). Springer.
Frick, T. W., Myers, R. D., Dagli, C., & Barrett, A. F. (2022). Innovative learning analytics for
evaluating instruction: A big data roadmap to effective online learning. Routledge.
Frick, T., Myers, R., Thompson, K., & York, S. (2008). New ways to measure systemic change:
Map & Analyze Patterns & Structures Across Time (MAPSAT). Featured research paper
presented at the annual conference of the Association for Educational Communications &
Technology, Orlando, FL, United States.
https://www.indiana.edu/~tedfrick/MAPSATAECTOrlando2008.pdf
Frick, T. W., & Reigeluth, C. M. (1992, April). Verifying prescriptive instructional theory by
Analysis of Patterns in Time [Paper presentation]. The annual meeting of the American
Educational Research Association (AERA) San Francisco, CA, United States.
Gašević, D., Dawson, S., & Siemens, G. (2015). Let’s not forget: Learning analytics are about
learning. TechTrends, 59(1), 64-71. https://doi.org/10.1007/s11528-014-0822-x
Google Analytics 4 (2020). Meet the next generation of Google Analytics.
https://support.google.com/analytics/answer/10089681?hl=en
Greenwood, D. J., & Levin, M. (1998). Introduction to action research: Social research for
social change. SAGE.
Ifenthaler, D. (2017). Learning analytics design. In L. Lin & M. Spector (Eds.), The sciences of
learning and instructional design: Constructive articulation between communities (pp.
202-211). Routledge.

INNOVATIVE LEARNING ANALYTICS FOR EVALUATING EFFECTIVENESS OF FPI 39
Kirk, R. E. (1999). Statistics: An introduction (4th ed.). Harcourt Brace.
Kirk, R. E. (2013). Experimental design: Procedures for the behavioral sciences (4th ed.).
SAGE.
Klein, C., & Hess, R. M. (2019). Using learning analytics to improve student learning outcomes
assessment: Benefits, constraints, & possibilities. In J. Lester, C. Klein, A. Johri, & H.
Rangwala (Eds.), Learning analytics in higher education: Current innovations, future
potential, and practical applications (pp. 140-159). Routledge.
Mangaroska, K., & Giannakos, M. (2019). Learning analytics for learning design: A systematic
literature review of analytics-driven design to enhance learning. IEEE Transactions on
Learning Technologies, 12(4), 516-534. https://doi.org/10.1109/TLT.2018.2868673
Merrill, M. D. (2002). First principles of instruction. Educational Technology Research &
Development, 50(3), 43-59. https://doi.org/10.1007/BF02505024
Merrill, M. D. (2013). First principles of instruction: Identifying and designing effective,
efficient, and engaging instruction. Pfeiffer.
Merrill, M. D. (2020). M. David Merrill’s First Principles of Instruction. Association for
Educational Communications and Technology.
Myers, R. D., & Frick, T. W. (2015). Using pattern matching to assess gameplay. In C. S. Loh,
Y. Sheng, & D. Ifenthaler (Eds.), Serious games analytics: Methodologies for
performance measurement, assessment, and improvement, (Chapter 19, pp. 435-458).
Springer. https://doi.org/10.1007/978-3-319-05834-4_19
Phillips, T., & Ozogul, G. (2020). Learning analytics research in relation to educational
technology: Capturing learning analytics contributions with bibliometric analysis.
TechTrends, 64(6), 878-886. https://doi.org/10.1007/s11528-020-00519-y
INNOVATIVE LEARNING ANALYTICS FOR EVALUATING EFFECTIVENESS OF FPI 40
Reigeluth, C. M., & Frick, T. W. (1999). Formative research: a methodology for improving
design theories. In C. M. Reigeluth (Ed.), Instructional-Design Theories and Models: A
New Paradigm of Instructional Theories (Vol. II, pp. 633-651). Lawrence-Erlbaum.
Romero, C., & Ventura, S. (2020). Educational data mining and learning analytics: An updated
survey. Wiley Interdisciplinary Reviews: Data Mining and Knowledge Discovery, 10(3),
e1355. https://doi.org/10.1002/widm.1355
Schmitt, S. (1969). Measuring uncertainty. Addison-Wesley.
Scriven, M. (1967). The methodology of evaluation. In R. W. Tyler, R. M. Gagné, & M.
Scriven., (Eds.). Perspectives on curriculum evaluation (AERA monograph series on
curriculum evaluation no. 1, pp. 39-83). Rand McNally.
Steiner, E. (1988). Methodology of theory building. Educology Research Associates.
Tabachnick, B. G., & Fidell, L. S. (2018). Using multivariate statistics (7th ed.). Pearson.
Wong, J., Baars, M., de Koning, B. B., van der Zee, T., Davis, D., Khalil, M., & Paas, F. (2019).
Educational theories and learning analytics: From data to knowledge. In D. Ifenthaler, D.-
K. Mah, & J. Y.-K. Yau (Eds.), Utilizing learning analytics to support study success (pp.
3-25). Springer, Cham. https://doi.org/10.1007/978-3-319-64792-0_1
Worthen, B., & Sanders, J. (1987). Educational evaluation: Alternative approaches and
practical guidelines. Longman.


