
Munich Personal RePEc Archive
Innovation and FDI: Does the Target of
Intellectual Property Rights Matter?
Chen, Hung-Ju
National Taiwan University
25 June 2019
Online at https://mpra.ub.uni-muenchen.de/94692/
MPRA Paper No. 94692, posted 01 Jul 2019 15:19 UTC

1
Innovation and FDI:
Does the Target of Intellectual Property Rights Matter?
Hung-Ju Chen*
ABSTRACT
This paper develops a North-South product-cycle model with innovation and foreign direct investment
(FDI) to analyze the influences from strengthening intellectual property rights (IPR) protection.
Innovation occurs in the North while imitation happens in the South. Southern firms can imitate either
goods produced in the North or goods produced by multinationals in the South. We find that if the
target of strengthening IPR protection is Northern-produced goods, then such a policy change reduces
the innovation rate and raises the North-South relative wage in the long run. However, the effects on
the long-run innovation rate and the North-South relative wage reverse if its target is Southern-
produced goods by multinationals. As for the pattern of production, strengthening IPR protection
raises the long-run extents of FDI and Southern production imitating goods produced by
multinationals while reducing the long-run extents of Northern production and Southern production
imitating goods produced in the North, regardless of the target of stronger IPR protection. In addition
to examining the long-run effects of strengthening IPR protection, we also analyze its effects during
the transitional dynamics. The quantitative analysis indicates that the two strengthening-IPR-
protection policies cause welfare losses for both Northern and Southern consumers if we consider the
accumulated effects during the transitional dynamics.
Keywords: FDI; Imitation; Innovation; IPR; R&D.
JEL Classification: E52; F23; O31.
* Department of Economics, National Taiwan University, No. 1, Sec. 4, Roosevelt Road, Taipei 10617, Taiwan;
Tel.: 886-2-33668416; Fax: 886-2-23657957; e-mail: [email protected]. The author would like to thank Been-Lon
Chen and the participants at the 2019 Asian Meeting of Econometric Society in China for their comments and suggestions.
The financial support provided by the Ministry of Science and Technology of Taiwan (grant number: MOST-107-
2628-H-002-003) is gratefully acknowledged. The usual disclaimer applies.

2
1. INTRODUCTION
The approval of the Agreement on Trade-Related Aspects of Intellectual Property Rights (TRIPs)
under the Uruguay Round of negotiations based on the framework of the General Agreement on
Tariffs and Trade (GATT) has caused considerable discussion on the effects from the strengthening
of intellectual property rights (IPR) protection for both developed and developing countries. Since
then, studies have increased concerning the effects of strengthening IPR protection for both developed
and developing countries.
International production through foreign direct investment (FDI) is quite common nowadays due
to technological progress, which improves transportation and telecommunications. The availability of
FDI allows firms to choose to produce goods domestically or abroad, meaning strengthening IPR
protection in one country causes cross-country influences due to the adjustment of the production
pattern for firms in response to this policy change. It is commonly believed that such a policy can
benefit both developed and developing countries. For developed countries, stronger IPR protection
encourages innovation owing to the mitigation of imitation risk. Developing countries can benefit from
stronger IPR protection by attracting firms to produce in those countries. Increases in FDI activities
also have the added virtues of reducing the relative wage between the developed and the developing
countries and bringing cutting-edge technologies to the developing countries. Firms, at the same time,
can reduce production cost by shifting production from developed countries to developing countries.
However, some people argue against stronger IPR protection, since it is doubtful whether it actually
increases the rate of innovation and reduces the relative wage between developed and developing
countries at the same time. Moreover, they doubt whether both Northern and Southern consumers can
benefit from strengthening IPR protection.
Several studies have examined the effects of changes in IPR protection on innovation in
developed countries and pattern of production based on an R&D model with FDI. The early study of
Helpman (1993) develops a model where innovation occurs in developed countries and imitation
happens in developing countries to examine the effects of IPR protection when firms can undertake
production in developing countries through FDI. In his study, the innovation rate is assumed to be
exogenous; as a result, this study does not analyze the impact of the strengthening of IPR protection on
innovation. Due to dissatisfaction with the exogenous innovation rate, the Helpman (1993) model
subsequently undergoes various modifications in several studies where the innovation rate is
endogenously determined in order to examine the effects of IPR protection on innovation.
Based on a model where innovation raises the varieties of goods, Lai (1998) shows that both the
innovation rate and FDI will increase with strengthening IPR protection. However, based on a quality-
improvement (product-cycle) model with costly imitation, Glass and Saggi (2002) find the reverse
effects of stronger IPR protection on the rate of innovation and the extent of FDI due to labor wastage

3
and imitation tax effects if imitation is costly. Since R&D activities require high-skilled labor, Parello
(2008) and Chen (2015b, 2018) introduce human capital into an R&D model and endogenize the skill
choice of Northerners when examining the effects of strengthening IPR protection on innovation and
wage inequality in developed countries. Changes in IPR protection affect not only the pattern of
production, but also the demand of Northern skilled (unskilled) labor, which will in turn affect the
wage inequality in developed countries.
In this study we develop a dynamic quality-improvement general-equilibrium model.1 Our
model is made up of a North country (a developed country) in which innovation occurs and a South
country (a developing country) in which imitation happens. Innovation targets all types of goods and
improves their quality. Northern workers can work either in the R&D sector or in the production sector.
Northern firms choose either to carry out the entire production of the goods in the North or act as
multinational firms and produce goods in the South through FDI. Southern firms could imitate goods
produced in the North or goods produced by multinationals in the South at different (exogenous) rates.
Once Southern firms succeed at imitation, they are able to use the state-of-the-art technologies to
produce the highest quality products. We assume that the rate of imitation for goods produced by
multinationals in the South is higher than the rate of imitation for goods produced in the North due to
two reasons. First, developed countries usually have more comprehensive and complete IPR
protection than developing countries; second, it is easier for Southern firms to imitate domestic goods
(i.e. goods produced by multinationals in the South) than foreign goods (i.e. goods produced in the
North). Therefore, multinational firms can make products in the South at lower costs by taking
advantage of the lower Southern wage rate, but they face a higher risk of imitation by Southern firms.
We assume that the Northern standard of IPR protection determines the imitation rate of goods
produced in the North while the Southern standard of IPR protection decides the imitation rate of
goods produced by multinationals in the South.2 Therefore, depending on the target of IPR protection,
strengthening such protection is represented by a decrease in the rate of imitation for Northern-
produced goods or Southern-produced goods by multinationals. Our assumption that Southern firms
could imitate Northern-produced goods and Southern-produced goods by multinationals at different
rates allows us to analyze the influences of strengthening IPR protection for different targets of IPR
protection. Two scenarios of IPR protection policies are considered, with the first of these scenarios
involving IPR protection targeting Northern-produced goods. We find that increasing the Northern
1 The product-cycle model is originally considered by Vernon (1966) and subsequently developed by
Segerstrom, Anant and Dinopoulos (1990), Grossman and Helpman (1991a, 1991b, 1991c, 1991d), and Aghion
and Howitt (2009). 2 The Northern and Southern standards of IPR protection are also considered in Lin (2019). However, in his
study the Northern IPR standard determines the imitation rate of goods consumed exclusively in the North,
whereas the Southern IPR standard determines the imitation rate of goods consumed exclusively in the South.

4
standard of IPR protection raises the North-South relative wage and reduces the rate of innovation in
the long run. As regards the pattern of production, such a policy change will cause an increase in the
long-run extents of FDI and Southern production imitating Southern-produced goods by
multinationals, along with corresponding reductions in the long-run extents of Northern production
and Southern production imitating Northern-produced goods.
We show that welfare for Northern (Southern) consumers is positively correlated with the rate of
innovation and consumers’ expenditure in the North (South) and negatively correlated with the price
factor. Due to the model’s complexity, we are not able to analytically determine the effects of stronger
IPR protection on welfare for Northern (Southern) consumers. We thus conduct a numerical analysis
to evaluate the effects of stronger IPR protection on welfare. Following Grossman and Helpman
(1991), we first consider the effects of stronger IPR protection on the long-run (steady-state) welfare.
Although such a policy change raises the steady-state Northern (Southern) expenditure, which is
beneficial to Northern (Southern) welfare, it reduces the steady-state rate of innovation and raises the
steady-state price factor, both harmful to Northern (Southern) welfare. We find overall that such a
policy change generates welfare losses for both Northerners and Southerners.
Because our numerical analysis indicates that the speed of convergence is slow, changes in IPR
protection would affect economic variables for sustained periods of time so that their accumulated
effects during the transition from one equilibrium to another may therefore cause potentially large
impacts on welfare during the transition. We then take changes during the transitional dynamics into
consideration and re-examine welfare changes. We show that when considering welfare changes
during the transitional dynamics, strengthening the Northern standard of IPR protection will also cause
welfare losses for both Northerners and Southerners, but with much larger orders when comparing
changes in steady-state welfare.3
In the second scenario we consider the effects caused by strengthening the Southern standard of
IPR protection. In this scenario, strengthening the Southern standard of IPR protection is represented
by a reduction in the imitation risk for Southern-produced goods by multinationals. Since such a policy
motivates Northern firms to shift their production from the North to the South through FDI, the long-
run extent of FDI will increase. Furthermore, the demand for Northern labor will decrease while the
demand for Southern labor will increase, leading to a decrease in the North-South relative wage in the
long run. Because more Northern workers are released from the production sector and become
available for employment in the R&D sector, the long-run rate of innovation will increase. As regards
3 Our quantitative analysis suggests that regarding steady-state welfare, a decrease in the imitation rate for
Northern-produced goods from 5% to 4.75% (a 5% decrease) will respectively cause decreases in the steady-state
welfare for Northerners and Southerners by 1.21% and 18.41% in consumption equivalence. If we take
transitional dynamics into account, such a policy change will generate welfare losses in the order of 62.44% for
Northerners and 62.49% for Southerners in consumption equivalence.

5
the pattern of production, the strengthening of IPR protection will cause reductions in the long-run
extents of Northern production and Southern production imitating Northern-produced goods.
However, the change in the long-run extent of Southern production imitating Southern-produced
goods by multinationals is ambiguous.
Concerning steady-state welfare, our numerical analysis indicates that although strengthening
IPR protection on goods produced in the South raises the steady-state innovation rate, which is
beneficial to welfare, it also raises the steady-state price factor, which is harmful to welfare. The
steady-state Northern consumers’ expenditure will decrease while the steady-state Southern
consumers’ expenditure will increase. We find that there will be welfare gains for both Northern and
Southern consumers. However, if we take the transitional dynamics into account, then the results of
welfare reverse and such a policy change will generate welfare losses for both Northern and Southern
consumers.4 This finding highlights the tradeoffs involved for economic performance induced by
strengthening IPR protection, especially innovation and welfare. Moreover, when examining the
effects of stronger IPR protection on welfare, the results would be misleading if we only consider its
effects at the steady state and do not take the transitional dynamics into consideration.
Our findings cast doubt on the common belief that strengthening IPR protection could raise the
rate of innovation and FDI activities as well as benefit consumers both in developed and developing
countries. We show that strengthening IPR protection may not necessarily raise the rate of innovation
and that the target of stronger IPR protection plays an important role when determining the effects of
IPR protection on the rate of innovation. While increasing the Northern standard of IPR protection
reduces the innovation rate, increasing the Southern standard of IPR protection raises it. But both
policies raise the extent of FDI. Our findings about the long-run effects of stronger IPR protection on
innovation and FDI activities are different from those found by Lai (1998) and Glass and Saggi (2002).
Regarding welfare, both policies generate welfare losses for Northern and Southern consumers if we
consider the accumulated effects during the transitional dynamics.
Since previous studies of R&D have demonstrated that the stability of the steady-state
equilibrium of an R&D model is sensitive to the model setting, we also examine the stability of the
steady-state equilibrium under each scenario in this paper.5 As summarized in Table 1, in addition to
the target of imitation, which is the focus of this paper, the target of innovation is also the focus in the
literature of IPR protection. Glass and Wu (2007) introduce costless imitation into a product-cycle
model and find that the target of innovation matters when analyzing the effects of stronger IPR
protection on innovation rate and FDI. They show that stronger IPR protection will reduce both
4 Our quantitative analysis suggests that regarding steady-state welfare, a decrease in the imitation rate for
Northern-produced goods by multinationals from 25% to 23.75% (a 5% decrease) will respectively cause increases
in the steady-state welfare for Northerners and Southerners by 52.48% and 28.69% in consumption equivalence.
If we take transitional dynamics into account, such a policy change will generate welfare losses in the order of
56.09% for Northerners and 55.19% for Southerners in consumption equivalence. 5 An early study that examines the stability of the steady-state equilibrium in an R&D model can be found in
Tanaka, Iwaisako and Futagami (2007). In their study, they consider a product-cycle model with international
transfer of technology through licensing.

6
innovation intensity and the extent of FDI in a model with inefficient followers where innovation targets
only imitated products; however, stronger IPR protection will cause reverse effects on the innovation
rate and the extent of FDI in a model with efficient followers where innovation targets all types of
products.
Tanaka and Iwaisako (2014) find that the steady-state equilibrium is not attainable in a product-
cycle model with inefficient followers and then introduce government subsidies for R&D and FDI and
show that the steady state will become achievable if the subsidy rates are sufficiently high.
Furthermore, if the interior steady state is stable, then stronger IPR protection promotes both
innovation rate and FDI, which are opposite to the results found by Glass and Wu (2007), indicating
that the effects of strengthening IPR protection are also sensitive to the model setting. By modifying
our model to allow imitation targeting only Southern-produced goods by multinationals, our model
can be returned to the model of Glass and Wu (2007) with efficient followers. We show that the
economy will attain a stable steady-state equilibrium. Thus, our finding suggests that allowing
innovation to target all types of goods (efficient followers) is another way to obtain a stable steady-
state equilibrium. However, one should be careful when drawing results based on a product-cycle
model with inefficient followers.
The remainder of this paper is organized as follows. In the next section, we develop a product-
cycle model with innovation and FDI, derive the steady-state equilibrium, and analyze the stability
condition of the steady-state equilibrium. Section 3 derives the steady state and also analyzes its
stability property. Section 4 examines the effects of increasing the Northern (Southern) standard of
IPR protection on key variables and the social welfare for Northern and Southern consumers under
each type of IPR protection. A numerical analysis is also provided in this section. The final section
concludes.
2. THE MODEL
We develop a product-cycle model composed of a developed Northern country (N) and a developing
Southern country (S). There is no population growth in both countries and there are 𝐿𝑘 (𝑘 = {𝑁, 𝑆})
agents in country 𝑘. In every period, each agent in country 𝑘 is endowed with one unit of time, and
she spends all of the time at work to earn the wage 𝑤𝑘(𝑡). We normalize the Southern wage rate
(𝑤𝑆(𝑡)) to 1. This implies that the North-South relative wage, which is measured by the ratio of the
Northern wage rate to the Southern wage rate, is equal to 𝑤𝑁(𝑡).
2.1. Consumers
There is a continuum of products 𝑧 ∈ [0,1] available at different quality levels (𝑗). Each quality level
‘𝑗’ is better than quality level ‘𝑗 − 1’ by 𝜆 times, where the size of the quality increment 𝜆 is

7
constant and 1 < 𝜆 < 2.6 All products begin at time 𝑡 = 0 with a quality level 𝑗 = 0 and a base
quality 𝜆0 = 1. Therefore, each product of quality 𝑗 provides quality 𝑥𝑗(𝑧) = 𝜆𝑗.
Let 𝑞𝑘𝑗(𝑧, 𝑡) denote consumption in country 𝑘 for quality level 𝑗 of product z at time 𝑡. For
the representative consumer in country 𝑘, the total expenditure (𝐸𝑘(𝑡)) for all products with different
quality levels under price 𝑝𝑘𝑗(𝑧, 𝑡) is:
𝐸𝑘(𝑡) = ∫ [∑ 𝑝𝑘𝑗(𝑧, 𝑡)𝑞𝑘𝑗(𝑧, 𝑡)𝑗 ] 𝑑𝑧.10 (1)
Let 𝐴𝑘(0) and 𝑊𝑘(0) respectively denote the value of assets that the household holds and the sum
of the discount wage income of the household at time 𝑡 = 0 in country 𝑘. The cumulative interest
rate, up to time t, is given by 𝑅(𝑡) = ∫ 𝑟(𝜏)𝑑𝜏𝑡0 , where 𝑟(𝜏) is the instantaneous real interest rate at
time 𝜏. The intertemporal budget constraint is: ∫ 𝐸𝑘(𝑡)𝑒−𝑅(𝑡)𝑑𝑡∞
0 ≤ 𝐴𝑘(0) + 𝑊𝑘(0). (2)
Consumers care about both the quantity and quality of goods. The instantaneous utility faced by
a representative consumer in country 𝑘 is:
𝑙𝑜𝑔 𝑢𝑘 (𝑡) = ∫ log [∑ 𝑥𝑗(𝑧)𝑞𝑘𝑗(𝑧, 𝑡)𝑗 ]10 𝑑𝑧. (3)
Let 𝜌 represent the subjective discount factor. The lifetime utility of the representative consumer in
country 𝑘 is: 𝑈𝑘(0) = ∫ 𝑒−𝜌𝑡 𝑙𝑜𝑔 𝑢𝑘(𝑡) 𝑑𝑡.∞
0 (4)
The consumer’s problem is solved by three steps. First, when considering the within-industry
static optimization problem, consumers are willing to pay 𝜆 for a single quality-level improvement
in a product; that is, consumers choose the quality that gives the lowest adjusted price, 𝑝𝑗(𝑧,𝑡)𝑥𝑗(𝑧) . Second,
consumers choose an expenditure across all products that is the same, because the elasticity of
substitution between any two products is constant at unity. Let 𝐸(𝑡) = 𝐸𝑁(𝑡)𝐿𝑁 + 𝐸𝑆(𝑡)𝐿𝑆 represent
global expenditure. This results in a demand function for product 𝑧 of quality 𝑗 at time 𝑡 in country 𝑘 equal to 𝑞𝑘𝑗(𝑧, 𝑡) = 𝐸𝑘(𝑡)/𝑝𝑗(𝑧, 𝑡). Finally, consumers maximize lifetime utility subject to the
inter-temporal budget constraint to allocate lifetime wealth across time. This leads to the optimal
expenditure path for the representative consumer in each country:
6 The assumption of 1 < 𝜆 < 2 is in line with empirical findings that a markup over the marginal/average
cost is positive, but less than 100%.

8
�̇�𝑘(𝑡)𝐸𝑘(𝑡) = 𝑟(𝑡) − 𝜌. (5)
2.2. Producers
Innovation occurs only in the North. Northern firms hire Northern workers for R&D. Let 𝑣𝑁(𝑡)
represent the expected discounted value of a Northern firm that has successfully improved a product
by one higher quality level. Let 𝜙𝑅(𝑧, 𝑡) denote the rate of innovation. A Northern firm in industry 𝑧 will achieve one level of quality improvement in the final product with a probability 𝜙𝑅(𝑧, 𝑡)𝑑𝑡
for a time interval 𝑑𝑡. In order to achieve this, 𝑎𝑅𝜙𝑅(𝑧, 𝑡)𝑑𝑡 units of labor are required at a cost of 𝑤𝑁(𝑡)𝑎𝑅𝜙𝑅(𝑧, 𝑡)𝑑𝑡. To generate a finite rate of innovation, the expected gains from innovation cannot
exceed the costs:
𝑣𝑁(𝑡) ≤ 𝑎𝑅𝑤𝑁(𝑡), with equality being achieved when innovation occurs with positive intensity: 𝑣𝑁(𝑡) = 𝑎𝑅𝑤𝑁(𝑡) ⟺ 𝜙𝑅(𝑧, 𝑡) > 0. (6)
We assume that one unit of labor is required to produce one unit of the final product in the North
or in the South. The cost of firms producing one unit of goods in the North is then 𝑤𝑁, and the cost of
firms completing one unit of production in the South is 𝑤𝑆 = 1. After succeeding at innovating a
higher-level quality product, a Northern firm can hire Northern workers to produce goods in the North
or undertake its production in the South through FDI, lowering its costs by hiring Southern workers.
Let 𝑣𝐹(𝑧, 𝑡) represent capital gains from undertaking production in the South through FDI.
Following Glass and Wu (2007) and Tanaka and Iwaisako (2014), we assume that FDI does not incur
any cost. A Northern firm will feel then indifferent between producing in the North or in the South if:
𝑣𝐹(𝑡) = 𝑣𝑁(𝑡). (7)
Old technologies in which the designs have been improved are available internationally, so that
Southern firms are able to produce final goods by using old technologies. Firms face Bertrand
competition. Northern firms, which produce through the use of state-of-the-art technologies possessing
one quality-level lead over their closest rivals will charge the price 𝑝(𝑡) = 𝜆 in order to just prevent
their closest rivals from earning positive profits.
Let 𝛱𝑁(𝑡) and 𝛱𝐹(𝑡) denote the instantaneous profits for Northern production and FDI,
respectively. The instantaneous profits for Northern production are: 𝛱𝑁(𝑡) = 𝐸(𝑡)𝜆 [𝜆 − 𝑤𝑁(𝑡)]. (8)
The instantaneous profits for multinational firms are:

9
𝛱𝐹(𝑡) = 𝐸(𝑡)𝜆 (𝜆 − 1). (9)
Southern firms can imitate either Northern-produced goods at a rate of 𝜙𝑆𝑁 or Southern-
produced goods by multinationals at a rate of 𝜙𝑆𝐹. After succeeding at imitating a higher-level quality
product, a Southern firm is able to capture the entire industry market by setting a price at 1 that is
lower than 𝜆. Because of the following two reasons, we assume that the imitation rate of goods
produced in the North is smaller than that of goods produced in the South; that is, 𝜙𝑆𝑁 < 𝜙𝑆𝐹. First,
it is easier for Southern firms to imitate Southern-produced (domestic) goods than Northern-produced
(foreign) goods. Second, developed countries usually have stricter IPR protection than developing
countries, so that goods produced in the North are more protective. This implies that multinational
firms can earn higher profits by charging the price 𝑝(𝑡) = 𝜆 and hiring Southern workers for
production; however, they also face a higher rate of imitation. Depending on its target, strengthening
IPR protection is represented by a decrease in 𝜙𝑆𝑁 or 𝜙𝑆𝐹.
The no-arbitrage condition that determines 𝑣𝑁(𝑡) is: 𝑟(𝑡) = �̇�𝑁(𝑡) + 𝛱𝑁(𝑡) − [𝜙𝑅(𝑡) + 𝜙𝑆𝑁]𝑣𝑁(𝑡)𝑣𝑁(𝑡) . (10)
Equation (10) equates the real interest rate to the asset return per unit of asset for Northern production.
The asset return includes (i) any potential capital gains (�̇�𝑁(𝑡)); (ii) profits from successful innovation
(𝛱𝑁(𝑡) ); (iii) the expected capital loss from creative destruction (−𝜙𝑅(𝑡)𝑣𝑁(𝑡)) ; and (iv) the
expected capital loss from imitation (−𝜙𝑆𝑁𝑣𝑁(𝑡)).
The no-arbitrage condition that determines 𝑣𝐹(𝑡) is: 𝑟(𝑡) = �̇�𝐹(𝑡) + 𝛱𝐹(𝑡) − [𝜙𝑅(𝑡) + 𝜙𝑆𝐹]𝑣𝐹(𝑡)𝑣𝐹(𝑡) . (11)
Equation (11) equates the real interest rate to the asset return per unit of asset for multinational firms.
The asset return is the sum of (i) any potential capital gains (�̇�𝐹(𝑡)); (ii) profits from successful
imitation (𝛱𝐹(𝑡)); (iii) the expected capital loss from creative destruction (−𝜙𝑅(𝑡)𝑣𝐹(𝑡)); and (iv)
the expected capital loss from imitation (−𝜙𝑆𝐹𝑣𝐹(𝑡)).
2.3. Type of industry
Let 𝑛𝑁(𝑡), 𝑛𝐹(𝑡), 𝑛𝑆𝑁(𝑡), and 𝑛𝑆𝐹(𝑡) respectively denote the extent of Northern production (the
proportion of products produced completely in the North), the extent of FDI (the proportion of the
goods for which production is carried out through FDI), the extent (proportion) of Southern production
imitating Northern-produced goods, and the extent (proportion) of Southern-produced goods by
multinationals. The extent of Southern production by imitation is thus defined as 𝑛𝑆(𝑡) = 𝑛𝑆𝑁(𝑡) +𝑛𝑆𝐹(𝑡). The sum of these product measures equals one:
𝑛𝑁(𝑡) + 𝑛𝐹(𝑡) + 𝑛𝑆𝑁(𝑡) + 𝑛𝑆𝐹(𝑡) = 1. (12)

10
The law of motion of 𝑛𝑆𝑁(𝑡) is governed by the following equation:
�̇�𝑆𝑁(𝑡) = 𝜙𝑆𝑁𝑛𝑁(𝑡) − 𝜙𝑅(𝑡)𝑛𝑆𝑁(𝑡). (13)
Equation (13) indicates that the change in the extent of Southern production imitating Northern-
produced goods equals the flows going into Southern production imitating Northern-produced goods
minus the flows coming out of it due to innovation.
Similarly, the change in the extent of Southern production imitating goods produced by
multinationals equals the flows going into Southern production imitating goods produced by
multinationals in the South minus the flows coming out of it due to innovation. This implies that the
law of motion of 𝑛𝑆𝐹(𝑡) is governed by the following equation:
�̇�𝑆𝐹(𝑡) = 𝜙𝑆𝐹𝑛𝐹(𝑡) − 𝜙𝑅(𝑡)𝑛𝑆𝐹(𝑡). (14)
Combining (13) and (14), we derive the law of motion for the extent of Southern production by
imitation as:
�̇�𝑆(𝑡) = 𝜙𝑆𝑁𝑛𝑁(𝑡) + 𝜙𝑆𝐹𝑛𝐹(𝑡) − 𝜙𝑅(𝑡)𝑛𝑆(𝑡). (15)
2.4. Labor market
Northern firms hire Northern workers for innovation and production. The labor-market-clearing
condition for Northern labor is therefore: 𝑎𝑅𝜙𝑅(𝑡) + 𝑛𝑁(𝑡) 𝐸(𝑡)𝜆 = 𝐿𝑁 . (16)
Multinational firms and Southern firms hire Southern workers for production. The labor-market-
clearing condition for Southern labor is therefore: [𝑛𝐹(𝑡) + 𝜆(𝑛𝑆𝐹(𝑡) + 𝑛𝑆𝑁(𝑡))] 𝐸(𝑡)𝜆 = 𝐿𝑆. (17)
2.5. Welfare
Using 𝑞𝑘𝑗(𝑧, 𝑡) = 𝐸𝑘(𝑡)/𝑝𝑗(𝑧, 𝑡), we express the instantaneous utility as: log 𝑢𝑘(𝑡) = log𝐸𝑘(𝑡) − ∫ log𝑝𝑗(𝑧, 𝑡)𝑑𝑧10 + log(𝜆) ∫ 𝑥𝑗(𝑧)𝑑𝑧1
0 . Because the expected number of innovations arriving in period t is 𝑡𝜙𝑅(𝑡), the instantaneous utility
becomes:7 log 𝑢𝑘(𝑡) = log𝐸𝑘(𝑡) − ∫ log𝑝𝑗(𝑧, 𝑡)𝑑𝑗10 + 𝑡𝜙𝑅(𝑡)log(𝜆).
7 See Grossman and Helpman (1991d) for more details.

11
Since consumers pay the price of 𝜆 for goods produced by Northern firms in the North and by
multinationals in the South and pay the price of 1 for goods produced by Southern firms, the price
factor is:8 𝑃𝑡 = ∫ log𝑝𝑗(𝑧, 𝑡)𝑑𝑗10 = [𝑛𝑁(𝑡) + 𝑛𝐹(𝑡)]log𝜆 + 𝑛𝑆(𝑡)log1 = [1 − 𝑛𝑆(𝑡)]log𝜆.
Note that the price factor positively depends on the extent of Northern production and the extent of
FDI, but negatively depends on the extent of Southern production. Therefore, the instantaneous utility
can be written as: log 𝑢𝑘(𝑡) = log𝐸𝑘(𝑡) − (1 − 𝑛𝑆(𝑡))log𝜆 + 𝑡𝜙𝑅(𝑡)log𝜆. (18)
Substituting (18) into (4), we then derive the lifetime utility of consumers which represents welfare
for consumers living in country 𝑘.
3. STEADY-STATE EQUILIBRUM AND SOCIAL WELFARE
We assume that the Northern standard of IPR protection determines the imitation rate of goods
produced in the North, while the Southern standard of IPR protection decides the imitation rate of
goods produced by multinationals in the South. This section first derives the steady-state equilibrium
and examines its stability and then calculates the steady-state social welfare.
3.1. The steady-state equilibrium
We use variables with an upper bar to denote the steady-state values of the corresponding variables.
Since �̇�𝑘(𝑡)𝐸𝑘(𝑡) = 𝑟(𝑡) − 𝜌, we then have:
�̇�(𝑡)𝐸(𝑡) = 𝑟(𝑡) − 𝜌. (19)
At the steady state, �̇�(𝑡)𝐸(𝑡) = �̇�𝑁(𝑡) = �̇�𝐹(𝑡) = 0 and 𝑟(𝑡) = 𝜌. The no-arbitrage conditions of
(10) and (11) can then be expressed as: 𝑣𝑁 = 𝛱𝑁𝜌 + 𝜙𝑅 + 𝜙𝑆𝑁 , (20)
𝑣𝐹 = 𝛱𝐹𝜌 + 𝜙𝑅 + 𝜙𝑆𝐹 . (21)
Substituting (6) and (8) into (20) gives us: �̅�𝜆 (𝜆 − 𝑤𝑁) = (𝜌 + 𝜙𝑅 + 𝜙𝑆𝑁)𝑎𝑅𝑤𝑁. (22)
8 See Tanaka and Iwaisako (2014).

12
Substituting (6), (7), and (9) into (21) yields: �̅�𝜆 (𝜆 − 1) = (𝜌 + 𝜙𝑅 + 𝜙𝑆𝐹)𝑎𝑅𝑤𝑁. (23)
At the steady-state equilibrium, the flows going into Southern production equal the flows coming out
of it - that is, �̇�𝑆(𝑡) = 0. Thus, (15) indicates:
𝜙𝑆𝑁�̅�𝑁 + 𝜙𝑆𝐹�̅�𝐹 = 𝜙𝑅�̅�𝑆. (24)
The steady-state equilibrium is characterized by (12), (16), (17), and (22)-(24) with six variables {𝑤𝑁, �̅�, �̅�𝑁, �̅�𝐹 , �̅�𝑆, 𝜙𝑅}.9 We are now ready to calculate the steady state. Combining (22) and (23), we
express the steady-state Northern wage (𝑤𝑁) as a function of the steady-state rate of innovation (𝜙𝑅): 𝑤𝑁 = 𝑤𝑁(𝜙𝑅; 𝜙𝑆𝑁, 𝜙𝑆𝐹) = 𝜌 + 𝜙𝑅 + 𝜆𝜙𝑆𝐹 − (𝜆 − 1)𝜙𝑆𝑁𝜌 + 𝜙𝑅 + 𝜙𝑆𝐹 . (25)
Combining (22) and (25), we express the steady-state global expenditure (�̅�) as a function of 𝜙𝑅: �̅�(𝜙𝑅; 𝜙𝑆𝑁, 𝜙𝑆𝐹) = 𝜆𝑎𝑅[𝜆𝜙𝑆𝐹 − (𝜆 − 1)𝜙𝑆𝑁 + 𝜌 + 𝜙𝑅]𝜆 − 1 .
Appendix A shows that besides 𝑤𝑁 and �̅�, variables {�̅�𝑁, �̅�𝐹 , �̅�𝑆} also can be expressed as
functions of 𝜙𝑅 ; that is, �̅�𝑁 = �̅�𝑁(𝜙𝑅; 𝜙𝑆𝑁 , 𝜙𝑆𝐹) , �̅�𝐹 = �̅�𝐹(𝜙𝑅; 𝜙𝑆𝑁 , 𝜙𝑆𝐹) , and �̅�𝑆 =�̅�𝑆(𝜙𝑅; 𝜙𝑆𝑁, 𝜙𝑆𝐹). Using 12), we replace (�̅�𝑆𝑁 + �̅�𝑆𝐹) by (1 − �̅�𝑁 − �̅�𝐹) in the market-clearing
condition for Southern labor (equation(17)) and derive: 𝑓(𝜙𝑅; 𝜙𝑆𝑁, 𝜙𝑆𝐹) = 𝐿𝑆 , (26)
where 𝑓(𝜙𝑅; 𝜙𝑆𝑁, 𝜙𝑆𝐹) = [𝜆(1 − �̅�𝑁(𝜙𝑅; 𝜙𝑆𝑁 , 𝜙𝑆𝐹)) − (𝜆 − 1)�̅�𝐹(𝜙𝑅; 𝜙𝑆𝑁 , 𝜙𝑆𝐹)] �̅�(𝜙𝑅;𝜙𝑆𝑁,𝜙𝑆𝐹)𝜆 .
Equation (26) is used to implicitly solve for 𝜙𝑅. Appendix A also shows that if 𝜌𝜆−1 < 𝜙𝑆𝑁, then
𝜕𝑓(𝜙𝑅;𝜙𝑆𝑁,𝜙𝑆𝐹)𝜕𝜙𝑅 > 0, indicating that 𝑓(𝜙𝑅; 𝜙𝑆𝑁 , 𝜙𝑆𝐹) is an increasing function in 𝜙𝑅 . Since 𝜙𝑅 ∈(0,1), the solution of 𝜙𝑅 will exist if 𝑓(0; 𝜙𝑆𝑁 , 𝜙𝑆𝐹) < 𝐿𝑆 < 𝑓(1; 𝜙𝑆𝑁 , 𝜙𝑆𝐹).10 Therefore, there
will exist a unique solution of 𝜙𝑅 if the following two conditions hold.
Condition (P1) 𝜌𝜆−1 < 𝜙𝑆𝑁.
Condition (P2) 𝑓(0; 𝜙𝑆𝑁 , 𝜙𝑆𝐹) < 𝐿𝑆 < 𝑓(1; 𝜙𝑆𝑁 , 𝜙𝑆𝐹).
9 See Appendix A for details of calculation.
10 Note that 𝑓(0; 𝜙𝑆𝑁 , 𝜙𝑆𝐹) = [𝜆𝜙𝑆𝐹−(𝜆−1)𝜙𝑆𝑁][𝜆𝑎𝑅𝜙𝑆𝐹−(𝜆−1)𝐿𝑁]+𝜌𝜆𝑎𝑅𝜙𝑆𝐹(𝜆−1)𝜙𝑆𝐹 and 𝑓(1; 𝜙𝑆𝑁 , 𝜙𝑆𝐹) =[𝜆𝜙𝑆𝐹−(𝜆−1)𝜙𝑆𝑁+1][𝑎𝑅(1+𝜆𝜙𝑆𝐹)−(𝜆−1)(𝐿𝑁−𝑎𝑅)]+𝜌𝑎𝑅(1+𝜆𝜙𝑆𝐹)(𝜆−1)(1+𝜙𝑆𝐹) .

13
Once one derives the solution of 𝜙𝑅, the remaining variables {𝑤𝑁, �̅�, �̅�𝑁 , �̅�𝐹 , �̅�𝑆} can be solved
accordingly. Note that at the steady-state equilibrium, the flows going into 𝑛𝑆𝑁(𝑡) and 𝑛𝑆𝐹(𝑡) equal
the flows coming out of them - that is, �̇�𝑆𝑁(𝑡) = �̇�𝑆𝐹(𝑡) = 0. Thus, (13) and (14) indicate:
𝜙𝑆𝑁�̅�𝑁 = 𝜙𝑅�̅�𝑆𝑁, (27)
𝜙𝑆𝐹�̅�𝐹 = 𝜙𝑅�̅�𝑆𝐹. (28)
Using (27) and (28), we respectively derive �̅�𝑆𝑁 and �̅�𝑆𝐹 as �̅�𝑆𝑁 = 𝜙𝑆𝑁�̅�𝑁𝜙𝑅 and �̅�𝑆𝐹 = 𝜙𝑆𝐹�̅�𝐹𝜙𝑅 .
3.2. Stability of the steady-state equilibrium
In the following analysis we derive the dynamical system, which characterizes the dynamic behavior
of the economy, and then examine the stability of the steady-state equilibrium.11 Appendix B shows
that 𝐸(𝑡) can be expressed as a function of 𝑤𝑁(𝑡). Moreover, we present that 𝜙𝑅(𝑡), 𝑛𝑁(𝑡), and 𝑛𝐹(𝑡) can be expressed as functions of 𝑤𝑁(𝑡)and 𝑛𝑆(𝑡) ; that is, 𝐸(𝑡) = 𝐸(𝑤𝑁(𝑡)) , 𝜙𝑅(𝑡) =𝜙𝑅(𝑤𝑁(𝑡), 𝑛𝑆(𝑡)) , 𝑛𝑁(𝑡) = 𝑛𝑁(𝑤𝑁(𝑡), 𝑛𝑆(𝑡)) , and 𝑛𝐹(𝑡) = 𝑛𝐹(𝑤𝑁(𝑡), 𝑛𝑆(𝑡)) . During the
transitional dynamics, the real interest rate 𝑟(𝑡) changes over time, and its dynamic behavior can be
characterized by the following function in 𝑤𝑁(𝑡)and 𝑛𝑆(𝑡): 𝑟(𝑡) = 𝑟(𝑤𝑁(𝑡), 𝑛𝑆(𝑡))
= 1𝑤𝑁(𝑡) [(𝜙𝑆𝐹 − 𝜙𝑆𝑁)(𝜆 − 𝑤𝑁(𝑡))𝑤𝑁(𝑡) − 1 − 𝜙𝑅(𝑤𝑁(𝑡), 𝑛𝑆𝑁(𝑡), 𝑛𝑆𝐹(𝑡)) − 𝜙𝑆𝑁 + 𝜌(𝑤𝑁(𝑡) − 1)]. (29)
From the no-arbitrage condition that determines 𝑣𝑁(𝑡) (equation (10)), we derive the
relationship between 𝑟(𝑡) and 𝑣𝑁(𝑡) as: �̇�𝑁(𝑡)𝑣𝑁(𝑡) = 𝑟(𝑡) − (𝜙𝑆𝐹 − 𝜙𝑆𝑁)(𝜆 − 𝑤𝑁(𝑡))𝑤𝑁(𝑡) − 1 + 𝜙𝑅(𝑡) + 𝜙𝑆𝑁.
Equation (6) indicates that 𝑤�̇�(𝑡)𝑤𝑁(𝑡) = �̇�𝑁(𝑡)𝑣𝑁(𝑡). Next we use (6) and (10) to derive the law of motion of 𝑤𝑁(𝑡) as: 𝑤�̇�(𝑡) = (𝜌 + 𝜙𝑆𝐹)𝑤𝑁(𝑡) + (𝑤𝑁(𝑡) − 1)𝜙𝑅(𝑤𝑁(𝑡), 𝑛𝑆(𝑡)) − 𝜆𝜙𝑆𝐹 + 𝜙𝑆𝑁(𝜆 − 1) − 𝜌. (30)
Equation (15) indicates that the law of motion of 𝑛𝑆(𝑡) is governed by the following equation:
�̇�𝑆(𝑡) = 𝜙𝑆𝑁𝑛𝑁(𝑤𝑁(𝑡), 𝑛𝑆(𝑡)) + 𝜙𝑆𝐹𝑛𝐹(𝑤𝑁(𝑡), 𝑛𝑆(𝑡)) − 𝜙𝑅(𝑤𝑁(𝑡), 𝑛𝑆(𝑡))𝑛𝑆(𝑡). (31)
The dynamical system of the economy is represented by (30) and (31) in {𝑤𝑁(𝑡), 𝑛𝑆(𝑡)}.
Linearizing (30) and (31) at the steady state yields:
11 See Appendix B for details of calculation.

14
[𝑤�̇�(𝑡)�̇�𝑆(𝑡) ] = [𝑑11 𝑑12𝑑21 𝑑22] [𝑤𝑁(𝑡) − 𝑤𝑁𝑛𝑆(𝑡) − �̅�𝑆 ], where 𝐽 = [𝑑11 𝑑12𝑑21 𝑑22] is the Jacobian matrix of this dynamical system evaluated at the steady-state
values of (𝑤𝑁, �̅�𝑆) with 𝑑11 = 𝜌 + 𝜙𝑅 + 𝜙𝑆𝐹 − (𝜙𝑆𝐹−𝜙𝑆𝑁)[1+(𝜆−1)�̅�𝑆]𝑤𝑁−1 , 𝑑12 = (𝜙𝑆𝐹 − 𝜙𝑆𝑁)𝑤𝑁(𝜆 −1) , 𝑑21 = 𝐿𝑆𝑎𝑅𝑤𝑁2 + (𝜙𝑆𝐹−𝜙𝑆𝑁)[1+(𝜆−1)�̅�𝑆]�̅�𝑆(𝑤𝑁−1)2 , and 𝑑22 = −𝜆(𝜙𝑆𝐹 − 𝜙𝑆𝑁) − 𝜙𝑅 − 𝜙𝑆𝑁 −(𝜙𝑆𝐹−𝜙𝑆𝑁)𝑤𝑁(𝜆−1)�̅�𝑆𝑤𝑁−1 .
Let 𝜂1 and 𝜂2 represent the two eigenvalues calculated from the Jacobian matrix (𝐽). Because 𝑛𝑆(𝑡) is a state variable and 𝑤𝑁(𝑡) is a jump variable, then the steady-state equilibrium is stable if
one eigenvalue is negative and one eigenvalue is positive, implying that the determinant of the
Jacobian matrix is negative. This requires that 𝜂1𝜂2 = 𝐷𝑒𝑡(𝐽) = 𝑑11𝑑22 − 𝑑12𝑑21 < 0 , which
generates the following condition.
Condition (P3) (𝜆 − 1) {𝜌�̅�𝑆 + (𝜙𝑆𝐹−𝜙𝑆𝑁)𝐿𝑆𝑎𝑅[𝜌+𝜙𝑅+𝜆𝜙𝑆𝐹−(𝜆−1)𝜙𝑆𝑁]} > (2 − 𝜆)[𝜙𝑅 + 𝜆𝜙𝑆𝐹 − (𝜆 − 1)𝜙𝑆𝑁]. We thus have the following proposition.
Proposition 1. There exists a unique non-trivial steady state that is a saddle point if conditions (P1)-
(P3) hold.
We hereafter assume that conditions (P1)-(P3) are satisfied in the rest of the paper. Let 𝜂1 and 𝜂2 respectively represent the negative and positive eigenvalues. The paths for 𝑤𝑁(𝑡) and 𝑛𝑆(𝑡) are
characterized by: 𝑤𝑁(𝑡) = 𝑤𝑁 + (𝑤𝑁(0) − 𝑤𝑁)𝑒𝜂1𝑡, (32) 𝑛𝑆(𝑡) = �̅�𝑆 + 𝜂1 − 𝑎11𝑎12 (𝑛𝑆(0) − �̅�𝑆), (33)
where 𝑤𝑁(0) and 𝑛𝑆(0) are the initial values of 𝑤𝑁(𝑡) and 𝑛𝑆(𝑡).
3.3. Steady-state social welfare
This section derives steady-state social welfare in the North and in the South. The steady-state price
factor equals �̅� = (1 − �̅�𝑆)log𝜆, indicating that the average price is determined by the steady-state
value of the extent of Southern production (�̅�𝑆). Because at the steady state the innovation rate is
constant, the expected number of innovations arriving in period t is 𝜙𝑅𝑡. Equation (18) indicates that
the instantaneous utility at the steady state is:

15
𝑙𝑜𝑔 �̅�𝑘(𝑡) = 𝑙𝑜𝑔�̅�𝑘 − (1 − �̅�𝑆)log𝜆 + 𝜙𝑅𝑡𝑙𝑜𝑔𝜆.
From (4), we derive the steady-state lifetime utility representing steady-state social welfare as:
�̅�𝑘(0) = 1𝜌 (𝑙𝑜𝑔�̅�𝑘 − (1 − �̅�𝑆)log𝜆 + 𝜙𝑅𝜌 𝑙𝑜𝑔𝜆). (34)
4. EFFECTS OF STRENGTHENING IPR PROTECTION
We are now ready to examine the long-run and short-run effects of strengthening IPR protection on
key macroeconomic variables and social welfare for Northern and Southern consumers under two
scenarios, depending on the target of IPR protection.
4.1. Strengthening the Northern standard of IPR protection
We first examine the long-run effects of strengthening the Northern standard of IPR protection.12
Such a policy change is represented by a decrease in 𝜙𝑆𝑁. Note that (26) is used to derive the long-
run rate of innovation. In Appendix C, we totally differentiate (26) with respect to 𝜙𝑅 and 𝜙𝑆𝑁 and
find that 𝑑𝜙𝑅𝑑𝜙𝑆𝑁 > 0, indicating that such a strengthening policy induces a decrease in the rate of
innovation. Strengthening the Northern standard of IPR protection reduces imitation risk of Northern-
produced goods, thereby motivating Northern firms to produce in the North. We find that there is an
increase in the long-run sale of Northern-produced goods (𝑛𝑁 �̅�𝜆 ), implying that Northern labor
employed by the production sector will increase, which crowds out labor employed in the R&D sector
in the long run. As a result, the long-run rate of innovation will decrease.
Proposition 2. Strengthening the Northern standard of IPR protection reduces the rate of innovation
in the long run.
Proof. See Appendix C.
Equation (25) indicates that this policy change affects the long-run North-South relative wage
directly or indirectly through its effect on the long-run rate of innovation. Strengthening the Northern
standard of IPR protection reduces imitation risk of Northern-produced goods, thereby motivating
Northern firms to produce in the North. The no-arbitrage condition (20) implies that the market value
of a Northern firm equals the sum of the present value of its instantaneous profit flow; that is, 𝑣𝑁 = 12 Appendix C provides the details of calculation for the effects of strengthening Northern IPR standard on
endogenous variables.

16
𝛱𝑁𝜌+𝜙𝑅+𝜙𝑆𝑁. Therefore, a lower 𝜙𝑆𝑁 ceteris paribus raises 𝑣𝑁, increasing the motivation of Northern
production, raising the demand for Northern labor, and causing an increase in the North-South relative
wage in the long run (the direct effect). Concerning the indirect effect, (25) implies that 𝜕𝑤𝑁𝜕𝜙𝑅 < 0,
meaning that a decrease in the long-run innovation rate will cause an increase in the long-run North-
South relative wage (the indirect effect). Note that both the direct effect and the indirect effect show
that the North-South relative wage will increase with such a strengthening policy.
We then decompose the effects of stronger IPR protection on the long-run sale of Northern-
produced goods by separately analyzing its effects on the extent of Northern production and global
expenditure. Although such strengthening reduces the imitation risk for Northern-produced goods and
motivates firms to produce in the North, the increased North-South relative wage motivates firms to
shift their production bases to the South. Appendix C shows that: 𝑑�̅�𝑁𝑑𝜙𝑆𝑁 = 1𝜙𝑅 + 𝜙𝑆𝑁 + 𝜆(𝜙𝑆𝐹 − 𝜙𝑆𝑁) + 𝜌 [(𝜆 − 1)𝑛𝑁 − (𝜆 − 1 + 𝑛𝑁) ( 𝑑𝜙𝑅𝑑𝜙𝑆𝑁)]. This implies that strengthening the Northern standard of IPR protection will cause an overall decrease
in the long-run extent of Northern production if such a strengthening policy causes a small change in
innovation rate such that ( 𝑑𝜙𝑅𝑑𝜙𝑆𝑁) < (𝜆−1)𝑛𝑁𝜆−1+𝑛𝑁.
Regarding the effect of strengthening the Northern standard of IPR protection on global
expenditure in the long run, Appendix C shows that: 𝑑�̅�𝑑𝜙𝑆𝑁 = 𝜆𝑎𝑅𝜆 − 1 [( 𝑑𝜙𝑅𝑑𝜙𝑆𝑁) − (𝜆 − 1)].
Note that if the change in the innovation rate induced by such a policy change is small enough, like ( 𝑑𝜙𝑅𝑑𝜙𝑆𝑁) < (𝜆−1)𝑛𝑁𝜆−1+𝑛𝑁 , then ( 𝑑𝜙𝑅𝑑𝜙𝑆𝑁) < 𝜆 − 1, implying that 𝑑�̅�𝑑𝜙𝑆𝑁 < 0. This strengthening policy will
thus raise global expenditure in the long run. We now have our next proposition.
Proposition 3. Strengthening the Northern standard of IPR protection leads to an increase in the long-
run North-South relative wage. Moreover, if such a strengthening policy does not cause a large change
in the long-run rate of innovation, then the long-run global expenditure will increase.
Proof. See Appendix C.
A decrease in the long-run extent of Northern production implies that Northern firms shift
production to the South, indicating that there is an increase in the long-run extent of FDI. Since such
a strengthening policy reduces the motivation for Southern firms to imitate Northern-produced goods,

17
the long-run extent of Southern production imitating Northern-produced goods will decrease while
the long-run extent of Southern production imitating Southern-produced goods by multinationals will
increase. We summarize the results of the production pattern in the following proposition.
Proposition 4. Strengthening the Northern standard of IPR protection decreases the extent of Northern
production and the extent of Southern production imitating Northern-produced goods while raising
the extent of FDI and the extent of Southern production imitating Southern-produced goods by
multinationals in the long run, provided that such a policy change does not cause a large change in the
long-run rate of innovation.
Proof. See Appendix C.
Since a theoretical analysis may not be able to provide clear results of the effects on some
endogenous variables and welfare, we next conduct a numerical analysis. For the benchmark model,
we assign the discount factor 𝜌 = 0.01 to generate a 1% real interest rate at the steady state. The
one-stage quality improvement is set at 𝜆 = 1.35 to match the Northern markup of 35%.13 We
assign the Northern population to 0.9 and the Southern population to 1.35 so that the North-South
relative wage is about 1.2.14 Equation (16) indicates that the labor requirement for innovative R&D
(𝑎𝑅𝜙𝑅) cannot be much larger than the Northern population in order to generate a positive value of 𝑛𝑁. Thus, the labor intensity for innovative R&D (𝑎𝑅) is set at 1.5 in order to generate a positive value
of 𝑛𝑁. We set 𝜙𝑆𝑁 to 0.05 and 𝜙𝑆𝐹 to 0.25, but we allow their values to vary in order to examine
their impacts.15
Based on our parameterization, the North-South relative wage equals 1.20 and global expenditure
equals 2.44 at the steady state. The resultant steady-state rate of innovation is 0.09. The respective
extents of Northern production, FDI, Southern production imitating Northern-produced goods, and
Sothern production imitating Southern-produced goods by multinationals are 42.23%, 9.29%, 23.08%,
and 25.40% at the steady state. Table 2 presents the benchmark values and also summarizes the effects
of strengthening IPR protection on the key macroeconomic variables and welfare. Under our
parameterization, there are one positive eigenvalue and one negative eigenvalue (𝜂1 < 0 and 𝜂2 >0) in all numerical cases, indicating that the steady-state equilibrium is stable in all these cases.
13 The parameter 𝜆 is set to 1.35 in Dinopoulos and Segerstrom (1999) and 1.3 in Cozzi and Impullitti (2016). 14 Cozzi and Impullitti (2016) mention that the data show that the ratio of skilled wage to unskilled wage equals
1.28. In our model, since innovation occurs only in the North, then Northern labor can be considered as skilled
labor and Southern labor can be considered as unskilled labor. 15 Ideally, the data of 𝑛𝑁, 𝑛𝐹, 𝑛𝑆𝑁, and 𝑛𝑆𝐹 can be used to calibrate parameter values of 𝐿𝑁, 𝐿𝑆, 𝜙𝑆𝑁, and 𝜙𝑆𝐹. Unfortunately, such data are not available. In Appendix F, we summarize studies conducting numerical
analysis based on a product-cycle model. Their calibration results are also given in Appendix F. Appendix F
indicates that there is a wide variety of parameter values. Moreover, these parameter values generate very
different results for the production pattern.

18
<Table 2 is inserted about here>
In order to analyze the effects of strengthening the Northern standard of IPR protection, we let 𝜙𝑆𝑁 decrease by 5% from 5% to 4.75% (that is, 5% ∗ 0.95 = 4.75). We find that a decrease in 𝜙𝑆𝑁
by 5% raises the long-run North-South relative wage rate by 0.23% and long-run global expenditure
by 0.10%. The long-run rate of innovation decreases by 0.48%. The extent of Northern production
decreases by 0.02%, while the extent of FDI increases by 2.70% in the long run, resulting in a decrease
in the extent of Southern production imitating Northern-produced goods by 4.56% and an increase in
the extent of Southern production imitating Southern-produced goods by multinationals by 3.19% in
the long run. As a result, the steady-state extent of Southern production decreases by 0.50%.
Ever since the study of Grossman and Helpman (1991), the literature has focused on examining
the effects of IPR protection on the steady-state welfare.16 Regarding changes to the steady-state
welfare for Northerners and Southerners in response to such a policy change, we differentiate (34)
with respect to 𝜙𝑖, 𝑖 = 𝑆𝐹, 𝑆𝑁, and obtain:17 𝑑�̅�𝑘(0)𝑑𝜙𝑖 = 1𝜌 [ 1�̅�𝑘 (𝑑�̅�𝑘𝑑𝜙𝑖 ) + (𝑑�̅�𝑆𝑑𝜙𝑖) log𝜆 + 𝑙𝑜𝑔𝜆𝜌 (𝑑𝜙𝑅𝑑𝜙𝑖 )]. (35)
Equation (35) indicates that strengthening the Northern standard of IPR protection affects the
Northern (Southern) welfare through consumers’ expenditure in the North (South), the average price,
and innovation rate. An increase in Northern (Southern) consumers’ expenditure means that Northern
(Southern) consumers consume more goods, while an increase in the rate of innovation allows
consumers to enjoy a better quality of products. These two effects are beneficial to Northern (Southern)
consumers. However, a higher price factor reduces consumers’ purchasing power and is harmful to
the welfare of Northern (Southern) consumers.
A decrease in 𝜙𝑆𝑁 by 5% raises the steady-state price factor by 0.47%. The decrease in the
steady-state rate of innovation and the increase in the steady-state price factor hurt the steady-state
welfare for both Northerners and Southerners. However, the increase in the steady-state Northern
(Southern) consumers’ expenditure by 0.17% (0.04%) benefits Northern (Southern) welfare.18 We
evaluate the welfare gains/losses as the percentage change in consumption necessary to equate the
initial levels of welfare to what they would be following a policy change. Our numerical results show
that under our parameterization, such a policy change will generate a 1.21% steady-state welfare loss
16 Grossman and Helpman (1991) consider a closed economy and show that it must jump immediately to the
steady state in response to a policy change. Therefore, there is no need to consider welfare changes during the
transitional dynamics. 17 In this analysis, we consider welfare at the steady-state equilibrium and do not consider welfare changes
during the transitional dynamics. 18 We explain how strengthening the Northern standard of IIPR protection on the Northern and Southern
consumers’ expenditures in the next paragraph.

19
in consumption equivalence for Northerners and a 18.41% steady-state welfare loss in consumption
equivalence for Southerners.
Tanaka and Iwaisako (2014) examine how welfare changes in response to strengthening IPR
protection during the transitional dynamics. As shown in Table 2, the absolute value of the negative
eigenvalue (𝜂1) is not large, indicating that the speed of convergence is slow (see (32) and (33)). Since
such strengthening policy affects economic variables for sustained periods of time, we need to
consider their accumulated effects on welfare during the transition from one equilibrium to another.
Assuming that the economy is initially at the steady state and the strengthening policy is implemented
at 𝑡 = 0 , Figure 1 presents the transitional dynamics of the North-South wage gap, the rate of
innovation, global expenditure, and the pattern of production. It depicts both temporary (short-run)
and permanent (long-run) effects of the strengthening policy on economic performance. It shows that
the North-South relative wage jumps upward right after the policy change, then decreases, and
converges to the new steady state. Conversely, the innovation rate jumps downward after the policy
change, then increases and converges to the new steady state. Regarding the pattern of production, the
extents of Northern and Southern production decrease over time while the extent of FDI increases
over time.
<Figure 1 is inserted about here>
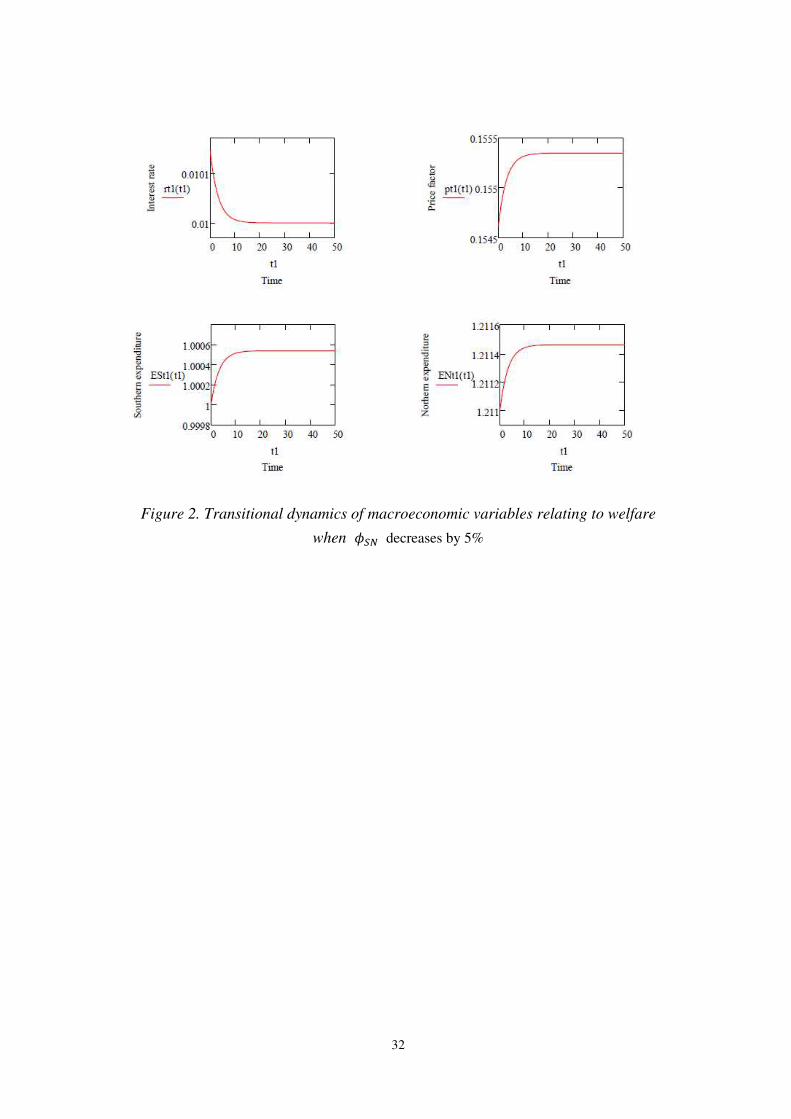
Equation (18) indicates that strengthening IPR protection affects the instantaneous utility through
the consumers’ expenditure, the extent of Southern production (or the price factor), and the innovation
rate. Following Tanaka and Iwaisalo (2014), we assume that Southern consumers initially possess no
assets. With this assumption and along with the normalization of the Southern wage rate to 1, the
intertemporal budget constraint implies that the initial Southern consumer’s expenditure is 𝐸𝑆(0) =1. Equation (5) indicates the dynamic behavior of 𝐸𝑆(𝑡) follows �̇�𝑆(𝑡)𝐸𝑆(𝑡) = 𝑟(𝑡) − 𝜌. Note that the
transitional dynamics of the real interest rate are characterized by (29). From the definition of global
expenditure, we derive the transitional dynamics of Northern consumers’ expenditure as 𝐸𝑁(𝑡) =𝐸(𝑡)−𝐿𝑆𝐸𝑆(𝑡)𝐿𝑁 . Figure 2 presents the transitional dynamics of the real interest rate, the price factor, the
Northern consumers’ expenditure, and the Southern consumers’ expenditure. It indicates that the price
factor, the Northern consumers’ expenditure, and the Southern consumers’ expenditure all increase over
time.
<Figure 2 is inserted about here>
We find that there are welfare losses for both Northerners and Southerners if we consider the
accumulated effects during transitional dynamics caused by strengthening the Northern standard of IPR

20
protection. Our quantitative analysis suggests that such losses are in the order of 62.44% for Northerners
and 62.49% for Southerners in consumption equivalence. These results demonstrate that if we do not
consider the transitional dynamics, then we would underestimate welfare losses caused by an increase
in the Northern standard of IPR protection.
4.2. Strengthening the Southern standard of IPR protection
We next turn to examine the long-run effects of strengthening the Southern standard of IPR
protection.19 Such a policy change is represented by a decrease in 𝜙𝑆𝐹. In Appendix D, we totally
differentiate (26) with respect to 𝜙𝑅 and 𝜙𝑆𝐹 and find that 𝑑𝜙𝑅𝑑𝜙𝑆𝐹 < 0 , indicating that such a
strengthening policy will cause an increase in the rate of innovation. Increasing the Southern standard
of IPR protection reduces the imitation risk for Southern-produced goods by multinationals, thereby
motivating Northern firms to shift production to the South. We find that there is a decrease in the long-
run sale of Northern-produced goods (𝑛𝑁 �̅�𝜆), meaning that Northern labor employed by the production
sector will decrease in the long run. With more labor released from the production sector in the North,
employment in the R&D sector increases, resulting in a rise in the rate of innovation in the long run.
Proposition 5. Strengthening the Southern standard of IPR protection raises the rate of innovation in
the long run.
Proof. See Appendix D.
We use (25) to examine the direct and indirect effects of such a strengthening policy on the long-
run North-South relative wage. Increasing the Southern standard of IPR protection reduces imitation
risk for Southern-produced goods by multinationals, thereby motivating Northern firms to shift
production to the South. The no-arbitrage condition (21) indicates that the market value of
multinationals equals the sum of the present value of the instantaneous profit flow; that is, 𝑣𝐹 =𝛱𝐹𝜌+𝜙𝑅+𝜙𝑆𝐹. A lower 𝜙𝑆𝐹 ceteris paribus raises 𝑣𝐹, increasing the motivation of Northern firms to
produce in the South. This will reduce the demand for Northern labor and increase the demand for
Southern labor, causing a reduction in the North-South relative wage in the long run (the direct effect).
Concerning the indirect effect, (25) implies that an increase in the long-run innovation rate will reduce
the long-run North-South relative wage (the indirect effect). Therefore, the North-South relative wage
will decrease in the long run.
19 Appendix D provides the details of calculation for the effects of strengthening the Southern standard of IPR
protection.

21
We also show in Appendix D that: 𝑑�̅�𝑑𝜙𝑆𝐹 = 𝜆2𝑎𝑅(𝜆 − 1)𝜉1(𝜙𝑅 + 𝜙𝑆𝐹) {𝜆[𝜙𝑅 + 𝜙𝑆𝑁 + 𝜆(𝜙𝑆𝐹 − 𝜙𝑆𝑁)] − (𝜆 − 1)𝐿𝑆𝑎𝑅 }. Therefore, if 𝐿𝑆 < 𝜆𝑎𝑅𝜆−1 [𝜆(𝜙𝑆𝐹 − 𝜙𝑆𝑁) + 𝜙𝑆𝐹] , then
𝑑�̅�𝑑𝜙𝑆𝐹 > 0 . Therefore, such a strengthening
policy will raise global expenditure in the long run if the Southern population is sufficiently small.
We thus have the next proposition.
Proposition 6. Strengthening the Southern standard of IPR protection results in a decrease in the long-
run North-South relative wage. Moreover, such a strengthening policy will reduce global expenditure
in the long run, provided that Southern population is sufficiently small.
Proof. See Appendix D.
Concerning the pattern of production, we show that 𝑑�̅�𝑁𝑑𝜙𝑆𝐹 > 0 in Appendix D, implying that
such a policy change results in a reduction in the long-run extent of Northern production. Since
Northern firms shift production to the South, the extent of FDI increases. We then use the steady-state
condition for the extent of Sothern production imitating Northern-produced goods (equation (27)) to
determine the change of extent of Southern production imitating Northern-produced goods. With a
decrease in the long-run extent of Northern production, the flows going into Southern production
imitating Northern-produced goods decrease. At the same time, an increase in the long-run rate of
innovation spurs the flows going out of Southern production imitating Northern-produced goods.
Therefore, the steady-state extent of Sothern production imitating Northern-produced goods must
decrease in order to raise the flows going out of Southern production imitating Northern-produced
goods so as to restore the steady-state condition.
Although an increase in the Southern standard of IPR protection reduces the motivation of
Southern firms to imitate Southern-produced goods by multinationals, the released Southern labor
from the sector of Sothern production imitating Northern-produced goods raises the extent of Southern
production imitating Southern-produced goods by multinationals. As a result, there is an ambiguous
change in the extent of Southern production imitating Southern-produced goods by multinationals.
We summarize the results of this production pattern in the following proposition.
Proposition 7. Increasing the Southern standard of IPR protection causes the extent of Northern
production and the extent of Southern production imitating Northern-produced goods to decrease and
the extent of FDI to increase in the long run. However, the change in the long-run extent of Southern
production imitating Southern-produced goods by multinationals is ambiguous.

22
Proof. See Appendix D.
In order to examine the effects of strengthening the Southern standard of IPR protection, we let 𝜙𝑆𝐹 decrease by 5% from 25% to 23.75% (that is, 25% ∗ 0.95 = 23.75%) and examine its effects
on macroeconomic performance and welfare. Table 2 presents the results.20 A decrease in 𝜙𝑆𝐹 by
5% in the Southern standard of IPR protection reduces the North-South relative wage by 1.14% and
the global expenditure by 0.49% while raising the rate of innovation by 16.17% in the long run. The
extent of Northern production decreases by 2.43% and the extent of FDI increases by 31.09% in the
long run. Moreover, the extent of Southern production imitating Northern-produced goods decreases
by 16.01% and the extent of Southern production imitating Southern-produced goods by
multinationals increases by 7.21% in the long run. As a consequence, the extent of Southern
production decrease by 3.85%.
Although the increase in the steady-state rate of innovation benefits the steady-state welfare for
both Northerners and Southerners, the rise in the steady-state price factor by 3.62% reduces the steady-
state welfare for both Northerners and Southerners. The steady-state Northern consumers’ expenditure
decreases by 1.63%, while the steady-state Southern consumers’ expenditure increases by 0.34%.
There are overall increases in the steady-state Northern and Southern welfare of 52.48% and 28.69%
in consumption equivalence, respectively.
Figure 3 presents the transitional dynamics of the North-South wage gap, the rate of innovation,
global expenditure, and the pattern of production after the strengthening policy of the Southern
standard of IPR protection is implemented. It shows that the North-South relative wage jumps
downward right after the policy change, then decreases, and converges to the new steady state. The
innovation rate jumps upward after the policy change, then increases, and converges to the new steady
state. Regarding the pattern of production, the extents of Northern and Southern production decrease
over time while the extent of FDI increases over time.
<Figure 3 is inserted about here>
Concerning welfare changes during the transitional dynamics, we present the transitional
dynamics of the real interest rate, the price factor, the Northern consumers’ expenditure, and the
Southern consumers’ expenditure in response to an increase in the Southern standard of IPR protection
in Figure 4. It indicates that the price factor and the Southern consumers’ expenditure increase over time.
The Northern consumers’ expenditure jumps downward right after the policy change and then increases
over time. In contrast to the changes of steady-state welfare, there are welfare losses for both Northerners
20 Because 𝜙𝑆𝐹 is larger than 𝜙𝑆𝑁 under our parametrization, then a 5% decrease of 𝜙𝑆𝐹 will cause larger
impacts on endogenous variables than a 5% decrease of 𝜙𝑆𝑁.

23
and Southerners if we consider the accumulated effects caused by strengthening the Southern standard
of IPR protection during the transitional dynamics. Our quantitative analysis suggests that such losses
are in the order of 56.09% for Northerners and 55.19% for Southerners in consumption equivalence.
Comparing results in our two scenarios under two IPR protection policies, we find that when examining
the effects of stronger IPR protection on welfare, we should consider the accumulated effects caused by
stronger IPR protection during the transitional dynamics. If we only consider changes in the steady state
and ignore the accumulated effects during the transitional dynamics, the conclusions would be
misleading or wrong.
<Figure 4 is inserted about here>
Comparing the effects caused by these two IPR protection policies, we find that the target of
strengthening IPR protection matters when concerning its effects on the North-South relative wage
and the rate of innovation. While increasing the Northern standard of IPR protection raises the North-
South relative wage and reduces the rate of innovation, strengthening the Southern standard of IPR
protection causes the opposite effects on these two variables.21 Concerning the production pattern,
our findings indicate that the strengthening of IPR protection leads to decreases in the extent of
Northern production and the extent of Southern production imitating Northern-produced goods while
raising the extent of FDI and the extent of Southern production imitating Southern-produced goods
by multinationals, regardless of the targets of IPR protection. Table 3 summarizes the results found in
Sections 4.1 and 4.2.
<Table 3 is inserted about here>
4.3. Discussion
We summarize the related studies that examine the influences of stronger IPR protection in a product-
cycle model with FDI or outsourcing in Table 1. One important feature of this paper is that Southern
firms can imitate either Northern-produced goods or Southern-produced goods by multinationals at
different rates. The spirit of this feature is similar to the study of Glass and Saggi (2002). However,
our model differs from their model in many ways. For example, the settings of imitation and the cost
of FDI activities in this paper are all different from theirs.22 More importantly, we assume that
imitation rates are exogenous, so that we are able to separately analyze the effects of strengthening
21 For studies finding that strengthening IPR protection raises the rate of innovation, see Glass and Wu (2007),
Tanaka and Iwaisako (2014), and Chen (2015b). For studies finding that strengthening IPR protection reduces
the rate of innovation, see Glass and Saggi (2001) and Chen (2015c). 22 While we assume that imitation is costless and Northern firms can become multinational firms without any
cost in this paper, they assume that imitation and FDI activities are costly. We also investigate the stability of
the steady-state equilibrium and examine welfare changes in responses to changes of IPR protection whereas
they do not conduct such an analysis.

24
IPR protection when its target is Northern-produced goods or Southern-produced goods by
multinationals. However, they assume that the rate imitation is endogenous and that stronger IPR
protection is represented by an increase in labor units used for imitation activities. As a result, stronger
IPR protection raises both labor units required for imitation under their setting of the model and affects
the rates of imitation for both Northern-produced goods and Southern-produced goods by
multinationals at the same time. Therefore, they are not able to separate the effects caused by
strengthening IPR protection on different targets. Because our model setting is different from theirs
in many ways, the results herein are different from theirs. For example, they show that strengthening
IPR protection impedes both innovation rate and FDI while the North-South relative wage is immune
to such policy change. Depending on the target of stronger IPR protection, we show that such a policy
change may increase or decrease innovation rate and the North-South relative wage. Furthermore, the
extent of FDI will increase, regardless of the object of stronger IPR protection.
It is commonly known that the setting of an R&D model affects not only the impacts of
strengthening IPR protection on macroeconomic performance qualitatively, but also the stability
property of the steady-state equilibrium. Therefore, before analyzing the impacts of strengthening IPR
protection on the steady-state equilibrium, we should make sure that the steady-state equilibrium is
attainable. The analysis of Tanaka and Iwaisako (2014) introduces government subsidies on R&D and
FDI into the case of inefficient followers in Glass and Wu (2007) and shows that these subsidies on
R&D and FDI are important determinants for the stability of the steady-state equilibrium in a product-
cycle model where innovation targets only imitated goods. If the government does not subsidize R&D
and FDI, then the steady-state equilibrium is not attainable in Glass and Wu (2007); however, the
steady-state equilibrium will be stable if these subsidies of R&D and FDI are sufficiently large.
In Appendix E we consider a model where Southern firms only imitate Southern-produced goods
by multinationals by setting 𝜙𝑆𝑁 = 0 and 𝑛𝑆𝑁 = 0 . 23 This corresponds to the case of efficient
followers in Glass and Wu (2007). 24 We show that the steady state is determinant if (𝜆 − 1) [𝜌�̅�𝑆𝐹 + (𝜆−1)𝜙𝑆𝐹𝐿𝑆𝑎𝑅(𝜌+𝜙𝑅+𝜆𝜙𝑆𝐹)] > (2 − 𝜆)(𝜙𝑅 + 𝜆𝜙𝑆𝐹) . 25 The numerical analysis indicates that
under our parameterization in Section 4.1, the two eigenvalues of the Jacobian matrix for the
dynamical system represented in {𝑤𝑁(𝑡), 𝑛𝑆𝐹(𝑡)} are -0.3163 and 1.5551, implying that the steady-
state equilibrium is determinant since 𝑛𝑆𝐹(𝑡) is a state variable and 𝑤𝑁(𝑡) is a jump variable. This
23 In this specific case, there is no need to consider the law of motion of 𝑛𝑆𝑁 (equation (13)). 24 The Proposition 3 in Glass and Wu (1007) demonstrates that in this case, stronger IPR protection will
increase innovation rate and extent of FDI while at the same time reducing global expenditure, the North-South
relative wage, and the extent of Northern production. However, they do not analyze the stability property of the
steady-state equilibrium. In Appendix E, we complete their analysis by examining the stability property of the
steady-state equilibrium. 25 See Appendix E for the details of calculation.

25
result demonstrates that allowing innovation to target all types of goods is another way to obtain a
stable steady-state equilibrium. Moreover, one should be more cautious with the results based on a
product-cycle model with inefficient followers.
5. CONCLUSION
This paper studies the effects of strengthening-IPR-protection policies on rate of innovation, the
North-South relative wage, and the pattern of production based on a product-cycle model with FDI.
We also examine the changes of social welfare for Northern (Southern) consumers in response to the
strengthening of IPR protection.
We find that the target of strengthening IPR protection matters when concerning its effects on
the rate of innovation and the North-South relative wage, but the target of strengthening IPR protection
does not matter when concerning its effects on the production pattern. When the strengthening of IPR
protection is applied to goods produced in the North, such a policy raises the North-South relative
wage while reducing the rate of innovation. The extents of Northern production and Southern
production imitating Northern-produced goods decrease while the extents of FDI and Southern
production imitating Southern-produced goods by multinationals increase.
When the strengthening of IPR protection is applied to goods produced in the South by
multinationals, this policy generates the reverse effects on the North-South relative wage and the rate
of innovation, but it causes the same effects on the production pattern as when the strengthening of
IPR protection is applied on Northern-produced goods. In Tanaka and Iwaisako (2014), strengthening
IPR protection means that the risk of imitation of goods produced by multinationals decreases. In our
second scenario, we find that if the policy of stronger IPR protection is applied to Southern-produced
goods by multinationals, then such a policy will promote both innovation rate and FDI. These findings
are consistent with theirs.26
A few notes are worth discussing. First, the imitation risk is exogenous in the model, and we use
an exogenous reduction in imitation risk to represent the strengthening of IPR protection. However,
Southern firms can devote labor input to the imitation sector to increase the rate of imitation. It would
thus be interesting to endogenize the imitation risk and examine the effects of IPR protection. Second,
our paper focuses on a theoretical analysis of the long-run effects of stronger IPR protection. The
results shown herein provide a direction for empirical study, and it is important to know whether the
data support these results.
26 The major difference between our second scenario and what Tanaka and Iwaisako (2014) present is that in
order to allow the economy to converge to a stable nontrivial steady-state equilibrium, we assume that innovation
targets all types of goods, whereas they assume that the government subsidizes R&D and FDI.

26
REFERENCES
Aghion, P., Howitt, P., 2009. Endogenous growth theory. MIT Press, Cambridge, MA.
Chen, H.-J., 2015a. Intellectual Property Rights and Skills Accumulation: A Product-cycle Model of
FDI and Outsourcing. Journal of Macroeconomics 46, 328-343.
Chen, H.-J., 2015b. Innovation and intellectual property rights in a product-cycle model of skills
accumulation. Review of International Economics 23, 320-344.
Chen, H.-J., 2018. Innovation and imitation: Effects of intellectual property rights in a product-cycle
model of skills accumulation. Macroeconomic Dynamics 22, 1475-1509.
Chu, A.C., Peng, S.-K., 2011. International intellectual property rights: Effects on growth, welfare
and income inequality. Journal of Macroeconomics 33, 276-287.
Cozzi, G., Impullitti, G., 2016. Globalization and wage polarization. The Review of Economics and
Statistics 98, 984-1000.
Dinopoulos, E., Segerstrom, P., 1999. A Schumpeterian model of protection and relative wages. American
Economic Review 89, 450-472.
Dinopoulos, E., Segerstrom, P., 2010. Intellectual property rights, multinational firms and economic
growth. Journal of Development Economics 92, 13-27.
Glass, A.J., Saggi, K., 2001. Innovation and wage effects of international outsourcing. European Economic
Review 45, 67-86.
Glass, A.J., Saggi, K., 2002. Intellectual property rights and foreign direct investment. Journal of
International Economics 56, 387-410.
Glass, A.J., 2004. Outsourcing under imperfect protection of intellectual property. Review of International
Economics 12, 867-884.
Glass, A.J., Wu, X., 2007. Intellectual property rights and quality improvement. Journal of Development
Economics 82, 393-415.
Grossman, G.M., Helpman, E., 1991a. Quality ladders and product cycles. Quarterly Journal of Economics
106, 557-586.
Grossman, G.M., Helpman, E., 1991b. Endogenous product cycles. Economic Journal 101, 1214-1229.
Grossman, G.M., Helpman, E., 1991c. Innovation and growth in the global economy. MIT Press,
Cambridge, MA.
Grossman, G.M., Helpman, E., 1991d. Quality ladders in the theory of growth. Review of Economic Studies
58, 43-61.
Lin, H.C., 2019. North-South harmonization of intellectual property rights: Who wins, who loses? DOI:
10.13140/RG.2.2.24277.22244
Parello, C.P., 2008. A North-South model of intellectual property rights protection and skill accumulation.
Journal of Development Economics 85, 253-281.
Segerstrom, P., 1998. Endogenous growth without scale effects. American Economic Review 88, 1290-
1310.

27
Segerstrom, P., Anant, T., Dinopoulos, E., 1990. A Schumpeterian model of the product life cycle.
American Economic Review 80, 1077-1091.
Tanaka, H., Iwaisako, T., 2014. Intellectual property rights and foreign direct investment: A welfare
analysis. European Economic Review 67, 107-124.
Tanaka, H., Iwaisako, T., Futagami, K., 2007. Dynamic analysis of innovation and international transfer
of technology through licensing. Journal of International Economics 73, 189-212.
Vernon, R., 1966. International investment and international trade in the product cycle. Quarterly Journal
of Economics 80, 190-20.

28
Table 1 Related studies
Imitation targets only
Southern-produced goods
by multinationals
Imitation targets Northern-
produced goods and
Southern-produced goods by
multinationals at different
rates
Innovation targets only
imitated goods
1. Glass and Wu (2007) (inefficient followers)
2. Tanaka and Iwaisako (2014)
Glass and Saggi (2002)
Innovation targets all types
of goods
1. Glass (2004) 2. Glass and Wu (2007)
(efficient followers)
3. This paper
(𝜙𝑆𝑁=0 and 𝑛𝑆𝑁 = 0)
This paper
Notes: Glass (2004) develops a model with outsourcing to study the influences of stronger IPR
protection on the steady-state equilibrium. However, her study does now analyze the stability of the
steady-state equilibrium and the transitional dynamics.

29
Table 2 Numerical results of the effects of strengthening IPR protection
Variables Equilibrium values 𝜙𝑆𝑁 down by 5% 𝜙𝑆𝐹 down by 5%
Panel A: Effects on key variables 𝑤𝑁 1.1992 0.2286 -1.1388 �̅� 2.4385 0.1038 -0.4947 𝜙𝑅 0.0915 -0.4782 16.1687 �̅�𝑁 0.4223 -0.0178 -2.4256 �̅�𝐹 0.0929 2.6953 31.0941 �̅�𝑆𝑁 0.2308 -4.5605 -16.0063 �̅�𝑆𝐹 0.2540 3.1887 7.2056 �̅�𝑆 0.4848 -0.5011 -3.8468
Panel B: Welfare gain/loss in consumption equivalence (steady state)
𝐸𝑁 1.2095 0.1654 -1.6266
𝐸𝑆 1.0000 0.0447 0.3448 �̅� 0.1546 0.4715 3.6197
welfare(North) 278.0658 -1.2128 52.4789
welfare(South) 259.0484 -18.4121 28.6911
Panel C: Welfare gain/loss in consumption equivalence (transitional dynamics)
welfare(North) 278.0658 -62.4414 -56.0889
welfare(South) 259.0484 -62.4905 -55.1872
Panel D: Stability property (eigenvalues) 𝜂1 -0.3093 -0.3096 -0.3117 𝜂2 1.6282 1.6245 1.6272
Notes: All figures in the columns of 𝜙𝑆𝑁 down by 5% and 𝜙𝑆𝐹 down by 5% in Panels A, B, and C refer to the percentage changes in the key variables from
their equilibrium values as a result of changes in IPR protection policies.

30
Table 3 The effects of strengthening IPR protection
Strengthening IPR protection on Northern-
produced goods
Strengthening IPR protection on Southern-
produced goods by multinationals 𝜙𝑆𝑁↓ 𝜙𝑆𝐹↓ 𝑤𝑁 ↑ ↓ �̅� ↑ ↓ 𝜙𝑅 ↓ ↑ �̅�𝑁 ↓ ↓ �̅�𝐹 ↑ ↑ �̅�𝑆𝑁 ↓ ↓ �̅�𝑆𝐹 ↑ N/A

31
Figure 1. Transitional dynamics of macroeconomic variables
when 𝜙𝑆𝑁 decreases by 5%
32
Figure 2. Transitional dynamics of macroeconomic variables relating to welfare
when 𝜙𝑆𝑁 decreases by 5%

33
Figure 3. Transitional dynamics of macroeconomic variables
when 𝜙𝑆𝐹 decreases by 5%

34
Figure 4. Transitional dynamics of macroeconomic variables relating to welfare
when 𝜙𝑆𝐹 decreases by 5%

35
APPENDIX A
The steady-state equilibrium
In this appendix, we derive the steady-state equilibrium. We use variables with an upper bar to denote
the steady-state values of the corresponding variables. In Appendix B we show that �̇�(𝑡)𝐸(𝑡) = �̇�𝑁(𝑡) =�̇�𝐹(𝑡) = 0 and 𝑟(𝑡) = 𝜌 in the long run. The no-arbitrage conditions of (10) and (11) can then be
expressed as: 𝑣𝑁 = 𝛱𝑁𝜌 + 𝜙𝑅 + 𝜙𝑆𝑁 , (A1)
𝑣𝐹 = 𝛱𝐹𝜌 + 𝜙𝑅 + 𝜙𝑆𝐹 . (A2)
Substituting (6) and (8) into (A1) gives us: �̅�𝜆 (𝜆 − 𝑤𝑁) = (𝜌 + 𝜙𝑅 + 𝜙𝑆𝑁)𝑎𝑅𝑤𝑁. (A3)
Substituting (6), (7), and (9) into (A2) yields: �̅�𝜆 (𝜆 − 1) = (𝜌 + 𝜙𝑅 + 𝜙𝑆𝐹)𝑎𝑅𝑤𝑁. (A4)
At the steady-state equilibrium, the flows going into 𝑛𝑆𝑁(𝑡) and 𝑛𝑆𝐹(𝑡) equal the flows
coming out of them - that is, �̇�𝑆𝑁(𝑡) = �̇�𝑆𝐹(𝑡) = 0. Thus, (13) and (14) indicate:
𝜙𝑆𝑁�̅�𝑁 = 𝜙𝑅�̅�𝑆𝑁, (A5)
𝜙𝑆𝐹�̅�𝐹 = 𝜙𝑅�̅�𝑆𝐹. (A6)
The steady-state equilibrium is characterized by (12), (16), (17), and (A3)-(A6) with seven variables {𝑤𝑁, �̅�, �̅�𝑁, �̅�𝐹 , �̅�𝑆𝑁, �̅�𝑆𝐹 , 𝜙𝑅}. Moreover, the extent of Southern production at the steady state can be
derived as �̅�𝑆 = �̅�𝑆𝑁 + �̅�𝑆𝐹.
Combining (A3) and (A4) yields:
𝜆 − 𝑤𝑁𝜆 − 1 = 𝜌 + 𝜙𝑅 + 𝜙𝑆𝑁𝜌 + 𝜙𝑅 + 𝜙𝑆𝐹 . (A7)
Using (A7), we can express 𝑤𝑁 as a function of 𝜙𝑅; that is:
𝑤𝑁 = 𝑤𝑁(𝜙𝑅; 𝜙𝑆𝑁 , 𝜙𝑆𝐹) = 𝜌 + 𝜙𝑅 + 𝜆𝜙𝑆𝐹 − (𝜆 − 1)𝜙𝑆𝑁𝜌 + 𝜙𝑅 + 𝜙𝑆𝐹 , (A8)
with 𝜕𝑤𝑁(𝜙𝑅;𝜙𝑆𝑁,𝜙𝑆𝐹)𝜕𝜙𝑅 = −(𝜆−1)(𝜙𝑆𝐹−𝜙𝑆𝑁)(𝜌+𝜙𝑅+𝜙𝑆𝐹)2 < 0 ,
𝜕𝑤𝑁(𝜙𝑅;𝜙𝑆𝑁,𝜙𝑆𝐹)𝜕𝜙𝑆𝑁 = −(𝜆−1)𝜌+𝜙𝑅+𝜙𝑆𝐹 < 0 , and
𝜕𝑤𝑁(𝜙𝑅;𝜙𝑆𝑁,𝜙𝑆𝐹)𝜕𝜙𝑆𝐹 = (𝜆−1)(𝜌+𝜙𝑅+𝜙𝑆𝑁)(𝜌+𝜙𝑅+𝜙𝑆𝐹)2 > 0. Note that (A8) indicates that 𝑤𝑁 > 1.

36
Combining (A4) and (A8), the steady-state global expenditure (�̅�) can be expressed as a function
of 𝜙𝑅: �̅�(𝜙𝑅; 𝜙𝑆𝑁 , 𝜙𝑆𝐹) = 𝜆𝑎𝑅[𝜆𝜙𝑆𝐹 − (𝜆 − 1)𝜙𝑆𝑁 + 𝜌 + 𝜙𝑅]𝜆 − 1 , (A9)
with 𝜕�̅�(𝜙𝑅;𝜙𝑆𝑁,𝜙𝑆𝐹)𝜕𝜙𝑅 = 𝜆𝑎𝑅𝜆−1 > 0,
𝜕�̅�(𝜙𝑅;𝜙𝑆𝑁,𝜙𝑆𝐹)𝜕𝜙𝑆𝑁 = −𝜆𝑎𝑅 < 0, and 𝜕�̅�(𝜙𝑅;𝜙𝑆𝑁,𝜙𝑆𝐹)𝜕𝜙𝑆𝐹 = 𝜆2𝑎𝑅𝜆−1 > 0.
Substituting (A9) into (16), we derive the steady-state extent of Northern production (𝑛𝑁) as a
function of 𝜙𝑅: �̅�𝑁(𝜙𝑅; 𝜙𝑆𝑁, 𝜙𝑆𝐹) = 𝜆(𝐿𝑁 − 𝑎𝑅𝜙𝑅)�̅�(𝜙𝑅; 𝜙𝑆𝑁 , 𝜙𝑆𝐹) = (𝜆 − 1)(𝐿𝑁 − 𝑎𝑅𝜙𝑅)𝑎𝑅[𝜆𝜙𝑆𝐹 − (𝜆 − 1)𝜙𝑆𝑁 + 𝜌 + 𝜙𝑅], (A10)
with 𝜕𝑛𝑁(𝜙𝑅;𝜙𝑆𝑁,𝜙𝑆𝐹)𝜕𝜙𝑅 = − 𝜆�̅�2 [𝑎𝑅�̅�(𝜙𝑅; 𝜙𝑆𝑁 , 𝜙𝑆𝐹) + (𝐿𝑁 − 𝑎𝑅𝜙𝑅) (𝜕�̅�(𝜙𝑅;𝜙𝑆𝑁,𝜙𝑆𝐹)𝜕𝜙𝑅 )] < 0 ,
𝜕𝑛𝑁(𝜙𝑅;𝜙𝑆𝑁,𝜙𝑆𝐹)𝜕𝜙𝑆𝑁 = − 𝜆(𝐿𝑁−𝑎𝑅𝜙𝑅)�̅�2 (𝜕𝐸(𝜙𝑅;𝜙𝑆𝑁,𝜙𝑆𝐹)𝜕𝜙𝑆𝑁 ) > 0 , and 𝜕𝑛𝑁(𝜙𝑅𝜙𝑆𝑁,𝜙𝑆𝐹)𝜕𝜙𝑆𝐹 =
− 𝜆(𝐿𝑁−𝑎𝑅𝜙𝑅)�̅�2 (𝜕�̅�(𝜙𝑅;𝜙𝑆𝑁,𝜙𝑆𝐹)𝜕𝜙𝑆𝐹 ) < 0.
Substituting (A10) into (A5), we derive the steady-state extent of Southern production imitating
Northern-produced goods (𝑛𝑆𝑁) as a function of 𝜙𝑅: �̅�𝑆𝑁(𝜙𝑅; 𝜙𝑆𝑁, 𝜙𝑆𝐹) = 𝜙𝑆𝑁𝑛𝑁(𝜙𝑅; 𝜙𝑆𝑁 , 𝜙𝑆𝐹)𝜙𝑅 , (A11)
with 𝜕𝑛𝑁(𝜙𝑅;𝜙𝑆𝑁,𝜙𝑆𝐹)𝜕𝜙𝑅 = 𝜙𝑆𝑁𝜙𝑅2 [𝜙𝑅 (𝜕𝑛𝑁(𝜙𝑅;𝜙𝑆𝑁,𝜙𝑆𝐹)𝜕𝜙𝑅 ) − 𝑛𝑁] < 0 ,
𝜕𝑛𝑁(𝜙𝑅;𝜙𝑆𝑁,𝜙𝑆𝐹)𝜕𝜙𝑆𝑁 = 𝜙𝑆𝑁𝜙𝑅 (𝜕𝑛𝑁(𝜙𝑅;𝜙𝑆𝑁,𝜙𝑆𝐹)𝜕𝜙𝑆𝑁 ) > 0, and
𝜕𝑛𝑁(𝜙𝑅;𝜙𝑆𝑁,𝜙𝑆𝐹)𝜕𝜙𝑆𝐹 = 𝜙𝑆𝑁𝜙𝑅 (𝜕𝑛𝑁(𝜙𝑅;𝜙𝑆𝑁,𝜙𝑆𝐹)𝜕𝜙𝑆𝐹 ) < 0.
Combining (12), (A6), and (A11) allows us to express the steady-state extent of FDI (𝑛𝐹) as a
function of 𝜙𝑅: �̅�𝐹(𝜙𝑅; 𝜙𝑆𝑁, 𝜙𝑆𝐹) = 𝜙𝑅 − (𝜙𝑅 + 𝜙𝑆𝑁)𝑛𝑁(𝜙𝑅; 𝜙𝑆𝑁, 𝜙𝑆𝐹)𝜙𝑅 + 𝜙𝑆𝐹 , (A12)
with 𝜕𝑛𝐹(𝜙𝑅;𝜙𝑆𝑁,𝜙𝑆𝐹)𝜕𝜙𝑅 = 1𝜙𝑅+𝜙𝑆𝐹 [1 − 𝑛𝑁(𝜙𝑅; 𝜙𝑆𝑁 , 𝜙𝑆𝐹) − (𝜙𝑅 + 𝜙𝑆𝑁) (𝜕𝑛𝑁(𝜙𝑅;𝜙𝑆𝑁,𝜙𝑆𝐹)𝜕𝜙𝑅 ) −
𝑛𝐹(𝜙𝑅; 𝜙𝑆𝑁 , 𝜙𝑆𝐹)] > 0 , 𝜕𝑛𝐹(𝜙𝑅;𝜙𝑆𝑁,𝜙𝑆𝐹)𝜕𝜙𝑆𝑁 = − 1𝜙𝑅+𝜙𝑆𝐹 [𝑛𝑁(𝜙𝑅; 𝜙𝑆𝑁 , 𝜙𝑆𝐹) + (𝜙𝑅 +
𝜙𝑆𝑁) (𝜕𝑛𝑁(𝜙𝑅;𝜙𝑆𝑁,𝜙𝑆𝐹)𝜕𝜙𝑆𝑁 )] < 0 , and 𝜕𝑛𝐹(𝜙𝑅;𝜙𝑆𝑁,𝜙𝑆𝐹)𝜕𝜙𝑆𝐹 = − 1𝜙𝑅+𝜙𝑆𝐹 [𝑛𝐹(𝜙𝑅; 𝜙𝑆𝑁 , 𝜙𝑆𝐹) + (𝜙𝑅 +
𝜙𝑆𝑁) (𝜕𝑛𝑁(𝜙𝑅;𝜙𝑆𝑁,𝜙𝑆𝐹)𝜕𝜙𝑆𝐹 )].
Substituting (A10)-(A12) into (12), we derive the steady-state extent of Southern production

37
imitating Southern-produced goods by multinationals (𝑛𝑆𝐹) as a function of 𝜙𝑅: �̅�𝑆𝐹(𝜙𝑅; 𝜙𝑆𝑁, 𝜙𝑆𝐹) = 1 − �̅�𝑁(𝜙𝑅; 𝜙𝑆𝑁 , 𝜙𝑆𝐹) − �̅�𝐹(𝜙𝑅; 𝜙𝑆𝑁 , 𝜙𝑆𝐹) − �̅�𝑆𝑁(𝜙𝑅; 𝜙𝑆𝑁 , 𝜙𝑆𝐹). (A13)
Using (12), we replace (�̅�𝑆𝑁 + �̅�𝑆𝐹) by (1 − �̅�𝑁 − �̅�𝐹) and re-write (17) as: 𝑓(𝜙𝑅; 𝜙𝑆𝑁 , 𝜙𝑆𝐹) = 𝐿𝑆, (A14)
where 𝑓(𝜙𝑅; 𝜙𝑆𝑁, 𝜙𝑆𝐹) = [𝜆(1 − �̅�𝑁(𝜙𝑅; 𝜙𝑆𝑁 , 𝜙𝑆𝐹)) − (𝜆 − 1)�̅�𝐹(𝜙𝑅; 𝜙𝑆𝑁 , 𝜙𝑆𝐹)] �̅�(𝜙𝑅;𝜙𝑆𝑁,𝜙𝑆𝐹)𝜆 .
The steady-state equilibrium is represented by (A14), which we use to implicitly solve for 𝜙𝑅.
Note that 𝑓(0; 𝜙𝑆𝑁 , 𝜙𝑆𝐹) = [𝜆𝜙𝑆𝐹−(𝜆−1)𝜙𝑆𝑁][𝜆𝑎𝑅𝜙𝑆𝐹−(𝜆−1)𝐿𝑁]+𝜌𝜆𝑎𝑅𝜙𝑆𝐹(𝜆−1)𝜙𝑆𝐹 and 𝑓(1; 𝜙𝑆𝑁 , 𝜙𝑆𝐹) =[𝜆𝜙𝑆𝐹−(𝜆−1)𝜙𝑆𝑁+1][𝑎𝑅𝜆(1+𝜙𝑆𝐹)−(𝜆−1)𝐿𝑁]+𝜌𝑎𝑅(1+𝜆𝜙𝑆𝐹)(𝜆−1)(1+𝜙𝑆𝐹) . Moreover, using (A14), we derive:
𝜉1 = 𝜕𝑓(𝜙𝑅; 𝜙𝑆𝑁 , 𝜙𝑆𝐹)𝜕𝜙𝑅
= − [𝜆 (𝜕𝑛𝑁(𝜙𝑅; 𝜙𝑆𝑁 , 𝜙𝑆𝐹)𝜕𝜙𝑅 ) + (𝜆 − 1) (𝜕𝑛𝐹(𝜙𝑅; 𝜙𝑆𝑁 , 𝜙𝑆𝐹)𝜕𝜙𝑅 )] �̅�𝜆
+ [𝜆(1 − 𝑛𝑁) − (𝜆 − 1)𝑛𝐹]𝜆 (𝜕�̅�(𝜙𝑅; 𝜙𝑆𝑁 , 𝜙𝑆𝐹)𝜕𝜙𝑅 )
= − 𝜙𝑅 + 𝜙𝑆𝑁 + 𝜆(𝜙𝑆𝐹 − 𝜙𝑆𝑁)𝜙𝑅 + 𝜙𝑆𝐹 (𝜕𝑛𝑁(𝜙𝑅; 𝜙𝑆𝑁, 𝜙𝑆𝐹)𝜕𝜙𝑅 ) �̅�𝜆 + �̅�𝐹𝜆 (𝜕�̅�(𝜙𝑅; 𝜙𝑆𝑁, 𝜙𝑆𝐹)𝜕𝜙𝑅 )
+ 𝑎𝑅(1 − 𝑛𝑁 − 𝑛𝐹)(𝜆 − 1)(𝜙𝑅 + 𝜙𝑆𝐹) {𝜆𝜙𝑆𝐹(2 − 𝜆) + 𝜙𝑅 + (𝜆 − 1)[(𝜆 − 1)𝜙𝑆𝑁 − 𝜌]}. If
𝜌𝜆−1 < 𝜙𝑆𝑁, then 𝜕𝑓(𝜙𝑅;𝜙𝑆𝑁,𝜙𝑆𝐹)𝜕𝜙𝑅 > 0 and 𝑓(𝜙𝑅; 𝜙𝑆𝑁 , 𝜙𝑆𝐹) is an increasing function in 𝜙𝑅. Since 𝜙𝑅 ∈ (0,1), then the solution of 𝜙𝑅 exists if 𝑓(0; 𝜙𝑆𝑁, 𝜙𝑆𝐹) < 𝐿𝑆 < 𝑓(1; 𝜙𝑆𝑁, 𝜙𝑆𝐹). We consider
the following conditions.
Condition (P1) 𝜌𝜆−1 < 𝜙𝑆𝑁.
Condition (P2) 𝑓(0; 𝜙𝑆𝑁 , 𝜙𝑆𝐹) < 𝐿𝑆 < 𝑓(1; 𝜙𝑆𝑁 , 𝜙𝑆𝐹).
Under conditions (P1) and (P2), there exists a unique solution of 𝜙𝑅. Once one derives the solution
of 𝜙𝑅, the remaining endogenous variables can be solved accordingly by using (A8)-(A12).
APPENDIX B
The dynamical system and stability of the steady-state equilibrium

38
In this appendix we derive the dynamical system of the economy and examine the stability of the
steady-state equilibrium. Variables with an upper bar are used to denote the steady-state values of the
corresponding variables. Since �̇�𝑘(𝑡)𝐸𝑘(𝑡) = 𝑟(𝑡) − 𝜌, we thus have:
�̇�(𝑡)𝐸(𝑡) = �̇�𝑘(𝑡)𝐸𝑘(𝑡) = 𝑟(𝑡) − 𝜌. (B1)
Equation (7) indicates that �̇�𝐹(𝑡) = �̇�𝑁(𝑡). Using (10) and (11), we have:
𝛱𝐹(𝑡) − 𝛱𝑁(𝑡) = (𝜙𝑆𝐹 − 𝜙𝑆𝑁)𝑣𝑁(𝑡). (B2)
Substituting (8) and (9) into (B2) gives: 𝐸(𝑡) = 𝜆(𝜙𝑆𝐹 − 𝜙𝑆𝑁)𝑣𝑁(𝑡)𝑤𝑁(𝑡) − 1 . (B3)
Substituting (6) into (B3) allows us to express 𝐸(𝑡) as a function of 𝑤𝑁(𝑡): 𝐸(𝑡) = 𝐸(𝑤𝑁(𝑡)) = 𝜆(𝜙𝑆𝐹 − 𝜙𝑆𝑁)𝑎𝑅𝑤𝑁(𝑡)𝑤𝑁(𝑡) − 1 . (B4)
Using (17) and (B4), we derive 𝑛𝐹(𝑡) as a function of 𝑤𝑁(𝑡) and 𝑛𝑆(𝑡): 𝑛𝐹(𝑡) = 𝑛𝐹(𝑤𝑁(𝑡), 𝑛𝑆(𝑡)) = 𝜆 [ 𝐿𝑆(𝑤𝑁(𝑡) − 1)𝜆(𝜙𝑆𝐹 − 𝜙𝑆𝑁)𝑎𝑅𝑤𝑁(𝑡) − 𝑛𝑆𝑁(𝑡) − 𝑛𝑆𝐹(𝑡)]
= 𝜆 [ 𝐿𝑆(𝑤𝑁(𝑡) − 1)𝜆(𝜙𝑆𝐹 − 𝜙𝑆𝑁)𝑎𝑅𝑤𝑁(𝑡) − 𝑛𝑆(𝑡)]. (B5)
Combining (12) and (B5), we express 𝑛𝑁(𝑡) as a function of 𝑤𝑁(𝑡) and 𝑛𝑆(𝑡): 𝑛𝑁(𝑡) = 𝑛𝑁(𝑤𝑁(𝑡), 𝑛𝑆(𝑡)) = 1 − 𝑛𝐹(𝑤𝑁(𝑡), 𝑛𝑆(𝑡)) − 𝑛𝑆(𝑡). (B6)
Substituting (B4) and (B6) into (16) yields: 𝜙𝑅(𝑡) = 𝜙𝑅(𝑤𝑁(𝑡), 𝑛𝑆(𝑡))
= 1𝑎𝑅 [𝐿𝑁 − (𝜙𝑆𝐹 − 𝜙𝑆𝑁)𝑎𝑅𝑤𝑁(𝑡)𝑤𝑁(𝑡) − 1 𝑛𝑁(𝑤𝑁(𝑡), 𝑛𝑆(𝑡))]. (B7)
Using (B4), we derive: �̇�(𝑡)𝐸(𝑡) = −1𝑤𝑁(𝑡) − 1 𝑤�̇�(𝑡)𝑤𝑁(𝑡). (B8)
Combining (8) and (10), we have: 𝑟(𝑡) = �̇�𝑁(𝑡)𝑣𝑁(𝑡) + 𝐸(𝑡)(𝜆 − 𝑤𝑁(𝑡))𝜆𝑣𝑁(𝑡) − (𝜙𝑅(𝑡) + 𝜙𝑆𝑁). (B9)
Using (B4) to replace 𝐸(𝑡) in (B9) gives: �̇�𝑁(𝑡)𝑣𝑁(𝑡) = 𝑟(𝑡) − (𝜙𝑆𝐹 − 𝜙𝑆𝑁)(𝜆 − 𝑤𝑁(𝑡))𝑤𝑁(𝑡) − 1 + 𝜙𝑅(𝑡) + 𝜙𝑆𝑁 . (B10)

39
Equation (6) indicates that �̇�𝑁(𝑡)𝑣𝑁(𝑡) = 𝑤�̇�(𝑡)𝑤𝑁(𝑡). Next we re-write (B10) as:
𝑤�̇�(𝑡)𝑤𝑁(𝑡) = 𝑟(𝑡) − (𝜙𝑆𝐹 − 𝜙𝑆𝑁)(𝜆 − 𝑤𝑁(𝑡))𝑤𝑁(𝑡) − 1 + 𝜙𝑅(𝑡) + 𝜙𝑆𝑁 . (B11)
Substituting (B11) into (B8), we have: �̇�(𝑡)𝐸(𝑡) = −1𝑤𝑁(𝑡) − 1 [𝑟(𝑡) − (𝜙𝑆𝐹 − 𝜙𝑆𝑁)(𝜆 − 𝑤𝑁(𝑡))𝑤𝑁(𝑡) − 1 + 𝜙𝑅(𝑡) + 𝜙𝑆𝑁]. (B12)
Combining (B1), (B7), and (B12), we express 𝑟(𝑡) as a function of 𝑤𝑁(𝑡) and 𝑛𝑆(𝑡): 𝑟(𝑡) = 𝑟(𝑤𝑁(𝑡), 𝑛𝑆(𝑡))
= 1𝑤𝑁(𝑡) [(𝜙𝑆𝐹 − 𝜙𝑆𝑁)(𝜆 − 𝑤𝑁(𝑡))𝑤𝑁(𝑡) − 1 − 𝜙𝑅(𝑤𝑁(𝑡), 𝑛𝑆(𝑡)) − 𝜙𝑆𝑁 + 𝜌(𝑤𝑁(𝑡) − 1)]. (B13)
Substituting (B7) and (B13) into (B11) gives: 𝑤�̇�(𝑡) = (𝜌 + 𝜙𝑆𝐹)𝑤𝑁(𝑡) + (𝑤𝑁(𝑡) − 1)𝜙𝑅(𝑤𝑁(𝑡), 𝑛𝑆(𝑡)) − 𝜆𝜙𝑆𝐹 + 𝜙𝑆𝑁(𝜆 − 1) − 𝜌. (B14)
Substituting (B5), (B6), and (B7) into (15) yields:
�̇�𝑆(𝑡) = 𝜙𝑆𝑁𝑛𝑁(𝑤𝑁(𝑡), 𝑛𝑆(𝑡)) + 𝜙𝑆𝐹𝑛𝐹(𝑤𝑁(𝑡), 𝑛𝑆(𝑡)) − 𝜙𝑅(𝑤𝑁(𝑡), 𝑛𝑆(𝑡))𝑛𝑆(𝑡). (B15)
The dynamical system is represented by (B14) and (B15) in {𝑤𝑁(𝑡), 𝑛𝑆(𝑡)}. Linearizing (B14)
and (B15) at the steady state yields: [𝑤�̇�(𝑡)�̇�𝑆(𝑡) ] = [𝑑11 𝑑12𝑑21 𝑑22] [𝑤𝑁(𝑡) − 𝑤𝑁𝑛𝑆(𝑡) − �̅�𝑆 ], where 𝐽 = [𝑑11 𝑑12𝑑21 𝑑22] is the Jacobian matrix of this dynamical system evaluated at the steady-state
values of (𝑤𝑁, �̅�𝑆) with 𝑑11 = 𝜌 + 𝜙𝑅 + 𝜙𝑆𝐹 − (𝜙𝑆𝐹−𝜙𝑆𝑁)[1+(𝜆−1)�̅�𝑆]𝑤𝑁−1 , 𝑑12 = (𝜙𝑆𝐹 − 𝜙𝑆𝑁)𝑤𝑁(𝜆 −1) , 𝑑21 = 𝐿𝑆𝑎𝑅𝑤𝑁2 + (𝜙𝑆𝐹−𝜙𝑆𝑁)[1+(𝜆−1)�̅�𝑆]�̅�𝑆(𝑤𝑁−1)2 , and 𝑑22 = −𝜆(𝜙𝑆𝐹 − 𝜙𝑆𝑁) − 𝜙𝑅 − 𝜙𝑆𝑁 −(𝜙𝑆𝐹−𝜙𝑆𝑁)𝑤𝑁(𝜆−1)�̅�𝑆𝑤𝑁−1 .
Let 𝜂1 and 𝜂2 represent the two eigenvalues calculated from the Jacobian matrix (𝐽). The
determinant of the Jacobian matrix is derived as:
𝐷𝑒𝑡(𝐽) = 𝑑11𝑑22 − 𝑑12𝑑21 = −(𝜌 + 𝜙𝑅 + 𝜆𝜙𝑆𝐹)𝜆 − 1 𝛩,
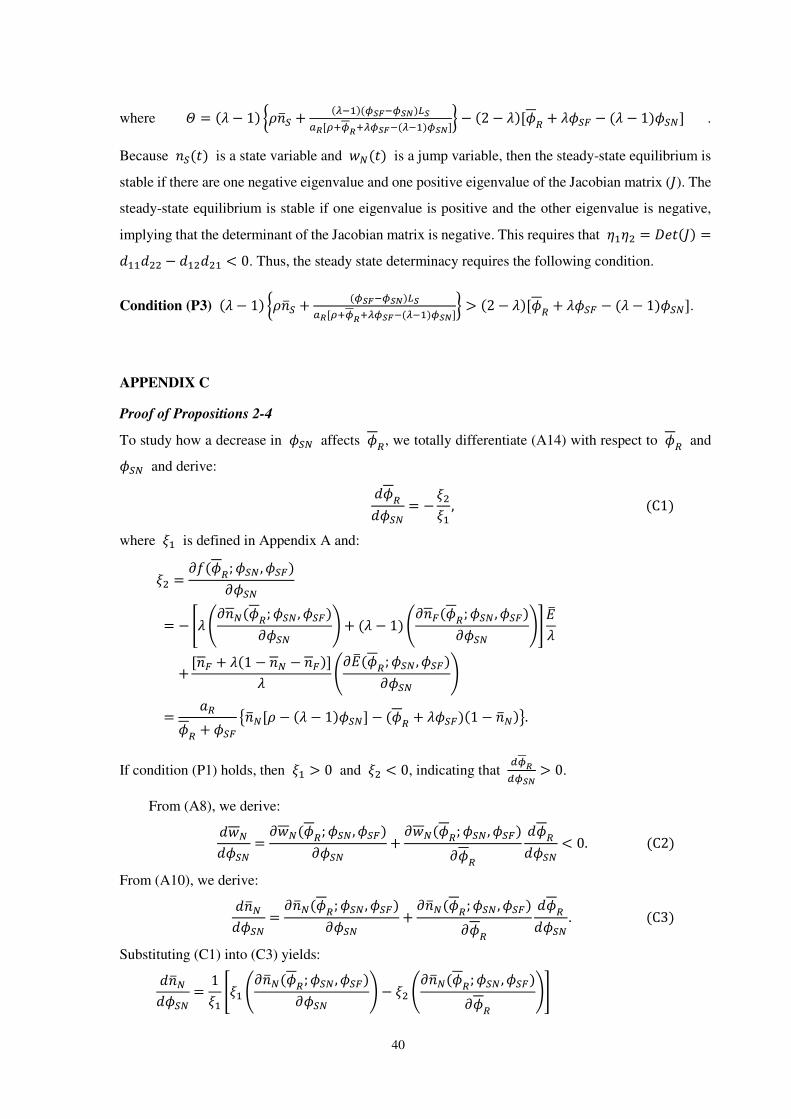
40
where 𝛩 = (𝜆 − 1) {𝜌�̅�𝑆 + (𝜆−1)(𝜙𝑆𝐹−𝜙𝑆𝑁)𝐿𝑆𝑎𝑅[𝜌+𝜙𝑅+𝜆𝜙𝑆𝐹−(𝜆−1)𝜙𝑆𝑁]} − (2 − 𝜆)[𝜙𝑅 + 𝜆𝜙𝑆𝐹 − (𝜆 − 1)𝜙𝑆𝑁] .
Because 𝑛𝑆(𝑡) is a state variable and 𝑤𝑁(𝑡) is a jump variable, then the steady-state equilibrium is
stable if there are one negative eigenvalue and one positive eigenvalue of the Jacobian matrix (𝐽). The
steady-state equilibrium is stable if one eigenvalue is positive and the other eigenvalue is negative,
implying that the determinant of the Jacobian matrix is negative. This requires that 𝜂1𝜂2 = 𝐷𝑒𝑡(𝐽) =𝑑11𝑑22 − 𝑑12𝑑21 < 0. Thus, the steady state determinacy requires the following condition.
Condition (P3) (𝜆 − 1) {𝜌�̅�𝑆 + (𝜙𝑆𝐹−𝜙𝑆𝑁)𝐿𝑆𝑎𝑅[𝜌+𝜙𝑅+𝜆𝜙𝑆𝐹−(𝜆−1)𝜙𝑆𝑁]} > (2 − 𝜆)[𝜙𝑅 + 𝜆𝜙𝑆𝐹 − (𝜆 − 1)𝜙𝑆𝑁].
APPENDIX C
Proof of Propositions 2-4
To study how a decrease in 𝜙𝑆𝑁 affects 𝜙𝑅, we totally differentiate (A14) with respect to 𝜙𝑅 and 𝜙𝑆𝑁 and derive: 𝑑𝜙𝑅𝑑𝜙𝑆𝑁 = − 𝜉2𝜉1 , (C1)
where 𝜉1 is defined in Appendix A and: 𝜉2 = 𝜕𝑓(𝜙𝑅; 𝜙𝑆𝑁 , 𝜙𝑆𝐹)𝜕𝜙𝑆𝑁
= − [𝜆 (𝜕𝑛𝑁(𝜙𝑅; 𝜙𝑆𝑁, 𝜙𝑆𝐹)𝜕𝜙𝑆𝑁 ) + (𝜆 − 1) (𝜕𝑛𝐹(𝜙𝑅; 𝜙𝑆𝑁 , 𝜙𝑆𝐹)𝜕𝜙𝑆𝑁 )] �̅�𝜆
+ [𝑛𝐹 + 𝜆(1 − 𝑛𝑁 − 𝑛𝐹)]𝜆 (𝜕�̅�(𝜙𝑅; 𝜙𝑆𝑁 , 𝜙𝑆𝐹)𝜕𝜙𝑆𝑁 )
= 𝑎𝑅𝜙𝑅 + 𝜙𝑆𝐹 {�̅�𝑁[𝜌 − (𝜆 − 1)𝜙𝑆𝑁] − (𝜙𝑅 + 𝜆𝜙𝑆𝐹)(1 − �̅�𝑁)}. If condition (P1) holds, then 𝜉1 > 0 and 𝜉2 < 0, indicating that
𝑑𝜙𝑅𝑑𝜙𝑆𝑁 > 0.
From (A8), we derive: 𝑑𝑤𝑁𝑑𝜙𝑆𝑁 = 𝜕𝑤𝑁(𝜙𝑅; 𝜙𝑆𝑁, 𝜙𝑆𝐹)𝜕𝜙𝑆𝑁 + 𝜕𝑤𝑁(𝜙𝑅; 𝜙𝑆𝑁, 𝜙𝑆𝐹)𝜕𝜙𝑅𝑑𝜙𝑅𝑑𝜙𝑆𝑁 < 0. (C2)
From (A10), we derive: 𝑑�̅�𝑁𝑑𝜙𝑆𝑁 = 𝜕�̅�𝑁(𝜙𝑅; 𝜙𝑆𝑁 , 𝜙𝑆𝐹)𝜕𝜙𝑆𝑁 + 𝜕�̅�𝑁(𝜙𝑅; 𝜙𝑆𝑁 , 𝜙𝑆𝐹)𝜕𝜙𝑅𝑑𝜙𝑅𝑑𝜙𝑆𝑁 . (C3)
Substituting (C1) into (C3) yields: 𝑑�̅�𝑁𝑑𝜙𝑆𝑁 = 1𝜉1 [𝜉1 (𝜕�̅�𝑁(𝜙𝑅; 𝜙𝑆𝑁 , 𝜙𝑆𝐹)𝜕𝜙𝑆𝑁 ) − 𝜉2 (𝜕�̅�𝑁(𝜙𝑅; 𝜙𝑆𝑁 , 𝜙𝑆𝐹)𝜕𝜙𝑅 )]

41
= 1𝜙𝑅 + 𝜙𝑆𝑁 + 𝜆(𝜙𝑆𝐹 − 𝜙𝑆𝑁) + 𝜌 [(𝜆 − 1)𝑛𝑁 − (𝜆 − 1 + 𝑛𝑁) ( 𝑑𝜙𝑅𝑑𝜙𝑆𝑁)]. (C4)
Since 𝑑𝜙𝑅𝑑𝜙𝑆𝑁 > 0, then (C4) indicates that
𝑑�̅�𝑁𝑑𝜙𝑆𝑁 > 0 if and only if ( 𝑑𝜙𝑅𝑑𝜙𝑆𝑁) < (𝜆−1)𝑛𝑁𝜆−1+𝑛𝑁. This means that
a decrease in 𝜙𝑆𝑁 will raise �̅�𝑁 if it does not cause a large increase in 𝜙𝑅 and vice versa.
Using (A9), we derive: 𝑑�̅�𝑑𝜙𝑆𝑁 = 𝜕�̅�(𝜙𝑅; 𝜙𝑆𝑁, 𝜙𝑆𝐹)𝜕𝜙𝑆𝑁 + 𝜕�̅�(𝜙𝑅; 𝜙𝑆𝑁 , 𝜙𝑆𝐹)𝜕𝜙𝑅𝑑𝜙𝑅𝑑𝜙𝑆𝑁
= 𝜆𝑎𝑅𝜆 − 1 [( 𝑑𝜙𝑅𝑑𝜙𝑆𝑁) − (𝜆 − 1)]. (C5)
Since (𝜆−1)𝑛𝑁𝜆−1+𝑛𝑁 < (𝜆 − 1), (C5) indicates that
𝑑�̅�𝑑𝜙𝑆𝑁 < 0 if ( 𝑑𝜙𝑅𝑑𝜙𝑆𝑁) < (𝜆−1)𝑛𝑁𝜆−1+𝑛𝑁.
From (A12), we derive: 𝑑�̅�𝐹𝑑𝜙𝑆𝑁 = 𝜕�̅�𝐹(𝜙𝑅; 𝜙𝑆𝑁 , 𝜙𝑆𝐹)𝜕𝜙𝑆𝑁 + 𝜕�̅�𝐹(𝜙𝑅; 𝜙𝑆𝑁 , 𝜙𝑆𝐹)𝜕𝜙𝑅𝑑𝜙𝑅𝑑𝜙𝑆𝑁
= − 1𝜙𝑅 + 𝜙𝑆𝐹 [�̅�𝑁 − (1 − �̅�𝑁 − �̅�𝐹) ( 𝑑𝜙𝑅𝑑𝜙𝑆𝑁) + (𝜙𝑅 + 𝜙𝑆𝑁) (𝑑𝑛𝑁(𝜙𝑅; 𝜙𝑆𝑁 , 𝜙𝑆𝐹)𝑑𝜙𝑆𝑁 )]. (C6)
If ( 𝑑𝜙𝑅𝑑𝜙𝑆𝑁) < (𝜆−1)𝑛𝑁𝜆−1+𝑛𝑁, then (C6) indicates that 𝑑�̅�𝐹𝑑𝜙𝑆𝑁 < 0 since
(𝜆−1)𝑛𝑁𝜆−1+𝑛𝑁 < 𝑛𝑁𝜆−1+𝑛𝑁.
Using (A11), we have: 𝑑�̅�𝑆𝑁𝑑𝜙𝑆𝑁 = 𝜕�̅�𝑆𝑁(𝜙𝑅; 𝜙𝑆𝑁, 𝜙𝑆𝐹)𝜕𝜙𝑆𝑁 + 𝜕�̅�𝑆𝑁(𝜙𝑅; 𝜙𝑆𝑁 , 𝜙𝑆𝐹)𝜕𝜙𝑅𝑑𝜙𝑅𝑑𝜙𝑆𝑁
= 1𝜙𝑅2 {�̅�𝑁 [𝜙𝑅 − 𝜙𝑆𝑁 ( 𝑑𝜙𝑅𝑑𝜙𝑆𝑁)] + (𝜙𝑅𝜙𝑆𝑁) (𝑑𝑛𝑁(𝜙𝑅; 𝜙𝑆𝑁 , 𝜙𝑆𝐹)𝑑𝜙𝑆𝑁 )}. (C7)
Using (A5), we derive 𝜙𝑆𝑁 = �̅�𝑆𝑁𝜙𝑅�̅�𝑁 . If ( 𝑑𝜙𝑅𝑑𝜙𝑆𝑁) < (𝜆−1)𝑛𝑁𝜆−1+𝑛𝑁 , then we derive 𝜙𝑆𝑁 ( 𝑑𝜙𝑅𝑑𝜙𝑆𝑁) <(𝜆−1)�̅�𝑆𝑁𝜆−1+𝑛𝑁 𝜙𝑅 < 𝜙𝑅, implying that
𝑑�̅�𝑆𝑁𝑑𝜙𝑆𝑁 > 0.
From (A13), we have: 𝑑�̅�𝑆𝐹𝑑𝜙𝑆𝑁 = − ( 𝑑�̅�𝑁𝑑𝜙𝑆𝑁) − ( 𝑑�̅�𝐹𝑑𝜙𝑆𝑁) − (𝑑�̅�𝑆𝑁𝑑𝜙𝑆𝑁). (C8)
Using (C6) and (C7) to substitute ( 𝑑�̅�𝐹𝑑𝜙𝑆𝑁) and (𝑑�̅�𝑆𝑁𝑑𝜙𝑆𝑁) into (C8) gives:
𝑑�̅�𝑆𝐹𝑑𝜙𝑆𝑁 = − 𝜙𝑆𝐹(𝜙𝑅 + 𝜙𝑆𝑁)(𝜙𝑅 + 𝜙𝑆𝐹)𝜙𝑅 ( 𝑑�̅�𝑁𝑑𝜙𝑆𝑁)

42
− 1(𝜙𝑅 + 𝜙𝑆𝐹)𝜙𝑅2 [𝜙𝑆𝐹𝜙𝑅�̅�𝑁 + [𝜙𝑅2(1 − �̅�𝑁 − �̅�𝐹) − (𝜙𝑅 + 𝜙𝑆𝐹)𝜙𝑆𝑁�̅�𝑁] ( 𝑑𝜙𝑅𝑑𝜙𝑆𝑁)]. (C9)
Using (A5) to replace 𝜙𝑆𝑁�̅�𝑁 in (C9) by �̅�𝑆𝑁𝜙𝑅 yields: 𝑑�̅�𝑆𝐹𝑑𝜙𝑆𝑁 = − 1(𝜙𝑅 + 𝜙𝑆𝐹)𝜙𝑅 {𝜙𝑆𝐹(𝜙𝑅 + 𝜙𝑆𝑁) ( 𝑑�̅�𝑁𝑑𝜙𝑆𝑁) + 𝜙𝑆𝐹�̅�𝑁 + [(1 − �̅�𝑁 − �̅�𝐹)𝜙𝑅− (𝜙𝑅 + 𝜙𝑆𝐹)�̅�𝑆𝑁] ( 𝑑𝜙𝑅𝑑𝜙𝑆𝑁)}. (C10)
If ( 𝑑𝜙𝑅𝑑𝜙𝑆𝑁) < (𝜆−1)𝑛𝑁𝜆−1+𝑛𝑁, then we derive 𝜙𝑆𝐹�̅�𝑁 > (𝜙𝑅 + 𝜙𝑆𝐹)�̅�𝑆𝑁 ( 𝑑𝜙𝑅𝑑𝜙𝑆𝑁), implying that 𝑑�̅�𝑆𝐹𝑑𝜙𝑆𝑁 <
0.
APPENDIX D
Proof of Propositions 5-7
To study how a decrease in 𝜙𝑆𝐹 affects 𝜙𝑅, we totally differentiate (A14) with respect to 𝜙𝑅 and 𝜙𝑆𝐹 and derive: 𝑑𝜙𝑅𝑑𝜙𝑆𝐹 = − 𝜉3𝜉1 , (D1)
where 𝜉1 is given in Appendix A and: 𝜉3 = 𝜕𝑓(𝜙𝑅; 𝜙𝑆𝑁 , 𝜙𝑆𝐹)𝜕𝜙𝑆𝐹
= − [𝜆 (𝜕𝑛𝑁(𝜙𝑅; 𝜙𝑆𝑁, 𝜙𝑆𝐹)𝜕𝜙𝑆𝐹 ) + (𝜆 − 1) (𝜕𝑛𝐹(𝜙𝑅; 𝜙𝑆𝑁 , 𝜙𝑆𝐹)𝜕𝜙𝑆𝐹 )] �̅�𝜆
+ [𝜆(1 − 𝑛𝑁) − (𝜆 − 1)𝑛𝐹]𝜆 (𝜕�̅�(𝜙𝑅; 𝜙𝑆𝑁, 𝜙𝑆𝐹)𝜕𝜙𝑆𝐹 )
= {−[𝜙𝑅 + 𝜙𝑆𝑁 + 𝜆(𝜙𝑆𝐹 − 𝜙𝑆𝑁)] (𝜕𝑛𝑁(𝜙𝑅; 𝜙𝑆𝑁 , 𝜙𝑆𝐹)𝜕𝜙𝑆𝐹 ) + (𝜆 − 1)𝑛𝐹} �̅�𝜆(𝜙𝑅 + 𝜙𝑆𝐹)
+ [𝑛𝐹 + 𝜆(1 − 𝑛𝑁 − 𝑛𝐹)]𝜆 (𝜕�̅�(𝜙𝑅; 𝜙𝑆𝑁 , 𝜙𝑆𝐹)𝜕𝜙𝑆𝐹 ). Since
𝜕𝑛𝑁(𝜙𝑅;𝜙𝑆𝑁,𝜙𝑆𝐹)𝜕𝜙𝑆𝐹 < 0 and 𝜕�̅�(𝜙𝑅;𝜙𝑆𝑁,𝜙𝑆𝐹)𝜕𝜙𝑆𝐹 > 0, then 𝜉3 > 0. If condition (P1) holds, then 𝜉1 >
0. Thus, we have 𝑑𝜙𝑅𝑑𝜙𝑆𝐹 < 0.
From (A8), we derive:

43
𝑑𝑤𝑁𝑑𝜙𝑆𝐹 = 𝜕𝑤𝑁(𝜙𝑅; 𝜙𝑆𝑁 , 𝜙𝑆𝐹)𝜕𝜙𝑆𝐹 + 𝜕𝑤𝑁(𝜙𝑅; 𝜙𝑆𝑁 , 𝜙𝑆𝐹)𝜕𝜙𝑅𝑑𝜙𝑅𝑑𝜙𝑆𝐹 > 0. (D2)
From (A9), we derive: 𝑑�̅�𝑑𝜙𝑆𝐹 = 𝜕�̅�(𝜙𝑅; 𝜙𝑆𝑁, 𝜙𝑆𝐹)𝜕𝜙𝑆𝐹 + 𝜕�̅�(𝜙𝑅; 𝜙𝑆𝑁 , 𝜙𝑆𝐹)𝜕𝜙𝑅𝑑𝜙𝑅𝑑𝜙𝑆𝐹 . (D3)
Substituting (D1) into (D3) yields: 𝑑�̅�𝑑𝜙𝑆𝐹 = 1𝜉1 [𝜉1 (𝜕�̅�(𝜙𝑅; 𝜙𝑆𝑁, 𝜙𝑆𝐹)𝜕𝜙𝑆𝐹 ) − 𝜉3 (𝜕�̅�(𝜙𝑅; 𝜙𝑆𝑁, 𝜙𝑆𝐹)𝜕𝜙𝑅 )]
= 𝜆𝑎𝑅2 {𝜆[𝜙𝑅 + 𝜙𝑆𝑁 + 𝜆(𝜙𝑆𝐹 − 𝜙𝑆𝑁)] − [𝜙𝑅 + 𝜙𝑆𝑁 + 𝜆(𝜙𝑆𝐹 − 𝜙𝑆𝑁) + 𝜌][𝑛𝐹 + 𝜆(1 − 𝑛𝑁 − 𝑛𝐹)]}(𝜆 − 1)𝜉1(𝜙𝑅 + 𝜙𝑆𝐹) . Using (A9) and (17), we respectively replace [𝜙𝑅 + 𝜙𝑆𝑁 + 𝜆(𝜙𝑆𝐹 − 𝜙𝑆𝑁) + 𝜌] by
(𝜆−1)�̅�𝜆𝑎𝑅 and
[𝑛𝐹 + 𝜆(1 − 𝑛𝑁 − 𝑛𝐹)] by 𝐿𝑆𝜆�̅� and derive: 𝑑�̅�𝑑𝜙𝑆𝐹 = 𝜆2𝑎𝑅(𝜆 − 1)𝜉1(𝜙𝑅 + 𝜙𝑆𝐹) {𝜆[𝜙𝑅 + 𝜙𝑆𝑁 + 𝜆(𝜙𝑆𝐹 − 𝜙𝑆𝑁)] − (𝜆 − 1)𝐿𝑆𝑎𝑅 }
> 𝜆2𝑎𝑅(𝜆 − 1)𝜉1(𝜙𝑅 + 𝜙𝑆𝐹) {𝜆[𝜆(𝜙𝑆𝐹 − 𝜙𝑆𝑁) + 𝜙𝑆𝐹] − (𝜆 − 1)𝐿𝑆𝑎𝑅 }. Therefore,
𝑑�̅�𝑑𝜙𝑆𝐹 > 0 if 𝐿𝑆 < 𝜆𝑎𝑅𝜆−1 [𝜆(𝜙𝑆𝐹 − 𝜙𝑆𝑁) + 𝜙𝑆𝐹]. From (A10), we derive: 𝑑�̅�𝑁𝑑𝜙𝑆𝐹 = 𝜕�̅�𝑁(𝜙𝑅; 𝜙𝑆𝑁, 𝜙𝑆𝐹)𝜕𝜙𝑆𝐹 + 𝜕�̅�𝑁(𝜙𝑅; 𝜙𝑆𝑁, 𝜙𝑆𝐹)𝜕𝜙𝑅
𝑑𝜙𝑅𝑑𝜙𝑆𝐹 . (D4)
Substituting (D1) into (D4) yields: 𝑑�̅�𝑁𝑑𝜙𝑆𝐹 = 1𝜉1 [𝜉1 (𝜕�̅�𝑁(𝜙𝑅; 𝜙𝑆𝑁 , 𝜙𝑆𝐹)𝜕𝜙𝑆𝐹 ) − 𝜉3 (𝜕�̅�𝑁(𝜙𝑅; 𝜙𝑆𝑁, 𝜙𝑆𝐹)𝜕𝜙𝑅 )]
= −1𝜉1[𝜙𝑅 + 𝜙𝑆𝑁 + 𝜆(𝜙𝑆𝐹 − 𝜙𝑆𝑁) + 𝜌] [𝜆�̅�𝑁𝜉1 − (𝜆−1 + �̅�𝑁)𝜉3] = 𝑎𝑅ℎ1(𝜙𝑅; 𝜙𝑆𝐹 , 𝜙𝑆𝑁)𝜉1(𝜙𝑅 + 𝜙𝑆𝐹)[𝜙𝑅 + 𝜙𝑆𝑁 + 𝜆(𝜙𝑆𝐹 − 𝜙𝑆𝑁) + 𝜌], (D5)
where ℎ1(𝜙𝑅; 𝜙𝑆𝑁, 𝜙𝑆𝐹) = [𝜙𝑅 + 𝜙𝑆𝑁 + 𝜆(𝜙𝑆𝐹 − 𝜙𝑆𝑁) + 𝜌][𝜆𝑛𝑁 + (𝜆 − 1)𝑛𝐹](1 − 𝑛𝑁) +[𝜆(1 − 𝑛𝑁) − (𝜆 − 1)𝑛𝐹)]𝜆(𝜙𝑅 + 𝜙𝑆𝐹) > 0. Therefore, we have 𝑑�̅�𝑁𝑑𝜙𝑆𝐹 > 0.
From (A12), we derive: 𝑑�̅�𝐹𝑑𝜙𝑆𝐹 = 𝜕�̅�𝐹(𝜙𝑅; 𝜙𝑆𝑁 , 𝜙𝑆𝐹)𝜕𝜙𝑆𝐹 + 𝜕�̅�𝐹(𝜙𝑅; 𝜙𝑆𝑁, 𝜙𝑆𝐹)𝜕𝜙𝑅𝑑𝜙𝑅𝑑𝜙𝑆𝐹
= − 1𝜙𝑅 + 𝜙𝑆𝐹 [(𝜙𝑅 + 𝜙𝑆𝑁) (𝜕𝑛𝑁(𝜙𝑅; 𝜙𝑆𝑁, 𝜙𝑆𝐹)𝜕𝜙𝑆𝐹 ) + �̅�𝐹 − (1 − �̅�𝑁 − �̅�𝐹) ( 𝑑𝜙𝑅𝑑𝜙𝑆𝐹)] < 0.

44
From (A11), we derive: 𝑑�̅�𝑆𝑁𝑑𝜙𝑆𝐹 = 𝜕�̅�𝑆𝑁(𝜙𝑅; 𝜙𝑆𝑁 , 𝜙𝑆𝐹)𝜕𝜙𝑆𝐹 + 𝜕�̅�𝑆𝑁(𝜙𝑅; 𝜙𝑆𝑁, 𝜙𝑆𝐹)𝜕𝜙𝑅𝑑𝜙𝑅𝑑𝜙𝑆𝐹
= 1𝜉1 [𝜉1 (𝜕�̅�𝑆𝑁(𝜙𝑅; 𝜙𝑆𝑁 , 𝜙𝑆𝐹)𝜕𝜙𝑆𝐹 ) − 𝜉3 (𝜕�̅�𝑆𝑁(𝜙𝑅; 𝜙𝑆𝑁 , 𝜙𝑆𝐹)𝜕𝜙𝑅 )]
= 1𝜉1 { 𝜙𝑆𝑁𝜙𝑅 𝜉1 (𝜕�̅�𝑁(𝜙𝑅; 𝜙𝑆𝑁 , 𝜙𝑆𝐹)𝜕𝜙𝑆𝐹 ) − 𝜙𝑆𝑁𝜙𝑅 [(𝜕𝑛𝑁(𝜙𝑅; 𝜙𝑆𝑁 , 𝜙𝑆𝐹)𝜕𝜙𝑅 ) − 𝑛𝑁𝜙𝑅 ] 𝜉3}.
(D6)
Since 𝑑�̅�𝑁𝑑𝜙𝑆𝐹 > 0, (D5) indicates that 𝜉1 (𝜕�̅�𝑁(𝜙𝑅;𝜙𝑆𝑁,𝜙𝑆𝐹)𝜕𝜙𝑆𝐹 ) > 𝜉3 (𝜕�̅�𝑁(𝜙𝑅;𝜙𝑆𝑁,𝜙𝑆𝐹)𝜕𝜙𝑅 ). Thus, we have
𝑑�̅�𝑆𝑁𝑑𝜙𝑆𝐹 > 0. Since an increase in 𝜙𝑆𝐹 raises �̅�𝑁 and �̅�𝑆𝑁 while reducing �̅�𝐹 and �̅�𝑆𝐹 = 1 − �̅�𝑁 −�̅�𝐹 − �̅�𝑆𝑁, the change of �̅�𝑆𝐹 is ambiguous.
APPENDIX E
A model where imitation targets only Southern-produced goods by multinationals
In this appendix, we consider a model where imitation targets only goods produced through FDI. Since
Southern firms only imitate goods produced in the South through FDI, it implies that 𝜙𝑆𝑁 = 0 and 𝑛𝑆𝑁 = 0. Moreover, there is no need to consider (13). We use variables with an upper bar to represent
the steady-state values of the corresponding variables. Since �̇�𝑘(𝑡)𝐸𝑘(𝑡) = 𝑟(𝑡) − 𝜌, we thus have:
�̇�(𝑡)𝐸(𝑡) = �̇�𝑘(𝑡)𝐸𝑘(𝑡) = 𝑟(𝑡) − 𝜌. (E1)
Equation (7) indicates that �̇�𝐹(𝑡) = �̇�𝑁(𝑡). Using (10) and (11), we have:
𝛱𝐹(𝑡) − 𝛱𝑁(𝑡) = 𝜙𝑆𝐹𝑣𝑁(𝑡). (E2)
Substituting (8) and (9) into (E2) gives: 𝐸(𝑡) = 𝜆𝜙𝑆𝐹𝑣𝑁(𝑡)𝑤𝑁(𝑡) − 1 . (E3)
Substituting (6) into (E3) allows us to express 𝐸(𝑡) as a function of 𝑤𝑁(𝑡): 𝐸(𝑡) = 𝐸(𝑤𝑁(𝑡)) = 𝜆𝜙𝑆𝐹𝑎𝑅𝑤𝑁(𝑡)𝑤𝑁(𝑡) − 1 . (E4)
Using (17) and (E4), we derive 𝑛𝐹(𝑡) as a function of 𝑤𝑁(𝑡) and 𝑛𝑆𝐹(𝑡): 𝑛𝐹(𝑡) = 𝑛𝐹(𝑤𝑁(𝑡), 𝑛𝑆𝐹(𝑡)) = 𝜆 [𝐿𝑆(𝑤𝑁(𝑡) − 1)𝜆𝜙𝑆𝐹𝑎𝑅𝑤𝑁(𝑡) − 𝑛𝑆𝐹(𝑡)]. (E5)

45
Combining (12) and (E5), we express 𝑛𝑁(𝑡) as a function of 𝑤𝑁(𝑡) and 𝑛𝑆𝐹(𝑡): 𝑛𝑁(𝑡) = 𝑛𝑁(𝑤𝑁(𝑡), 𝑛𝑆𝐹(𝑡)) = 1 − 𝑛𝐹(𝑤𝑁(𝑡), 𝑛𝑆𝐹(𝑡)) − 𝑛𝑆𝐹(𝑡). (E6)
Substituting (E4) and (E6) into (16) yields: 𝜙𝑅(𝑡) = 𝜙𝑅(𝑤𝑁(𝑡), 𝑛𝑆𝐹(𝑡))
= 1𝑎𝑅 [𝐿𝑁 − 𝜙𝑆𝐹𝑎𝑅𝑤𝑁(𝑡)𝑤𝑁(𝑡) − 1 𝑛𝑁(𝑤𝑁(𝑡), 𝑛𝑆𝐹(𝑡))]. (E7)
Using (E4), we derive: �̇�(𝑡)𝐸(𝑡) = −1𝑤𝑁(𝑡) − 1 𝑤�̇�(𝑡)𝑤𝑁(𝑡). (E8)
Combining (8) and (10), we have: 𝑟(𝑡) = �̇�𝑁(𝑡)𝑣𝑁(𝑡) + 𝐸(𝑡)(𝜆 − 𝑤𝑁(𝑡))𝜆𝑣𝑁(𝑡) − 𝜙𝑅(𝑡). (E9)
Using (E4) to replace 𝐸(𝑡) in (E9) gives: �̇�𝑁(𝑡)𝑣𝑁(𝑡) = 𝑟(𝑡) − 𝜙𝑅(𝑡)(𝜆 − 𝑤𝑁(𝑡))𝑤𝑁(𝑡) − 1 + 𝜙𝑅(𝑡). (E10)
Equation (6) indicates that �̇�𝑁(𝑡)𝑣𝑁(𝑡) = 𝑤�̇�(𝑡)𝑤𝑁(𝑡). Thus, we re-write (E10) as:
𝑤�̇�(𝑡)𝑤𝑁(𝑡) = 𝑟(𝑡) − 𝜙𝑅(𝑡)(𝜆 − 𝑤𝑁(𝑡))𝑤𝑁(𝑡) − 1 + 𝜙𝑅(𝑡). (E11)
Substituting (E11) into (E8), we have: �̇�(𝑡)𝐸(𝑡) = −1𝑤𝑁(𝑡) − 1 [𝑟(𝑡) − 𝜙𝑆𝐹(𝜆 − 𝑤𝑁(𝑡))𝑤𝑁(𝑡) − 1 + 𝜙𝑅(𝑡)]. (E12)
Combining (E1), (E7), and (E12), we express 𝑟(𝑡) as a function of 𝑤𝑁(𝑡) and 𝑛𝑆𝐹(𝑡): 𝑟(𝑡) = 𝑟(𝑤𝑁(𝑡), 𝑛𝑆𝐹(𝑡))
= 1𝑤𝑁(𝑡) [𝜙𝑆𝐹(𝜆 − 𝑤𝑁(𝑡))𝑤𝑁(𝑡) − 1 − 𝜙𝑅(𝑤𝑁(𝑡), 𝑛𝑆𝐹(𝑡)) + 𝜌(𝑤𝑁(𝑡) − 1)]. (E13)
Substituting (E7) and (E13) into (E11) gives: 𝑤�̇�(𝑡) = (𝜌 + 𝜙𝑆𝐹)𝑤𝑁(𝑡) + (𝑤𝑁(𝑡) − 1)𝜙𝑅(𝑤𝑁(𝑡), 𝑛𝑆𝐹(𝑡)) − 𝜆𝜙𝑆𝐹 − 𝜌. (E14)
Substituting (E5), (E6), and (E7) into (15) yields:
�̇�𝑆𝐹(𝑡) = 𝜙𝑆𝐹𝑛𝐹(𝑤𝑁(𝑡), 𝑛𝑆𝐹(𝑡)) − 𝜙𝑅(𝑤𝑁(𝑡), 𝑛𝑆𝐹(𝑡))𝑛𝑆𝐹(𝑡). (E15)
The dynamical system is represented by (E14) and (E15) in {𝑤𝑁(𝑡), 𝑛𝑆𝐹(𝑡)}. Linearizing (E14)
and (E15) at the steady state yields the following Jacobian matrix (𝐽): [𝑤�̇�(𝑡)�̇�𝑆𝐹(𝑡)] = [𝑢11 𝑢12𝑢21 𝑢22] [ 𝑤𝑁(𝑡) − 𝑤𝑁𝑛𝑆𝐹(𝑡) − �̅�𝑆𝐹],

46
where 𝑢11 = 𝜌 + 𝜙𝑅 + 𝜙𝑆𝐹 − 𝜙𝑆𝐹[1+(𝜆−1)�̅�𝑆𝐹]𝑤𝑁−1 , 𝑢12 = 𝜙𝑆𝐹𝑤𝑁(𝜆 − 1) , 𝑢21 = 𝐿𝑆𝑎𝑅𝑤𝑁2 +𝜙𝑆𝐹[1+(𝜆−1)�̅�𝑆𝐹]�̅�𝑆𝐹(𝑤𝑁−1)2 , and 𝑢22 = −𝜆𝜙𝑆𝐹 − 𝜙𝑅 − 𝜙𝑆𝐹𝑤𝑁(𝜆−1)�̅�𝑆𝑤𝑁−1 .
Let 𝜂3 and 𝜂4 represent the two eigenvalues calculated from the Jacobian matrix of this
dynamical system evaluated at the steady-state values of (𝑤𝑁, �̅�𝑆𝐹). Because 𝑛𝑆𝐹(𝑡) is a state variable
and 𝑤𝑁(𝑡) is a jump variable, the steady-state equilibrium is therefore stable if there are one negative
eigenvalue and one positive eigenvalue. The steady-state equilibrium is then stable if the determinant
of the Jacobian matrix (𝐷𝑒𝑡(𝐽)) is negative; that is, 𝜂3𝜂4 = 𝐷𝑒𝑡(𝐽) < 0. The determinant of the
Jacobian matrix is derived as: 𝐷𝑒𝑡(𝐽) = 𝑢11𝑢22 − 𝑢12𝑢21
= −(𝜌 + 𝜙𝑅 + 𝜆𝜙𝑆𝐹)𝜆 − 1 {(𝜆 − 1) [𝜌�̅�𝑆𝐹 + (𝜆 − 1)𝜙𝑆𝐹𝐿𝑆𝑎𝑅(𝜌 + 𝜙𝑅 + 𝜆𝜙𝑆𝐹)] − (2 − 𝜆)(𝜙𝑅 + 𝜆𝜙𝑆𝐹)}. Therefore, the steady-state determinacy requires that (𝜆 − 1) [𝜌�̅�𝑆𝐹 + (𝜆−1)𝜙𝑆𝐹𝐿𝑆𝑎𝑅(𝜌+𝜙𝑅+𝜆𝜙𝑆𝐹)] > (2 −𝜆)(𝜙𝑅 + 𝜆𝜙𝑆𝐹).
APPENDIX F (Not Intended for Publication)
Literature for calibration
For the benchmark model, we assign the discount factor 𝜌 = 0.01 to generate a 1% real interest rate
at the steady state. The one-stage quality improvement is set at 𝜆 = 1.35 to match the Northern
markup of 35%. The Northern population is assigned to 0.9 and the Southern population is assigned
to 1.35 so that the North-South relative wage is about 1.2. We set the labor intensity for R&D (𝑎𝑅) to
1.5. Ideally, the data of 𝑛𝑁, 𝑛𝐹, 𝑛𝑆𝑁, and 𝑛𝑆𝐹 can be used to set the parameter values of 𝐿𝑁, 𝐿𝑆, 𝜙𝑆𝑁, and 𝜙𝑆𝐹 . Unfortunately, such data are not available.
We survey the literature and look for studies that conduct numerical analysis based on a product-
cycle model. These studies include Glass (1999), Glass and Saggi (2001, 2002), Glass (2004), Tanaka,
Iwaisako, and Futagami (2007), and Tanaka and Iwaisako (2014). Table F1 summarizes the parameter
values used in these studies. As shown in Table F1, there is a wide variety of parameter values.
Unfortunately, all these studies do not explain why these parameter values are assigned.
Table F2 also indicates that these parameter values generate very different results for 𝑛𝑁, 𝑛𝐹,
and 𝑛𝑆. As shown in Table F2 in this report, the numerical results of 𝑛𝑁, 𝑛𝐹, and 𝑛𝑆 vary a lot in
previous studies. It seems that there is no consensus on what the reasonable values for 𝑛𝑁, 𝑛𝐹, and 𝑛𝑆 should be.

47
Table F1 Summary of parameter values used in the related literature
𝜌 𝜆 𝑎𝑅 𝑎𝐹/𝑎𝑂 𝜙𝑆 𝐿𝑆 𝐿𝑁
Glass (1999) 4% 3 2 N/A endogenized 2 4
Glass and Saggi (2001) 16 2 2 1 N/A 1 174
Glass and Saggi (2002) 0.05 4 3 0.2 endogenized 6 3
Glass (2004) 112 3 1 0 0.5 1 2
Tanaka , Iwaisako, and
Futagami (2007)
0.05 1.5 7 3.5 N/A 2 1
Tanaka and Iwaisako (2014) 0.05 4 123.5 0 0.037 6 3
Notes: 1. The parameters 𝑎𝑂 and 𝑎𝐹 respectively represent the labor resources required for outsourcing and
FDI. 2. The parameter (variable) 𝜙𝑆 represents the rate of imitation. Imitation risk is not a concern in Glass and
Saggi (2001) and Tanaka et al. (2007). The imitation rate 𝜙𝑆 is exogenously given at 0.5 in Glass (2004) and
at 0.037 in Tanaka and Iwaisako (2014) while it is endogenously determined in Glass (1999) and Glass and
Saggi (2002).
Table F2 Summary of results in the related literature
𝑤𝑁 𝑛𝑁 𝑛𝐹 𝑛𝑆
Glass (1999) 1.3 72% 20% 8%
Glass and Saggi (2001) 1.5 not reported not reported not reported
Glass and Saggi (2002) 1.5 22.1% 32.3% 45.6%
Glass (2004) 2.17 66.8% 18.1% 15.1%
Tanaka , Iwaisako, and
Futagami (2007)
not reported not reported not reported not reported
Tanaka and Iwaisako
(2014)
not reported not reported not reported not reported
Note: The focus of Tanaka et al. (2007) and Tanaka and Iwaisako (2014) is on welfare, and they do not report
the values of 𝑤𝑁, 𝑛𝑁, 𝑛𝐹, and 𝑛𝑆.
References
Glass, A.J., 1999. Imitation as a stepping stone to innovation. OSU Working Paper No. 99-11.
Glass, A.J., Saggi, K., 2001. Innovation and wage effects of international outsourcing. European
Economic Review 45, 67-86.
Glass, A.J., Saggi, K., 2002. Intellectual property rights and foreign direct investment. Journal of
International Economics 56, 387-410.
Glass, A.J., 2004. Outsourcing under imperfect protection of intellectual property. Review of
International Economics 12, 867-884.

48
Tanaka, H., Iwaisako, T., 2014. Intellectual property rights and foreign direct investment: A
welfare analysis. European Economic Review 67, 107-124.
Tanaka, H., Iwaisako, T., Futagami, K., 2007. Dynamic analysis of innovation and international
transfer of technology through licensing. Journal of International Economics 73, 189-212.


