
Injuries & Fatalities In Wyoming
WOGISA Quarterly Meeting, Rock Springs, July 13, 2011
Timothy Ryan, State Occupational Epidemiologist, Office of the Governor

Estimated Annual Incidence Rate of Work-related Injuries and Illnesses, per 100,000 FTEs , WY and US, 2002-2009
Year
Estimated Annual Total Work-related Injury and
Illness Incidence Rate Per 100,000 FTEs
(WY)*
Estimated Annual Total Work-related Injury and
Illness Incidence Rate Per 100,000 FTEs
(US)*
Estimated Annual Incidence Rate Involving Days Away from Work
Per 100,000FTEs
(WY)**
Estimated Annual Incidence Rate Involving Days Away from Work
Per 100,000FTEs
(US)**
2002 5,600 5,200 2,200 1,600
2003 5,800 5,000 2,500 1,500
2004 5,300 4,800 2,300 1,400
2005 5,800 4,600 2,300 1,400
2006 4,800 4,400 1,900 1,300
2007 4,600 4,200 1,800 1,200
2008 4,600 3,900 1,600 1,100
2009 4,000 3,600 1,400 1,100
Source: Bureau of Labor Statistics, Survey of Occupational Injuries and Illnesses
*Incidence rates for total reportable cases. **Incidence rates involving days away from work include those that results in days away from work with or without job transfer or restriction.
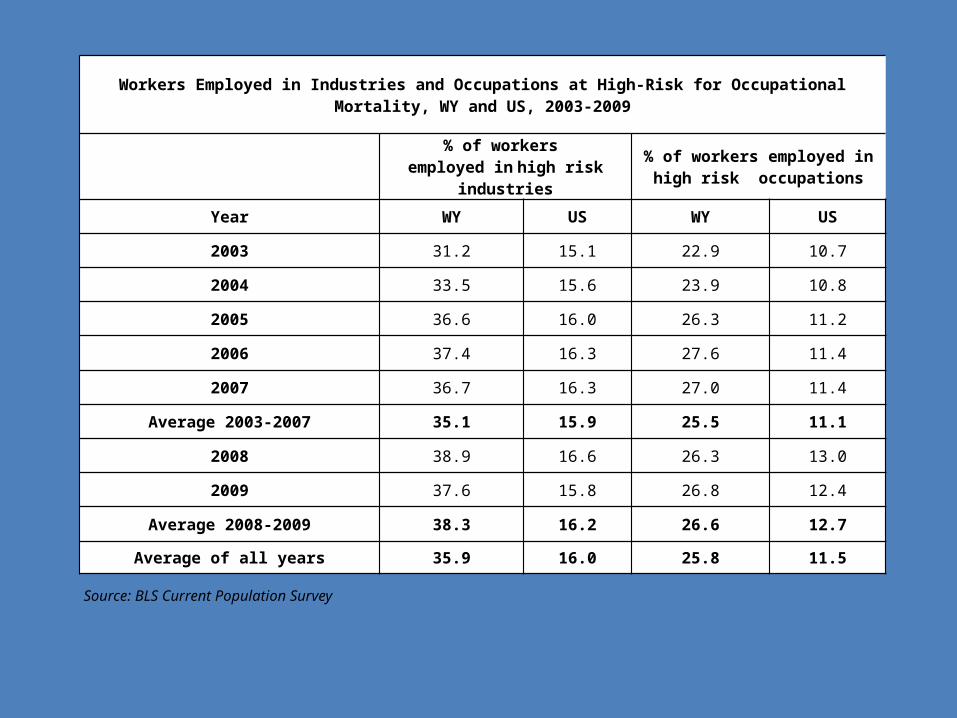
Source: BLS Current Population Survey
Workers Employed in Industries and Occupations at High-Risk for Occupational Mortality, WY and US, 2003-2009
% of workers employed in high risk industries
% of workers employed in high risk occupations
Year WY US WY US
2003 31.2 15.1 22.9 10.7
2004 33.5 15.6 23.9 10.8
2005 36.6 16.0 26.3 11.2
2006 37.4 16.3 27.6 11.4
2007 36.7 16.3 27.0 11.4
Average 2003-2007 35.1 15.9 25.5 11.1
2008 38.9 16.6 26.3 13.0
2009 37.6 15.8 26.8 12.4
Average 2008-2009 38.3 16.2 26.6 12.7
Average of all years 35.9 16.0 25.8 11.5

Total Workers’ Compensation Hospital Discharges among Residents 16 Years of Age or Older , WY , 2001-2009
YearAnnual number of work-related
hospitalizations(WY)
Annual crude rate of hospitalizations per 100,000 employed persons
(WY)
2001 716 274.3
2002 694 268.0
2003 653 245.5
2004 674 248.7
2005 648 237.4
2006 563 202.5
2007 461 164.6
2008 707 248.9
2009 683 244.8
Sources: Wyoming Department of Health hospital discharge data (numerator)Bureau of Labor Statistics Current Population Survey (denominator)

Hospital Discharges for Work-related Burns, WY, 2001-2009
Year Number of hospitalizations for work-related burns
Annual crude rate of work-related burn hospitalizations per 100,000 workers
2001 26 10.0
2002 31 12.0
2003 21 7.9
2004 38 14.0
2005 28 10.3
2006 18 6.5
2007 25 8.9
2008 24 8.5
2009 26 9.3
Source: Source: Wyoming Department of Health hospital discharge data (numerator)Bureau of Labor Statistics Current Population Survey (denominator)

State Workers’ Compensation Claims for Amputations with Lost Work-time, WY, 2001-2008
Year Number of amputation claims filed Annual incidence rate of amputation claims filed per 100,000 workers covered
2001 23 10.1
2002 34 14.8
2003 29 12.5
2004 37 15.4
2005 34 13.8
2006 30 11.5
2007 36 13.3
2008 41 14.7
Source: Wyoming Department of Labor, Division of Workers’ Compensation (numerator)National Academy of Social Insurance (NASI) estimate of workers covered by workers' compensation (denominator)

19921993
19941995
19961997
19981999
20002001
20022003
20042005
20062007
20082009
20100
10
20
30
40
50
60
2636 35 32 28 29 33 32 36 40
33 3743 46
36
48
33
19
34
Wyoming Occupational Fatalities
Source: US Department of Labor, Bureau of Labor Statistics, CFOI Data, 1992-2010.

Year Number of
Deaths
Number Employed from Current
Population Survey
Number of Full Time Equivalents (FTE)
WY Occupational Fatality Rate/100,000 FTE (Rank)
US Fatality Rate
2001 40 261,000 253,221.26 14.90 (2nd) 4.57
2002 33 259,000 250,096.04 12.00 (2nd) 4.30
2003 37 266,000 258,590.73 13.90 (1st) 4.24
2004 43 271,000 261,429.57 15.50 (1st) 4.33
2005 46 273,000 267,674.89 16.80 (1st) 4.22
2006 36 278,000 275,221.25 13.08 (2nd) 4.21
2007 48 280,000 277,379.53 17.10 (1st) 3.92
2008 33 284,000 281,930.50 12.40 (1st) 3.76
2009 19 279,000 265,986.11 *7.14 3.34
Occupational Fatalities, WY and US Rates
Source: Data compiled by National Institute of Occupational Safety and Health

48.42
18.57
7.79
7.63
7.63
4.813.812 Transportation Accidents
Contact with Objects/Equipment
Falls
Exposure to Harmful Substance/Environment
Aircraft Accidents
Assaults and Violent Acts
Fires and Explosions
Other
Fatal Injuries by type of “Event”
Source: US Department of Labor, Bureau of Labor Statistics, CFOI Data, 1992-2008.
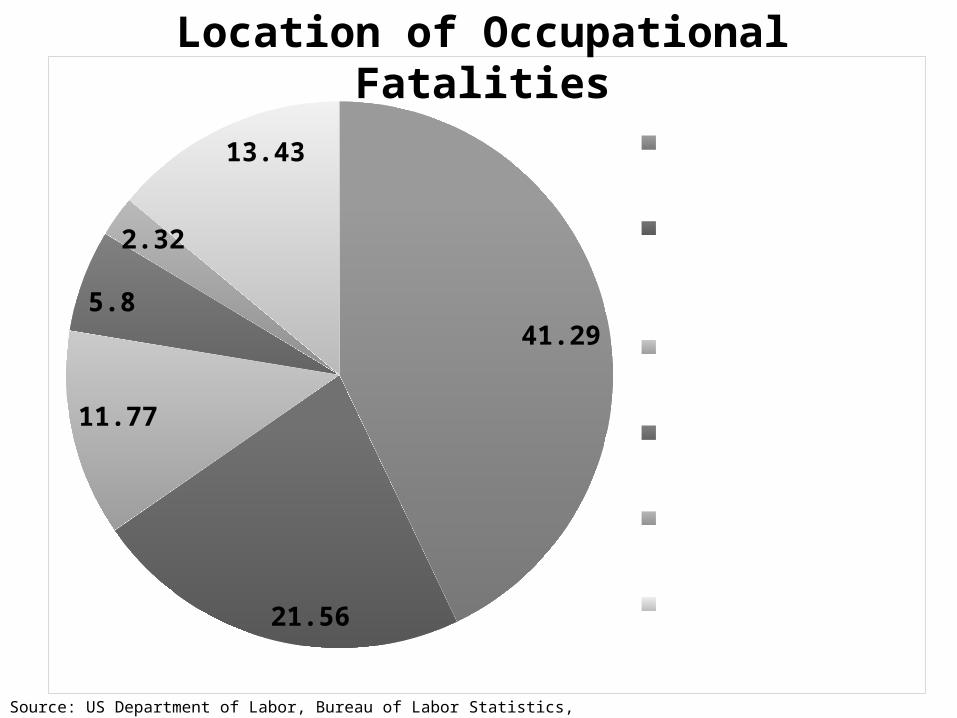
41.29
21.56
11.77
5.8
2.32
13.43 Street and Highway
Industrial Place/ Premises
Farm
Mine & Quarry
Public Building
Other
Location of Occupational Fatalities
Source: US Department of Labor, Bureau of Labor Statistics, CFOI Data, 1992-2008.

17
16
12
10
7
5
30
Transportation
Oil & Gas
Construction
Manufacturing
Agriculture
Coal & Mining
Other
Industry Specific Occupational Fatalities
Source: US Department of Labor, Bureau of Labor Statistics, CFOI Data, 1992-2008.
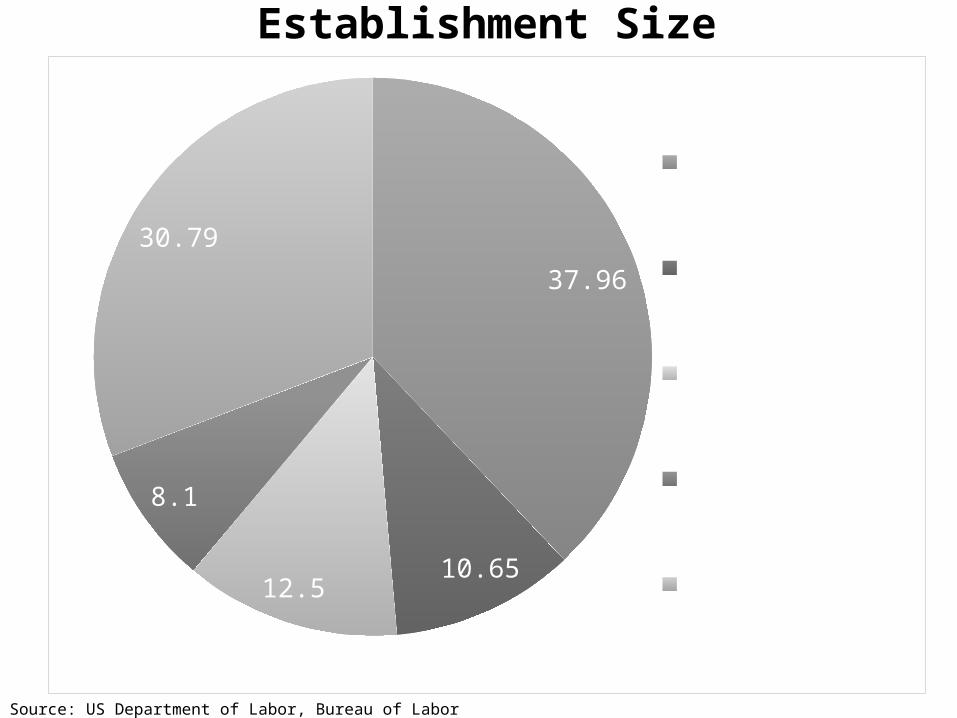
Establishment Size
37.96
10.6512.5
8.1
30.79
1-10 Employees
11-19 Employees
20-49 Employees
50-99 Employees
100+ Employees
Source: US Department of Labor, Bureau of Labor Statistics, CFOI Data, 1992-2008.

1 26.97
17.74
25.04
23.88
15.26
8.4615 and Under
16-19 Years
20-24 Years
25-34 Years
35-44 Years
45-54 Years
55-64 Years
65 and Older
Age Distribution of Occupational Fatalities
Source: US Department of Labor, Bureau of Labor Statistics, CFOI Data, 1992-2008.

Gender
8.13
91.87
Female Male
Source: US Department of Labor, Bureau of Labor Statistics, CFOI Data, 1992-2008.
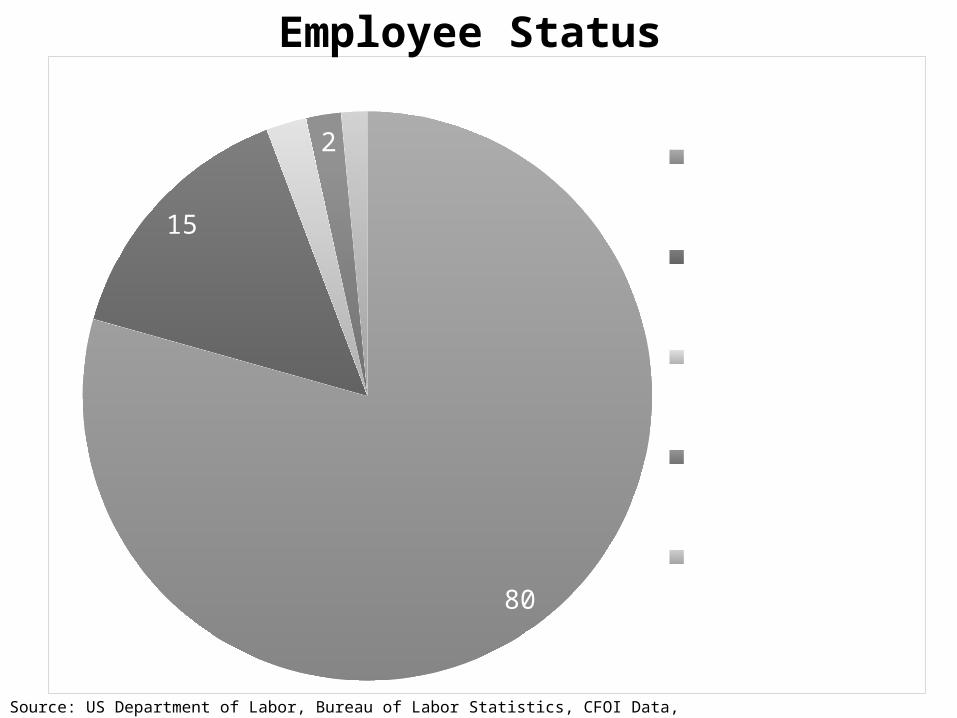
80
15
2.32
1.5
Work for Pay
Self-employed
Volunteer
Active Duty
Work in Family Business
Employee Status
Source: US Department of Labor, Bureau of Labor Statistics, CFOI Data, 1992-2008.

How Do We Compare?
0
5
10
15
20
25
30
35
40
45
50
Transportation Contact Falls Violence
WestWyoming
Perc
enta
ge
Source: US Department of Labor, Bureau of Labor Statistics, CFOI Data, 1992-2008.


