Download - ING Bank Annual Report

ING Bank
Annual Report
2018
ING Bank Annual Report 2018 2
Contents | Who we are | Report of the Management Board | Corporate governance | Consolidated annual accounts | Parent company annual accounts | Other information
Who we are
About ING 3
Report of Management Board
Financial developments ING Bank 5
Retail Banking 6
Wholesale Banking 11
Regulatory Context 13
Risk and Capital Management 15
Composition of the Management Board Banking and Supervisory Board 22
Corporate Governance
Corporate Governance 24
Conformity Statement 30
Report of the Supervisory Board 31
Consolidated annual accounts
Consolidated statement of financial position 43
Consolidated statement of profit or loss 44
Consolidated statement of comprehensive income 45
Consolidated statement of changes in equity 46
Consolidated statement of cash flows 48
Notes to the consolidated annual accounts 50
Parent company annual accounts
Parent company annual accounts 259
Other Information
Independent auditor’s report 279
Articles of Association - Appropriation of results 287
Contents
ING Bank Annual Report 2018 3
Contents | Who we are | Report of the Management Board | Corporate governance | Consolidated annual accounts | Parent company annual accounts | Other information
> About ING
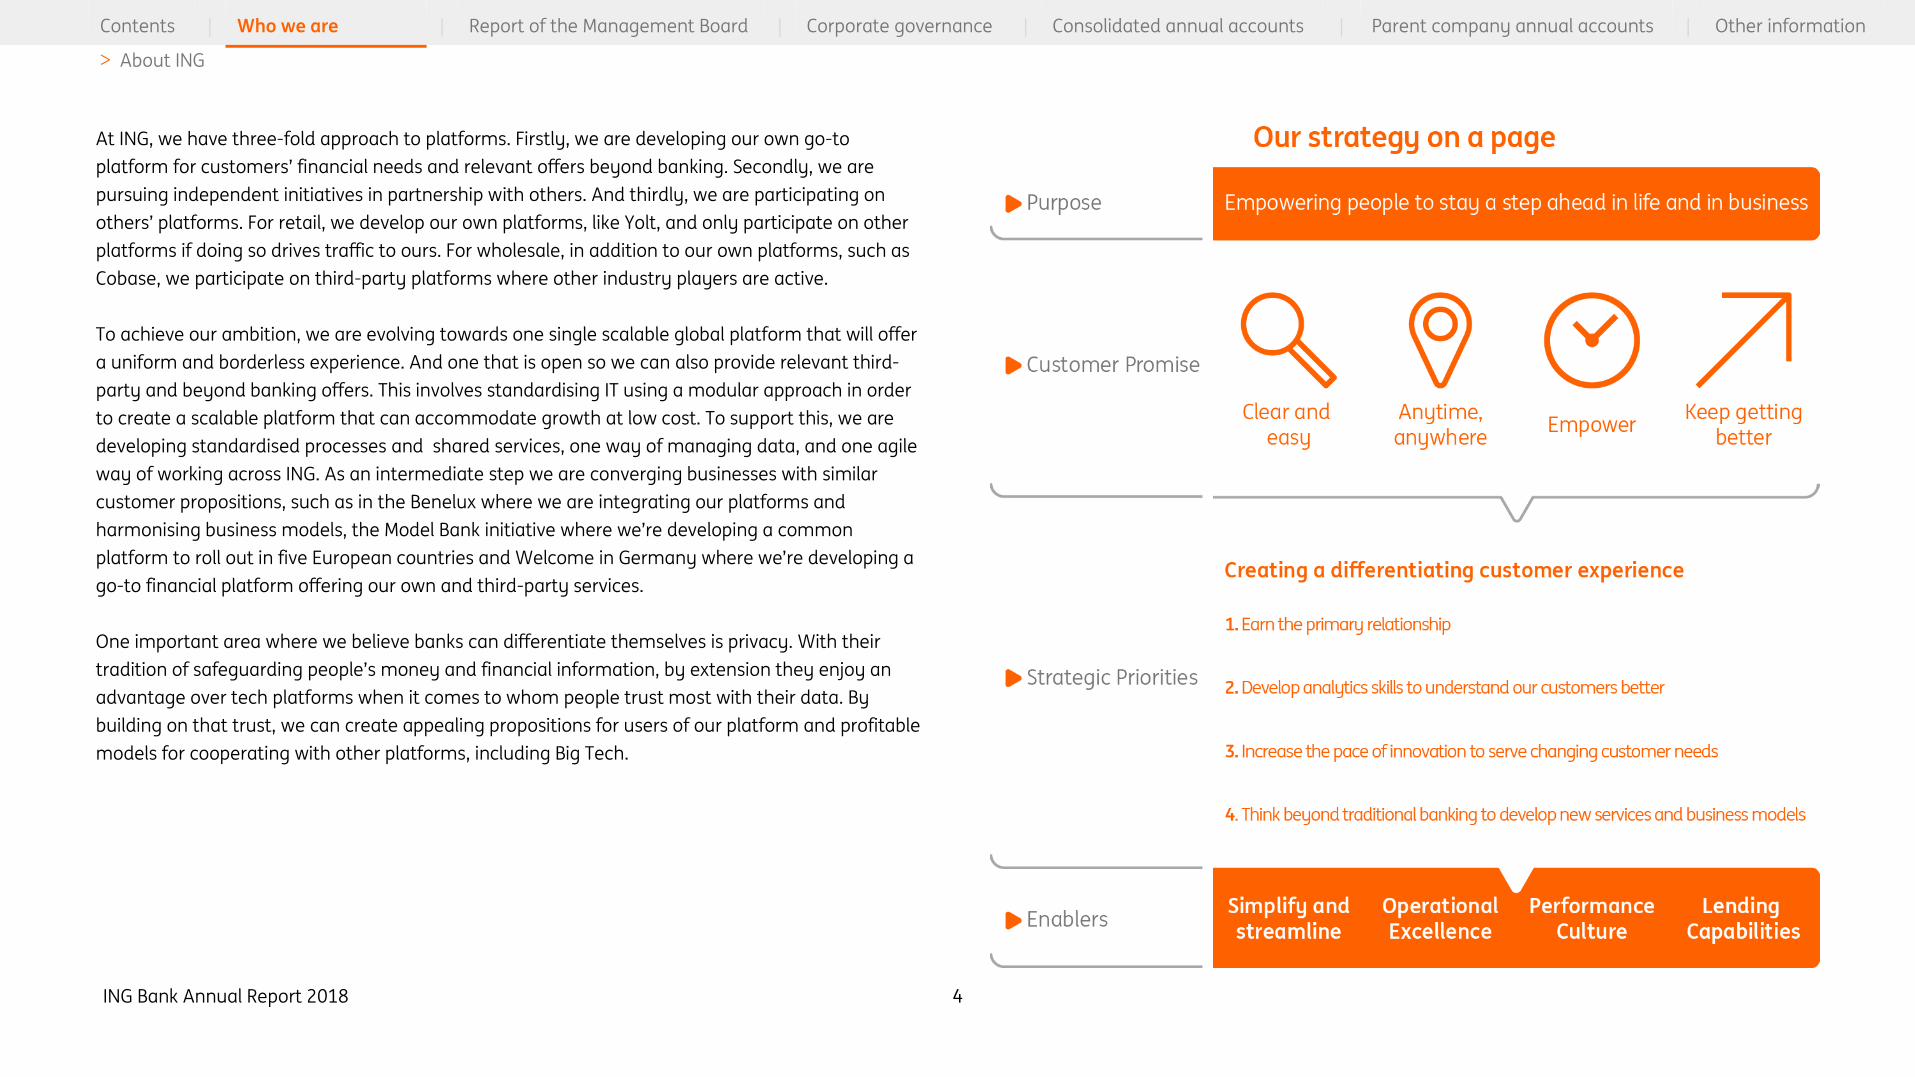
The Think Forward strategy has provided a blueprint for transforming the customer experience at a
time when digitalisation is increasing and mobile devices are rapidly becoming our customers’
channel of choice. Inspired by the strategy’s Customer Promise – clear and easy, anytime and
anywhere, empower, and keep getting better – we have delivered a differentiating digital customer
experience through innovations such as digital financial advisors, forecasting tools and instant
lending available through award-winning mobile apps as part of an omnichannel approach.
Strong customer satisfaction ratings and a continuing healthy increase in customer numbers show
that we are succeeding in staying relevant to customers in a fast-changing market for banking
services. The number of retail customers increased in 2018 by a million to 38.4 million. Primary
relationships, where customers have a current account with recurring income and at least one
other product, increased by more than a million to 12.5 million in 2018. And in net promoter scores
(NPS), customers ranked us number one in seven of our 13 retail markets.
Strong and consistent profitability has been driven by the steady increase in our lending business
at resilient margins and by growth of fee income. The well-diversified increase in lending spans
segments and geographies. In particular, lending to businesses and consumers has grown strongly
in our Challengers & Growth Markets. In Wholesale Banking, Industry Lending and Transaction
Services activities have led to strong increases in lending and fees. And new propositions that add
value for customers, like investment options that offer an alternative to low-yielding savings, have
contributed to an increase in fee and commission income in our Retail businesses.
ING of tomorrow
While we can look back on many accomplishments since the launch of the Think Forward strategy,
we are also conscious of the challenges ahead and the need to keep re-inventing ourselves to
remain relevant to customers in the future. The strategic vision embodied in the Think Forward
strategy is also guiding us as we navigate a changing world.
Banks can no longer differentiate themselves with products – they’ve become commodities. The
key differentiator of the future will be the customer experience. That experience will be digital, and
non-banks are setting the standard.
Fintechs are leveraging easy mobile access, transparency and low cost to compete for lucrative
parts of banks’ value chains in areas like payments and instant lending. But the biggest challenge is
coming from the Big Tech platforms that are setting the digital standard in terms of customer
experience and where people spend more and more of their time when they’re online – to shop, to
socialise, for news and entertainment, and for a whole range of other needs.
To compete with Big Tech and other platforms, banks will need to become platforms themselves.
They will need to offer the same personal, instant, relevant and seamless experience. They will
need to be open to becoming go-to platforms that keep people coming back, offering third-party
products and beyond banking services. And they will need to become experts in managing and
analysing customer data in order to know the needs and preferences of their customers, create
new offers and improve the customer experience.
The Big Tech platforms are not only disrupting banking with their customer experience. They are
now directly competing with banks. Apple Pay is growing rapidly and has expanded to more than
20 countries, WeChat is lending to consumers and Alibaba’s Ant Financial now has the world’s
biggest money market fund by assets. And with tech platforms now leading the rankings of the
world’s largest companies by market capitalisation, they have the size and scale to be formidable
competitors.
About ING
ING Bank Annual Report 2018 4
Contents | Who we are | Report of the Management Board | Corporate governance | Consolidated annual accounts | Parent company annual accounts | Other information
> About ING
At ING, we have three-fold approach to platforms. Firstly, we are developing our own go-to
platform for customers’ financial needs and relevant offers beyond banking. Secondly, we are
pursuing independent initiatives in partnership with others. And thirdly, we are participating on
others’ platforms. For retail, we develop our own platforms, like Yolt, and only participate on other
platforms if doing so drives traffic to ours. For wholesale, in addition to our own platforms, such as
Cobase, we participate on third-party platforms where other industry players are active.
To achieve our ambition, we are evolving towards one single scalable global platform that will offer
a uniform and borderless experience. And one that is open so we can also provide relevant third-
party and beyond banking offers. This involves standardising IT using a modular approach in order
to create a scalable platform that can accommodate growth at low cost. To support this, we are
developing standardised processes and shared services, one way of managing data, and one agile
way of working across ING. As an intermediate step we are converging businesses with similar
customer propositions, such as in the Benelux where we are integrating our platforms and
harmonising business models, the Model Bank initiative where we’re developing a common
platform to roll out in five European countries and Welcome in Germany where we’re developing a
go-to financial platform offering our own and third-party services.
One important area where we believe banks can differentiate themselves is privacy. With their
tradition of safeguarding people’s money and financial information, by extension they enjoy an
advantage over tech platforms when it comes to whom people trust most with their data. By
building on that trust, we can create appealing propositions for users of our platform and profitable
models for cooperating with other platforms, including Big Tech.

ING Bank Annual Report 2018 5
Contents | Who we are | Report of the Management Board | Corporate governance | Consolidated annual accounts | Parent company annual accounts | Other information
> Financial decelopments ING Bank
ING Bank posted strong commercial results in 2018, but they were negatively affected by the €775
million settlement agreement with the Dutch authorities on regulatory issues. The net result
dropped to €4,607 million from €5,019 million in 2017, primarily due to the settlement agreement
which was recorded as a special item. In 2017, there was a special item related to a €121 million
tax charge at ING Australia Holdings Ltd, for which a full reimbursement is expected to be received
from NN Group. Although the bottom-line impact for ING Bank was nil, it affected both the tax and
'other income' lines.
The underlying net result of ING Bank rose 7.2 percent to €5,382 million in 2018 from €5,019 million
in 2017; this was partly caused by a lower underlying effective tax rate supported by the tax
reforms in Belgium and the US. Underlying net result is derived from total net result by excluding
the impact from special items.
The underlying result before tax rose 3.3 percent to €7,526 million in 2018 from €7,283 million in
2017, primarily driven by continued business growth at resilient interest margins, higher net fee
and commission income, and slightly lower risk costs. Commercial performance was strong in
2018. ING Bank grew net core lending (adjusted for currency impacts, and excluding Bank Treasury
and the run-off portfolios) by €36.6 billion, or 6.4 percent, and net customer deposits rose by €19.3
billion in 2018. The global retail customer base grew by one million customers to reach 38.4 million
over the year, and the number of primary customers rose by 1.1 million to 12.5 million.
Total underlying income increased 2.0 percent to €18,102 million from €17,755 million in 2017. Net
interest income rose 1.2 percent to €13,949 million, due to an increase of the average balance
sheet total, partly offset by a narrowing of the net interest margin to 1.53 percent from 1.55
percent in 2017. The increase of the average balance sheet was mainly driven by the continued
growth in net core lending and customer deposits. The interest result on customer lending activities
increased driven by higher volumes at stable margins. The interest result on customer deposits
slightly declined, as the impact of volume growth was more than offset by margin pressure on
current accounts (due to lower reinvestment yields); the interest margin on savings stabilised,
mainly due to a further lowering of client savings rates in several countries. Net interest income
was furthermore negatively affected by a decline in the volatile interest results of Financial
Markets. Net fee and commission income rose 3.3 percent to €2,803 million. The increase was
mainly in Wholesale Banking (supported by the inclusion of Payvision as from the second quarter of
2018) and most of the Retail Banking countries, except for Belgium and Turkey. Investment and
other income rose to €1,350 million from €1,259 million in 2017, mainly caused by higher valuation
results and net trading income, including improved hedge ineffectiveness results, and one-off
results. The increase was primarily visible in Retail Banking (excluding Belgium) and the Corporate
Line. In Wholesale Banking, investment and other income declined, mainly due a loss recorded on
the intended sale of an Italian lease run-off portfolio in 2018, while 2017 included a gain on the sale
of an equity stake in the real estate run-off portfolio.
Underlying operating expenses increased 1.3 percent to €9,920 million from €9,795 million in 2017.
In 2018, expenses included €947 million of regulatory expenses up from €901 million in the
previous year. Excluding regulatory costs, expenses were up 0.9 percent, as higher costs for
strategic projects and to support business growth, were largely offset by lower performance-
related expenses and strict cost management. The underlying cost/income ratio improved to 54.8
percent from 55.2 percent in 2017.
The net addition to the provision for loan losses declined 3.0 percent to €656 million from €676
million in 2017. Risk costs were 21 basis points of average risk-weighted assets, which is well below
ING Bank’s through-the-cycle average of 40-45 basis points.
The underlying return on IFRS-EU equity of ING Bank rose to 12.6 percent in 2018 from 11.6 percent
in 2017.
Financial developments ING Bank

ING Bank Annual Report 2018 6
Contents | Who we are | Report of the Management Board | Corporate governance | Consolidated annual accounts | Parent company annual accounts | Other information
> Retail Banking
ING’s Retail business serves 38.4 million customers. ING also has stakes in the Bank of Beijing
(China), TMB (Thailand) and Kotak Mahindra Bank (India).
In most of our retail markets we offer a full range of banking products and services, covering
payments, savings, investments and secured and unsecured lending.
Market Leaders Our Market Leaders are mature businesses in Belgium, the Netherlands and Luxembourg where we
have strong positions in retail and wholesale banking.
In the first half of 2018, we successfully migrated 600,000 customers from Record Bank into ING in
Belgium.
We are combining our strengths in Belgium and the Netherlands under the Unite be+nl programme
and building an integrated banking platform. This is part of our strategy to enhance operational
excellence, create greater cost-efficiency and provide a consistent, digital-first banking experience
for our customers. For example, customers in Belgium will benefit from new functionalities on the
ING mobile banking app. ING is also the first major bank in Belgium to offer same-day payments
processing.
In the Netherlands we now have 4.3 million mobile app users, including 1.1 million new registered
users in 2018. In Belgium, digital adoption is accelerating too, with a net increase of close to
285,000 new active mobile users (36 percent) to 1.07 million users. Some 55 million mobile
payments were processed in Belgium in 2018, almost four times higher than in 2017. However,
many customers still value face-to-face interactions and we have to balance their needs with our
digital ambitions. To this end, we extended the opening hours of our branch network in Belgium.
One of the ways we are harmonising our products is by standardising the look and feel. For
example, we have globally reduced more than 95 bank card designs to just eight. In 2018, we
introduced the new-look cards in Belgium and the Netherlands. These have a ‘clear and easy’ look
with a symbolic orange ‘heart’. This follows the roll-out of the new cards in France in 2017, then
Germany, Romania and Wholesale Banking. We will only issue new cards to customers when their
existing ones expire to avoid unnecessary waste and costs as we replace all 15 million cards
worldwide.
Tapping into the growth of a cashless society and rising demand for mobile payments, ING
announced the merger in March 2018 of payments app company Payconiq with Bancontact to
create the Bancontact Payconiq Company. Conceived by ING in 2014, Payconiq is a joint initiative
with AXA Bank, Belfius, BNP Paribas Fortis, KBC, Rabobank and Volksbank. It allows users to pay for
online and in-store purchases with their mobile phones, instantly and seamlessly connecting to
their bank account. In 2018, 34 million payments were processed through either Bancontact or
Payconiq, which is about twice as many as in 2017.
Around 50,000 merchants in Belgium are signed up to the service, which is available to consumers
from all banks, not only the shareholders. In November 2018, the first Dutch retailer signed up, with
more to follow as it is rolled out in the Netherlands. Testing has also started in Germany.
At the request of the Dutch Authority for Financial Markets banks compensated SME customers in
the Netherlands who had been sold interest rate derivatives during a defined period. The
compensation framework (UHK or Uniform Herstelkader) was determined by an independent
committee set up by the Dutch Finance Minister in 2016. Execution was challenging, with extreme
complexity, limited estimated tolerances and high compliance standards under stringent
supervision. In 2018, all relevant ING customers received a compensation offer. Of these, 77 percent
Retail Banking
ING Bank Annual Report 2018 7
Contents | Who we are | Report of the Management Board | Corporate governance | Consolidated annual accounts | Parent company annual accounts | Other information
> Retail Banking
had been accepted by the end of the year and we foresee high acceptance of the rest. The
estimated costs have been recognised in the profit and loss account as part of a provision.
ING actively reached out to customers in the Netherlands with interest-only mortgages to help
them plan ahead for when their mortgages mature and the principal repayment is due. Customers
can use the insights we provide to take timely action if needed to prevent affordability problems in
the future. We believe this results in additional redemptions and product conversions and leads to
de-risking of the mortgage portfolio.
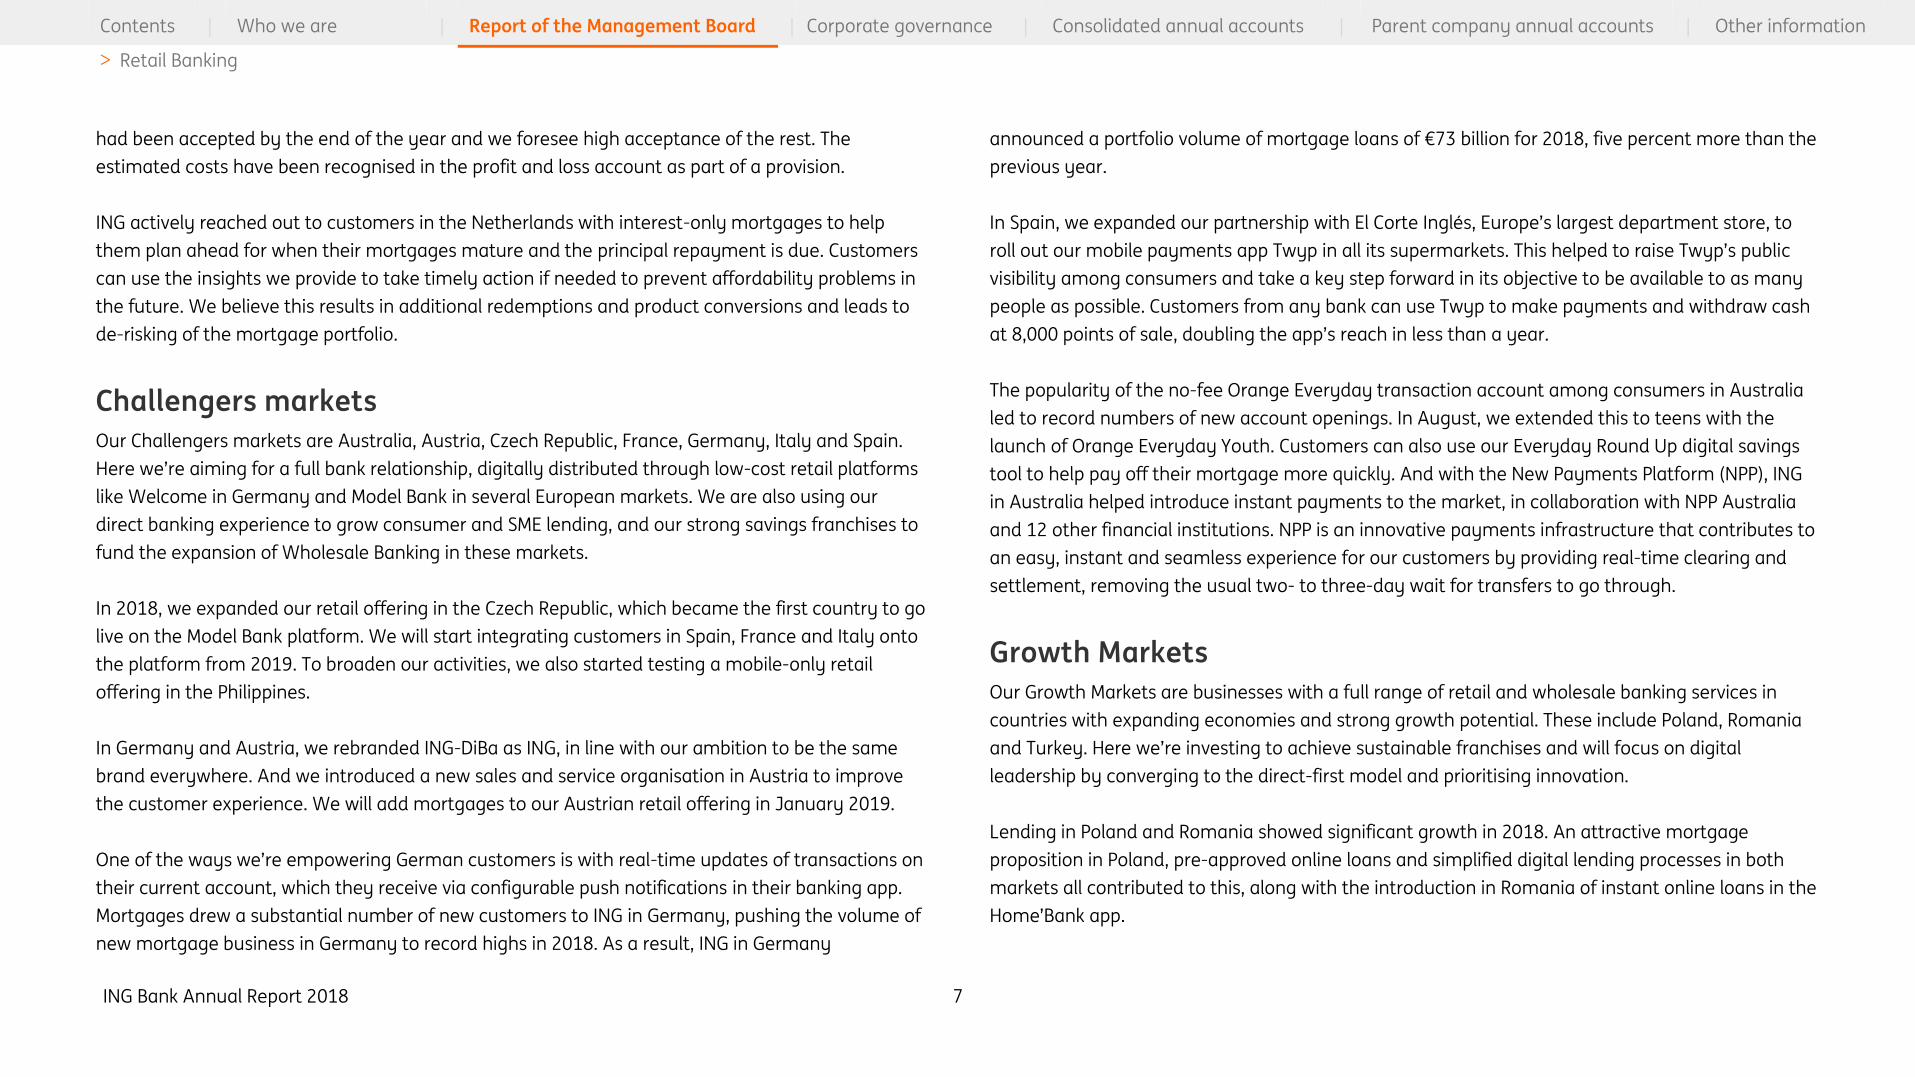
Challengers markets Our Challengers markets are Australia, Austria, Czech Republic, France, Germany, Italy and Spain.
Here we’re aiming for a full bank relationship, digitally distributed through low-cost retail platforms
like Welcome in Germany and Model Bank in several European markets. We are also using our
direct banking experience to grow consumer and SME lending, and our strong savings franchises to
fund the expansion of Wholesale Banking in these markets.
In 2018, we expanded our retail offering in the Czech Republic, which became the first country to go
live on the Model Bank platform. We will start integrating customers in Spain, France and Italy onto
the platform from 2019. To broaden our activities, we also started testing a mobile-only retail
offering in the Philippines.
In Germany and Austria, we rebranded ING-DiBa as ING, in line with our ambition to be the same
brand everywhere. And we introduced a new sales and service organisation in Austria to improve
the customer experience. We will add mortgages to our Austrian retail offering in January 2019.
One of the ways we’re empowering German customers is with real-time updates of transactions on
their current account, which they receive via configurable push notifications in their banking app.
Mortgages drew a substantial number of new customers to ING in Germany, pushing the volume of
new mortgage business in Germany to record highs in 2018. As a result, ING in Germany
announced a portfolio volume of mortgage loans of €73 billion for 2018, five percent more than the
previous year.
In Spain, we expanded our partnership with El Corte Inglés, Europe’s largest department store, to
roll out our mobile payments app Twyp in all its supermarkets. This helped to raise Twyp’s public
visibility among consumers and take a key step forward in its objective to be available to as many
people as possible. Customers from any bank can use Twyp to make payments and withdraw cash
at 8,000 points of sale, doubling the app’s reach in less than a year.
The popularity of the no-fee Orange Everyday transaction account among consumers in Australia
led to record numbers of new account openings. In August, we extended this to teens with the
launch of Orange Everyday Youth. Customers can also use our Everyday Round Up digital savings
tool to help pay off their mortgage more quickly. And with the New Payments Platform (NPP), ING
in Australia helped introduce instant payments to the market, in collaboration with NPP Australia
and 12 other financial institutions. NPP is an innovative payments infrastructure that contributes to
an easy, instant and seamless experience for our customers by providing real-time clearing and
settlement, removing the usual two- to three-day wait for transfers to go through.
Growth Markets Our Growth Markets are businesses with a full range of retail and wholesale banking services in
countries with expanding economies and strong growth potential. These include Poland, Romania
and Turkey. Here we’re investing to achieve sustainable franchises and will focus on digital
leadership by converging to the direct-first model and prioritising innovation.
Lending in Poland and Romania showed significant growth in 2018. An attractive mortgage
proposition in Poland, pre-approved online loans and simplified digital lending processes in both
markets all contributed to this, along with the introduction in Romania of instant online loans in the
Home’Bank app.

ING Bank Annual Report 2018 8
Contents | Who we are | Report of the Management Board | Corporate governance | Consolidated annual accounts | Parent company annual accounts | Other information
> Retail Banking
To stand out in the digitally advanced Polish market, where fintechs are gaining ground among
tech-savvy consumers, we extended mobile payments to platforms such as Google Pay and Visa
HCE. We also introduced an ING-specific keyboard for our Moje app to simplify mobile commerce
and peer-to-peer transactions.
ING in Poland teamed up with fintech Twisto to introduce the country’s first e-commerce payment
gateway. It enables shoppers (not only ING customers, but from any bank) to buy online now and
pay later, and get instant cashback if they return their purchases. Some 200 Polish merchants
signed up for the pilot in April 2018, during which over 4,000 transactions were made. The Imoje
payments gateway continues to grow by about 200 percent per month.
And to make foreign payments instant and seamless for Polish consumers, for example while
travelling, we introduced a multi-currency card that allows users to pay for foreign purchases from
several different currency accounts without incurring any commission fees. It has proven popular,
with over 100,000 users so far.
For business customers in Poland and Romania, we launched ING Business, a new digital platform
that makes banking clear and easy and accessible anytime, anywhere from any device. We also
introduced Invoice Financing, a digital micro-factoring solution developed in-house at ING. It gives
Polish SME customers control over which invoices they want to pre-finance and when.
And in line with our ambition to help create a low-carbon society we introduced an eco-offering for
Polish entrepreneurs. The offering gives the loans we provide a responsible side because it
encourages customers to take sustainable actions such as buying energy-efficient equipment for
their businesses, for example, or insulating their buildings. See more about our ambition to align
ING’s overall loan portfolio with global climate goals in the ‘Responsible Finance’ section below.
Launched in June 2018, Turkey’s Orange Extra ( Turuncu Ekstra) programme was voted Most
Innovative Product by Visa. At the end of 2018, it had 470,200 active customers, of which 183,000
were primary customers and 120,500 were spenders on the programme with Orange Extra cards.
We also teamed up with several merchants in Turkey to offer customers vendor financing for online
purchases via our mobile app. For example, they can get a loan for a new phone from the provider
at the point of sale. And in another beyond banking collaboration we teamed up with online
moving services platform Octovan to develop a tool that calculates the full cost of moving into a
new home. The aim is to help the 1.5 million people in Turkey who move each year avoid financial
surprises. Users can also apply for a loan to cover unforeseen expenses.
Financial Performance in 2018
Total Retail Banking
Retail Banking recorded a solid set of 2018 results. Net profit rose 2.6 percent to €3,452 million from
€3,363 million in 2017. There were no special items excluded from the underlying results in both
years. The underlying result before tax increased 2.5 percent to €4,841 million in 2018.
The improvement in pre-tax result was mainly attributable to higher income, which more than
offset a slight increase in expenses and higher risk costs. Underlying income rose 2.3 percent,
primarily driven by higher income in the Retail Challengers & Growth Markets (supported by
continued volume growth and a bigger retail customer base), partly offset by a decline in Retail
Belgium due to margin pressure and lower income from investment and financial markets
products. Total customer lending increased by €12.0 billion to €408.4 billion compared with the
opening balance sheet as of 1 January 2018. Adjusted for currency impacts and excluding Bank
Treasury and the WestlandUtrecht Bank (WUB) run-off portfolio, net growth in Retail’s core lending
book was €22.0 billion. Net customer deposits (also excluding Bank Treasury and currency impacts)
grew by €20.1 billion in 2018.
Underlying operating expenses increased 1.3 percent compared with 2017. Excluding regulatory
costs, expenses were up 1.2 percent, mainly related to strategic projects and selective business
growth in the Retail Challengers & Growth Markets, and higher external staff expenses in Retail
Belgium. These increases were partly offset by lower expenses in Retail Netherlands supported by

ING Bank Annual Report 2018 9
Contents | Who we are | Report of the Management Board | Corporate governance | Consolidated annual accounts | Parent company annual accounts | Other information
> Retail Banking
the benefits from the ongoing cost-saving programmes. The underlying cost/income ratio
improved to 56.3 percent from 56.9 percent in 2017.
Risk costs rose to €457 million, or 29 basis points of average risk-weighted assets, from €391 million
in 2017, reflecting higher risk costs in Retail Belgium and the Retail Other Challengers & Growth
Markets, while Retail Netherlands and Retail Germany recorded net releases from loan loss
provisions.
Market Leaders
Retail Netherlands
The underlying result before tax of Retail Netherlands rose 4.4 percent to €2,342 million from
€2,243 million in 2017. This was mainly due to lower risk costs and benefits from the ongoing cost-
saving programmes.
Underlying income rose 0.2 percent to €4,476 million. The interest result was 3.4 percent lower,
mainly caused by margin pressure on savings and current accounts, and a decline in the average
lending volumes, partly offset by higher margins on mortgages. Net core lending (excluding the
WUB run-off portfolio and Bank Treasury-related products) grew by €1.9 billion as from 1 January
2018, of which €0.8 billion in mortgages and €1.1 billion in other lending. Net growth in customer
deposits (excluding Bank Treasury) was €3.5 billion in 2018. Net fee and commission income rose
by €53 million, or 8.8 percent, primarily due to higher daily banking fees. Investment and other
income rose by €78 million, mainly attributable to higher allocated Bank Treasury revenues.
Underlying operating expenses declined 2.1 percent on 2017, mainly driven by the benefits from
the ongoing cost-saving initiatives and lower expenses for legal claims.
Risk costs turned to a net release of €31 million, or -6 basis points of average risk-weighted assets,
from a net addition of €13 million in 2017, reflecting the continued positive macroeconomic
conditions in the Netherlands.
Retail Belgium
Retail Belgium includes ING in Luxembourg.
The underlying result before tax of Retail Belgium fell 24.2 percent to €595 million in 2018,
compared with €785 million in 2017. The decline reflects lower income, higher expenses and an
increase in risk costs.
Underlying income decreased to €2,369 million from €2,473 million in 2017. The interest result
declined 0.7 percent to €1,830 million, mainly due to margin pressure on most products, in part
offset by volume growth in the lending portfolio as well as current accounts. The net production in
customer lending (excluding Bank Treasury and the sale of a mortgage portfolio) was €6.1 billion, of
which €2.2 billion was in mortgages and €3.9 billion in other lending. The net inflow in customer
deposits was €3.0 billion in 2018. Net fee and commission income decreased 9.1 percent, mainly
due to lower fee income on investment products. Investment and other income fell by €55 million,
mainly due to lower income from financial markets products.
Operating expenses rose by €26 million, or 1.6 percent, to €1,610 million, mainly due to higher
external staff expenses related to the transformation programmes and the successful integration
of Record Bank into ING Belgium.
Risk costs increased by €60 million to € 164 million, or 44 basis points of risk-weighted assets, from
€104 million, or 30 basis points of risk-weighted assets, in 2017. The increase was primarily in
business lending.

ING Bank Annual Report 2018 10
Contents | Who we are | Report of the Management Board | Corporate governance | Consolidated annual accounts | Parent company annual accounts | Other information
> Retail Banking
Challengers & Growth Markets
Retail Germany
Retail Germany includes ING in Austria.
The underlying result before tax increased 11.9 percent to €972 million, compared with €869
million in 2017, mainly due to higher income and a higher net release in risk costs.
Underlying income increased 4.3 percent to €1,972 million in 2018 from €1,891 million a year ago.
Net interest income declined 1.9 percent reflecting margin compression on mortgages and current
accounts, and lower Bank Treasury-related interest income. This was only partly offset by higher
margins on savings and deposits and volume growth in most products. Net core lending growth,
which excludes Bank Treasury products, was €4.4 billion in 2018, of which €3.6 billion was in
mortgages and €0.8 billion in consumer lending. Net inflow in customer deposits (excluding Bank
Treasury) was €5.0 billion, mainly driven by a promotional savings campaign in the fourth quarter
of 2018. Net fee and commission income rose 4.7 percent, due to higher fee income on investment
products and an improvement in fees on current accounts. Investment and other income rose to
€76 million, mainly due to improved hedge ineffectiveness results from Bank Treasury.
Operating expenses declined 0.5 percent to €1,027 million from €1,032 million in 2017. This
decrease was mainly caused by lower regulatory costs and a decline in marketing expenses, partly
offset by higher costs to support business growth and a restructuring provision in 2018.
Risk costs were €-27 million in 2018, compared with €-10 million in 2017, reflecting a benign credit
environment in the German market and review of the consumer lending portfolio.
Retail Other
Retail Other consists of the other Challenger countries & Growth Markets, including the stakes in
Asia.
Retail Other’s underlying result before tax increased 13.0 percent to €932 million in 2018, from
€825 million in 2017. This was mainly due to higher income, partly offset by increased expenses
and higher risk costs.
Total underlying income rose by €287 million, or 9.5 percent, to €3,315 million. This increase was
driven by continued strong commercial results across most countries, reflecting customer growth
and higher volumes. Net interest income rose 10.4 percent to €2,690 million, reflecting sustainable
growth in lending and customer deposits volumes and an improved total interest margin. The net
production (excluding currency effects and Bank Treasury) in customer lending was €9.6 billion, of
which €6.4 billion was in mortgages and €3.2 billion in other lending (mainly consumer loans). Net
customer deposits grew by €8.6 billion in 2018. Net fee and commission income rose 2.9 percent
driven by increases in most countries, partly offset by a decline in Turkey. Investment and other
income increased by €23 million, mainly due to a higher dividend from Bank of Beijing and a higher
profit contribution from ING Bank’s 25% stake in TMB (which was mainly driven by one-offs), while
previous year included a gain on the sale of MasterCard shares in Turkey.
Operating expenses increased by €114 million, or 5.9 percent, to €2,033 million. This increase was,
next to higher regulatory costs, mainly due to higher staff expenses in most counties to support
commercial growth and higher investments in strategic projects.
Risk costs were € 350 million, or 71 basis points of average risk-weighted assets, compared with
€284 million, or 58 basis points, in 2017. The increase was mainly attributable to higher risk costs in
Italy, Romania and Poland, while risk costs in Turkey remained on the same high level as in 2017.

ING Bank Annual Report 2018 11
Contents | Who we are | Report of the Management Board | Corporate governance | Consolidated annual accounts | Parent company annual accounts | Other information
> Wholesale banking
Wholesale Banking is an important and integral contributor to ING's commercial performance. With
a local presence in more than 40 countries, we provide corporate clients and financial institutions
with advisory value propositions such as specialised lending, tailored corporate finance and debt
and equity market solutions. We also serve their daily banking needs with payments and cash
management, trade and treasury services.
In 2018, transaction services, payments and cash management, and lending all grew and we
expect this to continue as we support our corporate clients with their business needs and with
becoming more sustainable.
We sharpened our strategy in 2018 to focus on what clients want – advice, data-driven insights and
sector knowledge – and reorganised the way we work to deliver an experience that is borderless,
instant, personal and consistent. This includes creating a new Europe, Middle East and Africa (EMEA)
region and strengthening our international network by putting more resources (products and
people) into Asia and the Americas. This, along with the introduction of a cross-border Strategic
Products team fosters collaboration across the regions to give clients access to more products and
services. We are also strengthening core banking services, such as Debt Capital Markets and
Corporate Finance. And we introduced ING’s one Way of Working in our client service and delivery
areas to support this new client-led approach.
In September 2018, as part of our commitment to fighting climate change, ING pledged to steer its
entire lending portfolio towards the climate goals of the Paris Agreement (see ‘Responsible Finance’
section).
Low volatility on stock and currency markets dampened appetite for hedging and impacted growth
in our Financial Markets business. Mounting concerns about emerging markets currencies and the
potential for defaults, and in particular the sharp fall of the Turkish currency, reverberated through
lending markets. Pessimism about macro-economic developments such as the trade war between
the US and China unsettled financial markets and dampened consumer confidence. The rising oil
price caused inflation to increase, subduing real income growth.
Britain’s pending exit from the European Union and the potential impact on financial markets saw
many international banks forced to make contingency plans to relocate their operations away
from London. ING centralised its Financial Markets in London in 2016. We are in an ongoing
dialogue with the European Central Bank and the Bank of England’s Prudential Regulation Authority
to safeguard business continuity, keeping a close eye on the conditions under which the UK exits
the EU.
Financial performance in 2018
Wholesale Banking posted good 2018 results, supported by continued net core lending growth and
despite the difficult financial markets the whole industry faced. The net result rose to €2,055 million
from €1,950 million in 2017, this was primarily due to a lower effective tax rate supported by the
impact of the corporate tax reforms in Belgium and the US. There were no special items excluded
from the underlying results in both years. The underlying result before tax was €2,755 million,
down 3.2 percent from 2017, as higher results in Industry Lending were more than offset by lower
results in Financial Markets and Bank Treasury & Other.
Industry Lending posted an underlying result before tax of €2,091 million, up 6.4 percent compared
with 2017, primarily due to volume growth, partly offset by some pressure on margins. The 2018
result furthermore included a €66 million gain related to an equity-linked bond in Belgium. The
underlying result before tax from General Lending & Transaction Services remained unchanged at
€751 million. Higher income, supported by volume growth in General Lending and the inclusion of
Payvision as from the second quarter of 2018, was offset by increased expenses (partly due to
payment innovation initiatives and higher regulatory costs) and slightly higher risk costs.
Wholesale Banking

ING Bank Annual Report 2018 12
Contents | Who we are | Report of the Management Board | Corporate governance | Consolidated annual accounts | Parent company annual accounts | Other information
> Wholesale banking
Financial Markets recorded an underlying result before tax of €-40 million compared with €82
million in 2017. The drop in result was caused by lower income, which was impacted by lower client
activity and challenging global market conditions, partly offset by a modest decline in expenses.
The underlying result before tax of Bank Treasury & Other fell to a loss of €47 million compared
with a gain of €47 million in 2017. This was mainly due to lower results in the run-off businesses
(including a €123 million loss recorded in the fourth quarter of 2018 on the intended sale of an
Italian lease run-off portfolio, while 2017 included a €97 million gain on the sale of an equity stake
in the real estate run-off portfolio), partly offset by lower expenses for litigation issues.
Total underlying income of Wholesale Banking fell 2.4 percent to €5,781 million compared with
2017, mainly reflecting lower revenues in Financial Markets and the loss on the intended sale of an
Italian lease run-off portfolio. Wholesale Banking’s net core lending book (adjusted for currency
impacts, and excluding Bank Treasury and the Lease run-off portfolio) grew by €14.5 billion in 2018.
Net customer deposits (excluding currency impacts and Bank Treasury) shrank by €0.8 billion. The
interest result rose 1.3 percent on 2017, whereas net fee and commission income increased 4.8
percent (supported by the inclusion of Payvision). Investment and other income fell by €246 million;
this was almost fully attributable to the aforementioned one-off results in the lease and real estate
run-off businesses. Underlying operating expenses increased 1.2 percent to €2,826 million due to
higher regulatory costs. Expenses excluding regulatory costs were stable, mainly reflecting lower
performance-related expenses and strict cost control, and despite the inclusion of Payvision. The
underlying cost/income ratio increased to 48.9 percent from 47.1 percent in 2017.
Risk costs declined to €200 million, or 13 basis points of average risk-weighted assets, from €284
million, or 19 basis points in 2017. The relatively low risk costs in 2018 were supported by several
larger net releases for clients and only a few larger new additions. On top of that, risk costs for the
Italian lease run-off portfolio were significantly lower than in the previous year.

ING Bank Annual Report 2018 13
Contents | Who we are | Report of the Management Board | Corporate governance | Consolidated annual accounts | Parent company annual accounts | Other information
> Regulatory Context
Financial conditions slightly tighter
As economic momentum in the US remained strong, the Federal Reserve continued hiking interest
rates. The European Central Bank reduced its asset purchase programme.
Given differences in monetary policy stances and economic developments, longer-term yields
increased in the US and, on balance, moved sideways in the eurozone. However, in Italy,
uncertainty about the forthcoming budget led to a considerable increase in sovereign spreads.
Given our geographical footprint, eurozone rate developments have a larger impact than rate
developments in the US.
There was little progress on eurozone reform in 2018 given the diverse political interests involved.
It’s clear that the debate on the Economic and Monetary Union is difficult and progress on the
completion of the banking union is slow. We are hoping for progress on the European Deposit
Insurance Scheme (EDIS), as it is an absolute requirement for finishing the Banking Union.
Furthermore, we have concern about making a ‘sovereign debt restructuring mechanism’ part of
the criteria for support from the European Stability Mechanism.
The review of EU prudential rules, via CRR2/CRD5 (Capital Requirements Regulation/Capital
Requirements Directive) and BRRD2 (Bank Recovery and Resolution Directive), was discussed
intensively during 2018 by the Council and the European Parliament. The package includes the
introduction of new rules, for instance regarding NSFR (net stable funding ratio), a G-SIB (global
systemically important bank) surcharge for the leverage ratio, interest rate risk in the banking book
and internal MREL (minimum own funds and eligible liabilities).
Data
The regulatory framework for personal data is fundamentally shaped by the EU. It seeks to walk
the fine line between privacy protection and fostering data sharing. In 2018, two crucial pieces of
the new personal data architecture started being rolled out across the EU: the second Payment
Services Directive (PSD2) and the General Data Protection Regulation (GDPR). We are refining our
internal processes on data in order to meet these new regulatory requirements. We are on course
to implement one global approach to data management to ensure we maximise the potential of
this key resource.
The GDPR is a landmark personal data-protection framework that is arguably the world’s most
stringent. It gives customers the right to receive their personal data upon request and to allow their
data to be directly transmitted to third parties. PSD2 meanwhile implies that banks must share
customers’ payments data – with the customer’s explicit consent – with other regulated entities.
You can read more in the ‘Innovation and transformation’ chapter.
ING believes customer data should be accessible in a similar manner for banks and non-banks. This
should be adequately reflected in the EU’s regulatory framework. The EU should consider
expanding the open access regime pioneered by PSD2 to – in the first instance – financial services
platforms, followed by other sectors to create a level playing field, while keeping strong safeguards
for our customers, such as the GDPR, in place.
Regulatory Context
ING Bank Annual Report 2018 14
Contents | Who we are | Report of the Management Board | Corporate governance | Consolidated annual accounts | Parent company annual accounts | Other information
> Regulatory Context
Regulatory developments
The Banks’s IFRS 9 implementation was completed in the first quarter of 2018. The impact on ING
Bank’s CET1 ratio, taking into account the existing regulatory provision shortfall and before any
transition relief, was a reduction of 20 bps. This was mainly caused by the change in the
classification and measurement of a portion of the portfolio invested in liquid assets.
As of 1 January 2022, the first stage of Basel IV (revised Internal Rating-Based Approach) will come
into effect. Based on the current estimates, without management actions this is expected to
potentially increase RWA by roughly 15-18% on a fully loaded basis, of which around 80% is
expected at implementation date.

ING Bank Annual Report 2018 15
Contents | Who we are | Report of the Management Board | Corporate governance | Consolidated annual accounts | Parent company annual accounts | Other information
> Risk and Capital Management
Risk and capital management focuses on maintaining our risk profile within our risk appetite and
strengthening our capital base. It allows ING to grow a sustainable business while implementing the
Think Forward strategy. In a dynamic environment, ING continually develops its risk and capital
management to address political and economic developments, changing customer behaviour,
increasing regulatory requirements, emerging competitors and new technologies.
Capital developments at ING Bank
The capital position remained strong in 2018, resulting from profitable and growing operations,
complemented by increased optimisation of the capital structure. ING has sufficient buffers to
withstand certain adverse scenarios without breaching applicable requirements, at both the
consolidated and subsidiary level. ING is confident this position will allow us to continue to
successfully execute our Think Forward strategy support business growth and maintain our
dividend policy.
The ING Bank’s phased-in CET1 ratio at the end of the year decreased by 0.2 point from the
previous year to 12.9%, as risk-weighted assets increased due to volume growth and model
updates slightly offset by positive risk migration. The available CET1 capital decreased slightly by
€0.2 billion compared with year-end 2017.
In 2018, a total of €4.7 billion of ING Bank N.V. Tier 2 bonds were redeemed and a total of €1.8
billion of Tier 2 bonds were issued by ING Groep N.V.
A consistent approach to capital management
ING Bank’s overall approach to capital management is intended to ensure that capital is adequate
to cover the (economic) risks at all levels and to ensure compliance with regulations. ING Bank
constantly challenges capital positions at subsidiary levels to ensure its optimal use. The continued
strength of ING’s capital position, the adequacy of our financial position and our risk management
effectiveness are essential in order to achieve our purpose to empower people and businesses to
realise their goals, as well as to support ING’s commercial activities, to pay dividends on common
shares to shareholders and to invest in new technologies and best practices. In this way, ING aims
to deliver shareholder returns while investing in the innovation of products and services.
Capital Management is tasked to optimise ING’s capital and debt position in order to meet
regulatory requirements, while supporting business growth, ensuring coupon payments and
rewarding shareholders according to a progressive dividend policy. Optimising ING’s capital
allocation entails finding a balance between the forces governing supply and demand. The
uncertainties surrounding these factors are a reflection of changing market circumstances and
continuous unpredictability in regulatory and macroeconomic forces. The process of balancing
these strategic goals is captured in the Internal Capital Adequacy Assessment Processes (ICAAP)
Framework and is enabled by the building blocks and elements facilitating the internal adequacy
and assessment process.
Funding & liquidity
The main objective of ING’s funding and liquidity risk management is to maintain sufficient liquidity
to fund ING’s commercial activities under normal market circumstances and in times of stress
across geographies, maturities and currencies. This requires a diversified funding structure, taking
into consideration all relevant opportunities and constraints.
ING has a Funding & Liquidity (F&L) framework which aims to maintain sufficient liquidity under
normal, adverse and stressed market circumstances. In general, ING considers the adequacy of its
F&L position through three main lenses: (i) Stress, (ii) Sustainability and (iii) Regulatory. For each
lens, ING has a set of risk appetite statements that underscore the bank’s risk appetite profile
Risk and capital management
ING Bank Annual Report 2018 16
Contents | Who we are | Report of the Management Board | Corporate governance | Consolidated annual accounts | Parent company annual accounts | Other information
> Risk and Capital Management
commensurate with the principles for liquidity adequacy. These risk appetite statements are
subsequently translated into a number of metrics with appropriate boundaries and instruments to
measure and manage ING’s F&L adequacy.
ING’s funding consists mainly of retail and corporate deposits contributing 50% and 21% of the
total funding at year-end 2018, respectively. These funding sources provide a relatively stable
funding base. The remainder of the required funding is attracted by Group Treasury through long-
term and short-term professional funding. Group Treasury manages the professional funding in line
with risk appetite, ensuring sufficiently diversified and stable funding.
In 2018, customer lending growth outpaced customer deposit growth. As a result, the reliance on
professional funding activities increased. As the share of customer deposits continued to provide an
excess of stable funding, the additional lending growth was funded through short-term Certificates
of Deposit and Commercial Paper (CD/CP) issuance.
Stress testing
Stress testing is an integral component of our risk and capital management framework. It allows us
to (i) assess potential vulnerabilities in our businesses, business model, and/or portfolios; (ii)
understand the sensitivities of the core assumptions in our strategic and capital plans; and (iii)
improve decision making through balancing risk and return.
In addition to running internal stress test scenarios to reflect the outcomes of the annual risk
assessment, ING also participates in regulatory stress test exercises. ING participated in the 2018
EU-wide stress test conducted by the European Banking Authority (EBA) in cooperation with the
European Central Bank (ECB), De Nederlandsche Bank (DNB), the European Commission and the
European Systemic Risk Board (ESRB). The adverse stress test scenario was developed by the ECB
and covers a three-year time horizon (2018-2020). The stress test was carried out applying a static
balance sheet assumption as of December 2017, and therefore does not take into account current
or future business strategies and management actions. The results also reflect the impact of IFRS 9
for determining loan loss provisions in adverse circumstances.
Managing risks to enable a sustainable business while
strengthening culture and resilience
ING's business is managing risks every day. These include financial risks - we take on credit risk
when we offer loans, guarantees and other products as part of our business model - market risk in
our trading and banking book positions, and liquidity and/or funding risks through financial
management.
Besides financial risks, ING is subject to non-financial risks associated with IT and cybersecurity,
daily operations, compliance with laws and regulations, and adherence to socially accepted ethical
norms. Non-financial risks can also arise through relationships with our clients, should issues
emerge that are irreconcilable with our Environmental and Social Risk framework.
Risk management at ING is directed and overseen by the independent Risk Management function.
The function’s primary roles are to properly identify, measure and manage risks in normal and
stressed economic conditions, and to oversee our business activities such that they are consistent
with both our strategy and our risk appetite.
ING monitors its capacity to take risks through its Risk Appetite Framework. Within the framework,
we monitor a range of financial and non-financial risk metrics to ensure that our risk profile is in line
with our risk appetite. ING’s risk appetite, which is approved by both the Supervisory Board and the
Management Board Banking, defines our desired forward-looking risk profile, and informs the
strategic and financial planning process. It is designed to be able to withstand market volatility and
stress, while meeting regulatory requirements. This framework is complemented by a Non-
Financial Risk Framework that includes compliance risk, operational risk and IT risk. Both
frameworks, including underlying assumptions and metrics, are regularly reviewed such that they
stay relevant in the ever-evolving finance environment. They combine various financial and non-
financial risk disciplines into a single coordinated approach to provide the businesses with a clear
overview of their risks and the way they are managed. This view allows the Management Board
ING Bank Annual Report 2018 17
Contents | Who we are | Report of the Management Board | Corporate governance | Consolidated annual accounts | Parent company annual accounts | Other information
> Risk and Capital Management
Banking and senior management to form an opinion on the adequacy of internal risk management
and control systems for the risks ING faces while pursuing the Management Board Banking’s
strategy. ING also has a process in place for the internal control over financial reporting.
While we are vigilant in our efforts to comply with applicable laws and regulations, it remains a
significant operational challenge for banks to meet all these requirements within the strict
timelines. ING faces the risk of failures in compliance, including in areas where the applicable
regulations are unclear, subject to multiple interpretations or under development, are in conflict
with each other, or where regulators revise their guidance or courts overturn previous rulings.
Implementing the processes and procedures necessary for effective compliance has significant
implications for IT systems and data, as people with the necessary knowledge and skills are scarce.
In the area of compliance risk, the Compliance Risk Management function has established a control
framework based on laws and regulations, as well as on the standards for non-financial risk set out
in ING’s internal control framework. To support management in mitigating compliance risks, it
trains and advises the business on the management of these risks. Topics include money
laundering, terrorist financing, sanction and export control compliance, conflicts of interest, mis-
selling, corruption, protection of customers’ interests, the Foreign Account Tax Compliance Act
(FATCA), the Common Reporting Standard (CRS), and US withholding tax and information reporting
regulations.
Where an ING employee suspects any irregularity or misconduct within ING that leads to or could
lead to a violation of ING’s Orange Code, ING policies, such as anti-bribery and corruption policy,
and/or any law, regulation or code, our Whistleblower Policy provides for anonymous reporting, via
internal or external channels, alongside normal reporting channels. In 2018, ING recorded 75
alleged irregularities in accordance with its Whistleblower Policy, including 45 reports of suspected
breaches of Orange Code or unethical behaviour.
To help us create a culture of integrity across the bank, we invite all employees to participate in our
Promoting Integrity Programme (PIP), running since 2010. This global e-learning programme dives
into dilemmas and issues that employees might face and aims to equip them to take the right
decisions. In 2018, the PIP included the topics data and dilemma management. In 2019, we will
revisit the set-up of the PIP. In addition, two online modules were launched to all staff: one to
enhance awareness on KYC and a second one on whistleblowing.
In the Netherlands and Belgium we initiated ‘i for integrity’ in 2018, an approach aimed at
strengthening a mind-set that puts integrity above all and embeds integrity in the organisation
and our decision-making processes.
ING has designed controls to mitigate the compliance risks associated with the above-mentioned
risk areas. Their effectiveness is tested periodically, and senior management is responsible for
ensuring our processes comply with applicable laws and regulations, ING’s internal policies and
procedures and the Orange Code.
In connection with the introduction of the ING Way of Working, Operational Risk Management
(ORM) and Information Risk Management (IRM) have established a new risk governance that adopts
the ING Way of Working for non-financial risk (NFR) management within various entities. To enable
business lines to manage their risks linked to the increased sourcing activities within ING, the
sourcing policy has been updated to cover generic control objectives for mitigating and monitoring
key risks. The integrated top-down/bottom-up emerging risk assessment identifies and monitors
developments that may have an impact on ING’s strategy and risk profile, like changes in the global
environment, customer needs and expectations, local/global regulatory requirements and the
effectiveness of our response to technological developments.
Further, ING is vitally dependent on its IT infrastructure for the reliability and continuity of its
operations. Although IT and digitalisation are seen as opportunities for ING to distinguish itself from
competitors, they also present risks. In 2018, ING continued to focus strongly on managing its IT
risk exposure. ING aims to further increase the efficiency and effectiveness of our IT infrastructure
and the reliability and continuity of IT processing.
ING Bank Annual Report 2018 18
Contents | Who we are | Report of the Management Board | Corporate governance | Consolidated annual accounts | Parent company annual accounts | Other information
> Risk and Capital Management
Data is everywhere, in both digital and non-digital form. With cybercrime and data management a
continuing threat to companies in general and to financial institutions in particular, ING has set
minimum standards for platform security, data management, cybercrime resilience and security
monitoring, as well as for identity and access management that the right people have the right
access to the right resources at the right time.
User Access Management (UAM) remains an important element of our control framework to
mitigate unauthorised and/or inappropriate access to our data and information. ING is building on
its cybercrime resilience, further enhancing the control environment to protect, detect and respond
to e-banking fraud, DDoS and targeted attacks.
ING’s most important risks and control measures are regularly reported to and discussed by the
Risk Committee of the Supervisory Board. Both financial and non-financial risk reports are reviewed
in detail, including the status of ING’s metrics with regard to solvency, liquidity, funding, credit,
market risk and non-financial risks. In 2018, as part of this process, the Risk Committee and the full
Supervisory Board spent considerable time discussing among others improvement in the bank-wide
Know Your Customer Enhancement Programme.
In addition, the design and operation of the Risk Appetite Framework and the Non-Financial Risk
Framework are discussed annually with the Risk Committee and the full Supervisory Board. The
design and operation of internal controls over financial reporting are discussed annually with the
Audit Committee and reported to the Supervisory Board.
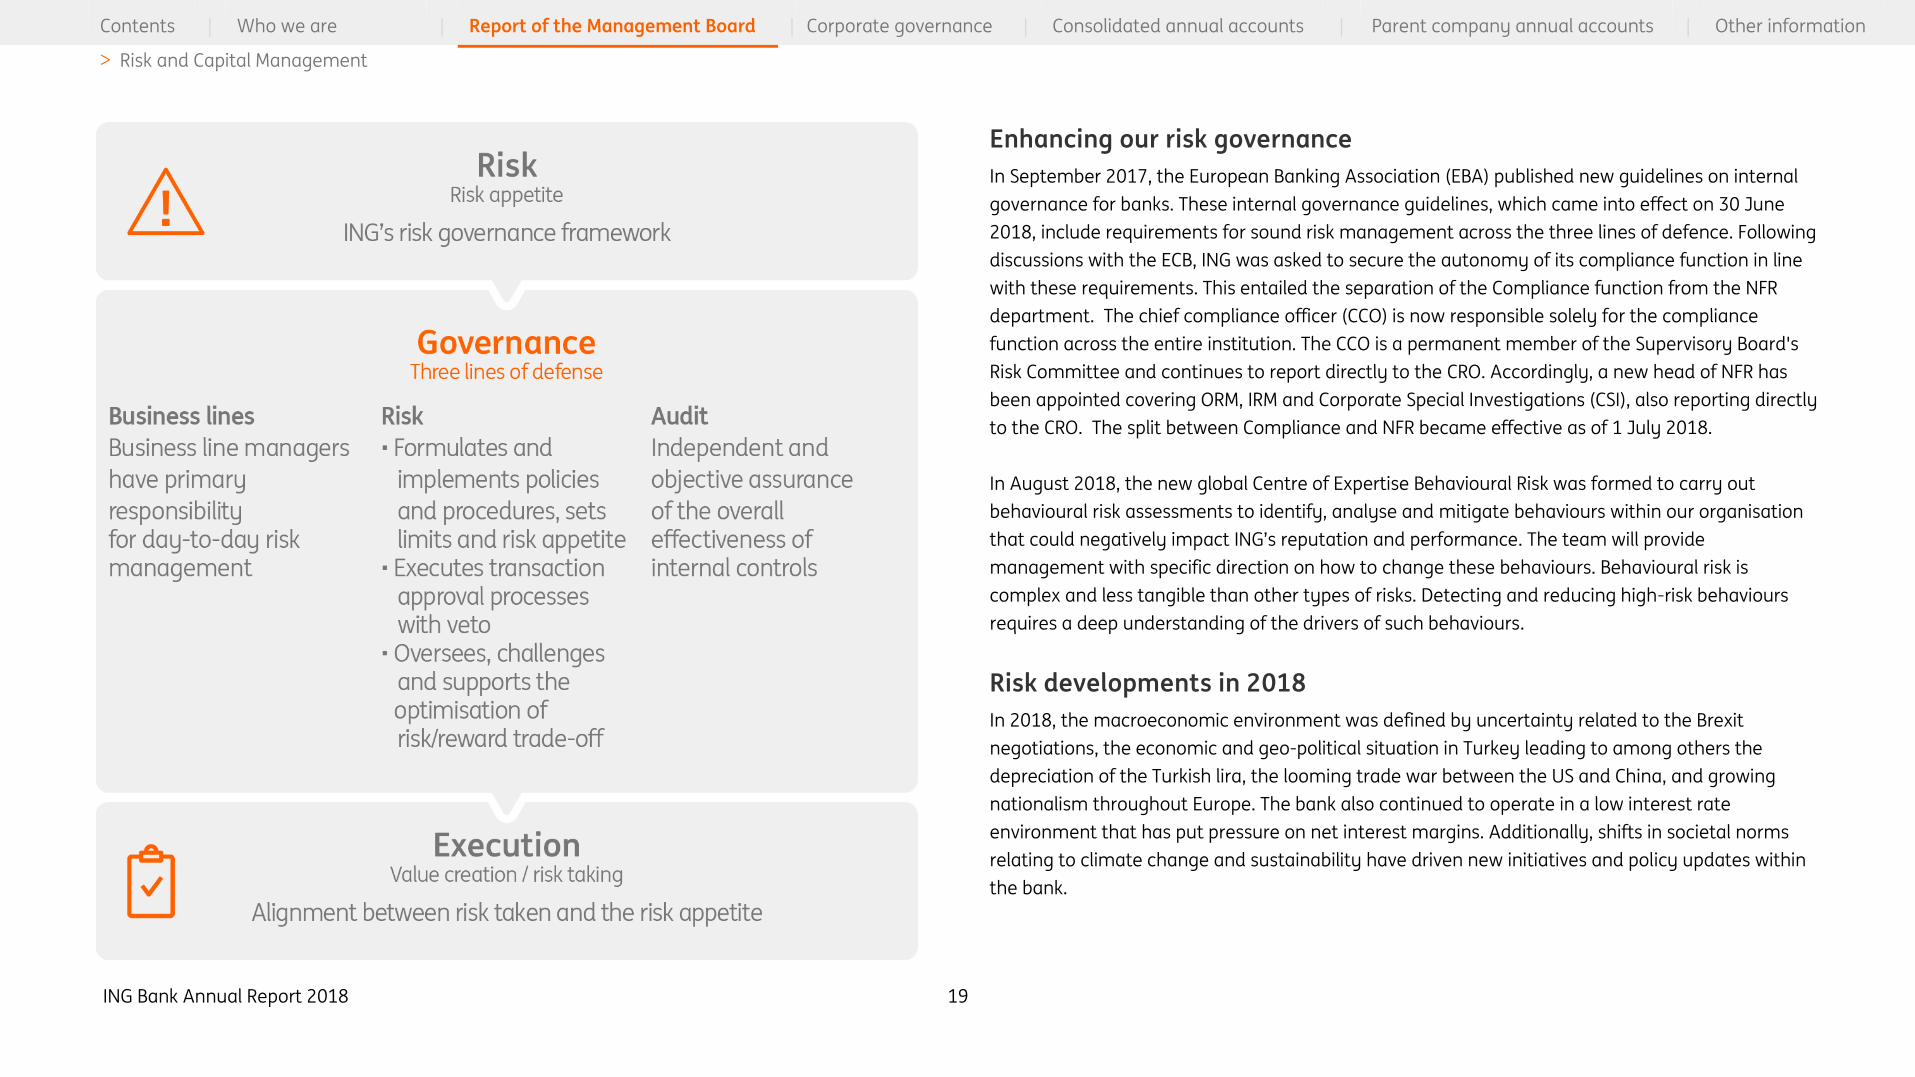
Three lines of defence
ING’s risk and control structure is based on the three lines of defence model. This model aims to
provide a sound governance framework for risk management by defining and implementing three
different risk management layers with distinct roles, responsibilities, and oversight.
The heads of ING’s lines of business and their delegates form the first line of defence and have
primary accountability for the performance, operations, compliance and effective control of risks
affecting their respective businesses. They originate loans, deposits and other products within
applicable frameworks and limits, they know our customers and are best positioned to act in both
the customers’ and ING’s best interest. The COO is responsible and accountable for proper security
and controls on both local and global applications and IT-platforms servicing the bank.
The independent risk management departments, headed by the chief risk officer (CRO), act as a
second line of defence. As a member of the Management Board Banking, risk remains a continuing
topic for the leadership team. The second line of defence’s role is to properly identify, measure,
manage and report risks. In order to achieve that goal, the second line develops policies and
guidelines, implements and operates control frameworks, and decides on risk acceptance. It also
aims to achieve compliance with internal and external requirements on an individual and
consolidated basis. Furthermore, the second line supports the commercial departments and acts
where necessary to keep the risk profile within the defined risk appetite.
Corporate Audit is our third line of defence. It provides an independent assessment of the internal
controls over the risks to ING’s business processes and assets, including risk management activities
performed in both the first and second lines of defence.
We believe this set-up facilitates the overall risk and control environment. Together with a
governance process using business and Group level risk committees, the Management Board
Banking receives regular information about the risk profile of ING Bank.
ING Bank Annual Report 2018 19
Contents | Who we are | Report of the Management Board | Corporate governance | Consolidated annual accounts | Parent company annual accounts | Other information
> Risk and Capital Management
Enhancing our risk governance
In September 2017, the European Banking Association (EBA) published new guidelines on internal
governance for banks. These internal governance guidelines, which came into effect on 30 June
2018, include requirements for sound risk management across the three lines of defence. Following
discussions with the ECB, ING was asked to secure the autonomy of its compliance function in line
with these requirements. This entailed the separation of the Compliance function from the NFR
department. The chief compliance officer (CCO) is now responsible solely for the compliance
function across the entire institution. The CCO is a permanent member of the Supervisory Board's
Risk Committee and continues to report directly to the CRO. Accordingly, a new head of NFR has
been appointed covering ORM, IRM and Corporate Special Investigations (CSI), also reporting directly
to the CRO. The split between Compliance and NFR became effective as of 1 July 2018.
In August 2018, the new global Centre of Expertise Behavioural Risk was formed to carry out
behavioural risk assessments to identify, analyse and mitigate behaviours within our organisation
that could negatively impact ING’s reputation and performance. The team will provide
management with specific direction on how to change these behaviours. Behavioural risk is
complex and less tangible than other types of risks. Detecting and reducing high-risk behaviours
requires a deep understanding of the drivers of such behaviours.
Risk developments in 2018
In 2018, the macroeconomic environment was defined by uncertainty related to the Brexit
negotiations, the economic and geo-political situation in Turkey leading to among others the
depreciation of the Turkish lira, the looming trade war between the US and China, and growing
nationalism throughout Europe. The bank also continued to operate in a low interest rate
environment that has put pressure on net interest margins. Additionally, shifts in societal norms
relating to climate change and sustainability have driven new initiatives and policy updates within
the bank.

ING Bank Annual Report 2018 20
Contents | Who we are | Report of the Management Board | Corporate governance | Consolidated annual accounts | Parent company annual accounts | Other information
> Risk and Capital Management
As of 1 January 2018, ING transitioned to reporting non-performing loans (NPLs) and provisions
under the IFRS 9 methodology. The Stage 3 credit-impaired assets and the Stage 3 ratio (Stage 3
credit-impaired assets expressed as a percentage of total credit outstandings) have replaced the
NPL and the NPL ratio. Therefore, the comparative figures for the credit outstandings and the
opening balance for the provisions have been adjusted. In 2018, ING Bank’s Stage 3 ratio improved
to 1.5% from 1.8% at the beginning of the year. The Stage 3 credit-impaired outstandings
decreased, particularly within Retail in the Netherlands and industry lending, whereas the total
credit outstandings went up year-on-year. On a portfolio level, improvements were observed in
residential mortgages and business lending both in the Netherlands, where the Stage 3 ratio
decreased to 0.7% from 1.0% and 4.7% from 6.2%, respectively, reflecting the positive
macroeconomic environment. Within industry lending, the Stage 3 ratio for Project and Asset-
based Finance and Real Estate Finance dropped by 0.8 percentage points to 1.5% and 0.8
percentage points to 1.2% respectively following restructuring and repayments of some larger
files. Overall, ING Bank’s Stage 3 ratio remained low, with relatively limited impact from the events
in Turkey. The stock of provisions decreased by €0.9 billion to €4.6 billion mainly due to
reclassification of the Italian general lease run-off portfolio to assets held for sale, higher write offs
and exchange rate movements following the depreciation of the Turkish lira in Stage 3 files, and a
positive trend of the asset quality in the Stages 1 and 2. ING Bank’s Stage 3 provision coverage ratio
decreased to 30.6 from 34.6% at the beginning of the year. ING Bank’s loan portfolio consists
predominantly of asset-based and secured loans, including residential mortgages, Real Estate
Finance, and project-based finance.
The fifth Anti-Money Laundering Directive (5th AMLD) was adopted by the EU Parliament on 19
April 2018 and published in the EU Official Journal on 19 June 2018. EU member states have to
transpose the 5th AMLD into their local laws and regulations by 10 January 2020. The main
changes brought by the 5th AMLD: (i) enhance the powers of EU financial intelligence units and
facilitate increased transparency regarding who really owns companies and trusts by establishing
beneficial ownership registers; (ii) prevent risks associated with the use of virtual currencies for
terrorist financing and limit the use of prepaid cards; (iii) improve the safeguards for financial
transactions to and from high-risk third countries; (iv) enhance the access of financial intelligence
units to information, including centralised bank account registers; (v) ensure centralised national
bank and payment account registers or central data retrieval systems in all member states.
Financial economic crime/KYC
In September 2018, ING was impacted by the €775 million settlement agreement with the Dutch
Public Prosecution Service related to the previously disclosed criminal investigations that found
serious shortcomings in the execution of customer due diligence requirements to prevent financial
economic crime at ING Netherlands in the period investigated (2010-2016). Read more on ing.com
The implementation and execution of policies and procedures related to anti-money laundering
(AML) is an ongoing activity. In addition, ING has taken a number of specific measures to
strengthen its management of compliance risks and address the root causes of the shortcomings.
These measures are being implemented as part of the bank-wide, global Know Your Customer (KYC)
Enhancement Programme, a multi-year improvement programme with integral steering. This
specific programme was officially launched early in 2017 and is expected to run until end-2020. ING
is committed to periodically providing the Dutch central bank (DNB) with regular updates on the
progress made.
The KYC Enhancement Programme encompasses all client segments in all ING business units,
leveraging on experiences from the enhancement programme already started in the Netherlands.
The programme consists of three parts: (a) look-back analysis on past deficiencies in post-
transaction monitoring. The look-back analysis consists of screening of transactions executed in the
past. In case unusual transactions are identified, ING is committed to following the applicable
reporting process; (b) enhancement of customer due diligence files with the aim to document
sufficiently the knowledge the bank has about its clients in the line with past and new
requirements; (c) structural solutions that should support getting sustainably better in addressing
money laundering risks in our portfolio and complying with laws and regulations.

ING Bank Annual Report 2018 21
Contents | Who we are | Report of the Management Board | Corporate governance | Consolidated annual accounts | Parent company annual accounts | Other information
> Risk and Capital Management
The structural solutions comprise five pillars:
• Development and global roll-out of KYC risk appetite statements, KYC risk assessments on
clients capability structure and maturity assessments. Setting acceptance criteria based on
which clients are on-boarded, transactions are processed or taxes are withheld. This pillar covers
also the use of a uniform risk assessment methodology for KYC-related integrity risks and a
common taxonomy to measure effectiveness.
• Development and global roll-out of a bank-wide KYC digital service platform, including
processes and tooling around CDD, screening and workflow management. This includes the
fulfilment of the client acceptance and maintenance life cycle within one global digital platform.
All required screening components (name screening, pre-transaction screening, adverse media
screening) will be incorporated into the client acceptance due diligence process. Once a customer
is onboarded, ongoing screening and monitoring of transactions can then be activated.
• Translation of risk assessment outcomes into scenarios and alert definitions that can be
applied in transaction monitoring. This includes the design and definitions of the applicable
financial economic crime (FEC) and client activity monitoring (CAM) scenarios per entity, the
building of the alert definitions (including data feeds) and migration to a central tool where
relevant and possible, and validating and testing the approach from risks to alerts.
• Set up central KYC organisation that defines standards and drives global execution and
improvements. This includes the set-up of the new KYC organisation now in place. As of 4Q 2018,
we have strengthened the KYC governance by including the heads of the business lines in the
KYC Committee. Going forward we will further develop the global KYC function to ensure
structural embedding of standardised and uniform ways of working, with regular improvement
cycles and support of advanced technologies and insights.
• Develop and rollout KYC communication and awareness initiatives and set up a behavioural
risk department that performs risk assessments. In its internal communications, ING has made
it clear that non-financial risk and compliance are just as important as financial risk and need to
be embedded in ING’s DNA. An online training module to enhance awareness of KYC was rolled
out to all employees worldwide. MBB members spent a considerable amount of time engaging
with staff to explain and discuss our responsibility as gatekeepers of the financial system. In
these meetings, the impact of the settlement, the root causes, the shortcomings and our
commitment and efforts to enhance were discussed. ING started behavioural risk assessments
during which more than 100 interviews were held and more than 200 surveys were done to
understand better how people, teams and departments interact and work together. Based on
these insights, actions for improvement will be considered.
ING recognises that fighting Financial Economic Crime requires close cooperation with other banks
and supervisory and regulatory authorities. ING is therefore working with the Dutch Banking
Association (NVB) and the Dutch central bank (DNB) on harmonising efforts in the fight against FEC
and participates actively in various working groups and project teams in this area. As such, ING
actively participates in public-private partnerships to combat FEC, such as participating in the FEC
Council PPS (‘FEC-RAAD Public Private Cooperation’) in which Dutch authorities and financial
institutions cooperate on supervision, control, prosecution or investigation with financial sector
parties to strengthen the integrity of the sector. This is done by means of preventative action to
identify and combat threats to integrity. ING believes that introducing clear accountabilities and
standard processes across the financial industry will allow ING to manage and control KYC activities
and integrity risks more effectively.
As previously noted, in connection with the above-mentioned investigations ING also received
information requests from the US Securities and Exchange Commission (SEC). ING has received a
formal notification from the SEC that it has concluded its investigation and, based on the
information at that time, the Division of Enforcement does not intend to recommend SEC
enforcement action against ING.

ING Bank Annual Report 2018 22
Contents | Who we are | Report of the Management Board | Corporate governance | Consolidated annual accounts | Parent company annual accounts | Other information
> Composition of the Management Board Banking and Supervisory Board
Management Board Banking
Composition on 31 December 2018
• R.A.J.G. (Ralph) Hamers (52)
CEO, chairman of Management Board Banking
• J.V. (Koos) Timmermans (58)1
CFO, Vice-chairman
• S.J.A. (Steven) van Rijswijk (48)
CRO, Management Board Banking
• M.I. (Isabel) Fernandez Niemann (50)
Head of Wholesale Banking
• R.M.M. (Roel) Louwhoff (53)
COO/CTO, Management Board Banking
• (Aris) Bogdaneris (55)
Head of Challengers & Growth Markets
• R.B. (Roland) Boekhout (55)
Head of Market Leaders
1 Please note that Koos Timmermans stepped down from his position as CFO and member of the Executive Board and
Management Board Banking of ING. He was succeeded by Tanate Phutrakul, who was appointed as CFO and member of the
Management Board Banking effective 7 February 2019.
Supervisory Board
Composition on 31 December 2018
G.J. (Hans) Wijers (67) - Chairman
H.J.M (Hermann-Josef) Lamberti (62) - Vice-chairman
J.P. (Jan Peter) Balkenende (62)
E.F.C.B. (Eric) Boyer de la Giroday (66)
H. W. (Henk) Breukink (68)
M. (Mariana) Gheorghe (62)
M. (Margarete) Haase (65)
R.W.P. (Robert) Reibestein (62)
Composition of the Management Board Banking and Supervisory Board
ING Bank Annual Report 2018 23
Contents | Who we are | Report of the Management Board | Corporate governance | Consolidated annual accounts | Parent company annual accounts | Other information
> Composition of the Management Board Banking and Supervisory Board
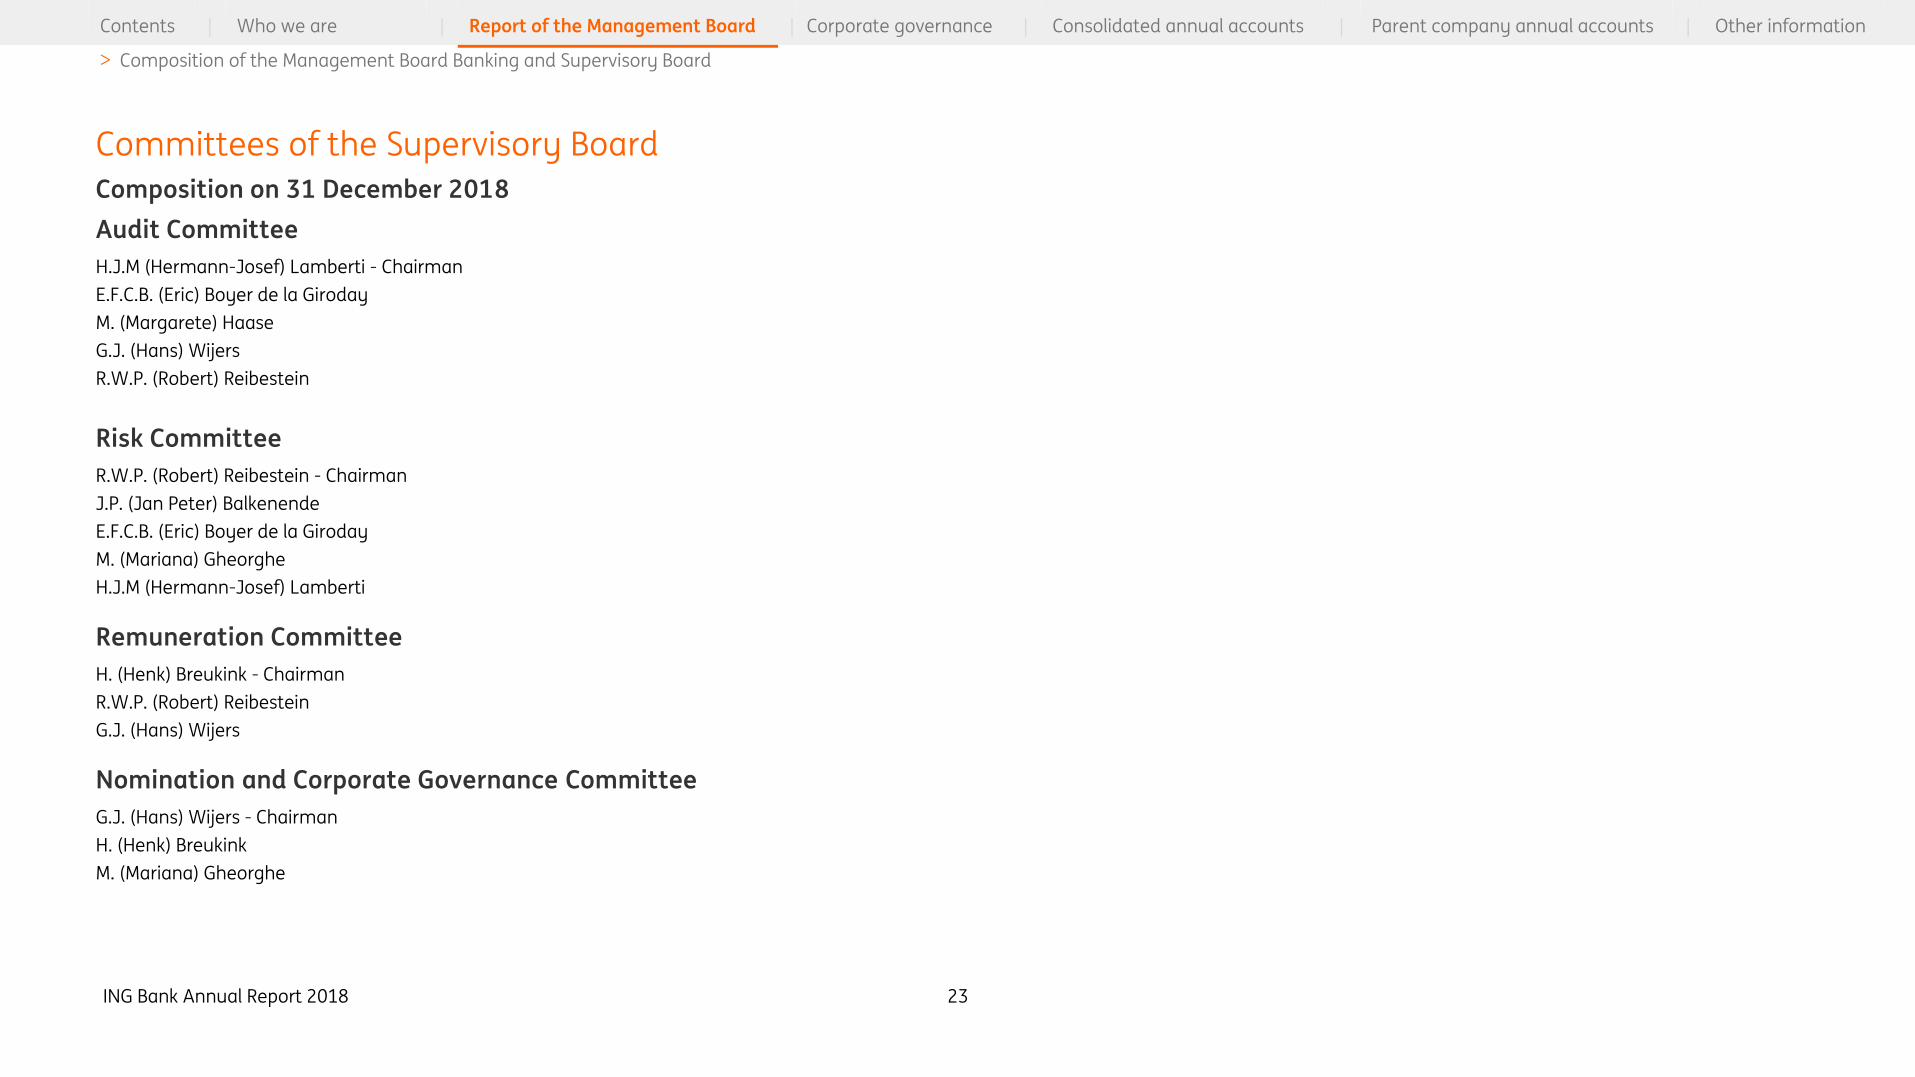
Committees of the Supervisory Board
Composition on 31 December 2018
Audit Committee
H.J.M (Hermann-Josef) Lamberti - Chairman
E.F.C.B. (Eric) Boyer de la Giroday
M. (Margarete) Haase
G.J. (Hans) Wijers
R.W.P. (Robert) Reibestein
Risk Committee
R.W.P. (Robert) Reibestein - Chairman
J.P. (Jan Peter) Balkenende
E.F.C.B. (Eric) Boyer de la Giroday
M. (Mariana) Gheorghe
H.J.M (Hermann-Josef) Lamberti
Remuneration Committee
H. (Henk) Breukink - Chairman
R.W.P. (Robert) Reibestein
G.J. (Hans) Wijers
Nomination and Corporate Governance Committee
G.J. (Hans) Wijers - Chairman
H. (Henk) Breukink
M. (Mariana) Gheorghe
ING Bank Annual Report 2018 24
Contents | Who we are | Report of the Management Board | Corporate governance | Consolidated annual accounts | Parent company annual accounts | Other information
> Corporate governance
This chapter, including the parts of this Annual Report
incorporated by reference, with the separate publication of ‘ING’s
application of the Dutch Banking Code’ dated 4 March 2019, (see
www.ing.com), together comprise the ‘corporate governance
statement’ as specified in section 2a of the decree with respect to
the contents of the Annual Report (‘Besluit inhoud
bestuursverslag’)1
Dutch Banking Code
The Dutch Banking Code, as revised in 2014, is applied by ING Bank N.V. The Banking Code can be
downloaded from the website of the Dutch Banking Association (www.nvb.nl). Its application to ING
Bank is described in ‘Application of the Dutch Banking Code by ING Bank N.V.’, available on the ING
Group website (www.ing.com). This is to be read in conjunction with and deemed to be incorporated
in the Annual Report of ING Bank N.V.
Financial reporting process
As ING Bank N.V. is a consolidated subsidiary of ING Groep N.V. (‘ING Group’) its policies and
procedures for establishing and maintaining adequate internal control over financial reporting are
the same as those applied by ING Group for its consolidated financial statements with respect to
ING Bank N.V. and the entities included in the latter's own consolidated financial statements.
1 Dutch Bulletin of Acts (Staatsblad) 2004, 747, most recently amended with effect from 1 January 2018: Dutch Bulletin of
Acts 2017, 332.
ING’s internal control over financial reporting is a process designed under the supervision of our
principal executive and principal financial officers to provide reasonable assurance regarding the
reliability of financial reporting and the preparation of financial statements for external purposes in
accordance with generally accepted accounting principles.
Our internal control over financial reporting includes those policies and procedures that:
• pertain to the maintenance of records that, in reasonable detail, accurately and fairly reflect the
transactions and dispositions of the assets of ING;
• provide reasonable assurance that transactions are recorded as necessary to permit preparation
of financial statements in accordance with generally accepted accounting principles, and that
our receipts and expenditures are being made only in accordance with authorisations of our
management and directors; and • provide reasonable assurance regarding prevention or timely detection of unauthorised
acquisition, use or disposition of our assets that could have a material effect on our financial
statements.
ING has a process in place where, under the supervision and with the participation of the CEO and
CFO. ING assesses the effectiveness of internal control over financial reporting, based on the criteria
of the Committee of Sponsoring Organisations of the Treadway Commission (‘COSO’) in Internal
Reporting – Integrated Framework (2013 Framework).
Board composition
ING Bank aims to have an adequate and balanced composition of its Management Board. Thereto,
annually, the Supervisory Board assesses the composition of the Management Board. In the
context of such assessment, ING Bank aims to have a gender balance by having at least 30 percent
Corporate Governance

ING Bank Annual Report 2018 25
Contents | Who we are | Report of the Management Board | Corporate governance | Consolidated annual accounts | Parent company annual accounts | Other information
> Corporate governance
men and at least 30 percent women amongst its Management Board members. However, because
of the fact that ING Bank needs to balance several other relevant selection criteria when
composing its Management Board, the composition of the Management Board did not meet the
abovementioned gender balance in 2018 (14 percent women). ING Bank will continue to strive for
an adequate and balanced composition of its Management Board in future appointments, by taking
into account all relevant selection criteria including but not limited to gender balance, executive
experience, experience in corporate governance of large stock-listed companies and experience in
the political and social environment.
Changes in the composition
As announced on 4 December 2018, Tanate Phutrakul was appointed as CFO and member of the
Management Board Banking, succeeding Koos Timmermans on 7 February 2019. The Supervisory
Board will nominate Tanate Phutrakul for appointment as a member of the Executive Board of ING
Group at the Annual General Meeting on 23 April 2019. The appointments have been approved by
the European Central Bank (‘ECB’).
Information on members of the Management Board Banking
R.A.J.G. (Ralph) Hamers member and Chairman Management
Board (Born 1966, Dutch nationality, male; appointed in 2013)
Ralph Hamers was appointed a member of the Executive Board of ING Group on 13 May 2013. On 1
October 2013, he was appointed CEO and Chairman of this Board and of the Management Board
Banking. Ralph Hamers joined ING in 1991. Before his appointment to the Executive Board, he was
CEO of ING Belgium and Luxembourg.
Relevant positions pursuant to CRD IV2
CEO and Chairman of the Management Board Bankingof ING Bank N.V. and the Executive Board of
ING Groep N.V.
Other relevant ancillary positions Member of the Management Board of the Nederlandse Vereniging van Banken (NVB), member of
the Board of Directors of the Institute of International Finance, Inc., non-executive member of the
board of Foundation Royal Concertgebouw Orchestra Amsterdam and member of UNICEF’s Global
Board of the Young People’s Agenda .
J.V. (Koos) Timmermans, Chief Financial Officer (‘CFO’) and vice-
chairman (Born 1960, Dutch nationality, male; appointed in 2011 and stepped down on 7 February 2019)
Koos Timmermans was appointed as vice-chairman of the Management Board Banking as of 1
October 2011 and appointed as CFO since 8 May 2017. From 1 October 2014, Koos Timmermans
has, in addition to his current tasks which include aligning ING Bank’s activities and the balance
sheet with new and upcoming regulation, also assumed responsibilities for the Bank’s operations in
the Benelux and ING’s sustainability department.
Relevant positions pursuant to CRD IV
Vice-chairman and CFO of the Management Board Banking of ING Bank N.V. and of the Executive
Board of ING Groep N.V., member of the Management Board of ING Support Holding B.V. and
member of the Supervisory Board of Nederlandse Financierings-Maatschappij voor
Ontwikkelingslanden N.V. (‘FMO’, Entrepreneurial Development Bank)
2 The fourth EU Capital Requirements Directive 2013/36/EU
ING Bank Annual Report 2018 26
Contents | Who we are | Report of the Management Board | Corporate governance | Consolidated annual accounts | Parent company annual accounts | Other information
> Corporate governance
Other relevant ancillary positions Member of the Supervisory Board Stadsherstel Amsterdam N.V. and member of the Supervisory
Board of Amsterdam Institute of Finance.
S.J.A. (Steven) van Rijswijk, member and Chief Risk Officer (‘CRO’) (Born 1970, Dutch nationality, male; appointed in 2017)
Steven van Rijswijk has been a member of the Management Board Banking since 8 May 2017. He
was appointed CRO on 1 August 2017. He is also a member and CRO of the Executive Board of ING
Groep N.V. Before becoming a member of the Management Board Banking, Steven van Rijswijk was
global head of Client Coverage within ING Wholesale Banking. Steven van Rijswijk joined ING in 1995
in the Corporate Finance team holding various positions in the areas of Mergers & Acquisitions and
Equity Markets. Steven van Rijswijk holds a master’s degree in business economics from Erasmus
University Rotterdam (the Netherlands).
Relevant positions pursuant to CRD IV
Member and CRO of the Management Board Banking of ING Bank N.V. and of the Executive Board of
ING Groep N.V.
R. (Roland) Boekhout, member and head of Market Leaders (Born 1963, Dutch nationality, male; appointed in 2017)
Roland Boekhout was appointed a member of the Management Board Banking since 8 May 2017.
He is also head of Market Leaders. As head of Market Leaders, he is responsible for ING Bank’s
operations in the Benelux, and the intended integration of ING’s banking platform in the
Netherlands and Belgium. In addition, he is responsible for Advanced Analytics. Furthermore, he is a
non- executive director of ING Belgium N.V./S.A.
Roland Boekhout holds a master’s degree in business economics from Erasmus University
Rotterdam, the Netherlands.
Relevant positions pursuant to CRD IV Member of the Management Board Banking of ING Bank N.V. and Non-Executive Director of ING
Belgium N.V./S.A.
Other relevant ancillary positions Member of the board of (Vorstandsmitglied) of the Deutsch-Niederländische Handelskammer,
member of the Euronext advisory board, member of the advisory council of the Maatschappelijke
Alliantie (the Netherlands), chairman of the Supervisory Council ING Netherlands and chairman of
Stichting ING Nederland Fonds (foundation) and member of the management board of the
Netherlandse Vereniging van Banken (NVB).
A. (Aris) Bogdaneris, member and head of Challengers & Growth
Markets (Born 1963, Canadian nationality, male; appointed in 2015)
Aris Bogdaneris was appointed a member of the Management Board Banking on 1 June 2015. He is
also head of Challengers & Growth Markets, responsible for all markets where ING is active in both
retail and wholesale banking outside the Benelux.
Prior to this appointment, Aris Bogdaneris was a member of the Management Board Banking
responsible for Retail Banking at Raiffeisen Bank International as well as Chief Operating Officer
overseeing Information Technology and Operations/Shared Service Centers.
Relevant positions pursuant to CRD IV Member of the Management Board Banking of ING Bank N.V., member of Management Board of
ING Bank (Australia) Ltd and member of the Supervisory Board of ING DiBa.

ING Bank Annual Report 2018 27
Contents | Who we are | Report of the Management Board | Corporate governance | Consolidated annual accounts | Parent company annual accounts | Other information
> Corporate governance
M.I. (Isabel) Fernandez Niemann, member and head of Wholesale
Banking (Born 1968, Spanish Dutch nationality, female; appointed in 2016)
Isabel Fernandez Niemann was appointed a member of the Management Board Banking as from 1
September 2016. She is also head of Wholesale Banking as from 1 November 2016. Prior to her
appointment Isabel Fernandez Niemann was Global Commercial Leader and Head of Sales for
General Electric.
Relevant position pursuant to CRD IV Member of the Management Board Banking of ING Bank N.V.
Other relevant ancillary positions
Member of the board of Stichting het Nationale Ballet Fonds and member of the Supervisory
Council ING Netherlands
R.M.M. (Roel) Louwhoff, member and COO Management Board (Born 1965, Dutch nationality, male; appointed in 2014)
Roel Louwhoff was appointed a member and chief operations officer (COO) of the Management
Board Banking on 1 May 2014. He was also appointed Chief Transformation Officer (CTO) per 1
October 2016. In this role, that he fulfils alongside his COO role, he is responsible for operations of
the bank-wide transformation that was announced in 2016. Roel Louwhoff is responsible for
Operations, IT (including standardisation), data management, information security, process
management and procurement. Prior to this appointment, Roel Louwhoff was CEO of BT Operate.
Relevant position pursuant to CRD IV Member of the Management Board Banking of ING Bank N.V.
Supervisory Board
ING Group needs to balance several relevant selection criteria when composing its Supervisory
Board but strives for an adequate and balanced composition thereof, by taking into account all
relevant selection criteria including, but not limited to experience in retail and wholesale banking,
gender balance, executive experience, experience in corporate governance and experience in the
political and social environment.
The Nomination Committee assesses the composition of the Supervisory Board, annually. In the
context of such assessment, ING Group aims to have a gender balance by having at least 30
percent men and at least 30 percent women amongst its Supervisory Board members. Margarete
Haase was appointed as a member of the Supervisory Board at the General Meeting of 2017 and
per 1 October 2017 she has been present as an observer at the meetings of the Supervisory Board.
Her appointment became effective on 1 May 2018. The percentage of females within the
Supervisory Board in 2018 is 25 percent. Further measures are being taken to ensure the preferred
composition in terms of gender as soon as reasonably possible.
Ancillary positions Member of the Supervisory Board may hold various other directorships, paid positions and ancillary
positions and are required to provide details on these. CRD IV, restricts the total number of
supervisory board positions or non-executive directorships with commercial organisations that
may be held by a Supervisory Board member to four, or to two, if the Supervisory Board member
also has an executive board position. The European Central Bank may under special circumstances
permit a Supervisory Board member to fulfil an additional supervisory board position or non-
executive directorship. Positions with, inter alia, subsidiaries or qualified holdings are not taken into
account in the application of these restrictions. Such positions may not conflict with the interests of
ING Bank N.V. It is the responsibility of the individual member of the Supervisory Board to ensure
that the directorship duties are reported and performed properly and are not affected by any other
positions that the individual may hold outside ING Bank N.V.
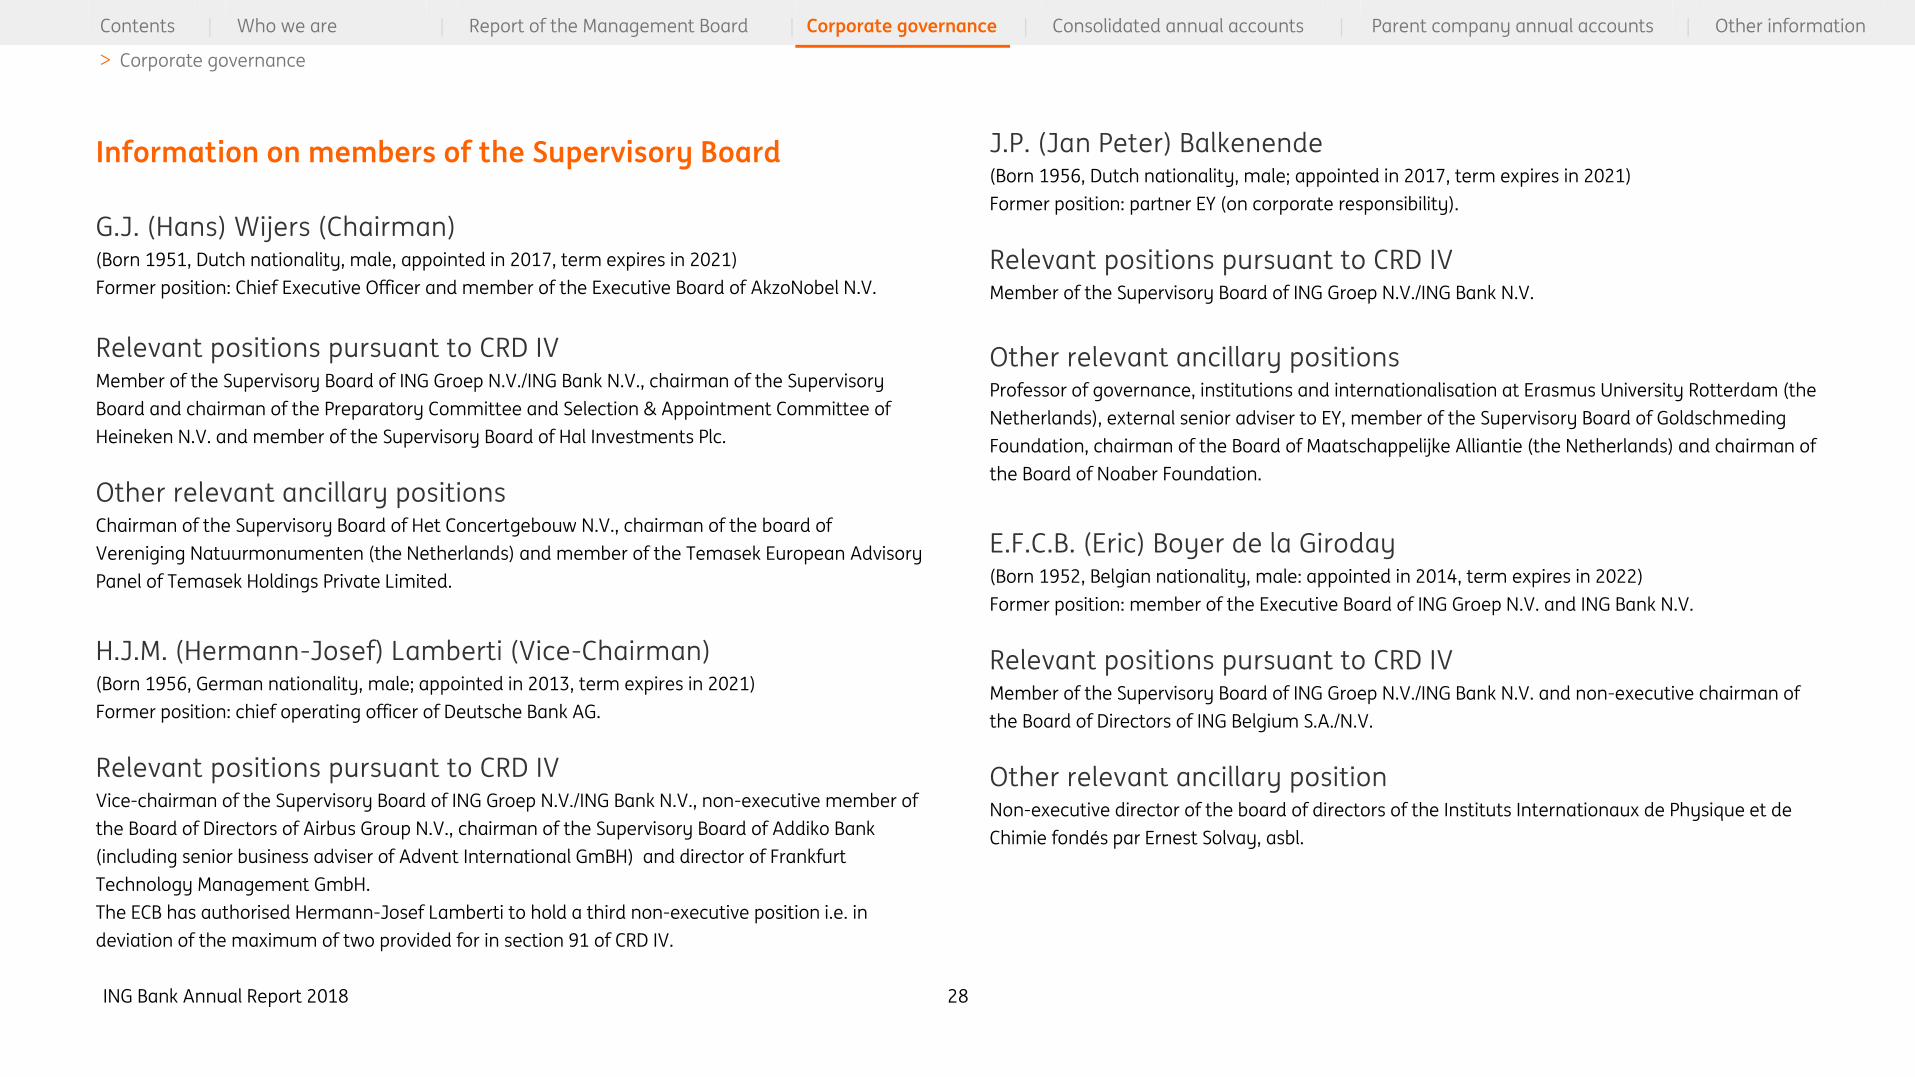
ING Bank Annual Report 2018 28
Contents | Who we are | Report of the Management Board | Corporate governance | Consolidated annual accounts | Parent company annual accounts | Other information
> Corporate governance
Information on members of the Supervisory Board
G.J. (Hans) Wijers (Chairman) (Born 1951, Dutch nationality, male, appointed in 2017, term expires in 2021)
Former position: Chief Executive Officer and member of the Executive Board of AkzoNobel N.V.
Relevant positions pursuant to CRD IV Member of the Supervisory Board of ING Groep N.V./ING Bank N.V., chairman of the Supervisory
Board and chairman of the Preparatory Committee and Selection & Appointment Committee of
Heineken N.V. and member of the Supervisory Board of Hal Investments Plc.
Other relevant ancillary positions Chairman of the Supervisory Board of Het Concertgebouw N.V., chairman of the board of
Vereniging Natuurmonumenten (the Netherlands) and member of the Temasek European Advisory
Panel of Temasek Holdings Private Limited.
H.J.M. (Hermann-Josef) Lamberti (Vice-Chairman) (Born 1956, German nationality, male; appointed in 2013, term expires in 2021)
Former position: chief operating officer of Deutsche Bank AG.
Relevant positions pursuant to CRD IV Vice-chairman of the Supervisory Board of ING Groep N.V./ING Bank N.V., non-executive member of
the Board of Directors of Airbus Group N.V., chairman of the Supervisory Board of Addiko Bank
(including senior business adviser of Advent International GmBH) and director of Frankfurt
Technology Management GmbH.
The ECB has authorised Hermann-Josef Lamberti to hold a third non-executive position i.e. in
deviation of the maximum of two provided for in section 91 of CRD IV.
J.P. (Jan Peter) Balkenende (Born 1956, Dutch nationality, male; appointed in 2017, term expires in 2021)
Former position: partner EY (on corporate responsibility).
Relevant positions pursuant to CRD IV Member of the Supervisory Board of ING Groep N.V./ING Bank N.V.
Other relevant ancillary positions Professor of governance, institutions and internationalisation at Erasmus University Rotterdam (the
Netherlands), external senior adviser to EY, member of the Supervisory Board of Goldschmeding
Foundation, chairman of the Board of Maatschappelijke Alliantie (the Netherlands) and chairman of
the Board of Noaber Foundation.
E.F.C.B. (Eric) Boyer de la Giroday (Born 1952, Belgian nationality, male: appointed in 2014, term expires in 2022)
Former position: member of the Executive Board of ING Groep N.V. and ING Bank N.V.
Relevant positions pursuant to CRD IV Member of the Supervisory Board of ING Groep N.V./ING Bank N.V. and non-executive chairman of
the Board of Directors of ING Belgium S.A./N.V.
Other relevant ancillary position Non-executive director of the board of directors of the Instituts Internationaux de Physique et de
Chimie fondés par Ernest Solvay, asbl.
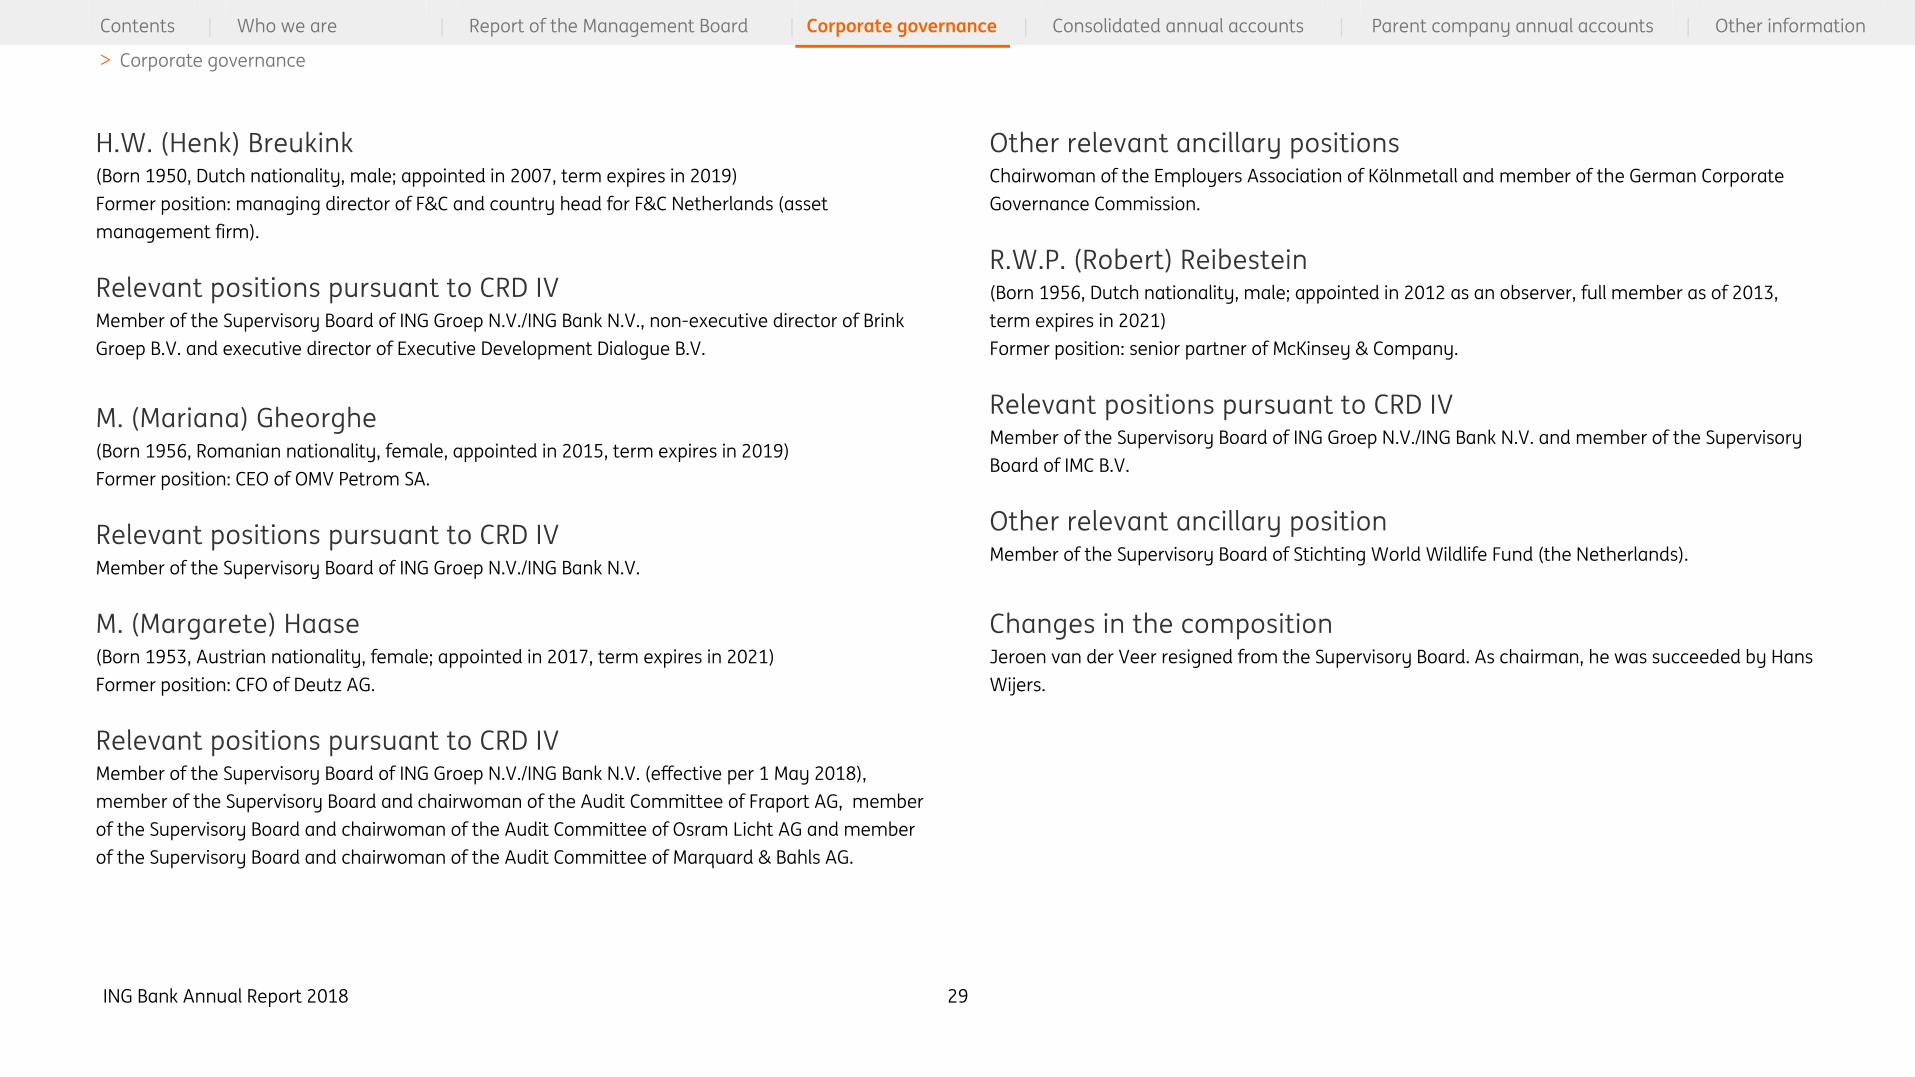
ING Bank Annual Report 2018 29
Contents | Who we are | Report of the Management Board | Corporate governance | Consolidated annual accounts | Parent company annual accounts | Other information
> Corporate governance
H.W. (Henk) Breukink (Born 1950, Dutch nationality, male; appointed in 2007, term expires in 2019)
Former position: managing director of F&C and country head for F&C Netherlands (asset
management firm).
Relevant positions pursuant to CRD IV Member of the Supervisory Board of ING Groep N.V./ING Bank N.V., non-executive director of Brink
Groep B.V. and executive director of Executive Development Dialogue B.V.
M. (Mariana) Gheorghe (Born 1956, Romanian nationality, female, appointed in 2015, term expires in 2019)
Former position: CEO of OMV Petrom SA.
Relevant positions pursuant to CRD IV Member of the Supervisory Board of ING Groep N.V./ING Bank N.V.
M. (Margarete) Haase (Born 1953, Austrian nationality, female; appointed in 2017, term expires in 2021)
Former position: CFO of Deutz AG.
Relevant positions pursuant to CRD IV Member of the Supervisory Board of ING Groep N.V./ING Bank N.V. (effective per 1 May 2018),
member of the Supervisory Board and chairwoman of the Audit Committee of Fraport AG, member
of the Supervisory Board and chairwoman of the Audit Committee of Osram Licht AG and member
of the Supervisory Board and chairwoman of the Audit Committee of Marquard & Bahls AG.
Other relevant ancillary positions Chairwoman of the Employers Association of Kölnmetall and member of the German Corporate
Governance Commission.
R.W.P. (Robert) Reibestein (Born 1956, Dutch nationality, male; appointed in 2012 as an observer, full member as of 2013,
term expires in 2021)
Former position: senior partner of McKinsey & Company.
Relevant positions pursuant to CRD IV Member of the Supervisory Board of ING Groep N.V./ING Bank N.V. and member of the Supervisory
Board of IMC B.V.
Other relevant ancillary position Member of the Supervisory Board of Stichting World Wildlife Fund (the Netherlands).
Changes in the composition Jeroen van der Veer resigned from the Supervisory Board. As chairman, he was succeeded by Hans
Wijers.
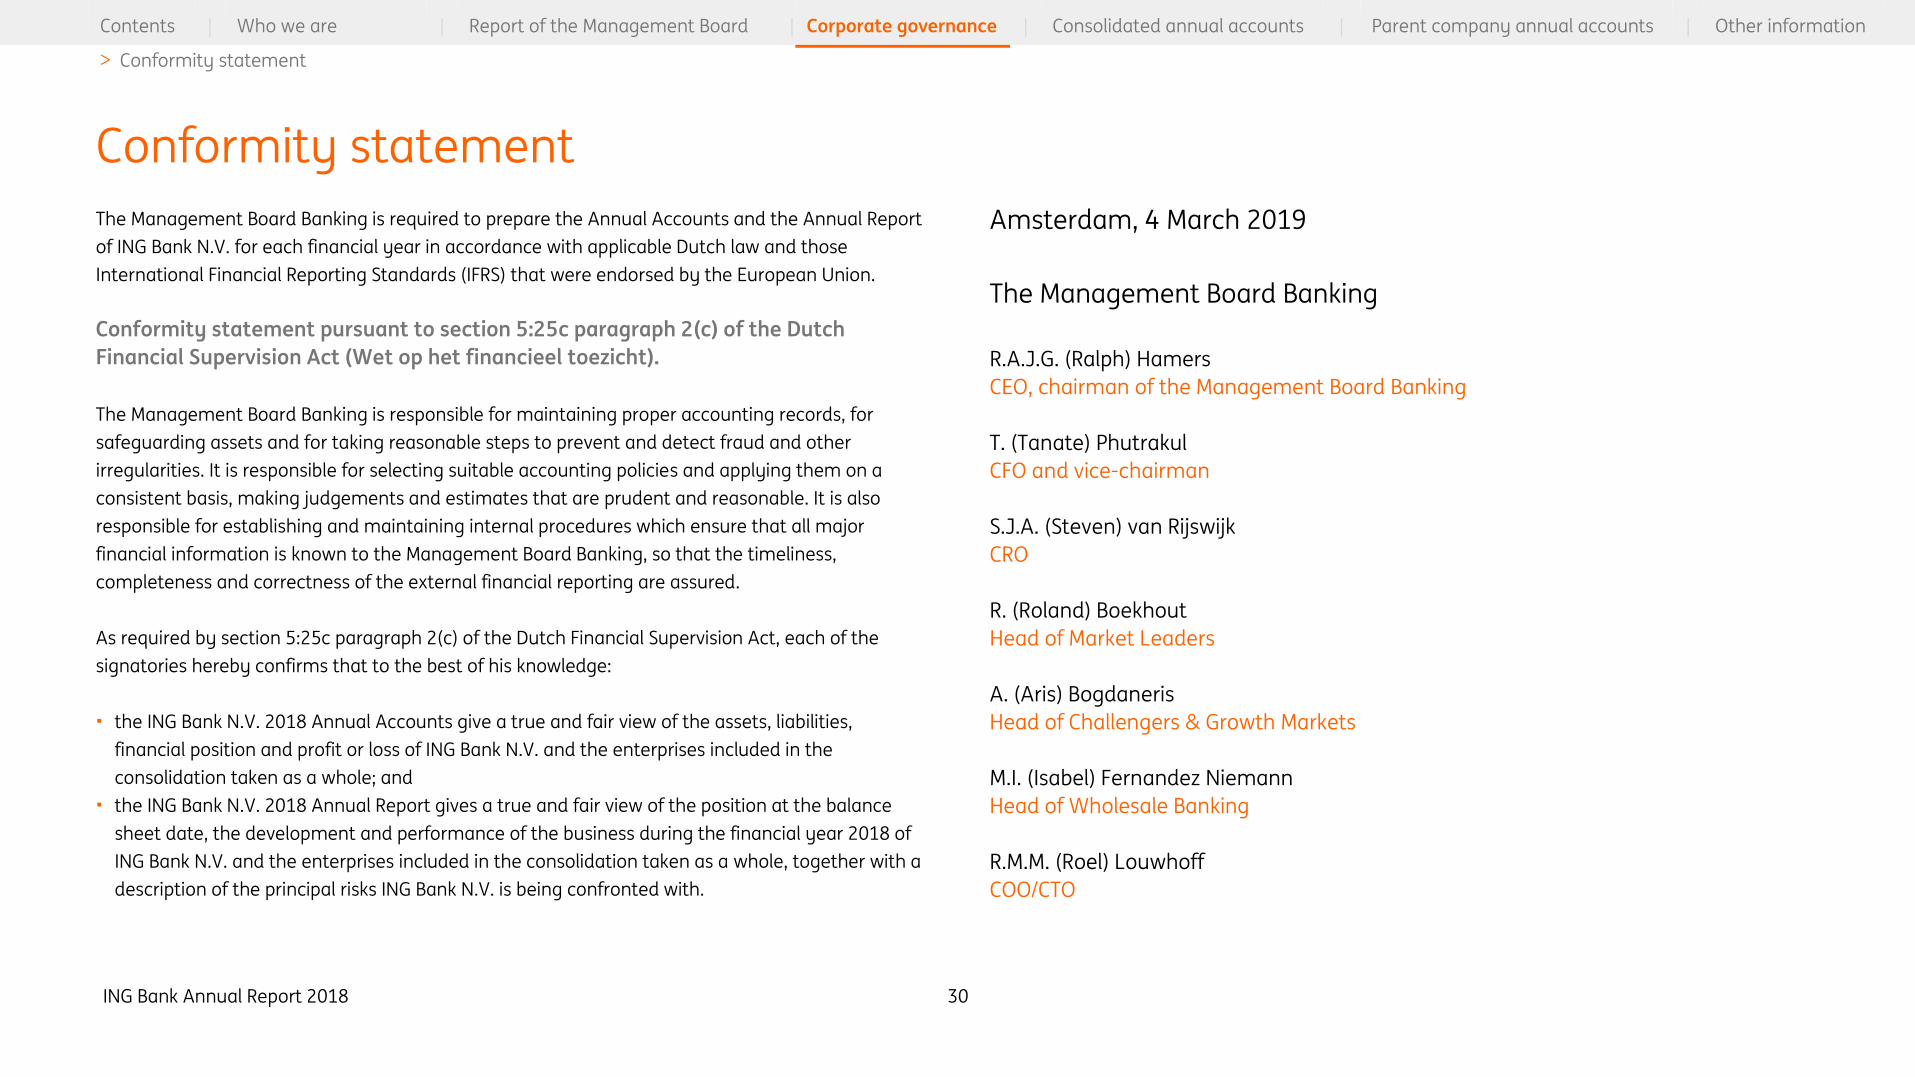
ING Bank Annual Report 2018 30
Contents | Who we are | Report of the Management Board | Corporate governance | Consolidated annual accounts | Parent company annual accounts | Other information
> Conformity statement
The Management Board Banking is required to prepare the Annual Accounts and the Annual Report
of ING Bank N.V. for each financial year in accordance with applicable Dutch law and those
International Financial Reporting Standards (IFRS) that were endorsed by the European Union.
Conformity statement pursuant to section 5:25c paragraph 2(c) of the Dutch
Financial Supervision Act (Wet op het financieel toezicht).
The Management Board Banking is responsible for maintaining proper accounting records, for
safeguarding assets and for taking reasonable steps to prevent and detect fraud and other
irregularities. It is responsible for selecting suitable accounting policies and applying them on a
consistent basis, making judgements and estimates that are prudent and reasonable. It is also
responsible for establishing and maintaining internal procedures which ensure that all major
financial information is known to the Management Board Banking, so that the timeliness,
completeness and correctness of the external financial reporting are assured.
As required by section 5:25c paragraph 2(c) of the Dutch Financial Supervision Act, each of the
signatories hereby confirms that to the best of his knowledge:
• the ING Bank N.V. 2018 Annual Accounts give a true and fair view of the assets, liabilities,
financial position and profit or loss of ING Bank N.V. and the enterprises included in the
consolidation taken as a whole; and
• the ING Bank N.V. 2018 Annual Report gives a true and fair view of the position at the balance
sheet date, the development and performance of the business during the financial year 2018 of
ING Bank N.V. and the enterprises included in the consolidation taken as a whole, together with a
description of the principal risks ING Bank N.V. is being confronted with.
Amsterdam, 4 March 2019
The Management Board Banking
R.A.J.G. (Ralph) Hamers
CEO, chairman of the Management Board Banking
T. (Tanate) Phutrakul
CFO and vice-chairman
S.J.A. (Steven) van Rijswijk
CRO
R. (Roland) Boekhout
Head of Market Leaders
A. (Aris) Bogdaneris
Head of Challengers & Growth Markets
M.I. (Isabel) Fernandez Niemann
Head of Wholesale Banking
R.M.M. (Roel) Louwhoff
COO/CTO
Conformity statement
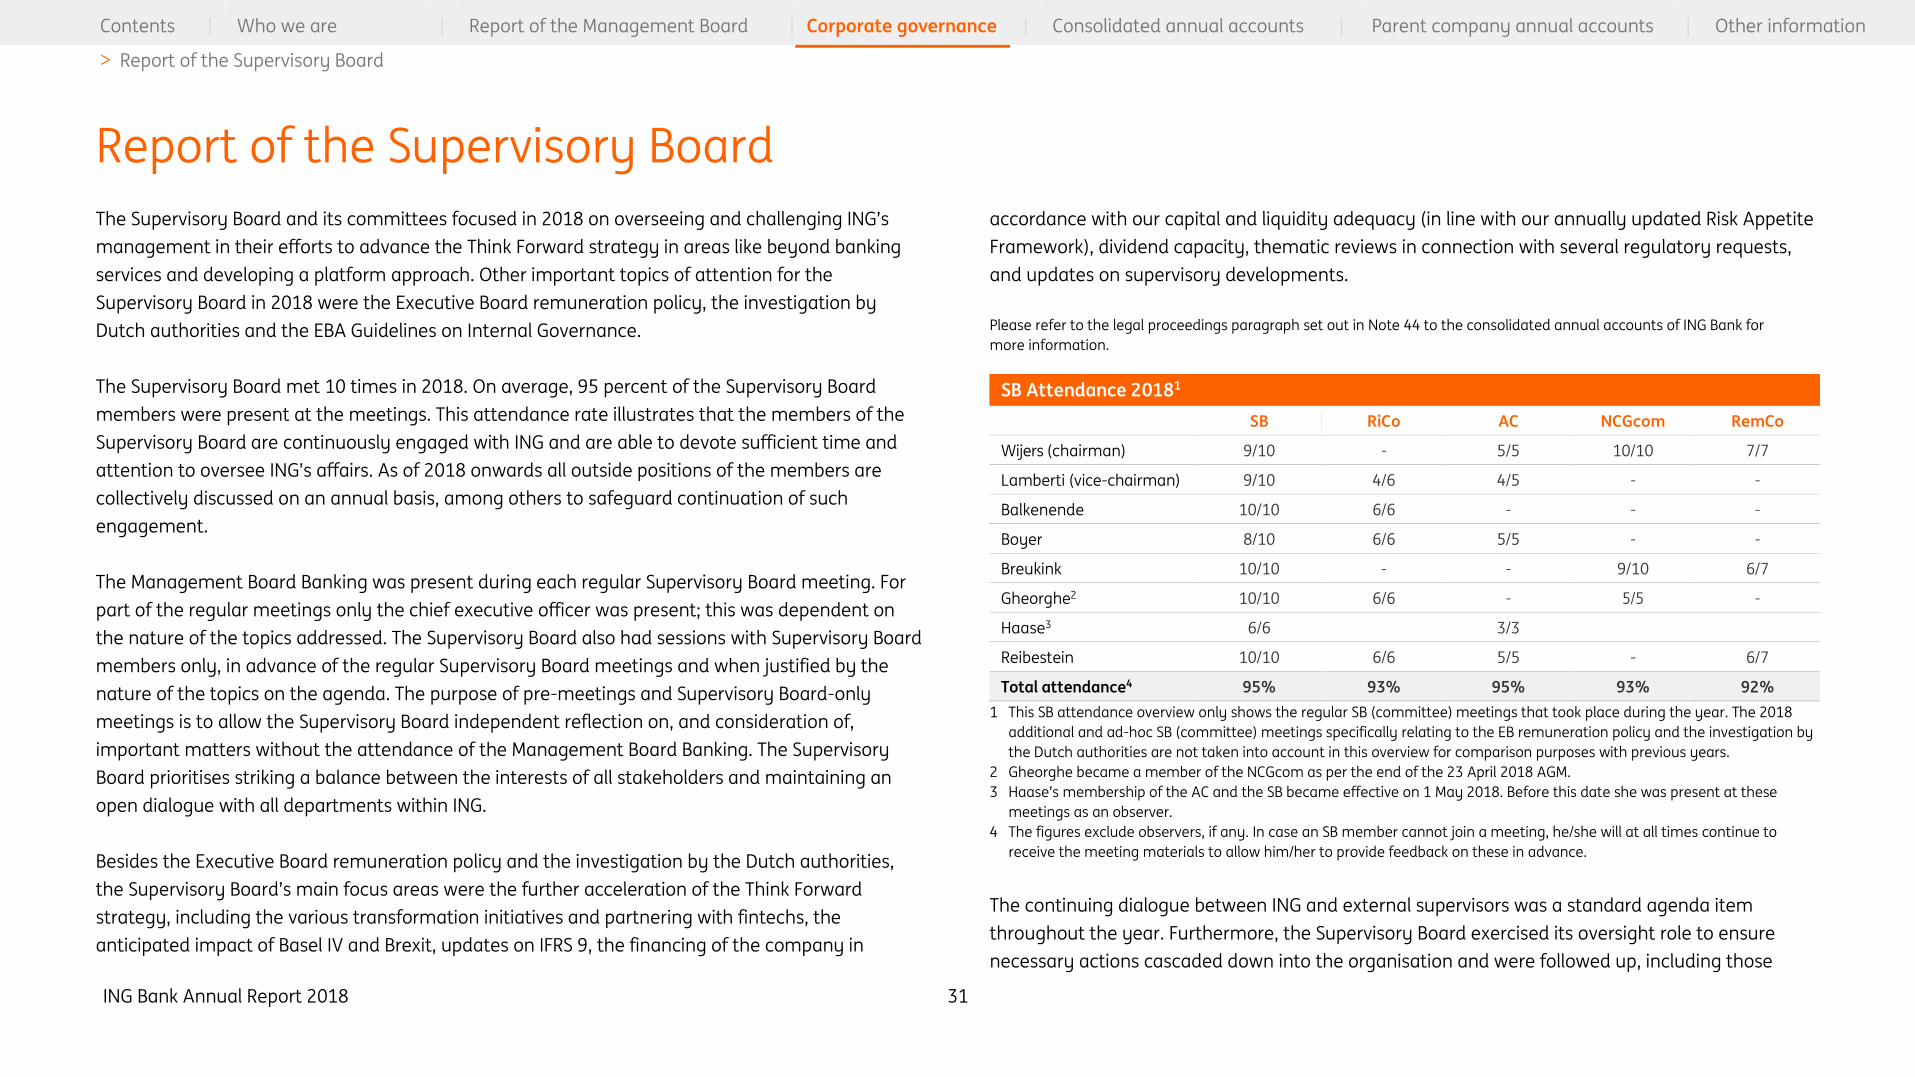
ING Bank Annual Report 2018 31
Contents | Who we are | Report of the Management Board | Corporate governance | Consolidated annual accounts | Parent company annual accounts | Other information
> Report of the Supervisory Board
The Supervisory Board and its committees focused in 2018 on overseeing and challenging ING’s
management in their efforts to advance the Think Forward strategy in areas like beyond banking
services and developing a platform approach. Other important topics of attention for the
Supervisory Board in 2018 were the Executive Board remuneration policy, the investigation by
Dutch authorities and the EBA Guidelines on Internal Governance.
The Supervisory Board met 10 times in 2018. On average, 95 percent of the Supervisory Board
members were present at the meetings. This attendance rate illustrates that the members of the
Supervisory Board are continuously engaged with ING and are able to devote sufficient time and
attention to oversee ING’s affairs. As of 2018 onwards all outside positions of the members are
collectively discussed on an annual basis, among others to safeguard continuation of such
engagement.
The Management Board Banking was present during each regular Supervisory Board meeting. For
part of the regular meetings only the chief executive officer was present; this was dependent on
the nature of the topics addressed. The Supervisory Board also had sessions with Supervisory Board
members only, in advance of the regular Supervisory Board meetings and when justified by the
nature of the topics on the agenda. The purpose of pre-meetings and Supervisory Board-only
meetings is to allow the Supervisory Board independent reflection on, and consideration of,
important matters without the attendance of the Management Board Banking. The Supervisory
Board prioritises striking a balance between the interests of all stakeholders and maintaining an
open dialogue with all departments within ING.
Besides the Executive Board remuneration policy and the investigation by the Dutch authorities,
the Supervisory Board’s main focus areas were the further acceleration of the Think Forward
strategy, including the various transformation initiatives and partnering with fintechs, the
anticipated impact of Basel IV and Brexit, updates on IFRS 9, the financing of the company in
accordance with our capital and liquidity adequacy (in line with our annually updated Risk Appetite
Framework), dividend capacity, thematic reviews in connection with several regulatory requests,
and updates on supervisory developments.
Please refer to the legal proceedings paragraph set out in Note 44 to the consolidated annual accounts of ING Bank for
more information.
SB Attendance 20181
SB Attendance SB RiCo AC NCGcom RemCo
Wijers (chairman) 9/10 - 5/5 10/10 7/7
Lamberti (vice-chairman) 9/10 4/6 4/5 - -
Balkenende 10/10 6/6 - - -
Boyer 8/10 6/6 5/5 - -
Breukink 10/10 - - 9/10 6/7
Gheorghe2 10/10 6/6 - 5/5 -
Haase3 6/6 3/3
Reibestein 10/10 6/6 5/5 - 6/7
Total attendance4 95% 93% 95% 93% 92%
1 This SB attendance overview only shows the regular SB (committee) meetings that took place during the year. The 2018
additional and ad-hoc SB (committee) meetings specifically relating to the EB remuneration policy and the investigation by
the Dutch authorities are not taken into account in this overview for comparison purposes with previous years.
2 Gheorghe became a member of the NCGcom as per the end of the 23 April 2018 AGM.
3 Haase’s membership of the AC and the SB became effective on 1 May 2018. Before this date she was present at these
meetings as an observer.
4 The figures exclude observers, if any. In case an SB member cannot join a meeting, he/she will at all times continue to
receive the meeting materials to allow him/her to provide feedback on these in advance.
The continuing dialogue between ING and external supervisors was a standard agenda item
throughout the year. Furthermore, the Supervisory Board exercised its oversight role to ensure
necessary actions cascaded down into the organisation and were followed up, including those
Report of the Supervisory Board
ING Bank Annual Report 2018 32
Contents | Who we are | Report of the Management Board | Corporate governance | Consolidated annual accounts | Parent company annual accounts | Other information
> Report of the Supervisory Board
related to culture and behaviour. Hans Wijers took over the chairman’s role from Jeroen van der
Veer in May 2018 after the 2018 Annual General Meeting. In this role he has had conversations with
various internal and external stakeholders, including employees, the Central Works Council and
government officials. In December 2018 he also participated in a governance roadshow with some
of our institutional investors.
CEO compensation
The Supervisory Board noted the reactions of various Dutch stakeholders following the proposal to
amend the Executive Board remuneration policy, as set out in the Annual Report 2017 and as
initially tabled for the 2018 Annual General Meeting, to bring the remuneration for the CEO position
closer to peers within the Euro Stoxx benchmark. In light of this, the Supervisory Board reconsidered
the proposal and decided not to put it up for a vote at the Annual General Meeting. The Supervisory
Board regrets the loss of trust and damage to ING’s reputation caused by this proposal. This was
discussed at length during the 2018 Annual General Meeting. The Supervisory Board evaluated the
decision-making process, supported by an ad hoc Supervisory Board committee. The Supervisory
Board is now performing an extensive review of ING’s remuneration policy. This comprehensive
review will be performed by the Supervisory Board in consultation with its advisory bodies with
significant emphasis on broad stakeholder engagement.
Settlement agreement
ING announced on 4 September 2018 that it had reached a settlement agreement with Dutch
authorities related to an investigation that found serious shortcomings in the execution of
customer due diligence and requirements related to fighting financial economic crime. In light of
the investigation the Supervisory Board, supported by external legal counsel and subject-matter
experts, had numerous internal ad hoc meetings and several meetings with external parties that
resulted in said agreement on 3 September 2018. As part of the process, the Supervisory Board also
performed a management assessment for the persons in scope covering the period 2010-2016
with subsequent necessary measures taken. Looking forward, the Supervisory Board, Executive
Board and Management Board Banking reconfirmed their commitment to comply with applicable
legal requirements and take the necessary actions to strengthen compliance risk management and
the culture of compliance throughout the organisation.
Appointment CFO
In addition, following the settlement and in consultation with the Supervisory Board, Koos
Timmermans stepped down from his position as CFO and member of the Executive Board and
Management Board Banking of ING. He was succeeded by Tanate Phutrakul, who was appointed as
CFO and member of the Management Board Banking effective 7 February 2019. The Supervisory
Board has nominated Tanate Phutrakul for appointment as a member of the Executive Board of ING
Group, subject to shareholder approval at the Annual General Meeting on 23 April 2019. The
appointments have been approved by the European Central Bank.
Permanent education and business visits
Permanent education and business visits are important for the members of the Supervisory Board
as part of their continuous learning aimed at maintaining their expertise at the required level and
expanding where necessary. They also help to keep up-to-date with and gain in-depth insight into
the global and local economic, financial and political landscape and to increase the Supervisory
Board’s understanding of and engagement with ING’s business operations and its stakeholders. The
annual Supervisory Board Knowledge Days, that took place on 10-12 January 2018 in Frankfurt and
that were combined with regular SB meetings, focused on gaining more insight into Germany’s
economy and financial landscape. There was also a ‘deep dive’ into the current business and
activities of ING in Germany, also covering our presence in Austria and the Czech Republic, and how
these relate and contribute to ING’s Think Forward strategy. As part of the annual business visit, the
Supervisory Board together with the Management Board Banking visited the offices of ING in Milan
and Madrid in September 2018. The visits allowed the SB to get a better understanding of local
business issues. There was also a special focus on Model Bank, the integrated banking platform
being designed to offer a consistent experience across multiple ING markets.
ING Bank Annual Report 2018 33
Contents | Who we are | Report of the Management Board | Corporate governance | Consolidated annual accounts | Parent company annual accounts | Other information
> Report of the Supervisory Board
Throughout the year, a number of other educational sessions on specific topics were organised for
and at the request of the Supervisory Board, including some covering regulatory requirements.
Topics included the 2018 EBA stress test, the bank’s changing competitive landscape and
partnering with fintechs, ING’s position on crypto currencies and tokens, pro-active balance sheet
management, risk modelling, the pricing process , data ethics/security, dilemma management, the
Organisational Health Index, ING’s global job evaluation framework, and performance management
and remuneration practices. These educational sessions and visits also provided opportunities for
Supervisory Board members to interact with senior management in speed-meet sessions. These
conversations contribute to better mutual understanding and alignment on what matters most to
ING, both for its employees and for the Supervisory Board. As in previous years, the Supervisory
Board will continue this practice.
Strategy based on long-term value creation
In 2018, ING continued to work on implementing its Think Forward strategy focused on long-term
value creation and based on our purpose to empower people to stay a step ahead in life and in
business.
In late 2016, ING announced the acceleration of the implementation of the strategy (accelerate
Think Forward), focusing on investing in our digital transformation, creating a scalable banking
platform and realising €900 million of gross costs savings by 2021. A global transformation
programme was approved to realise the acceleration of the strategy. The basic starting point of the
programme was ING’s value proposition, captured in multiple workstreams across the ING network.
Throughout 2018, the Supervisory Board discussed the progress of the strategy and its
transformation programme and, as part of this, had an active dialogue with the Management
Board Banking.
ING’s strategy, together with the transformation programme, includes an overarching view and a
number of initiatives to further improve the customer experience, earn primary customers, develop
analytics skills to understand our customers better, increase the pace of innovation to serve
changing customer needs, enhance efficiency, and think beyond traditional banking to develop
new services and business models whilst growing our lending capabilities. As part of this, platform
thinking was an important theme in 2018, with plans to become a go-to platform for customers’
financial needs, to participate on others’ platforms and to develop independent initiatives in
partnership with others. Other aspects of the accelerated strategy programme were discussed and
approved. Important drivers of the programme were addressed, such as the future of banking, the
journey of convergence, maintaining commercial momentum, how to fund and drive the
transformation and risk management. The Supervisory Board acknowledges it is important to take
into account the duty of care towards those stakeholders of the bank who may be impacted by the
transition.
Financial and risk reporting
The Management Board Banking has prepared the annual accounts and discussed these with the
Supervisory Board. The annual accounts will be submitted for adoption at the 2019 Annual General
Meeting as part of the 2018 Annual Report.
The quarterly results were discussed and approved in January, May, July/August and October 2018,
including the relevant press releases,. The full-year 2017 financial results were approved in March
2018. Also discussed were the Management Board Banking’s assessment of the adequacy and
effectiveness of the risk management and control. ING Bank paid € 2,517 million dividend to ING
Groep N.V.
The Supervisory Board approved the annual review of the risk appetite framework that reflects
recent changes in regulatory requirements. This included updates to the solvency risk appetite
statements (RAS), liquidity and funding RAS and concentration RAS. Per standard practice, the
Supervisory Board was informed in detail throughout the year of the potential financial and non-
financial risks for ING, including updates on Brexit, upcoming regulatory changes (such as Basel IV)
and political and economic developments in various countries and regions, and discussed how
these could best be mitigated.
ING Bank Annual Report 2018 34
Contents | Who we are | Report of the Management Board | Corporate governance | Consolidated annual accounts | Parent company annual accounts | Other information
> Report of the Supervisory Board
KPMG, in its role as ING’s external auditor, audited ING’s 2018 accounts and financial statements. As
part of the standard procedures, KPMG declared itself independent from ING, in compliance with
applicable rules and regulations. Based on the Audit Committee proposal, the Supervisory Board
approved the audit plans of the internal and external auditor, the latter including the scope and
materiality of the external audit. There has been a significant increase in regulatory reporting since
the start of ECB supervision. Reporting timelines have become shorter and the granularity of the
data being requested has increased. In addition, local requirements need to be met. ING aims to
safeguard data quality and all reporting processes so these remain up to standard.
Internal Supervisory Board meetings
During the internal meetings of the Supervisory Board in 2018 (with the CEO in attendance, except
when the annual self-evaluation of the Supervisory Board or matters concerning the CEO were
discussed), the Management Board Banking performance assessments were discussed and
approved. Furthermore the Management Board Banking annual targets were reviewed and
approved. The future composition of the Management Board Banking (including the appointment of
a new CFO), and the Supervisory Board, its committees and potential candidates were a recurring
topic of discussion in light of various developments. ING’s talent and succession planning were also
discussed, including the outcome of the Annual Talent Review. Remuneration was another
recurring agenda item. The Supervisory Board self-assessment was also on the agenda. Action
points from last year’s self-assessment were acted on during the year, covering: attention to the
future composition of the Supervisory Board, the aim to have fewer presentations and more
interactive discussions between the Supervisory Board and the Executive Board and Management
Board Banking, to balance the amount of pre-readings and time spent, to consider competitor
strategies and to develop a more balanced offering of deep dives/permanent education sessions.
As in previous years, the Supervisory Board conducted its annual self-assessment, facilitated by an
independent external party and with input from several executives who regularly interact with the
Supervisory Board and attend Supervisory Board meetings. In general, the performance of the
Supervisory Board and its committees was considered to be stable since previous year’s self-
assessment, acknowledging that the environment in which the Supervisory Board was operating
had become more challenging, among others with reference to the 2018 events in light of CEO
remuneration and the settlement.
Standard areas of attention of the Supervisory Board will be continued close monitoring and
assessment of the developments in the areas of non-financial risk, compliance and internal control,
as well as in the regulatory and external supervision landscape.
The Supervisory Board’s spearheads for 2019 will be to improve stakeholder management, focus on
the way forward by means of reinstating trust with customers and other stakeholders and pride
with employees to be part of ING, and achieving the right balance between the provision of
challenge/counterbalance and support to the Executive Board and the Management Board Banking
- particularly in the areas of compliance and performance management, with clear set priorities
and milestones.
Following the discussions on the self-assessment in February 2019, a number of suggestions were
made as key priorities for improving the performance of the Supervisory Board over the coming
year, such as continued interaction with stakeholders outside and senior management within the
organisation. With regard to the Supervisory Board’s meeting effectiveness focus will be on an
improved balance between presentation and discussion, in favour of the latter, supported by
document quality assurance and gathering feedback on meeting performance.
Audit Committee meetings
The Audit Committee met five times in 2018. On average, 95 percent of the members were present
at the scheduled meetings. The Audit Committee discussed the quarterly results, the interim
accounts and the annual accounts. Key audit matters, as included in the auditors’ reports were also
a topic of discussion.
In addition to financial results and accounts, the Audit Committee’s regular deliberations included
financial reporting, auditor’s independence and fees, the overall internal control environment, the
ING Bank Annual Report 2018 35
Contents | Who we are | Report of the Management Board | Corporate governance | Consolidated annual accounts | Parent company annual accounts | Other information
> Report of the Supervisory Board
internal controls over financial reporting, the internal and external auditor reports, review of the
internal audit function, and matters related to the financing of the company, including the
assessment of ING’s capital and liquidity position. The Audit Committee also reviewed the press
releases related to the periodic results, the Annual Report, and discussed and made
recommendations for the approval of the internal audit plan.
Specific attention was paid to a variety of other, related topics. These included IFRS-related
developments and their potential impact on our disclosures, legal proceedings, the remediation of
open-control deficiencies in areas including user access and change management and loan-loss
provisioning. Also addressed were non-financial risks relevant for the financial reporting, and the
results of the financial control enhancement programme. While the programme was completed,
the efforts to embed control more in the daily business continue to be part of ING’s business-as-
usual-activities. Also the settlement with the Dutch authorities, as well as the related information
request from US authorities, regarding various requirements related to client on-boarding, money
laundering and corrupt practices were discussed. The updated internal audit charter and the
quarterly whistleblower report were also areas of attention. The Audit Committee performed a
thorough assessment of the functioning of the external auditor and the scope and materiality of
the audit plan and the principal risks identified in the audit plan and made recommendations to the
Supervisory Board regarding the nomination of the external auditors for the years 2020-2023. All
relevant items discussed by the Audit Committee were reported to the Supervisory Board, with the
Supervisory Board approving those items as required from a governance perspective. Directly
following the Audit Committee meetings, the members of the Audit Committee met with the
internal and external auditors to seek confirmation that all relevant topics were discussed in the
Audit Committee meetings. To properly prepare for the regular Audit Committee meetings, the
chairman of the Audit Committee held separate sessions with the external auditor, the head of the
internal audit department, with the CFO and with the Group Controller. He also met with various
senior managers.
Risk Committee meetings
The Risk Committee met six times in 2018, compared with five times last year. On average, 93
percent of the members were present at the scheduled meetings. As with the meetings of the
other committees, all relevant items discussed by the Risk Committee were reported to the
Supervisory Board, with the Supervisory Board approving those items as required from a
governance perspective. In each quarterly Risk Committee meeting both the financial and non-
financial risk reports were discussed, including the status of ING’s metrics with regard to solvency
risk, liquidity and funding risk, credit risk, country risk, market risk, non-financial risk and
compliance risk. Stress-testing scenarios, including the impact of the 2018 EBA EU-wide stress test,
were also discussed. Also the review of the Risk function was discussed. Furthermore, in 2018 the
Risk Committee spent considerable time on discussing financial and non-financial risk, compliance
risk, money laundering risk, including updates of the bank-wide Know Your Customer enhancement
programme, and IT risk within risk appetite, GDPR/GDPP and MiFID II. The Risk Committee also spent
considerable time, before the instalment of a special committee on the matter, on the investigation
by the Dutch authorities, as well as the related information request from US authorities, regarding
various requirements related to client on-boarding, money laundering and corrupt practices.
Furthermore, the Risk Committee’s feedback is also taken into account in discussions regarding
remuneration policies – for examples as part of the Variable Remuneration Accrual Model, that was
recently introduced.
While transforming its organisation, ING needs to ensure that integrity continues to come first and
that critical non-financial risk areas stay top of mind, because this is an integral part of who we are.
We need to build up strong foundations with structural solutions that continue to earn the trust of
our clients and society at large.
A wide range of other topics were discussed, such as the annual review of the Risk Appetite
Framework. As in 2017, the Risk committee held an additional meeting to allow it to deal with an
increased number of high priority issues. During this extra meeting in 2018, the Risk Committee
ING Bank Annual Report 2018 36
Contents | Who we are | Report of the Management Board | Corporate governance | Consolidated annual accounts | Parent company annual accounts | Other information
> Report of the Supervisory Board
discussed several non-financial risk and compliance risk topics, including the know your customer
policy and the implications for ING of the political and economic situation in Turkey.
Read more in the ‘Risk Management’ and ‘Capital Management’ note in the Annual Accounts.
Nomination and Corporate Governance Committee meetings
The Nomination and Corporate Governance Committee met 10 times in 2018. On average, 93
percent of the members were present at the scheduled meetings. The Nomination and Corporate
Governance Committee discussed future succession planning for the Executive Board and the
Management Board Banking, as well as the future composition of the Supervisory Board. Various
diversity-related aspects were taken into account, such as the minimum and optimal size of a
Supervisory Board and how to arrive at an appropriate balance in its representation of regions, age,
gender, and financial and generalist expertise. In order to meet the requirements of various
stakeholders a diversity and competence matrix was further developed and published for the
members of the Management Board Banking and Supervisory Board to show how these various
elements are represented in the composition of these boards (see page 38).
Several potential (internal talents) were identified who have potential to assume more senior roles
in the organisation in the future, taking ING’s diversity policy (as published on www.ing.com) into
account. With regard to the Supervisory Board, the Nomination and Corporate Governance
Committee continued its search for suitable successors so as to maintain a balanced Supervisory
Board composition, following the early resignation of Ann Sherry as Supervisory Board member in
2017 and with Henk Breukink’s final term ending in 2019. Finding suitable candidates remains
challenging, as numerous requirements must be met to enhance the composition of the
Supervisory Board including regulatory requirements, diversity, banking and other industry
knowledge, outside positions, independence, no conflicts of interest, availability, etc.
The Nomination and Corporate Governance Committee has initiated a continuing conversation on
Management Board Banking succession planning as part of its regular meetings by means of deep
dives per function and business line. Focus areas included improving diversity at the higher
management levels, senior management succession planning and accelerating refreshment.
Attention was also paid specifically to regrettable losses among senior managers who left ING in
2018 for various reasons.
New this year were periodic conversations that took place outside regular meetings to consider
talented ING employees with the potential of taking on more senior and complex roles over time.
The approach and progress were shared with the Supervisory Board.
Special attention was paid to performance management and how to enhance the process and its
effectiveness by fostering ‘continuous conversation’ between managers and employees
throughout the year. In 2018, the committee discussed the agenda for the 2018 Annual General
Meeting and the proposed topics for the 2019 Annual General Meeting, including the publication of
the booklet on the application of the Dutch Corporate Governance Code and Dutch Banking Code.
During the year, the committee also discussed the (implementation of the) EBA Guidelines on
Internal Governance, including the required updates to the corporate board charters for ING in
relation to these guidelines.
Remuneration Committee meetings
In 2018, the Remuneration Committee met seven times. On average, 92 percent of the members
were present at the scheduled meetings. The Remuneration Committee, where necessary with
input and advice from the Risk Committee following strengthened risk management governance,
reviewed the thresholds above which the pool for variable remuneration may be used for actually
granting variable remuneration. It discussed the variable remuneration pool and reviewed the
performance assessment for the Executive Board and Management Board Banking, as well as the
variable remuneration proposals. Also the Executive Board remuneration policy and CEO
remuneration were discussed, including the follow-up actions resulting from the Supervisory
Board’s evaluation of the decision-making process after the item was withdrawn from the 2018
Annual General Meeting agenda. The remuneration proposals for Identified Staff were also
ING Bank Annual Report 2018 37
Contents | Who we are | Report of the Management Board | Corporate governance | Consolidated annual accounts | Parent company annual accounts | Other information
> Report of the Supervisory Board
reviewed, including potential cases for holdback of deferred compensation by way of malus. With
regard to the investigation by the Dutch authorities, a special ad-hoc committee of the Supervisory
Board was charged with the accompanying management assessment and its subsequent proposed
measures, including those encompassing impact on remuneration. In addition, the proposed
annual targets for the Executive Board and the Management Board Banking members were
discussed. The ING Bank Remuneration Regulations Framework was updated as part of an annual
review. This included the introduction of the Variable Remuneration Accrual Model. Throughout the
year the Remuneration Committee approved Identified Staff/High Earner-related remuneration
matters, based on ING’s accompanying governance framework.
Composition of the Management Board Banking and
Supervisory Board
At the Annual General Meeting on 23 April 2018, Eric Boyer de la Giroday was reappointed as
Supervisory Board member. Furthermore, Jeroen van der Veer stepped down as Supervisory Board
member as per the end of the 2018 Annual General Meeting following which Hans Wijers
succeeded him as chairman. Margarete Haase’s membership of the Supervisory Board became
effective as per 1 May 2018, following the period from 1 October 2017 during which she was
present as an observer at the meetings of the Audit Committee, Supervisory Board and Internal
Supervisory Board. Read more in the ‘Corporate governance’ chapter on the composition of the
Supervisory Board committees at year-end 2018.The Nomination and Corporate Governance
Committee and the Supervisory Board will continue to strive for an adequate and balanced
composition of the Supervisory Board when selecting and nominating new members for
appointment, taking into account ING’s diversity policy and other factors.
The members of the Supervisory Board are requested to assess annually whether or not they are
independent as set out in the Corporate Governance Code and to confirm this in writing. On the
basis of these criteria, all members of the Supervisory Board, with the exception of Eric Boyer de la
Giroday, are to be regarded as independent on 31 December 2018. Eric Boyer de la Giroday is
considered not independent because of his position as chairman of the Board of Directors of ING
Belgium S.A./N.V. and his former positions as member of the Executive Board of ING Groep N.V. and
vice-chairman of the Management Board Banking of ING Bank N.V. On the basis of the NYSE listing
standards, all members of the Supervisory Board are to be regarded as independent.
Furthermore, as mentioned earlier, on 7 February 2019 Tanate Phutrakul was appointed as CFO and
member of the Management Board Banking, succeeding Koos Timmermans. The appointments
have been approved by the European Central Bank.
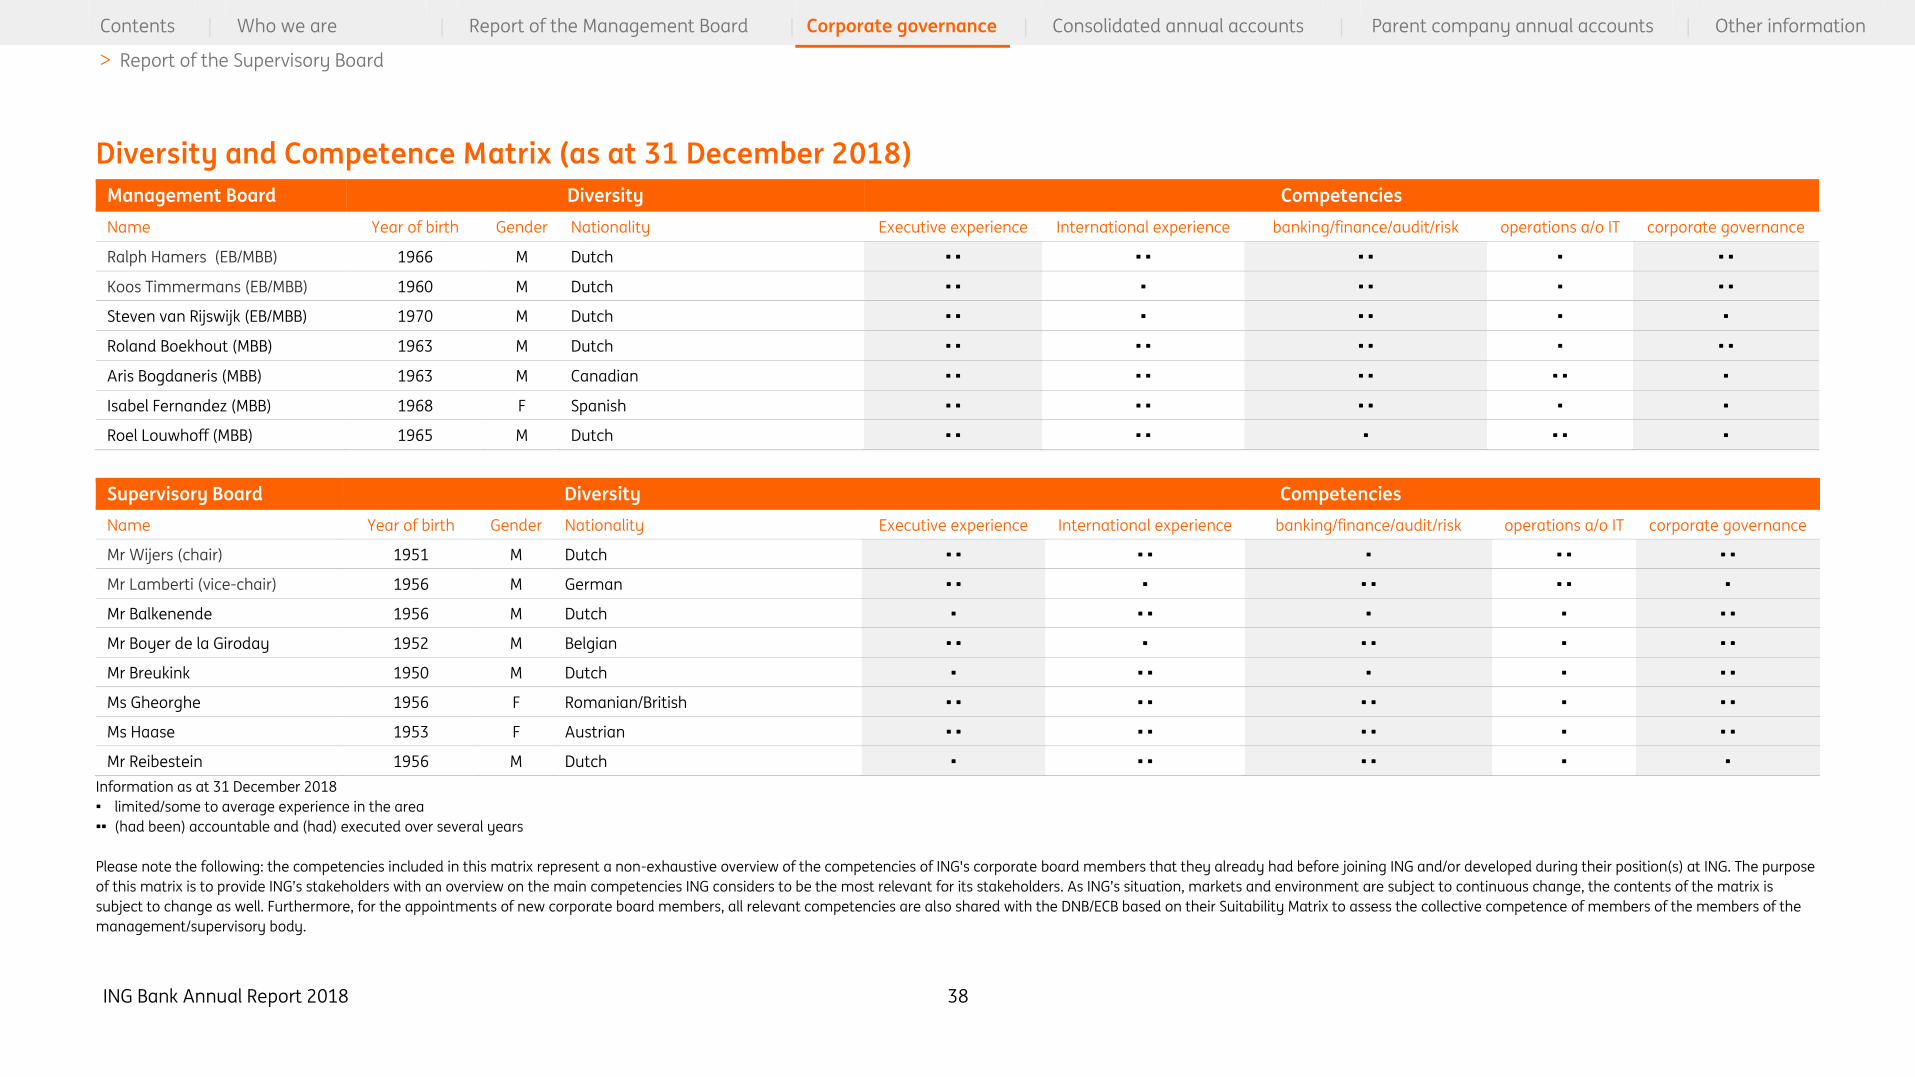
ING Bank Annual Report 2018 38
Contents | Who we are | Report of the Management Board | Corporate governance | Consolidated annual accounts | Parent company annual accounts | Other information
> Report of the Supervisory Board
Diversity and Competence Matrix (as at 31 December 2018)
Management Board Diversity Competencies
Name Year of birth Gender Nationality Executive experience International experience banking/finance/audit/risk operations a/o IT corporate governance
Ralph Hamers (EB/MBB) 1966 M Dutch • • • • • • • • •
Koos Timmermans (EB/MBB) 1960 M Dutch • • • • • • • •
Steven van Rijswijk (EB/MBB) 1970 M Dutch • • • • • • •
Roland Boekhout (MBB) 1963 M Dutch • • • • • • • • •
Aris Bogdaneris (MBB) 1963 M Canadian • • • • • • • • •
Isabel Fernandez (MBB) 1968 F Spanish • • • • • • • •
Roel Louwhoff (MBB) 1965 M Dutch • • • • • • • •
Supervisory Board Diversity Competencies
Name Year of birth Gender Nationality Executive experience International experience banking/finance/audit/risk operations a/o IT corporate governance
Mr Wijers (chair) 1951 M Dutch • • • • • • • • •
Mr Lamberti (vice-chair) 1956 M German • • • • • • • •
Mr Balkenende 1956 M Dutch • • • • • • •
Mr Boyer de la Giroday 1952 M Belgian • • • • • • • •
Mr Breukink 1950 M Dutch • • • • • • •
Ms Gheorghe 1956 F Romanian/British • • • • • • • • •
Ms Haase 1953 F Austrian • • • • • • • • •
Mr Reibestein 1956 M Dutch • • • • • • •
Information as at 31 December 2018
• limited/some to average experience in the area
•• (had been) accountable and (had) executed over several years
Please note the following: the competencies included in this matrix represent a non-exhaustive overview of the competencies of ING's corporate board members that they already had before joining ING and/or developed during their position(s) at ING. The purpose
of this matrix is to provide ING’s stakeholders with an overview on the main competencies ING considers to be the most relevant for its stakeholders. As ING’s situation, markets and environment are subject to continuous change, the contents of the matrix is
subject to change as well. Furthermore, for the appointments of new corporate board members, all relevant competencies are also shared with the DNB/ECB based on their Suitability Matrix to assess the collective competence of members of the members of the
management/supervisory body.
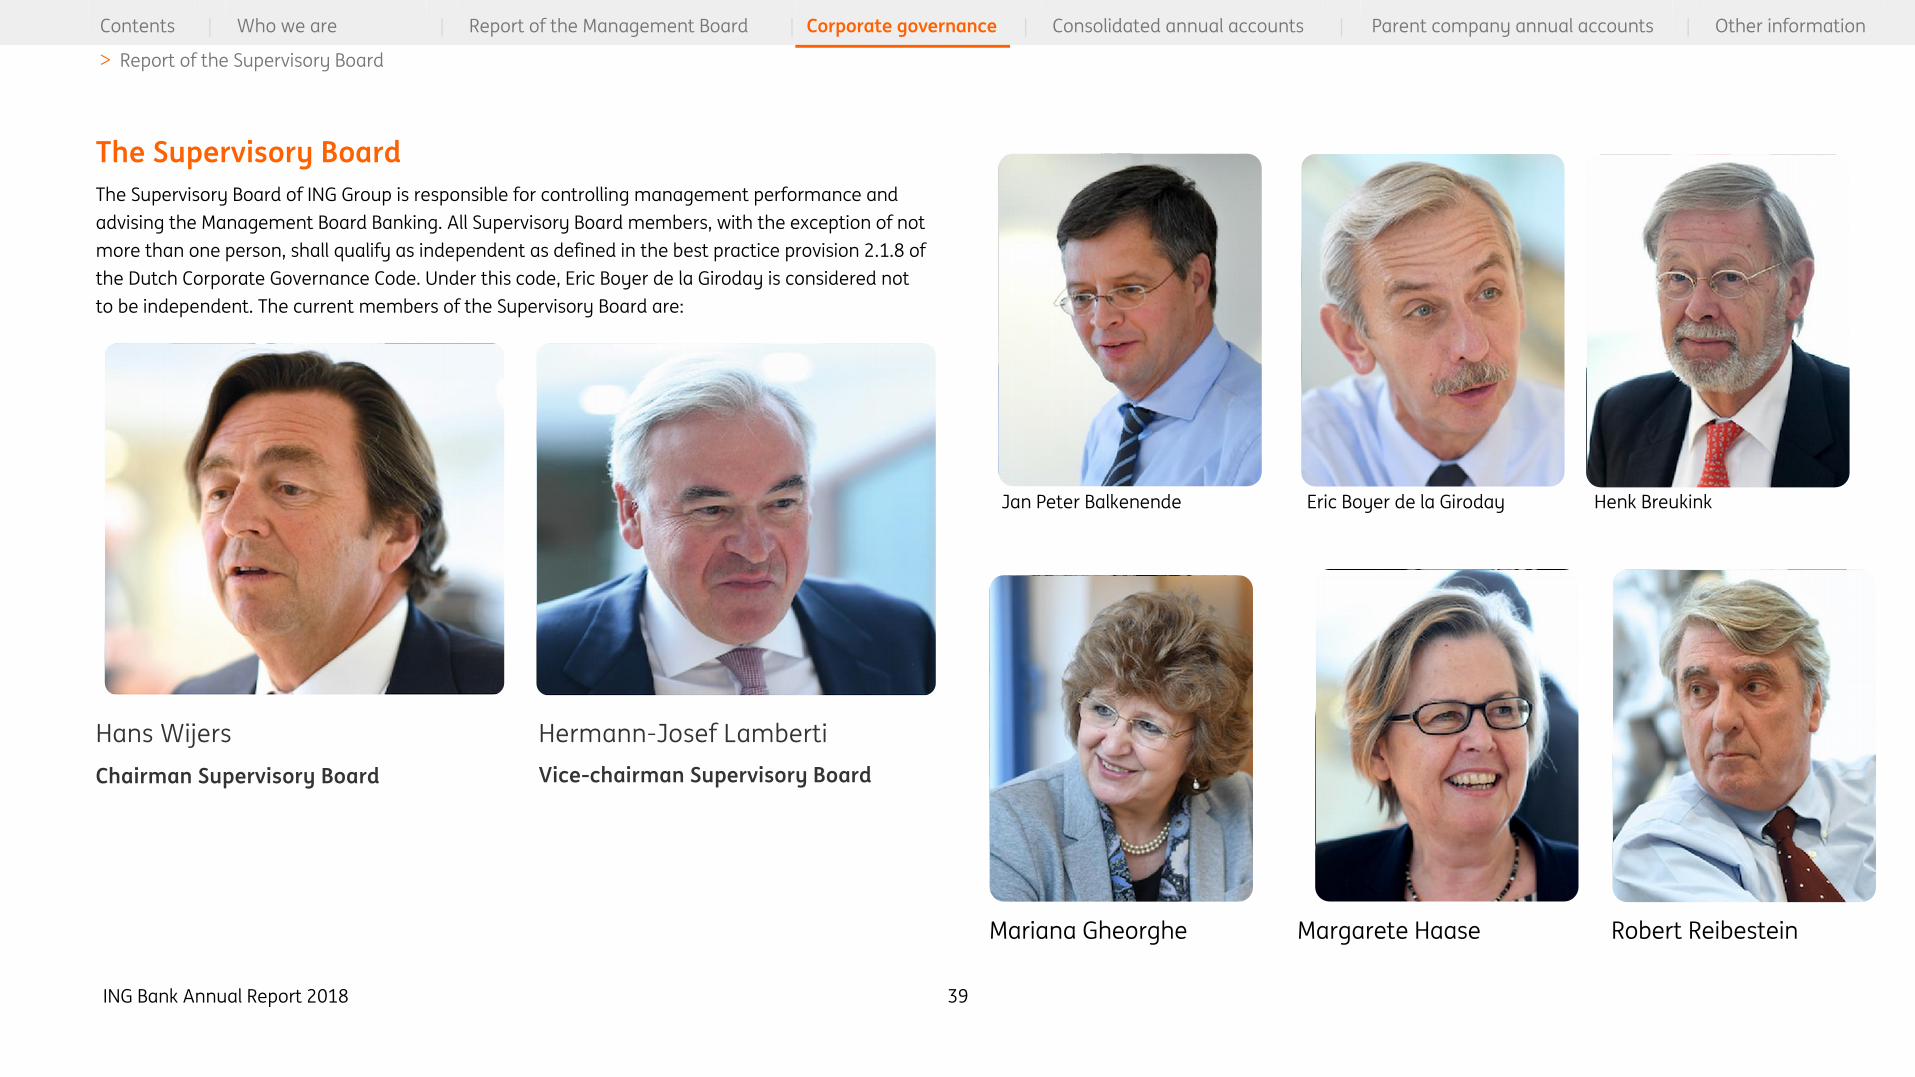
ING Bank Annual Report 2018 39
Contents | Who we are | Report of the Management Board | Corporate governance | Consolidated annual accounts | Parent company annual accounts | Other information
> Report of the Supervisory Board
The Supervisory Board
The Supervisory Board of ING Group is responsible for controlling management performance and
advising the Management Board Banking. All Supervisory Board members, with the exception of not
more than one person, shall qualify as independent as defined in the best practice provision 2.1.8 of
the Dutch Corporate Governance Code. Under this code, Eric Boyer de la Giroday is considered not
to be independent. The current members of the Supervisory Board are:
Hans Wijers
Chairman Supervisory Board
Hermann-Josef Lamberti
Vice-chairman Supervisory Boardti
Jan Peter Balkenende Eric Boyer de la Giroday Henk Breukink
Mariana Gheorghe Margarete Haase Robert Reibestein

ING Bank Annual Report 2018 40
Contents | Who we are | Report of the Management Board | Corporate governance | Consolidated annual accounts | Parent company annual accounts | Other information
> Report of the Supervisory Board
Appreciation for the Management Board Banking and ING
employees
The Supervisory Board would like to thank the members of the Management Board Banking for
their hard work in 2018. Important milestones were the steps taken towards creating a globally
scalable digital platform for customers and further digitalising our offering. The Supervisory Board
would also like to thank all ING employees for their contribution in realising these achievements
and for continuing to serve the interests of customers, shareholders and other stakeholders of ING.
The Supervisory Board is fully aware that ING is going through a challenging period and would
therefore also like to thank everyone for their efforts to regain the trust of our customers and other
stakeholders.
Additional information More information can be found in the ‘Corporate governance’
chapter, which is deemed to be incorporated by reference here.
Amsterdam, 4 March 2019
The Supervisory Board

ING Bank Annual Report 2018 41
Consolidated Annual Accounts
Consolidated statement of financial position 43
Consolidated statement of profit or loss 44
Consolidated statement of comprehensive income 45
Consolidated statement of changes in equity 46
Consolidated statement of cash flows
48
Notes to the consolidated annual accounts
1 Accounting policies 50
Notes to the Consolidated Statement of financial position
2 Cash and balances with central banks 84
3 Loans and advances to banks 84
4 Financial assets at fair value through profit or loss 85
5 Financial assets at fair value through other comprehensive income 87
6 Securities at amortised cost 88
7 Loans and advances to customers 89
8 Investments in associates and joint ventures 91
9 Property and equipment 92
10 Intangible assets 94
11 Other assets 95
12 Assets and liabilities held for sale 96
13 Deposits from banks 96
14 Customer deposits 96
15 Financial liabilities at fair value through profit or loss 97
16 Provisions 98
17 Other liabilities 99
18 Debt securities in issue 99
19 Subordinated loans 100
20 Equity 101
Notes to the Consolidated statement of profit or loss
21 Net interest income 104
22 Net fee and commission income 105
23 Valuation results and net trading income 106
24 Investment income 107
25 Result of disposal of group companies 108
26 Other income 108
27 Staff expenses 108
28 Other operating expenses 111
Notes to the Consolidated statement of cash flows
29 Net cash flow from operating activities 112
30 Changes in liabilities arising from financing activities 113
31 Cash and cash equivalents 113
Contents
ING Bank Annual Report 2018 42
Segment reporting
32 Segments 114
33 Information on geographical areas 118
Additional notes to the Consolidated annual accounts
34 Pension and other post-employment benefits 120
35 Taxation 124
36 Fair value of assets and liabilities 127
37 Derivatives and hedge accounting 144
38 Assets by contractual maturity 152
39 Liabilities by maturity 154
40 Assets not freely disposable 156
41 Transfer of financial assets 156
42 Offsetting financial assets and liabilities 157
43 Contingent liabilities and commitments 162
44 Legal proceedings 163
45 Consolidated companies and businesses acquired and divested 166
46 Principal subsidiaries, investments in associates and joint ventures 168
47 Structured entities 169
48 Related parties 171
49 Subsequent events 174
50 Risk management 175
51 Capital management 254
Parent company annual accounts
Parent company statement of financial position 259
Parent company statement of profit or loss 260
Parent company statement of changes in equity 261
Notes to the parent company annual accounts 263
Other information
Independent auditor’s report 279
Articles of Association – Appropriation of results 287
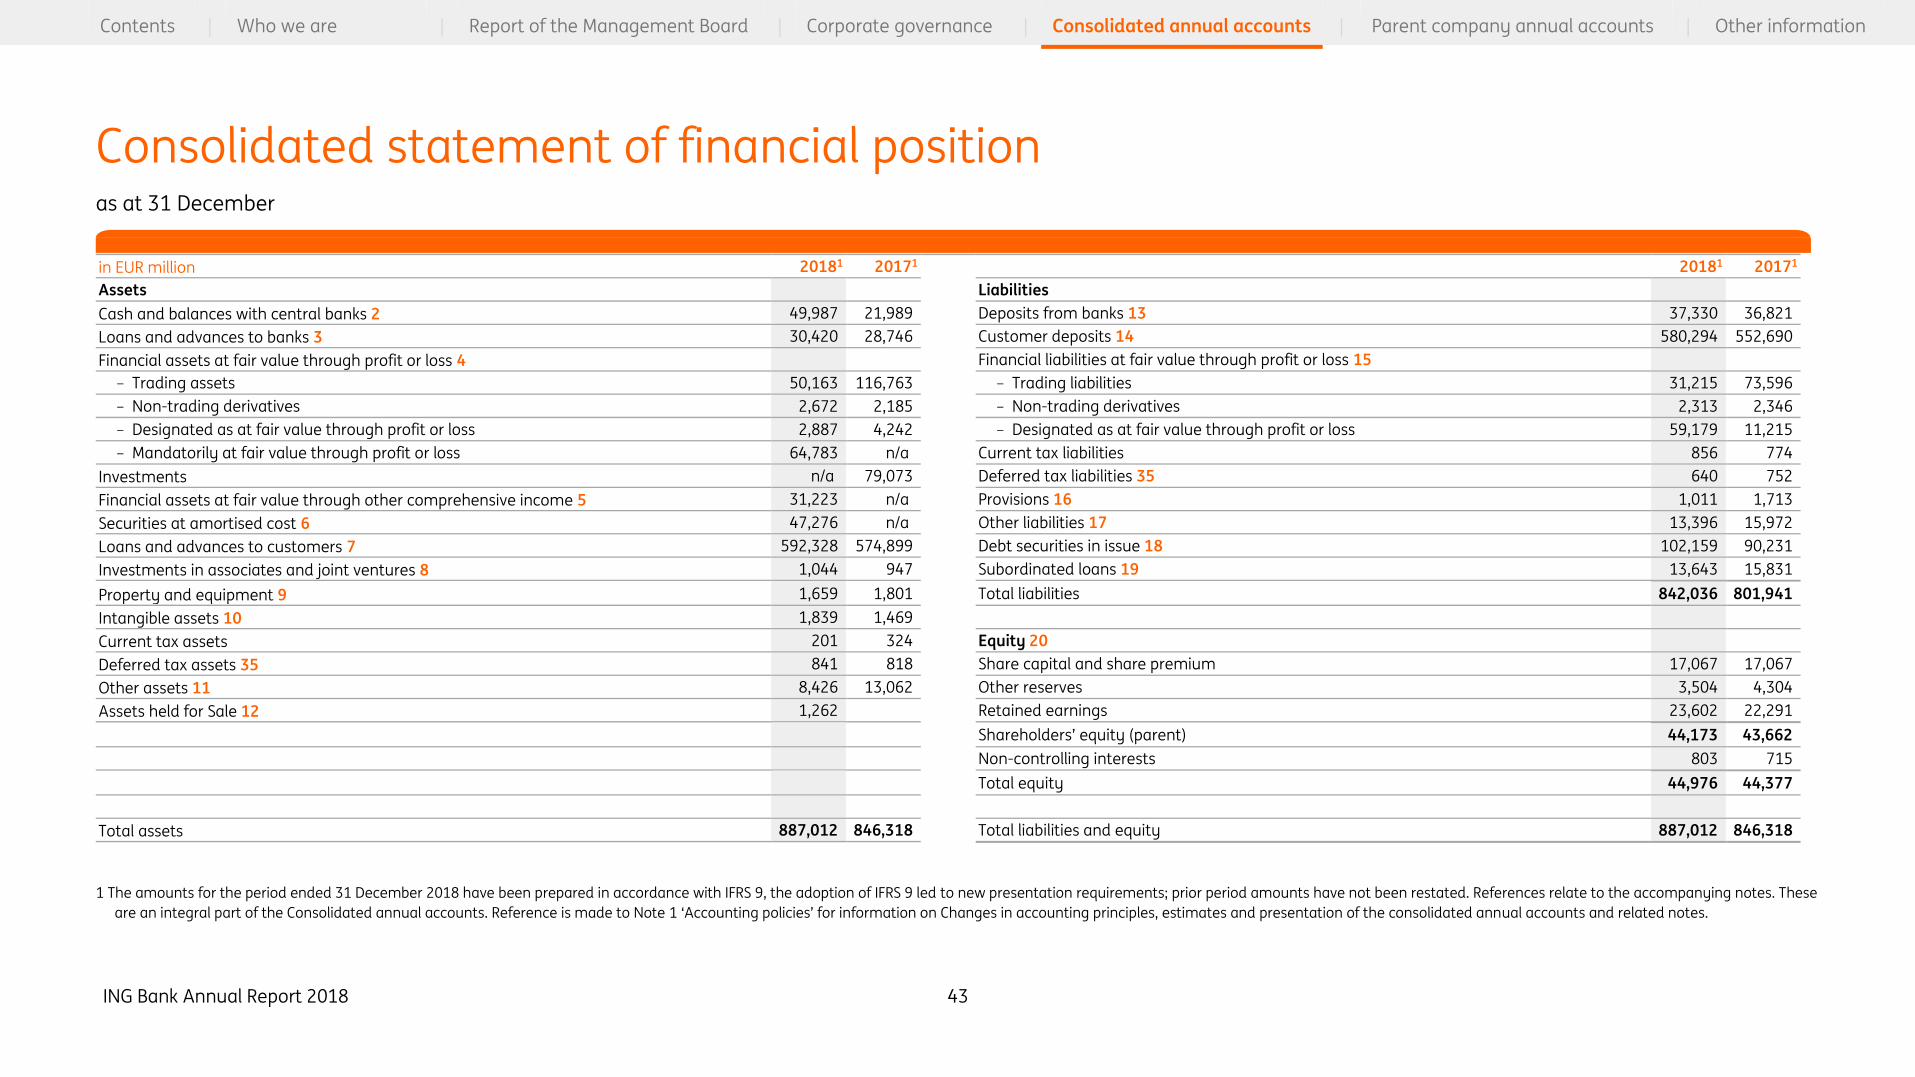
ING Bank Annual Report 2018 43
Contents | Who we are | Report of the Management Board | Corporate governance | Consolidated annual accounts | Parent company annual accounts | Other information
in EUR million 20181 20171 20181 20171
Assets Liabilities
Cash and balances with central banks 2 49,987 21,989 Deposits from banks 13 37,330 36,821
Loans and advances to banks 3 30,420 28,746 Customer deposits 14 580,294 552,690
Financial assets at fair value through profit or loss 4 Financial liabilities at fair value through profit or loss 15
– Trading assets 50,163 116,763 – Trading liabilities 31,215 73,596
– Non-trading derivatives 2,672 2,185 – Non-trading derivatives 2,313 2,346
– Designated as at fair value through profit or loss 2,887 4,242 – Designated as at fair value through profit or loss 59,179 11,215
– Mandatorily at fair value through profit or loss 64,783 n/a Current tax liabilities 856 774
Investments n/a 79,073 Deferred tax liabilities 35 640 752
Financial assets at fair value through other comprehensive income 5 31,223 n/a Provisions 16 1,011 1,713
Securities at amortised cost 6 47,276 n/a Other liabilities 17 13,396 15,972
Loans and advances to customers 7 592,328 574,899 Debt securities in issue 18 102,159 90,231
Investments in associates and joint ventures 8 1,044 947 Subordinated loans 19 13,643 15,831
Property and equipment 9 1,659 1,801 Total liabilities 842,036 801,941
Intangible assets 10 1,839 1,469
Current tax assets 201 324 Equity 20
Deferred tax assets 35 841 818 Share capital and share premium 17,067 17,067
Other assets 11 8,426 13,062 Other reserves 3,504 4,304
Assets held for Sale 12 1,262 Retained earnings 23,602 22,291
Shareholders’ equity (parent) 44,173 43,662
Non-controlling interests 803 715
Total equity 44,976 44,377
Total assets 887,012 846,318 Total liabilities and equity 887,012 846,318
1 The amounts for the period ended 31 December 2018 have been prepared in accordance with IFRS 9, the adoption of IFRS 9 led to new presentation requirements; prior period amounts have not been restated. References relate to the accompanying notes. These
are an integral part of the Consolidated annual accounts. Reference is made to Note 1 ‘Accounting policies’ for information on Changes in accounting principles, estimates and presentation of the consolidated annual accounts and related notes.
Consolidated statement of financial position as at 31 December

ING Bank Annual Report 2018 44
Contents | Who we are | Report of the Management Board | Corporate governance | Consolidated annual accounts | Parent company annual accounts | Other information
in EUR million 20181 20171 20161 20181 20171 20161
Interest income using effective interest rate method 25,288 n/a n/a Addition to loan loss provisions 7 656 676 974
Other interest income 2,504 n/a n/a Staff expenses 27 5,430 5,198 5,036
Total interest income 27,792 43,988 44,221 Other operating expenses 28 5,265 4,598 5,567
Total expenses 11,351 10,472 11,577
Interest expense using effective interest rate method –11,222 n/a n/a
Other interest expense –2,620 n/a n/a Result before tax 6,751 7,404 5,937
Total interest expense –13,842 –30,206 –30,904
Taxation 35 2,036 2,303 1,635
Net interest income 21 13,949 13,782 13,317 Net result (before non-controlling interest) 4,715 5,101 4,302
Fee and commission income 4,240 3,864 3,581 Net result attributable to Non-controlling interests 108 82 75
Fee and commission expense –1,437 –1,150 –1,148 Net result attributable to shareholder of the parent 4,607 5,019 4,227
Net fee and commission income 22 2,803 2,714 2,433
Dividend per ordinary share (in euros) 5.41 6.83 2.89
Valuation results and net trading income 23 1,031 672 1,093 Total amount of dividend paid (in million euros) 2,517 3,176 1,345
Investment income 24 183 192 421 1 The amounts for the period ended 31 December 2018 have been prepared in accordance with IFRS 9, the adoption of IFRS 9
led to new presentation requirements; prior period amounts have not been restated. Share of result from associates and joint ventures 8 124 166 77
Result on disposal of group companies 25 –123 1 1
Other income 26 136 349 172
Total income 18,102 17,876 17,514
References relate to the accompanying notes. These are an integral part of the Consolidated
annual accounts.
Reference is made to Note 1 ‘Accounting policies’ for information in Changes in accounting
principles, estimates and presentation of the Consolidated annual accounts and related notes.
Consolidated statement of profit or loss for the years ended 31 December

ING Bank Annual Report 2018 45
Contents | Who we are | Report of the Management Board | Corporate governance | Consolidated annual accounts | Parent company annual accounts | Other information
in EUR million 20181 20171 20161
Net result (before non-controlling interests) 4,715 5,101 4,302
Other comprehensive income
Items that will not be reclassified to the statement of profit or loss:
Realised and unrealised revaluations property in own use 1 26 2
Remeasurement of the net defined benefit asset/liability 34 6 –29 –65
Net change in fair value of equity instruments at FVOCI –461 n/a n/a
Change in fair value of own credit risk of financial liabilities at FVPL 198 n/a n/a
Items that may subsequently be reclassified to the statement of profit or loss:
Unrealised revaluations AFS investments and other revaluations n/a –284 189
Realised gains/losses on AFS investments reclassified to the statement of profit or
loss n/a –92 –272
Net change in fair value of debt instruments at FVOCI –163 n/a n/a
Realised gains/losses on debt instruments at FVOCI reclassified to the statement of
profit or loss –55 n/a n/a
Changes in cash flow hedge reserve 382 –526 68
Exchange rate differences –402 –861 –273
Share of other comprehensive income of associates and joint ventures and
other income 13 3 5
Total comprehensive income 4,234 3,338 3,956
Comprehensive income attributable to:
Non-controlling interests 132 109
Shareholders of the parent 4,102 3,229 3,956
4,234 3,338 3,956
1 The amounts for the period ended 31 December 2018 have been prepared in accordance with IFRS 9, the adoption of IFRS 9
led to new presentation requirements; prior period amounts have not been restated.
References relate to the accompanying notes. These are an integral part of the Consolidated
annual accounts. This includes Note 1 ‘Accounting policies’, which contains information on Changes
in accounting principles, estimates and presentation of the Consolidated annual accounts and
related notes.
Reference is made to Note 35 ‘Taxation’ for the disclosure on the income tax effects on each
component of the other comprehensive income.
Consolidated statement of comprehensive income for the years ended 31 December

ING Bank Annual Report 2018 46
Contents | Who we are | Report of the Management Board | Corporate governance | Consolidated annual accounts | Parent company annual accounts | Other information
in EUR million
Share capital and
share premium Other reserves Retained earnings
Share-holders'
equity (parent)
Non-controlling
interests Total equity
Balance as at 31 December 2017 17,067 4,304 22,291 43,662 715 44,377
Effect of change in accounting policy 1 –648 –391 –1,038 –14 –1,053
Balance as at 1 January 2018 17,067 3,656 21,901 42,624 700 43,325
Net change in fair value of equity instruments at fair value through other comprehensive income –518 56 –461 0 –461
Net change in fair value of debt instruments at fair value through other comprehensive income –163 –163 0 –163
Realised gains/losses on debt instruments at fair value through other comprehensive income reclassified to the
statement of profit or loss –54 –54 –2 –55
Changes in cash flow hedge reserve 342 342 41 382
Realised and unrealised revaluations property in own use –2 3 1 –0 1
Remeasurement of the net defined benefit asset/liability 34 6 6 6
Exchange rate differences and other –386 –386 –16 –402
Share of other comprehensive income of associates and joint ventures and other income 264 –251 13 13
Change in fair value of own credit risk of financial liabilities at fair value through profit or loss 198 198 198
Total amount recognised directly in other comprehensive income net of tax –312 –192 –505 24 –481
Net result 160 4,447 4,607 108 4,715
Total comprehensive income net of tax –152 4,255 4,102 132 4,234
Dividends –2,517 –2,517 –61 –2,578
Employee stock option and share plans 59 59 0 59
Changes in the composition of the group and other changes 2 –96 –96 31 –65
Balance as at 31 December 2018 17,067 3,504 23,602 44,173 803 44,976
1 Changes per type of Reserve components are presented in Note 1 ‘Accounting policies’, 1.3.1.1. IFRS 9 ‘Financial instruments’ – Impact of adoption.
2 Includes an amount for the initial recognition of the redemption liability related to the acquisition of Payvision Holding B.V. and Makelaarsland B.V. that reduces the Retained earnings of the Group. Future remeasurements of the redemption liability are
recognised in the statement of profit or loss.
Consolidated statement of changes in equity for the years ended 31 December
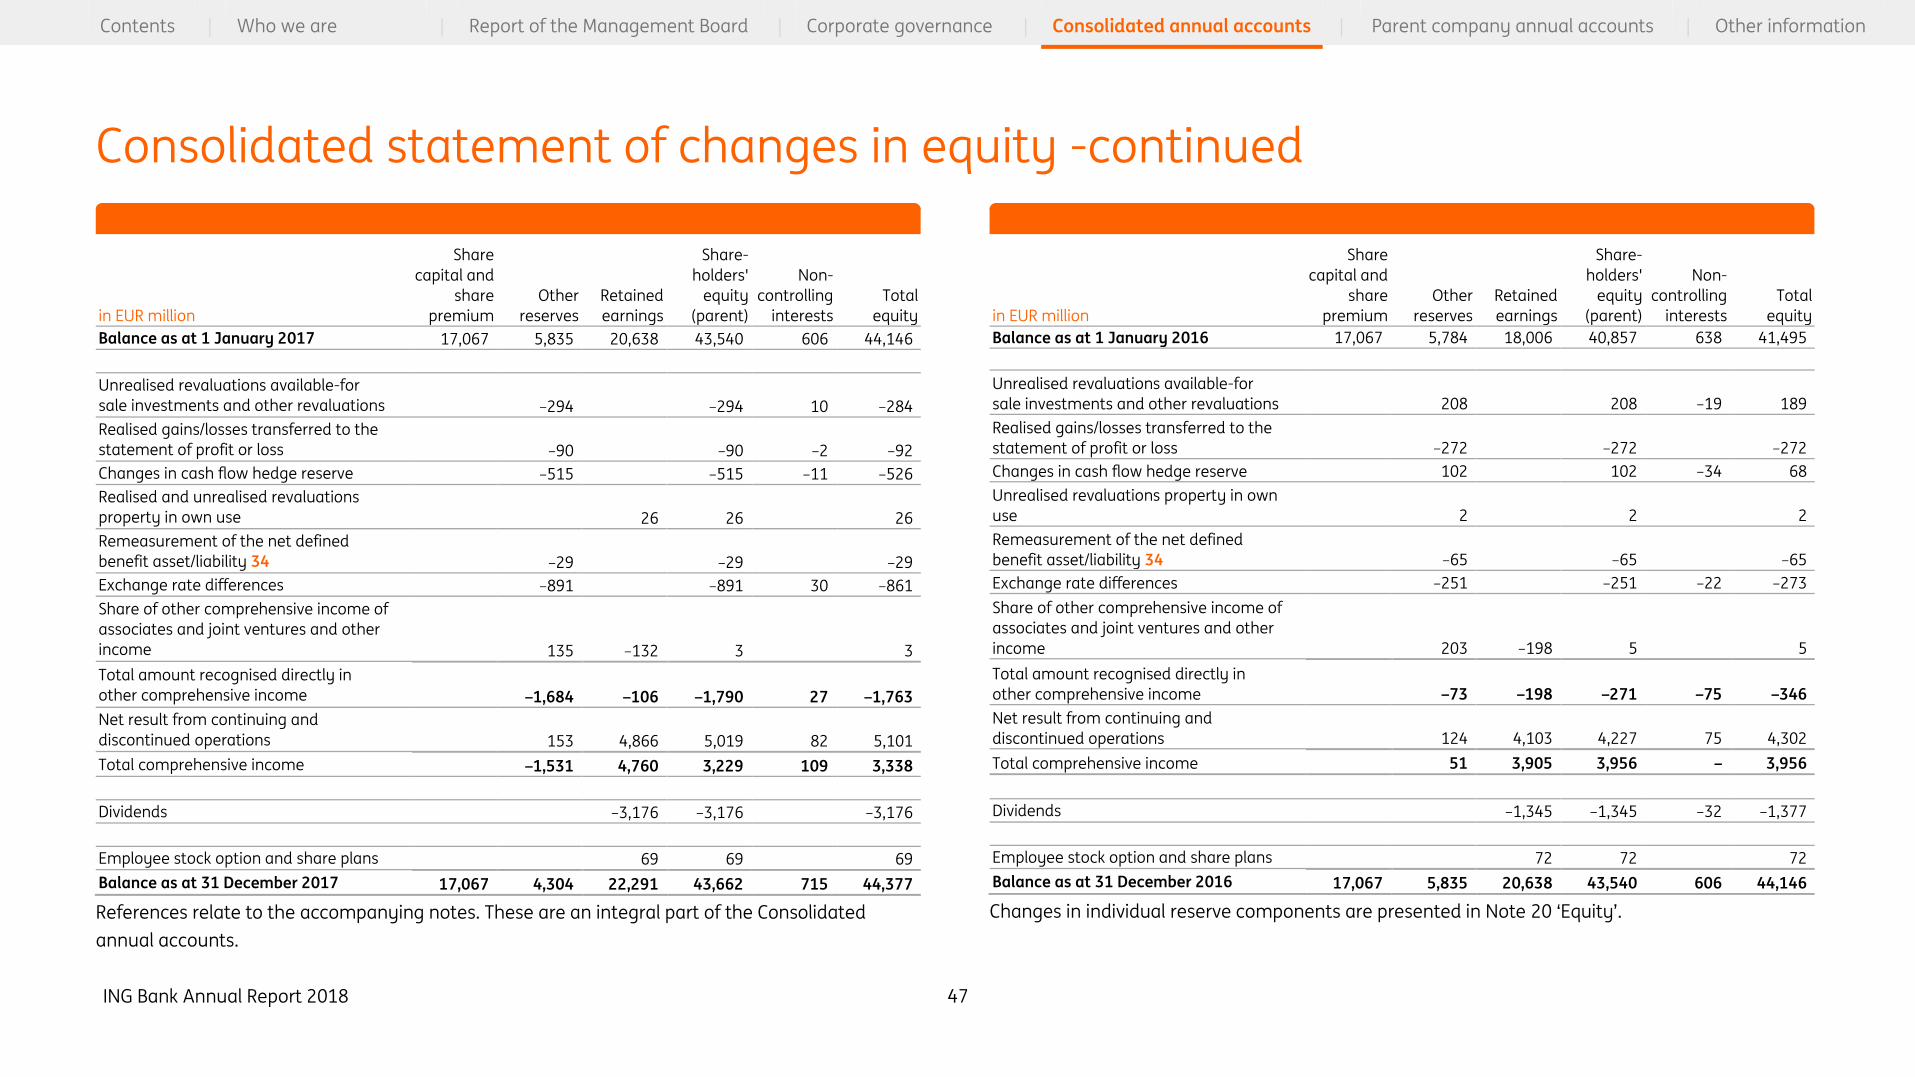
ING Bank Annual Report 2018 47
Contents | Who we are | Report of the Management Board | Corporate governance | Consolidated annual accounts | Parent company annual accounts | Other information
in EUR million
Share
capital and
share
premium
Other
reserves
Retained
earnings
Share-
holders'
equity
(parent)
Non-
controlling
interests
Total
equity
Balance as at 1 January 2017 17,067 5,835 20,638 43,540 606 44,146
Unrealised revaluations available-for
sale investments and other revaluations –294 –294 10 –284
Realised gains/losses transferred to the
statement of profit or loss –90 –90 –2 –92
Changes in cash flow hedge reserve –515 –515 –11 –526
Realised and unrealised revaluations
property in own use 26 26 26
Remeasurement of the net defined
benefit asset/liability 34 –29 –29 –29
Exchange rate differences –891 –891 30 –861
Share of other comprehensive income of
associates and joint ventures and other
income 135 –132 3 3
Total amount recognised directly in
other comprehensive income –1,684 –106 –1,790 27 –1,763
Net result from continuing and
discontinued operations 153 4,866 5,019 82 5,101
Total comprehensive income –1,531 4,760 3,229 109 3,338
Dividends –3,176 –3,176 –3,176
Employee stock option and share plans 69 69 69
Balance as at 31 December 2017 17,067 4,304 22,291 43,662 715 44,377
References relate to the accompanying notes. These are an integral part of the Consolidated
annual accounts.
in EUR million
Share
capital and
share
premium
Other
reserves
Retained
earnings
Share-
holders'
equity
(parent)
Non-
controlling
interests
Total
equity
Balance as at 1 January 2016 17,067 5,784 18,006 40,857 638 41,495
Unrealised revaluations available-for
sale investments and other revaluations 208 208 –19 189
Realised gains/losses transferred to the
statement of profit or loss –272 –272 –272
Changes in cash flow hedge reserve 102 102 –34 68
Unrealised revaluations property in own
use 2 2 2
Remeasurement of the net defined
benefit asset/liability 34 –65 –65 –65
Exchange rate differences –251 –251 –22 –273
Share of other comprehensive income of
associates and joint ventures and other
income 203 –198 5 5
Total amount recognised directly in
other comprehensive income –73 –198 –271 –75 –346
Net result from continuing and
discontinued operations 124 4,103 4,227 75 4,302
Total comprehensive income 51 3,905 3,956 – 3,956
Dividends –1,345 –1,345 –32 –1,377
Employee stock option and share plans 72 72 72
Balance as at 31 December 2016 17,067 5,835 20,638 43,540 606 44,146
Changes in individual reserve components are presented in Note 20 ‘Equity’.
Consolidated statement of changes in equity -continued

ING Bank Annual Report 2018 48
Contents | Who we are | Report of the Management Board | Corporate governance | Consolidated annual accounts | Parent company annual accounts | Other information
in EUR million 20181 20171 20161 20181 20171 20161
Cash flows from operating activities 29 Disposals and redemptions:
Result before tax 6,751 7,404 5,937 – Associates and joint ventures 116 245 54
Adjusted for: – Depreciation and amortisation 520 520 536 – Available-for-sale investments n/a 32,788 31,165
– Addition to loan loss provisions 656 676 974 – Held-to-maturity investments n/a 2,675 630
– Other –1,646 708 1,580 – Financial assets at FVOCI 15,657 n/a n/a
Taxation paid –1,600 –1,753 –1,555 – Securities at amortised cost 18,709 n/a n/a
Changes in: – Net change in Loans and advances to/from banks, not
available/payable on demand –212 3,014 –1,514
– Property and equipment 17 79 75
– Net change in Trading assets and Trading liabilities 9,820 –11,180 11,342 – Loans sold 206 1,815 1,295
– Loans and advances to customers –31,016 –21,397 –29,668 – Other investments 9 9
– Customer deposits 31,241 22,960 23,682 Net cash flow from/(used in) investing activities 5,451 11,754 3,742
– Other 3,622 –2,337 –2,357 Cash flows from financing activities
Net cash flow from/(used in) operating activities 18,136 –1,385 8,957 Proceeds from debt securities 141,214 89,369 106,174
Cash flows from investing activities Repayments of debt securities –131,170 –95,077 –121,998
Investments and advances: Proceeds from issuance of subordinated loans 1,828 2,314 1,085
– Acquisition of subsidiaries, net of cash acquired –111 Repayments of subordinated loans –4,594 –1,246 –961
– Associates and joint ventures –97 –79 –49 Purchase/sale of treasury shares
– Available-for-sale investments n/a –21,601 –27,003 Dividends paid –2,517 –3,176 –1,345
– Held-to-maturity investments n/a –3,609 –1,731 Net cash flow from/(used in) financing activities 4,761 –7,816 –17,045
– Financial assets at FVOCI –10,517 n/a n/a
– Securities at amortised cost –17,985 n/a n/a Net cash flow 28,348 2,553 –4,346
– Property and equipment –286 –304 –415
– Other investments –258 –264 –288 Cash and cash equivalents at beginning of year 18,975 16,163 20,354
Effect of exchange rate changes on cash and cash equivalents 205 260 155
Cash and cash equivalents at end of year 47,528 18,976 16,163
1 The amounts for the period ended 31 December 2018 have been prepared in accordance with IFRS 9, the adoption of IFRS 9
led to new presentation requirements; prior period amounts have not been restated.
Consolidated statement of cash flows for the years ended 31 December
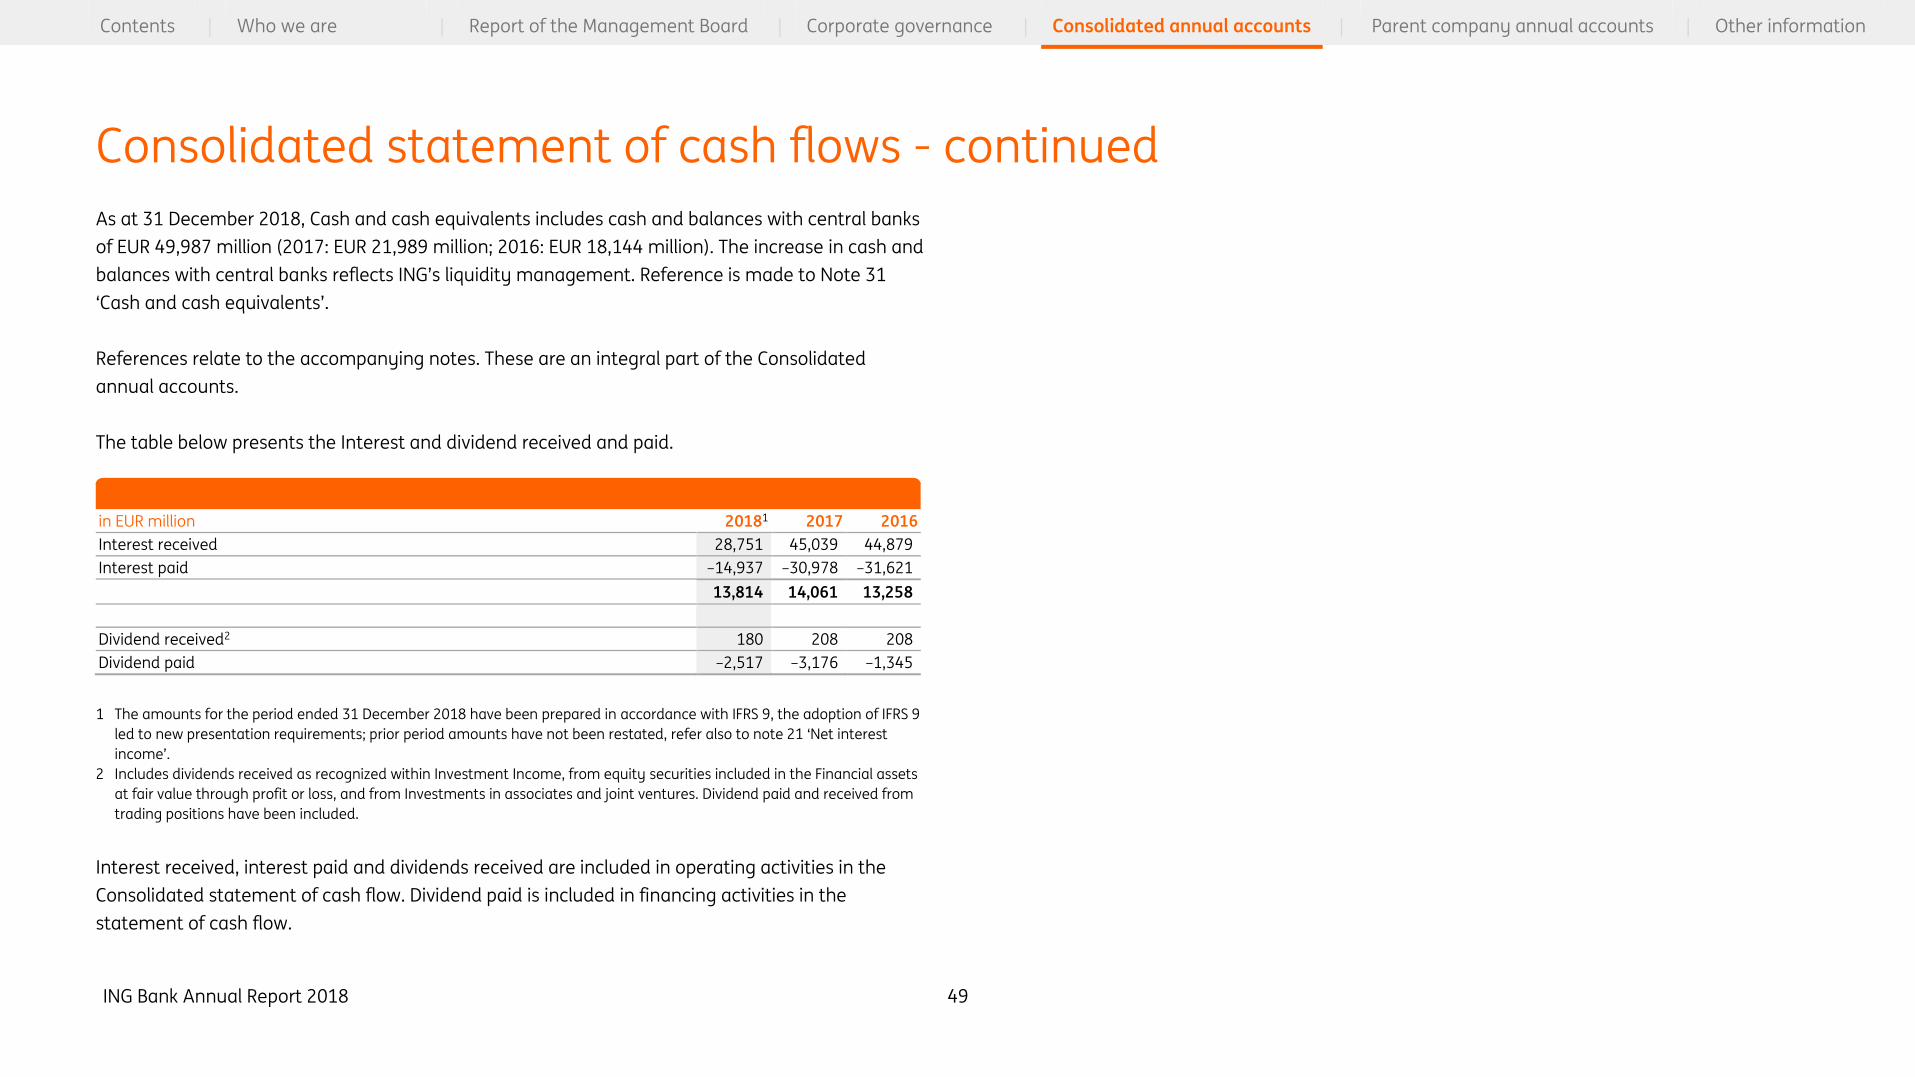
ING Bank Annual Report 2018 49
Contents | Who we are | Report of the Management Board | Corporate governance | Consolidated annual accounts | Parent company annual accounts | Other information
As at 31 December 2018, Cash and cash equivalents includes cash and balances with central banks
of EUR 49,987 million (2017: EUR 21,989 million; 2016: EUR 18,144 million). The increase in cash and
balances with central banks reflects ING’s liquidity management. Reference is made to Note 31
‘Cash and cash equivalents’.
References relate to the accompanying notes. These are an integral part of the Consolidated
annual accounts.
The table below presents the Interest and dividend received and paid.
in EUR million 20181 2017 2016
Interest received 28,751 45,039 44,879
Interest paid –14,937 –30,978 –31,621
13,814 14,061 13,258
Dividend received2 180 208 208
Dividend paid –2,517 –3,176 –1,345
1 The amounts for the period ended 31 December 2018 have been prepared in accordance with IFRS 9, the adoption of IFRS 9
led to new presentation requirements; prior period amounts have not been restated, refer also to note 21 ‘Net interest
income’.
2 Includes dividends received as recognized within Investment Income, from equity securities included in the Financial assets
at fair value through profit or loss, and from Investments in associates and joint ventures. Dividend paid and received from
trading positions have been included.
Interest received, interest paid and dividends received are included in operating activities in the
Consolidated statement of cash flow. Dividend paid is included in financing activities in the
statement of cash flow.
Consolidated statement of cash flows - continued
ING Bank Annual Report 2018 50
Contents | Who we are | Report of the Management Board | Corporate governance | Consolidated annual accounts | Parent company annual accounts | Other information
> Accounting policies > 1
Notes to the accounting policies Reporting entity
ING Bank N.V. is a company domiciled in Amsterdam, the Netherlands. Commercial Register of
Amsterdam, number 33031431. These Consolidated annual accounts, as at and for the year ended
31 December 2018, comprise ING Bank N.V. (the Parent company) and its subsidiaries, together
referred to as ING Bank. ING Bank is a global financial institution with a strong European base,
offering a wide range of retail and wholesale banking services to customers in over 40 countries.
Authorisation of the Consolidated annual accounts
The ING Bank Consolidated annual accounts, as at and for the year ended 31 December 2018, were
authorised for issue in accordance with a resolution of the Management Board Banking on 4 March
2019. The Management Board Banking may decide to amend the annual accounts as long as these
are not adopted by the General Meeting of Shareholders. The General Meeting of Shareholders may
decide not to adopt the annual accounts, but may not amend these.
Basis of preparation of the Consolidated annual accounts
The ING Bank Consolidated annual accounts have been prepared in accordance with International
Financial Reporting Standards (IFRS) as adopted by the European Union (EU) and the relevant
articles of Part 9 of Book 2 of the Dutch Civil Code.
IFRS as adopted by the EU are IFRS Standards and IFRS Interpretations as issued by the
International Accounting Standards Board (IASB) and the IFRS Interpretations Committee (IFRIC)
with some limited modifications such as the temporary ‘carve-out’ from IAS 39 ‘Financial
Instruments: Recognition and Measurement’ (herein, referred to as IFRS).
Under the EU carve-out, ING Bank applies fair value hedge accounting to portfolio hedges of
interest rate risk (macro hedging). For further information, reference is made to Note 1 ‘Accounting
policies’, d) Principles of valuation and determination of results and Note 37 ‘Derivatives and hedge
accounting’.
The ING Bank Consolidated annual accounts have been prepared on a going concern basis.
Amounts may not add up due to rounding
1 Accounting policies
ING Bank has consistently applied its accounting policies to all periods presented in these
Consolidated annual accounts, except for changes in IFRS 9 that became effective in 2018.
1.1 Changes in IFRS effective in 2018
A number of new or amended standards became applicable for the current reporting period. ING
Bank changed its accounting policies as a result of adopting IFRS 9 ‘Financial Instruments’.
The impact of the adoption of IFRS 9 is disclosed in note 1.3.1.1 ‘IFRS 9 Financial instruments –
Impact of adoption’ and the new IFRS 9 accounting policies are disclosed in note 1.3.1.2 ‘IFRS 9
Financial instruments - Accounting policies applied from 1 January 2018’. The other standards and
amendments, including IFRS 15 (refer to note 1.3.2 ‘IFRS 15 Revenue from Contract with
Customers’), did not have a significant impact on the Bank’s accounting policies.
Except for the amendment to IFRS 9 regarding prepayment features with negative compensation,
ING Bank has not early adopted any standard, interpretation or amendment which has been
issued, but is not yet effective.
Notes to the Consolidated annual accounts amounts in millions of euros, unless stated otherwise

ING Bank Annual Report 2018 51
Contents | Who we are | Report of the Management Board | Corporate governance | Consolidated annual accounts | Parent company annual accounts | Other information
> Accounting policies > 1
1.2 Upcoming changes in IFRS after 2018
Major new IFRSs
IFRS 16 ‘Leases’
IFRS 16 ‘Leases’ was issued by the IASB in January 2016 and endorsed by the EU in October 2017.
IFRS 16 replaces IAS 17 ‘Leases’, IFRIC 4 ‘Determining whether an Arrangement contains a Lease’,
SIC-15 ‘Operating Leases- Incentives’ and SIC-27 ‘Evaluating the Substance of Transactions Involving
the Legal Form of a Lease. The new requirements are effective for annual periods beginning on or
after 1 January 2019 and will be applied by ING as of that date.
For lessee accounting, the new standard removes the distinction between operating or finance
leases. All leases will be recognised on the statement of financial position with exemptions for
short-term leases with a lease term of less than 12 months and leases of low-value assets (for
example mobile phones or laptops). A lessee is required to recognise a right-of-use asset
representing its right to use the underlying leased asset and a lease liability representing its
obligation to make lease payments. The standard permits a lessee to choose either a full
retrospective or a modified retrospective transition approach. Furthermore the standard provides
some practical expedients and exemptions. ING has opted to apply for periods starting from
January 1, 2019 the modified retrospective approach and will make use of several of these practical
expedients and exemptions permitted under the standard. Lessor accounting remains substantially
unchanged.
The IFRS 16 implementation project commenced in 2017 with a data gathering exercise in a
preliminary impact assessment.
The implementation project’s main focus was on:
Performing two ‘parallel runs’ over the course of 2018, to test readiness of systems, processes and
a number of controls for transition to IFRS 16 as per 1 January 2019;
Technical interpretation of the Standard;
Developing and validating the lease calculation models;
Updating the policies and governance impacted by IFRS 16;
Preparing the IFRS 16 transition disclosures.
As per 31 December 2018 ING has a number of lease contracts for buildings, cars and other leases
such as IT equipment that are currently accounted for under IAS 17 as operating leases. As a result
of the new IFRS 16 requirements, ING estimates that the Right-of-use assets and Lease liabilities to
be recognised will amount to approximately EUR 1.3 billion. This amount is marginally lower than
the future rental commitments to be paid under non-cancellable operating leases, as disclosed in
Note 43 Contingent liabilities and commitments. This decrease is largely caused by the effects of
the exemptions applied for leases of low-value assets, the exemption for short-term leases, the
effect of discounting and the exclusion of the non-lease components in the lease payments. This is
partly offset by including lease payments for periods covered by extension options that are
reasonably certain to be exercised.
ING Bank has opted to use the incremental borrowing rate as the discount rate for initial
measurement of the lease liability. The incremental borrowing rate is the rate a lessee would have
to pay to borrow over a similar term, and with a similar security, the funds necessary to obtain an
asset of a similar value to the right-of-use asset in a similar economic environment. This rate is
approximated by using the risk free rate applicable to the lease term, currency of the lease
payment and jurisdiction, with the Fund Transfer Pricing (FTP) rate as an add-on. The FTP rate is
used to transfer interest rate risk and funding and liquidity risk positions between the ING business
and treasury departments. It is determined by either ING Bank or Local Asset and Liability
Committee (ALCO).
There is no significant impact of the adoption of IFRS 16 on ING Bank’s Net result, Comprehensive
income or Shareholders’ equity on transition. This follows ING’s implementation decision where the
value of the right-of-use asset is based on the value of the lease liability, adjusted for any
previously recognised prepaid and/or accrued lease payments on that lease contract, as is
permitted under the Standard.

ING Bank Annual Report 2018 52
Contents | Who we are | Report of the Management Board | Corporate governance | Consolidated annual accounts | Parent company annual accounts | Other information
> Accounting policies > 1
Changes to IFRS effective in 2019 and onwards expected to have no significant
impact on ING Bank
The following published amendments are not mandatory for 2018 and have not been early
adopted by ING Bank. ING Bank is still currently assessing the detailed impact of these
amendments, however the implementation of these amendments is expected to have no
significant impact on ING Bank’s Consolidated annual accounts.
The list of upcoming changes to IFRS, which are applicable for ING Bank:
Effective in 2019 (* - endorsed by the EU, the rest not yet endorsed by the EU):
IFRIC 23 ‘Uncertainty over Income Tax Treatments’ (issued on 7 June 2017)*;
Amendments to IAS 28 ‘Investments in Associates and Joint Ventures’: Long-term Interests in
Associates and Joint Ventures (issued on 12 October 2017)*;
Annual improvements cycle 2015 – 2017: Amendments to IFRS 3 ‘Business Combinations’, IFRS
11 ‘Joint Arrangements’, IAS 12 ‘Income Taxes’, IAS 23 ‘Borrowing Costs’ (issued on 12 December
2017); and
Amendments to IAS 19 ‘Employee Benefits’: Plan Amendment, Curtailment or Settlement (issued
on 7 February 2018).
Effective in 2020 (not yet endorsed by the EU):
Amendments to References to the Conceptual Framework in IFRS Standards (issued on 29 March
2018);
Amendment to IFRS 3 Business Combinations (issued on 22 October 2018); and
Amendments to IAS 1 and IAS 8: Definition of Material (issued on 31 October 2018).
IASB has also issued IFRS 17 ‘Insurance Contracts’ effective in 2021, however it is not applicable for
ING Bank.
1.3 Changes to accounting policies in 2018
1.3.1 IFRS 9 ‘Financial instruments’
ING Bank has applied the classification, measurement, and impairment requirements of IFRS 9
retrospectively as of 1 January 2018 by adjusting the opening balance sheet and opening equity at
1 January 2018. ING Bank has not restated comparative periods as permitted by the standard. ING
Bank early adopted the amendment to IFRS 9, otherwise effective 1 January 2019, which allows
financial assets with prepayment features that permit or require a party to a contract either to pay
or receive reasonable compensation for the early termination of the contract, to be measured at
amortised cost (AC) or at fair value through other comprehensive income (FVOCI). ING Bank opted
to continue applying the hedge accounting rules of IAS 39 under the EU-carve out as explicitly
permitted by IFRS 9. Notwithstanding, the revised hedge accounting disclosures as required by IFRS
7 ‘Financial Instruments: Disclosures’ as per 1 January 2018 have been implemented.
1.3.1.1 IFRS 9 ‘Financial instruments’ – Impact of adoption
Transition
Changes in accounting policies resulting from the adoption of IFRS 9 have been applied
retrospectively. Comparative periods have not been restated. Differences in the carrying amounts
of financial assets and financial liabilities resulting from the adoption of IFRS 9 are recognised in
retained earnings and reserves as at 1 January 2018. Accordingly, the information presented for
2017 does not reflect the requirements of IFRS 9 and therefore is not comparable to the
information presented for 2018 under IFRS 9.
The following assessments have been made on the basis of the facts and circumstances that
existed at the date of initial application:
The determination of the business model within which a financial asset is held;
The designation and revocation of previous designations of certain financial assets and financial
liabilities as measured at Fair Value Through Profit or Loss (FVPL);
The designation of certain investments in equity instruments not held-for-trading as at Fair
Value Through Other Comprehensive Income (FVOCI); and

ING Bank Annual Report 2018 53
Contents | Who we are | Report of the Management Board | Corporate governance | Consolidated annual accounts | Parent company annual accounts | Other information
> Accounting policies > 1
For financial liabilities designated as at FVPL, the determination of whether presenting the
effects of changes in the financial liability’s credit risk in Other Comprehensive Income (OCI)
would create or enlarge an accounting mismatch in profit or loss.
In 2018 ING Bank continued to test and refine the new processes, internal controls and governance
framework necessitated by the adoption of IFRS 9. This has given rise to a minor change in
estimation of the IFRS 9 impact, compared to what was presented in the ING Bank Annual Report
2017.
The following table reconciles the carrying amounts of financial instruments under IAS 39 to the
carrying amounts under IFRS 9 on transition to IFRS 9 on 1 January 2018.
In EUR million Ref IAS 39 Reclassfication1 Remeasurement IFRS 9
Cash and balances with central banks 21,989 3 21,992
Loans and advances to banks 28,746 -59 2 28,689
Trading assets E 116,763 -51,264 65,499
Non-trading derivatives 2,185 577 2,762
Loans and advances at FVPL C, E 2,500 54,082 31 56,613
Debt securities at FVPL C 1,738 1,497 -96 3,139
Equity securities at FVPL D 4 184 16 204
Available-for-sale A, C, D 69,730 -69,730
Debt securities at FVOCI A 30,459 -22 30,437
Equity securities at FVOCI D 3,800 3,800
Loans and advances at FVOCI B 3,139 225 3,364
Securities at AC A, C 9,343 39,904 -830 48,417
Loans and advances to customers B, C 574,899 -8,367 -761 565,771
Other assets (financial and non-financial) 18,421 -4,225 306 14,502
Total assets 846,318 – -1,131 845,188
Deposits from banks 36,821 108 36,929
Customer deposits 552,690 156 552,846
Trading liabilities E 73,596 -35,362 38,234
Non-trading derivatives 2,346 326 2,672
Financial liabilities designated at FVPL E 11,215 37,264 48,479
Other liabilities (financial and non-financial) 19,211 -3,366 -77 15,768
Debt securities in issue 90,231 703 90,934
Subordinated loans 15,831 170 16,001
Total liabilities 801,941 – -77 801,863
Shareholders' equity (parent) 43,662 -1,038 42,624
Non-controlling interest 715 -14 700
Total equity 44,377 – -1,053 43,325
Total liabilities and equity 846,318 – -1,131 845,188
1 Includes the reclassification of accrued interest from other assets and other liabilities to the corresponding balance sheet
item of the host contract.
Reconciliation of carrying amounts on the date of initial application of IFRS 9
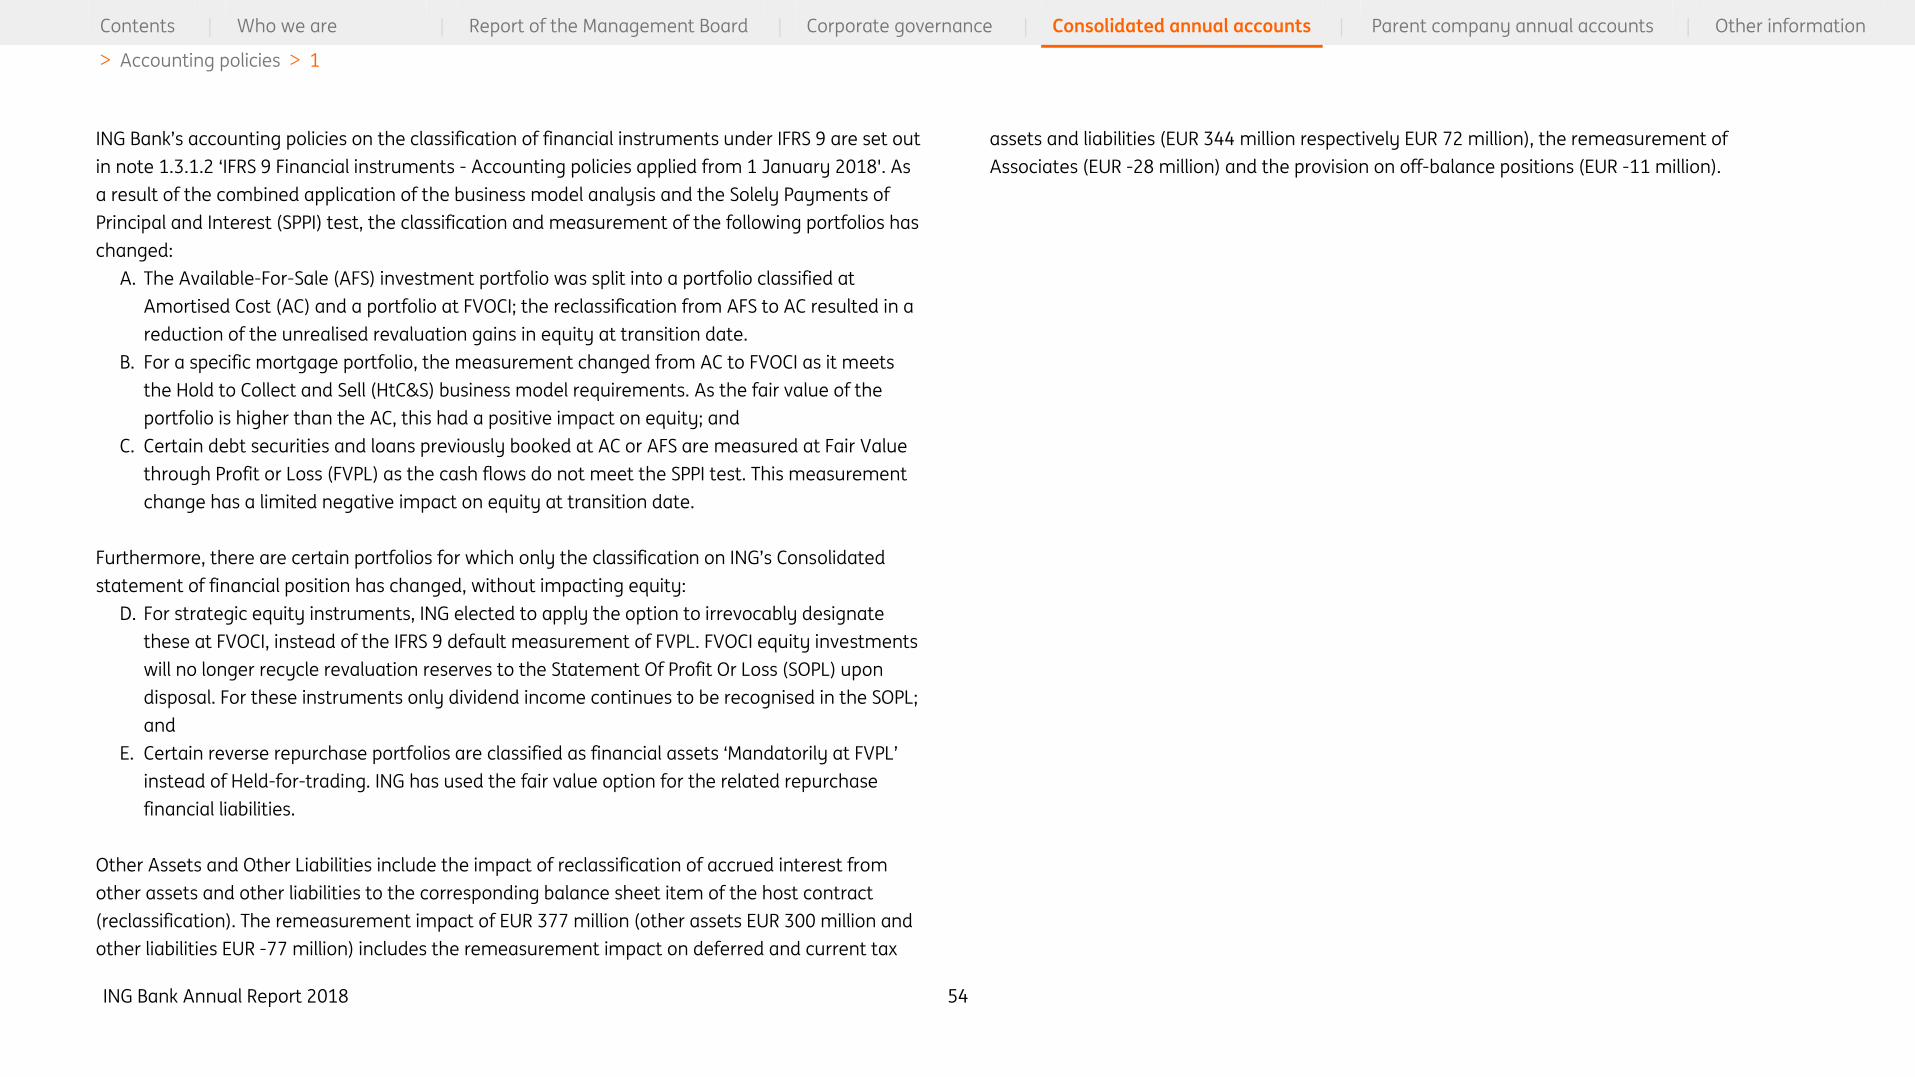
ING Bank Annual Report 2018 54
Contents | Who we are | Report of the Management Board | Corporate governance | Consolidated annual accounts | Parent company annual accounts | Other information
> Accounting policies > 1
ING Bank’s accounting policies on the classification of financial instruments under IFRS 9 are set out
in note 1.3.1.2 ‘IFRS 9 Financial instruments - Accounting policies applied from 1 January 2018'. As
a result of the combined application of the business model analysis and the Solely Payments of
Principal and Interest (SPPI) test, the classification and measurement of the following portfolios has
changed:
A. The Available-For-Sale (AFS) investment portfolio was split into a portfolio classified at
Amortised Cost (AC) and a portfolio at FVOCI; the reclassification from AFS to AC resulted in a
reduction of the unrealised revaluation gains in equity at transition date.
B. For a specific mortgage portfolio, the measurement changed from AC to FVOCI as it meets
the Hold to Collect and Sell (HtC&S) business model requirements. As the fair value of the
portfolio is higher than the AC, this had a positive impact on equity; and
C. Certain debt securities and loans previously booked at AC or AFS are measured at Fair Value
through Profit or Loss (FVPL) as the cash flows do not meet the SPPI test. This measurement
change has a limited negative impact on equity at transition date.
Furthermore, there are certain portfolios for which only the classification on ING’s Consolidated
statement of financial position has changed, without impacting equity:
D. For strategic equity instruments, ING elected to apply the option to irrevocably designate
these at FVOCI, instead of the IFRS 9 default measurement of FVPL. FVOCI equity investments
will no longer recycle revaluation reserves to the Statement Of Profit Or Loss (SOPL) upon
disposal. For these instruments only dividend income continues to be recognised in the SOPL;
and
E. Certain reverse repurchase portfolios are classified as financial assets ‘Mandatorily at FVPL’
instead of Held-for-trading. ING has used the fair value option for the related repurchase
financial liabilities.
Other Assets and Other Liabilities include the impact of reclassification of accrued interest from
other assets and other liabilities to the corresponding balance sheet item of the host contract
(reclassification). The remeasurement impact of EUR 377 million (other assets EUR 300 million and
other liabilities EUR -77 million) includes the remeasurement impact on deferred and current tax
assets and liabilities (EUR 344 million respectively EUR 72 million), the remeasurement of
Associates (EUR -28 million) and the provision on off-balance positions (EUR -11 million).
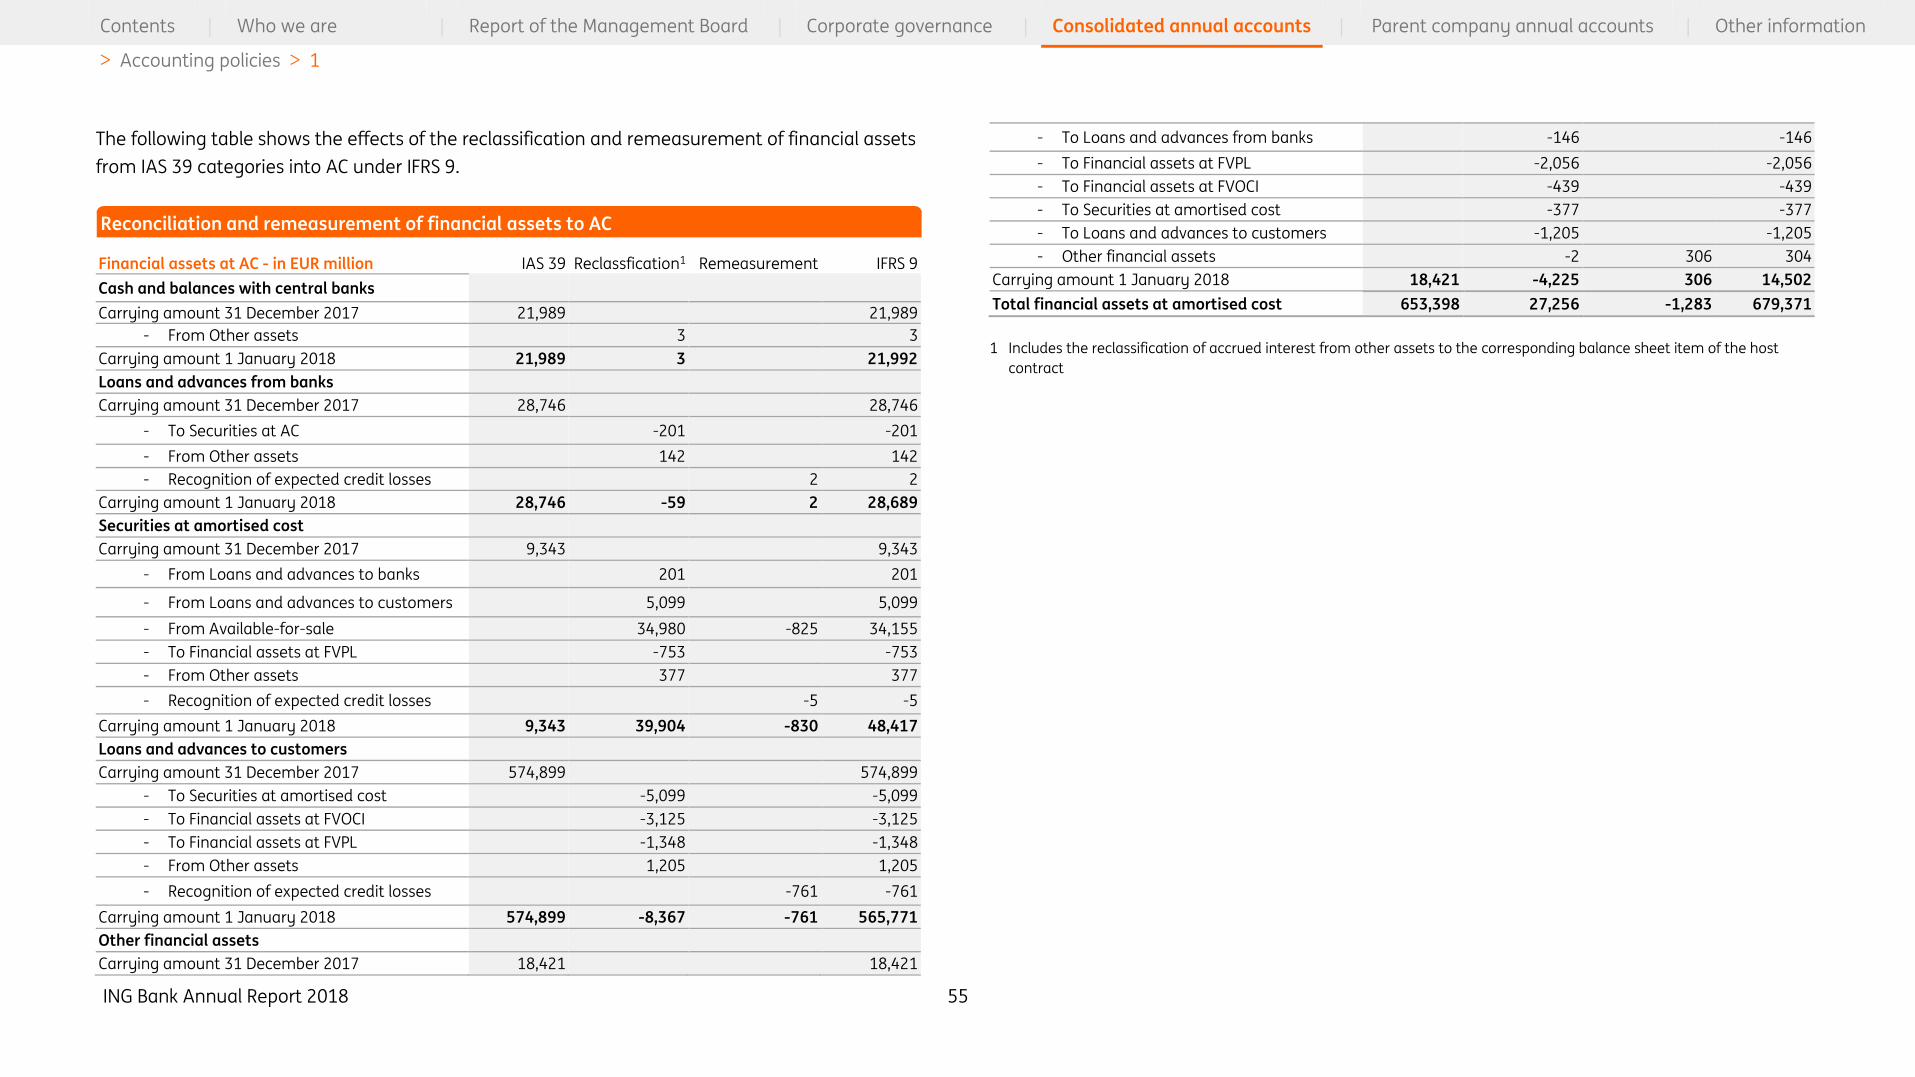
ING Bank Annual Report 2018 55
Contents | Who we are | Report of the Management Board | Corporate governance | Consolidated annual accounts | Parent company annual accounts | Other information
> Accounting policies > 1
The following table shows the effects of the reclassification and remeasurement of financial assets
from IAS 39 categories into AC under IFRS 9.
Financial assets at AC - in EUR million IAS 39 Reclassfication1 Remeasurement IFRS 9
Cash and balances with central banks
Carrying amount 31 December 2017 21,989 21,989
- From Other assets 3 3
Carrying amount 1 January 2018 21,989 3 21,992
Loans and advances from banks
Carrying amount 31 December 2017 28,746 28,746
- To Securities at AC -201 -201
- From Other assets 142 142
- Recognition of expected credit losses 2 2
Carrying amount 1 January 2018 28,746 -59 2 28,689
Securities at amortised cost
Carrying amount 31 December 2017 9,343 9,343
- From Loans and advances to banks 201 201
- From Loans and advances to customers 5,099 5,099
- From Available-for-sale 34,980 -825 34,155
- To Financial assets at FVPL -753 -753
- From Other assets 377 377
- Recognition of expected credit losses -5 -5
Carrying amount 1 January 2018 9,343 39,904 -830 48,417
Loans and advances to customers
Carrying amount 31 December 2017 574,899 574,899
- To Securities at amortised cost -5,099 -5,099
- To Financial assets at FVOCI -3,125 -3,125
- To Financial assets at FVPL -1,348 -1,348
- From Other assets 1,205 1,205
- Recognition of expected credit losses -761 -761
Carrying amount 1 January 2018 574,899 -8,367 -761 565,771
Other financial assets
Carrying amount 31 December 2017 18,421 18,421
- To Loans and advances from banks -146 -146
- To Financial assets at FVPL -2,056 -2,056
- To Financial assets at FVOCI -439 -439
- To Securities at amortised cost -377 -377
- To Loans and advances to customers -1,205 -1,205
- Other financial assets -2 306 304
Carrying amount 1 January 2018 18,421 -4,225 306 14,502
Total financial assets at amortised cost 653,398 27,256 -1,283 679,371
1 Includes the reclassification of accrued interest from other assets to the corresponding balance sheet item of the host
contract
Reconciliation and remeasurement of financial assets to AC

ING Bank Annual Report 2018 56
Contents | Who we are | Report of the Management Board | Corporate governance | Consolidated annual accounts | Parent company annual accounts | Other information
> Accounting policies > 1
The following table shows the effects of the reclassification and remeasurement of financial assets
from IAS 39 categories into FVPL under IFRS 9.
Financial assets at FVPL - in EUR million IAS 39 Reclassfication1 Remeasurement IFRS 9
Trading assets
Carrying amount 31 December 2017 116,763 116,763
- From Other Assets 1,466 1,466
- To Loans and advances at FVPL -52,730 -52,730
Carrying amount 1 January 2018 116,763 -51,264 65,499
Non-trading derivatives
- Opening balance 2,185 2,185
- From Other Assets 577 577
Carrying amount 1 January 2018 2,185 577 2,762
Loans and advances at FVPL
Carrying amount 31 December 2017 2,500 2,500
- From Trading assets 52,730 52,730
- From Loans and advances to customers 1,348 31 1,379
- From Other Assets 4 4
Carrying amount 1 January 2018 2,500 54,082 31 56,613
Debt securities at FVPL
Carrying amount 31 December 2017 1,738 1,738
- From Available-for-sale 735 735
- From Amortised cost 753 -96 657
- From Other Assets 9 9
Carrying amount 1 January 2018 1,738 1,497 -96 3,139
Equity securities at FVPL
Carrying amount 31 December 2017 4 4
- From Available-for-sale 184 16 200
Carrying amount 1 January 2018 4 184 16 204
Total financial assets FVPL 123,190 5,076 -49 128,217
1 Includes the reclassification of accrued interest from other assets liabilities to the corresponding balance sheet item of the
host contract.
The following table shows the effects of the reclassification and remeasurement of financial assets
from IAS 39 categories into FVOCI under IFRS 9.
Financial assets at FVOCI - in EUR million IAS 39 Reclassfication1 Remeasurement IFRS 9
Available-for-sale
Carrying amount 31 December 2017 69,730 69,730
- To Equity securities at FVOCI -3,800 -3,800
- To Debt securities at FVOCI -30,033 -30,033
- To Equity securities at FVPL -183 -183
- To Debt securities at FVPL -735 -735
- To Securities at amortised cost -34,979 -34,979
Carrying amount 1 January 2018 69,730 -69,730
Debt securities at FVOCI
Carrying amount 31 December 2017
- From Available-for-sale 30,033 -2 30,031
- From Other Assets 426 426
- Recognition of expected credit losses -20 -20
Carrying amount 1 January 2018 30,459 -22 30,437
Equity securities at FVOCI
Carrying amount 31 December 2017
- From Available-for-sale 3,800 3,800
Carrying amount 1 January 2018 3,800 3,800
Loans and advances at FVOCI
Carrying amount 31 December 2017
- From Loans and advances to customers 3,125 225 3,350
- From Other Assets 14 14
Carrying amount 1 January 2018 3,139 225 3,364
Total financial assets at FVOCI 69,730 -32,332 203 37,601
1 Includes the reclassification of accrued interest from other assets to the corresponding balance sheet item of the host
contract
Reconciliation and remeasurement of financial assets to FVPL
Reconciliation and remeasurement of financial assets to FVOCI
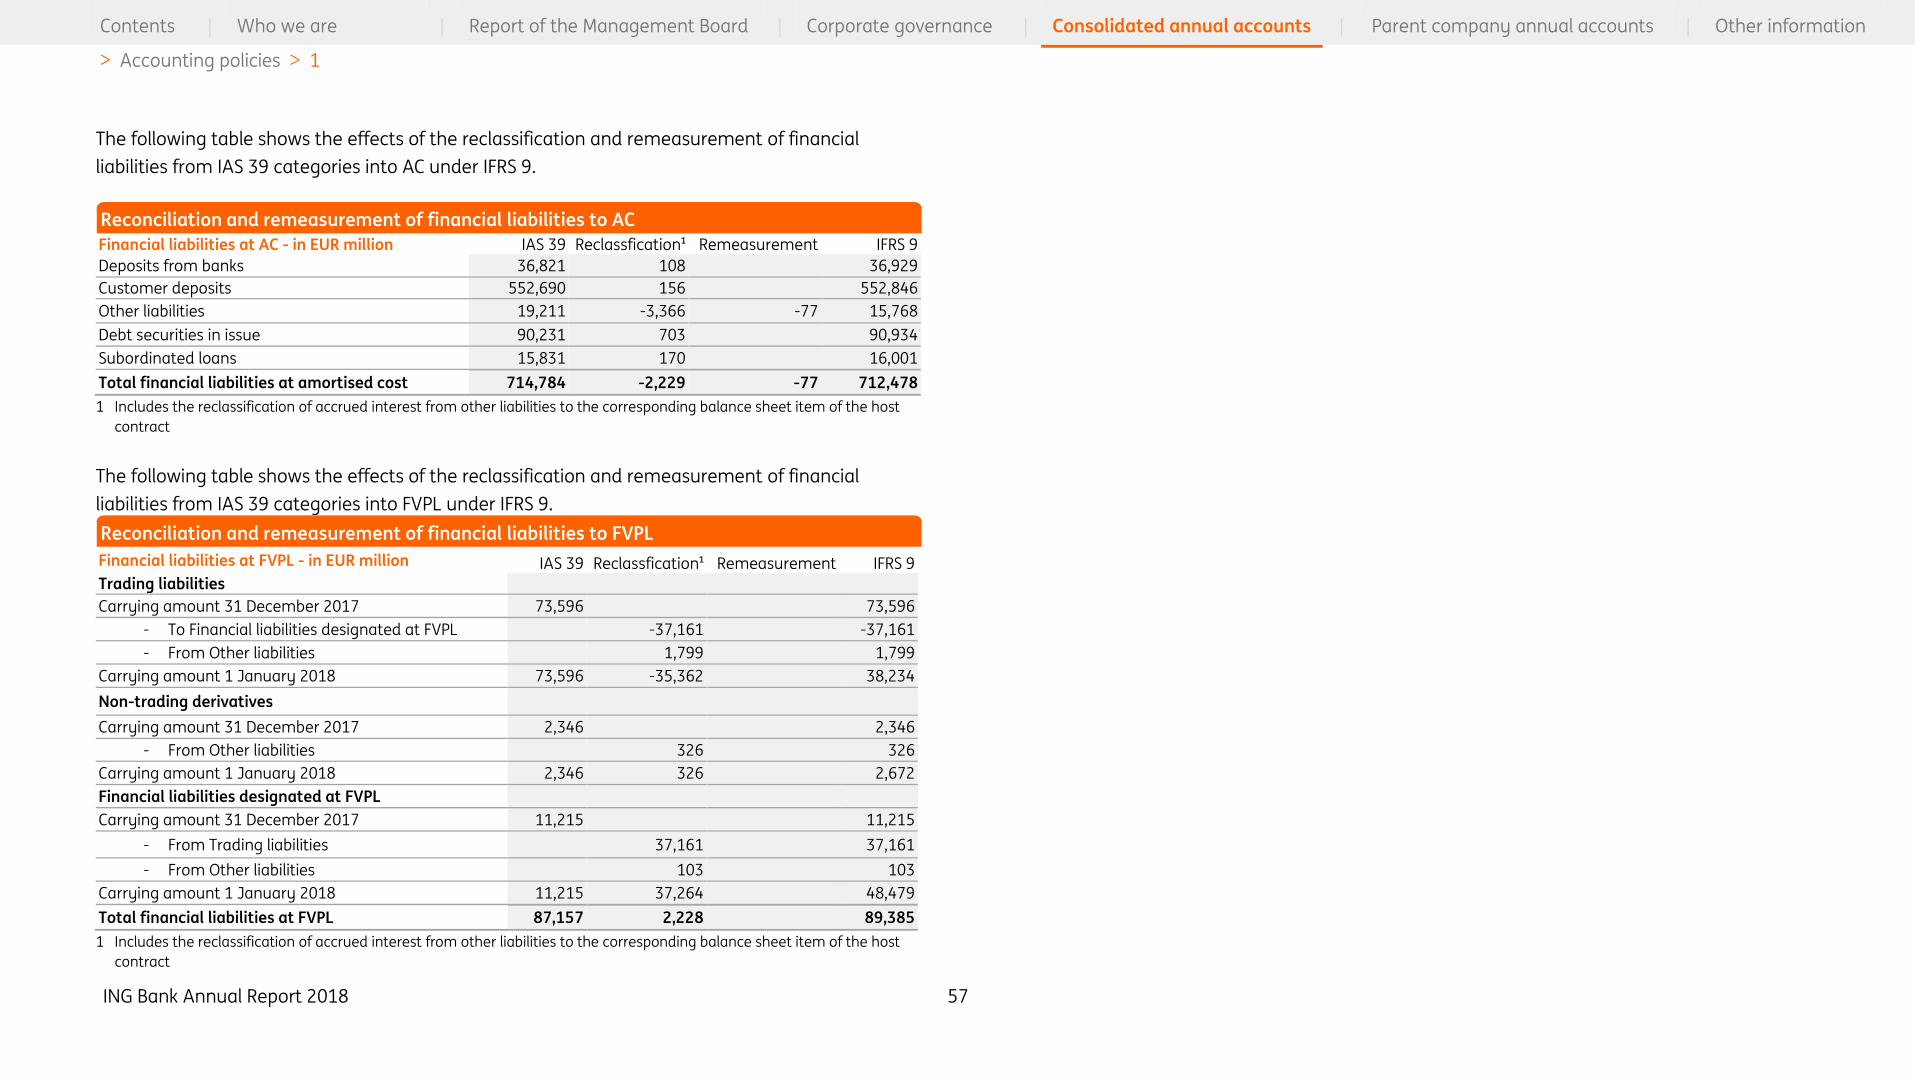
ING Bank Annual Report 2018 57
Contents | Who we are | Report of the Management Board | Corporate governance | Consolidated annual accounts | Parent company annual accounts | Other information
> Accounting policies > 1
The following table shows the effects of the reclassification and remeasurement of financial
liabilities from IAS 39 categories into AC under IFRS 9.
Financial liabilities at AC - in EUR million IAS 39 Reclassfication¹ Remeasurement IFRS 9
Deposits from banks 36,821 108 36,929
Customer deposits 552,690 156 552,846
Other liabilities 19,211 -3,366 -77 15,768
Debt securities in issue 90,231 703 90,934
Subordinated loans 15,831 170 16,001
Total financial liabilities at amortised cost 714,784 -2,229 -77 712,478
1 Includes the reclassification of accrued interest from other liabilities to the corresponding balance sheet item of the host
contract
The following table shows the effects of the reclassification and remeasurement of financial
liabilities from IAS 39 categories into FVPL under IFRS 9.
Financial liabilities at FVPL - in EUR million IAS 39 Reclassfication¹ Remeasurement IFRS 9
Trading liabilities
Carrying amount 31 December 2017 73,596 73,596
- To Financial liabilities designated at FVPL -37,161 -37,161
- From Other liabilities 1,799 1,799
Carrying amount 1 January 2018 73,596 -35,362 38,234
Non-trading derivatives
Carrying amount 31 December 2017 2,346 2,346
- From Other liabilities 326 326
Carrying amount 1 January 2018 2,346 326 2,672
Financial liabilities designated at FVPL
Carrying amount 31 December 2017 11,215 11,215
- From Trading liabilities 37,161 37,161
- From Other liabilities 103 103
Carrying amount 1 January 2018 11,215 37,264 48,479
Total financial liabilities at FVPL 87,157 2,228 89,385
1 Includes the reclassification of accrued interest from other liabilities to the corresponding balance sheet item of the host
contract
Reconciliation and remeasurement of financial liabilities to AC
Reconciliation and remeasurement of financial liabilities to FVPL
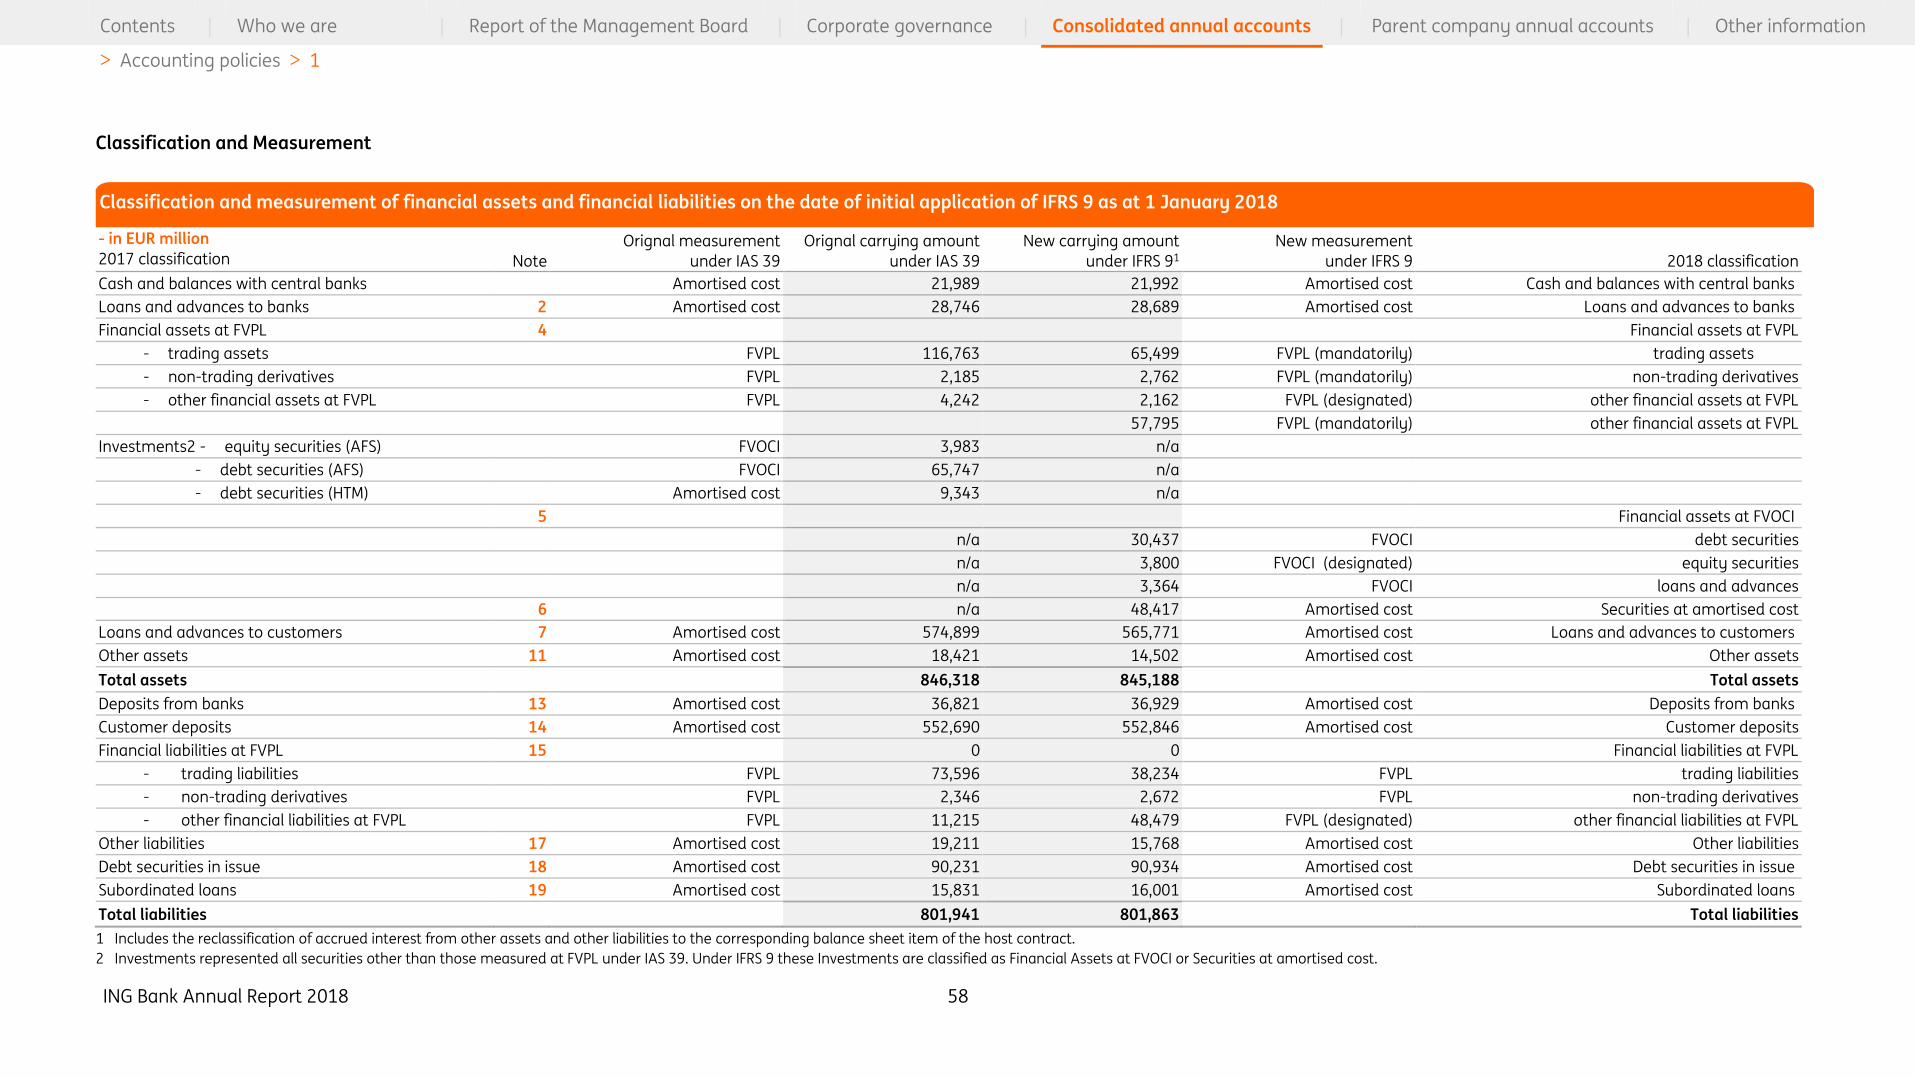
ING Bank Annual Report 2018 58
Contents | Who we are | Report of the Management Board | Corporate governance | Consolidated annual accounts | Parent company annual accounts | Other information
> Accounting policies > 1
Classification and Measurement
- in EUR million
2017 classification Note
Orignal measurement
under IAS 39
Orignal carrying amount
under IAS 39
New carrying amount
under IFRS 91
New measurement
under IFRS 9 2018 classification
Cash and balances with central banks Amortised cost 21,989 21,992 Amortised cost Cash and balances with central banks
Loans and advances to banks 2 Amortised cost 28,746 28,689 Amortised cost Loans and advances to banks
Financial assets at FVPL 4 Financial assets at FVPL
- trading assets FVPL 116,763 65,499 FVPL (mandatorily) trading assets
- non-trading derivatives FVPL 2,185 2,762 FVPL (mandatorily) non-trading derivatives
- other financial assets at FVPL FVPL 4,242 2,162 FVPL (designated) other financial assets at FVPL
57,795 FVPL (mandatorily) other financial assets at FVPL
Investments2 - equity securities (AFS) FVOCI 3,983 n/a
- debt securities (AFS) FVOCI 65,747 n/a
- debt securities (HTM) Amortised cost 9,343 n/a
5 Financial assets at FVOCI
n/a 30,437 FVOCI debt securities
n/a 3,800 FVOCI (designated) equity securities
n/a 3,364 FVOCI loans and advances
6 n/a 48,417 Amortised cost Securities at amortised cost
Loans and advances to customers 7 Amortised cost 574,899 565,771 Amortised cost Loans and advances to customers
Other assets 11 Amortised cost 18,421 14,502 Amortised cost Other assets
Total assets 846,318 845,188 Total assets
Deposits from banks 13 Amortised cost 36,821 36,929 Amortised cost Deposits from banks
Customer deposits 14 Amortised cost 552,690 552,846 Amortised cost Customer deposits
Financial liabilities at FVPL 15 0 0 Financial liabilities at FVPL
- trading liabilities FVPL 73,596 38,234 FVPL trading liabilities
- non-trading derivatives FVPL 2,346 2,672 FVPL non-trading derivatives
- other financial liabilities at FVPL FVPL 11,215 48,479 FVPL (designated) other financial liabilities at FVPL
Other liabilities 17 Amortised cost 19,211 15,768 Amortised cost Other liabilities
Debt securities in issue 18 Amortised cost 90,231 90,934 Amortised cost Debt securities in issue
Subordinated loans 19 Amortised cost 15,831 16,001 Amortised cost Subordinated loans
Total liabilities 801,941 801,863 Total liabilities
1 Includes the reclassification of accrued interest from other assets and other liabilities to the corresponding balance sheet item of the host contract.
2 Investments represented all securities other than those measured at FVPL under IAS 39. Under IFRS 9 these Investments are classified as Financial Assets at FVOCI or Securities at amortised cost.
Classification and measurement of financial assets and financial liabilities on the date of initial application of IFRS 9 as at 1 January 2018
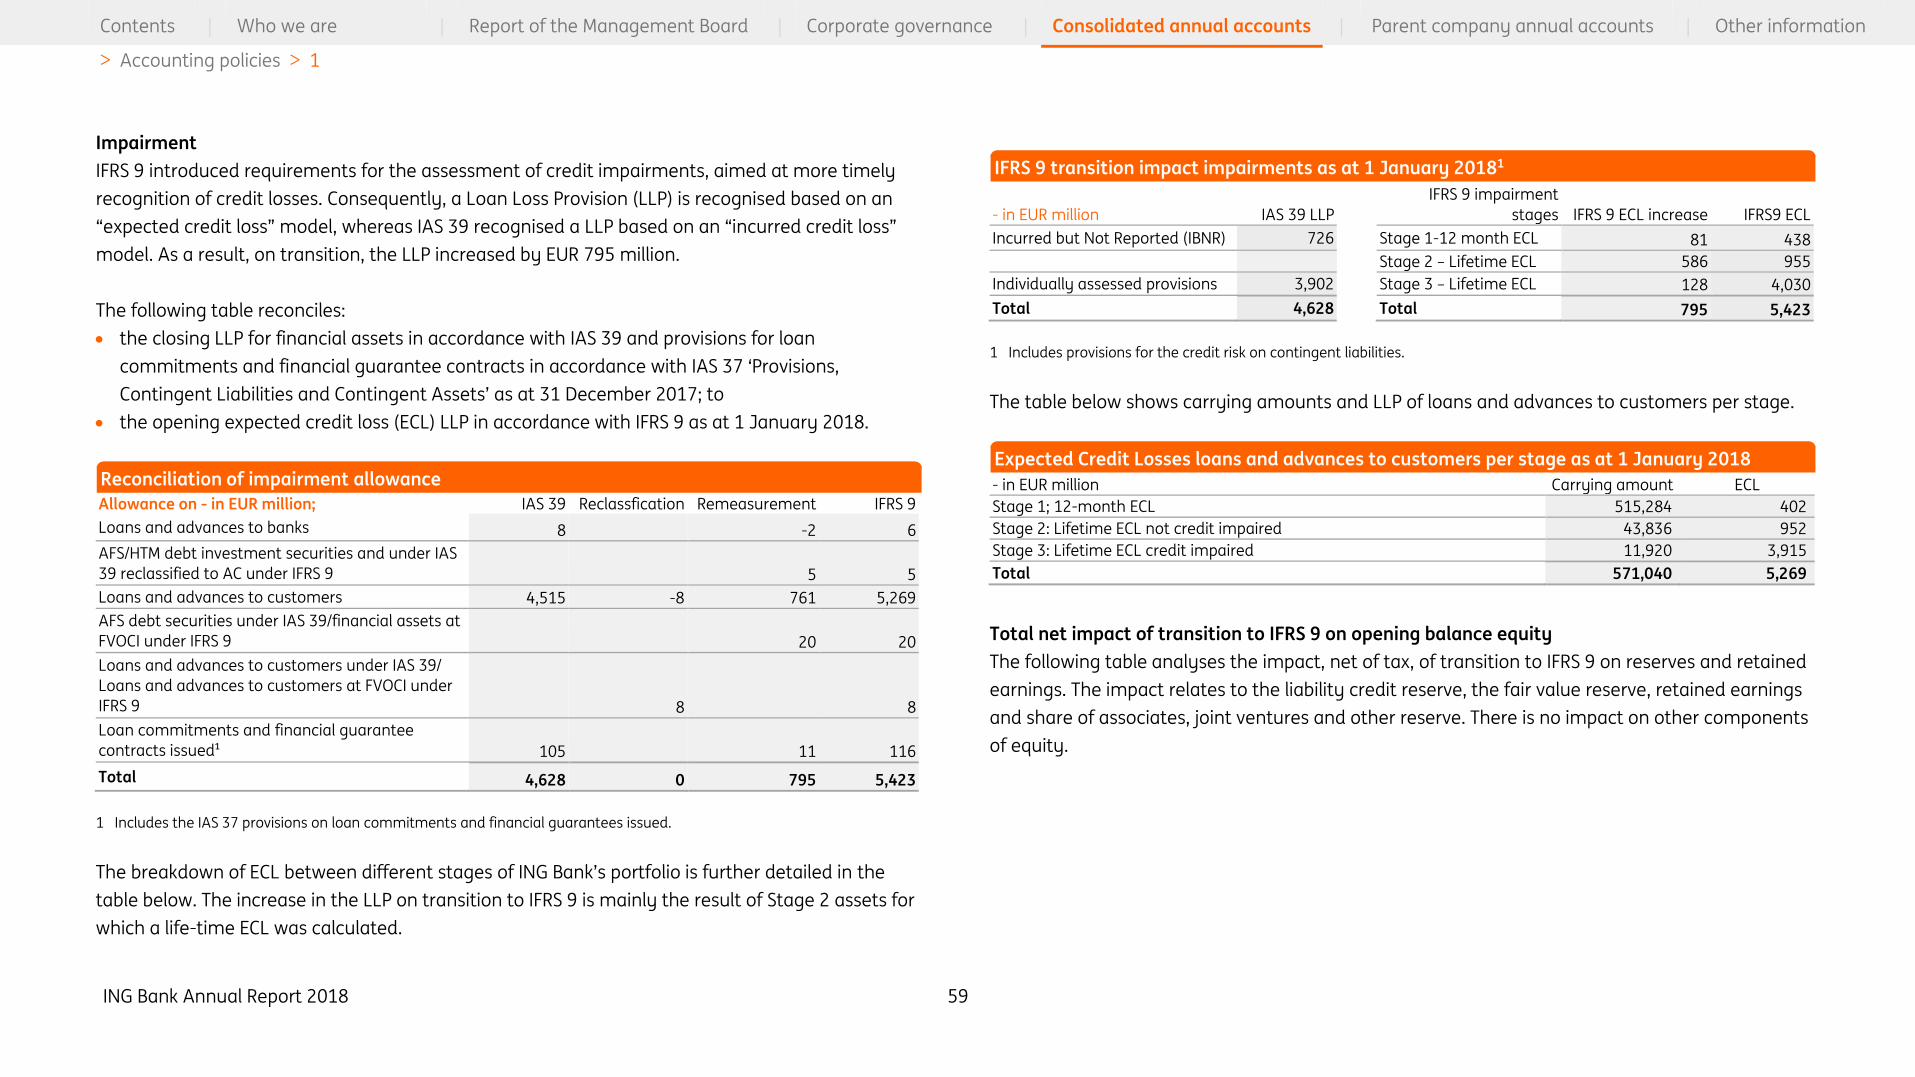
ING Bank Annual Report 2018 59
Contents | Who we are | Report of the Management Board | Corporate governance | Consolidated annual accounts | Parent company annual accounts | Other information
> Accounting policies > 1
Impairment
IFRS 9 introduced requirements for the assessment of credit impairments, aimed at more timely
recognition of credit losses. Consequently, a Loan Loss Provision (LLP) is recognised based on an
“expected credit loss” model, whereas IAS 39 recognised a LLP based on an “incurred credit loss”
model. As a result, on transition, the LLP increased by EUR 795 million.
The following table reconciles:
the closing LLP for financial assets in accordance with IAS 39 and provisions for loan
commitments and financial guarantee contracts in accordance with IAS 37 ‘Provisions,
Contingent Liabilities and Contingent Assets’ as at 31 December 2017; to
the opening expected credit loss (ECL) LLP in accordance with IFRS 9 as at 1 January 2018.
Allowance on - in EUR million; IAS 39 Reclassfication Remeasurement IFRS 9
Loans and advances to banks 8 -2 6
AFS/HTM debt investment securities and under IAS
39 reclassified to AC under IFRS 9 5 5
Loans and advances to customers 4,515 -8 761 5,269
AFS debt securities under IAS 39/financial assets at
FVOCI under IFRS 9 20 20
Loans and advances to customers under IAS 39/
Loans and advances to customers at FVOCI under
IFRS 9 8 8
Loan commitments and financial guarantee
contracts issued¹ 105 11 116
Total 4,628 0 795 5,423
1 Includes the IAS 37 provisions on loan commitments and financial guarantees issued.
The breakdown of ECL between different stages of ING Bank’s portfolio is further detailed in the
table below. The increase in the LLP on transition to IFRS 9 is mainly the result of Stage 2 assets for
which a life-time ECL was calculated.
- in EUR million IAS 39 LLP
IFRS 9 impairment
stages IFRS 9 ECL increase IFRS9 ECL
Incurred but Not Reported (IBNR) 726 Stage 1-12 month ECL 81 438
Stage 2 – Lifetime ECL 586 955
Individually assessed provisions 3,902 Stage 3 – Lifetime ECL 128 4,030
Total 4,628 Total 795 5,423
1 Includes provisions for the credit risk on contingent liabilities.
The table below shows carrying amounts and LLP of loans and advances to customers per stage.
- in EUR million Carrying amount ECL
Stage 1; 12-month ECL 515,284 402
Stage 2: Lifetime ECL not credit impaired 43,836 952
Stage 3: Lifetime ECL credit impaired 11,920 3,915
Total 571,040 5,269
Total net impact of transition to IFRS 9 on opening balance equity
The following table analyses the impact, net of tax, of transition to IFRS 9 on reserves and retained
earnings. The impact relates to the liability credit reserve, the fair value reserve, retained earnings
and share of associates, joint ventures and other reserve. There is no impact on other components
of equity.
Reconciliation of impairment allowance
IFRS 9 transition impact impairments as at 1 January 20181
Expected Credit Losses loans and advances to customers per stage as at 1 January 2018

ING Bank Annual Report 2018 60
Contents | Who we are | Report of the Management Board | Corporate governance | Consolidated annual accounts | Parent company annual accounts | Other information
> Accounting policies > 1
- in EUR million
Impact of adopting IFRS
9 at 1 January 2018
Liability credit reserve
Closing balance under IAS 39 (31 December 2017) 0
Reclassification of own credit risk for financial liabilities designated as at FVPL¹ -190
Opening balance under IFRS 9 (1 January 2018) -190
Fair value reserve
Closing balance under IAS 39 (31 December 2017) 3,650
Reclassification of investment securities (debt) from Available-for-sale to amortised cost -568
Reclassification of investment securities (equity) from Available-for-sale to FVPL -42
Reclassification of loans and advances to debt instruments at FVOCI 175
Opening balance under IFRS 9 (1 January 2018) 3,215
Share of associates, joint venture and other reserve
Closing balance under IAS 39 (31 December 2017) 2,473
Impact of application of IFRS 9 -23
Opening balance under IFRS 9 (1 January 2018) 2,450
Retained earnings
Closing balance under IAS 39 (31 December 2017) 22,291
Reclassifications under IFRS 9¹ 182
Recognition of ECL under IFRS 9 (including lease receivables, loan commitments and
financial guarantee contracts) -572
Opening balance under IFRS 9 (1 January 2018) 21,901
1 Net amount of reclassifications to retained earnings, to and from fair value reserves and to liability credit reserves, due to
changes in classification and measurement.
IFRS 9 Impact on Shareholders’ equity and (fully-loaded) CET1
Impact on
shareholders'
equity (in € bln)
Impact on FL
CET1 ratio
(in %-point)
Loan loss provisions -0.6
Investment portfolio -0.6
Mortgages held in HTC&S portfolio 0.2
Total impact –1.0 -0.2
Presentation
IFRS 9 resulted in changes to IAS 1 for the presentation of Interest income for instruments
calculated using the effective interest rate (EIR) method. The revised presentation requires it be
shown as a separate line item in the consolidated statement of profit or loss. To enhance the
relevance of the interest disclosures, ING Bank changed its separate presentation of interest (i.e.
‘split interest’) for trading derivatives, trading securities and trading loans / deposits (mainly repo’s)
to presenting the full fair value movements in ‘Valuation results and net trading income’. Similar
presentation was applied to interest expense. The presentation of accrued interest in the balance
sheet was also changed so that it is no longer separately presented, but rather included in the
corresponding balance sheet item of the host contract. The new interest presentation was applied
prospectively together with the other requirements of IFRS 9.
Impact (net of tax) of transition to IFRS 9 on reserves and retained earnings
Impact (net of tax) of adopting IFRS 9 on 1 January 2018
ING Bank Annual Report 2018 61
Contents | Who we are | Report of the Management Board | Corporate governance | Consolidated annual accounts | Parent company annual accounts | Other information
> Accounting policies > 1
1.3.1.2 IFRS 9 ‘Financial instruments’ - Accounting policies applied from 1 January
2018
Fair value and hedge accounting policies are included in the below section although these have
remained unchanged with the adoption of IFRS 9.
Recognition and derecognition of financial instruments
Recognition of financial assets
Financial assets are recognised in the balance sheet when ING becomes a party to the contractual
provisions of the instruments. Equity investments, debt securities financial assets and financial
assets measured at fair value through profit or loss that require delivery within the time frame
established by regulation or market convention (‘regular way’ purchases and sales) are recognised
using trade date accounting. Trade date is the date on which ING commits to purchase or sell the
asset. Loans and advances and repurchase agreements are recognised using settlement date
accounting.
Derecognition of financial assets
Financial assets are derecognised when the rights to receive cash flows from the financial assets
have expired or where ING Bank has transferred substantially all risks and rewards of ownership. If
ING Bank neither transfers nor retains substantially all the risks and rewards of ownership of a
financial asset, it derecognises the financial asset if it no longer has control over the asset. The
difference between the carrying amount of a financial asset that has been extinguished and the
consideration received is recognised in profit or loss.
Recognition of financial liabilities
Financial liabilities are recognised on the date that the entity becomes a party to the contractual
provisions of the instrument.
Derecognition of financial liabilities
Financial liabilities are derecognised from the Consolidated statement of financial position when
the obligation specified in the contract is discharged, cancelled or expired. The difference between
the carrying amount of a financial liability that has been extinguished and the consideration paid is
recognised in statement of profit or loss.
Classification and measurement of financial instruments (IFRS 9)
Financial assets
From 1 January 2018, ING Bank classifies its financial assets in the following measurement
categories:
those to be measured subsequently at fair value (either through OCI, or through profit or loss);
and
those to be measured at amortised cost (AC).
At initial recognition, ING Bank measures a financial asset at its fair value plus, in the case of a
financial asset not at FVPL, transaction costs that are directly attributable to the acquisition of the
financial asset. Transaction costs of financial assets carried at FVPL are expensed in the statement
of profit or loss.
Debt instruments
The classification depends on the entity’s business model for managing the financial assets and the
contractual terms of the cash flows at initial recognition.
Business models
Business models are classified as Hold to Collect (HtC), Hold to Collect and Sell (HtC&S) or Other
depending on how a portfolio of financial instruments as a whole is managed. ING Bank’s business
models are based on the existing management structure of the bank, and refined based on an
analysis of how businesses are evaluated and reported, how their specific business risks are
managed and on historic and expected future sales. Sales are permissible in a HtC business model
ING Bank Annual Report 2018 62
Contents | Who we are | Report of the Management Board | Corporate governance | Consolidated annual accounts | Parent company annual accounts | Other information
> Accounting policies > 1
when these are due to an increase in credit risk, take place close to the maturity date, are
insignificant in value (both individually and in aggregate) or are infrequent.
Contractual cash flows Solely Payments of Principal and Interest (SPPI)
The contractual cash flows of a financial asset are assessed to determine whether they represent
SPPI. Interest includes consideration for the time value of money, credit risk and also consideration
for liquidity risk and costs associated with holding the financial asset for a particular period of time.
In addition, interest can include a profit margin that is consistent with a basic lending arrangement.
Financial assets with embedded derivatives are considered in their entirety when determining
whether their cash flows are SPPI.
In assessing whether the contractual cash flows are SPPI, ING Bank considers the contractual terms
of the instrument. This includes assessing whether the financial asset contains a contractual term
that could change the timing or amount of contractual cash flows such that it would not meet this
condition. In making the assessment, terms such as the following are considered, with an example
of an SPPI failure for each consideration:
prepayment terms. For example a prepayment of an outstanding principal amount plus a
penalty which is not capped to three or six months of interest;
leverage features, which increase the variability of the contractual cash flows with the result
that they do not have the economic characteristics of interest. An example is a Libor contract
with a multiplier;
terms that limit ING Bank’s claim to cash flows from specified assets - e.g. non-recourse asset
arrangements. This could be the case if payments of principal and interest are met solely by the
cash flows generated by the underlying asset, for example instances in real estate, shipping and
aviation financing; and
features that modify consideration of the time value of money. These are contracts with for
example an interest rate which is reset every month to a one-year rate. ING Bank performs
either a qualitative or quantitative benchmark test on a financial asset with a modified time
value of money element. A qualitative test is performed when it is clear with little or no analysis
whether the contractual cash flows solely represent SPPI.
Based on the entity’s business model for managing the financial assets and the contractual terms
of the cash flows, there are three measurement categories into which ING Bank classifies its debt
instruments:
Amortised Cost:
Debt instruments that are held for collection of contractual cash flows under a HtC business
model where those cash flows represent SPPI are measured at AC. Interest income from these
financial assets is included in Interest income using the EIR method. Any gain or loss arising on
derecognition is recognised directly in profit or loss. Impairment losses are presented as a
separate line item in the Consolidated statement of profit or loss.
FVOCI:
Debt instruments that are held for collection of contractual cash flows and for selling the
financial assets under a HtC&S business model, where the assets’ cash flows represent SPPI, are
measured at FVOCI. Movements in the carrying amount are recognised in OCI, except for the
recognition of impairment gains or losses, interest revenue and foreign exchange gains and
losses which are recognised in profit or loss. When the financial asset is derecognised, the
cumulative gain or loss previously recognised in OCI is reclassified from equity to profit or loss
and recognised in Investment income or Other income, based on the specific characteristics of
the business model. Interest income from these financial assets is included in Interest income
using the EIR method. Impairment losses are presented as a separate line item in the
Consolidated statement of profit or loss.
FVPL:
Debt instruments that do not meet the criteria for AC or FVOCI are measured at FVPL. This
includes debt instruments that are held-for-trading. Fair value movements on trading loans and
deposits (mainly repo’s) are presented fully within valuation result and net trading income. ING
Bank may in some cases, on initial recognition, irrevocably designate a financial asset as
classified and measured at FVPL. This is the case where doing so eliminates or significantly
reduces an accounting mismatch that would otherwise arise on assets measured at AC or FVOCI.
The interest arising on a debt instrument that is part of a hedge relationship, but not subject to
hedge accounting, is recognised in profit or loss and presented within Interest income or Interest
expense in the period in which it arises. The interest arising on financial assets designated as at
ING Bank Annual Report 2018 63
Contents | Who we are | Report of the Management Board | Corporate governance | Consolidated annual accounts | Parent company annual accounts | Other information
> Accounting policies > 1
FVPL is recognised in profit or loss and presented within Interest income or Interest expense in
the period in which it arises.
ING Bank reclassifies debt investments when, and only when, its business model for managing
those assets changes.
Equity instruments
All equity investments are measured at fair value. ING Bank applies the fair value through OCI
option to investments which are considered strategic, consisting of investments that add value to
ING Bank’s core banking activities.
There is no subsequent recycling of fair value gains and losses to profit or loss following the
derecognition of investments if elected to be classified and measured as FVOCI. Dividends from
such investments continue to be recognised in profit or loss as Investment income when ING Bank’s
right to receive payments is established. Impairment requirements are not applicable to equity
investments classified and measured as FVOCI.
Other remaining equity investments are measured at FVPL. All changes in the fair value are
recognised in Valuation result and Net trading income in the Consolidated statement of profit or
loss as applicable.
Financial liabilities
Financial liabilities are classified and subsequently measured at AC, except for financial guarantee
contracts, derivatives and liabilities designated at FVPL. Financial liabilities classified and measured
at FVPL are presented as follows:
the amount of change in the fair value that is attributable to changes in own credit risk of the
liability is presented in OCI. Upon derecognition this Debt Valuation Adjustment (DVA) impact
does not recycle from OCI to profit or loss; and
the remaining amount of change in the fair value is presented in profit or loss.
A financial guarantee contract is a contract that requires ING Bank to make specified payments to
reimburse the holder for a loss it incurs because a specified debtor fails to make payment when
due in accordance with the original or modified terms of a debt instrument. Such a contract is
initially recognised at fair value and is subsequently measured at the higher of (a) the amount
determined in accordance with impairment provisions of IFRS 9 (see section “Impairment of
financial assets”) and (b) the amount initially recognised less, when appropriate, cumulative
amortisation recognised in accordance with the revenue recognition principle of IFRS 15.
Fair values of financial assets and liabilities
All financial assets and liabilities are recognised initially at fair value. Subsequently, only financial
assets and liabilities classified as held-for-trading or designated at FVPL and financial assets
classified as FVOCI are measured at fair value in the annual accounts.
Fair value is defined as the price that would be received to sell an asset or paid to transfer a liability
in an orderly transaction between market participants at the measurement date. It assumes that
market participants would use and take into account the characteristics of the asset or liability
when pricing the asset or liability. Fair values of financial assets and liabilities are based on
unadjusted quoted market prices where available. Such quoted market prices are primarily
obtained from exchange prices for listed financial instruments. Where an exchange price is not
available, quoted prices in an active market may be obtained from independent market vendors,
brokers, or market makers. In general, positions are valued at the bid price for a long position and
at the offer price for a short position or are valued at the price within the bid-offer spread that is
most representative of fair value in the circumstances. In some cases where positions are marked
at mid-market prices, a fair value adjustment is calculated.
For certain financial assets and liabilities, quoted market prices are not available. For such
instruments, fair value is determined using valuation techniques. These range from discounting of
cash flows to various valuation models, where relevant pricing factors including the market price of
underlying reference instruments, market parameters (volatilities, correlations and credit ratings),
and customer behaviour are taken into account. ING maximises the use of market observable

ING Bank Annual Report 2018 64
Contents | Who we are | Report of the Management Board | Corporate governance | Consolidated annual accounts | Parent company annual accounts | Other information
> Accounting policies > 1
inputs and minimises the use of unobservable inputs in determining the fair value. It can be
subjective dependent on the significance of the unobservable input to the overall valuation. All
valuation techniques used are subject to internal review and approval. Most data used in these
valuation techniques are validated on a daily basis when possible.
When a group of financial assets and liabilities are managed on the basis of their net risk
exposures, the fair value of a group of financial assets and liabilities are measured on a net portfolio
level.
To include credit risk in fair value, ING applies both Credit and Debit Valuation Adjustments (CVA,
DVA). Own issued debt and structured notes that are measured at fair value are adjusted for credit
risk by means of a DVA. Additionally, derivatives valued at fair value are adjusted for credit risk by a
CVA. The CVA is of a bilateral nature as both the credit risk on the counterparty as well as the credit
risk on ING are included in the adjustment. All input data that is used in the determination of the
CVA is based on market implied data. Additionally, wrong-way risk (when exposure to a
counterparty is increasing and the credit quality of that counterparty deteriorates) and right-way
risk (when exposure to a counterparty is increasing and the credit quality of that counterparty
improves) are taken into account in the measurement of the valuation adjustment. ING applies an
additional ‘Funding Valuation Adjustment’ (FVA) to the uncollateralised derivatives based on the
market price of funding liquidity.
Critical judgements and key estimation uncertainties:
Even if market prices are available, when markets are less liquid there may be a range of prices for
the same security from different price sources. Selecting the most appropriate price requires
judgement and could result in different estimates of fair value.
Valuation techniques are subjective in nature and significant judgement is involved in establishing
fair values for certain financial assets and liabilities. Valuation techniques involve various
assumptions regarding pricing factors. The use of different valuation techniques and assumptions
could produce significantly different estimates of fair value.
Price testing is performed to assess whether the process of valuation has led to an appropriate fair
value of the position and to an appropriate reflection of these valuations in the statement of profit
or loss. Price testing is performed to minimise the potential risks for economic losses due to
incorrect or misused models.
Reference is made to Note 36 ‘Fair value of assets and liabilities’ and Market risk in Note 50 ‘Risk
management’ for the basis of the determination of the fair value of financial instruments and
related sensitivities.
Credit risk management classification and maximum credit risk exposure
Credit risk management disclosures are provided in Note 50 ‘Risk management – Credit risk’
paragraph ‘Credit risk categories’.
The maximum credit risk exposure for items in the statement of financial position is generally the
carrying value for the relevant financial assets. For the off-balance sheet items the maximum credit
exposure is the maximum amount that could be required to be paid. Reference is made to Note 43
‘Contingent liabilities and commitments’ for these off-balance sheet items. Collateral received is not
taken into account when determining the maximum credit risk exposure.
The manner in which ING Bank manages credit risk and determines credit risk exposures for that
purpose is explained in Note 50 ‘Risk management – Credit risk’ paragraph ‘Credit Risk Appetite and
Concentration Risk Framework’.
Derivatives and hedge accounting
Derivatives are initially recognised at fair value on the date on which a derivative contract is
entered into and are subsequently measured at fair value. Fair values are obtained from quoted
market prices in active markets, including market transactions and valuation techniques (such as
ING Bank Annual Report 2018 65
Contents | Who we are | Report of the Management Board | Corporate governance | Consolidated annual accounts | Parent company annual accounts | Other information
> Accounting policies > 1
discounted cash flow models and option pricing models), as appropriate. All derivatives are carried
as assets when their fair value is positive and as liabilities when their fair value is negative. Fair
value movements on derivatives are presented in profit or loss in Valuation result and net trading
income, except for derivatives in either a formal hedge relationship and so-called economic hedges
that are not in a formal hedge accounting relationship where a component is presented separately
in interest result in line with ING’s risk management strategy.
Embedded derivatives are separated from financial liabilities and other non-financial contracts and
accounted for as a derivative if, and only if:
a) the economic characteristics and risks of the embedded derivative are not closely related to the
economic characteristics and risks of the host contract;
b) a separate instrument with the same terms as the embedded derivative would meet the
definition of a derivative; and
c) the combined instrument is not measured at fair value with changes in fair value reported in
profit or loss.
If an embedded derivative is separated, the host contract is accounted for as for a similar free-
standing contract.
The method of recognising the resulting fair value gain or loss depends on whether the derivative is
designated as a hedging instrument, and if so, the nature of the item being hedged. The Bank
designates certain derivatives as hedges of the fair value of recognised assets or liabilities or firm
commitments (fair value hedge), hedges of highly probable future cash flows attributable to a
recognised asset or liability or a forecast transaction (cash flow hedge), or hedges of a net
investment in a foreign operation. Hedge accounting is used for derivatives designated in this way
provided certain criteria are met.
At the inception of the transaction ING Bank documents the relationship between hedging
instruments and hedged items, its risk management objective, together with the methods selected
to assess hedge effectiveness. The Bank also documents its assessment, both at hedge inception
and on an ongoing basis, of whether the derivatives that are used in hedging transactions are
highly effective in offsetting changes in fair values or cash flows of the hedged items.
ING Bank applies fair value hedge accounting to portfolio hedges of interest rate risk (macro
hedging) under the EU carve-out. The EU carve-out macro hedging enables a group of derivatives
(or proportions) to be viewed in combination and jointly designated as the hedging instrument and
removes some of the limitations in fair value hedge accounting relating to hedging core deposits
and under-hedging strategies. Under the EU carve-out, hedge accounting may be applied to core
deposits and ineffectiveness only arises when the revised estimate of the amount of cash flows in
scheduled time buckets falls below the designated amount of that bucket.
ING Bank also applies fair value hedge accounting for portfolio hedges of interest rate risk (macro
hedging) under the EU carve-out to its retail operations. The net exposures of retail funding (savings
and current accounts) and retail lending (mortgages) are hedged. The hedging activities are
designated under a portfolio fair value hedge on the mortgages. Changes in the fair value of the
derivatives are recognised in the statement of profit or loss, together with the fair value adjustment
on the mortgages (hedged items) insofar as attributable to interest rate risk (the hedged risk).
Fair value hedges
Changes in the fair value of derivatives that are designated and qualify as fair value hedges are
recognised in the statement of profit or loss, together with fair value adjustments to the hedged
item attributable to the hedged risk. If the hedge relationship no longer meets the criteria for hedge
accounting, the cumulative adjustment of the hedged item is, in the case of interest bearing
instruments, amortised through the statement of profit or loss over the remaining term of the
original hedge or recognised directly when the hedged item is derecognised. For non-interest
bearing instruments, the cumulative adjustment of the hedged item is recognised in the statement
of profit or loss only when the hedged item is derecognised.
ING Bank Annual Report 2018 66
Contents | Who we are | Report of the Management Board | Corporate governance | Consolidated annual accounts | Parent company annual accounts | Other information
> Accounting policies > 1
Cash flow hedges
The effective portion of changes in the fair value of derivatives that are designated and qualify as
cash flow hedges are recognised in equity. The gain or loss relating to the ineffective portion is
recognised immediately in the statement of profit or loss. Amounts accumulated in equity are
recycled to the statement of profit or loss in the periods in which the hedged item affects net
result. When a hedging instrument expires or is sold, or when a hedge no longer meets the criteria
for hedge accounting, any cumulative gain or loss existing in equity at that time remains in equity
and is recognised when the forecast transaction is ultimately recognised in the statement of profit
or loss. When a forecast transaction is no longer expected to occur, the cumulative gain or loss that
was reported in equity is transferred immediately to the statement of profit or loss.
Net investment hedges
Hedges of net investments in foreign operations are accounted for in a similar way to cash flow
hedges. Any gain or loss on the hedging instrument relating to the effective portion of the hedge is
recognised in equity and the gain or loss relating to the ineffective portion is recognised
immediately in the statement of profit or loss. Gains and losses accumulated in equity are included
in the statement of profit or loss when the foreign operation is disposed.
Non-trading derivatives that do not qualify for hedge accounting
Derivative instruments that are used by the Bank as part of its risk management strategies, but
which do not qualify for hedge accounting under ING Bank’s accounting policies, are presented as
non-trading derivatives. Non-trading derivatives are measured at fair value with changes in the fair
value taken to the statement of profit or loss.
Offsetting of financial assets and financial liabilities
Financial assets and financial liabilities are offset, and the net amount reported, in the statement of
financial position when the Bank has a current legally enforceable right to set off the recognised
amounts and intends to either settle on a net basis or to realise the asset and settle the liability
simultaneously. Offsetting is applied to certain interest rate swaps for which the services of a
central clearing house are used. Offsetting is also applied to certain clients subject to cash pooling
arrangements where the intention to settle net is demonstrated via a physical transfer of cash
balances into a single netting account on a period end basis.
Repurchase transactions and reverse repurchase transactions
Securities sold subject to repurchase agreements (repos), securities lending and similar agreements
continue to be recognised in the consolidated statement of financial position. The counterparty
liability is measured at FVPL (designated) and included in Other financial liabilities at FVPL if the
asset is measured at FVPL. Otherwise, the counterparty liability is included in Deposits from banks,
Customer deposits, or Trading, as appropriate.
Securities purchased under agreements to resell (reverse repos), securities borrowings and similar
agreements are not recognised in the consolidated statement of financial position. The
consideration paid to purchase securities is recognised as Loans and advances to customers, Loans
and advances to banks, Other financial assets at FVPL or Trading assets, as appropriate. The
difference between the sale and repurchase price is treated as interest and amortised over the life
of the agreement using the effective interest method.
Impairment of financial assets (IFRS 9)
An ECL model is applied to on-balance sheet financial assets accounted for at AC and FVOCI such as
loans, debt securities and lease receivables, as well as off-balance sheet items such as undrawn
loan commitments, certain financial guarantees, and undrawn committed revolving credit facilities.
Under the ECL model ING Bank calculates the allowance for credit losses (loan loss provision, LLP)
by considering on a discounted basis the cash shortfalls it would incur in various default scenarios
for prescribed future periods and multiplying the shortfalls by the probability of each scenario
occurring. The LLP is the sum of these probability-weighted outcomes and the ECL estimates are
unbiased and include supportable information about past events, current conditions, and forecasts
of future economic conditions. ING Bank’s approach leverages the existing regulatory capital
models that use the Advanced Internal Ratings Based (AIRB) models for regulatory purposes.

ING Bank Annual Report 2018 67
Contents | Who we are | Report of the Management Board | Corporate governance | Consolidated annual accounts | Parent company annual accounts | Other information
> Accounting policies > 1
Three stage approach
Financial assets are classified in any of the below 3 Stages at each reporting date. A financial asset
can move between Stages during its lifetime. The Stages are based on changes in credit quality
since initial recognition and defined as follows:
Stage 1: 12 month ECL
Financial assets that have not had a significant increase in credit risk since initial recognition (i.e.
no Stage 2 or 3 triggers apply). Assets are classified as stage 1 upon initial recognition (with the
exception of purchased or originated credit impaired (POCI) assets) and have a provision for ECL
associated with the probability of default (PD) events occurring with the next 12 months (12
months ECL). For those financial assets with a remaining maturity of less than 12 months, a PD
is used that corresponds to the remaining maturity;
Stage 2: Lifetime ECL not credit impaired
Financial assets showing a significant increase in credit risk since initial recognition. A provision is
made for the life time ECL representing losses over the life of the financial instrument (lifetime
ECL); or
Stage 3: Lifetime ECL credit impaired
Financial instruments that are credit impaired require a life time provision.
Significant increase in credit risk
ING Bank established a framework, incorporating quantitative and qualitative indicators, to identify
and assess significant increases in credit risk (SICR). This is used to determine the appropriate ECL
Staging for each financial asset.
The main determinate of SICR is a quantitative test, whereby the lifetime PD of an asset at each
reporting date is compared against its lifetime PD at the date of origination or purchase. If the delta
is above pre-defined absolute or relative PD thresholds, then an asset is considered to have
experienced a SICR, which is a trigger for movement between Stage 1 and Stage 2. In these
instances, assets will cease reporting a 12 month ECL, and instead report a lifetime ECL. Assets can
also return to Stage 1 if there is sufficient evidence that there has been a significant reduction in
credit risk.
ING Bank relies on a number of qualitative indicators to identify and assess SICR. These include:
Forbearance status;
Watch List status. Loans on the Watch List are individually assessed for Stage 2 classification;
Intensive care management;
Substandard Internal rating; and
Arrears status.
Credit impaired financial assets (Stage 3)
Financial assets are assessed for credit-impairment at each reporting date and more frequently
when circumstances warrant further assessment. Evidence of credit-impairment includes arrears of
over 90 days on any material credit obligation, indications that the borrower is experiencing
significant financial difficulty, a breach of contract, bankruptcy or distressed restructuring.
An asset that is in stage 3 will move back to stage 2 when, as at the reporting date, it is no longer
considered to be credit-impaired. The asset will migrate back to stage 1 when its credit risk at the
reporting date is no longer considered to have increased significantly since initial recognition.
Definition of default
ING Bank has aligned the definition of credit impaired under IFRS 9 (Stage 3) with the definition of
default for prudential purposes. This is also the definition used for internal risk management
purposes.
Macroeconomic scenarios
ING has established a quarterly process whereby forward-looking macroeconomics scenarios and
probability weightings are developed for ECL calculation purposes. ING Bank applies data
predominantly from a leading service provider enriched with the internal ING Bank view. A baseline,
up-scenario and a down-scenario are determined to reflect an unbiased and probability-weighted
ECL amount. As a baseline scenario, ING Bank applies the market-neutral view combining
consensus forecasts for economic variables such as unemployment rates, GDP growth, house
ING Bank Annual Report 2018 68
Contents | Who we are | Report of the Management Board | Corporate governance | Consolidated annual accounts | Parent company annual accounts | Other information
> Accounting policies > 1
prices, commodity prices, and short-term interest rates. Applying market consensus in the baseline
scenario ensures unbiased estimates of the expected credit losses.
The alternative scenarios are based on observed forecast errors in the past, adjusted for the risks
affecting the economy today and the forecast horizon. The probabilities assigned are based on the
likelihoods of observing the three scenarios and are derived from confidence intervals on a
probability distribution. The forecasts for the economic variables are adjusted on a quarterly basis.
Measurement of ECL
ING Bank applies a collective assessment method to measure ECL for performing (Stage 1), under-
performing (Stage 2), and certain non-performing (Stage 3) assets. Other non-performing assets
subject to ECL measurement apply the individual assessment method, and are all in Stage 3.
Collectively assessed assets (Stages 1 to 3)
This is a model-based approach that calculates ECL in a formula that is expressed simplistically as
PD x EAD x LGD, adjusted for the time value of money. Assets that are collectively assessed are
grouped on the basis of similar credit risk characteristics, taking into account loan type, industry,
geographic location, collateral type, past due status and other relevant factors. These
characteristics are relevant to the estimation of future cash flows for groups of such assets by
being indicative of the debtors’ ability to pay all amounts due according to the contractual terms of
the assets being evaluated.
For Stage 3 assets the PD equals 100% and the LGD and EAD represent a lifetime view of the losses
based on characteristics of defaulted facilities.
To build the IFRS 9 models, ING Bank’s expected loss models (PD, LGD, EAD) used for regulatory and
capital purposes have been adjusted by removing embedded prudential conservatism (such as
floors) and converted through-the-cycle estimates to point-in-time estimates to support the
calculation of collective-assessment ECL under IFRS 9. The models assess ECL on the basis of
forward-looking macroeconomic forecasts and other inputs. For most financial assets, the expected
life is limited to the remaining maturity. For overdrafts and certain revolving credit facilities, such as
credit cards, the maturity is estimated based on historical data as these do not have a fixed term or
repayment schedule.
Individually assessed assets (Stage 3)
ING Bank estimates individual impairment provisions for individually significant credit impaired
financial assets within Stage 3. Individual provisions are calculated using the discounted expected
future cash flow method. To determine expected future cash flows, one or more scenarios are
used. Each scenario is analysed based on the probability of occurrence and including forward
looking information.
In determining the scenarios, all relevant factors impacting the future cash flows are taken into
account. These include expected developments in credit quality, business and economic forecasts,
and estimates of if/when recoveries will occur and taking into account ING’s restructuring/recovery
strategy.
The best estimate of ECL is calculated as the weighted-average of the shortfall (gross carrying
amount minus discounted expected future cash flow using the original EIR) per scenario, based on
best estimates of expected future cash flows. Recoveries can be from different sources including
repayment of the loan, collateral recovery, asset sale etc. Cash flows from collateral and other
credit enhancements are included in the measurement of the expected credit losses of the related
financial asset when it is part of or integral to the contractual terms of the financial asset and the
credit enhancement is not recognised separately. For the individual assessment, with granular
(company or deal-specific) scenarios, specific factors can have a larger impact on the future cash
flows than macroeconomic factors.
When a financial asset is credit-impaired, interest ceases to be recognised on the regular accrual
basis, which accrues income based on the gross carrying amount of the asset. Rather, interest
income is calculated by applying the original EIR to the AC of the asset, which is the gross carrying
amount less the related loan loss provision.
ING Bank Annual Report 2018 69
Contents | Who we are | Report of the Management Board | Corporate governance | Consolidated annual accounts | Parent company annual accounts | Other information
> Accounting policies > 1
Purchase or Originated Credit Impaired (POCI) assets
POCI assets are financial assets that are credit-impaired on initial recognition. Impairment on a
POCI asset is determined based on lifetime ECL from initial recognition. POCI assets are recognised
initially at an amount net of impairments and are measured at AC using a credit-adjusted effective
interest rate. In subsequent periods any changes to the estimated lifetime ECL are recognised in
profit or loss. Favourable changes are recognised as an impairment gain even if the lifetime ECL at
the reporting date is lower than the estimated lifetime ECL at origination.
Modifications
In certain circumstances ING grants borrowers postponement and/or reduction of loan principal
and/or interest payments for a temporary period of time to maximise collection opportunities, and
if possible, avoid default, foreclosure, or repossession. When such postponement and/or reduction
of loan principal and/or interest payments is executed based on credit concerns it is also referred to
as forbearance (refer to the Risk Management note for more details). In such cases, the net present
value of the postponement and/or reduction of loan and/or interest payments is taken into account
in the determination of the appropriate level of impairment loss. If the forbearance results in a
substantial modification of the terms of the loan, the original loan is derecognised and a new loan
is recognised at its fair value at the modification date. ING Bank determines whether there has
been a substantial modification using both quantitative and qualitative factors.
Write-off and debt forgiveness
If there is no reasonable expectation of recovery and/or collectability of amounts due a write-off
can occur. The following events can lead to a write-off:
After a restructuring has been completed and there is a high improbability of recovery of part of
the remaining loan exposure (including partial debt waivers);
In a bankruptcy liquidation scenario;
After divestment or sale of a credit facility at a discount;
Upon conversion of a credit facility into equity; or
ING Group releases a legal (monetary) claim it has on its customer.
When a loan is uncollectable, it is written off against the related loan loss provision. Subsequent
recoveries of amounts previously written off are recognised in the statement of profit or loss.
Debt forgiveness (or debt settlement) involves write-off but additionally involves the forgiveness of
a legal obligation, in whole or in part. This means that ING forfeits the legal right to recover the
debt. As a result, the financial asset needs to be derecognised. Distinction is made in situations
where ING ends the relationship with the client and situations where ING (partially) continues the
financing of the client.
Presentation of ECL
Loss allowances for financial assets measured at AC are deducted from the gross carrying amount
of the assets. For debt instruments at FVOCI, the loss allowance is recognised in OCI, instead of
deducting the carrying amount of the asset. For impaired financial assets with drawn and undrawn
components, ECL also reflects any credit losses related to the portion of the loan commitment that
is expected to be drawn down over the remaining life of the instrument. The loss allowance on
issued financial guarantee contracts, in scope of IFRS 9 and not measured at FVPL, are recognised
as liabilities and presented in Other provisions. ECL are presented in profit or loss in Addition to loan
loss provision.
Critical judgements and key estimation uncertainties:
Considerable management judgement is exercised in determining the amount of LLP for financial
assets assessed on both a collective and an individual impairment basis. In particular, this
judgement requires ING Bank to make various assumptions about the risk of default, the
subsequent expected loss rates in the event of default, and expected future cash flows. These
assumptions are based on a combination of the Bank’s past history, existing market conditions and
forward-looking estimates at the end of each reporting period. Changes in these assumptions may
lead to changes in the LLP over time.
Some of these judgements involve estimation. Given they are subjective and complex in nature,
and because the LLP and the underlying exposures subject to impairment assessment are material,
ING Bank Annual Report 2018 70
Contents | Who we are | Report of the Management Board | Corporate governance | Consolidated annual accounts | Parent company annual accounts | Other information
> Accounting policies > 1
these judgements are considered key sources of estimation uncertainty. The sensitivity of these
estimates is assessed in the credit risk section of Note 50, Risk Management.
The critical judgements are:
The use of forward-looking macroeconomic scenarios in both collective and individual impairment
assessments. Forward-looking macroeconomic scenarios are subjective and uncertain in nature.
The process the Bank follows involves using inputs from third party provider Oxford Economics (OE),
and subjecting these to internal expert review and challenge to ensure the inputs used in the
models reflect ING’s view on the macro economy. Two internal groups, the Macroeconomics
Scenarios Team and the Macroeconomics Scenarios Expert Panel, were established for this purpose.
The latter team consists of senior management representatives from the Business, Risk and
Finance. The use of alternate forward-looking macroeconomic scenarios can produce significantly
different estimates of ECL. This is demonstrated in the sensitivity analysis in Note 50, where the un-
weighted ECL under each of the three scenarios for some significant portfolios is disclosed.
The probability weights applied to each of the three scenarios. This is a management judgement
that ultimately requires estimation and consideration of the range of possibilities. This ensures
consensus view on the likelihood of each scenario materializing is appropriately reflected in the
weights applied by the Bank for collective assessment ECL calculations. The sensitivity analysis in
Note 50 discloses these weights used.
The criteria for identifying a significant increase in credit risk. When determining whether the credit
risk on a financial asset has increased significantly, ING Bank considers reasonable and supportable
information available to compare the risk of default occurring at reporting date with the risk of a
default occurring at initial recognition of the financial asset. Whilst judgement is required in
applying each financial asset with a PD rating, there is significant judgement used in determining
the stage allocation PD banding thresholds. The process of comparing a financial asset’s PD with
the PD banding thresholds determines its ECL stage. Assets in Stage 1 are allocated a 12 month
ECL, and those in Stage 2 are allocated a lifetime ECL, and the difference is often significant. As
such, the assumptions made both in assigning financial asset PDs and in setting PD banding
thresholds constitute a key source of estimation uncertainty. Analysis of the sensitivity associated
with the assessment of significant increase in credit risk is presented in Note 50, Risk Management.
The definition of default. Whilst not a source of estimation uncertainty, judgement is exercised in
management’s evaluation of whether there is objective evidence of impairment loss has been
incurred for larger exposures. Management judgement is required in assessing evidence of credit-
impairment.
1.3.1.3 Financial instruments prior to 1 January 2018 under IAS 39
The following is applicable to periods prior to 1 January 2018 for financial instruments accounted
for under IAS 39, to the extent not already discussed earlier in this section. Comparative periods
were not restated for the adoption of IFRS 9.
Classification and measurement of financial assets and financial liabilities (IAS 39)
Financial assets and liabilities designated at fair value through profit or loss
Management will designate a financial asset or a financial liability as such only if this eliminates a
measurement inconsistency, if the related assets and liabilities are managed on a fair value basis
or classified as an embedded derivative as described below.
Interest income and expense from financial instruments classified at fair value through profit or
loss is recognised in Interest income using the effective interest method (where applicable). The
remaining changes in fair value of such instruments are recognised in Valuation results and net
trading income in the statement of profit or loss. Dividend income from equity instruments
classified at fair value through profit or loss is generally recognised in ‘Valuation results and net
trading income’ in the statement of profit or loss when the dividend has been declared.
ING Bank Annual Report 2018 71
Contents | Who we are | Report of the Management Board | Corporate governance | Consolidated annual accounts | Parent company annual accounts | Other information
> Accounting policies > 1
Embedded derivatives
Certain derivatives embedded in other contracts are measured as separate derivatives when their
economic characteristics and risks are not closely related to those of the host contract, the host
contract is not carried at fair value through profit or loss, and if a separate instrument with the
same terms as the embedded derivative would meet the definition of a derivative. These
embedded derivatives are measured at fair value with changes in fair value recognised in the
statement of profit or loss. An assessment is carried out when ING Bank first becomes party to the
contract. A reassessment is carried out only when there is a change in the terms of the contract
that significantly modifies the expected cash flows.
Investments
Investments (including loans quoted in active markets) are classified either as held-to-maturity or
available-for-sale. Investment debt securities and loans quoted in active markets with fixed
maturity where management has both the intent and the ability to hold to maturity are classified
as held-to-maturity. Investment securities and quoted loans intended to be held for an indefinite
period of time, which may be sold in response to needs for liquidity or changes in interest rates,
exchange rates or equity prices, are classified as available-for-sale financial assets.
Available-for-sale financial assets
Available-for-sale financial assets include available-for-sale debt securities and available-for-sale
equity securities. Available-for-sale financial assets are initially recognised at fair value plus
transaction costs. For available-for-sale debt securities, the difference between cost and
redemption value is amortised. Interest income is recognised using the effective interest method.
Available-for-sale financial assets are subsequently measured at fair value. Interest income from
debt securities classified as available-for-sale is recognised in Interest income in the statement of
profit or loss. Dividend income from equity instruments classified as available-for-sale is recognised
in Investment income in the statement of profit or loss when the dividend has been declared.
Unrealised gains and losses arising from changes in the fair value are recognised in equity and are
recycled to the statement of profit or loss as Investment income when the asset is disposed.
Investments in prepayment sensitive securities such as Interest-Only and Principal-Only strips are
generally classified as available-for-sale.
Held-to-maturity investments
Non-derivative financial assets with fixed or determinable payments and fixed maturity for which
ING Bank has the positive intent and ability to hold to maturity and which are designated by
management as held-to-maturity assets are initially recognised at fair value plus transaction costs.
Subsequently, they are carried at AC using the effective interest method less any impairment
losses. Interest income from debt securities classified as held-to-maturity is recognised in Interest
income in the statement of profit or loss using the effective interest method. Held-to-maturity
investments include only debt securities.
Loans and receivables
Loans and receivables are non-derivative financial assets with fixed or determinable payments that
are not quoted in an active market. They are initially recognised at fair value plus transaction costs.
Subsequently, they are carried at AC using the effective interest method less any impairment
losses. Loans and receivables include Cash and balances with central banks, Loans and advances to
banks, Loans and advances to customers, and some categories of Other assets and are reflected in
these line items in the statement of financial position. Interest income from loans and receivables is
recognised in Interest income in the statement of profit or loss using the effective interest method.
Impairments of financial assets at amortised cost (loan loss provisions) (IAS 39)
ING Bank assesses periodically and at each balance sheet date whether there is objective evidence
that a financial asset or group of financial assets is impaired. A financial asset or a group of
financial assets is impaired and impairment losses are incurred if, and only if, there is objective
evidence of impairment as a result of one or more events that occurred after the initial recognition
of the asset, but before the balance sheet date, (a loss event) and that loss event (or events) has an
impact on the estimated future cash flows of the financial asset or group of financial assets that
can be reliably estimated. The following circumstances, among others, are considered objective
evidence that a financial asset or group of assets is impaired:

ING Bank Annual Report 2018 72
Contents | Who we are | Report of the Management Board | Corporate governance | Consolidated annual accounts | Parent company annual accounts | Other information
> Accounting policies > 1
The borrower has sought or has been placed in bankruptcy or similar protection and this leads to
the avoidance of or delays in repayment of the financial asset;
The borrower has failed in the repayment of principal, interest, or fees and the payment failure
has remained unsolved for a certain period;
The borrower has demonstrated significant financial difficulty, to the extent that it will have a
negative impact on the expected future cash flows of the financial asset;
The credit obligation has been restructured for non-commercial reasons. ING Bank has granted
concessions, for economic or legal reasons relating to the borrower’s financial difficulty, the
effect of which is a reduction in the expected future cash flows of the financial asset; and
Historical experience, updated for current events where necessary, provides evidence that a
proportion of a group of assets is impaired although the related events that represent
impairment triggers are not yet captured by ING Bank’s credit risk systems.
Losses expected as a result of future events, no matter how likely, are not recognised.
ING Bank first assesses whether objective evidence of impairment (a loss event/trigger) exists
individually for financial assets that are individually significant, and then individually or collectively
for financial assets that are not individually significant. If ING Bank determines that no objective
evidence of impairment (a loss event/trigger) exists for an individually assessed financial asset,
whether significant or not, it includes the asset in a group of financial assets with similar credit risk
characteristics and collectively assesses them for impairment. Assets that are individually assessed
for impairment and for which an impairment loss is or continues to be recognised are not included
in a collective assessment of impairment.
If there is objective evidence that an impairment loss on an asset carried at AC has been incurred,
the amount of the loss is measured as the difference between the asset’s carrying amount and the
present value of estimated future cash flows (excluding future credit losses that have not been
incurred) discounted at the financial asset’s original effective interest rate. The carrying amount of
the asset is reduced through the use of an allowance account (loan loss provision) and the amount
of the loss is recognised in the statement of profit or loss under Addition to loan loss provision. If
the asset has a variable interest rate, the discount rate for measuring any impairment loss is the
current effective interest rate determined under the contract.
If, in a subsequent period, the amount of the impairment loss decreases and the decrease can be
related objectively to an event occurring after the impairment was recognised (such as an
improvement in the debtor’s credit rating), the previously recognised impairment loss is reversed
by adjusting the provision. The amount of the reversal is recognised in the statement of profit or
loss.
Impairments on other debt instruments (Loans and held-to-maturity investments) are part of the
loan loss provision as described above.
Impairment of AFS assets
At each balance sheet date, ING Bank assesses whether there is objective evidence that a financial
asset or a group of financial assets is impaired. In the specific case of equity investments classified
as available-for-sale, a significant or prolonged decline in the fair value of the security below its cost
is considered in determining whether the assets are impaired. Significant and prolonged are
interpreted on a case-by-case basis for specific equity securities; generally 25% and six months are
used as triggers. If any objective evidence exists for available-for-sale debt and equity investments,
the cumulative loss, measured as the difference between the acquisition cost and the current fair
value, less any impairment loss on that financial asset previously recognised in net result, is
removed from equity and recognised in the statement of profit or loss. Impairment losses
recognised on equity instruments can never be reversed. If, in a subsequent period, the fair value of
a debt instrument classified as available-for-sale increases and the increase can be objectively
related to an event occurring after the impairment loss was recognised in the statement of profit or
loss, the impairment loss is reversed through the statement of profit or loss.
ING Bank Annual Report 2018 73
Contents | Who we are | Report of the Management Board | Corporate governance | Consolidated annual accounts | Parent company annual accounts | Other information
> Accounting policies > 1
1.3.2 IFRS 15 ‘Revenue from Contract with Customers’
IFRS 15 is effective for annual periods beginning on or after 1 January 2018 and has been endorsed
by the EU. IFRS 15 introduces a five-step approach for recognising revenue as and when the agreed
performance obligations are satisfied. Agreed performance obligations are individual promises
made to the customer that deliver benefit from the customer’s perspective. Revenue should either
be recognised at a point-in-time or over-time depending on the service being delivered to the
customer. The adoption of IFRS 15 had no significant impact on ING Bank’s results or financial
position.
Reference is made to Note 22 ‘Net fee and commission income’ which includes disaggregated
revenue categories based on the type of services provided. Note 32 ‘Segments’ includes Net fee
and commission income, as reported to the Executive Board of ING Bank and the Management
Board of ING Bank, disaggregated by line of business and by geographical segment.
1.4 Significant judgements and critical accounting estimates and
assumptions
The preparation of the consolidated annual accounts requires management to make judgements in
the process of applying its accounting policies and to use estimates and assumptions. The
estimates and assumptions affect the reported amounts of the assets and liabilities and the
amounts of the contingent liabilities at the balance sheet date, as well as reported income and
expenses for the year. The actual outcome may differ from these estimates. The process of setting
assumptions is subject to internal control procedures and approvals.
ING Bank has identified areas that require management to make significant judgements and use
critical accounting estimates and assumptions based on the information and financial data that
may change in future periods. These areas are:
The determination of the fair values of financial assets and liabilities;
Loan loss provisions; and
Provisions.
For further discussion of the significant judgements and critical accounting estimates and
assumptions in these areas, reference is made to the relevant parts in sections 1.3.1.2 ‘IFRS 9
Financial instruments - Accounting policies applied from 1 January 2018’, 1.5 ‘Principles of
valuation and determination of results’ and the applicable notes to the Consolidated annual
accounts.
1.5 Principles of valuation and determination of results Consolidation
ING Bank (the Bank) comprises ING Bank N.V. (the Parent Company) and all other subsidiaries.
Subsidiaries are entities controlled by ING Bank N.V. Control exists if ING Bank N.V. is exposed or has
rights to variable returns and has the ability to affect those returns through the power over the
investee. Control is usually achieved through situations including, but not limited to:
Ownership, directly or indirectly, of more than half of the voting power;
Ability to appoint or remove the majority of the board of directors;
Power to govern operating and financial policies under statute or agreement; and
Power over more than half of the voting rights through an agreement with other investors.
The existence and effect of potential voting rights that are currently exercisable or convertible are
considered in assessing whether Bank controls another entity.
For interests in structured entities, the existence of control requires judgment as these entities are
designed so that voting or similar rights are not the dominant factor in deciding who controls the
entity. This judgment includes, for example, the involvement in the design of the structured entity,
contractual arrangements that give rights to direct the structured entities relevant activities and
commitment to ensure that the structured entity operates as designed.
A list of principal subsidiaries is included in Note 46 ‘Principal subsidiaries’.

ING Bank Annual Report 2018 74
Contents | Who we are | Report of the Management Board | Corporate governance | Consolidated annual accounts | Parent company annual accounts | Other information
> Accounting policies > 1
A list containing the information referred to in Section 379 (1), Book 2 of the Dutch Civil Code has
been filed with the office of the Commercial Register of Amsterdam, in accordance with Section 379
(5), Book 2 of the Dutch Civil Code.
The results of the operations and the net assets of subsidiaries are included in the statement of
profit or loss and the statement of financial position from the date control is obtained until the date
control is lost. On disposal, the difference between the sales proceeds, net of directly attributable
transaction costs, and the net assets is included in net result.
A subsidiary which ING Bank has agreed to sell but is still legally owned by ING Bank may still be
controlled by Bank at the balance sheet date and therefore, still be included in the consolidation.
Such a subsidiary may be presented as a held for sale disposal group if certain conditions are met.
All intercompany transactions, balances and unrealised surpluses and deficits on transactions
between group companies are eliminated. Where necessary, the accounting policies used by
subsidiaries are changed to ensure consistency with group policies. In general, the reporting dates
of subsidiaries are the same as the reporting date of ING Bank N.V.
ING Bank N.V. and its Dutch group companies are subject to legal restrictions regarding the amount
of dividends they can pay to their shareholders. The Dutch Civil Code contains the restriction that
dividends can only be paid up to an amount equal to the excess of the company’s own funds over
the sum of the paid-up capital and reserves required by law. Additionally, certain Bank companies
are subject to restrictions on the amount of funds they may transfer in the form of dividends, or
otherwise, to the parent company.
Furthermore, in addition to the restrictions in respect of minimum capital requirements that are
imposed by industry regulators in the countries in which the subsidiaries operate, other limitations
exist in certain countries.
Segment reporting
An operating segment is a distinguishable component of the Bank, engaged in providing products
or services, whose operating results are regularly reviewed by the Executive Board of ING Bank and
the Management Board Banking (together the Chief Operating Decision Maker (CODM)) to make
decisions about resources to be allocated to the segments and assess its performance. A
geographical area is a distinguishable component of the Bank engaged in providing products or
services within a particular economic environment that is subject to risks and returns that are
different from those of segments operating in other economic environments.
The CODM examines ING Bank’s performance both by line of business and geographic perspective
and has identified five reportable segments by line of business and six by geographical area. The
geographical analyses are based on the location of the office from which the transactions are
originated.
Foreign currency translation
Functional and presentation currency
Items included in the annual accounts of each of the Bank’s entities are measured using the
currency of the primary economic environment in which the entity operates (the functional
currency). The Consolidated annual accounts are presented in euros, which is Bank’s presentation
currency.
Transactions and balances
Foreign currency transactions are translated into the functional currency using the exchange rate
prevailing at the date of the transactions. Exchange rate differences resulting from the settlement
of such transactions and from the translation at year-end exchange rates of monetary assets and
liabilities denominated in foreign currencies are recognised in the statement of profit or loss, except
when deferred in equity as part of qualifying cash flow hedges or qualifying net investment hedges.
Non-monetary items that are measured in terms of historical cost in a foreign currency are
translated using the exchange rate at the date of the transaction.

ING Bank Annual Report 2018 75
Contents | Who we are | Report of the Management Board | Corporate governance | Consolidated annual accounts | Parent company annual accounts | Other information
> Accounting policies > 1
Exchange rate differences on non-monetary items, measured at fair value through profit or loss,
are reported as part of the fair value gain or loss. Non-monetary items are retranslated at the date
fair value is determined. Exchange rate differences on non-monetary items measured at fair value
through the revaluation reserve are included in the revaluation reserve in equity.
Exchange rate differences in the statement of profit or loss are generally included in ‘Valuation
results and net trading income’. Reference is made to Note 23 ‘Valuation results and net trading
income’, which discloses the amounts included in the statement of profit or loss. Exchange rate
differences relating to the disposal of debt and FVPL equity securities are considered to be an
inherent part of the capital gains and losses recognised in Investment income. As mentioned
below, in Bank companies relating to the disposals of group companies, any exchange rate
difference deferred in equity is recognised in the statement of profit or loss in ‘Result on disposal of
group companies’. Reference is also made to Note 20 ‘Equity’, which discloses the amounts
included in the statement of profit or loss.
Group companies
The results and financial positions of all group companies that have a functional currency different
from the presentation currency are translated into the presentation currency as follows:
Assets and liabilities included in each statement of financial position are translated at the closing
rate at the date of that statement of financial position;
Income and expenses included in each statement of profit or loss are translated at average
exchange rates (unless this average is not a reasonable approximation of the cumulative effect
of the rates prevailing on the transaction dates, in which case income and expenses are
translated at the dates of the transactions); and
All resulting exchange rate differences are recognised in a separate component of equity.
On consolidation, exchange rate differences arising from the translation of a monetary item that
forms part of the net investment in a foreign operation, and of borrowings and other instruments
designated as hedges of such investments, are taken to shareholders’ equity. When a foreign
operation is sold, the corresponding exchange rate differences are recognised in the statement of
profit or loss as part of the gain or loss on sale.
Goodwill and fair value adjustments arising from the acquisition of a foreign operation are treated
as assets and liabilities of the foreign operation and translated at the exchange rate prevailing at
the balance sheet date.
Investments in associates and joint ventures
Associates are all entities over which the Bank has significant influence but not control. Significant
influence is the ability to participate in the financial and operating policies of the investee. It
generally results from a shareholding of between 20% and 50% of the voting rights or through
situations including, but not limited to one or more of the following:
Representation on the board of directors;
Participation in the policymaking process; and
Interchange of managerial personnel.
Joint ventures are entities over which the Bank has joint control. Joint control is the contractually
agreed sharing of control over an arrangement or entity, which exists only when decisions about
the relevant activities require the unanimous consent of the parties sharing control. Joint control
means that no party to the agreement is able to act unilaterally to control the activity of the entity.
The parties to the agreement must act together to control the entity and therefore exercise the
joint control.
Investments in associates and joint ventures are initially recognised at cost and subsequently
accounted for using the equity method of accounting.
The Bank’s investment in associates and joint ventures (net of any accumulated impairment loss)
includes goodwill identified on acquisition. The Bank’s share of its associates and joint ventures
post-acquisition profits or losses is recognised in the statement of profit or loss, and its share of
post-acquisition changes in reserves is recognised in equity. The cumulative post-acquisition

ING Bank Annual Report 2018 76
Contents | Who we are | Report of the Management Board | Corporate governance | Consolidated annual accounts | Parent company annual accounts | Other information
> Accounting policies > 1
changes are adjusted against the carrying amount of the investment. When the Bank’s share of
losses in an associate or joint venture equals or exceeds its interest in the associate or joint venture,
including any long-term interests in the associate like uncollateralised loans that are neither
planned nor likely to be settled in the foreseeable future, the Bank does not recognise further
losses, unless it has incurred obligations or made payments on behalf of the associate or joint
venture.
Unrealised gains on transactions between the Bank and its associates and joint ventures are
eliminated to the extent of the Bank’s interest in the associates and joint ventures. Unrealised
losses are also eliminated unless they provide evidence of an impairment of the asset transferred.
Accounting policies of associates and joint ventures have been changed where necessary to ensure
consistency with the policies adopted by the Bank. The reporting dates of all significant associates
and joint ventures are consistent with the reporting date of the Bank.
Property and equipment
Property in own use
Land and buildings held for own use are stated at fair value at the balance sheet date. Increases in
the carrying amount arising on revaluation of land and buildings held for own use are credited to
the revaluation reserve in shareholders’ equity. Decreases in the carrying amount that offset
previous increases of the same asset are charged against the revaluation reserve directly in equity;
all other decreases are charged to the statement of profit or loss. Increases that reverse a
revaluation decrease on the same asset previously recognised in net result are recognised in the
statement of profit or loss. Depreciation is recognised based on the fair value and the estimated
useful life (in general 20–50 years). Depreciation is calculated on a straight-line basis. On disposal,
the related revaluation reserve is transferred to retained earnings.
The fair values of land and buildings are based on regular appraisals done by independent qualified
valuers or by internal valuers, similar to appraisals of real estate investments. Subsequent
expenditure is included in the asset’s carrying amount when it is probable that future economic
benefits associated with the item will flow to the Bank and the cost of the item can be measured
reliably.
Equipment
Equipment is stated at cost less accumulated depreciation and any impairment losses. The cost of
the assets is depreciated on a straight line basis over their estimated useful lives, which are
generally as follows: for data processing equipment two to five years, and four to ten years for
fixtures and fittings. Expenditure incurred on maintenance and repairs is recognised in the
statement of profit or loss as incurred. Expenditure incurred on major improvements is capitalised
and depreciated.
Disposals of property and equipment
The difference between the proceeds on disposal and net carrying value is recognised in the
statement of profit or loss under Other income.
Leases
The determination of whether an arrangement is or contains a lease is based on the substance of
the arrangement at inception date.
ING Bank as the lessee
The leases entered into by ING Bank are primarily operating leases. The total payments made
under operating leases are recognised in the statement of profit or loss on a straight-line basis over
the period of the lease.
When an operating lease is terminated before the lease period has expired, any penalty payment
to be made to the lessor is recognised as an expense in the period in which termination takes place.
ING Bank as the lessor
When assets are held subject to a finance lease, the present value of the lease payments is
recognised as a receivable under Loans and advances to customers or Loans and advances to
banks. The difference between the gross receivable and the present value of the receivable is
unearned lease finance income. Lease income is recognised over the term of the lease using the
net investment method (before tax), which reflects a constant periodic rate of return.
ING Bank Annual Report 2018 77
Contents | Who we are | Report of the Management Board | Corporate governance | Consolidated annual accounts | Parent company annual accounts | Other information
> Accounting policies > 1
Acquisitions, goodwill and other intangible assets
Acquisitions and goodwill
ING Bank’s acquisitions are accounted for using the acquisition method of accounting. The
consideration for each acquisition is measured at the aggregate of the fair values (at the date of
exchange) of assets given, liabilities incurred or assumed, and equity instruments issued in
exchange for control of the acquiree. Goodwill, being the difference between the cost of the
acquisition (including assumed debt) and the Bank’s interest in the fair value of the acquired assets,
liabilities and contingent liabilities as at the date of acquisition, is capitalised as an intangible asset.
Goodwill is only recognised separately on acquisitions. The results of the operations of the acquired
companies are included in the statement of profit or loss from the date control is obtained.
Where applicable, the consideration for the acquisition includes any asset or liability resulting from
a contingent consideration arrangement, the contingent consideration is measured at its
acquisition-date fair value. Contingent consideration arrangements classified as an asset or a
liability, are subsequently measured at fair value and the changes in fair value will be recognised in
the statement of profit or loss. Changes in the fair value of the contingent consideration classified
as equity, are not recognised.
Where a business combination is achieved in stages, ING Bank’s previously held interests in the
assets and liabilities of the acquired entity are remeasured to fair value at the acquisition date (i.e.
the date ING Bank obtains control) and the resulting gain or loss, if any, is recognised in the
statement of profit or loss. Amounts arising from interests in the acquiree prior to the acquisition
date that have previously been recognised in other comprehensive income are reclassified to the
statement of profit or loss, where such treatment would be appropriate if that interest were
disposed of. Acquisition related costs are recognised in the statement of profit or loss as incurred
and presented in the statement of profit or loss as Other operating expenses.
The initial accounting for the fair value of the net assets of the companies acquired during the year
may be determined only provisionally as the determination of the fair value can be complex and
the time between the acquisition and the preparation of the Annual accounts can be limited. The
initial accounting shall be completed within a year after acquisition. Adjustments to the fair value
as at the date of acquisition of acquired assets and liabilities, that are identified within one year
after acquisition are recognised as an adjustment to goodwill; any subsequent adjustment is
recognised as income or expense. On disposal of group companies where control is lost, the
difference between the sale proceeds and carrying value (including goodwill) and the unrealised
results (including the currency translation reserve in equity) is included in the statement of profit or
loss.
Goodwill impairment
ING assesses at each reporting period, whether there is an indication that an intangible asset may
be impaired. Irrespective of whether there is an indication of impairment, intangible assets with an
indefinite useful life, including goodwill acquired in a business combination, and intangible assets
not yet available for use, are tested annually for impairment. Goodwill is allocated to groups of
CGUs (that is, the group of cash generating units or CGUs) for the purpose of impairment testing.
These groups of CGUs represent the lowest level at which goodwill is monitored for internal
management purposes. Goodwill is tested for impairment by comparing the carrying value of the
group of CGUs to the recoverable amount of that group of CGUs. The carrying value is determined
as the IFRS net asset value including goodwill. In compliance with IAS 36 ‘Impairment of assets’, the
carrying value is determined on a basis that is consistent with the way in which the recoverable
amount of the CGU is determined. When the carrying values need to be allocated between Retail
and Wholesale, solvency (risk-weighted assets) are used as a basis. The recoverable amount is
estimated as the higher of fair value less costs of disposal and value in use. Several methodologies
are applied to arrive at the best estimate of the recoverable amount. Impairment of goodwill, if
applicable, is included in the statement of profit or loss in Other operating expenses.
Computer software
Computer software that has been purchased or generated internally for own use is stated at cost
less amortisation and any impairment losses. Amortisation is calculated on a straight-line basis
over its useful life. This period will generally not exceed five years. Amortisation is included in Other
operating expenses.
ING Bank Annual Report 2018 78
Contents | Who we are | Report of the Management Board | Corporate governance | Consolidated annual accounts | Parent company annual accounts | Other information
> Accounting policies > 1
Other intangible assets
Other intangible assets are capitalised and amortised over their expected economic life, which is
generally between three and ten years. Intangible assets with an indefinite life are not amortised.
Taxation
Income tax on the result for the year comprises current and deferred tax. Income tax is recognised
in the statement of profit or loss but it is recognised directly in equity if the tax relates to items that
are recognised directly in equity.
Deferred income tax
Deferred income tax is provided in full, using the liability method, on temporary differences arising
between the tax basis of assets and liabilities and their carrying amounts in the consolidated
annual accounts. Deferred income tax is determined using tax rates (and laws) that have been
enacted or substantively enacted by the balance sheet date and are expected to apply when the
related deferred income tax asset is realised or the deferred income tax liability is settled. Deferred
tax assets and liabilities are not discounted.
Deferred tax assets are recognised where it is probable that future taxable profit will be available
against which the temporary differences can be utilised. Deferred income tax is provided on
temporary differences arising from investments in subsidiaries and associates, except where the
timing of the reversal of the temporary difference is controlled by the Bank and it is probable that
the difference will not reverse in the foreseeable future. The tax effects of income tax losses
available for carry forward are recognised as an asset where it is probable that future taxable
profits will be available against which these losses can be utilised.
Fair value remeasurement of debt and equity instruments measured at FVOCI and cash flow
hedges, are recognised directly in equity. Deferred tax related to this fair value remeasurement is
also recognised directly in equity and is subsequently recognised in the statement of profit or loss
together with the deferred gain or loss.
Uncertain tax positions are assessed continually by ING Bank and in case it is probable that there
will be a cash outflow; a current tax liability is recognised.
Other assets
Investment property
Investment properties are recognised at fair value at the balance sheet date. Changes in the
carrying amount resulting from revaluations are recognised in the statement of profit or loss. On
disposal, the difference between the sale proceeds and carrying value is recognised in the
statement of profit or loss.
Property obtained from foreclosures
Property obtained from foreclosures is stated at the lower of cost and net realisable value. Net
realisable value is the estimated selling price, less applicable variable selling expenses. Property
obtained from foreclosures is included in Other assets - Property development and obtained from
foreclosures.
Property development
Property developed and under development for which ING Bank has the intention to sell the
property after its completion is included in Other assets – Property development and obtained from
foreclosures.
Property developed and under development for which ING Bank has the intention to sell the
property under development after its completion and where there is not yet a specifically
negotiated contract is measured at direct construction cost incurred up to the balance sheet date,
including borrowing costs incurred during construction and ING Bank’s own directly attributable
development and supervision expenses less any impairment losses. Profit is recognised using the
completed contract method (on sale date of the property). Impairment is recognised if the
estimated selling price, less applicable variable selling expenses is lower than carrying value.
ING Bank Annual Report 2018 79
Contents | Who we are | Report of the Management Board | Corporate governance | Consolidated annual accounts | Parent company annual accounts | Other information
> Accounting policies > 1
Property under development for which ING Bank has the intention to sell the property under
development after its completion and where there is a specifically negotiated contract is valued
using the percentage of completion method (pro rata profit recognition). The stage of completion is
measured by reference to costs incurred to date as percentage of total estimated costs for each
contract.
Property under development is stated at fair value (with changes in fair value recognised in the
statement of profit or loss) if ING Bank has the intention to recognise the property under
development after completion as real estate investments.
Disposal groups held for sale and discontinued operations
Disposal groups (and groups of non-current assets) are classified as held for sale if their carrying
amount will be recovered principally through a sale transaction rather than through continuing use.
This is only the case when the sale is highly probable and the disposal group (or group of assets) is
available for immediate sale in its present condition; management must be committed to the sale,
which is expected to occur within one year from the date of classification as held for sale.
Upon classification as held for sale, the disposal group is measured at the lower of its carrying
amount and fair value less costs to sell, except where specifically exempt from IFRS 5. An
impairment loss is recognised for any initial or subsequent write-down of the disposal group to fair
value less costs to sell. A gain is recognised for any subsequent increases in fair value less costs to
sell of the disposal group, but not in excess of any cumulative impairment loss previously
recognised. A gain or loss not previously recognised by the date of the sale of the disposal group is
recognised at the date of derecognition. Assets within the disposal group are not depreciated or
amortised while they are classified as held for sale. Interest and other expenses attributable to the
liabilities of a disposal group classified as held for sale continue to be recognised. The assets of the
disposal group classified as held for sale are presented separately from the other assets in the
balance sheet. The liabilities of a disposal group classified as held for sale are presented separately
from other liabilities in the balance sheet.
When a group of assets that is classified as held for sale represents a major line of business or
geographical area the disposal group is classified as discontinued operations. Upon classification of
a business as held for sale and discontinued operations the individual income and expenses are
presented within the Total net result from discontinued operations instead of being presented in
the usual line items in the Consolidated statement of profit or loss. All comparative years in the
Consolidated statement of profit or loss are restated and presented as discontinued operations for
all periods presented. Furthermore, the individual assets and liabilities are presented in the
Consolidated statement of financial position as Assets and liabilities held for sale and are no longer
included in the usual line items in the Consolidated statement of financial position. Changes in
assets and liabilities as a result of classification as held for sale are included in the notes in the line
‘Changes in composition of the group and other changes’.
Provisions, contingent liabilities and contingent assets
A provision is a present obligation arising from past events, the settlement of which is expected to
result in an outflow of resources embodying economic benefits, however the timing or the amount
is uncertain. Provisions are discounted when the effect of the time value of money is significant
using a pre-tax discount rate.
Reorganisation provisions include employee termination benefits when the Bank is demonstrably
committed to either terminating the employment of current employees according to a detailed
formal plan without possibility of withdrawal, or providing termination benefits as a result of an
offer made to encourage voluntary redundancy.
A liability is recognised for a levy when the activity that triggers payment, as identified by the
relevant legislation, occurs. For a levy that is triggered upon reaching a minimum threshold, the
liability is recognised only upon reaching the specified minimum threshold.
A contingent liability is a possible obligation that arises from past events and whose existence will
be confirmed only by the occurrence or non-occurrence of one or more uncertain future events not
wholly within the control of ING Bank; or a present obligation that arises from past events but is not
ING Bank Annual Report 2018 80
Contents | Who we are | Report of the Management Board | Corporate governance | Consolidated annual accounts | Parent company annual accounts | Other information
> Accounting policies > 1
recognised because it is either not probable that an outflow of economic benefits will be required to
settle the obligation or the amount of the obligation cannot be measured reliably. Contingent
liabilities are not recognised in the statement of financial position, but are rather disclosed in the
notes unless the possibility of the outflow of economic benefits is remote.
A contingent asset is a possible asset that arises from past events and whose existence will be
confirmed only by the occurrence or non-occurrence of one or more uncertain future events not
wholly within the control of ING Bank. Contingent assets are recognised in the statement of
financial position only when realisation of the income that arises from such an asset is virtually
certain. Contingent assets are disclosed in the notes when an inflow of economic benefits is
probable.
Critical judgements and key estimation uncertainty:
The recognition and measurement of provisions is an inherently uncertain process involving using
judgement to determine when a present obligation exists and estimates regarding probability,
amounts and timing of cash flows.
ING Bank may become involved in legal proceedings. The degree of uncertainty and the method of
making the accounting estimate depends on the individual case, its nature and complexity. Legal
cases are usually one of a kind. Judgment is required to estimate the probability of an
unfavourable outcome and the amount of potential loss. For the assessment of litigation provisions
ING Bank consults with legal experts. Even taking into consideration legal experts’ advice, the
probability of an outflow of economic benefits can still be uncertain and the amount provisioned
can remain sensitive to the assumptions used which may have a broad range of outcomes.
Reference is made to Note 16 ‘Provisions’.
For legal proceedings where it is not possible to make a reliable estimate of the expected financial
effect, that could result from the ultimate resolution of the proceedings, no provision is recognised,
however disclosure is included in the annual accounts. Reference is made to Note 44 ‘Legal
proceedings’.
Key assumptions for the reorganisation provision are in estimating the amounts and timing of cash
flows as the announced transformation initiatives are implemented over a period of several years.
Reference is made to Note 16 ‘Provisions’.
Other liabilities
Defined benefit plans
The net defined benefit asset or liability recognised in the statement of financial position in respect
of defined benefit pension plans is the fair value of the plan assets less the present value of the
defined benefit obligation at the balance sheet date.
Plan assets are measured at fair value at the balance sheet date. For determining the pension
expense, the return on plan assets is determined using a high quality corporate bond rate identical
to the discount rate used in determining the defined benefit obligation.
Changes in plan assets that effect Shareholders’ equity and/or Net result, include mainly:
Return on plan assets using a high quality corporate bond rate at the start of the reporting
period which are recognised as staff costs in the statement of profit or loss; and
Remeasurements which are recognised in Other comprehensive income (equity).
The defined benefit obligation is calculated by internal and external actuaries through actuarial
models and calculations using the projected unit credit method. This method considers expected
future payments required to settle the obligation resulting from employee service in the current
and prior periods, discounted using a high quality corporate bond rate. Inherent in these actuarial
models are assumptions including discount rates, rates of increase in future salary and benefit
levels, mortality rates, trend rates in health care costs, consumer price index and the expected level
of indexation. The assumptions are based on available market data as well as management
expectations and are updated regularly. The actuarial assumptions may differ significantly from
the actual results due to changes in market conditions, economic and mortality trends, and other
assumptions. Any changes in these assumptions could have a significant impact on the defined
benefit plan obligation and future pension costs.
ING Bank Annual Report 2018 81
Contents | Who we are | Report of the Management Board | Corporate governance | Consolidated annual accounts | Parent company annual accounts | Other information
> Accounting policies > 1
Changes in the defined benefit obligation that effects Shareholders’ equity and/or Net result,
include mainly:
Service cost which are recognised as staff costs in the statement of profit or loss;
Interest expenses using a high quality corporate bond rate at the start of the period which are
recognised as staff costs in the Statement of profit or loss; and
Remeasurements which are recognised in Other comprehensive income (equity).
Remeasurements recognised in other comprehensive income are not recycled to profit or loss. Any
past service cost relating to a plan amendment is recognised in profit or loss in the period of the
plan amendment. Gains and losses on curtailments and settlements are recognised in the
statement of profit or loss when the curtailment or settlement occurs.
The recognition of a net defined benefit asset in the Consolidated statement of financial position is
limited to the present value of any economic benefits available in the form of refunds from the
plans or reductions in future contributions to the plans.
Defined contribution plans
For defined contribution plans, the Bank pays contributions to publicly or privately administered
pension insurance plans on a mandatory, contractual or voluntary basis. The Bank has no further
payment obligations once the contributions have been paid. The contributions are recognised as
staff expenses in the profit or loss when they are due. Prepaid contributions are recognised as an
asset to the extent that a cash refund or a reduction in the future payments is available.
Other post-employment obligations
Some group companies provide post-employment healthcare and other benefits to certain
employees and former employees. The entitlement to these benefits is usually conditional on the
employee remaining in service up to retirement age and the completion of a minimum service
period. The expected costs of these benefits are accrued over the period of employment using an
accounting methodology similar to that for defined benefit pension plans.
Income recognition
Interest
Interest income and expense are recognised in the statement of profit or loss using the effective
interest method. The effective interest method is a method of calculating the amortised cost of a
financial asset or a financial liability and of allocating the interest income or interest expense over
the relevant period. The effective interest rate is the rate that exactly discounts estimated future
cash payments or receipts through the expected life of the financial instrument or, when
appropriate, a shorter period to the net carrying amount of the financial asset or financial liability.
When calculating the effective interest rate, the Bank estimates cash flows considering all
contractual terms of the financial instrument (for example, prepayment options) but does not
consider future credit losses.
The calculation includes all fees and points paid or received between parties to the contract that
are an integral part of the effective interest rate, transaction costs and all other premiums or
discounts. Once a financial asset or a group of similar financial assets has been written down as a
result of an impairment loss, interest income is recognised using the rate of interest used to
discount the future cash flows for the purpose of measuring the impairment loss.
Interest results on instruments classified at Amortised Cost, assets measured at FVOCI and
derivatives in a formal hedge accounting relationship is presented in ‘Interest income using
effective interest rate method’. Interest result on derivatives in so called economic hedges and
instruments designated at fair value are presented in ‘Other interest income’.
Fees and commissions
Fees and commissions are generally recognised as the service is provided. Loan commitment fees
for loans that are likely to be drawn down are deferred (together with related direct costs) and
recognised as an adjustment to the effective interest rate on the loan. Loan syndication fees are
recognised as income when the syndication has been completed and the Bank has retained no part
of the loan package for itself or has retained a part at the same effective interest rate as the other
participants. Commission and fees arising from negotiating, or participating in the negotiation of, a

ING Bank Annual Report 2018 82
Contents | Who we are | Report of the Management Board | Corporate governance | Consolidated annual accounts | Parent company annual accounts | Other information
> Accounting policies > 1
transaction for a third party – such as the arrangement of the acquisition of shares or other
securities or the purchase or sale of businesses – are recognised on completion of the underlying
transaction. Portfolio and other management advisory and service fees are recognised based on
the applicable service contracts as the service is provided. Asset management fees related to
investment funds and investment contract fees are recognised on a pro-rata basis over the period
the service is provided. The same principle is applied for wealth management, financial planning
and custody services that are continuously provided over an extended period of time. Fees received
and paid between banks for payment services are classified as commission income and expenses.
Lease income
The proceeds from leasing out assets under operating leases are recognised on a straight-line basis
over the life of the lease agreement. Lease payments received in respect of finance leases when
ING Bank is the lessor are divided into an interest component (recognised as interest income) and a
repayment component.
Expense recognition
Expenses are recognised in the statement of profit or loss as incurred or when a decrease in future
economic benefits related to a decrease in an asset or an increase in a liability has arisen that can
be measured reliably.
Fee and commission expenses are generally a result from a contract with ING service providers in
order to perform the service for our customers. Costs are generally presented as ‘Commission
expenses’ if they are specific, incremental, directly attributable and identifiable to generate
commission income.
Share-based payments
Share-based payment expenses are recognised as a staff expense over the vesting period. A
corresponding increase in equity is recognised for equity-settled share-based payment
transactions. The fair value of equity-settled share-based payment transactions are measured at
the grant date. Rights granted will remain valid until the expiry date, even if the share based
payment scheme is discontinued. The rights are subject to certain conditions, including a pre-
determined continuous period of service.
Statement of cash flows
The statement of cash flows is prepared in accordance with the indirect method, classifying cash
flows as cash flows from operating, investing and financing activities. In the net cash flow from
operating activities, the result before tax is adjusted for those items in the statement of profit or
loss and changes in items per the statement of financial position, which do not result in actual cash
flows during the year.
For the purposes of the statement of cash flows, Cash and cash equivalents comprise balances with
less than three months’ maturity from the date of acquisition, including cash and balances with
central banks, treasury bills and other eligible bills, amounts due from other banks, and deposits
from banks. Investments qualify as a cash equivalent if they are readily convertible to a known
amount of cash and are subject to an insignificant risk of changes in value.
Cash flows arising from foreign currency transactions are translated into the functional currency
using the exchange rates at the date of the cash flows.
The net cash flow shown in respect of Loans and advances to customers relates only to
transactions involving actual payments or receipts. The Addition to loan loss provision which is
deducted from the item Loans and advances to customers in the statement of financial position
has been adjusted accordingly from the result before tax and is shown separately in the statement
of cash flows.
The difference between the Net cash flow in accordance with the statement of cash flows and the
change between the opening and closing balance of Cash and cash equivalents in the statement of
financial position is due to exchange rate differences and is presented separately in the cash flow
statement.
Liabilities arising from financing activities are debt securities and subordinated loans.
ING Bank Annual Report 2018 83
Contents | Who we are | Report of the Management Board | Corporate governance | Consolidated annual accounts | Parent company annual accounts | Other information
> Accounting policies > 1
1.6 Parent company accounts
The parent company accounts of ING Bank N.V. are prepared in accordance with the financial
reporting requirements included in Part 9 of Book 2 of the Dutch Civil Code. In accordance with
subsection 8 of section 362, Book 2 of the Dutch Civil Code, the recognition and measurement
principles applied in the Parent company accounts are the same as those applied in the
Consolidated annual accounts.
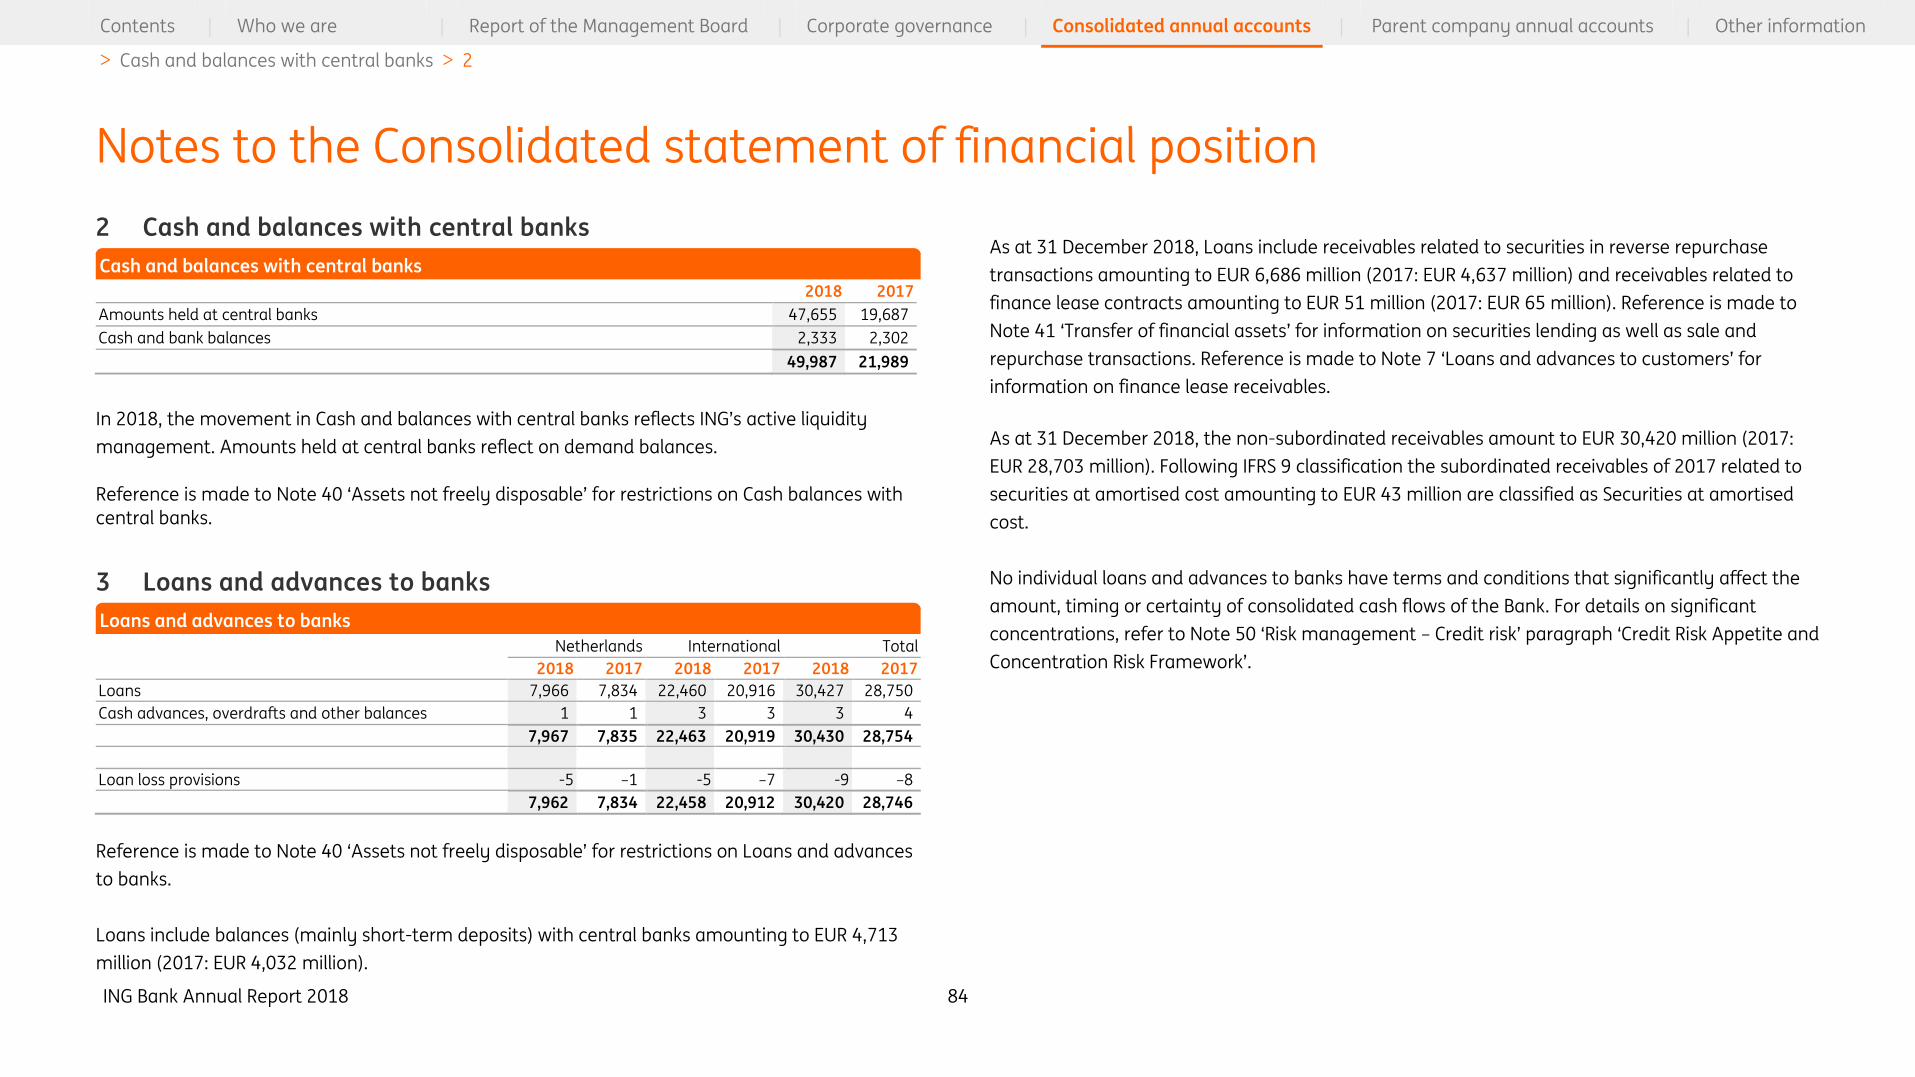
ING Bank Annual Report 2018 84
Contents | Who we are | Report of the Management Board | Corporate governance | Consolidated annual accounts | Parent company annual accounts | Other information
> Cash and balances with central banks > 2
2 Cash and balances with central banks
2018 2017
Amounts held at central banks 47,655 19,687
Cash and bank balances 2,333 2,302
49,987 21,989
In 2018, the movement in Cash and balances with central banks reflects ING’s active liquidity
management. Amounts held at central banks reflect on demand balances.
Reference is made to Note 40 ‘Assets not freely disposable’ for restrictions on Cash balances with
central banks.
3 Loans and advances to banks
Netherlands International Total
2018 2017 2018 2017 2018 2017
Loans 7,966 7,834 22,460 20,916 30,427 28,750
Cash advances, overdrafts and other balances 1 1 3 3 3 4
7,967 7,835 22,463 20,919 30,430 28,754
Loan loss provisions -5 –1 -5 –7 -9 –8
7,962 7,834 22,458 20,912 30,420 28,746
Reference is made to Note 40 ‘Assets not freely disposable’ for restrictions on Loans and advances
to banks.
Loans include balances (mainly short-term deposits) with central banks amounting to EUR 4,713
million (2017: EUR 4,032 million).
As at 31 December 2018, Loans include receivables related to securities in reverse repurchase
transactions amounting to EUR 6,686 million (2017: EUR 4,637 million) and receivables related to
finance lease contracts amounting to EUR 51 million (2017: EUR 65 million). Reference is made to
Note 41 ‘Transfer of financial assets’ for information on securities lending as well as sale and
repurchase transactions. Reference is made to Note 7 ‘Loans and advances to customers’ for
information on finance lease receivables.
As at 31 December 2018, the non-subordinated receivables amount to EUR 30,420 million (2017:
EUR 28,703 million). Following IFRS 9 classification the subordinated receivables of 2017 related to
securities at amortised cost amounting to EUR 43 million are classified as Securities at amortised
cost.
No individual loans and advances to banks have terms and conditions that significantly affect the
amount, timing or certainty of consolidated cash flows of the Bank. For details on significant
concentrations, refer to Note 50 ‘Risk management – Credit risk’ paragraph ‘Credit Risk Appetite and
Concentration Risk Framework’.
Notes to the Consolidated statement of financial position
Cash and balances with central banks
Loans and advances to banks
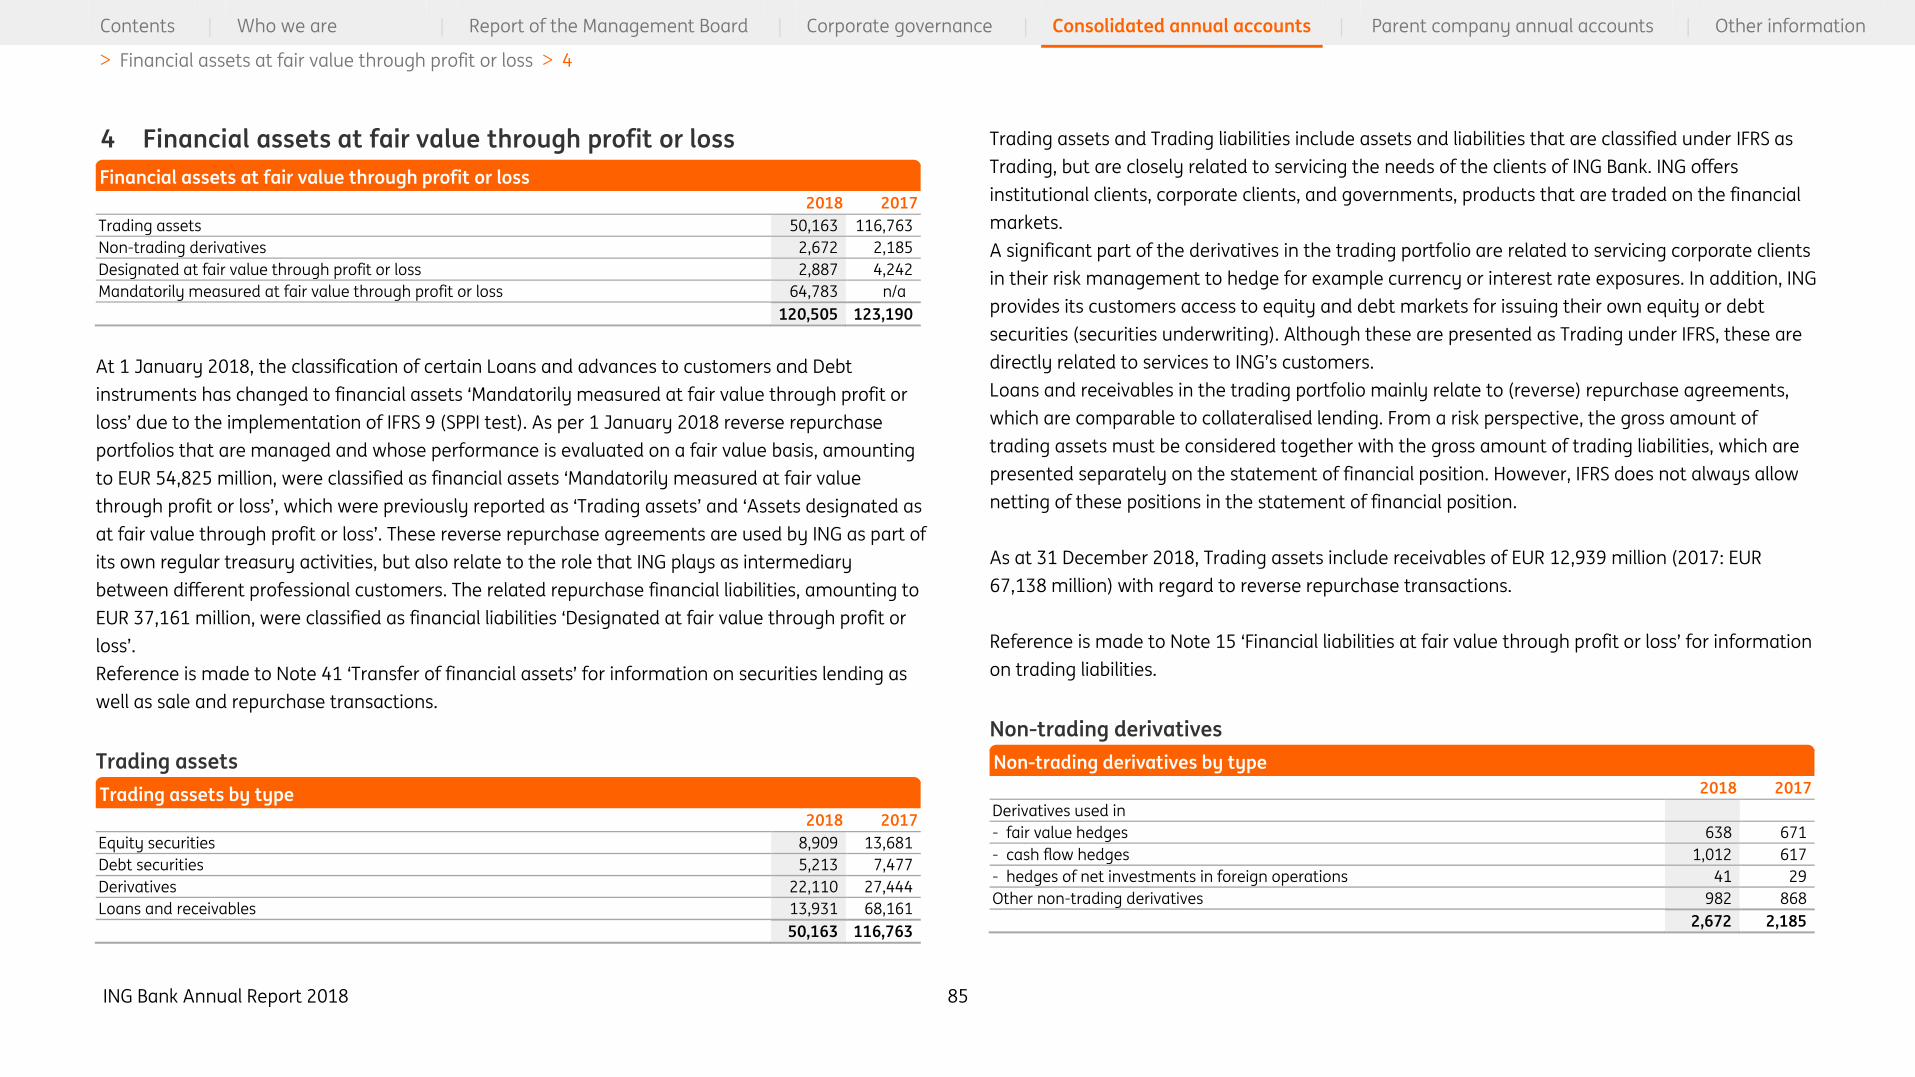
ING Bank Annual Report 2018 85
Contents | Who we are | Report of the Management Board | Corporate governance | Consolidated annual accounts | Parent company annual accounts | Other information
> Financial assets at fair value through profit or loss > 4
4 Financial assets at fair value through profit or loss
2018 2017
Trading assets 50,163 116,763
Non-trading derivatives 2,672 2,185
Designated at fair value through profit or loss 2,887 4,242
Mandatorily measured at fair value through profit or loss 64,783 n/a
120,505 123,190
At 1 January 2018, the classification of certain Loans and advances to customers and Debt
instruments has changed to financial assets ‘Mandatorily measured at fair value through profit or
loss’ due to the implementation of IFRS 9 (SPPI test). As per 1 January 2018 reverse repurchase
portfolios that are managed and whose performance is evaluated on a fair value basis, amounting
to EUR 54,825 million, were classified as financial assets ‘Mandatorily measured at fair value
through profit or loss’, which were previously reported as ‘Trading assets’ and ‘Assets designated as
at fair value through profit or loss’. These reverse repurchase agreements are used by ING as part of
its own regular treasury activities, but also relate to the role that ING plays as intermediary
between different professional customers. The related repurchase financial liabilities, amounting to
EUR 37,161 million, were classified as financial liabilities ‘Designated at fair value through profit or
loss’.
Reference is made to Note 41 ‘Transfer of financial assets’ for information on securities lending as
well as sale and repurchase transactions.
Trading assets
2018 2017
Equity securities 8,909 13,681
Debt securities 5,213 7,477
Derivatives 22,110 27,444
Loans and receivables 13,931 68,161
50,163 116,763
Trading assets and Trading liabilities include assets and liabilities that are classified under IFRS as
Trading, but are closely related to servicing the needs of the clients of ING Bank. ING offers
institutional clients, corporate clients, and governments, products that are traded on the financial
markets.
A significant part of the derivatives in the trading portfolio are related to servicing corporate clients
in their risk management to hedge for example currency or interest rate exposures. In addition, ING
provides its customers access to equity and debt markets for issuing their own equity or debt
securities (securities underwriting). Although these are presented as Trading under IFRS, these are
directly related to services to ING’s customers.
Loans and receivables in the trading portfolio mainly relate to (reverse) repurchase agreements,
which are comparable to collateralised lending. From a risk perspective, the gross amount of
trading assets must be considered together with the gross amount of trading liabilities, which are
presented separately on the statement of financial position. However, IFRS does not always allow
netting of these positions in the statement of financial position.
As at 31 December 2018, Trading assets include receivables of EUR 12,939 million (2017: EUR
67,138 million) with regard to reverse repurchase transactions.
Reference is made to Note 15 ‘Financial liabilities at fair value through profit or loss’ for information
on trading liabilities.
Non-trading derivatives
2018 2017
Derivatives used in
- fair value hedges 638 671
- cash flow hedges 1,012 617
- hedges of net investments in foreign operations 41 29
Other non-trading derivatives 982 868
2,672 2,185
Financial assets at fair value through profit or loss
Trading assets by type
Non-trading derivatives by type
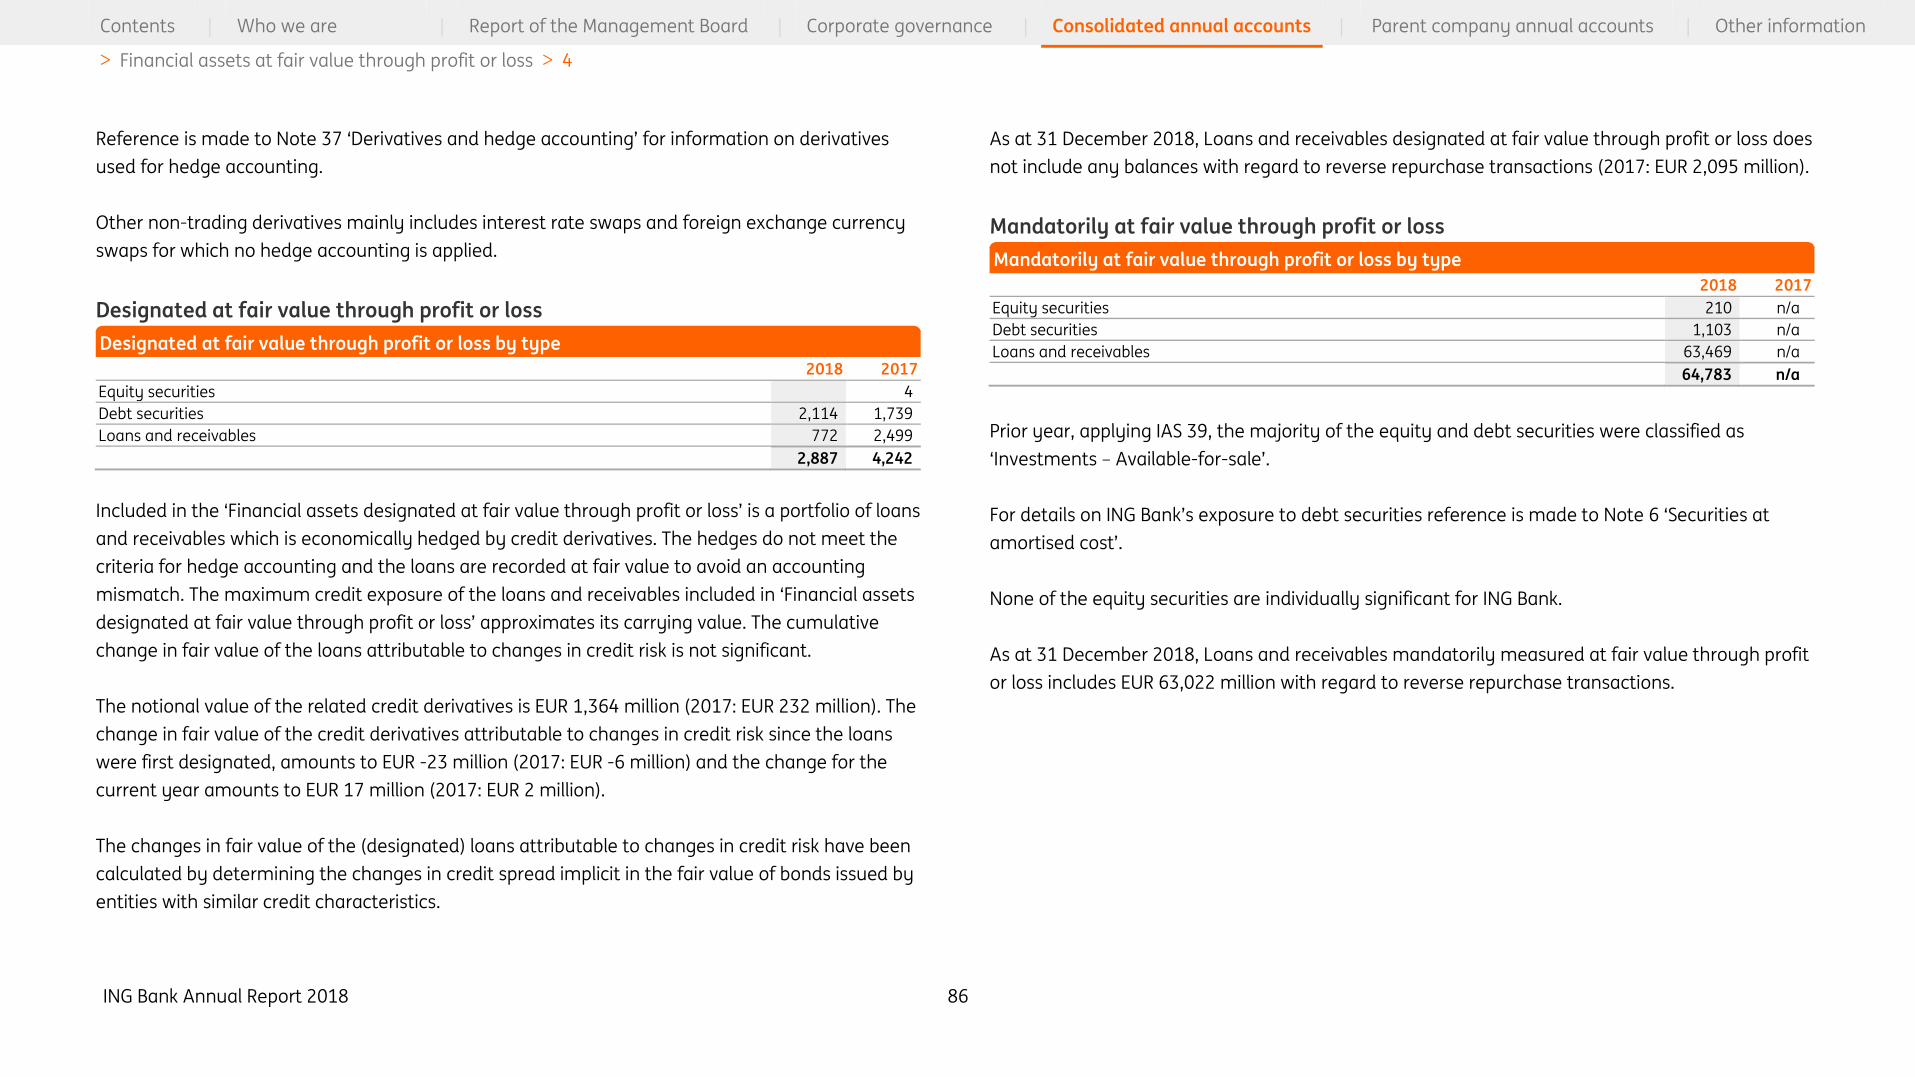
ING Bank Annual Report 2018 86
Contents | Who we are | Report of the Management Board | Corporate governance | Consolidated annual accounts | Parent company annual accounts | Other information
> Financial assets at fair value through profit or loss > 4
Reference is made to Note 37 ‘Derivatives and hedge accounting’ for information on derivatives
used for hedge accounting.
Other non-trading derivatives mainly includes interest rate swaps and foreign exchange currency
swaps for which no hedge accounting is applied.
Designated at fair value through profit or loss
2018 2017
Equity securities 4
Debt securities 2,114 1,739
Loans and receivables 772 2,499
2,887 4,242
Included in the ‘Financial assets designated at fair value through profit or loss’ is a portfolio of loans
and receivables which is economically hedged by credit derivatives. The hedges do not meet the
criteria for hedge accounting and the loans are recorded at fair value to avoid an accounting
mismatch. The maximum credit exposure of the loans and receivables included in ‘Financial assets
designated at fair value through profit or loss’ approximates its carrying value. The cumulative
change in fair value of the loans attributable to changes in credit risk is not significant.
The notional value of the related credit derivatives is EUR 1,364 million (2017: EUR 232 million). The
change in fair value of the credit derivatives attributable to changes in credit risk since the loans
were first designated, amounts to EUR -23 million (2017: EUR -6 million) and the change for the
current year amounts to EUR 17 million (2017: EUR 2 million).
The changes in fair value of the (designated) loans attributable to changes in credit risk have been
calculated by determining the changes in credit spread implicit in the fair value of bonds issued by
entities with similar credit characteristics.
As at 31 December 2018, Loans and receivables designated at fair value through profit or loss does
not include any balances with regard to reverse repurchase transactions (2017: EUR 2,095 million).
Mandatorily at fair value through profit or loss
2018 2017
Equity securities 210 n/a
Debt securities 1,103 n/a
Loans and receivables 63,469 n/a
64,783 n/a
Prior year, applying IAS 39, the majority of the equity and debt securities were classified as
‘Investments – Available-for-sale’.
For details on ING Bank’s exposure to debt securities reference is made to Note 6 ‘Securities at
amortised cost’.
None of the equity securities are individually significant for ING Bank.
As at 31 December 2018, Loans and receivables mandatorily measured at fair value through profit
or loss includes EUR 63,022 million with regard to reverse repurchase transactions.
Designated at fair value through profit or loss by type
Mandatorily at fair value through profit or loss by type

ING Bank Annual Report 2018 87
Contents | Who we are | Report of the Management Board | Corporate governance | Consolidated annual accounts | Parent company annual accounts | Other information
> Financial assets at fair value through other comprehensive income > 5
5 Financial assets at fair value through other comprehensive
income
2018 2017
Equity securities 3,228 n/a
Debt securities1 25,616 n/a
Loans and advances1 2,379 n/a
31,223 n/a
Available-for-sale investments n/a 69,730
Held-to-maturity investments2 n/a 9,343
31,223 79,073
1 Debt securities include an amount of EUR -6 million and the Loans and advances includes EUR -5 million ‘Loan loss
provisions’.
2 Under IFRS 9 these Investments are classified as Securities at amortised cost, reference is made to Note 6 ‘Securities at
amortised cost‘.
Exposure to equity securities
Carrying
value
Dividend
income
2018 2018
Investment in Bank of Beijing 1,967 83
Investment in Kotak Mahindra Bank 919 1
Other Investments 342 8
3,228 92
For strategic equity securities, ING decided to apply the option to irrevocably designate these
investments at fair value through other comprehensive income, instead of the IFRS 9 default
measurement of fair value through profit or loss.
Changes in fair value through other comprehensive income financial assets
The following table presents changes in fair value of equity securities and debt instruments at fair
value through other comprehensive income. The comparative amounts include equity securities
and debt instruments that were classified as Available-for- sale investments under IAS 39.
FVOCI equity
securities
FVOCI debt
instruments1 Total
2018 2017 2018 2017 2018 2017
Opening balance as at 1 January 3,983 4,024 65,747 78,888 69,730 82,912
Effect of changes in accounting policy –184 –31,945 –32,129
Additions 33 325 10,486 21,276 10,518 21,601
Amortisation –12 –146 –12 –146
Transfers and reclassifications 1 7 1 2 7
Changes in unrealised revaluations2 –463 21 –660 –1,030 –1,123 –1,009
Impairments –6 –6
Reversals of impairments 16 3 16 3
Disposals and redemptions –178 –79 –15,478 –32,709 –15,656 –32,788
Exchange rate differences 35 –308 –159 –535 –124 –843
Changes in the composition of the group
and other changes –1 1 1 –1
Closing balance 3,228 3,983 27,995 65,747 31,223 69,730
1 Fair value through other comprehensive income debt instruments includes both debt securities and loans and advances.
2 Changes in unrealised revaluations include changes on hedged items which are recognised in the statement of profit or
loss.
In the fourth quarter of 2018, ING reduced its stake in Kotak Mahindra Bank by 0.67% to 3.07% with
the sale of 12.7 million shares for EUR 177 million. The fair value of the investment at the date of
derecognition was EUR 984 million and the gain on disposal was EUR 3.6 million.
Reference is made to Note 6 ‘Securities at amortised cost’ for details on ING Bank’s exposure to
debt securities and for further information on transfers and reclassifications of fair value through
comprehensive income and amortised cost investments.
Reference is made to Note 24 ‘Investment income’ for details on Impairments.
Financial assets at fair value through other comprehensive income by type
Equity securities designated as at fair value through other comprehensive income
Changes in fair value through other comprehensive income financial assets
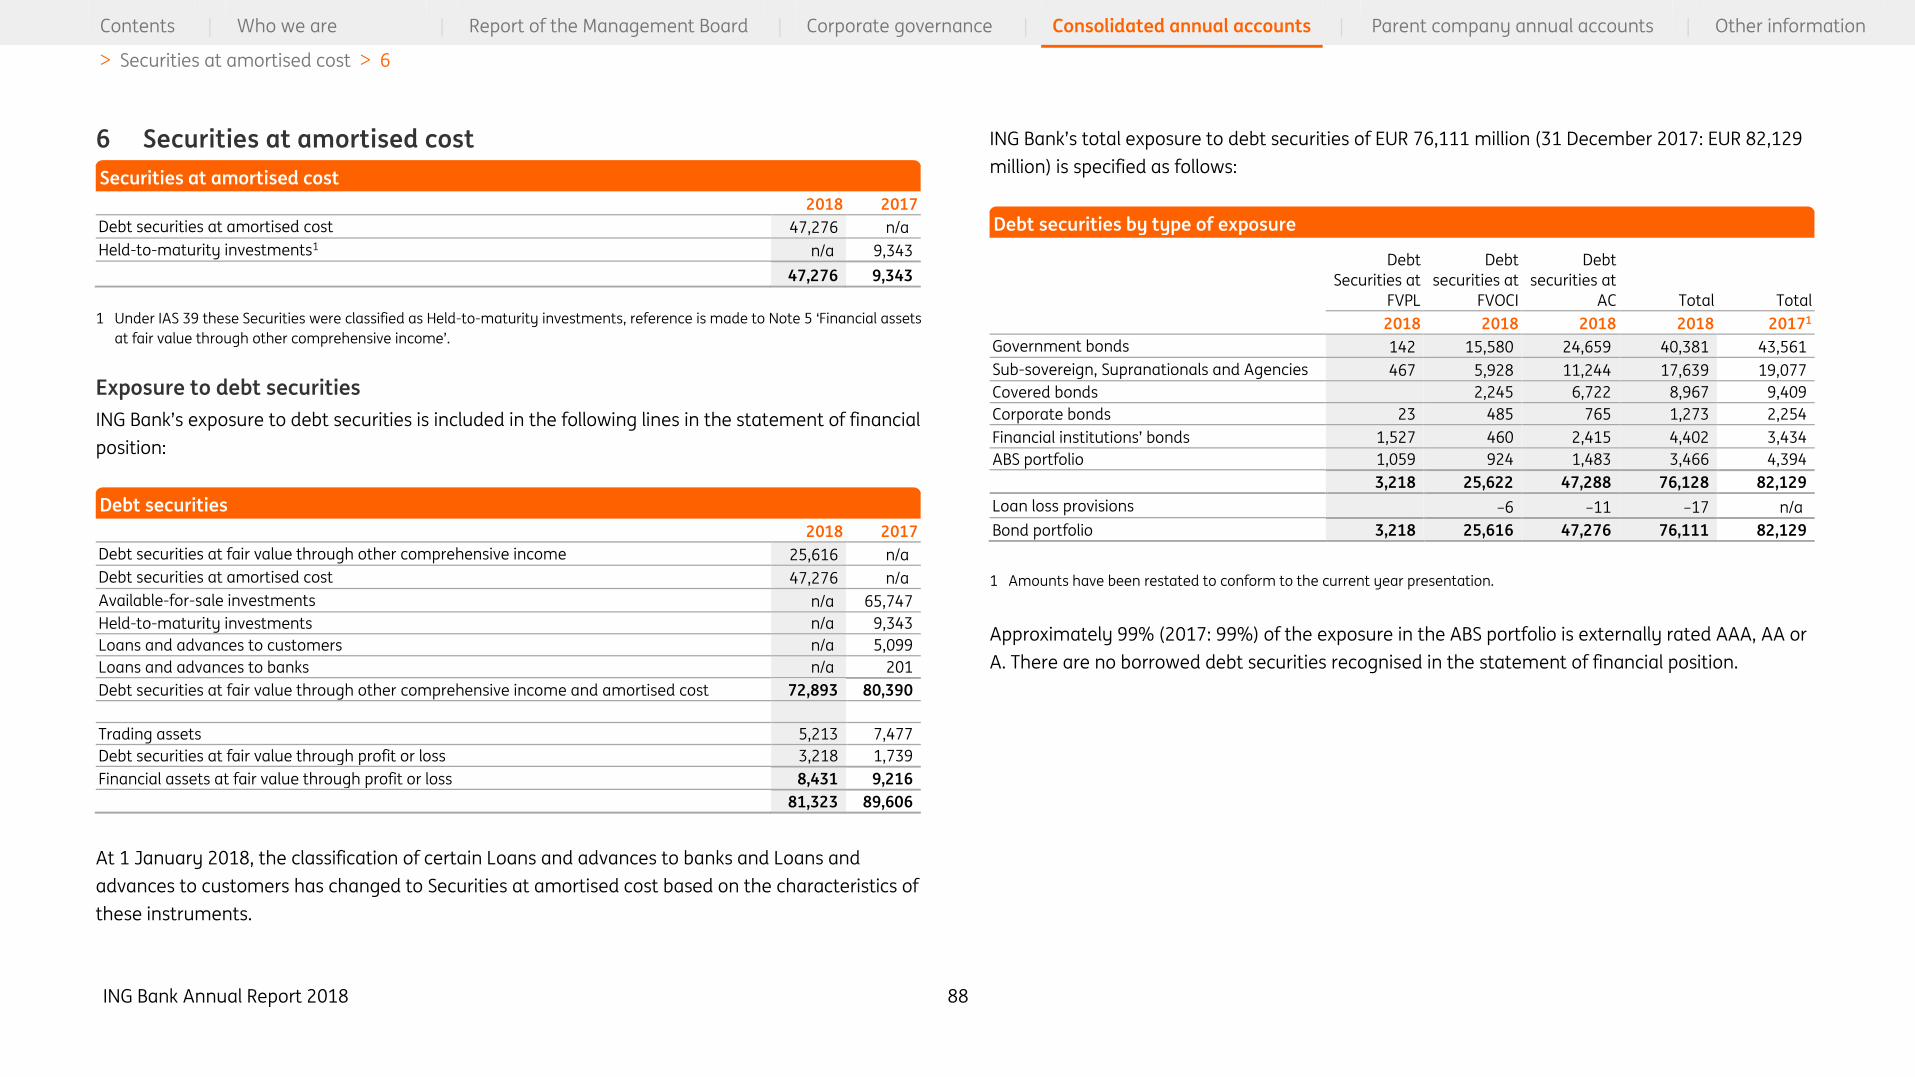
ING Bank Annual Report 2018 88
Contents | Who we are | Report of the Management Board | Corporate governance | Consolidated annual accounts | Parent company annual accounts | Other information
> Securities at amortised cost > 6
6 Securities at amortised cost
2018 2017
Debt securities at amortised cost 47,276 n/a
Held-to-maturity investments1 n/a 9,343
47,276 9,343
1 Under IAS 39 these Securities were classified as Held-to-maturity investments, reference is made to Note 5 ‘Financial assets
at fair value through other comprehensive income’.
Exposure to debt securities
ING Bank’s exposure to debt securities is included in the following lines in the statement of financial
position:
2018 2017
Debt securities at fair value through other comprehensive income 25,616 n/a
Debt securities at amortised cost 47,276 n/a
Available-for-sale investments n/a 65,747
Held-to-maturity investments n/a 9,343
Loans and advances to customers n/a 5,099
Loans and advances to banks n/a 201
Debt securities at fair value through other comprehensive income and amortised cost 72,893 80,390
Trading assets 5,213 7,477
Debt securities at fair value through profit or loss 3,218 1,739
Financial assets at fair value through profit or loss 8,431 9,216
81,323 89,606
At 1 January 2018, the classification of certain Loans and advances to banks and Loans and
advances to customers has changed to Securities at amortised cost based on the characteristics of
these instruments.
ING Bank’s total exposure to debt securities of EUR 76,111 million (31 December 2017: EUR 82,129
million) is specified as follows:
Debt
Securities at
FVPL
Debt
securities at
FVOCI
Debt
securities at
AC Total Total
2018 2018 2018 2018 20171
Government bonds 142 15,580 24,659 40,381 43,561
Sub-sovereign, Supranationals and Agencies 467 5,928 11,244 17,639 19,077
Covered bonds 2,245 6,722 8,967 9,409
Corporate bonds 23 485 765 1,273 2,254
Financial institutions’ bonds 1,527 460 2,415 4,402 3,434
ABS portfolio 1,059 924 1,483 3,466 4,394
3,218 25,622 47,288 76,128 82,129
Loan loss provisions –6 –11 –17 n/a
Bond portfolio 3,218 25,616 47,276 76,111 82,129
1 Amounts have been restated to conform to the current year presentation.
Approximately 99% (2017: 99%) of the exposure in the ABS portfolio is externally rated AAA, AA or
A. There are no borrowed debt securities recognised in the statement of financial position.
Securities at amortised cost
Debt securities
Debt securities by type of exposure

ING Bank Annual Report 2018 89
Contents | Who we are | Report of the Management Board | Corporate governance | Consolidated annual accounts | Parent company annual accounts | Other information
> Loans and advances to customers > 7
7 Loans and advances to customers
Netherlands International Total
2018 2017 2018 2017 2018 2017
Loans to, or guaranteed by, public authorities 24,547 26,975 17,257 19,397 41,803 46,372
Loans secured by mortgages 119,939 121,702 219,983 204,883 339,922 326,585
Loans guaranteed by credit institutions 209 279 2,901 1,722 3,110 2,001
Personal lending 3,304 3,162 21,563 20,074 24,867 23,236
Asset backed securities 2,209 2,209
Corporate loans 37,331 38,550 149,787 140,461 187,117 179,011
185,329 190,668 411,490 388,746 596,819 579,414
Loan loss provisions –1,480 –1,693 –3,011 –2,822 –4,491 –4,515
183,849 188,975 408,479 385,924 592,328 574,899
As at 31 December 2018, Loans and advances to customers includes receivables with regard to
securities which have been acquired in reverse repurchase transactions amounting to EUR 266
million (2017: EUR 421 million).
Reference is made to Note 41 ‘Transfer of financial assets’ for information on securities lending as
well as sale and repurchase transactions.
2018 2017
Non-subordinated 592,208 574,919
Subordinated 120 480
592,328 574,899
No individual loan or advance has terms and conditions that significantly affect the amount, timing
or certainty of the consolidated cash flows of the Bank. For details on significant concentrations,
refer to Note 50 ‘Risk management – Credit risk’ paragraph ‘Credit Risk Appetite and Concentration
Risk Framework’.
The following table show the reconciliations from the opening to the closing balance of the loan
loss provision.
2018 2017
12-month
ECL
(Stage 1)
Lifetime
ECL not
credit
impaired
(stage 2)
Lifetime
ECL credit
impaired
(stage 3)
Purchase
d
credit
impaired Total² Total
Opening balance as at 1 January IAS 39 4,521 5,308
Effect of changes in accounting policy 795
Opening balance as at 1 January IFRS 9 438 955 3,916 7 5,316
Transfer into 12-month ECL 19 –206 –23 –209
Transfer into lifetime ECL not credit impaired –62 501 –56 383
Transfer into lifetime ECL credit impaired –7 –86 707 615
Net remeasurement of loan loss provision 17 –55 312 –0 274
New financial assets originated or purchased 213 –0 212
Financial assets that have been derecognised –101 –145 –341 –0 –588
Changes in models
Increase in loan loss provisions 80 9 599 –0 688 676
Write-offs –1,043 –1,044 –1,279
Recoveries of amounts previously written off 53 53 59
Foreign exchange and other movements –18 –38 –386 –4 –446 –136
Closing balance 500 925 3,139 2 4,568 4,628
1 At the end of December 2018, the stock of provisions included provisions for loans and advances to central banks (EUR 3
million), loans and advances to banks (EUR 9 million), financial assets at FVOCI (EUR 11 million), securities at amortised cost
(EUR 11 million), provisions for loans and advances to customers (EUR 4,491 million) and provisions for contingent liabilities
(credit replacements) recorded under Provisions (EUR 42 million).
2 The 2018 changes in loan loss provision presents IFRS 9 expected credit losses (excluding IAS 37 provisions for non-credit
replacement positions (1 January 2018: EUR 107 million), The IAS 39 comparative 2017 amount includes IAS 37 provision for
all off balance positions.
Loans and advances to customers by type
Loans and advances to customers by subordination
Changes in loan loss provisions¹

ING Bank Annual Report 2018 90
Contents | Who we are | Report of the Management Board | Corporate governance | Consolidated annual accounts | Parent company annual accounts | Other information
> Loans and advances to customers > 7
The Addition to loan loss provisions in the Consolidated statement of profit or loss (EUR 656 million)
relates to the increase in the loan loss provisions (EUR 688 million) and the release related to the
IAS 37 non-credit replacement off-balance positions (EUR 32 million included in Note 16
‘Provisions’).
For details on credit qualities, refer to Note 50 ‘Risk management – Credit risk’ paragraph ‘Credit
quality – Loan loss provisioning.
The following table provides information on financial assets that were modified while they had a
loss allowance measured at an amount equal to lifetime ECL.
2018
Financial assets modified during the period
Amortised cost before modification 2,503
Net modification loss –50
Financial assets modified since initial recognition
Gross carrying amount at 31 December of financial assets for which loss allowance has changed to
12-month measurement during the period 908
Loans and advances to customers and Loans and advances to banks include finance lease
receivables and are detailed as follows:
2018 2017
Maturities of gross investment in finance lease receivables
- within 1 year 2,374 2,729
- more than 1 year but less than 5 years 5,959 6,215
- more than 5 years 1,646 2,897
9,979 11,841
Unearned future finance income on finance leases –673 –1,082
Net investment in finance leases 9,306 10,759
Maturities of net investment in finance lease receivables
- within 1 year 2,193 2,474
- more than 1 year but less than 5 years 5,581 5,652
- more than 5 years 1,532 2,633
9,306 10,759
Included in Loans and advances to banks 51 65
Included in Loans and advances to customers 9,256 10,694
9,306 10,759
Expected credit losses for uncollectable finance lease receivables of EUR 150 million as at 31
December 2018 (2017: EUR 337 million) is included in the loan loss provision. The loan loss
provision for finance lease receivables is classified into the following loan loss provision stages;
stage 1: EUR 5 million, stage 2: EUR 11 million and stage 3: EUR 134 million.
No individual finance lease receivable has terms and conditions that significantly affect the
amount, timing or certainty of the consolidated cash flows of the Bank.
Financial assets modified
Finance lease receivables

ING Bank Annual Report 2018 91
Contents | Who we are | Report of the Management Board | Corporate governance | Consolidated annual accounts | Parent company annual accounts | Other information
> Investments in associates and joint ventures > 8
8 Investments in associates and joint ventures
2018
Interest
held (%)
Fair value of
listed
investments
Balance
sheet
value
Total
assets
Total
liabilities
Total
income
Total
expenses
TMB Public Company Limited 25 649 832 23,494 20,884 1,055 722
Other investments in associates and
joint ventures
212
1,044
2017
Interest
held (%)
Fair value of
listed
investments
Balance
sheet
value
Total
assets
Total
liabilities
Total
income
Total
expenses
TMB Public Company Limited 25 842 737 21,251 19,004 711 507
Other investments in associates and
joint ventures
210
947
TMB Public Company Limited (TMB) is an associate in which ING Bank holds a 25% ownership
interest. TMB is a financial institution providing products and services to Wholesale, Small and
Medium Enterprise (SME), and Retail customers. TMB is domiciled in Bangkok, Thailand and is listed
on the Stock Exchange of Thailand (SET).
Other investments in associates and joint ventures are mainly financial services and financial
technology funds or vehicles operating predominantly in Europe.
ING Bank does not hold any interests in Investments in Associates and joint ventures that are
individually significant to ING Bank. Other investments in associates and joint ventures represents a
large number of associates and joint ventures with an individual statement of financial position
value of less than EUR 50 million.
Significant influence for associates in which the interest held is below 20%, is based on the
combination of ING Bank’s financial interest and other arrangements, such as participation in the
Board of Directors.
The reporting dates of certain associates and joint ventures can differ from the reporting date of
the Bank, but by no more than three months.
Accumulated impairments of EUR 15 million (2017: EUR 33 million) have been recognised. The
values presented in the tables above could differ from the values presented in the individual annual
accounts of the associates and joint ventures, due to the fact that the individual values have been
brought in line with ING Bank’s accounting principles. Where the listed fair value is lower than the
statement of financial position value, an impairment review and an evaluation of the going concern
basis has been performed.
The associates and joint ventures of ING are subject to legal and regulatory restrictions regarding
the amount of dividends it can pay to ING. These restrictions are for example dependant on the
laws in the country of incorporation for declaring dividends or as a result of minimum capital
requirements that are imposed by industry regulators in the countries in which the associates and
joint ventures operate. In addition, the associates and joint ventures also consider other factors in
determining the appropriate levels of equity needed. These factors and limitations include, but are
not limited to, rating agency and regulatory views, which can change over time.
Investments in associates and joint ventures
Investments in associates and joint ventures

ING Bank Annual Report 2018 92
Contents | Who we are | Report of the Management Board | Corporate governance | Consolidated annual accounts | Parent company annual accounts | Other information
> Property and equipment > 9
2018 2017
Opening balance 947 1,003
Effect of changes in accounting policy –23
Additions 97 79
Transfers to and from Investments/Other assets and liabilities 5 –1
Revaluations –2 –8
Share of results 127 166
Dividends received –27 –29
Disposals –116 –245
Impairments –3
Exchange rate differences 39 –18
Closing balance 1,044 947
In 2018, Share of results from associates and joint ventures of EUR 127 million as presented in the
statement of profit or loss and the table above, is mainly attributable to results of TMB of EUR 98
million.
In 2017, Share of results from associates and joint ventures of EUR 166 million as presented in the
statement of profit or loss and the table above, is mainly attributable to results of TMB, EUR 56
million and a gain of EUR 97 million on the sale of shares in Appia Group Ltd UK.
In 2017 Disposals of EUR 245 million is mainly attributable to the sale of Appia Group Ltd UK of EUR
146 million.
9 Property and equipment
2018 2017
Property in own use 780 774
Equipment 879 917
Assets under operating leases 110
1,659 1,801
ING uses external valuers to value property in own use. All properties are typically appraised by
external valuers once every five years.
Assets subject to operating leases have been reclassified to finance lease, as the contracts of the
operating lease portfolio includes purchase options at prices sufficiently lower than the expected
market values at the end of the lease periods. These contracts meet the definition of a finance
lease in terms of IAS 17 and have been accounted for at their net investment value as part of
finance lease receivables.
Changes in Investments in associates and joint ventures
Property and equipment by type
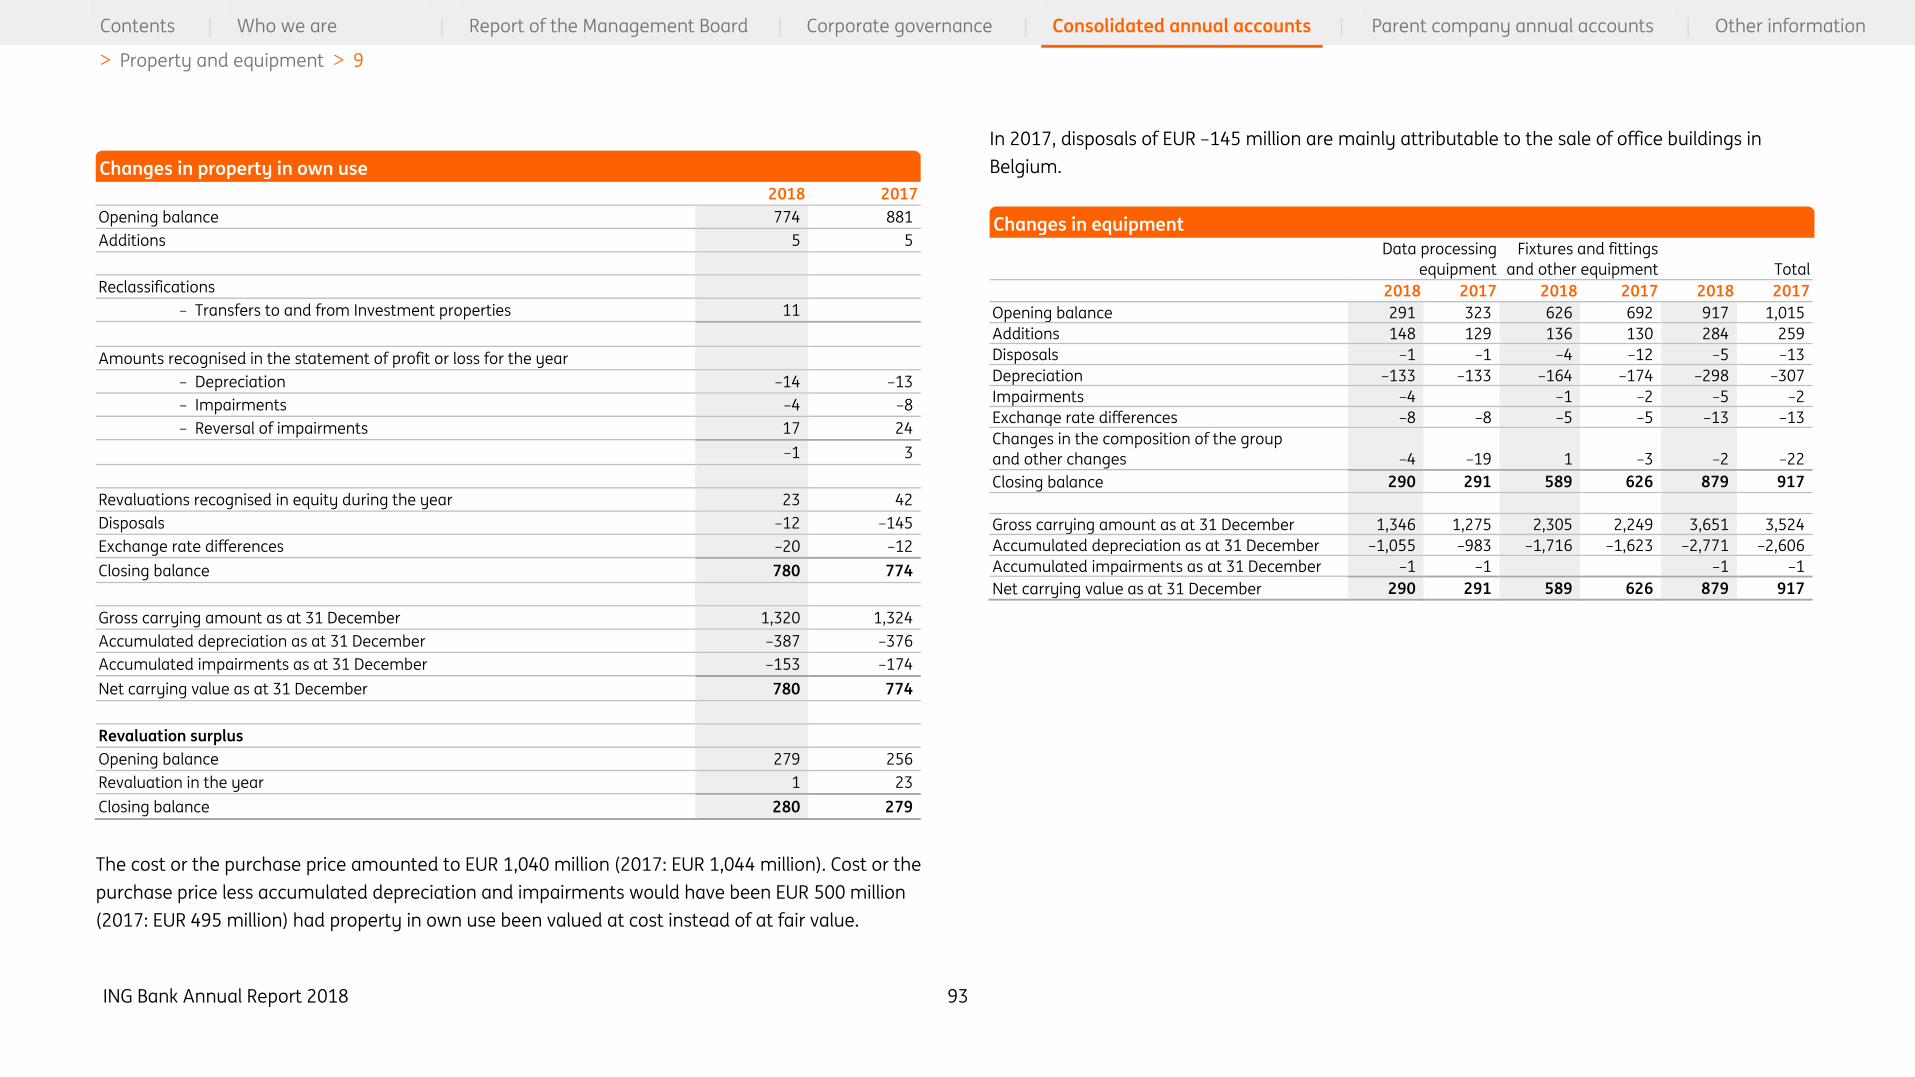
ING Bank Annual Report 2018 93
Contents | Who we are | Report of the Management Board | Corporate governance | Consolidated annual accounts | Parent company annual accounts | Other information
> Property and equipment > 9
2018 2017
Opening balance 774 881
Additions 5 5
Reclassifications
– Transfers to and from Investment properties 11
Amounts recognised in the statement of profit or loss for the year
– Depreciation –14 –13
– Impairments –4 –8
– Reversal of impairments 17 24
–1 3
Revaluations recognised in equity during the year 23 42
Disposals –12 –145
Exchange rate differences –20 –12
Closing balance 780 774
Gross carrying amount as at 31 December 1,320 1,324
Accumulated depreciation as at 31 December –387 –376
Accumulated impairments as at 31 December –153 –174
Net carrying value as at 31 December 780 774
Revaluation surplus
Opening balance 279 256
Revaluation in the year 1 23
Closing balance 280 279
The cost or the purchase price amounted to EUR 1,040 million (2017: EUR 1,044 million). Cost or the
purchase price less accumulated depreciation and impairments would have been EUR 500 million
(2017: EUR 495 million) had property in own use been valued at cost instead of at fair value.
In 2017, disposals of EUR –145 million are mainly attributable to the sale of office buildings in
Belgium.
Data processing
equipment
Fixtures and fittings
and other equipment Total
2018 2017 2018 2017 2018 2017
Opening balance 291 323 626 692 917 1,015
Additions 148 129 136 130 284 259
Disposals –1 –1 –4 –12 –5 –13
Depreciation –133 –133 –164 –174 –298 –307
Impairments –4 –1 –2 –5 –2
Exchange rate differences –8 –8 –5 –5 –13 –13
Changes in the composition of the group
and other changes –4 –19 1 –3 –2 –22
Closing balance 290 291 589 626 879 917
Gross carrying amount as at 31 December 1,346 1,275 2,305 2,249 3,651 3,524
Accumulated depreciation as at 31 December –1,055 –983 –1,716 –1,623 –2,771 –2,606
Accumulated impairments as at 31 December –1 –1 –0 –1 –1
Net carrying value as at 31 December 290 291 589 626 879 917
Changes in property in own use
Changes in equipment
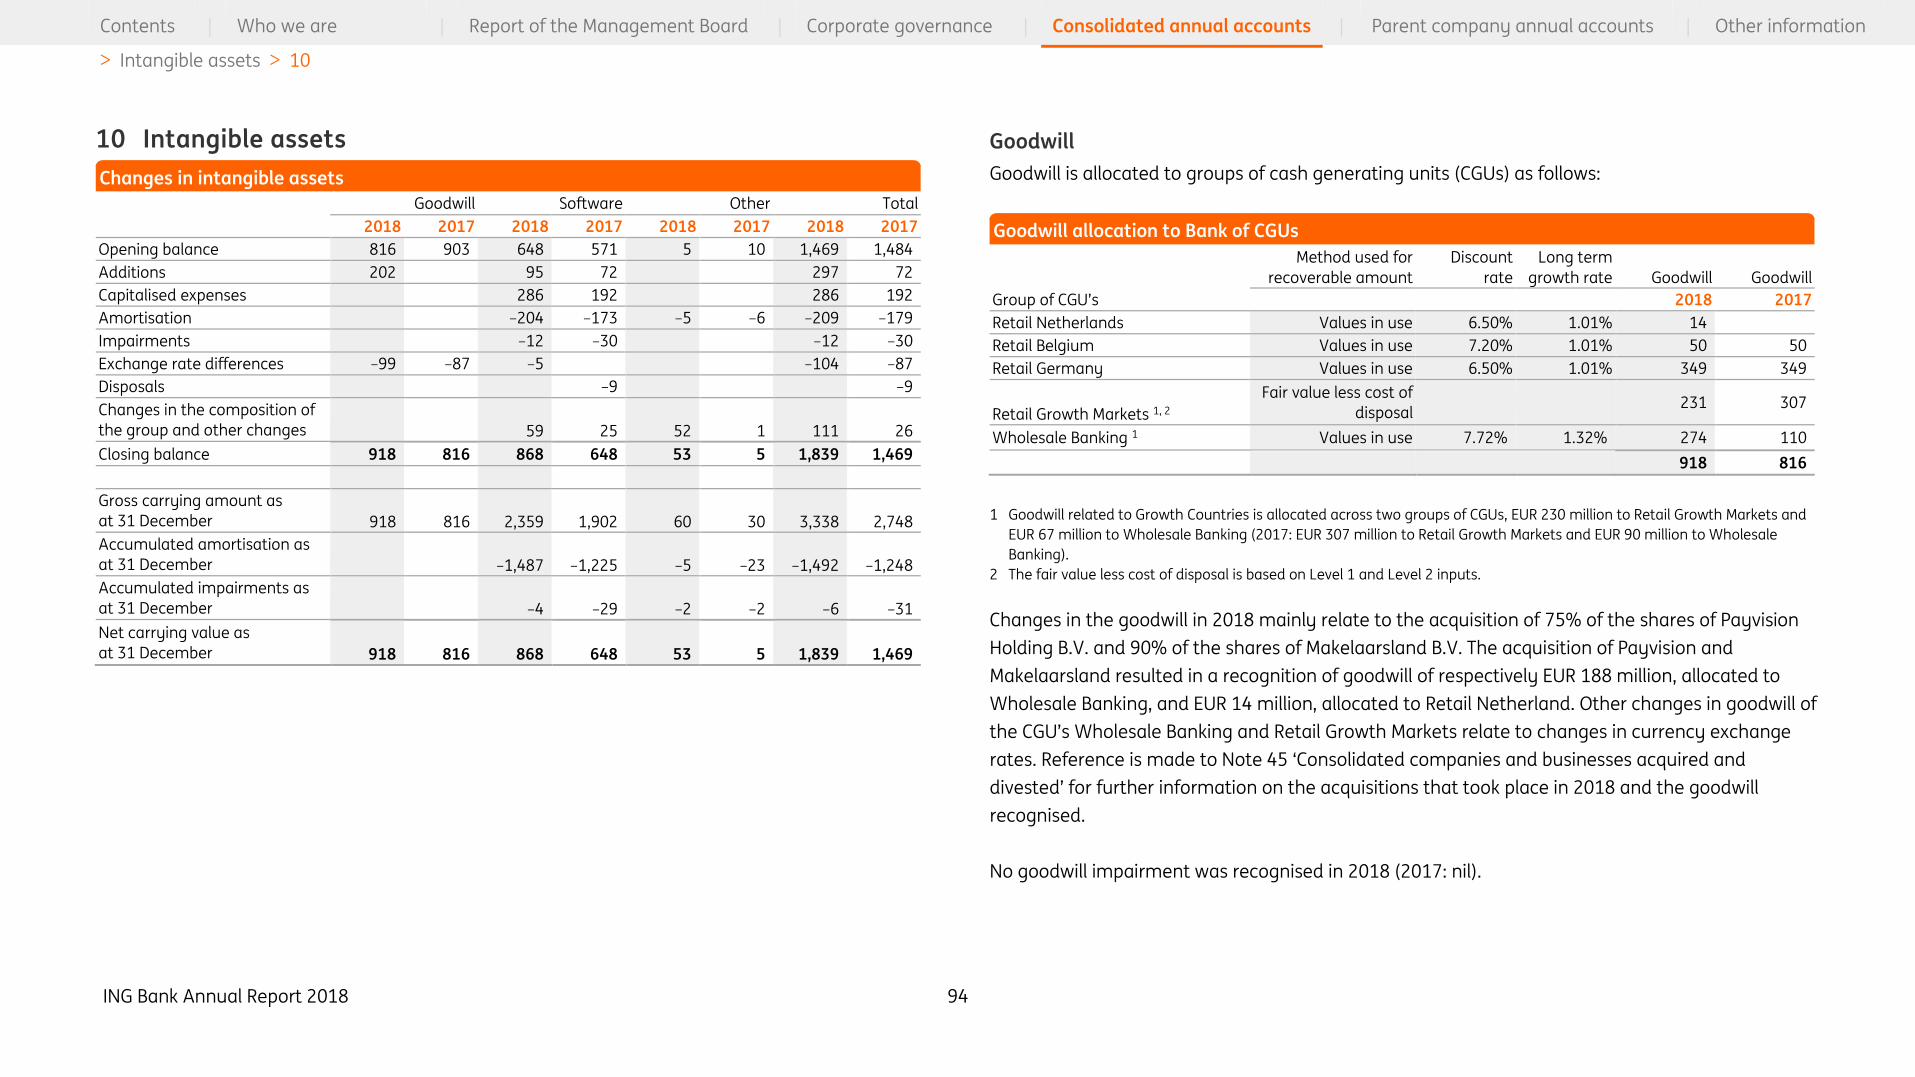
ING Bank Annual Report 2018 94
Contents | Who we are | Report of the Management Board | Corporate governance | Consolidated annual accounts | Parent company annual accounts | Other information
> Intangible assets > 10
10 Intangible assets
Goodwill Software Other Total
2018 2017 2018 2017 2018 2017 2018 2017
Opening balance 816 903 648 571 5 10 1,469 1,484
Additions 202 95 72 297 72
Capitalised expenses 286 192 286 192
Amortisation –204 –173 –5 –6 –209 –179
Impairments –12 –30 –12 –30
Exchange rate differences –99 –87 –5 –104 –87
Disposals –9 –0 –9
Changes in the composition of
the group and other changes 59 25 52 1 111 26
Closing balance 918 816 868 648 53 5 1,839 1,469
Gross carrying amount as
at 31 December 918 816 2,359 1,902 60 30 3,338 2,748
Accumulated amortisation as
at 31 December –1,487 –1,225 –5 –23 –1,492 –1,248
Accumulated impairments as
at 31 December –4 –29 –2 –2 –6 –31
Net carrying value as
at 31 December 918 816 868 648 53 5 1,839 1,469
Goodwill
Goodwill is allocated to groups of cash generating units (CGUs) as follows:
Method used for
recoverable amount
Discount
rate
Long term
growth rate Goodwill Goodwill
Group of CGU’s 2018 2017
Retail Netherlands Values in use 6.50% 1.01% 14
Retail Belgium Values in use 7.20% 1.01% 50 50
Retail Germany Values in use 6.50% 1.01% 349 349
Retail Growth Markets 1, 2
Fair value less cost of
disposal 231 307
Wholesale Banking 1 Values in use 7.72% 1.32% 274 110
918 816
1 Goodwill related to Growth Countries is allocated across two groups of CGUs, EUR 230 million to Retail Growth Markets and
EUR 67 million to Wholesale Banking (2017: EUR 307 million to Retail Growth Markets and EUR 90 million to Wholesale
Banking).
2 The fair value less cost of disposal is based on Level 1 and Level 2 inputs.
Changes in the goodwill in 2018 mainly relate to the acquisition of 75% of the shares of Payvision
Holding B.V. and 90% of the shares of Makelaarsland B.V. The acquisition of Payvision and
Makelaarsland resulted in a recognition of goodwill of respectively EUR 188 million, allocated to
Wholesale Banking, and EUR 14 million, allocated to Retail Netherland. Other changes in goodwill of
the CGU’s Wholesale Banking and Retail Growth Markets relate to changes in currency exchange
rates. Reference is made to Note 45 ‘Consolidated companies and businesses acquired and
divested’ for further information on the acquisitions that took place in 2018 and the goodwill
recognised.
No goodwill impairment was recognised in 2018 (2017: nil).
Changes in intangible assets
Goodwill allocation to Bank of CGUs
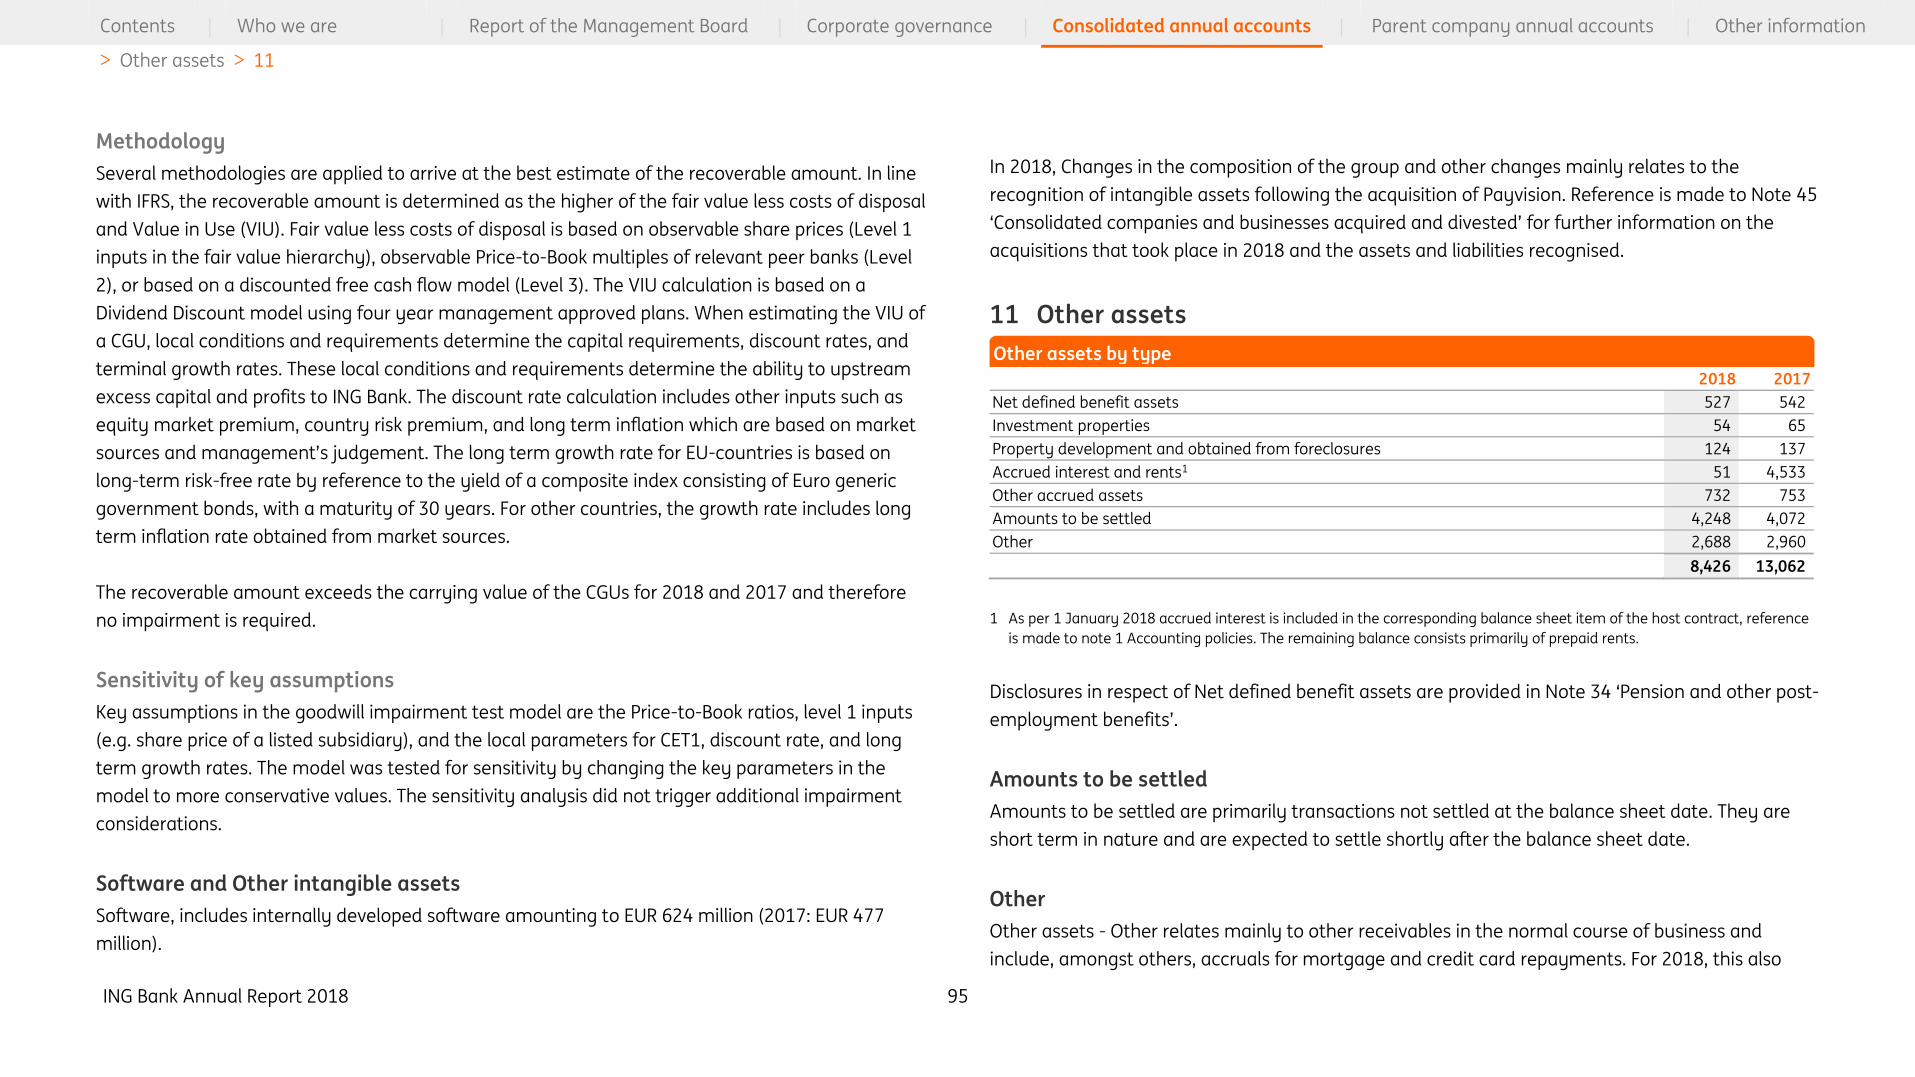
ING Bank Annual Report 2018 95
Contents | Who we are | Report of the Management Board | Corporate governance | Consolidated annual accounts | Parent company annual accounts | Other information
> Other assets > 11
Methodology
Several methodologies are applied to arrive at the best estimate of the recoverable amount. In line
with IFRS, the recoverable amount is determined as the higher of the fair value less costs of disposal
and Value in Use (VIU). Fair value less costs of disposal is based on observable share prices (Level 1
inputs in the fair value hierarchy), observable Price-to-Book multiples of relevant peer banks (Level
2), or based on a discounted free cash flow model (Level 3). The VIU calculation is based on a
Dividend Discount model using four year management approved plans. When estimating the VIU of
a CGU, local conditions and requirements determine the capital requirements, discount rates, and
terminal growth rates. These local conditions and requirements determine the ability to upstream
excess capital and profits to ING Bank. The discount rate calculation includes other inputs such as
equity market premium, country risk premium, and long term inflation which are based on market
sources and management’s judgement. The long term growth rate for EU-countries is based on
long-term risk-free rate by reference to the yield of a composite index consisting of Euro generic
government bonds, with a maturity of 30 years. For other countries, the growth rate includes long
term inflation rate obtained from market sources.
The recoverable amount exceeds the carrying value of the CGUs for 2018 and 2017 and therefore
no impairment is required.
Sensitivity of key assumptions
Key assumptions in the goodwill impairment test model are the Price-to-Book ratios, level 1 inputs
(e.g. share price of a listed subsidiary), and the local parameters for CET1, discount rate, and long
term growth rates. The model was tested for sensitivity by changing the key parameters in the
model to more conservative values. The sensitivity analysis did not trigger additional impairment
considerations.
Software and Other intangible assets
Software, includes internally developed software amounting to EUR 624 million (2017: EUR 477
million).
In 2018, Changes in the composition of the group and other changes mainly relates to the
recognition of intangible assets following the acquisition of Payvision. Reference is made to Note 45
‘Consolidated companies and businesses acquired and divested’ for further information on the
acquisitions that took place in 2018 and the assets and liabilities recognised.
11 Other assets
2018 2017
Net defined benefit assets 527 542
Investment properties 54 65
Property development and obtained from foreclosures 124 137
Accrued interest and rents1 51 4,533
Other accrued assets 732 753
Amounts to be settled 4,248 4,072
Other 2,688 2,960
8,426 13,062
1 As per 1 January 2018 accrued interest is included in the corresponding balance sheet item of the host contract, reference
is made to note 1 Accounting policies. The remaining balance consists primarily of prepaid rents.
Disclosures in respect of Net defined benefit assets are provided in Note 34 ‘Pension and other post-
employment benefits’.
Amounts to be settled
Amounts to be settled are primarily transactions not settled at the balance sheet date. They are
short term in nature and are expected to settle shortly after the balance sheet date.
Other
Other assets - Other relates mainly to other receivables in the normal course of business and
include, amongst others, accruals for mortgage and credit card repayments. For 2018, this also
Other assets by type

ING Bank Annual Report 2018 96
Contents | Who we are | Report of the Management Board | Corporate governance | Consolidated annual accounts | Parent company annual accounts | Other information
> Assets and liabilities held for sale > 12
includes a receivable at the Dutch level (from NN Group) regarding tax due by ING Australia
Holdings Ltd related to the years 2007-2013, for which a full reimbursement is expected to be
received from NN Group. As of 31 December 2018 the receivable due from NN Group including
interest amounts to EUR 107 million.
12 Assets and liabilities held for sale
Assets and liabilities held for sale includes disposal groups whose carrying amount will be recovered
principally through a sale transaction rather than through continuing operations. As at 31
December 2018 this relates to the intended sale of part of the ING Lease Italy business, for which
the transaction was not closed yet.
The assets held for sale are composed of lease receivables that were previously classified as Loans
and advances to customers.
Reference is made to Note 25 ‘Result on disposal of group companies’ and to Note 45 ‘Consolidated
companies and businesses acquired and divested’.
13 Deposits from banks
Deposits from banks include non-subordinated debt from banks, except for amounts in the form of
debt securities.
Netherlands International Total
2018 2017 2018 2017 2018 2017
Non-interest bearing 22 181 412 363 434 544
Interest bearing 17,211 17,230 19,686 19,047 36,896 36,277
17,233 17,411 20,097 19,410 37,330 36,821
Deposits from banks includes ING’s participation in the targeted longer-term refinancing operations
(TLTRO) with EUR 10.7 billion in 2016 and an additional EUR 7 billion in 2017. The TLTRO aims to
stimulate lending to the real economy in the Eurozone. The interest rate on the TLTRO’s is fixed
over the life of each operation at the benchmark rate of the European Central Bank.
Reference is made to Note 41 ‘Transfer of financial assets’ for information on securities lending as
well as sale and repurchase transactions.
14 Customer deposits
2018 2017
Savings accounts 322,795 319,659
Credit balances on customer accounts 202,168 186,455
Corporate deposits 36,735 39,655
Other 18,597 6,921
580,294 552,690
Deposits from banks by type
Customer deposits
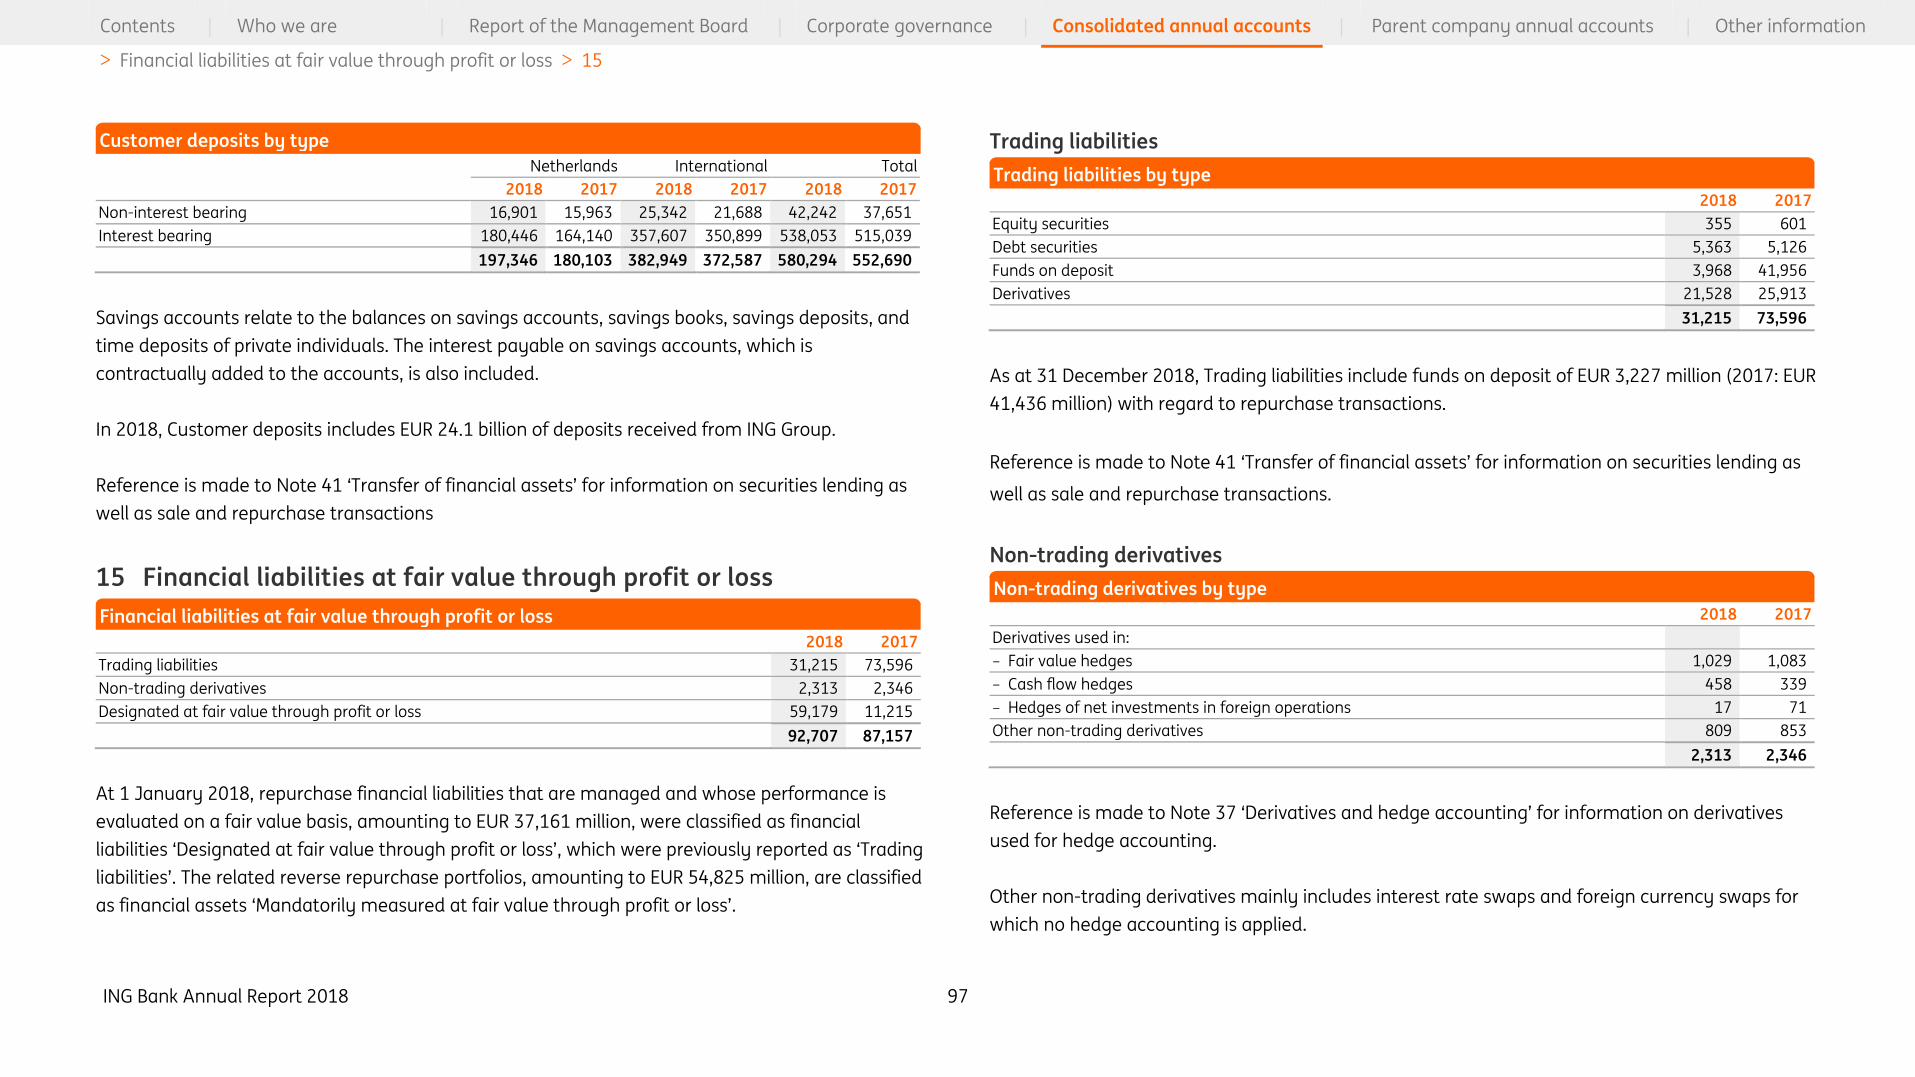
ING Bank Annual Report 2018 97
Contents | Who we are | Report of the Management Board | Corporate governance | Consolidated annual accounts | Parent company annual accounts | Other information
> Financial liabilities at fair value through profit or loss > 15
Netherlands International Total
2018 2017 2018 2017 2018 2017
Non-interest bearing 16,901 15,963 25,342 21,688 42,242 37,651
Interest bearing 180,446 164,140 357,607 350,899 538,053 515,039
197,346 180,103 382,949 372,587 580,294 552,690
Savings accounts relate to the balances on savings accounts, savings books, savings deposits, and
time deposits of private individuals. The interest payable on savings accounts, which is
contractually added to the accounts, is also included.
In 2018, Customer deposits includes EUR 24.1 billion of deposits received from ING Group.
Reference is made to Note 41 ‘Transfer of financial assets’ for information on securities lending as
well as sale and repurchase transactions
15 Financial liabilities at fair value through profit or loss
2018 2017
Trading liabilities 31,215 73,596
Non-trading derivatives 2,313 2,346
Designated at fair value through profit or loss 59,179 11,215
92,707 87,157
At 1 January 2018, repurchase financial liabilities that are managed and whose performance is
evaluated on a fair value basis, amounting to EUR 37,161 million, were classified as financial
liabilities ‘Designated at fair value through profit or loss’, which were previously reported as ‘Trading
liabilities’. The related reverse repurchase portfolios, amounting to EUR 54,825 million, are classified
as financial assets ‘Mandatorily measured at fair value through profit or loss’.
Trading liabilities
2018 2017
Equity securities 355 601
Debt securities 5,363 5,126
Funds on deposit 3,968 41,956
Derivatives 21,528 25,913
31,215 73,596
As at 31 December 2018, Trading liabilities include funds on deposit of EUR 3,227 million (2017: EUR
41,436 million) with regard to repurchase transactions.
Reference is made to Note 41 ‘Transfer of financial assets’ for information on securities lending as
well as sale and repurchase transactions.
Non-trading derivatives
2018 2017
Derivatives used in:
– Fair value hedges 1,029 1,083
– Cash flow hedges 458 339
– Hedges of net investments in foreign operations 17 71
Other non-trading derivatives 809 853
2,313 2,346
Reference is made to Note 37 ‘Derivatives and hedge accounting’ for information on derivatives
used for hedge accounting.
Other non-trading derivatives mainly includes interest rate swaps and foreign currency swaps for
which no hedge accounting is applied.
Customer deposits by type
Financial liabilities at fair value through profit or loss
Trading liabilities by type
Non-trading derivatives by type
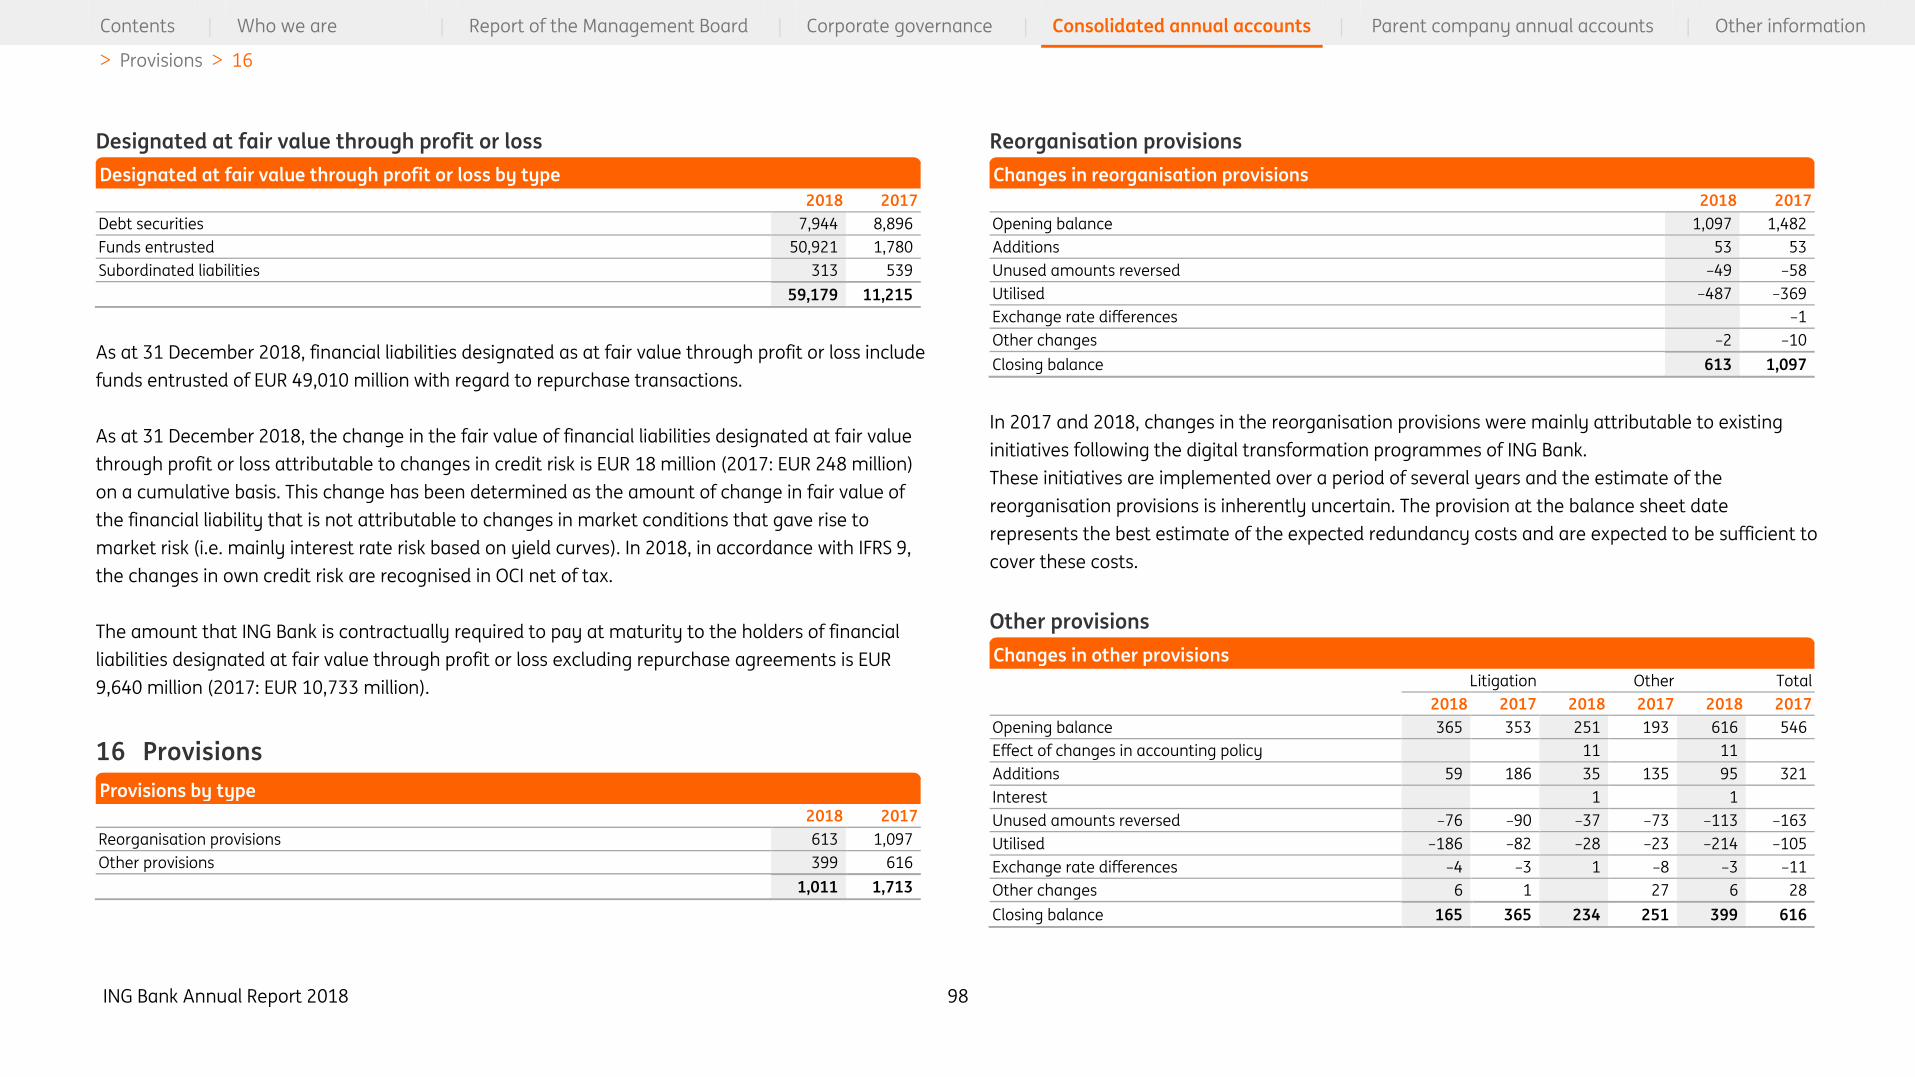
ING Bank Annual Report 2018 98
Contents | Who we are | Report of the Management Board | Corporate governance | Consolidated annual accounts | Parent company annual accounts | Other information
> Provisions > 16
Designated at fair value through profit or loss
2018 2017
Debt securities 7,944 8,896
Funds entrusted 50,921 1,780
Subordinated liabilities 313 539
59,179 11,215
As at 31 December 2018, financial liabilities designated as at fair value through profit or loss include
funds entrusted of EUR 49,010 million with regard to repurchase transactions.
As at 31 December 2018, the change in the fair value of financial liabilities designated at fair value
through profit or loss attributable to changes in credit risk is EUR 18 million (2017: EUR 248 million)
on a cumulative basis. This change has been determined as the amount of change in fair value of
the financial liability that is not attributable to changes in market conditions that gave rise to
market risk (i.e. mainly interest rate risk based on yield curves). In 2018, in accordance with IFRS 9,
the changes in own credit risk are recognised in OCI net of tax.
The amount that ING Bank is contractually required to pay at maturity to the holders of financial
liabilities designated at fair value through profit or loss excluding repurchase agreements is EUR
9,640 million (2017: EUR 10,733 million).
16 Provisions
2018 2017
Reorganisation provisions 613 1,097
Other provisions 399 616
1,011 1,713
Reorganisation provisions
2018 2017
Opening balance 1,097 1,482
Additions 53 53
Unused amounts reversed –49 –58
Utilised –487 –369
Exchange rate differences –1
Other changes –2 –10
Closing balance 613 1,097
In 2017 and 2018, changes in the reorganisation provisions were mainly attributable to existing
initiatives following the digital transformation programmes of ING Bank.
These initiatives are implemented over a period of several years and the estimate of the
reorganisation provisions is inherently uncertain. The provision at the balance sheet date
represents the best estimate of the expected redundancy costs and are expected to be sufficient to
cover these costs.
Other provisions
Litigation Other Total
2018 2017 2018 2017 2018 2017
Opening balance 365 353 251 193 616 546
Effect of changes in accounting policy 11 11
Additions 59 186 35 135 95 321
Interest 1 1
Unused amounts reversed –76 –90 –37 –73 –113 –163
Utilised –186 –82 –28 –23 –214 –105
Exchange rate differences –4 –3 1 –8 –3 –11
Other changes 6 1 –0 27 6 28
Closing balance 165 365 234 251 399 616
Designated at fair value through profit or loss by type
Provisions by type
Changes in reorganisation provisions
Changes in other provisions

ING Bank Annual Report 2018 99
Contents | Who we are | Report of the Management Board | Corporate governance | Consolidated annual accounts | Parent company annual accounts | Other information
> Other liabilities > 17
In 2018, Other provisions – other includes provisions related to contingent liabilities amounting to
EUR 122 million, of which EUR 42 million relates to credit replacement facilities and EUR 80 million
relates to non-credit replacement facilities. As at 31 December 2018 amounts expected to be
settled within twelve months, amount to EUR 194 million. The amounts included in Other provisions
are based on best estimates with regard to amounts and timing of cash flows required to settle the
obligation.
Included in Other provisions – Litigation in 2018 and 2017, is a provision related to floating interest
rate derivatives that were sold in the Netherlands. Also included in this column in 2018 and 2017, is
a provision recognised for reimbursement of expenses associated with the formalisation of
mortgages at ING Spain.
Reference is made to Note 28 ‘Other operating expenses’ and Note 44 ‘Legal proceedings’.
17 Other liabilities
2018 2017
Net defined benefit liability 421 476
Other post-employment benefits 76 87
Other staff-related liabilities 473 504
Other taxation and social security contributions 403 479
Accrued interest and rents1 61 3,601
Costs payable 2,272 2,600
Amounts to be settled 6,026 4,993
Other 3,664 3,232
13,396 15,972
1 As per 1 January 2018 accrued interest is included in the corresponding balance sheet item of the host contract, reference
is made to Note 1 Accounting policies.
Disclosures in respect of Net defined benefit liabilities are provided in Note 34 ‘Pension and other
post-employment benefits’.
Other staff-related liabilities
Other staff-related liabilities includes vacation leave provisions, variable compensation provisions,
jubilee provisions, and disability/illness provisions.
Amounts to be settled
Amounts to be settled are primarily transactions not settled at the balance sheet date. They are
short term in nature and are expected to settle shortly after the balance sheet date.
Other
Other liabilities – Other relates mainly to year-end accruals in the normal course of business. This
represents mainly balances on margin accounts or amounts payable to customers.
18 Debt securities in issue
Debt securities in issue relate to debentures and other issued debt securities with either fixed
interest rates or interest rates based on floating interest rate levels, such as certificates of deposit
and accepted bills issued by ING Bank, except for subordinated items. Debt securities in issue do not
include debt securities presented as Financial liabilities at fair value through profit or loss. ING Bank
does not have debt securities that are issued on terms other than those available in the normal
course of business. The maturities of the debt securities are as follows:
Other liabilities by type

ING Bank Annual Report 2018 100
Contents | Who we are | Report of the Management Board | Corporate governance | Consolidated annual accounts | Parent company annual accounts | Other information
> Subordinated loans > 19
2018 2017
Fixed rate debt securities
Within 1 year 32,626 29,296
More than 1 year but less than 2 years 7,766 7,084
More than 2 years but less than 3 years 10,267 7,629
More than 3 years but less than 4 years 5,488 8,369
More than 4 years but less than 5 years 3,123 5,432
More than 5 years 11,137 8,038
Total fixed rate debt securities 70,406 65,848
Floating rate debt securities
Within 1 year 22,684 15,091
More than 1 year but less than 2 years 4,134 3,932
More than 2 years but less than 3 years 1,587 1,341
More than 3 years but less than 4 years 130 278
More than 4 years but less than 5 years 165 150
More than 5 years 3,054 3,591
Total floating rate debt securities 31,753 24,383
Total debt securities¹ 102,159 90,231
1 Per 1 January 2018 the debt securities in issue includes accrued interest (EUR 0.7 billion), reference is made to Note 1
'Accounting policies'.
In 2018, the increase in Debt securities in issue of EUR 11.2 billion is mainly attributable to an
increase in commercial paper of EUR 12.9 billion, certificates of deposit of EUR 1.7 billion and
covered bonds of EUR 0.9 billion, partially offset by a decrease in other Debt securities in issue of
EUR 2.3 billion and long term maturity bonds of EUR 2.0 billion.
19 Subordinated loans
Subordinated loans relate to subordinated capital debentures and private loans which may be
included in the calculation of the capital ratio.
Subordinated loans include loans that qualify as Tier 1 capital. These loans have been placed with
ING Bank N.V. by ING Groep N.V.
2018 2017
Opening balance 15,831 16,104
Effect of changes in accounting policy 170
New issuances 1,828 2,314
Repayments –4,594 –1,246
Exchange rate differences and other 408 –1,341
Closing balance 13,643 15,831
In March 2018 ING Groep N.V. issued EUR 750 million and USD 1,250 million securities that qualify
as subordinated CRD IV Tier 2 notes with coupon of 2.00% until 22 March 2030 and 4.70% until 22
March 2028 respectively. Both issuances are placed with ING Bank N.V. under the same conditions.
In May 2018 ING redeemed the EUR 1,000 million 6.125% and the GBP 800 million 6.875% Tier 2
Debt Securities. In November ING redeemed the EUR 1,057 million 3.50% and the USD 2,058 million
4.125% Tier 2 Debt Securities.
The average interest rate on subordinated loans is 4.40% (2017: 4.65%). The interest expense
during the year 2018 was EUR 700 million (2017: EUR 756 million).
For additional information, reference is made to the Parent company annual accounts, Note 16
‘Subordinated loans’.
Debt securities in issue – maturities
Changes in subordinated loans

ING Bank Annual Report 2018 101
Contents | Who we are | Report of the Management Board | Corporate governance | Consolidated annual accounts | Parent company annual accounts | Other information
> Equity > 20
Equity
20 Equity
2018 2017 2016
Share capital and share premium
- Share capital 525 525 525
- Share premium 16,542 16,542 16,542
17,067 17,067 17,067
Other reserves
- Revaluation reserve: Available-for-sale and other n/a 3,449 3,832
- Revaluation reserve: Equity securities at FVOCI 1,914 n/a n/a
- Revaluation reserve: Debt instruments at FVOCI 365 n/a n/a
- Revaluation reserve: Cash flow hedge 604 263 777
- Revaluation reserve Credit liability 8 n/a n/a
- Revaluation reserve: Property in own use 202 201 201
- Net defined benefit asset/liability remeasurement reserve –394 –400 –371
- Currency translation reserve –2,068 –1,682 –791
- Share of associates and joint ventures and other reserves 2,872 2,473 2,187
3,504 4,304 5,835
Retained earnings 23,602 22,291 20,638
Shareholders’ equity (parent) 44,173 43,662 43,540
Non-controlling interests 803 715 606
Total equity 44,976 44,377 44,146
The following components of equity, as included in Other reserves, cannot be freely distributed:
Revaluation reserve, Net defined benefit asset/liability remeasurement reserve, Currency
translation reserve, Share of associates and joint ventures reserve and the part of Other reserves
that relates to the former Stichting Regio Bank and the former Stichting Vakbondsspaarbank SPN.
Share capital and share premium
Share capital
Ordinary shares (par value EUR 1.13)
Number x 1,000 Amount
2018 2017 2016 2018 2017 2016
Authorised share capital 1,600,000 1,600,000 1,600,000 1,808 1,808 1,808
Unissued share capital 1,134,965 1,134,965 1,134,965 1,283 1,283 1,283
Issued share capital 465,035 465,035 465,035 525 525 525
No change occurred in the issued share capital and share premium in 2018, 2017 and 2016.
All ordinary shares are in registered form. No share certificates have been issued. Ordinary shares
may be transferred by means of a deed of transfer, subject to the approval of the general meeting
of ING Bank. The par value of ordinary shares is EUR 1.13.
The authorised ordinary share capital of ING Bank N.V. consists of 1,600 million shares of which as
at 31 December 2018, 465 million ordinary shares were issued and fully paid.
ING Bank has 50 authorised preference shares with par value of EUR 1.13 per preference share. As
at 31 December 2018, 7 preference shares were issued and fully paid (2017: 7 preference shares;
2016: 7 preference shares) amounting to EUR 8 (2017: EUR 8 and 2016: EUR 8).
Total equity
Share capital
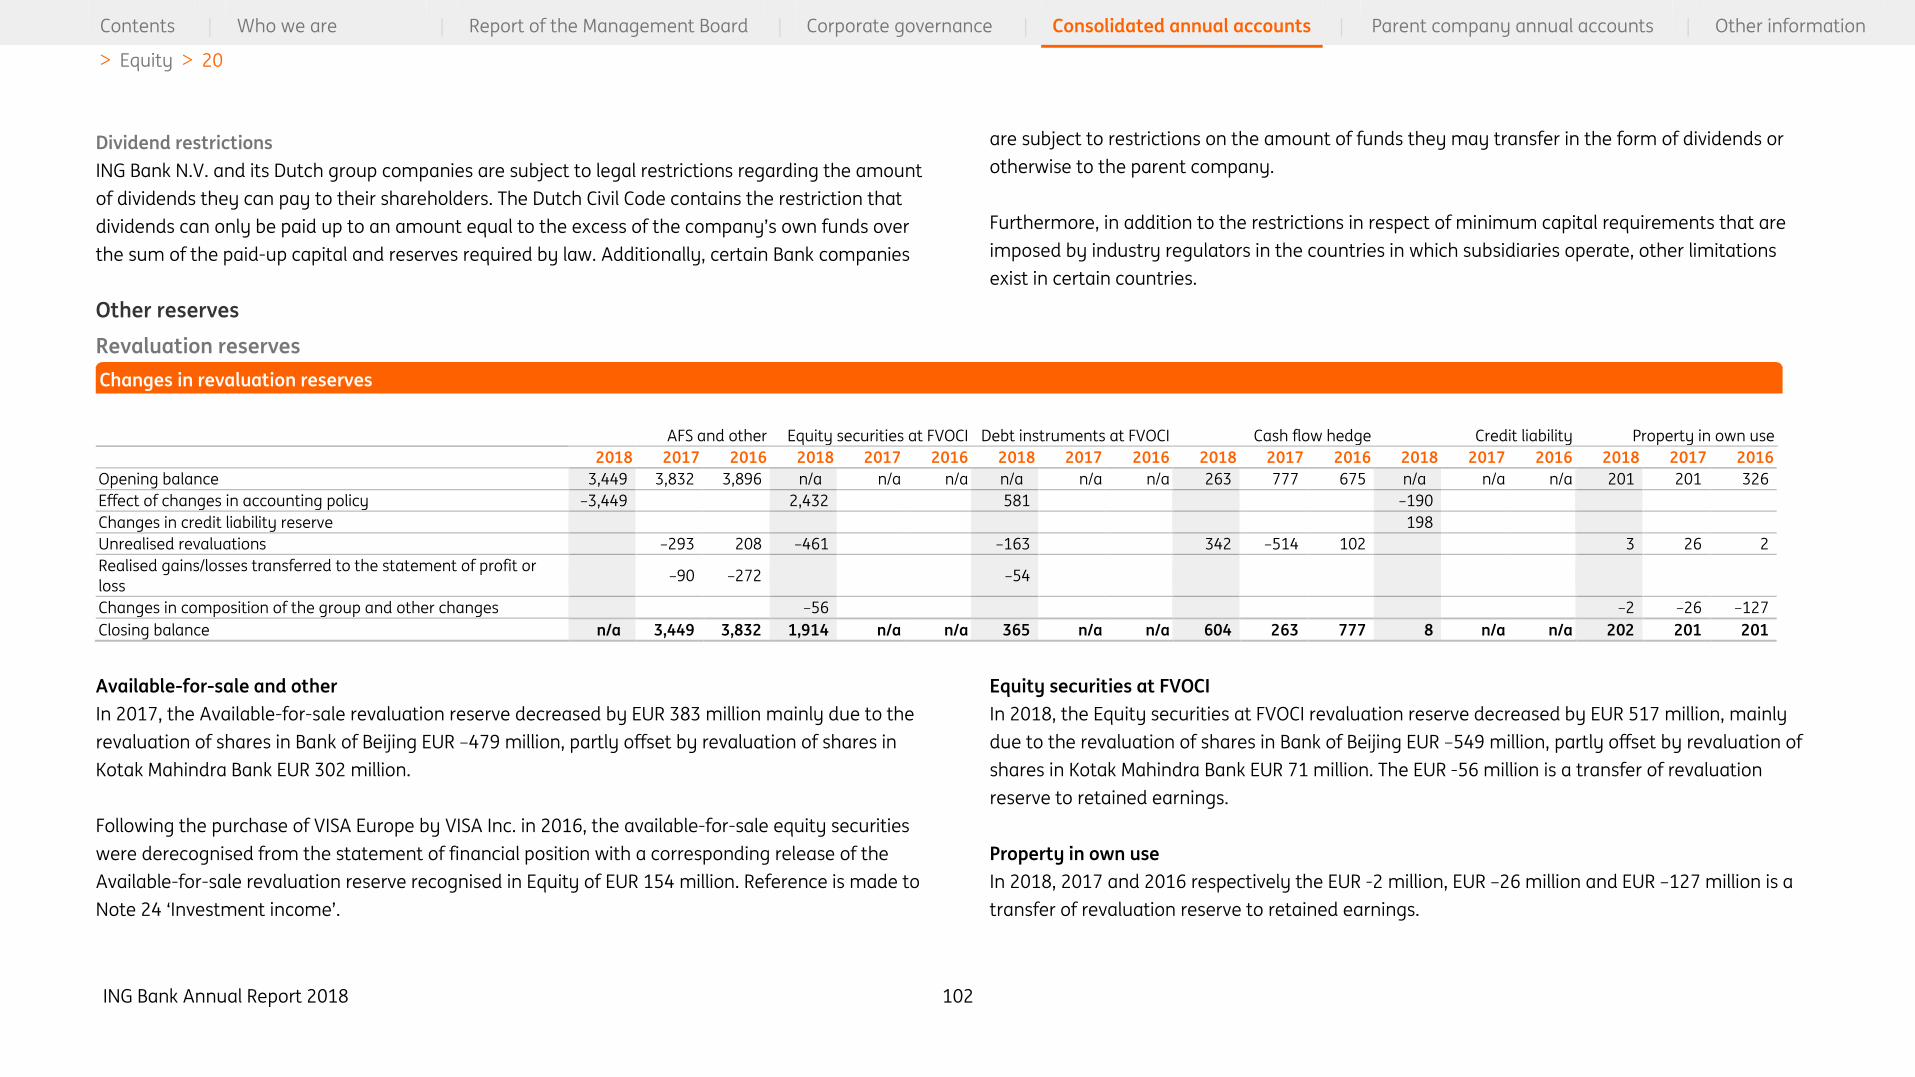
ING Bank Annual Report 2018 102
Contents | Who we are | Report of the Management Board | Corporate governance | Consolidated annual accounts | Parent company annual accounts | Other information
> Equity > 20
Dividend restrictions
ING Bank N.V. and its Dutch group companies are subject to legal restrictions regarding the amount
of dividends they can pay to their shareholders. The Dutch Civil Code contains the restriction that
dividends can only be paid up to an amount equal to the excess of the company’s own funds over
the sum of the paid-up capital and reserves required by law. Additionally, certain Bank companies
are subject to restrictions on the amount of funds they may transfer in the form of dividends or
otherwise to the parent company.
Furthermore, in addition to the restrictions in respect of minimum capital requirements that are
imposed by industry regulators in the countries in which subsidiaries operate, other limitations
exist in certain countries.
Other reserves
Revaluation reserves
AFS and other Equity securities at FVOCI Debt instruments at FVOCI Cash flow hedge Credit liability Property in own use
2018 2017 2016 2018 2017 2016 2018 2017 2016 2018 2017 2016 2018 2017 2016 2018 2017 2016
Opening balance 3,449 3,832 3,896 n/a n/a n/a n/a n/a n/a 263 777 675 n/a n/a n/a 201 201 326
Effect of changes in accounting policy –3,449 2,432 581 –190
Changes in credit liability reserve 198
Unrealised revaluations –293 208 –461 –163 342 –514 102 3 26 2
Realised gains/losses transferred to the statement of profit or
loss –90 –272 –54
Changes in composition of the group and other changes –56 –2 –26 –127
Closing balance n/a 3,449 3,832 1,914 n/a n/a 365 n/a n/a 604 263 777 8 n/a n/a 202 201 201
Available-for-sale and other
In 2017, the Available-for-sale revaluation reserve decreased by EUR 383 million mainly due to the
revaluation of shares in Bank of Beijing EUR –479 million, partly offset by revaluation of shares in
Kotak Mahindra Bank EUR 302 million.
Following the purchase of VISA Europe by VISA Inc. in 2016, the available-for-sale equity securities
were derecognised from the statement of financial position with a corresponding release of the
Available-for-sale revaluation reserve recognised in Equity of EUR 154 million. Reference is made to
Note 24 ‘Investment income’.
Equity securities at FVOCI
In 2018, the Equity securities at FVOCI revaluation reserve decreased by EUR 517 million, mainly
due to the revaluation of shares in Bank of Beijing EUR –549 million, partly offset by revaluation of
shares in Kotak Mahindra Bank EUR 71 million. The EUR -56 million is a transfer of revaluation
reserve to retained earnings.
Property in own use
In 2018, 2017 and 2016 respectively the EUR -2 million, EUR –26 million and EUR –127 million is a
transfer of revaluation reserve to retained earnings.
Changes in revaluation reserves

ING Bank Annual Report 2018 103
Contents | Who we are | Report of the Management Board | Corporate governance | Consolidated annual accounts | Parent company annual accounts | Other information
> Equity > 20
Net defined benefit asset/liability remeasurement reserve
Reference is made to Note 34 ‘Pension and other post-employment benefits’.
Currency translation reserve
2018 2017 2016
Opening balance –1,682 –791 –540
Unrealised revaluations 71 192 –76
Exchange rate differences –457 –1,083 –175
Closing balance –2,068 –1,682 –791
Unrealised revaluations relates to changes in the value of hedging instruments that are designated
as net investment hedges.
The hedging strategy is to hedge the CET1 ratio. The net decrease in currency translation reserve of
EUR 386 million is mainly caused by exchange rate differences in TRY and USD, which are not or
only partly hedged.
Share of associates, joint ventures and other reserves
2018 2017 2016
Opening balance 2,473 2,187 1,733
Effect of changes in accounting policy –23
Result for the year 160 153 124
Changes in composition of the group and other changes 261 133 330
Closing balance 2,872 2,473 2,187
Retained earnings
2018 2017 2016
Opening balance 22,291 20,638 18,006
Effect of changes in accounting policy –391
Transfer to/from other reserves –192 – –
Result for the year 4,447 4,866 4,103
Dividend –2,517 –3,176 –1,345
Employee stock options and share plans 59 69 72
Changes in composition of the group and other changes –96 –106 –198
Closing balance 23,602 22,291 20,638
In 2018, a cash dividend of EUR 2,517 million (2017: EUR 3,176 million and 2016: EUR 1,345 million)
was paid to the shareholder of ING Bank.
Changes in share of associates, joint ventures and other reserves
Changes in retained earnings
Changes in Currency translation reserve

ING Bank Annual Report 2018 104
Contents | Who we are | Report of the Management Board | Corporate governance | Consolidated annual accounts | Parent company annual accounts | Other information
> Net interest income > 21
21 Net interest income
2018 2017 2016 2018 2017 2016
Interest income on loans 19,390 18,405 18,457 Interest expense on deposits from banks 362 301 283
Interest income on financial assets at fair value through OCI 554 n/a n/a Interest expense on customer deposits 2,890 2,766 3,161
Interest income on financial assets at amortised cost 378 n/a n/a Interest expense on debt securities in issue 2,033 1,910 2,174
Interest income on non-trading derivatives (hedge accounting) 4,491 n/a n/a Interest expense on subordinated loans 700 756 780
Negative interest on liabilities 475 526 191 Negative interest on assets 412 407 184
Interest income using effective interest rate method 25,288 n/a n/a Interest expense on non-trading derivatives (hedge accounting) 4,826 5,946 6,720
Interest expense using effective interest rate method 11,222 n/a n/a
Interest income on financial assets at fair value through profit or loss 1,795 n/a n/a
Interest income on investments n/a 1,494 1,756 Interest expense on financial liabilities at fair value through profit or loss 1,577 n/a n/a
Interest income on trading derivatives n/a 16,109 16,081 Interest expense on trading derivatives n/a 16,118 16,263
Interest income on other trading portfolio n/a 1,028 728 Interest expense on other trading liabilities n/a 744 210
Interest income on non-trading derivatives (no hedge accounting) 683 629 666 Interest expense on non-trading derivatives (no hedge accounting) 1,011 929 766
Interest income on non-trading derivatives (hedge accounting) n/a 5,660 6,213 Interest expense other 33 329 363
Interest income other 25 137 129 Other interest expense 2,620 n/a n/a
Other interest income 2,504 n/a n/a
Interest income 27,792 43,988 44,221 Interest expense 13,842 30,206 30,904
Net interest income 13,949 13,782 13,317
Total Net interest income of EUR 13,949 million includes interest income and expense for
instruments calculated using the effective interest rate method and other interest income and
interest expense. IFRS 9 resulted in changes to IAS 1 for the presentation of Interest income for
instruments calculated using the effective interest rate method, which ING reports as a separate
line item in the consolidated statement of profit or loss as from current reporting period.
To further enhance the relevance of the interest disclosures, ING Bank changed its separate
presentation of interest (income and expenses) for trading derivatives, trading securities and
trading loans / deposits (mainly repo’s) to presenting the full fair value movements in ‘Valuation
results and net trading income’. The change in presentation is in line with the changed presentation
of accrued interest in the balance sheet that is no longer separately presented, but included in the
corresponding balance sheet item of the host contract.
The new interest presentation was applied prospectively together with the other presentation
requirements of IFRS 9.
Notes to the Consolidated statement of profit or loss
Net interest income
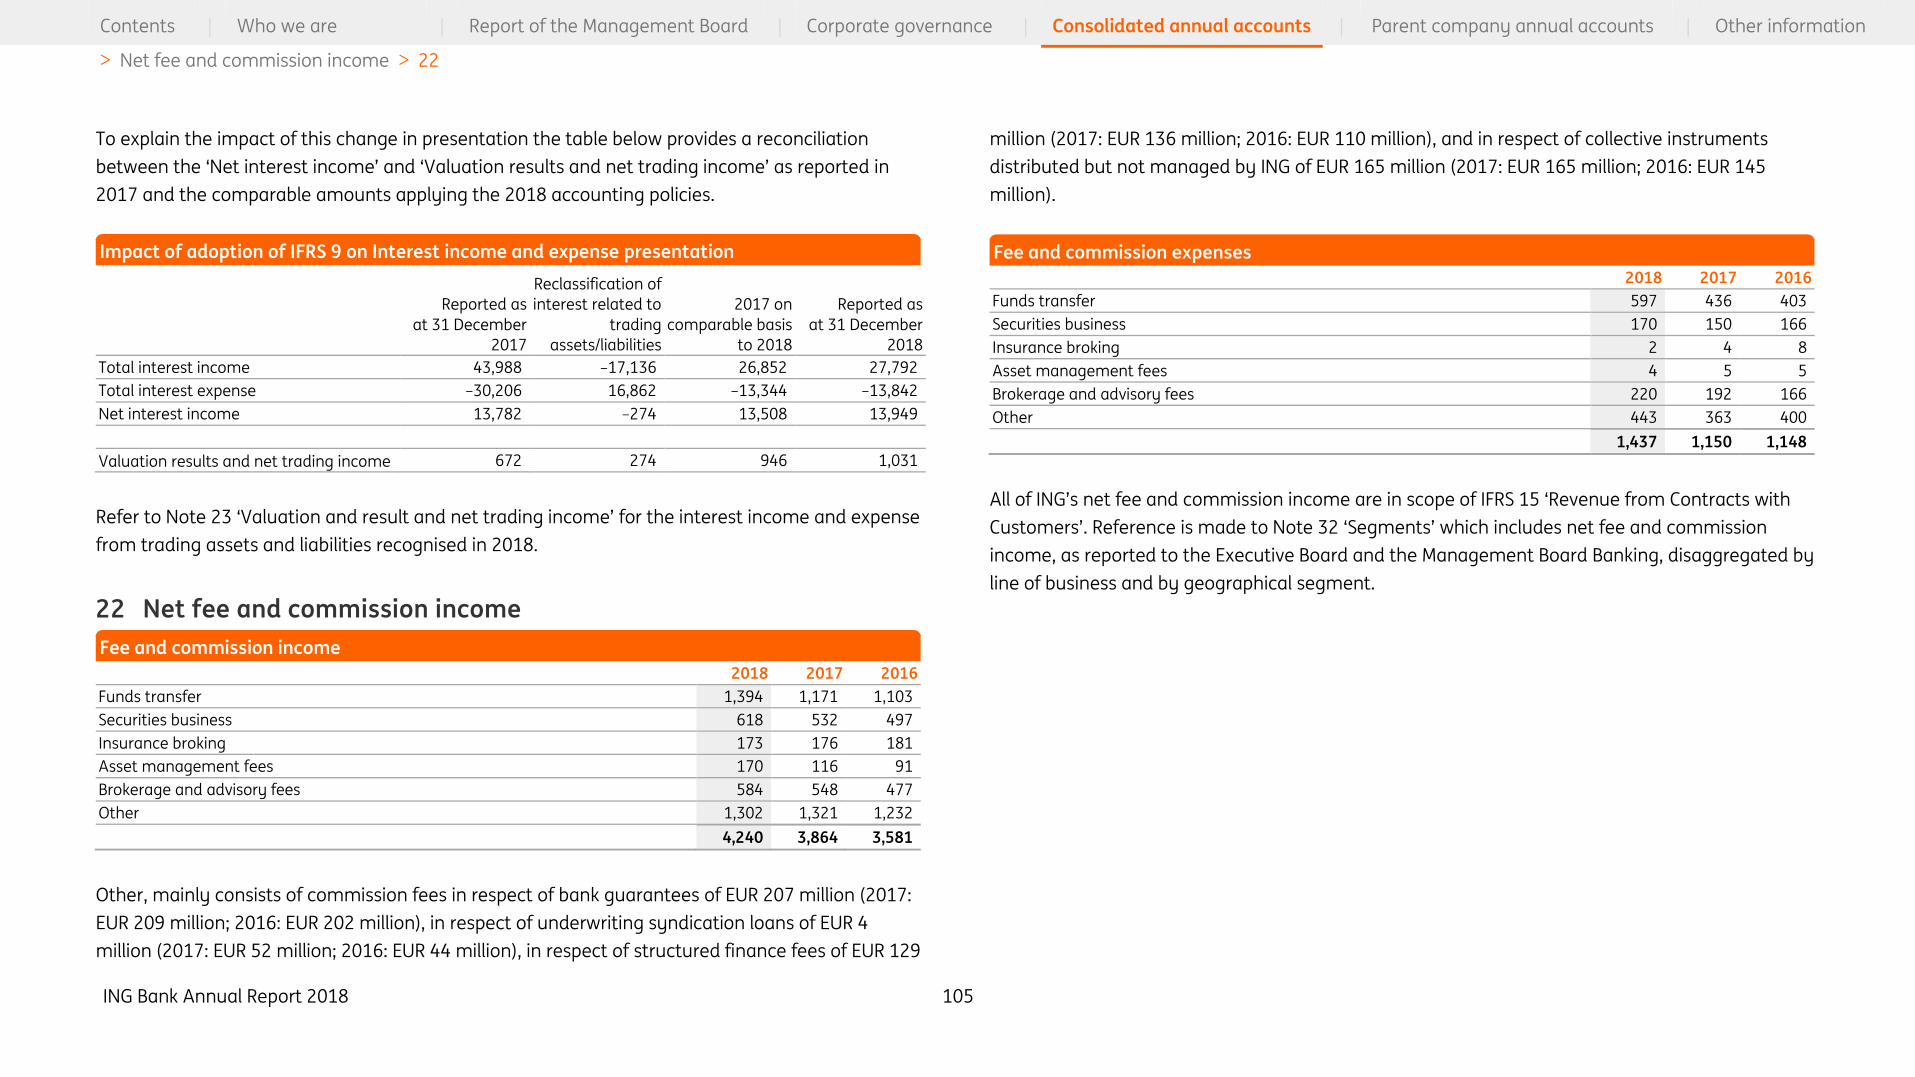
ING Bank Annual Report 2018 105
Contents | Who we are | Report of the Management Board | Corporate governance | Consolidated annual accounts | Parent company annual accounts | Other information
> Net fee and commission income > 22
To explain the impact of this change in presentation the table below provides a reconciliation
between the ‘Net interest income’ and ‘Valuation results and net trading income’ as reported in
2017 and the comparable amounts applying the 2018 accounting policies.
Reported as
at 31 December
2017
Reclassification of
interest related to
trading
assets/liabilities
2017 on
comparable basis
to 2018
Reported as
at 31 December
2018
Total interest income 43,988 –17,136 26,852 27,792
Total interest expense –30,206 16,862 –13,344 –13,842
Net interest income 13,782 –274 13,508 13,949
Valuation results and net trading income 672 274 946 1,031
Refer to Note 23 ‘Valuation and result and net trading income’ for the interest income and expense
from trading assets and liabilities recognised in 2018.
22 Net fee and commission income
2018 2017 2016
Funds transfer 1,394 1,171 1,103
Securities business 618 532 497
Insurance broking 173 176 181
Asset management fees 170 116 91
Brokerage and advisory fees 584 548 477
Other 1,302 1,321 1,232
4,240 3,864 3,581
Other, mainly consists of commission fees in respect of bank guarantees of EUR 207 million (2017:
EUR 209 million; 2016: EUR 202 million), in respect of underwriting syndication loans of EUR 4
million (2017: EUR 52 million; 2016: EUR 44 million), in respect of structured finance fees of EUR 129
million (2017: EUR 136 million; 2016: EUR 110 million), and in respect of collective instruments
distributed but not managed by ING of EUR 165 million (2017: EUR 165 million; 2016: EUR 145
million).
2018 2017 2016
Funds transfer 597 436 403
Securities business 170 150 166
Insurance broking 2 4 8
Asset management fees 4 5 5
Brokerage and advisory fees 220 192 166
Other 443 363 400
1,437 1,150 1,148
All of ING’s net fee and commission income are in scope of IFRS 15 ‘Revenue from Contracts with
Customers’. Reference is made to Note 32 ‘Segments’ which includes net fee and commission
income, as reported to the Executive Board and the Management Board Banking, disaggregated by
line of business and by geographical segment.
Fee and commission income
Fee and commission expenses Impact of adoption of IFRS 9 on Interest income and expense presentation
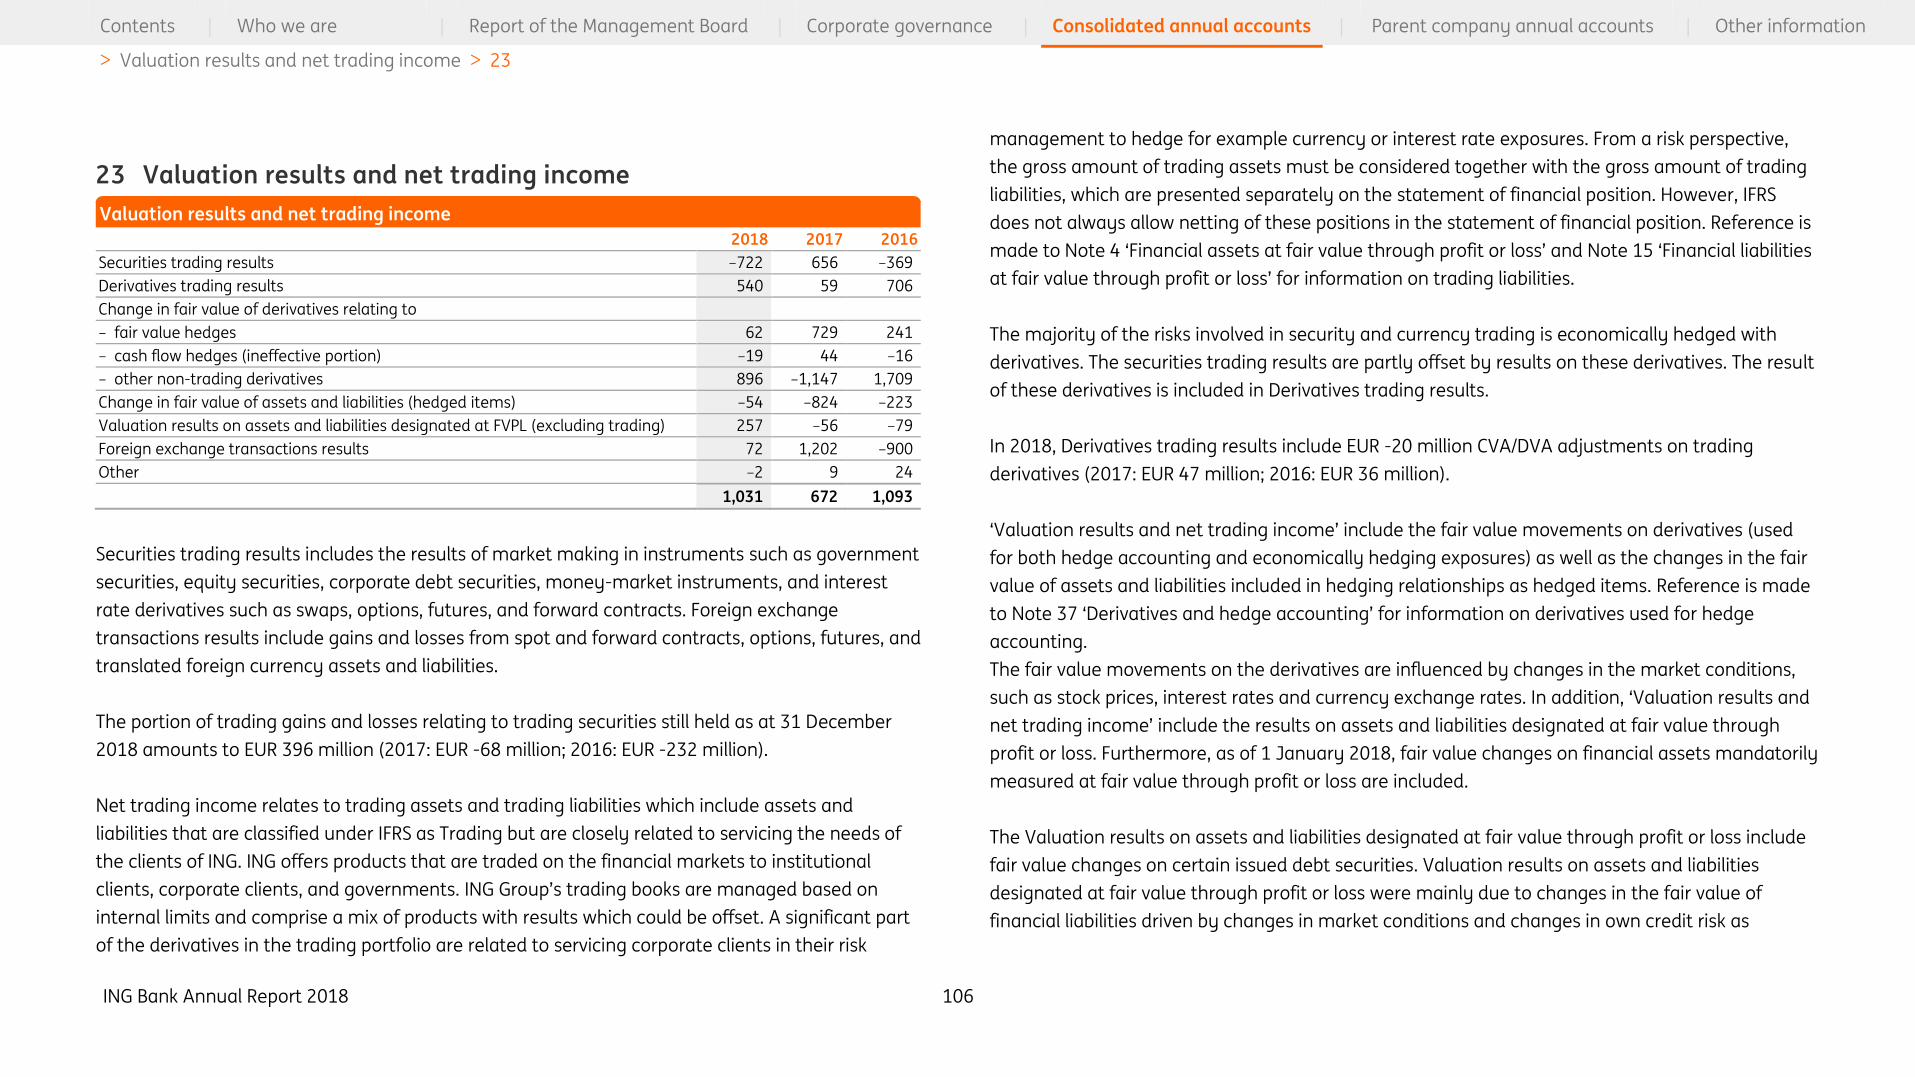
ING Bank Annual Report 2018 106
Contents | Who we are | Report of the Management Board | Corporate governance | Consolidated annual accounts | Parent company annual accounts | Other information
> Valuation results and net trading income > 23
23 Valuation results and net trading income
2018 2017 2016
Securities trading results –722 656 –369
Derivatives trading results 540 59 706
Change in fair value of derivatives relating to
– fair value hedges 62 729 241
– cash flow hedges (ineffective portion) –19 44 –16
– other non-trading derivatives 896 –1,147 1,709
Change in fair value of assets and liabilities (hedged items) –54 –824 –223
Valuation results on assets and liabilities designated at FVPL (excluding trading) 257 –56 –79
Foreign exchange transactions results 72 1,202 –900
Other –2 9 24
1,031 672 1,093
Securities trading results includes the results of market making in instruments such as government
securities, equity securities, corporate debt securities, money-market instruments, and interest
rate derivatives such as swaps, options, futures, and forward contracts. Foreign exchange
transactions results include gains and losses from spot and forward contracts, options, futures, and
translated foreign currency assets and liabilities.
The portion of trading gains and losses relating to trading securities still held as at 31 December
2018 amounts to EUR 396 million (2017: EUR -68 million; 2016: EUR -232 million).
Net trading income relates to trading assets and trading liabilities which include assets and
liabilities that are classified under IFRS as Trading but are closely related to servicing the needs of
the clients of ING. ING offers products that are traded on the financial markets to institutional
clients, corporate clients, and governments. ING Group’s trading books are managed based on
internal limits and comprise a mix of products with results which could be offset. A significant part
of the derivatives in the trading portfolio are related to servicing corporate clients in their risk
management to hedge for example currency or interest rate exposures. From a risk perspective,
the gross amount of trading assets must be considered together with the gross amount of trading
liabilities, which are presented separately on the statement of financial position. However, IFRS
does not always allow netting of these positions in the statement of financial position. Reference is
made to Note 4 ‘Financial assets at fair value through profit or loss’ and Note 15 ‘Financial liabilities
at fair value through profit or loss’ for information on trading liabilities.
The majority of the risks involved in security and currency trading is economically hedged with
derivatives. The securities trading results are partly offset by results on these derivatives. The result
of these derivatives is included in Derivatives trading results.
In 2018, Derivatives trading results include EUR -20 million CVA/DVA adjustments on trading
derivatives (2017: EUR 47 million; 2016: EUR 36 million).
‘Valuation results and net trading income’ include the fair value movements on derivatives (used
for both hedge accounting and economically hedging exposures) as well as the changes in the fair
value of assets and liabilities included in hedging relationships as hedged items. Reference is made
to Note 37 ‘Derivatives and hedge accounting’ for information on derivatives used for hedge
accounting.
The fair value movements on the derivatives are influenced by changes in the market conditions,
such as stock prices, interest rates and currency exchange rates. In addition, ‘Valuation results and
net trading income’ include the results on assets and liabilities designated at fair value through
profit or loss. Furthermore, as of 1 January 2018, fair value changes on financial assets mandatorily
measured at fair value through profit or loss are included.
The Valuation results on assets and liabilities designated at fair value through profit or loss include
fair value changes on certain issued debt securities. Valuation results on assets and liabilities
designated at fair value through profit or loss were mainly due to changes in the fair value of
financial liabilities driven by changes in market conditions and changes in own credit risk as
Valuation results and net trading income

ING Bank Annual Report 2018 107
Contents | Who we are | Report of the Management Board | Corporate governance | Consolidated annual accounts | Parent company annual accounts | Other information
> Investment income > 24
disclosed in Note 15 ‘Financial liabilities at fair value through profit or loss’. Market conditions
include in particular credit spread developments.
In 2018, Valuation results on assets and liabilities designated at fair value through profit or loss
(excluding trading) include fair value adjustments on own issued notes amounting to EUR 301
million (2017: EUR -105 million; 2016: EUR -70 million). DVA adjustment on own issued notes is no
longer included in Valuation results (2017: EUR -79 million; 2016: EUR -50 million). In 2018, in
accordance with IFRS 9, the DVA adjustments on own issued notes are recognised in OCI.
Interest income from trading assets in 2018 amounted to EUR 13,924 million.
Interest expense from trading liabilities in 2018 amounted to EUR 13,976 million.
‘Valuation results and net trading income’ are reflected in the Consolidated statement of cash flows
in the line Result before tax - Adjusted for: other.
24 Investment income
20181 2017 2016
Dividend income 102 80 87
Realised gains/losses on disposal of debt instruments measured at FVOCI 77 n/a n/a
Realised gains/losses on disposal of Available-for-sale debt securities n/a 64 107
Impairments of Available-for-sale debt securities n/a - -
Reversal of impairments of Available-for-sale debt securities n/a 3 -
Realised gains/losses and impairments of debt instruments measured at FVOCI 77 67 107
Realised gains/losses on disposal of Available-for-sale equity securities n/a 48 236
Impairments of Available-for-sale equity securities n/a –6 –13
Realised gains/losses and impairments of Available-for-sale equity securities n/a 42 223
Income from and fair value gains/losses on investment properties 4 3 4
Investment income 183 192 421
1 The adoption of IFRS 9 led to new presentation requirements for 2018; prior period amounts have not been restated.
Reference is made to Note 1 ‘Accounting policies’.
In 2018 and 2017, Dividend income mainly consists of dividend received from ING’s equity stake in
Bank of Beijing.
In 2016, Dividend income mainly consists of dividend received from ING’s equity stake in Bank of
Beijing and dividend received as a result of the merger between Equens SE and Worldline (EUR 16
million).
In 2016, Realised gains/losses on disposal of equity securities included EUR 163 million mainly
comprising the gain on disposal of the shares held in VISA Europe Limited. For further information
on the disposal of shares held in VISA Europe Limited, reference is made to Note 8 ‘Share of
associates and joint ventures’, and Note 20 ‘Equity’.
Investment income
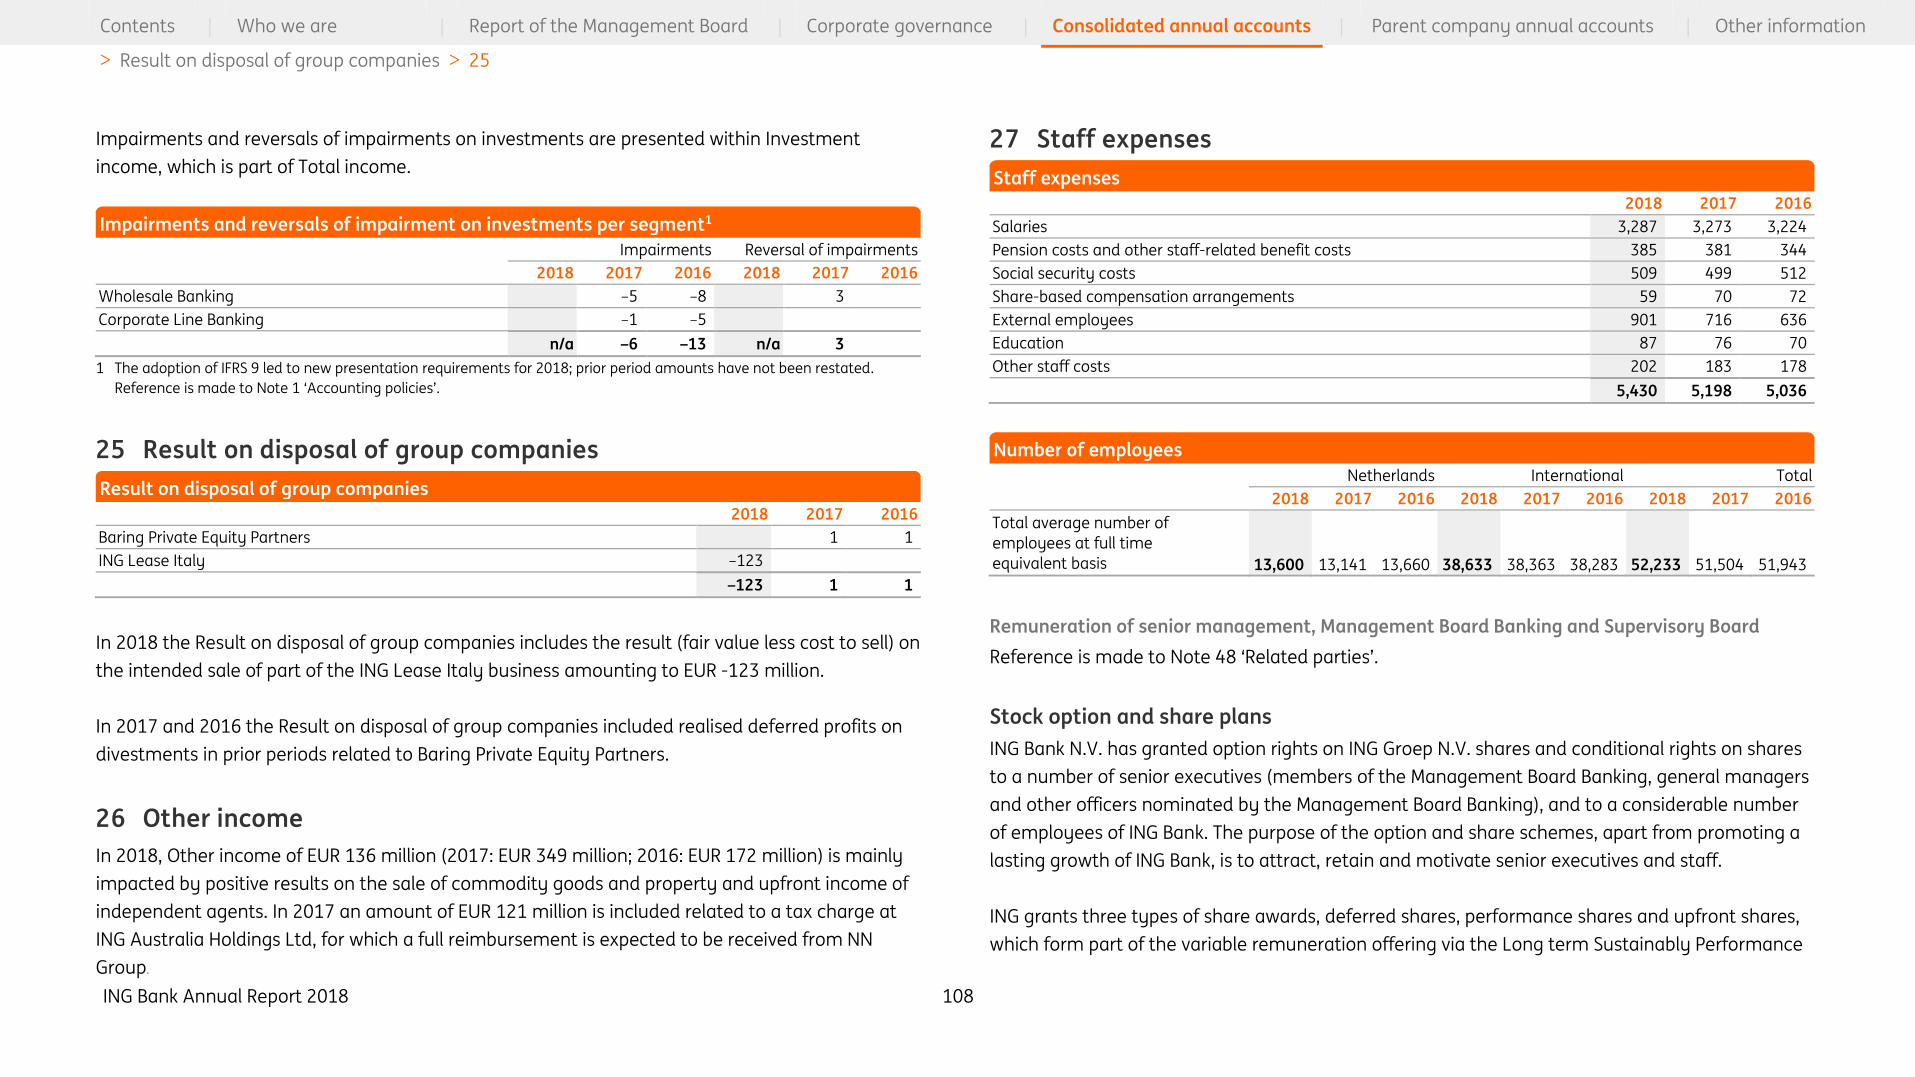
ING Bank Annual Report 2018 108
Contents | Who we are | Report of the Management Board | Corporate governance | Consolidated annual accounts | Parent company annual accounts | Other information
> Result on disposal of group companies > 25
Impairments and reversals of impairments on investments are presented within Investment
income, which is part of Total income.
Impairments Reversal of impairments
2018 2017 2016 2018 2017 2016
Wholesale Banking –5 –8 3
Corporate Line Banking –1 –5
n/a –6 –13 n/a 3
1 The adoption of IFRS 9 led to new presentation requirements for 2018; prior period amounts have not been restated.
Reference is made to Note 1 ‘Accounting policies’.
25 Result on disposal of group companies
2018 2017 2016
Baring Private Equity Partners 1 1
ING Lease Italy –123
–123 1 1
In 2018 the Result on disposal of group companies includes the result (fair value less cost to sell) on
the intended sale of part of the ING Lease Italy business amounting to EUR -123 million.
In 2017 and 2016 the Result on disposal of group companies included realised deferred profits on
divestments in prior periods related to Baring Private Equity Partners.
26 Other income
In 2018, Other income of EUR 136 million (2017: EUR 349 million; 2016: EUR 172 million) is mainly
impacted by positive results on the sale of commodity goods and property and upfront income of
independent agents. In 2017 an amount of EUR 121 million is included related to a tax charge at
ING Australia Holdings Ltd, for which a full reimbursement is expected to be received from NN
Group.
27 Staff expenses
2018 2017 2016
Salaries 3,287 3,273 3,224
Pension costs and other staff-related benefit costs 385 381 344
Social security costs 509 499 512
Share-based compensation arrangements 59 70 72
External employees 901 716 636
Education 87 76 70
Other staff costs 202 183 178
5,430 5,198 5,036
Netherlands International Total
2018 2017 2016 2018 2017 2016 2018 2017 2016
Total average number of
employees at full time
equivalent basis 13,600 13,141 13,660 38,633 38,363 38,283 52,233 51,504 51,943
Remuneration of senior management, Management Board Banking and Supervisory Board
Reference is made to Note 48 ‘Related parties’.
Stock option and share plans
ING Bank N.V. has granted option rights on ING Groep N.V. shares and conditional rights on shares
to a number of senior executives (members of the Management Board Banking, general managers
and other officers nominated by the Management Board Banking), and to a considerable number
of employees of ING Bank. The purpose of the option and share schemes, apart from promoting a
lasting growth of ING Bank, is to attract, retain and motivate senior executives and staff.
ING grants three types of share awards, deferred shares, performance shares and upfront shares,
which form part of the variable remuneration offering via the Long term Sustainably Performance
Impairments and reversals of impairment on investments per segment1
Result on disposal of group companies
Staff expenses
Number of employees

ING Bank Annual Report 2018 109
Contents | Who we are | Report of the Management Board | Corporate governance | Consolidated annual accounts | Parent company annual accounts | Other information
> Staff expenses > 27
Plan (LSPP). The entitlement to the share awards is granted conditionally. If the participant remains
in employment for an uninterrupted period between the grant date and the vesting date, the
entitlement becomes unconditional, with the exception of the upfront shares which are
immediately vested upon grant. In addition to the employment condition, the performance shares
require a performance condition that needs to be satisfied before a vest can occur. The number of
ING shares that would ultimately be vested at the end of a performance period is dependent on
ING’s performance over that period. Upfront and deferred shares awarded to the Management
Board members of ING Bank as well as identified staff, have a retention obligation that must be
adhered to upon vesting, a minimum retention of 12 months applies. ING has the authority to
apply a hold back to awarded but unvested shares and a claw-back to vested shares.
In addition to the LSPP share awards, ING also pays a number of senior employees fixed shares. The
number of shares are determined each month from a cash value that forms part of the employee
fixed remuneration. The shares are immediately vested to the employee, but have a minimum
holding requirement of two years before the employee can dispose of the shares. The fixed shares
are not subject to holdback or clawback.
The information presented below on stock options and share plans on ING Bank N.V. shares
includes personnel employed by entities that are presented as continuing operations as well as
held for sale and discontinued operations.
The shares granted in 2018 relate to performance year 2017. In 2018, 111,779 share awards (2017:
159,217; 2016: 232,281) were granted to the members of the Management Board Banking. To
senior management and other employees 3,989,214 share awards (2017: 4,846,903; 2016:
6,590,039) were granted.
Every year, the ING Group Executive Board decides whether the option and share schemes are to
be continued and, if so, to what extent. In 2010, the Group Executive Board decided not to continue
the option scheme as from 2011. The existing option schemes, up and until 2010, will be run off in
the coming years.
The option rights are valid for a period of ten years. Option rights that are not exercised within this
period, lapse. Option rights granted will remain valid until the expiry date, even if the option
scheme is discontinued. The option rights are subject to certain conditions, including a pre-
determined continuous period of service. The exercise prices of the options are the same as the
quoted prices of ING Groep N.V. shares at the date on which the options are granted.
The obligations with regard to the existing stock option plan and the share plans will be funded
either by cash or by newly issued shares at the discretion of ING Group.
Options outstanding Weighted average exercise price
(in numbers) (in euros)
2018 2017 2016 2018 2017 2016
Opening balance 9,572,737 15,838,152 22,939,049 12.46 15.53 17.52
Exercised –475,650 –1,290,392 –929,529 6.02 6.05 6.20
Forfeited –63,795 –97,188 –140,278 8.89 14.13 15.83
Expired –5,741,964 –4,877,835 –6,031,090 16.82 24.09 24.54
Closing balance 3,291,328 9,572,737 15,838,152 5.84 12.46 15.53
The weighted average share price at the date of exercise for options exercised during 2018 is EUR
13.65 (2017: EUR 13.81; 2016: 10.43). All option rights are vested.
Changes in option rights outstanding

ING Bank Annual Report 2018 110
Contents | Who we are | Report of the Management Board | Corporate governance | Consolidated annual accounts | Parent company annual accounts | Other information
> Staff expenses > 27
Options outstanding and exercisable as at 31 December Weighted average remaining contractual life Weighted average exercise price
Range of exercise price in euros 2018 2017 2016 2018 2017 2016 2018 2017 2016
0.00 – 5.00 1,130,907 1,342,436 1,771,080 0.21 1.21 2.21 2.87 2.87 2.87
5.00 – 10.00 2,160,421 2,496,862 3,401,679 1.21 2.21 3.21 7.39 7.39 7.38
10.00 – 15.00 75,399 97,258 0.71 1.71 14.35 14.35
15.00 – 20.00 5,658,040 5,973,986 0.21 1.21 16.94 16.93
20.00 – 25.00 4,247,605 0.23 24.58
25.00 – 30.00 346,544 0.38 25.42
3,291,328 9,572,737 15,838,152
All options outstanding are exercisable. As at 31 December 2018, the aggregate intrinsic value of
options outstanding and exercisable is EUR 12 million (2017: EUR 37 million; 2016: EUR 39 million).
Share awards Weighted average grant date fair value
(in numbers) (in euros)
2018 2017 2016 2018 2017 2016
Opening balance 7,220,642 8,362,851 8,648,781 11.46 10.44 10.07
Granted 4,100,993 5,006,120 6,822,320 12.50 13.20 10.20
Performance effect 341,623 379,805 542,749 11.65 10.47 8.68
Vested –5,565,093 –6,309,714 –7,493,664 12.05 11.41 9.67
Forfeited –245,179 –218,420 –157,335 11.38 10.83 10.50
Closing balance 5,852,986 7,220,642 8,362,851 11.62 11.46 10.44
The fair value of share awards granted is recognised as an expense under Staff expenses and is
allocated over the vesting period of the share awards. As of 2016, ING Bank no longer has share
awards containing a market based performance condition. Previously, the fair values of share
awards containing a market based performance condition have been determined using a Monte
Carlo simulation based valuation model. The model takes into account the risk free interest rate,
the current stock prices, expected volatilities and current dividend yields of the performance peer
group used to determine ING’s Total Shareholder Return (TSR) ranking.
As at 31 December 2018, total unrecognised compensation costs related to share awards amount
to EUR 29 million (2017: EUR 37 million; 2016: EUR 41 million). These costs are expected to be
recognised over a weighted average period of 1.4 years (2017: 1.4 years; 2016: 1.4 years).
Summary of stock options outstanding and exercisable
Changes in share awards

ING Bank Annual Report 2018 111
Contents | Who we are | Report of the Management Board | Corporate governance | Consolidated annual accounts | Parent company annual accounts | Other information
> Other operating expenses > 28
28 Other operating expenses
2018 2017 2016
IT related expenses 779 737 740
Office expenses 564 586 580
Advertising and public relations 402 455 404
Travel and accommodation expenses 179 178 169
External advisory fees 357 350 319
Audit and non-audit services 26 22 19
Postal charges 54 50 48
Depreciation of property and equipment 312 319 330
Amortisation of intangible assets 209 179 187
Impairments and reversals on property and equipment and intangibles 19 18 107
Regulatory costs 947 901 845
Addition/(unused amounts reversed) of provision for reorganisations and relocations 4 –5 1,189
Addition/(unused amounts reversed) of other provisions –13 167 213
Contributions and subscriptions 91 87 79
Other 1,336 554 338
5,265 4,598 5,567
Other operating expenses include lease and sublease payments in respect of operating leases of
EUR 268 million (2017: EUR 307 million; 2016: EUR 310 million) in which ING Bank is the lessee. No
individual operating lease has terms and conditions that significantly affect the amount, timing
and certainty of the consolidated cash flows of the Group.
Audit and non-audit services
Audit and non-audit services include fees for services provided by the Bank’s auditors. Increase in
audit fees 2018 primarily relates to audit activities for the implementation of IFRS 9 and IFRS 16.
Regulatory costs
Regulatory costs represent contributions to the Deposit Guarantee Schemes (DGS), The Single
Resolution Fund (SRF) and local bank taxes. As of 1 January 2016, the new ex-ante DGS in the
Netherlands and the SRF came into effect resulting in an increase of Regulatory costs. Included in
Regulatory costs for 2018, are contributions to DGS of EUR 364 million (2017: EUR 341 million; 2016:
EUR 316 million) mainly related to the Netherlands, Germany, Belgium, Poland, and Spain and
contributions to the SRF of EUR 208 million (2017: EUR 179 million; 2016: EUR 176 million) related to
the SRF. In 2018 local bank taxes decreased by EUR 6 million from EUR 381 million in 2017 to EUR
375 million (2016: EUR 351 million) due to a prior year adjustment (credit) on the UK bank tax of
EUR 10 million.
Addition/(unused amounts reversed) of provision for reorganisations and relocations
For Addition/(unused amounts reversed) on provision for reorganisations and relocations, reference
is made to the disclosure on the reorganisation provision in Note 16 ‘Provisions’.
Addition/(unused amounts reversed) of other provisions
Included in Addition/(unused amounts reversed) of other provisions in 2018, is a release for the
provision recognised in relation of a discontinued business in ING Luxembourg. Reference is made
to Note 16 ‘Provisions’ and Note 44 ‘Legal proceedings’.
Tangible and Intangible impairments and reversals
Impairment losses Reversals of impairments Total
2018 2017 2016 2018 2017 2016 2018 2017 2016
Property and equipment 9 10 65 –17 –24 –5 –8 –14 60
Property development 15 2 3 15 2 3
Software and other
intangible assets 12 30 44 12 30 44
(Reversals of) other
impairments 35 42 112 –17 –24 –5 19 18 107
Other operating expenses
Impairments and reversals of property and equipment and intangibles
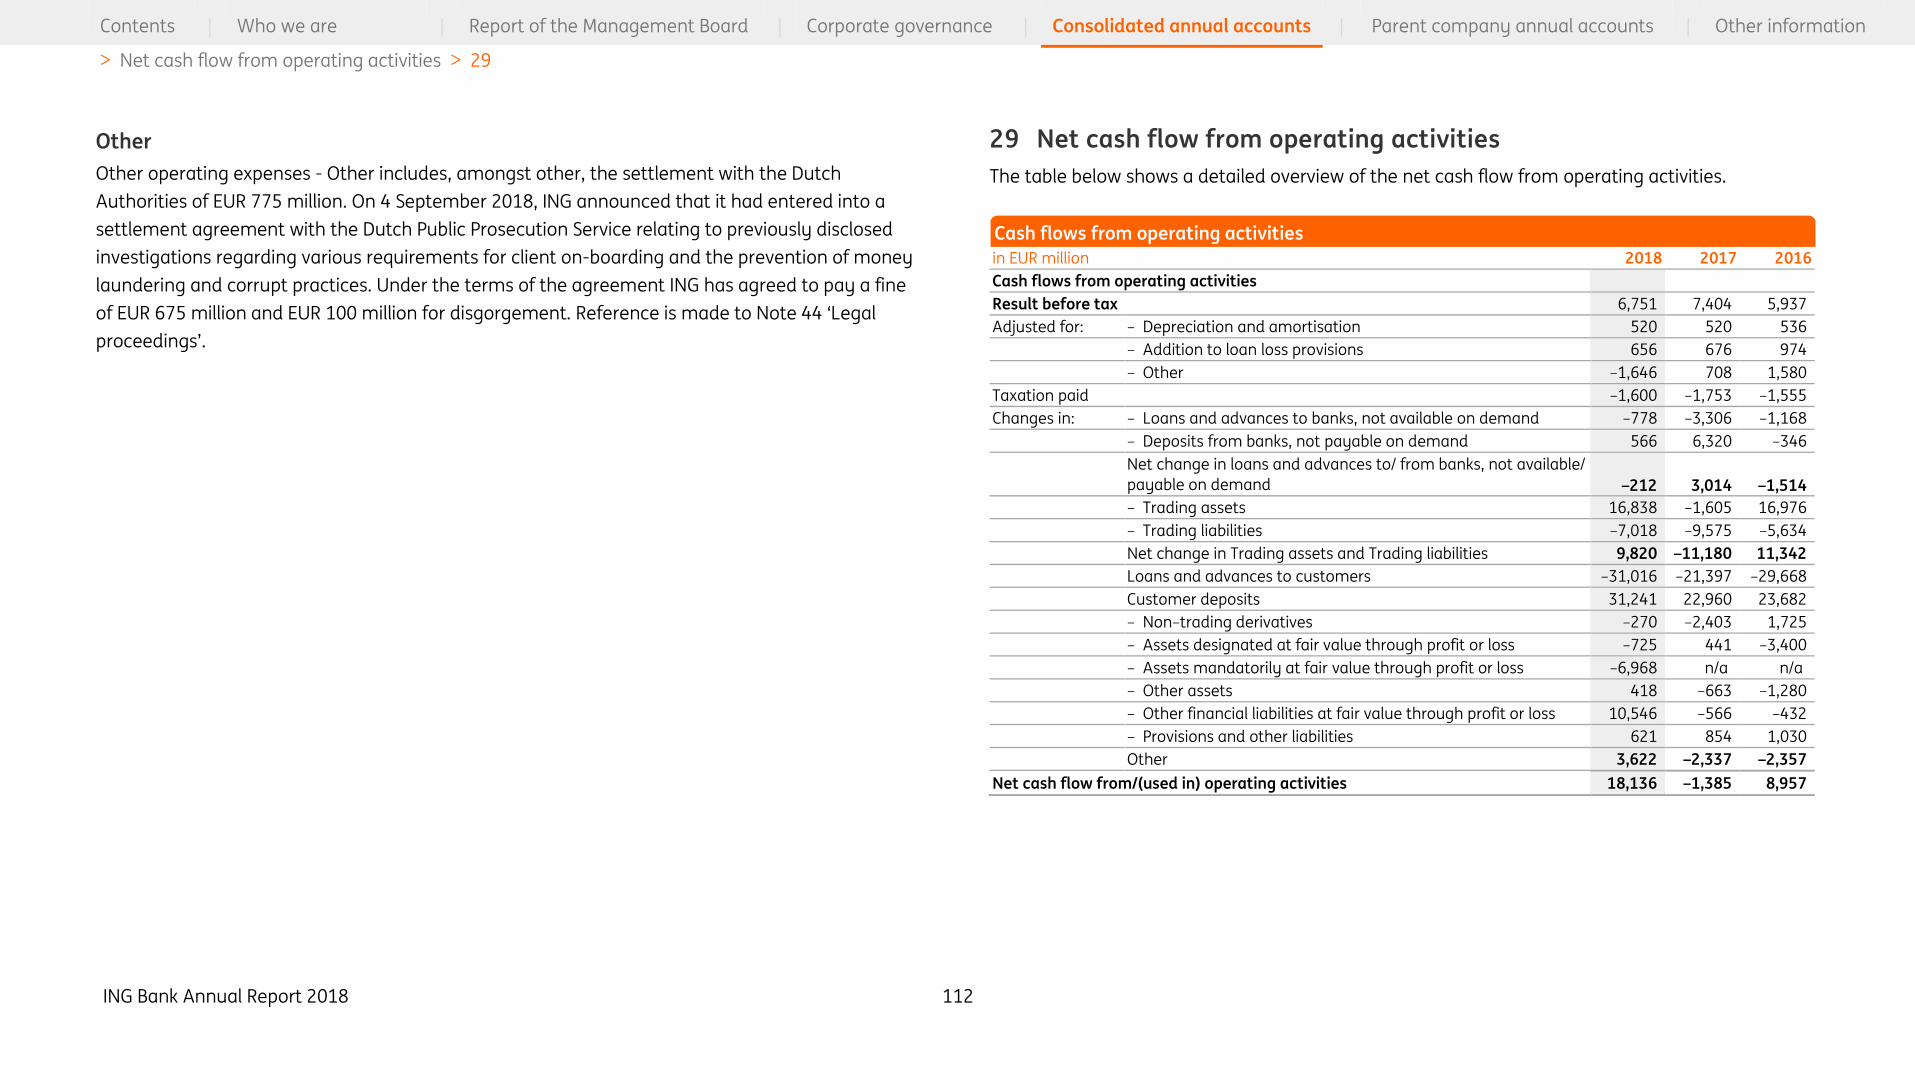
ING Bank Annual Report 2018 112
Contents | Who we are | Report of the Management Board | Corporate governance | Consolidated annual accounts | Parent company annual accounts | Other information
> Net cash flow from operating activities > 29
Other
Other operating expenses - Other includes, amongst other, the settlement with the Dutch
Authorities of EUR 775 million. On 4 September 2018, ING announced that it had entered into a
settlement agreement with the Dutch Public Prosecution Service relating to previously disclosed
investigations regarding various requirements for client on-boarding and the prevention of money
laundering and corrupt practices. Under the terms of the agreement ING has agreed to pay a fine
of EUR 675 million and EUR 100 million for disgorgement. Reference is made to Note 44 ‘Legal
proceedings’.
29 Net cash flow from operating activities
The table below shows a detailed overview of the net cash flow from operating activities.
in EUR million 2018 2017 2016
Cash flows from operating activities
Result before tax 6,751 7,404 5,937
Adjusted for: – Depreciation and amortisation 520 520 536
– Addition to loan loss provisions 656 676 974
– Other –1,646 708 1,580
Taxation paid –1,600 –1,753 –1,555
Changes in: – Loans and advances to banks, not available on demand –778 –3,306 –1,168
– Deposits from banks, not payable on demand 566 6,320 –346
Net change in loans and advances to/ from banks, not available/
payable on demand –212 3,014 –1,514
– Trading assets 16,838 –1,605 16,976
– Trading liabilities –7,018 –9,575 –5,634
Net change in Trading assets and Trading liabilities 9,820 –11,180 11,342
Loans and advances to customers –31,016 –21,397 –29,668
Customer deposits 31,241 22,960 23,682
– Non–trading derivatives –270 –2,403 1,725
– Assets designated at fair value through profit or loss –725 441 –3,400
– Assets mandatorily at fair value through profit or loss –6,968 n/a n/a
– Other assets 418 –663 –1,280
– Other financial liabilities at fair value through profit or loss 10,546 –566 –432
– Provisions and other liabilities 621 854 1,030
Other 3,622 –2,337 –2,357
Net cash flow from/(used in) operating activities 18,136 –1,385 8,957
Cash flows from operating activities

ING Bank Annual Report 2018 113
Contents | Who we are | Report of the Management Board | Corporate governance | Consolidated annual accounts | Parent company annual accounts | Other information
> Changes in liabilities arising from financing activities > 30
30 Changes in liabilities arising from financing activities
2017 Cash Flows Non cash changes 2018
Effect of change in
accounting policy Additions
Redemptions /
Disposals Aquisitions
Amor-
tisation Other
Changes
in FV
Foreign exchange
movement
Debt securities in issue 90,231 702 141,214 –131,170 78 –247 1,350 102,159
Subordinated Loans 15,831 170 1,828 –4,594 4 37 367 13,643
Total Liabilities from financing activities 106,062 872 143,042 –135,764 – 83 – –210 1,717 115,802
2016 2017
Debt securities in issue 101,305 89,369 –95,077 132 –40 –866 –4,592 90,231
Subordinated Loans 16,104 2,314 –1,246 89 –274 –1,156 15,831
Total Liabilities from financing activities 117,409 91,683 –96,323 – 221 –40 –1,140 –5,748 106,062
31 Cash and cash equivalents
2018 2017 2016
Treasury bills and other eligible bills 159 391 512
Deposits from banks/Loans and advances to banks –2,618 –3,404 –2,493
Cash and balances with central banks 49,987 21,989 18,122
Cash and cash equivalents at end of year 47,528 18,976 16,163
2018 2017 2016
Treasury bills and other eligible bills included in trading assets 17 5 126
Treasury bills and other eligible bills included in AFS investments n/a 386 386
Treasury bills and other eligible bills included in FVOCI n/a n/a
Treasury bills and other eligible bills included in securities at AC 142 n/a n/a
159 391 512
2018 2017 2016
Included in cash and cash equivalents:
– Deposits from banks –8,520 –8,563 –9,809
– Loans and advances to banks 5,902 5,159 7,316
–2,618 –3,404 –2,493
Not included in cash and cash equivalents:
– Deposits from banks –28,811 –28,258 –22,155
– Loans and advances to banks 24,519 23,587 21,556
–4,292 –4,671 –599
Total as included in the statement of financial position:
– Deposits from banks –37,330 –36,821 –31,964
– Loans and advances to banks 30,420 28,746 28,872
–6,910 –8,075 –3,092
Cash and cash equivalents includes deposits from banks and loans and advances to banks that are
on demand.
Changes in liabilities arising from financing activities
Cash and cash equivalents
Treasury bills and other eligible bills included in cash and cash equivalents
Deposits from banks/Loans and advances to banks

ING Bank Annual Report 2018 114
Contents | Who we are | Report of the Management Board | Corporate governance | Consolidated annual accounts | Parent company annual accounts | Other information
> Segments > 32
Included in Cash and cash equivalents, are minimum mandatory reserve deposits to be held with
various central banks. Reference is made to Note 40 ‘Assets not freely disposable’ for restrictions on
Cash and balances with central banks.
ING Bank’s risk management (including liquidity) is explained in note 50 ‘Risk management –
Funding and liquidity risk’.
Segment reporting
32 Segments
ING Bank’s segments are based on the internal reporting structures by lines of business.
The Management Board Banking of ING Bank set the performance targets, approve and monitor the
budgets prepared by the business lines. Business lines formulate strategic, commercial, and
financial policy in conformity with the strategy and performance targets set by the Management
Board Banking of ING Bank.
Recognition and measurement of segment results are in line with the accounting policies as
described in Note 1 ‘Accounting policies’. Corporate expenses are allocated to business lines based
on time spent by head office personnel, the relative number of staff, or on the basis of income,
expenses and/or assets of the segment.
The following table specifies the segments by line of business and the main sources of income of
each of the segments:
Segments of the Banking results by
line of
business Main source of income
Retail Netherlands Income from retail and private banking activities in the Netherlands,
including the SME and mid-corporate segments. The main products offered
are current and savings accounts, business lending, mortgages and other
consumer lending in the Netherlands.
(Market Leaders)
Retail Belgium Income from retail and private banking activities in Belgium (including
Luxembourg), including the SME and mid-corporate segments. The main
products offered are similar to those in the Netherlands. (Market Leaders)
Retail Germany Income from retail and private banking activities in Germany (including
Austria). The main products offered are current and savings accounts,
mortgages and other customer lending. (Challengers and Growth Markets)
Retail Other Income from retail banking activities in the rest of the world, including the
SME and mid-corporate segments in specific countries. The main products
offered are similar to those in the Netherlands. (Challengers and Growth Markets)
Wholesale Banking Income from wholesale banking activities (a full range of products is offered
from cash management to corporate finance), real estate and lease.
The geographical segments for the Banking results are presented on page 117.
Geographical segments Main countries
The Netherlands
Belgium Including Luxembourg
Germany Including Austria
Other Challengers Australia, France, Italy, Spain, Portugal, Czech Republic and UK Legacy run-
off portfolio
Growth Markets Poland, Romania, Turkey and Asian bank stakes
Wholesale Banking Rest of World UK, Americas, Asia and other countries in Central and Eastern Europe
Other Corporate Line Banking and the run-off portfolio of Real Estate
ING Bank evaluates the results of its banking segments using a financial performance measure
called underlying result. Underlying result is used to monitor the performance of ING Bank at a
consolidated level and by segment. The Management Board Banking consider this measure to be
Specification of the main sources of income of each of the segments by line of business
Specification of geographical segments
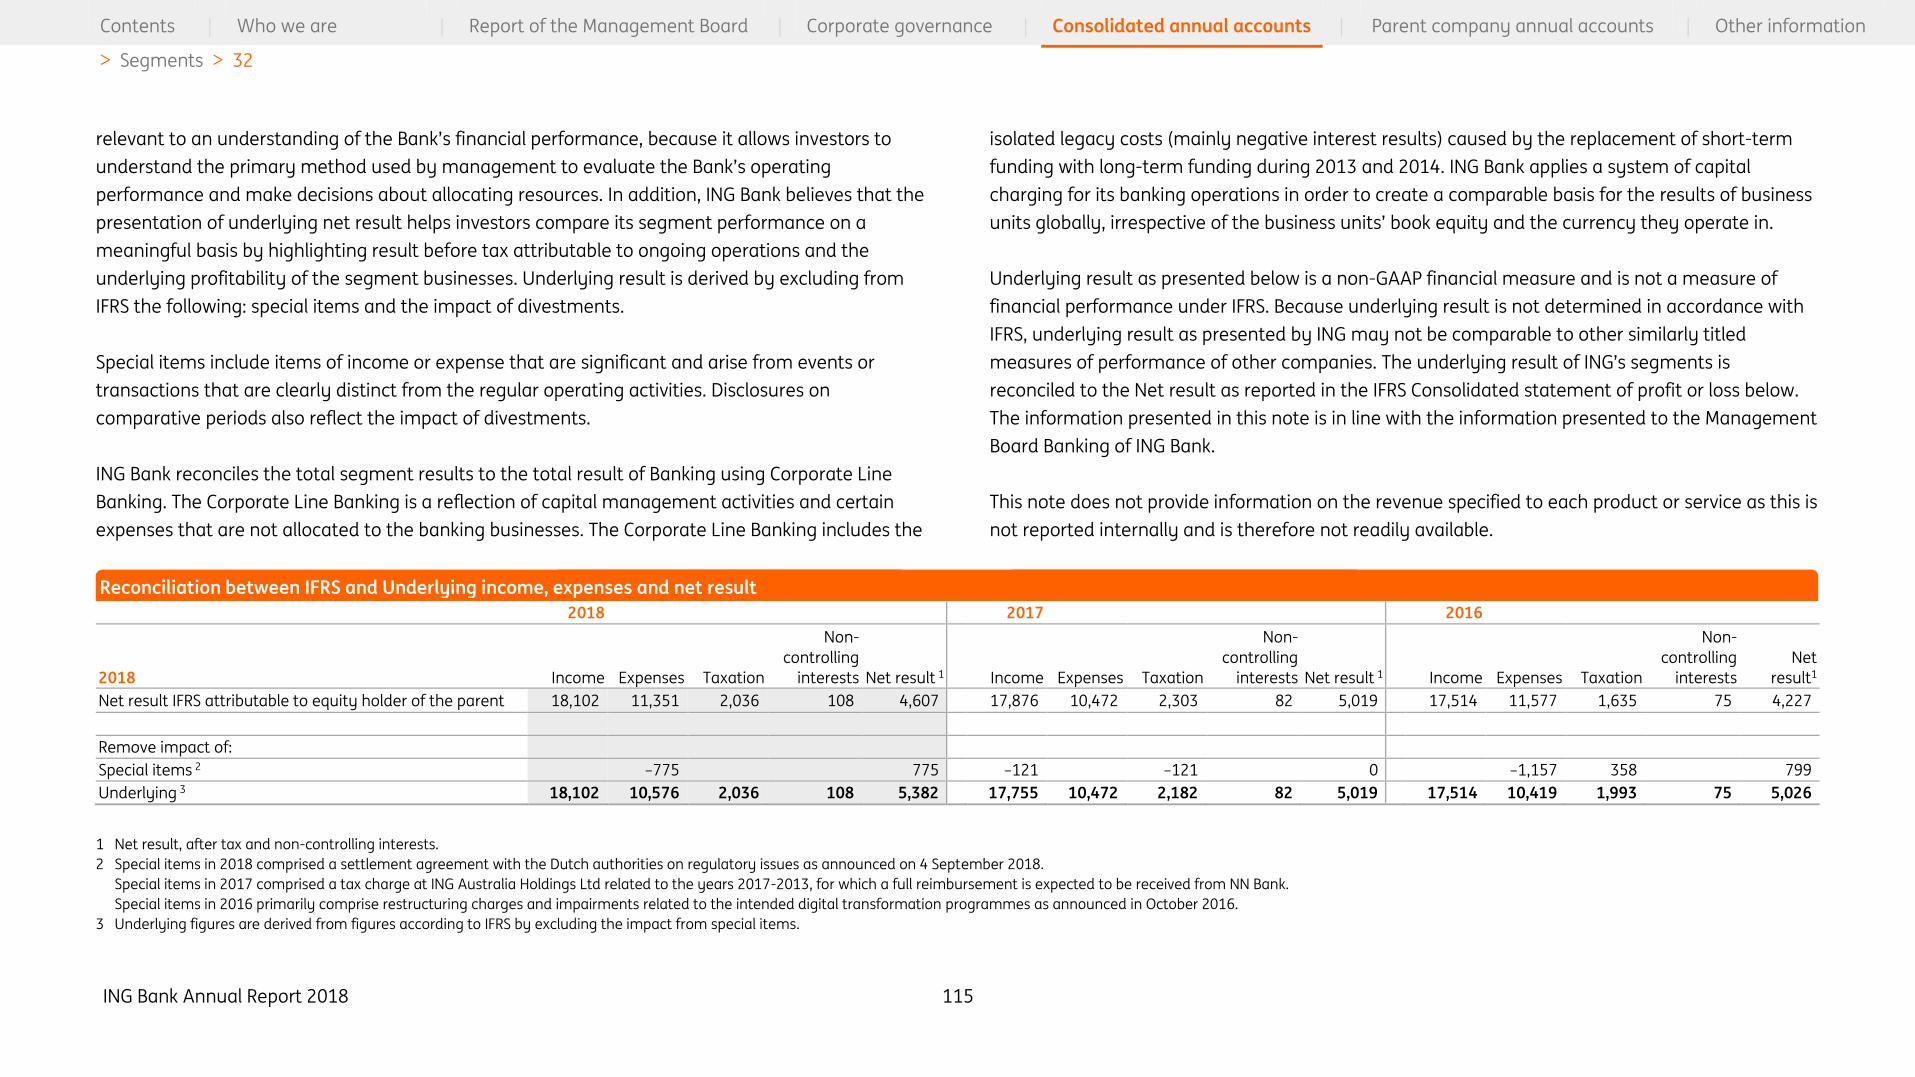
ING Bank Annual Report 2018 115
Contents | Who we are | Report of the Management Board | Corporate governance | Consolidated annual accounts | Parent company annual accounts | Other information
> Segments > 32
relevant to an understanding of the Bank’s financial performance, because it allows investors to
understand the primary method used by management to evaluate the Bank’s operating
performance and make decisions about allocating resources. In addition, ING Bank believes that the
presentation of underlying net result helps investors compare its segment performance on a
meaningful basis by highlighting result before tax attributable to ongoing operations and the
underlying profitability of the segment businesses. Underlying result is derived by excluding from
IFRS the following: special items and the impact of divestments.
Special items include items of income or expense that are significant and arise from events or
transactions that are clearly distinct from the regular operating activities. Disclosures on
comparative periods also reflect the impact of divestments.
ING Bank reconciles the total segment results to the total result of Banking using Corporate Line
Banking. The Corporate Line Banking is a reflection of capital management activities and certain
expenses that are not allocated to the banking businesses. The Corporate Line Banking includes the
isolated legacy costs (mainly negative interest results) caused by the replacement of short-term
funding with long-term funding during 2013 and 2014. ING Bank applies a system of capital
charging for its banking operations in order to create a comparable basis for the results of business
units globally, irrespective of the business units’ book equity and the currency they operate in.
Underlying result as presented below is a non-GAAP financial measure and is not a measure of
financial performance under IFRS. Because underlying result is not determined in accordance with
IFRS, underlying result as presented by ING may not be comparable to other similarly titled
measures of performance of other companies. The underlying result of ING’s segments is
reconciled to the Net result as reported in the IFRS Consolidated statement of profit or loss below.
The information presented in this note is in line with the information presented to the Management
Board Banking of ING Bank.
This note does not provide information on the revenue specified to each product or service as this is
not reported internally and is therefore not readily available.
2018 2017 2016
2018 Income Expenses Taxation
Non-
controlling
interests Net result 1 Income Expenses Taxation
Non-
controlling
interests Net result 1 Income Expenses Taxation
Non-
controlling
interests
Net
result1
Net result IFRS attributable to equity holder of the parent 18,102 11,351 2,036 108 4,607 17,876 10,472 2,303 82 5,019 17,514 11,577 1,635 75 4,227
Remove impact of:
Special items 2 –775 775 –121 –121 0 –1,157 358 799
Underlying 3 18,102 10,576 2,036 108 5,382 17,755 10,472 2,182 82 5,019 17,514 10,419 1,993 75 5,026
1 Net result, after tax and non-controlling interests.
2 Special items in 2018 comprised a settlement agreement with the Dutch authorities on regulatory issues as announced on 4 September 2018.
Special items in 2017 comprised a tax charge at ING Australia Holdings Ltd related to the years 2017-2013, for which a full reimbursement is expected to be received from NN Bank.
Special items in 2016 primarily comprise restructuring charges and impairments related to the intended digital transformation programmes as announced in October 2016.
3 Underlying figures are derived from figures according to IFRS by excluding the impact from special items.
Reconciliation between IFRS and Underlying income, expenses and net result

ING Bank Annual Report 2018 116
Contents | Who we are | Report of the Management Board | Corporate governance | Consolidated annual accounts | Parent company annual accounts | Other information
> Segments > 32
2018 2017 2016
Retail
Nether-
lands
Retail
Belgium
Retail
Germany
Retail
Other
Wholesale
Banking
Corporate
Line
Banking
Total
Banking
Retail
Nether-
lands
Retail
Belgium
Retail
Germany
Retail
Other
Wholesale
Banking
Corporate
Line
Banking
Total
Banking
Retail
Nether-
lands
Retail
Belgium
Retail
Germany
Retail
Other
Wholesale
Banking
Corporate
Line
Banking
Total
Banking
Underlying income
– Net interest income 3,488 1,830 1,671 2,690 3,947 324 13,949 3,610 1,842 1,704 2,437 3,895 294 13,782 3,653 1,936 1,689 2,107 3,750 182 13,317
– Net fee and commision
income 654 371 225 395 1,161 –3 2,803 601 408 215 384 1,108 –3 2,714 546 385 183 320 1,003 –2 2,434
– Total investment and other
income 335 169 76 230 673 –133 1,350 257 224 –28 207 919 –318 1,259 237 253 51 432 855 –65 1,763
Total underlying income 4,476 2,369 1,972 3,315 5,781 188 18,102 4,468 2,473 1,891 3,028 5,922 –27 17,755 4,463 2,573 1,923 2,859 5,608 115 17,514
Underlying expenditure
– Operating expenses 2,165 1,610 1,027 2,033 2,826 260 9,920 2,212 1,584 1,032 1,919 2,792 257 9,795 2,560 1,438 886 1,723 2,572 267 9,445
– Additions to loan loss
provision –31 164 –27 350 200 –1 656 13 104 –10 284 284 1 676 171 175 –18 278 368 974
Total underlying expenses 2,134 1,774 1,000 2,383 3,026 258 10,576 2,224 1,688 1,022 2,203 3,076 258 10,472 2,731 1,613 868 2,001 2,940 267 10,419
Underlying result before
taxation 2,342 595 972 932 2,755 –70 7,526 2,243 785 869 825 2,846 –285 7,283 1,705 961 1,055 858 2,668 –152 7,095
Taxation 578 199 324 200 681 55 2,036 566 296 241 188 881 9 2,182 422 306 315 178 753 18 1,993
Non-controlling interests –0 6 3 80 19 –0 108 –2 2 67 15 82 1 2 60 11 75
Underlying net result 1,764 390 646 652 2,055 –125 5,382 1,678 491 625 569 1,950 –293 5,019 1,282 653 738 620 1,903 –171 5,026
Special items –775 –775 0 0 –192 –418 –12 –149 –27 –799
Net result IFRS 1,764 390 646 652 2,055 –900 4,607 1,678 491 625 569 1,950 –293 5,019 1,090 235 738 608 1,754 –198 4,227
Segments Banking by line of business

ING Bank Annual Report 2018 117
Contents | Who we are | Report of the Management Board | Corporate governance | Consolidated annual accounts | Parent company annual accounts | Other information
> Segments > 32
2018 2017 2016
Nether-
lands Belgium Germany
Other
Challen
gers
Growth
markets
Wholesale
Banking
rest of
the world Other
Total
Banking
Nether-
lands Belgium Germany
Other
Challen
gers
Growth
markets
Wholesale
Banking
rest of
the world Other
Total
Banking
Nether-
lands Belgium Germany
Other
Challen
gers
Growth
markets
Wholesale
Banking
rest of
the world Other
Total
Banking
Underlying income
– Net interest income 4,374 2,129 2,200 1,732 1,639 1,556 319 13,949 4,537 2,099 2,172 1,527 1,515 1,636 295 13,782 4,699 2,183 2,025 1,373 1,274 1,579 183 13,317
– Net fee and commission
income 980 519 273 254 297 483 –4 2,803 871 519 269 232 316 509 –3 2,714 779 482 241 171 309 452 –1 2,434
– Total investment and
other income 509 379 99 –92 333 245 –123 1,350 445 480 –17 22 296 245 –211 1,259 367 559 75 133 460 202 –33 1,763
Total underlying income 5,863 3,028 2,572 1,895 2,269 2,283 192 18,102 5,853 3,098 2,424 1,781 2,127 2,390 82 17,755 5,845 3,225 2,340 1,677 2,043 2,233 149 17,514
Underlying expenditure
– Operating expenses 2,929 1,927 1,171 1,217 1,175 1,226 276 9,920 2,930 2,063 1,154 1,142 1,126 1,113 267 9,795 3,301 1,796 987 951 1,103 1,029 279 9,445
– Additions to loan loss
provision –65 153 6 163 274 126 –1 656 3 160 –15 201 241 85 1 676 310 215 –13 120 240 103 – 974
Total underlying expenses 2,863 2,080 1,176 1,380 1,449 1,353 275 10,576 2,933 2,223 1,140 1,344 1,367 1,198 268 10,472 3,610 2,010 973 1,071 1,343 1,132 279 10,419
Underlying result before
taxation 3,000 948 1,396 515 820 931 –83 7,526 2,920 876 1,285 437 760 1,192 –186 7,283 2,235 1,215 1,367 607 700 1,101 –130 7,095
Taxation 741 291 459 178 143 174 52 2,036 708 369 407 145 151 379 21 2,182 555 353 426 173 125 335 27 1,993
Non-controlling interests 1 6 3 98 –0 108 –2 2 82 82 1 2 71 75
Underlying net result 2,258 651 935 337 580 757 –134 5,382 2,212 508 875 292 527 813 –207 5,019 1,680 860 939 433 504 766 –157 5,026
Special items –775 –775 0 0 –268 –491 –13 –27 –799
Net result IFRS 2,258 651 935 337 580 757 –909 4,607 2,212 508 875 292 527 813 –207 5,019 1,412 369 939 420 504 766 –184 4,227
Geographical segments Banking

ING Bank Annual Report 2018 118
Contents | Who we are | Report of the Management Board | Corporate governance | Consolidated annual accounts | Parent company annual accounts | Other information
> Information on geographical areas > 33
33 Information on geographical areas
ING Bank’s business lines operate in seven main geographical areas: the Netherlands, Belgium, Rest
of Europe, North America, Latin America, Asia and Australia. A geographical area is a
distinguishable component of the Bank engaged in providing products or services within a
particular economic environment that is subject to risks and returns that are different from those of
geographical areas operating in other economic environments. The geographical analyses are
based on the location of the office from which the transactions are originated. The Netherlands is
ING Bank’s country of domicile.
The tables below provide additional information, for the years 2018, 2017 and 2016 respectively, on
names of principal subsidiaries and branches, nature of main activities and average number of
employees on a full time equivalent basis by country/tax jurisdiction.
Geographical area
Country/Tax
jurisdiction Name of principal subsidiary
Main (banking)
activity
Average number of
employees at full time
equivalent basis Total Income Total assets Result before tax Taxation
2018 2017 2016 2018 2017 2016 2018 2017 2016 2018 2017 2016 2018 2017 2016
The Netherlands Netherlands ING Bank N.V. Wholesale / Retail 13,600 13,141 13,660 5,837 5,860 5,790 261,449 241,481 293,893 1,673 2,437 1,375 634 661 360
Belgium Belgium ING België N.V. Wholesale / Retail 8,248 8,893 9,348 2,807 2,957 3,154 120,589 119,400 131,431 866 1,009 554 275 408 143
Luxemburg ING Luxembourg S.A. Wholesale / Retail 791 777 793 315 298 274 13,313 14,748 10,783 198 68 138 50 27 32
Rest of Europe Poland ING Bank Slaski S.A Wholesale / Retail 8,829 8,664 8,735 1,229 1,119 992 33,040 29,976 26,581 525 444 379 128 112 90
Germany ING DiBa A.G. Wholesale / Retail 4,625 4,587 4,341 2,421 2,312 2,212 144,911 138,153 134,902 1,309 1,240 1,282 431 396 407
Romania Branch of ING Bank N.V. Wholesale / Retail 2,269 1,968 1,806 403 314 288 7,112 5,940 5,456 183 135 123 25 23 21
Spain Branch of ING Bank N.V. Wholesale / Retail 1,201 1,135 1,116 600 509 498 23,757 23,858 23,309 195 97 197 71 25 51
Italy Branch of ING Bank N.V. Wholesale / Retail 911 838 833 231 336 376 16,991 16,728 15,920 –101 –4 100 –24 7 33
UK Branch of ING Bank N.V. Wholesale 672 603 599 505 550 504 64,016 78,573 29,830 180 324 290 44 76 154
France1 Branch of ING Bank N.V. Wholesale / Retail 620 591 613 323 310 280 12,063 10,678 8,614 111 93 56 45 32 18
Russia ING Bank (Eurasia) Z.A.O. Wholesale 277 270 276 82 136 118 1,449 1,607 2,008 25 78 69 3 20 7
Czech Republic Branch of ING Bank N.V. Wholesale / Retail 306 245 220 104 66 74 6,272 5,641 3,653 37 16 37 9 3 7
Hungary Branch of ING Bank N.V. Wholesale 141 146 152 40 32 37 1,227 1,003 1,358 5 –1 3 2 3
Slovakia Branch of ING Bank N.V. Wholesale 571 497 400 14 14 14 487 677 715 –0 2 3 1 1 1
Ukraine PJSC ING Bank Ukraine Wholesale 109 106 111 36 30 59 368 321 622 22 9 47 3 2 7
Austria Branch of ING DiBa A.G. Wholesale / Retail 235 225 196 85 80 86 753 682 360 18 25 37 6 –1 –4
Bulgaria Branch of ING Bank N.V. Wholesale 69 70 76 9 9 9 360 268 274 –0 –2
Ireland Branch of ING Bank N.V. Wholesale 47 43 42 69 57 53 2,867 2,337 1,910 59 48 54 7 6 7
Portugal Branch of ING Bank N.V. Wholesale 11 11 11 18 14 14 905 667 642 13 9 10 4 3 3
Switzerland Branch of ING België N.V. Wholesale 244 204 192 257 224 187 8,266 9,737 9,150 169 145 122 35 38 33
Additional information by country
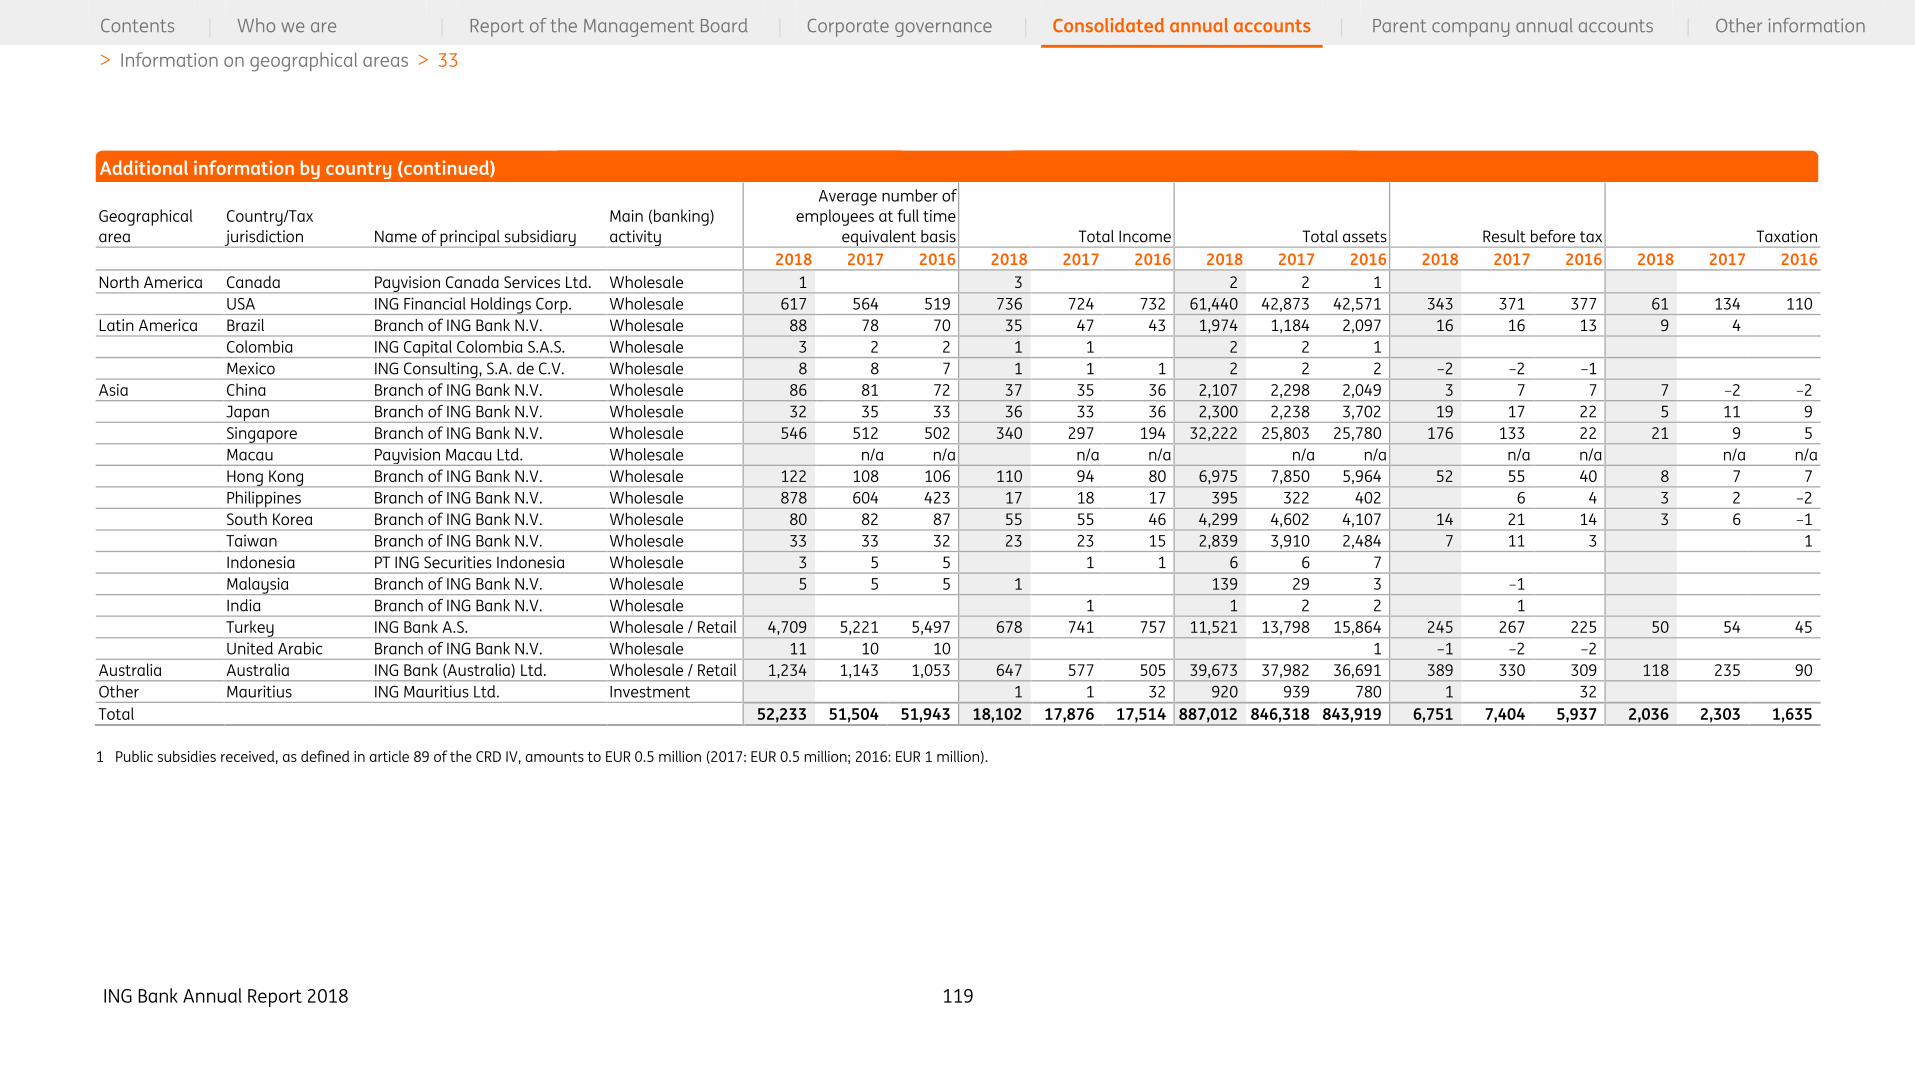
ING Bank Annual Report 2018 119
Contents | Who we are | Report of the Management Board | Corporate governance | Consolidated annual accounts | Parent company annual accounts | Other information
> Information on geographical areas > 33
Geographical
area
Country/Tax
jurisdiction Name of principal subsidiary
Main (banking)
activity
Average number of
employees at full time
equivalent basis Total Income Total assets Result before tax Taxation
2018 2017 2016 2018 2017 2016 2018 2017 2016 2018 2017 2016 2018 2017 2016
North America Canada Payvision Canada Services Ltd. Wholesale 1 3 2 2 1 0 0
USA ING Financial Holdings Corp. Wholesale 617 564 519 736 724 732 61,440 42,873 42,571 343 371 377 61 134 110
Latin America Brazil Branch of ING Bank N.V. Wholesale 88 78 70 35 47 43 1,974 1,184 2,097 16 16 13 9 4
Colombia ING Capital Colombia S.A.S. Wholesale 3 2 2 1 1 2 2 1
Mexico ING Consulting, S.A. de C.V. Wholesale 8 8 7 1 1 1 2 2 2 –2 –2 –1
Asia China Branch of ING Bank N.V. Wholesale 86 81 72 37 35 36 2,107 2,298 2,049 3 7 7 7 –2 –2
Japan Branch of ING Bank N.V. Wholesale 32 35 33 36 33 36 2,300 2,238 3,702 19 17 22 5 11 9
Singapore Branch of ING Bank N.V. Wholesale 546 512 502 340 297 194 32,222 25,803 25,780 176 133 22 21 9 5
Macau Payvision Macau Ltd. Wholesale n/a n/a n/a n/a n/a n/a n/a n/a n/a n/a
Hong Kong Branch of ING Bank N.V. Wholesale 122 108 106 110 94 80 6,975 7,850 5,964 52 55 40 8 7 7
Philippines Branch of ING Bank N.V. Wholesale 878 604 423 17 18 17 395 322 402 0 6 4 3 2 –2
South Korea Branch of ING Bank N.V. Wholesale 80 82 87 55 55 46 4,299 4,602 4,107 14 21 14 3 6 –1
Taiwan Branch of ING Bank N.V. Wholesale 33 33 32 23 23 15 2,839 3,910 2,484 7 11 3 0 1
Indonesia PT ING Securities Indonesia Wholesale 3 5 5 0 1 1 6 6 7 –0
Malaysia Branch of ING Bank N.V. Wholesale 5 5 5 1 139 29 3 0 –1 0
India Branch of ING Bank N.V. Wholesale 1 1 2 2 1 –0
Turkey ING Bank A.S. Wholesale / Retail 4,709 5,221 5,497 678 741 757 11,521 13,798 15,864 245 267 225 50 54 45
United Arabic
Emirates
Branch of ING Bank N.V. Wholesale 11 10 10 –0 0 1 –1 –2 –2
Australia Australia ING Bank (Australia) Ltd. Wholesale / Retail 1,234 1,143 1,053 647 577 505 39,673 37,982 36,691 389 330 309 118 235 90
Other Mauritius ING Mauritius Ltd. Investment
Management
1 1 32 920 939 780 1 32
Total 52,233 51,504 51,943 18,102 17,876 17,514 887,012 846,318 843,919 6,751 7,404 5,937 2,036 2,303 1,635
1 Public subsidies received, as defined in article 89 of the CRD IV, amounts to EUR 0.5 million (2017: EUR 0.5 million; 2016: EUR 1 million).
Additional information by country (continued)

ING Bank Annual Report 2018 120
Contents | Who we are | Report of the Management Board | Corporate governance | Consolidated annual accounts | Parent company annual accounts | Other information
> Pension and other post-employment benefits > 34
2018
The relatively high tax charge in the Netherlands is caused by non-deductible expenses based upon
the settlement agreement reached with the Dutch authorities on regulatory issues.
2017
Australia has a very high tax charge due to a tax charge at ING Australia Holdings Ltd related to the
years 2007-2013, for which a full reimbursement is expected to be received from NN Group.
Although the impact on net result was nil, this special item affected both the tax and ‘other income’
line in the Consolidated statement of profit or loss.
Due to the tax reforms in the US and Belgium, which resulted in a tax charge to record a reduction
in deferred tax assets, the tax charge is significantly higher.
Austria, China, Singapore and Taiwan all have lower tax charges due to prior year adjustments.
2016
The UK has a high tax charge due to changes in tax law and prior year adjustments. Russia, China,
Philippines and South Korea all have lower tax charges due to prior year adjustments.
Austria has an inverse tax charge due to the recognition of a tax asset for previously unrecognised
tax losses.
Brazil has a low tax charge due to the combination of relatively high exempt income with a
decreased profit.
Mauritius has no tax charge as the partial sale of Kotak Mahindra Bank shares in September 2016
was tax exempt.
Additional notes to the Consolidated annual accounts
34 Pension and other post-employment benefits
Most group companies sponsor defined contribution pension plans. The assets of all ING Bank’s
defined contribution plans are held in independently administered funds. Contributions are
generally determined as a percentage of remuneration. For the defined contribution scheme in the
Netherlands, the premium paid is also dependant on the interest rate developments and the
methodology of the Dutch Central Bank for determining the ultimate forward rate. These plans do
not give rise to provisions in the statement of financial position, other than relating to short-term
timing differences included in other assets/liabilities.
ING Bank maintains defined benefit retirement plans in some countries. These plans provide
benefits that are related to the remuneration and service of employees upon retirement. The
benefits in some of these plans are subject to various forms of indexation. The indexation is, in
some cases, at the discretion of management; in other cases it is dependent upon the sufficiency
of plan assets.
Annual contributions are paid to the funds at a rate necessary to adequately finance the accrued
liabilities of the plans calculated in accordance with local legal requirements. Plans in all countries
are designed to comply with applicable local regulations governing investments and funding levels.
ING Bank provides other post-employment benefits to certain employees and former employees.
These are primarily post-employment healthcare benefits and discounts on ING products provided
to employees and former employees.
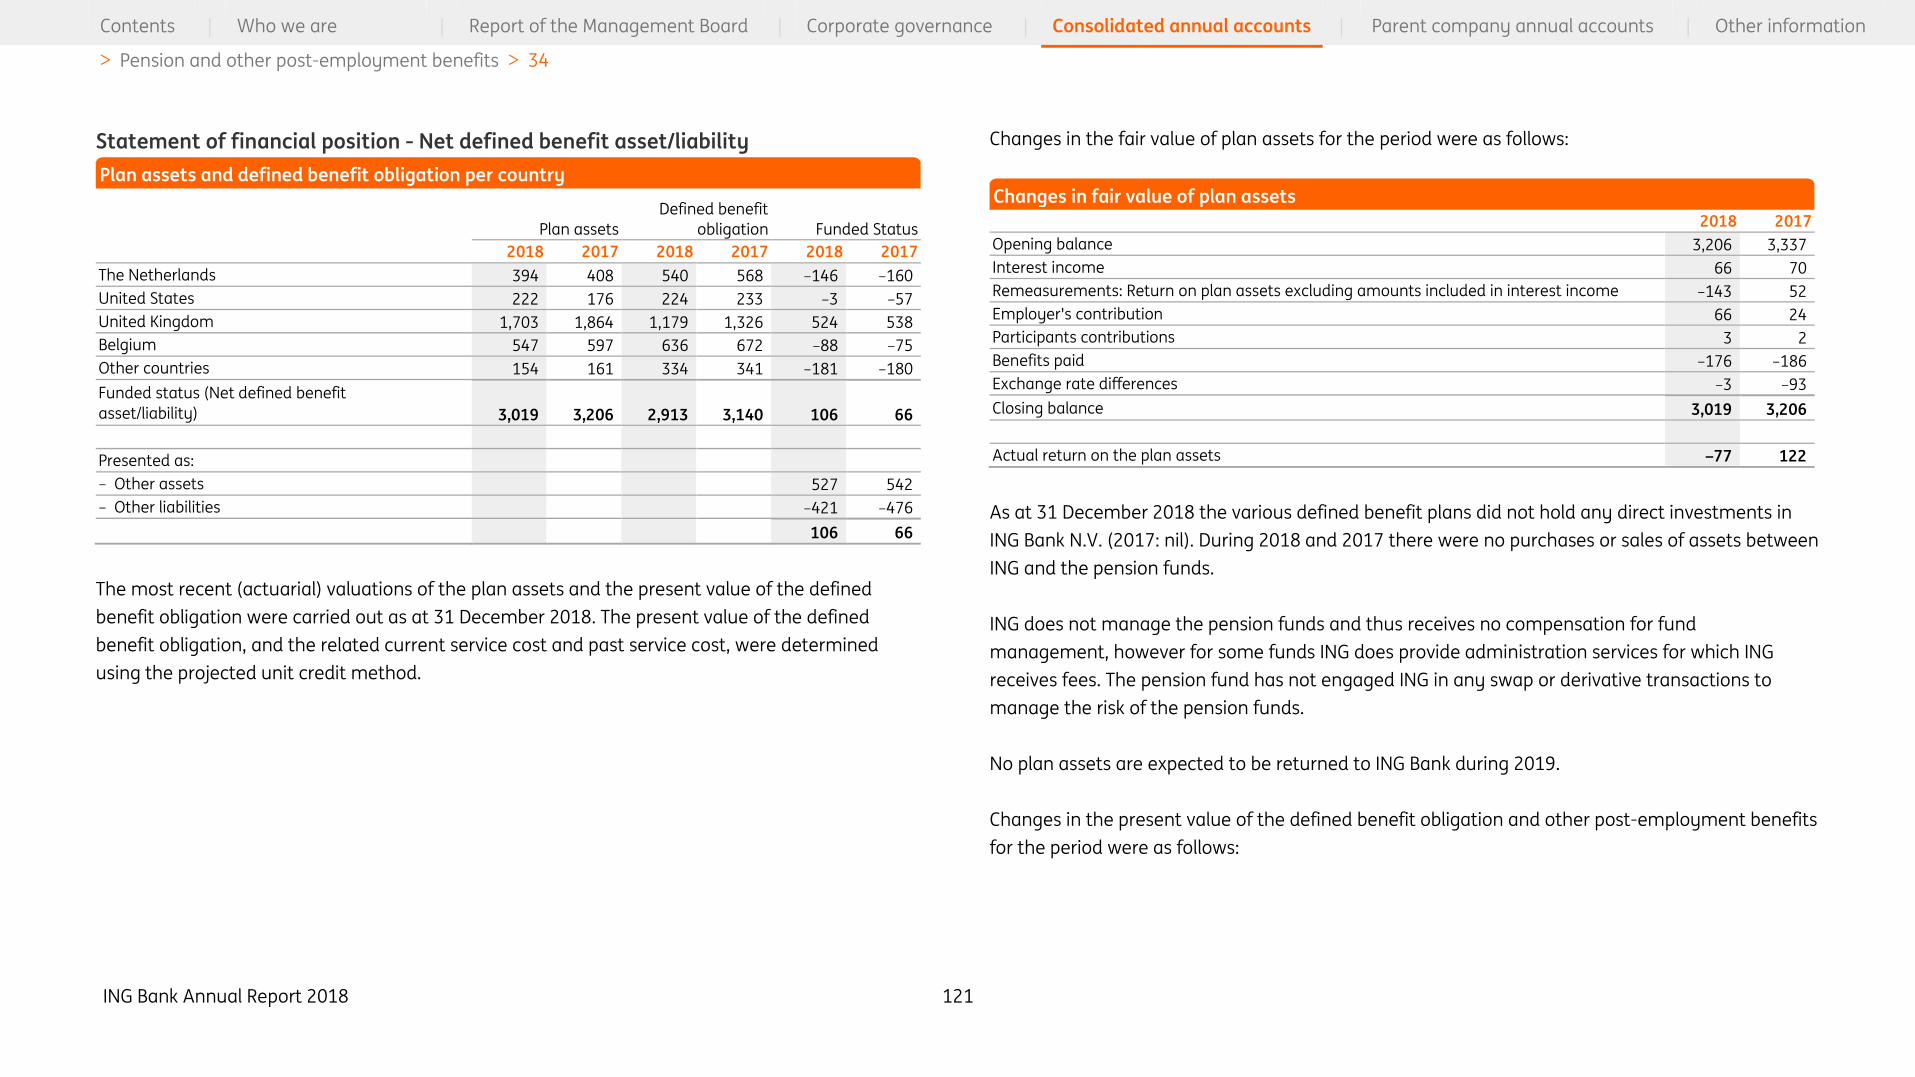
ING Bank Annual Report 2018 121
Contents | Who we are | Report of the Management Board | Corporate governance | Consolidated annual accounts | Parent company annual accounts | Other information
> Pension and other post-employment benefits > 34
Statement of financial position - Net defined benefit asset/liability
Plan assets
Defined benefit
obligation Funded Status
2018 2017 2018 2017 2018 2017
The Netherlands 394 408 540 568 –146 –160
United States 222 176 224 233 –3 –57
United Kingdom 1,703 1,864 1,179 1,326 524 538
Belgium 547 597 636 672 –88 –75
Other countries 154 161 334 341 –181 –180
Funded status (Net defined benefit
asset/liability) 3,019 3,206 2,913 3,140 106 66
Presented as:
– Other assets 527 542
– Other liabilities –421 –476
106 66
The most recent (actuarial) valuations of the plan assets and the present value of the defined
benefit obligation were carried out as at 31 December 2018. The present value of the defined
benefit obligation, and the related current service cost and past service cost, were determined
using the projected unit credit method.
Changes in the fair value of plan assets for the period were as follows:
2018 2017
Opening balance 3,206 3,337
Interest income 66 70
Remeasurements: Return on plan assets excluding amounts included in interest income –143 52
Employer's contribution 66 24
Participants contributions 3 2
Benefits paid –176 –186
Exchange rate differences –3 –93
Closing balance 3,019 3,206
Actual return on the plan assets –77 122
As at 31 December 2018 the various defined benefit plans did not hold any direct investments in
ING Bank N.V. (2017: nil). During 2018 and 2017 there were no purchases or sales of assets between
ING and the pension funds.
ING does not manage the pension funds and thus receives no compensation for fund
management, however for some funds ING does provide administration services for which ING
receives fees. The pension fund has not engaged ING in any swap or derivative transactions to
manage the risk of the pension funds.
No plan assets are expected to be returned to ING Bank during 2019.
Changes in the present value of the defined benefit obligation and other post-employment benefits
for the period were as follows:
Plan assets and defined benefit obligation per country Changes in fair value of plan assets

ING Bank Annual Report 2018 122
Contents | Who we are | Report of the Management Board | Corporate governance | Consolidated annual accounts | Parent company annual accounts | Other information
> Pension and other post-employment benefits > 34
Defined benefit
obligation
Other post-
employment
benefits
2018 2017 2018 2017
Opening balance 3,140 3,249 87 87
Current service cost 39 34 –4 –3
Interest cost 61 66 2 3
Remeasurements: Actuarial gains and losses arising from changes in
demographic assumptions 2 –7 9
Remeasurements: Actuarial gains and losses arising from changes in
financial assumptions –153 71 –11
Participants’ contributions 3 2 1
Benefits paid –179 –189 –1 –1
Effect of curtailment or settlement –3
Exchange rate differences 2 –83 2 –8
Changes in the composition of the group and other changes –1
Closing balance 2,913 3,140 76 87
Amounts recognised directly in Other comprehensive income (equity) were as follows:
2018 2017
Opening balance –400 –371
Remeasurement of plan assets –143 52
Actuarial gains and losses arising from changes in demographic assumptions –2 7
Actuarial gains and losses arising from changes in financial assumptions 153 –71
Taxation –3 –17
Total Other comprehensive income movement for the year 6 –29
Closing balance –394 –400
In 2018, EUR -143 million Remeasurement of plan assets and EUR 153 million Actuarial gains and
losses arising from changes in financial assumptions are mainly due to an increase in discount
rates.
The accumulated amount of remeasurements recognised directly in Other comprehensive income
(equity) is EUR -453 million (EUR -394 million after tax) as at 31 December 2018 (2017: EUR -476
million, EUR -400 million after tax).
Amounts recognised in the statement of profit or loss related to pension and other staff related
benefits are as follows:
Changes in defined benefit obligation and other post-employment benefits
Changes in the net defined benefit assets/liability remeasurement reserve
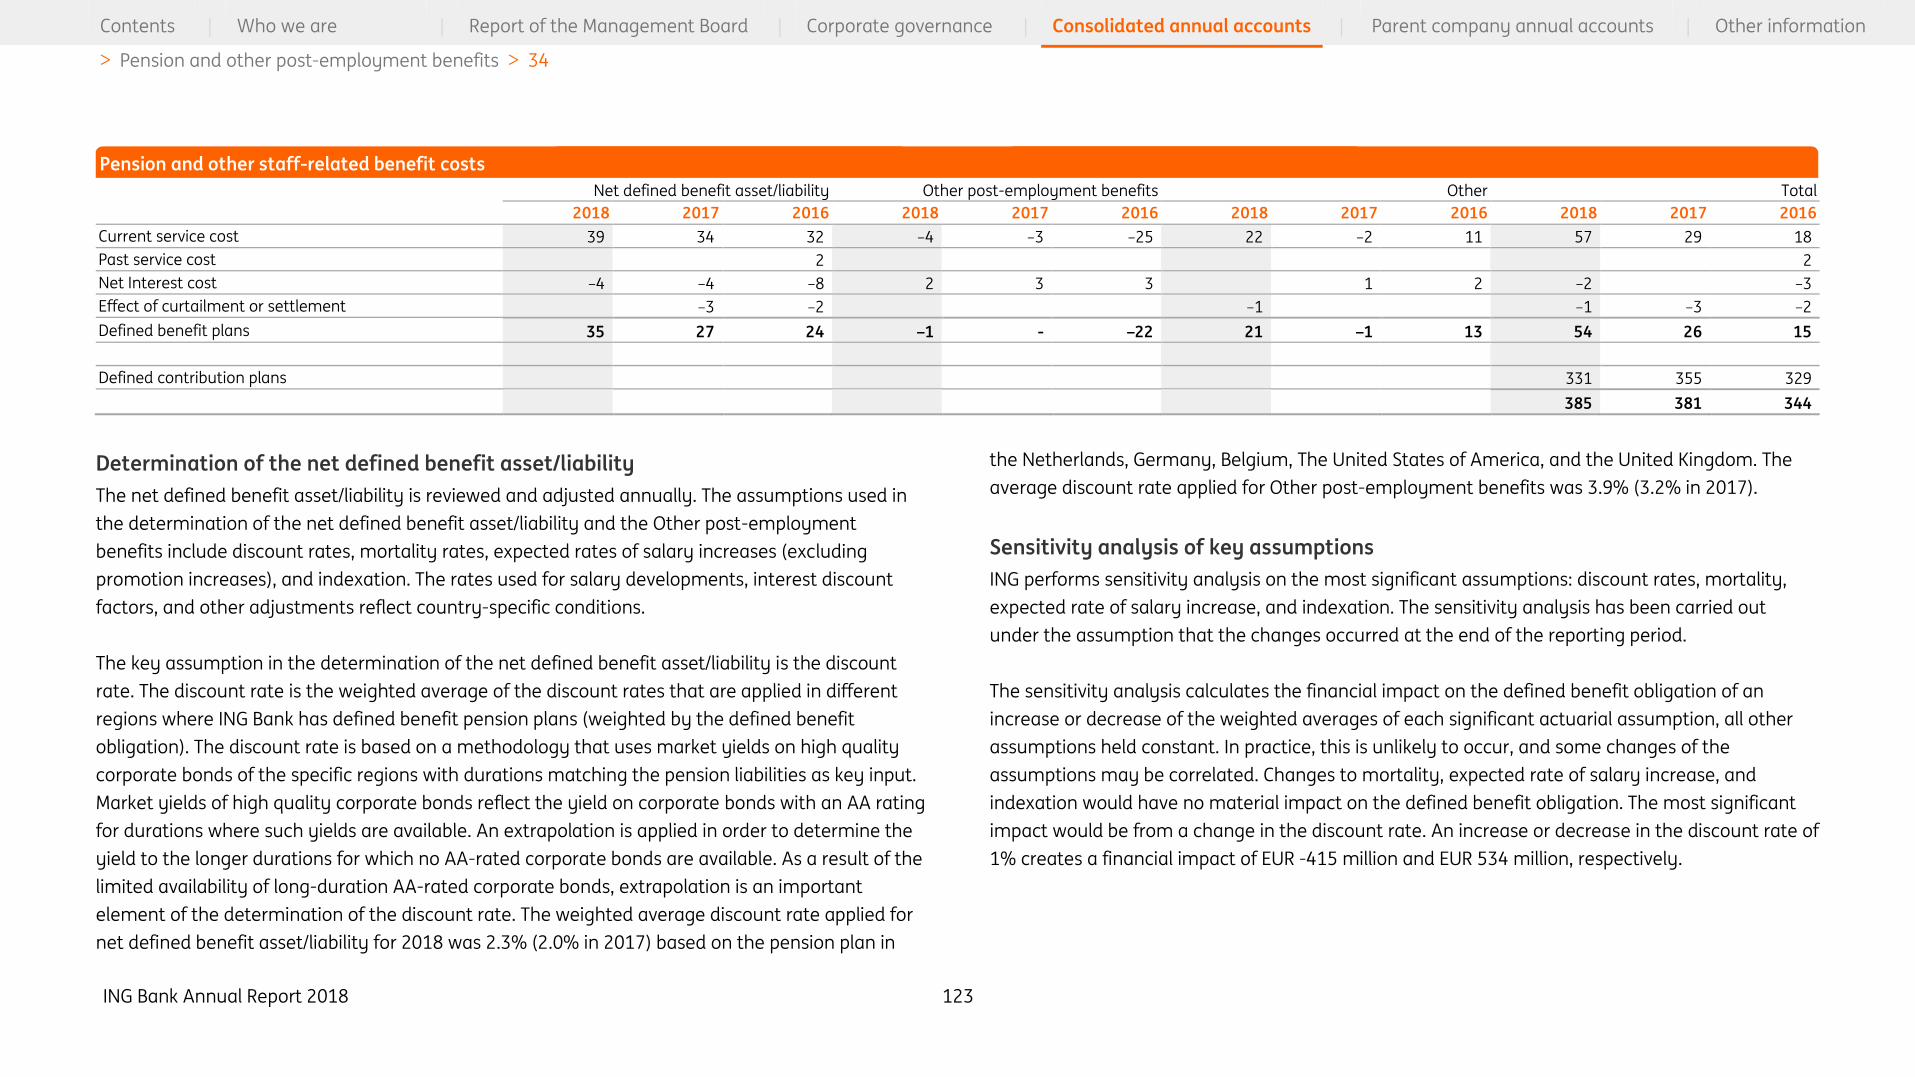
ING Bank Annual Report 2018 123
Contents | Who we are | Report of the Management Board | Corporate governance | Consolidated annual accounts | Parent company annual accounts | Other information
> Pension and other post-employment benefits > 34
Net defined benefit asset/liability Other post-employment benefits Other Total
2018 2017 2016 2018 2017 2016 2018 2017 2016 2018 2017 2016
Current service cost 39 34 32 –4 –3 –25 22 –2 11 57 29 18
Past service cost 2 2
Net Interest cost –4 –4 –8 2 3 3 1 2 –2 –3
Effect of curtailment or settlement –3 –2 –1 –1 –3 –2
Defined benefit plans 35 27 24 –1 - –22 21 –1 13 54 26 15
Defined contribution plans 331 355 329
385 381 344
Determination of the net defined benefit asset/liability
The net defined benefit asset/liability is reviewed and adjusted annually. The assumptions used in
the determination of the net defined benefit asset/liability and the Other post-employment
benefits include discount rates, mortality rates, expected rates of salary increases (excluding
promotion increases), and indexation. The rates used for salary developments, interest discount
factors, and other adjustments reflect country-specific conditions.
The key assumption in the determination of the net defined benefit asset/liability is the discount
rate. The discount rate is the weighted average of the discount rates that are applied in different
regions where ING Bank has defined benefit pension plans (weighted by the defined benefit
obligation). The discount rate is based on a methodology that uses market yields on high quality
corporate bonds of the specific regions with durations matching the pension liabilities as key input.
Market yields of high quality corporate bonds reflect the yield on corporate bonds with an AA rating
for durations where such yields are available. An extrapolation is applied in order to determine the
yield to the longer durations for which no AA-rated corporate bonds are available. As a result of the
limited availability of long-duration AA-rated corporate bonds, extrapolation is an important
element of the determination of the discount rate. The weighted average discount rate applied for
net defined benefit asset/liability for 2018 was 2.3% (2.0% in 2017) based on the pension plan in
the Netherlands, Germany, Belgium, The United States of America, and the United Kingdom. The
average discount rate applied for Other post-employment benefits was 3.9% (3.2% in 2017).
Sensitivity analysis of key assumptions
ING performs sensitivity analysis on the most significant assumptions: discount rates, mortality,
expected rate of salary increase, and indexation. The sensitivity analysis has been carried out
under the assumption that the changes occurred at the end of the reporting period.
The sensitivity analysis calculates the financial impact on the defined benefit obligation of an
increase or decrease of the weighted averages of each significant actuarial assumption, all other
assumptions held constant. In practice, this is unlikely to occur, and some changes of the
assumptions may be correlated. Changes to mortality, expected rate of salary increase, and
indexation would have no material impact on the defined benefit obligation. The most significant
impact would be from a change in the discount rate. An increase or decrease in the discount rate of
1% creates a financial impact of EUR -415 million and EUR 534 million, respectively.
Pension and other staff-related benefit costs

ING Bank Annual Report 2018 124
Contents | Who we are | Report of the Management Board | Corporate governance | Consolidated annual accounts | Parent company annual accounts | Other information
> Taxation > 35
Expected cash flows
Annual contributions are paid to the funds at a rate necessary to adequately finance the accrued
liabilities of the plans calculated in accordance with local legal requirements. Plans in all countries
are designed to comply with applicable local regulations governing investments and funding levels.
ING Bank’s subsidiaries should fund the cost of the entitlements expected to be earned on a yearly
basis.
For 2019 the expected contributions to pension plans are EUR 36 million.
The benefit payments for defined benefit and other post-employment benefits expected to be
made by the plan between 2019-2023 are estimated to be between EUR 94 million and EUR 125
million per annum. From 2024 to 2028 the total payments made by the plan are expected to be
EUR 661 million.
35 Taxation
Statement of financial position – Deferred tax
Deferred taxes are recognised on all temporary differences under the liability method using tax
rates applicable in the jurisdictions in which ING Bank is subject to taxation.
2018
Net
liability (-)
Net
asset (+)
2017
Effect of
changes in
accountin
g policies²
Change
through
equity
Change
through
net result
Exchange
rate
difference
s
Changes
in the
compo-
sition of
the group
and other
changes
Net
liability (-)
Net
asset (+)
2018
Financial assets at FVOCI¹ –555 142 76 273 4 –2 –64
Investment properties –5 –1 0 –6
Financial assets and liabilities at FVPL 419 16 –338 17 1 116
Depreciation –24 1 –0 –23
Cash flow hedges –72 –76 7 1 –140
Pension and post-employment
benefits 76 –12 –8 2 0 59
Other provisions 198 4 –187 –7 1 10
Receivables 614 –0 –59 1 0 556
Loans and advances to customers –394 137 35 24 –1 2 –198
Unused tax losses carried forward –8 60 –2 –0 51
Other –183 45 –53 60 1 –31 –160
66 344 –29 –175 23 –27 201
Presented in the statement of
financial position as:
– Deferred tax liabilities –752 –640
– Deferred tax assets 818 841
66 201
1 Financial assets FVOCI refers to the Investments Available for Sale under IAS 39.
2 Effect of changes in accounting policies refers to IFRS 9 implementation (reference is made to Note 1 ‘Accounting policies -
Reconciliation of carrying amounts on the date of initial application IFRS 9’).
Changes in deferred tax

ING Bank Annual Report 2018 125
Contents | Who we are | Report of the Management Board | Corporate governance | Consolidated annual accounts | Parent company annual accounts | Other information
> Taxation > 35
The deferred tax balance recorded under 'Other provisions' declined in 2018 by EUR 187 million
change through net result of which EUR 90 million relates to the decline of the Belgian
reorganisation provision.
Changes in the Composition of the Group and other changes include the deferred tax liability (EUR -
30 million) regarding the acquisition of Payvision.
2017
Net
liability (-)
Net
asset (+)
2016
Change
through
equity
Change
through
net result
Exchange
rate
difference
s
Changes
in the
composi-
tion of the
group and
other
changes
Net
liability (-)
Net
asset (+)
2017
Investments –799 123 116 5 –555
Investment properties –5 –5
Financial assets and liabilities at fair
value through profit or loss 697 –290 12 419
Depreciation –33 5 4 –24
Cash flow hedges –238 167 –1 –72
Pension and post-employment benefits 112 –25 –6 –5 76
Other provisions 255 –48 –6 –3 198
Receivables 570 49 –5 614
Loans and advances to customers –409 –2 17 –394
Unused tax losses carried forward 57 –60 –5 –8
Other –126 –10 –49 2 –183
81 253 –266 1 –3 66
Presented in the statement of financial
position as:
– Deferred tax liabilities –919 –752
– Deferred tax assets 1,000 818
81 66
2018 2017
Total unused tax losses carried forward 1,771 1,732
Unused tax losses carried forward not recognised as a deferred tax asset 1,010 1,074
Unused tax losses carried forward recognised as a deferred tax asset 761 658
Average tax rate 20.5% 19.5%
Deferred tax asset 156 128
No deferred tax
asset recognised
Deferred tax asset
recognised
2018 2017 2018 2017
Within 1 year 1 2
More than 1 year but less than 5 years 2 350 2 38
More than 5 years but less than 10 years 83 31 1
More than 10 years but less than 20 years 18
Unlimited 923 673 758 620
1,010 1,074 761 658
The above mentioned deferred tax of EUR 156 million (2017: EUR 128 million) and the related
unused tax losses carried forward exclude the deferred tax liability recorded in the Netherlands
with respect to the recapture of previously deducted UK tax losses in the Netherlands for the
amount of EUR –105 million (2017: EUR –136 million).
Deferred tax assets are recognised for temporary deductible differences, for tax losses carried
forward and unused tax credits only to the extent that realisation of the related tax benefit is
probable.
2018 2017
Italy 189 107
Changes in deferred tax
Deferred tax in connection with unused tax losses carried forward
Total unused tax losses carried forward analysed by expiry terms
Breakdown of certain net deferred tax asset positions by jurisdiction

ING Bank Annual Report 2018 126
Contents | Who we are | Report of the Management Board | Corporate governance | Consolidated annual accounts | Parent company annual accounts | Other information
> Taxation > 35
The table above includes a breakdown of certain net deferred tax asset positions by jurisdiction for
which the utilisation is dependent on future taxable profits whilst the related entities have incurred
losses in either the current or the preceding year.
Recognition is based on the fact that it is probable that the entity will have taxable profits and/or
can utilise tax planning opportunities before expiration of the deferred tax assets. Changes in
circumstances in future periods may adversely impact the assessment of the recoverability. The
uncertainty of the recoverability is taken into account in establishing the deferred tax assets.
Statement of profit or loss – Taxation
Netherlands International Total
2018 2017 2016 2018 2017 2016 2018 2017 2016
Current taxation 597 510 167 1,263 1,527 1,375 1,861 2,037 1,542
Deferred taxation 37 151 193 139 115 –100 175 266 93
634 661 360 1,402 1,642 1,275 2,036 2,303 1,635
2018 2017 2016
Result before tax from continuing operations 6,751 7,404 5,937
Weighted average statutory tax rate 25.9% 27.0% 27.5%
Weighted average statutory tax amount 1,751 2,002 1,630
Participation exemption –77 –45 –61
Other income not subject to tax –40 –84 –111
Expenses not deductible for tax purposes 346 155 129
Impact on deferred tax from change in tax rates –8 55 –1
Deferred tax benefit from previously unrecognised amounts –4 –18
Current tax from previously unrecognised amounts 28 66 –22
Write-off/reversal of deferred tax assets 4 2 33
State and local taxes 25 47 33
Adjustment to prior periods 7 109 23
Effective tax amount 2,036 2,303 1,635
Effective tax rate 30.2% 31.1% 27.6%
The weighted average statutory tax rate in 2018 is lower compared to 2017. This is mainly due to
lower statutory income tax rates in the USA and Belgium.
The effective tax rate of 30.2% in 2018 is significantly higher than the weighted average statutory
tax rate. This is mainly caused by a high amount of expenses non-deductible for tax purposes (tax
amount: EUR 346 million).
This relatively high amount of non-deductible expenses is caused by the settlement agreement
reached with the Dutch authorities on regulatory issues (tax amount: EUR 194 million).
The weighted average statutory tax rate in 2017 does not significantly differ compared to 2016.
The effective tax rate in 2017 was 31.1%.
Taxation by type
Reconciliation of the weighted average statutory income tax rate to
ING Bank’s effective income tax rate
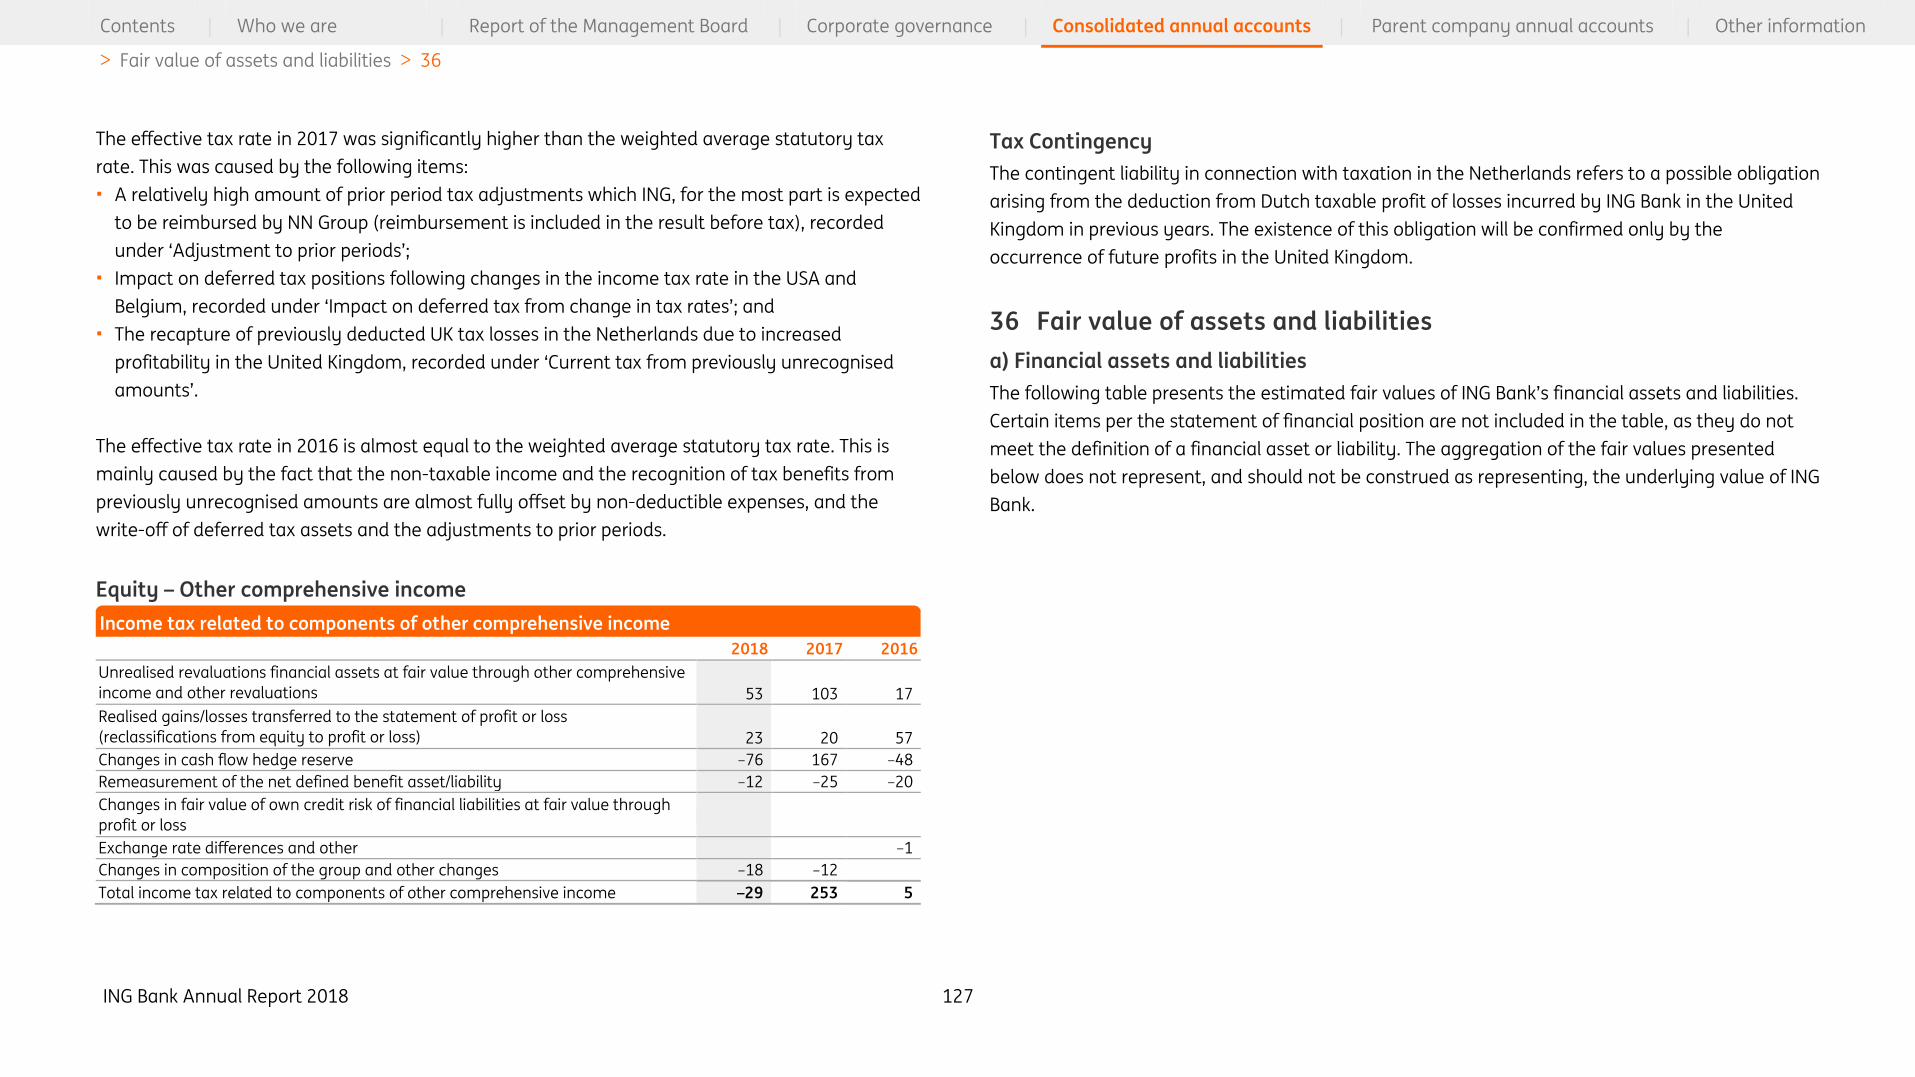
ING Bank Annual Report 2018 127
Contents | Who we are | Report of the Management Board | Corporate governance | Consolidated annual accounts | Parent company annual accounts | Other information
> Fair value of assets and liabilities > 36
The effective tax rate in 2017 was significantly higher than the weighted average statutory tax
rate. This was caused by the following items:
• A relatively high amount of prior period tax adjustments which ING, for the most part is expected
to be reimbursed by NN Group (reimbursement is included in the result before tax), recorded
under ‘Adjustment to prior periods’;
• Impact on deferred tax positions following changes in the income tax rate in the USA and
Belgium, recorded under ‘Impact on deferred tax from change in tax rates’; and
• The recapture of previously deducted UK tax losses in the Netherlands due to increased
profitability in the United Kingdom, recorded under ‘Current tax from previously unrecognised
amounts’.
The effective tax rate in 2016 is almost equal to the weighted average statutory tax rate. This is
mainly caused by the fact that the non-taxable income and the recognition of tax benefits from
previously unrecognised amounts are almost fully offset by non-deductible expenses, and the
write-off of deferred tax assets and the adjustments to prior periods.
Equity – Other comprehensive income
2018 2017 2016
Unrealised revaluations financial assets at fair value through other comprehensive
income and other revaluations 53 103 17
Realised gains/losses transferred to the statement of profit or loss
(reclassifications from equity to profit or loss) 23 20 57
Changes in cash flow hedge reserve –76 167 –48
Remeasurement of the net defined benefit asset/liability –12 –25 –20
Changes in fair value of own credit risk of financial liabilities at fair value through
profit or loss
Exchange rate differences and other –1
Changes in composition of the group and other changes –18 –12
Total income tax related to components of other comprehensive income –29 253 5
Tax Contingency
The contingent liability in connection with taxation in the Netherlands refers to a possible obligation
arising from the deduction from Dutch taxable profit of losses incurred by ING Bank in the United
Kingdom in previous years. The existence of this obligation will be confirmed only by the
occurrence of future profits in the United Kingdom.
36 Fair value of assets and liabilities
a) Financial assets and liabilities
The following table presents the estimated fair values of ING Bank’s financial assets and liabilities.
Certain items per the statement of financial position are not included in the table, as they do not
meet the definition of a financial asset or liability. The aggregation of the fair values presented
below does not represent, and should not be construed as representing, the underlying value of ING
Bank.
Income tax related to components of other comprehensive income

ING Bank Annual Report 2018 128
Contents | Who we are | Report of the Management Board | Corporate governance | Consolidated annual accounts | Parent company annual accounts | Other information
> Fair value of assets and liabilities > 36
Estimated fair value
Statement of financial
position value
20183 2017 2018 2017
Financial assets
Cash and balances with central banks 49,987 21,989 49,987 21,989
Loans and advances to banks 30,548 28,846 30,420 28,746
Financial assets at fair value through profit or loss
– Trading assets 50,163 116,763 50,163 116,763
– Non-trading derivatives 2,672 2,185 2,672 2,185
– Assets mandatorily as at fair value through profit or loss 64,783 n/a 64,783 n/a
– Assets designated as at fair value through profit or loss 2,887 4,242 2,887 4,242
Investments
- Available-for-sale n/a 69,730 n/a 69,730
- held to maturity n/a 9,378 n/a 9,343
Financial assets at fair value through other comprehensive income
– Equity securities 3,228 n/a 3,228 n/a
– Debt securities 25,616 n/a 25,616 n/a
– Loans and advances 2,379 n/a 2,379 n/a
Securities at amortised cost 47,815 n/a 47,276 n/a
Loans and advances to customers4 602,959 587,842 592,328 574,899
Other assets1 7,389 11,719 7,389 11,719
890,427 852,694 879,129 839,616
Financial liabilities
Deposits from banks 37,631 36,868 37,330 36,821
Customer deposits 580,404 553,546 580,294 552,690
Financial liabilities at fair value through profit or loss
– Trading liabilities 31,215 73,596 31,215 73,596
– Non-trading derivatives 2,313 2,346 2,313 2,346
– Designated as at fair value through profit or loss 59,179 11,215 59,179 11,215
Other liabilities2 12,011 14,419 12,011 1,419
Debt securities in issue 102,207 90,614 102,159 90,231
Subordinated loans 13,872 16,391 13,643 15,831
838,832 798,995 838,144 797,149
1 Other assets do not include, among others: (deferred) tax assets, net defined benefit asset, inventory, property
development and property obtained from foreclosures.
2 Other liabilities do not include, among others: (deferred) tax liabilities, net defined benefit and related employee benefit
liabilities, reorganisation and other provisions ,and other taxation and social security contributions.
3 The 2018 presentation was prospectively changed together with other IFRS9 changes and includes the reclassification of
accrued interest from other assets and other liabilities to the corresponding balance sheet item of the host contract.
4 In 2018, the fair value of the loans and advances to customers as at 31 December 2017 is adjusted by the amount of the
accrued interest (EUR 1,522 million). In 2017 the fair value of the accrued interest was reported, separate from loans and
advances to customers, under other assets.
Valuation Methods
The estimated fair values represent the price that would be received to sell an asset or paid to
transfer a liability in an orderly transaction between market participants at the measurement date.
It is a market-based measurement, which is based on assumptions that market participants would
use and takes into account the characteristics of the asset or liability that market participants
would take into account when pricing the asset or liability. Fair values of financial assets and
liabilities are based on quoted prices in active market where available. When such quoted prices are
not available, the fair value is determined by using valuation techniques.
ING uses unadjusted quotes where available. Unadjusted quoted prices are primarily obtained from
exchange prices for listed financial instruments. Where an exchange price is not available, quoted
market prices in active markets may be obtained from independent market vendors, brokers, or
market makers. In general, positions are valued at the bid price for a long position and at the offer
price for a short position or are valued at the price within the bid-offer spread that is most
representative of fair value at the date of valuation.
For certain financial assets and liabilities quoted market prices are not available. For these financial
assets and liabilities, fair value is determined using valuation techniques. These valuation
techniques range from discounting of cash flows to various valuation models, where relevant
pricing factors including the market price of underlying reference instruments, market parameters
(e.g. volatilities, correlations and credit ratings), and customer behaviour are taken into account.
ING maximises the use of market observable inputs and minimises the use of unobservable input in
determining the fair value. The fair value can be subjective dependent on the significance of the
unobservable input to the overall valuation. All valuation techniques used are subject to internal
Fair value of financial assets and liabilities
ING Bank Annual Report 2018 129
Contents | Who we are | Report of the Management Board | Corporate governance | Consolidated annual accounts | Parent company annual accounts | Other information
> Fair value of assets and liabilities > 36
review and approval. Data used in these valuation techniques are validated on a daily basis when
possible.
When a group of financial assets and financial liabilities are managed on the basis of their net risk
exposures, it measures the fair value of a group of financial assets or liabilities on net portfolio level.
Control framework
To determine whether the valuations based upon data inputs have led to an appropriate fair value,
the process of independent price verification (‘IPV’) or price testing is applied. This is done to ensure
the appropriate reflection of these valuations in balance sheet and the profit and loss accounts. IPV
tests and confirms the reliability of the market data used in these valuations and can lead to
adjustments in valuation. The IPV process is performed at least monthly or more frequently
depending on the nature of the market or trading activity. Multiple data sources are used to the
extent that such prices are available and taking into account cost-benefit ratio of retrieving such
prices. Valuation differences between primary and secondary source data are assessed. When
differences resulting from price testing exceed pre-approved thresholds, adjustments to the profit
and loss shall be made. Differences and adjustments must be assessed individually, approved by
the Local Parameter Committee, and reported back in the meeting minutes. In case a material
difference in value is found through the IPV process, it must be fully understood what the
underlying cause is for the difference, and if a systematic change is required (e.g. change of
source). Pricing and price testing is applied at individual trade level and is organised at a desk level.
Valuation processes are governed by various governance bodies, which include Local Parameter
Committees (LPC), Global Price Testing and Impairment Committee (GP&IC), Market Data
Committee (MDC), Trading Pricing Model Committee (TPMC). All relevant committees meet on a
quarterly basis or more frequent as required. Key valuation controls including product approval
process (PARP), IPV, valuation adjustments, and model use is monitored.
The Global Price Testing and Impairment Committee is responsible for the oversight and the
approval of the outcome of impairments (other loan loss provisions) and valuation- (price-testing)
processes. It oversees the quality and coherence of valuation methodologies and processes. The
TMPC is responsible for validating the appropriate models. Local Parameter Committees monitor
the appropriateness of (quoted) pricing, any other relevant market info, as well as that of pricing
models themselves related to the fair valued positions to which they are applied. LPC executes
valuation methodology and processes at a local level. The Market Data Committee approves and
reviews all pricing inputs for the calculation of market parameters.
Valuation Adjustments
Valuation adjustments are an integral part of the fair value. They are included as part of the fair
value to provide better estimation of market exit value on measurement date. ING considers
various valuation adjustments to arrive at the fair value including Bid-Offer adjustments, Credit
Valuation Adjustments (CVA), Debt Valuation Adjustments (DVA), Model Risk Adjustments,
Collateral Valuation Adjustment (CollVA), Funding Valuation Adjustment (FVA) and Exceptional
Valuation Adjustments. The combination of Credit Valuation adjustment and Debt Valuation
adjustment for derivatives is called Bilateral Valuation Adjustment (BVA).
• Bid-Offer adjustments are required to adjust mid-market values to appropriate bid or offer value
in order to best represent the exit value, and therefore fair value. It is applicable to financial
assets and liabilities that are valued at mid-price initially. In practice this adjustment accounts for
the difference in valuation from mid to bid and mid to offer for long and short exposures
respectively. In principle assets are valued at the bid prices and liabilities are valued at the offer
price. For certain assets or liabilities, where market quoted price is not available, the price within
the bid-offer spread that is most representative of fair value is used.
• Bilateral Valuation Adjustment (BVA) is the valuation component for the counterparty credit risk
of the derivative contracts. It has bilateral nature, where both counterparty’s credit risk and ING’s
own credit risks is taken into account. The calculation is based on the estimation of the expected
exposure, the counterparties’ risk of default, and taking into account the collateral agreements
as well as netting agreements. The counterparties’ risk of default is measured by probability of
default and expected loss given default, which is based on market information including credit
default swap (CDS) spread. Where counterparty CDS spreads are not available, relevant proxy
spreads are used. Additionally, wrong-way risk (when exposure to a counterparty is increasing
and the credit quality of that counterparty deteriorates) and right-way risk (when exposure to a
ING Bank Annual Report 2018 130
Contents | Who we are | Report of the Management Board | Corporate governance | Consolidated annual accounts | Parent company annual accounts | Other information
> Fair value of assets and liabilities > 36
counterparty is increasing and the credit quality of that counterparty improves) are included in
the adjustment.
• ING applies Debt Valuation Adjustment (DVA) to own issued financial liabilities that are measured
at fair value through profit or loss, if the credit risk component has not been included in the
prices. In the DVA calculation, the default probability of the institution are estimated based on
the ING Funding spread.
• Model risk adjustments reduce the risk of possible financial losses resulting from the use of a mis-
specified, misapplied, or incorrect implementation of a model.
• Collateral Valuation Adjustment (CollVA) is a derivative valuation adjustment capturing specific
features of CSA (Credit Support Annex) with a counterparty that the regular valuation framework
does not capture. Non-standard CSA features may include deviations in relation to the currency
in which ING posts or receives collateral, deviations in remuneration rate on collateral which may
pay lower or higher rate than overnight rate or even no interest at all. Other deviations can be
posting securities rather than cash as collateral.
• ING applies an additional ‘Funding Valuation Adjustment’ (FVA) to address the funding costs
associated with the collateral funding asymmetry on uncollateralized or partially collateralized
derivatives in the portfolio. This adjustment is based on the expected exposure profiles of the
uncollateralized or partially collateralized OTC derivatives and market-based funding spreads.
• Exeptional Valuation Adjustments – Exceptional valuation adjustments are valuation
adjustments of temporary nature and are subject to approval of GP&IC.
The following methods and assumptions were used by ING Bank to estimate the fair value of the
financial instruments:
a.1) Financial assets
Cash and balances with central banks
The carrying amount of cash approximates its fair value.
Loans and advances to banks
The fair values of receivables from banks are generally based on quoted market prices or, if
unquoted, on estimates based on discounting future cash flows using available market interest
rates including appropriate spreads offered for receivables with similar characteristics, similar to
Loans and advances to customers described below.
Financial assets at fair value through profit or loss, Financial assets at fair value
through other comprehensive income and Securities at amortised cost
Derivatives
Derivatives contracts can either be exchange-traded or over the counter (OTC). The fair value of
exchange-traded derivatives is determined using quoted market prices in an active market and
those derivatives are classified in Level 1 of the fair value hierarchy. For those instruments not
actively traded, fair values are estimated based on valuation techniques. OTC derivatives and
derivatives trading in an inactive market are valued using valuation techniques because quoted
market prices in an active market are not available for such instruments. The valuation techniques
and inputs depend on the type of derivative and the nature of the underlying instruments. The
principal techniques used to value these instruments are based on (amongst others) discounted
cash flows option pricing models and Monte Carlo simulation. These valuation models calculate the
present value of expected future cash flows, based on ‘no-arbitrage’ principles. These models are
commonly used in the financial industry. Inputs to valuation models are determined from
observable market data where possible. Certain inputs may not be observable in the market
directly, but can be determined from observable prices via valuation model calibration procedures.
The inputs used include for example prices available from exchanges, dealers, brokers or providers
of pricing, yield curves, credit spreads, default rates, recovery rates, dividend rates, volatility of
underlying interest rates, equity prices, and foreign currency exchange rates. These inputs are
determined with reference to quoted prices, recently executed trades, independent market quotes
and consensus data, where available.

ING Bank Annual Report 2018 131
Contents | Who we are | Report of the Management Board | Corporate governance | Consolidated annual accounts | Parent company annual accounts | Other information
> Fair value of assets and liabilities > 36
For uncollateralised OTC derivatives, ING applies Credit Valuation Adjustment to correctly reflect the
counterparty credit risk in the valuation. The technique for calculating CVA is based on Monte Carlo
simulation and uses various input including counterparty credit spread, market interest rates, and
market exchanges rates. The counterparty credit spreads are based on counterparty CDS spread
where available. Otherwise, the indexed proxy CDS spreads are used.
Equity securities
The fair values of publicly traded equity securities are based on quoted market prices when
available. Where no quoted market prices are available, fair value is determined based on quoted
prices for similar securities or other valuation techniques.
The fair value of private equity is based on quoted market prices, if available. In the absence of
quoted prices in an active market, fair value is estimated on the basis of an analysis of the
investee’s financial position and results, risk profile, prospects, price, earnings comparisons and
revenue multiples, and by reference to market valuations for similar entities quoted in an active
market.
Debt securities
Fair values for debt securities are based on quoted market prices, where available. Quoted market
prices may be obtained from an exchange, dealer, broker, industry group, pricing service, or
regulatory service. The quoted prices from non-exchange sources are assessed to determine if they
are tradable prices. This distinction determines where it falls in the fair value hierarchy.
If quoted prices in an active market are not available, fair value is based on an analysis of available
market inputs, which may include consensus prices obtained from one or more pricing services or
by a valuation technique that discounts expected future cash flows using a market interest rate
curves, referenced credit spreads, maturity of the investment, and estimated prepayment rates
where applicable.
Loans and advances to customers
For loans and advances that are repriced frequently and have had no significant changes in credit
risk, carrying amounts represent a reasonable estimate of the fair value. The fair value of other
loans is estimated by discounting expected future cash flows using a discount rate that reflects
credit risk, liquidity, and other current market conditions. The fair value of mortgage loans is
estimated by taking into account prepayment behaviour. Loans with similar characteristics are
aggregated for calculation purposes.
Other assets
The other assets are stated at their carrying value which is not significantly different from their fair
value.
a.2) Financial liabilities
Deposits from banks
The fair values of payables to banks are generally based on quoted market prices or, if not
available, on estimates based on discounting future cash flows using available market interest
rates and credit spreads for payables to banks with similar characteristics.
Customer deposits
The carrying values of customer deposits with an immediate on demand features approximate
their fair values. The fair values of deposits with fixed contractual terms have been estimated based
on discounting future cash flows using the interest rates currently applicable to deposits of similar
maturities.
Financial liabilities at fair value through profit or loss
The fair values of securities in the trading portfolio and other liabilities at fair value through profit or
loss are based on quoted market prices, where available. For those securities not actively traded,
fair values are estimated based on internal discounted cash flow valuation techniques using
ING Bank Annual Report 2018 132
Contents | Who we are | Report of the Management Board | Corporate governance | Consolidated annual accounts | Parent company annual accounts | Other information
> Fair value of assets and liabilities > 36
interest rates and credit spreads that apply to similar instruments. Reference is made to Financial
assets at fair value through profit or loss above.
Other liabilities
The other liabilities are stated at their carrying value which is not significantly different from their
fair value.
Debt securities in issue
The fair value of debt securities in issue is generally based on quoted market prices, or if not
available, on estimated prices by discounting expected future cash flows using a current market
interest rate and credit spreads applicable to the yield, credit quality and maturity.
Subordinated loans
The fair value of publicly traded subordinated loans are based on quoted market prices when
available. Where no quoted market prices are available, fair value of the subordinated loans is
estimated using discounted cash flows based on interest rates and credit spreads that apply to
similar instruments.
a.3) Fair value hierarchy
ING Bank has categorised its financial instruments that are either measured in the statement of
financial position at fair value or of which the fair value is disclosed, into a three level hierarchy
based on the priority of the inputs to the valuation. The fair value hierarchy gives the highest
priority to (unadjusted) quoted prices in active markets for identical assets or liabilities and the
lowest priority to valuation techniques supported by unobservable inputs. An active market for the
asset or liability is a market in which transactions for the asset or liability occur with sufficient
frequency and volume to provide reliable pricing information on an ongoing basis. The fair value
hierarchy consists of three levels, depending upon whether fair values were determined based on
(unadjusted) quoted prices in an active market (Level 1), valuation techniques with observable
inputs (Level 2) or valuation techniques that incorporate inputs which are unobservable and which
have a more than insignificant impact on the fair value of the instrument (Level 3). Financial assets
in Level 3 include for example illiquid debt securities, complex derivatives, certain complex loans
(for which current market information about similar assets to use as observable, corroborated data
for all significant inputs into a valuation model is not available), and asset backed securities for
which there is no active market and a wide dispersion in quoted prices.
Observable inputs reflect market data obtained from independent sources. Unobservable inputs are
inputs which are based on the Bank’s own assumptions about the factors that market participants
would use in pricing an asset or liability, developed based on the best information available in the
market. Unobservable inputs may include volatility, correlation, spreads to discount rates, default
rates and recovery rates, prepayment rates, and certain credit spreads. Transfers into and transfers
out of fair value hierarchy levels are made on a quarterly basis.
Level 1 – (Unadjusted) quoted prices in active markets
This category includes financial instruments whose fair value is determined directly by reference to
(unadjusted) quoted prices in an active market that ING Bank can access. A financial instrument is
regarded as quoted in an active market if quoted prices are readily and regularly available from an
exchange, dealer markets, brokered markets, or principal to principal markets. Those prices
represent actual and regularly occurring market transactions with sufficient frequency and volume
to provide pricing information on an ongoing basis. Transfers out of Level 1 into Level 2 or Level 3
occur when ING Bank establishes that markets are no longer active and therefore (unadjusted)
quoted prices no longer provide reliable pricing information.
Level 2 – Valuation technique supported by observable inputs
This category includes financial instruments whose fair value is based on market observables other
than (unadjusted) quoted prices. The fair value for financial instruments in this category can be
determined by reference to quoted prices for similar instruments in active markets, but for which
the prices are modified based on other market observable external data or reference to quoted
prices for identical or similar instruments in markets that are not active. These prices can be
obtained from a third party pricing service. ING analyses how the prices are derived and determines

ING Bank Annual Report 2018 133
Contents | Who we are | Report of the Management Board | Corporate governance | Consolidated annual accounts | Parent company annual accounts | Other information
> Fair value of assets and liabilities > 36
whether the prices are liquid tradable prices or model based consensus prices taking various data
as inputs.
For financial instruments that do not have a reference price available, fair value is determined using
a valuation technique (e.g. a model), where inputs in the model are taken from an active market or
are observable, such as interest rates and yield curves observable at commonly quoted intervals,
implied volatilities, and credit spreads.
If certain inputs in the model are unobservable, the instrument is still classified in this category,
provided that the impact of those unobservable inputs on the overall valuation is insignificant. The
notion of significant is particularly relevant for the distinction between Level 2 and Level 3 assets
and liabilities. ING Bank has chosen to align the definition of significant with the 90% confidence
range as captured in the prudent value definition by EBA. Unobservable parameters are shifted
down and upwards to reach this 90% confidence range. The same 90% confidence range is applied
to model uncertainty. If the combined change in asset value resulting from the shift of the
unobservable parameters and the model uncertainty exceeds the threshold, the asset is classified
as Level 3. A value change below the threshold results in a Level 2 classification.
Valuation techniques used for Level 2 assets and liabilities range from discounting of cash flows to
various industry standard valuation models such as option pricing model and Monte Carlo
simulation model, where relevant pricing factors including the market price of underlying reference
instruments, market parameters (volatilities, correlations, and credit ratings), and customer
behaviour are taken into account.
Level 3 – Valuation technique supported by unobservable inputs
This category includes financial instruments whose fair value is determined using a valuation
technique (e.g. a model) for which more than an insignificant part of the inputs in terms of the
overall valuation are not market observable. This category also includes financial assets and
liabilities whose fair value is determined by reference to price quotes but for which the market is
considered inactive. An instrument in its entirety is classified as Level 3 if a significant portion of the
instrument’s fair value is driven by unobservable inputs. Unobservable in this context means that
there is little or no current market data available from which to derive a price that an unrelated,
informed buyer would purchase the asset or liability at.
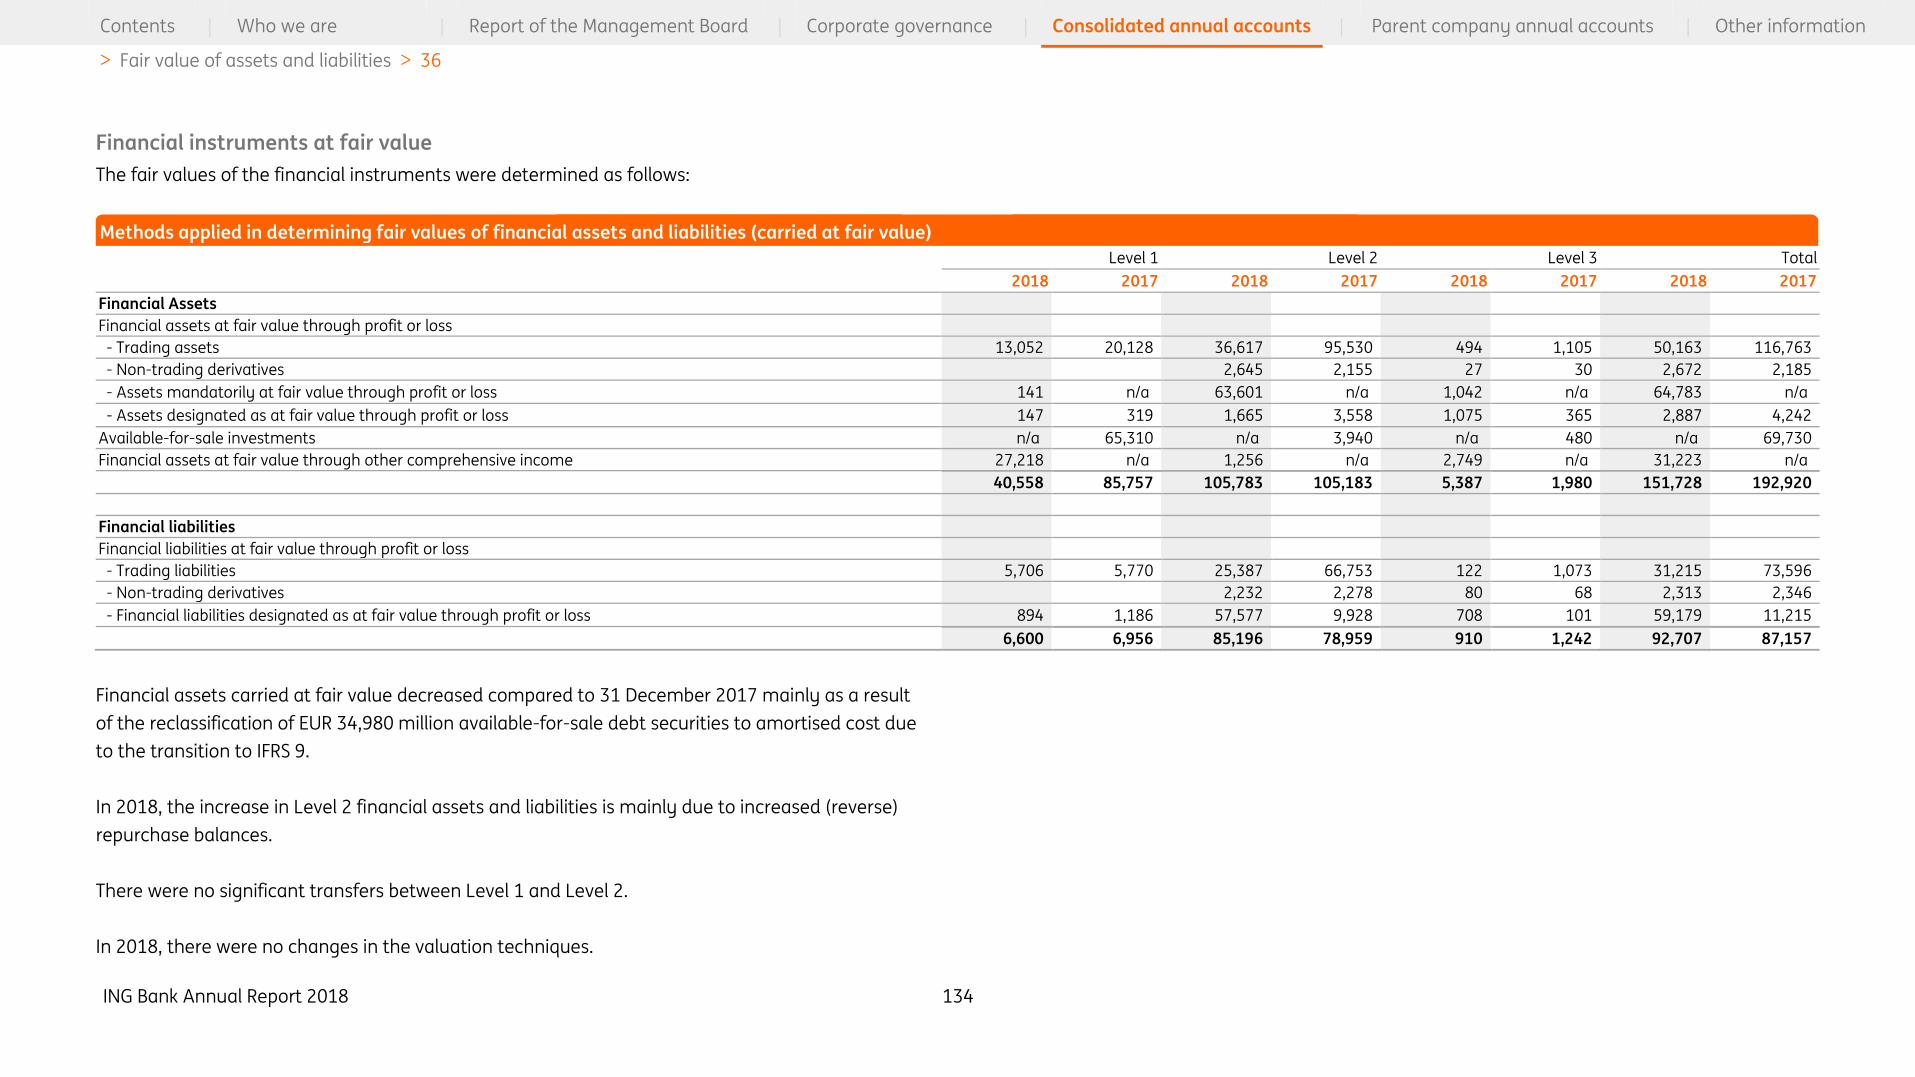
ING Bank Annual Report 2018 134
Contents | Who we are | Report of the Management Board | Corporate governance | Consolidated annual accounts | Parent company annual accounts | Other information
> Fair value of assets and liabilities > 36
Financial instruments at fair value
The fair values of the financial instruments were determined as follows:
Level 1 Level 2 Level 3 Total
2018 2017 2018 2017 2018 2017 2018 2017
Financial Assets
Financial assets at fair value through profit or loss
- Trading assets 13,052 20,128 36,617 95,530 494 1,105 50,163 116,763
- Non-trading derivatives 0 2,645 2,155 27 30 2,672 2,185
- Assets mandatorily at fair value through profit or loss 141 n/a 63,601 n/a 1,042 n/a 64,783 n/a
- Assets designated as at fair value through profit or loss 147 319 1,665 3,558 1,075 365 2,887 4,242
Available-for-sale investments n/a 65,310 n/a 3,940 n/a 480 n/a 69,730
Financial assets at fair value through other comprehensive income 27,218 n/a 1,256 n/a 2,749 n/a 31,223 n/a
40,558 85,757 105,783 105,183 5,387 1,980 151,728 192,920
Financial liabilities
Financial liabilities at fair value through profit or loss
- Trading liabilities 5,706 5,770 25,387 66,753 122 1,073 31,215 73,596
- Non-trading derivatives 0 2,232 2,278 80 68 2,313 2,346
- Financial liabilities designated as at fair value through profit or loss 894 1,186 57,577 9,928 708 101 59,179 11,215
6,600 6,956 85,196 78,959 910 1,242 92,707 87,157
Financial assets carried at fair value decreased compared to 31 December 2017 mainly as a result
of the reclassification of EUR 34,980 million available-for-sale debt securities to amortised cost due
to the transition to IFRS 9.
In 2018, the increase in Level 2 financial assets and liabilities is mainly due to increased (reverse)
repurchase balances.
There were no significant transfers between Level 1 and Level 2.
In 2018, there were no changes in the valuation techniques.
Methods applied in determining fair values of financial assets and liabilities (carried at fair value)
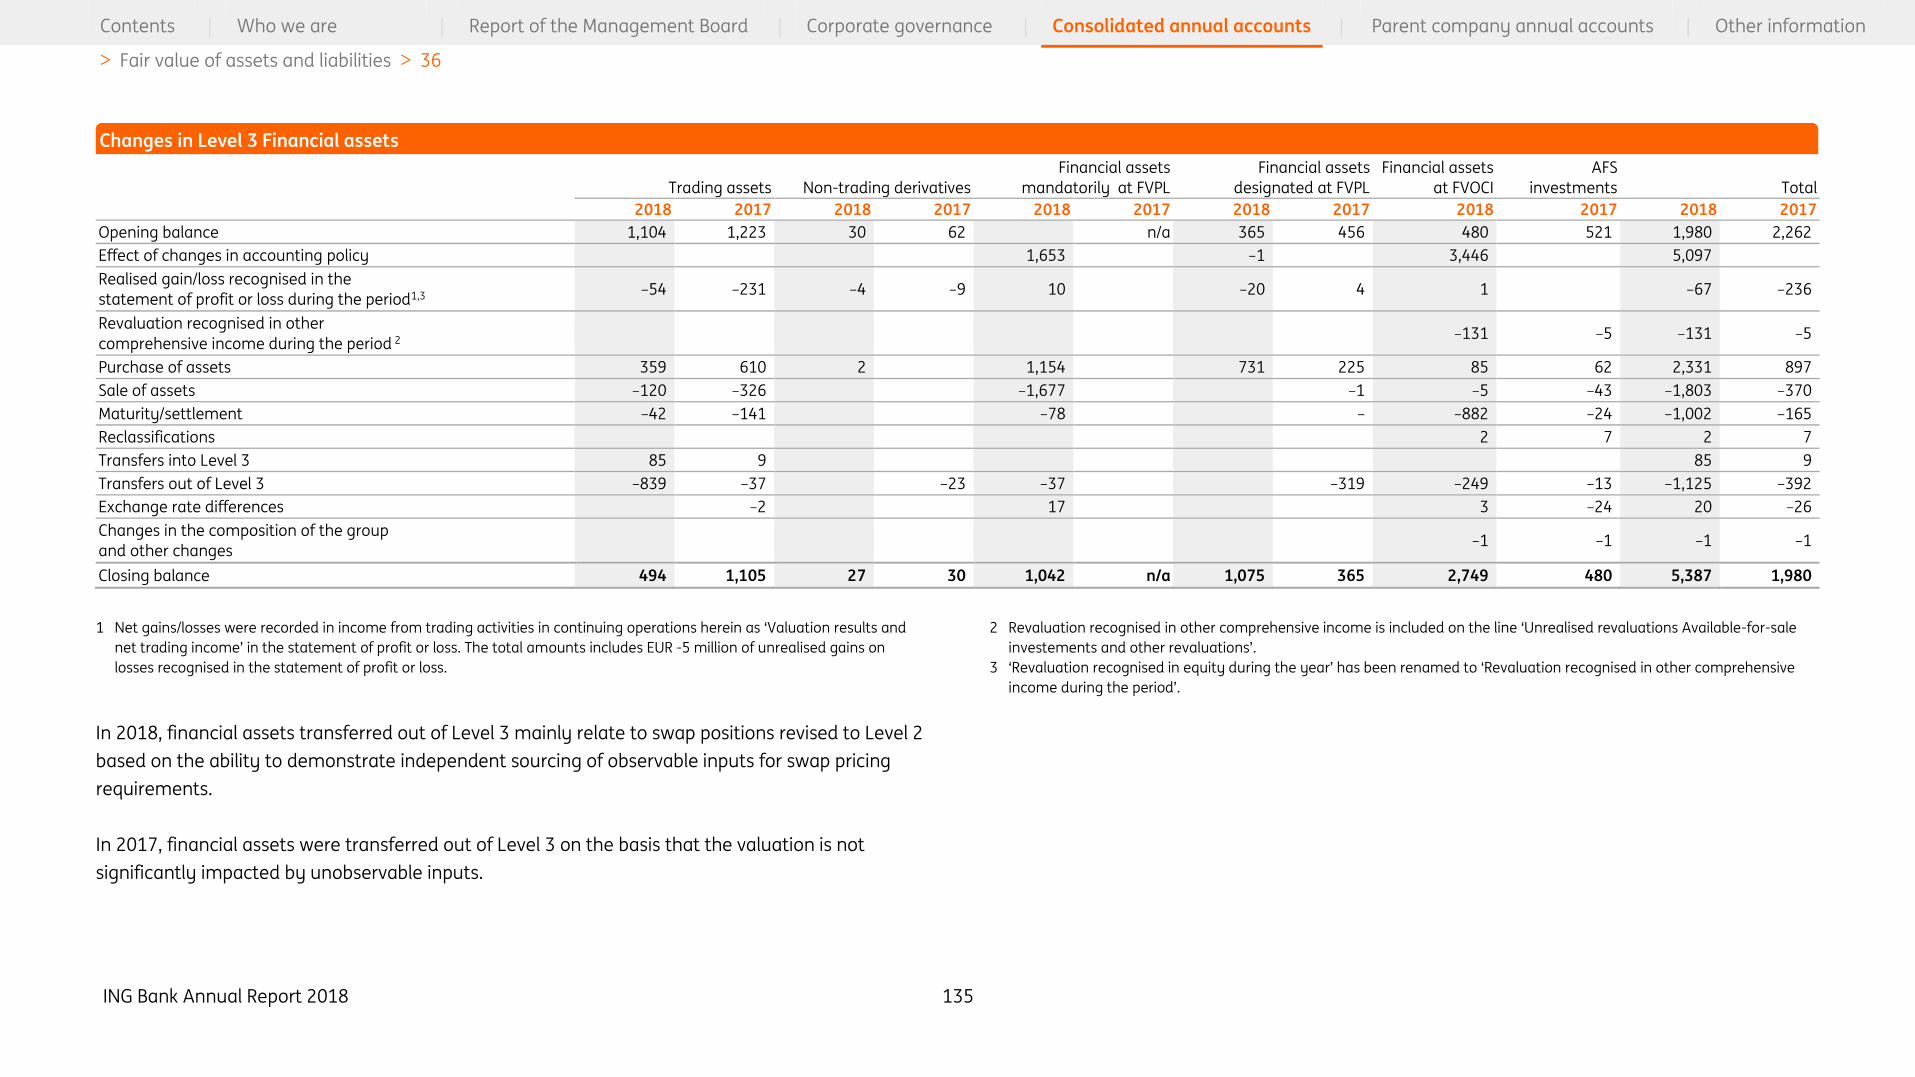
ING Bank Annual Report 2018 135
Contents | Who we are | Report of the Management Board | Corporate governance | Consolidated annual accounts | Parent company annual accounts | Other information
> Fair value of assets and liabilities > 36
Trading assets Non-trading derivatives
Financial assets
mandatorily at FVPL
Financial assets
designated at FVPL
Financial assets
at FVOCI
AFS
investments Total
2018 2017 2018 2017 2018 2017 2018 2017 2018 2017 2018 2017
Opening balance 1,104 1,223 30 62 – n/a 365 456 480 521 1,980 2,262
Effect of changes in accounting policy 1,653 –1 3,446 5,097
Realised gain/loss recognised in the
statement of profit or loss during the period1,3 –54 –231 –4 –9 10 –20 4 1 –67 –236
Revaluation recognised in other
comprehensive income during the period 2 –131 –5 –131 –5
Purchase of assets 359 610 2 – 1,154 – 731 225 85 62 2,331 897
Sale of assets –120 –326 –0 – –1,677 – –1 –5 –43 –1,803 –370
Maturity/settlement –42 –141 – –78 – – –882 –24 –1,002 –165
Reclassifications 2 7 2 7
Transfers into Level 3 85 9 –0 85 9
Transfers out of Level 3 –839 –37 –23 –37 –319 –249 –13 –1,125 –392
Exchange rate differences 0 –2 – 17 – 3 –24 20 –26
Changes in the composition of the group
and other changes 0 –1 –1 –1 –1
Closing balance 494 1,105 27 30 1,042 n/a 1,075 365 2,749 480 5,387 1,980
1 Net gains/losses were recorded in income from trading activities in continuing operations herein as ‘Valuation results and
net trading income’ in the statement of profit or loss. The total amounts includes EUR -5 million of unrealised gains on
losses recognised in the statement of profit or loss.
2 Revaluation recognised in other comprehensive income is included on the line ‘Unrealised revaluations Available-for-sale
investements and other revaluations’.
3 ‘Revaluation recognised in equity during the year’ has been renamed to ‘Revaluation recognised in other comprehensive
income during the period’.
In 2018, financial assets transferred out of Level 3 mainly relate to swap positions revised to Level 2
based on the ability to demonstrate independent sourcing of observable inputs for swap pricing
requirements.
In 2017, financial assets were transferred out of Level 3 on the basis that the valuation is not
significantly impacted by unobservable inputs.
Changes in Level 3 Financial assets

ING Bank Annual Report 2018 136
Contents | Who we are | Report of the Management Board | Corporate governance | Consolidated annual accounts | Parent company annual accounts | Other information
> Fair value of assets and liabilities > 36
Trading liabilities Non-trading derivatives
Financial liabilities designated as at fair
value through profit or loss Total
2018 2017 2018 2017 2018 2017 2018 2017
Opening balance 1,073 1,378 68 24 101 123 1,242 1,525
Effect of changes in accounting policy 4 0 4
Realised gain/loss recognised in the statement of profit or loss
during the period1 –67 –105 8 44 1 –6 –58 –67
Issue of liabilities 42 485 545 14 587 500
Early repayment of liabilities –87 –399 –20 –21 –106 –421
Maturity/settlement –37 –187 –11 –49 –187
Transfers into Level 3 39 16 92 131 16
Transfers out of Level 3 –844 –111 –9 –844 –120
Exchange rate differences –0 –4 –0 –0 –4
Changes in the composition of the group and other changes 2 2
Closing balance 122 1,073 80 68 708 101 910 1,242
1 Net gains/losses were recorded in income from trading activities in continuing operations included herein as ‘Valuation results and net trading income’ in the statement of profit or loss. The total amount includes EUR -58 million of unrealised gains and losses
recognised in the statement of profit or loss.
In 2018, financial liabilities transferred out of Level 3 mainly relate to swap positions revised to
Level 2 based on the ability to demonstrate independent sourcing of observable inputs for swap
pricing requirements.
In 2018 and 2017, financial liabilities were transferred out of Level 3 mainly due to the valuation
not being significantly impacted by unobservable inputs.
Changes in Level 3 Financial liabilities
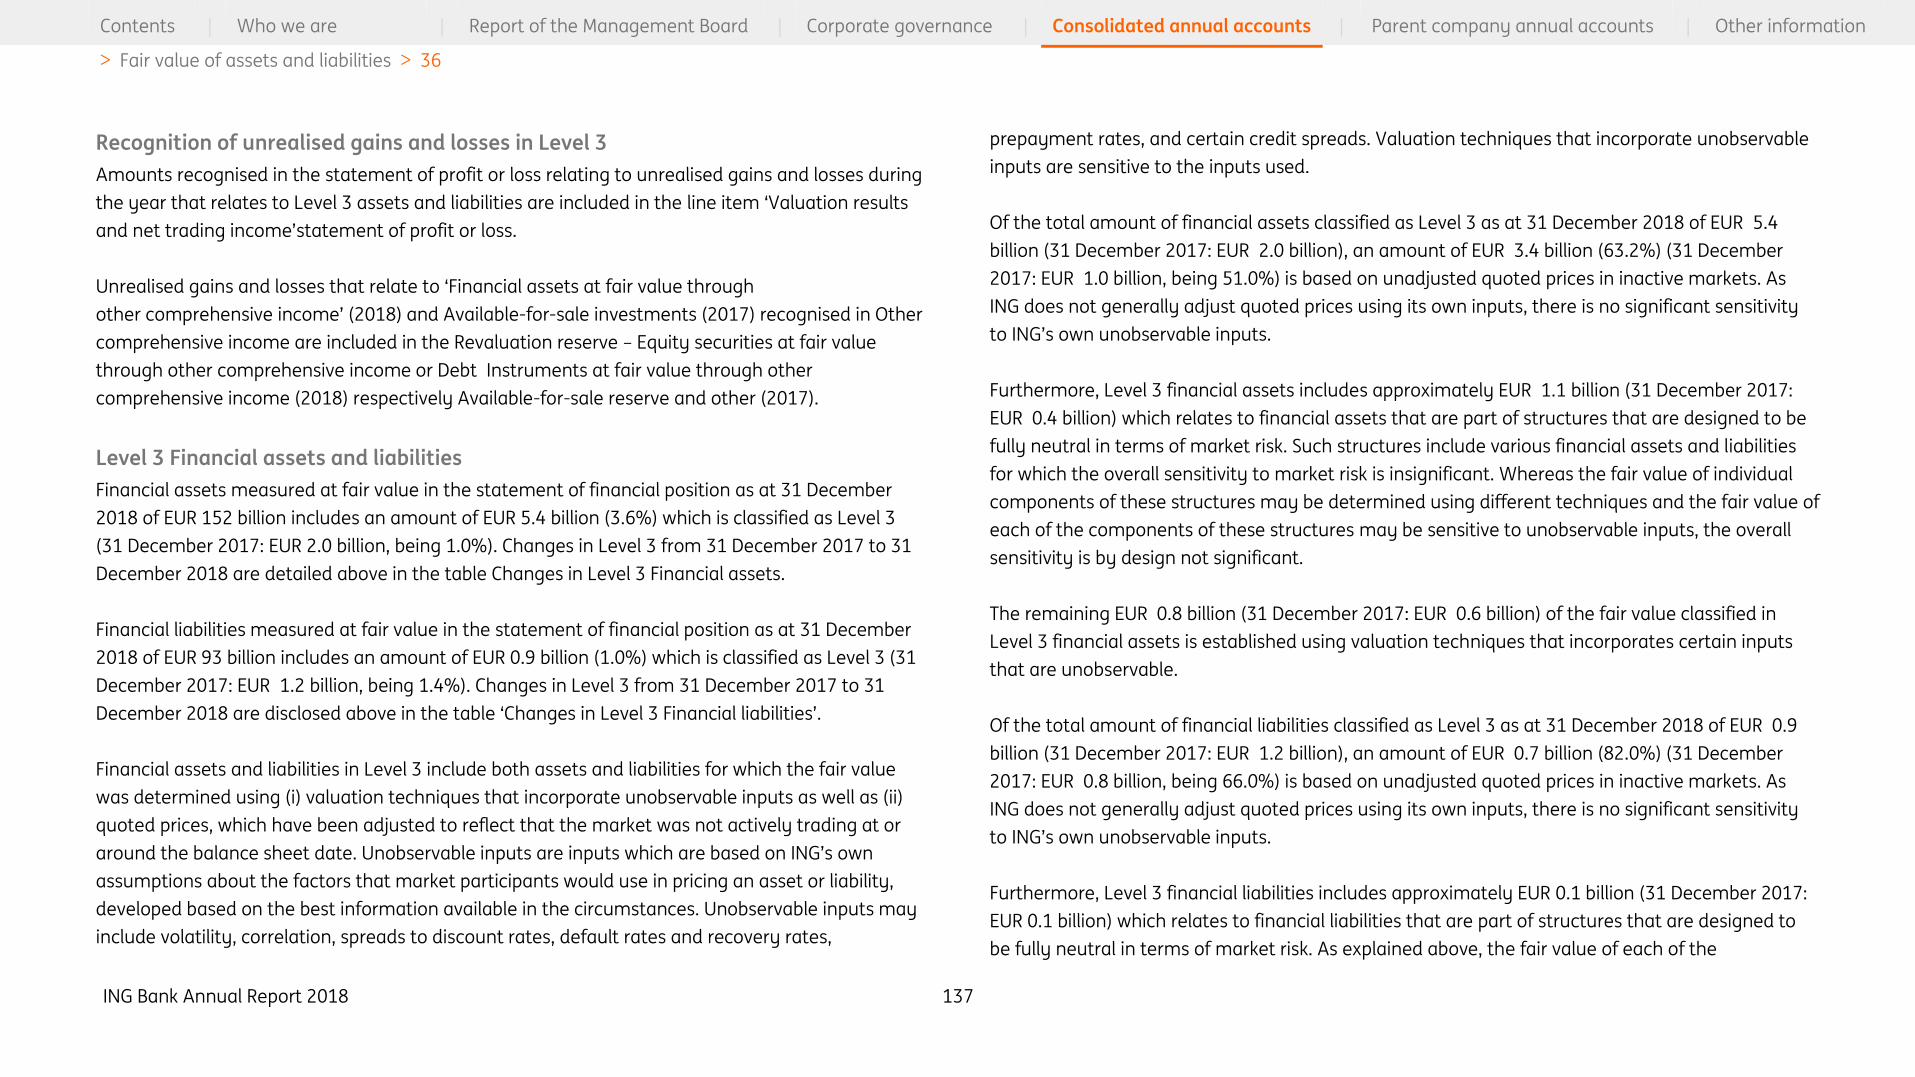
ING Bank Annual Report 2018 137
Contents | Who we are | Report of the Management Board | Corporate governance | Consolidated annual accounts | Parent company annual accounts | Other information
> Fair value of assets and liabilities > 36
Recognition of unrealised gains and losses in Level 3
Amounts recognised in the statement of profit or loss relating to unrealised gains and losses during
the year that relates to Level 3 assets and liabilities are included in the line item ‘Valuation results
and net trading income’statement of profit or loss.
Unrealised gains and losses that relate to ‘Financial assets at fair value through
other comprehensive income’ (2018) and Available-for-sale investments (2017) recognised in Other
comprehensive income are included in the Revaluation reserve – Equity securities at fair value
through other comprehensive income or Debt Instruments at fair value through other
comprehensive income (2018) respectively Available-for-sale reserve and other (2017).
Level 3 Financial assets and liabilities
Financial assets measured at fair value in the statement of financial position as at 31 December
2018 of EUR 152 billion includes an amount of EUR 5.4 billion (3.6%) which is classified as Level 3
(31 December 2017: EUR 2.0 billion, being 1.0%). Changes in Level 3 from 31 December 2017 to 31
December 2018 are detailed above in the table Changes in Level 3 Financial assets.
Financial liabilities measured at fair value in the statement of financial position as at 31 December
2018 of EUR 93 billion includes an amount of EUR 0.9 billion (1.0%) which is classified as Level 3 (31
December 2017: EUR 1.2 billion, being 1.4%). Changes in Level 3 from 31 December 2017 to 31
December 2018 are disclosed above in the table ‘Changes in Level 3 Financial liabilities’.
Financial assets and liabilities in Level 3 include both assets and liabilities for which the fair value
was determined using (i) valuation techniques that incorporate unobservable inputs as well as (ii)
quoted prices, which have been adjusted to reflect that the market was not actively trading at or
around the balance sheet date. Unobservable inputs are inputs which are based on ING’s own
assumptions about the factors that market participants would use in pricing an asset or liability,
developed based on the best information available in the circumstances. Unobservable inputs may
include volatility, correlation, spreads to discount rates, default rates and recovery rates,
prepayment rates, and certain credit spreads. Valuation techniques that incorporate unobservable
inputs are sensitive to the inputs used.
Of the total amount of financial assets classified as Level 3 as at 31 December 2018 of EUR 5.4
billion (31 December 2017: EUR 2.0 billion), an amount of EUR 3.4 billion (63.2%) (31 December
2017: EUR 1.0 billion, being 51.0%) is based on unadjusted quoted prices in inactive markets. As
ING does not generally adjust quoted prices using its own inputs, there is no significant sensitivity
to ING’s own unobservable inputs.
Furthermore, Level 3 financial assets includes approximately EUR 1.1 billion (31 December 2017:
EUR 0.4 billion) which relates to financial assets that are part of structures that are designed to be
fully neutral in terms of market risk. Such structures include various financial assets and liabilities
for which the overall sensitivity to market risk is insignificant. Whereas the fair value of individual
components of these structures may be determined using different techniques and the fair value of
each of the components of these structures may be sensitive to unobservable inputs, the overall
sensitivity is by design not significant.
The remaining EUR 0.8 billion (31 December 2017: EUR 0.6 billion) of the fair value classified in
Level 3 financial assets is established using valuation techniques that incorporates certain inputs
that are unobservable.
Of the total amount of financial liabilities classified as Level 3 as at 31 December 2018 of EUR 0.9
billion (31 December 2017: EUR 1.2 billion), an amount of EUR 0.7 billion (82.0%) (31 December
2017: EUR 0.8 billion, being 66.0%) is based on unadjusted quoted prices in inactive markets. As
ING does not generally adjust quoted prices using its own inputs, there is no significant sensitivity
to ING’s own unobservable inputs.
Furthermore, Level 3 financial liabilities includes approximately EUR 0.1 billion (31 December 2017:
EUR 0.1 billion) which relates to financial liabilities that are part of structures that are designed to
be fully neutral in terms of market risk. As explained above, the fair value of each of the

ING Bank Annual Report 2018 138
Contents | Who we are | Report of the Management Board | Corporate governance | Consolidated annual accounts | Parent company annual accounts | Other information
> Fair value of assets and liabilities > 36
components of these structures may be sensitive to unobservable inputs, but the overall sensitivity
is by design not significant.
The remaining EUR 0.1 billion (31 December 2017: EUR 0.3 billion) of the fair value classified in Level
3 financial liabilities is established using valuation techniques that incorporates certain inputs that
are unobservable.
The table below provides a summary of the valuation techniques, key unobservable inputs and the
lower and upper range of such unobservable inputs, by type of Level 3 asset/liability. The lower and
upper range mentioned in the overview represent the lowest and highest variance of the respective
valuation input as actually used in the valuation of the different financial instruments. Amounts
and percentages stated are unweighted. The range can vary from period to period subject to
market movements and change in Level 3 position. Lower and upper bounds reflect the variability
of Level 3 positions and their underlying valuation inputs in the portfolio, but do not adequately
reflect their level of valuation uncertainty. For valuation uncertainty assessment, reference is made
to section Sensitivity analysis of unobservable inputs (Level 3).

ING Bank Annual Report 2018 139
Contents | Who we are | Report of the Management Board | Corporate governance | Consolidated annual accounts | Parent company annual accounts | Other information
> Fair value of assets and liabilities > 36
Assets Liabilities Valuation techniques Significant unobservable inputs Lower range Upper range
2018 2017 2018 2017 2018 2017 2018 2017
At fair value through profit or loss
Debt securities 807 386 3 Price based Price (%) 0% 0% 105% 161%
Net asset value Price (%) 0% 0% 0% 0%
Present value techniques Credit spread (bps) 131 n/a 131 n/a
Loan pricing model Credit spread (bps) n/a n/a n/a n/a
Equity securities 162 4 1 Price based Price – 1 5,475 54
Loans and advances 1,047 20 15 Price based Price (%) 1% 0% 102% 101%
Present value techniques Price (%) 100% n/a 100% n/a
Credit spread (bps) 19 n/a 550 n/a
(Reverse) repo's 481 424 Present value techniques Price (%) 3% n/a 4% n/a
Structured notes 284 101 Price based Price (%) 77% 52% 108% 116%
Net asset value Price (%) n/a n/a n/a n/a
Option pricing model Equity volatility (%) 13% 14% 34% 23%
Equity/Equity correlation 0.6 0.5 0.9 0.7
Equity/FX correlation –0.7 0.2 0.5 0.4
Dividend yield (%) 1% 2% 5% 6%
Interest rate volatility (bps) 49 n/a 86 n/a
IR/IR correlation 0.8 n/a 0.8 n/a
Present value techniques Implied correlation 0.7 0.7 0.7 0.7
Derivatives
– Rates 57 490 39 485 Option pricing model Interest rate volatility (bps) 23 23 300 300
Interest rate correlation 0.8 n/a 0.8 n/a
IR/INF correlation n/a n/a n/a n/a
Present value techniques Reset spread (%) 2% 2% 2% 2%
Prepayment rate (%) n/a 5% n/a 10%
Inflation rate (%) n/a 4% n/a 4%
Credit spread (bps) 46 n/a 46 n/a
– FX 477 479 Present value techniques Inflation rate (%) n/a 4% n/a 4%
Valuation techniques and range of unobservable inputs (Level 3)

ING Bank Annual Report 2018 140
Contents | Who we are | Report of the Management Board | Corporate governance | Consolidated annual accounts | Parent company annual accounts | Other information
> Fair value of assets and liabilities > 36
Assets Liabilities Valuation techniques Significant unobservable inputs Lower range Upper range
2018 2017 2018 2017 2018 2017 2018 2017
– Credit 67 10 86 48 Present value techniques Credit spread (bps) 8 2 364 424
Implied correlation 0.7 0.7 0.7 1.0
Jump rate (%) 12% 12% 12% 12%
Price based Price (%) n/a n/a n/a n/a
– Equity 68 107 54 128 Option pricing model Equity volatility (%) 4% 5% 94% 129%
Equity/Equity correlation 0.2 0.1 0.9 1.0
Equity/FX correlation –0.8 –0.9 0.5 0.8
Dividend yield (%) 0% 0% 13% 21%
– Other 2 5 5 Option pricing model Commodity volatility (%) 12% 9% 79% 42%
Com/Com correlation 0.3 0.3 0.9 0.9
Com/FX correlation –0.5 –0.6 –0.5 –0.3
Available for sale
– Debt n/a 14 Price based Price (%) n/a 69% n/a 90%
Present value techniques Credit spread (bps) n/a n/a n/a n/a
Weighted average life (yr) n/a n/a n/a n/a
– Equity n/a 467 Discounted cash flow Annual accounts n/a n/a n/a n/a
Multiplier method Observable market factors n/a n/a n/a n/a
Comparable transactions n/a n/a n/a n/a
At fair value through other
comprehensive income
– Debt Price based Price (%) n/a n/a
– Loans and advances 2,379 Present value techniques Prepayment rate 6% 6%
– Equity 317 Present value techniques Credit spread (%) 322 322
Inflation rate (%) 3% 3%
Other 63 80
Total 5,387 1,980 910 1,242
Non-listed equity investments
Level 3 equity securities mainly include corporate investments, fund investments and other equity
securities which are not traded in active markets. In the absence of an active market, fair values are
estimated on the basis of the analysis of fund managers reports, company’s financial position,
future prospects, and other factors, considering valuations of similar positions or by the reference
to acquisition
cost of the position. For equity securities best market practice will be applied using the most
relevant valuation method.
All non-listed equity investments, including investments in private equity funds, are subject to a
standard review framework which ensures that valuations reflect fair values.
Valuation techniques and range of unobservable inputs (Level 3) – continued

ING Bank Annual Report 2018 141
Contents | Who we are | Report of the Management Board | Corporate governance | Consolidated annual accounts | Parent company annual accounts | Other information
> Fair value of assets and liabilities > 36
Price
For securities where market prices are not available fair value is measured by comparison with
observable pricing data from similar instruments. Prices of 0% are distressed to the point that no
recovery is expected, while prices significantly in excess of 100% or par are expected to pay a good
yield.
Credit spreads
Credit spread is the premium above a benchmark interest rate, typically LIBOR or relevant Treasury
instrument, required by the market participant to accept a lower credit quality. Higher credit
spreads indicate lower credit quality and a lower value of an asset.
Volatility
Volatility is a measure for variation of the price of a financial instrument or other valuation input
over time. Volatility is one of the key inputs in option pricing models. Typically, the higher the
volatility, the higher value of the option. Volatility varies by the underlying reference (equity,
commodity, foreign currency and interest rates), by strike, and maturity of the option. The
minimum level of volatility is 0% and there is no theoretical maximum.
Correlation
Correlation is a measure of dependence between two underlying references which is relevant for
valuing derivatives and other instruments which have more than one underlying reference. For
example, correlation between underlying equity names may be a relevant input parameter for
basket equity option pricing models. High positive correlation (close to 1) indicates strong positive
(statistical) relationship between underlyings, implying they typically move in the same direction.
High negative correlation, on the other hand, implies that underlyings typically move in opposite
directions.
Interest rates
Examples of interest rate related unobservable inputs are prepayment rates, reset rates and
inflation rates.
Prepayment rate and reset spread are key inputs to mortgage linked prepayment swaps valuation.
Prepayment rate is the estimated rate at which mortgage borrowers will repay their mortgages
early, e.g. 5% per year. Reset spread is the future spread at which mortgages will re-price at
interest rate reset dates.
Inflation rate is a key input to inflation linked instruments. Inflation linked instruments protect
against price inflation and are denominated and indexed to investment units. Interest payments
would be based on the inflation index and nominal rate in order to receive/pay the real rate of
return. A rise in nominal coupon payments is a result of an increase in inflation expectations, real
rates, or both. As markets for these inflation linked derivatives are illiquid, the valuation parameters
become unobservable.
Dividend yield
Dividend yield is an important input for equity option pricing models showing how much dividends
a company is expected to pay out each year relative to its share price. Dividend yields are generally
expressed as an annualised percentage of share price.
Sensitivity analysis of unobservable inputs (Level 3)
Where the fair value of a financial instrument is determined using inputs which are unobservable
and which have a more than insignificant impact on the fair value of the instrument, the actual
value of those inputs at the balance date may be drawn from a range of reasonably possible
alternatives. In line with market practice the upper and lower bounds of the range of alternative
input values reflect a 90% level of valuation certainty. The actual levels chosen for the
unobservable inputs in preparing the annual accounts are consistent with the valuation
methodology used for fair valued financial instruments.
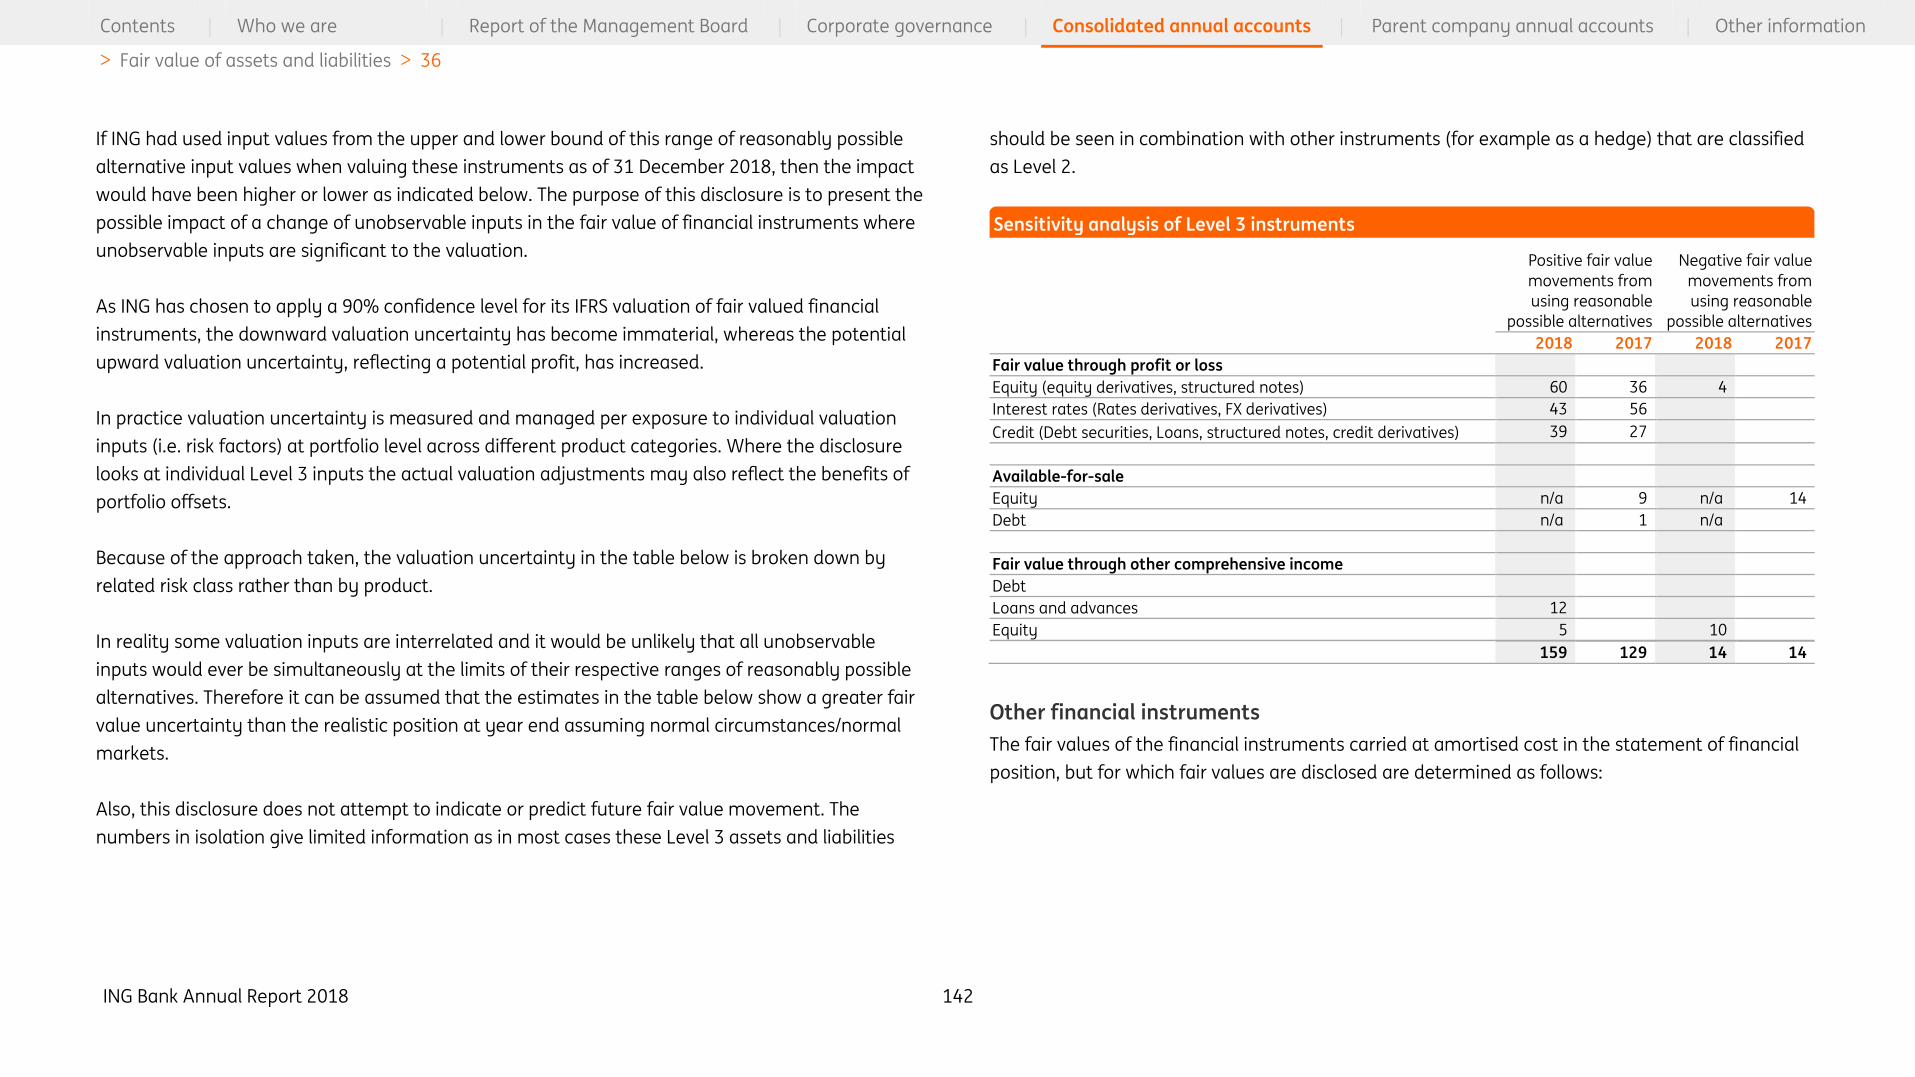
ING Bank Annual Report 2018 142
Contents | Who we are | Report of the Management Board | Corporate governance | Consolidated annual accounts | Parent company annual accounts | Other information
> Fair value of assets and liabilities > 36
If ING had used input values from the upper and lower bound of this range of reasonably possible
alternative input values when valuing these instruments as of 31 December 2018, then the impact
would have been higher or lower as indicated below. The purpose of this disclosure is to present the
possible impact of a change of unobservable inputs in the fair value of financial instruments where
unobservable inputs are significant to the valuation.
As ING has chosen to apply a 90% confidence level for its IFRS valuation of fair valued financial
instruments, the downward valuation uncertainty has become immaterial, whereas the potential
upward valuation uncertainty, reflecting a potential profit, has increased.
In practice valuation uncertainty is measured and managed per exposure to individual valuation
inputs (i.e. risk factors) at portfolio level across different product categories. Where the disclosure
looks at individual Level 3 inputs the actual valuation adjustments may also reflect the benefits of
portfolio offsets.
Because of the approach taken, the valuation uncertainty in the table below is broken down by
related risk class rather than by product.
In reality some valuation inputs are interrelated and it would be unlikely that all unobservable
inputs would ever be simultaneously at the limits of their respective ranges of reasonably possible
alternatives. Therefore it can be assumed that the estimates in the table below show a greater fair
value uncertainty than the realistic position at year end assuming normal circumstances/normal
markets.
Also, this disclosure does not attempt to indicate or predict future fair value movement. The
numbers in isolation give limited information as in most cases these Level 3 assets and liabilities
should be seen in combination with other instruments (for example as a hedge) that are classified
as Level 2.
Positive fair value
movements from
using reasonable
possible alternatives
Negative fair value
movements from
using reasonable
possible alternatives
2018 2017 2018 2017
Fair value through profit or loss
Equity (equity derivatives, structured notes) 60 36 4
Interest rates (Rates derivatives, FX derivatives) 43 56
Credit (Debt securities, Loans, structured notes, credit derivatives) 39 27
Available-for-sale
Equity n/a 9 n/a 14
Debt n/a 1 n/a
Fair value through other comprehensive income
Debt
Loans and advances 12
Equity 5 10
159 129 14 14
Other financial instruments
The fair values of the financial instruments carried at amortised cost in the statement of financial
position, but for which fair values are disclosed are determined as follows:
Sensitivity analysis of Level 3 instruments

ING Bank Annual Report 2018 143
Contents | Who we are | Report of the Management Board | Corporate governance | Consolidated annual accounts | Parent company annual accounts | Other information
> Fair value of assets and liabilities > 36
Level 1 Level 2 Level 3 Total
2018 2017 2018 2017 2018 2017 20182 2017
Financial Assets
Loans and advances to banks1 445 569 7,152 9,855 20,742 16,576 28,339 27,000
Held-to-maturity investments n/a 7,884 n/a 1,409 n/a 85 n/a 9,378
Loans and advances to customers1, 3 138 14,745 19,955 567,045 543,619 581,928 563,574
Securities at amortised cost 43,550 n/a 3,024 n/a 1,242 n/a 47,815 n/a
44,132 8,453 24,921 31,219 589,029 560,280 658,082 599,952
Financial liabilities
Deposits from banks 1 128 29 24,433 25,276 7,314 7,642 31,875 32,947
Customer deposits 1 6,695 8,875 50,922 41,209 22,172 27,349 79,789 77,433
Debt securities in issue 33,419 34,288 49,075 38,650 19,713 17,676 102,207 90,614
Subordinated loans 3,437 7,961 10,435 3,234 0 5,196 13,872 16,391
43,678 51,153 134,865 108,369 49,199 57,863 227,743 217,385
1 Financial assets and liabilities that are on demand are excluded from the fair value hierarchy as their fair value
approximates the carrying value.
2 The 2018 presentation was prospectively changed together with other IFRS9 changes and includes the reclassification of
accrued interest from other assets and other liabilities to the corresponding balance sheet item of the host contract.
3 In 2018, the fair value of the loans and advances to customers as at 31 December 2017 is adjusted by the amount of the
accrued interest (EUR 1,522 million). In 2017 the fair value of the accrued interest was reported, separate from loans and
advances to customers, under other assets.
b) Non-financial assets and liabilities
ING Bank’s non-financial assets comprise Investments in associates and joint ventures, Property in
own use, Investment property as included in the statement of financial position in the line items
Investments in associates and joint ventures, Property and equipment, and Other assets
respectively.
Investments in associates and joint ventures are accounted for using the equity method. For
further information, reference is made to Note 8 ’Investments in associates and joint ventures’.
Other non-financial assets (Property in own use, and Investment properties) are recognised at fair
value at the balance sheet date.
As at 31 December 2018, the estimated fair value of Property in own use and Investment property
amounts to EUR 780 million (2017: EUR 774 million) and EUR 54 million (2017: EUR 65 million)
respectively and is categorised as Level 3 of the fair value hierarchy on the basis of methods
applied in determining the fair values.
Amounts recognised in the statement of profit or loss relating to unrealised gains and losses during
the year that relate to Level 3 non-financial assets are included in the statement of profit or loss as
follows:
• Impairments on Property in own use are included in Other operating expenses - Impairments and
reversals on property and equipment and intangibles ; and
• Changes in the fair value of Investment property are included in Investment income.
Methods applied in determining fair values of financial assets and liabilities (carried at amortised cost)

ING Bank Annual Report 2018 144
Contents | Who we are | Report of the Management Board | Corporate governance | Consolidated annual accounts | Parent company annual accounts | Other information
> Derivatives and hedge accounting > 37
Unrealised gains and losses on Property in own use are included in the Revaluation reserve –
Property in own use reserve.
For amounts recognised in the Statement of profit or loss and other changes in non-financial assets
during the year, reference is made to Note 9 ‘Property and equipment’ and Note 11 ‘Other assets’.
As at 31 December 2018, ING Bank has no non-financial liabilities measured at fair value (2017:
none).
37 Derivatives and hedge accounting
Use of derivatives ING Bank uses derivatives for economic hedging purposes to manage its asset and liability
portfolios and structural risk positions as described in Note 50 ‘Risk management – Credit risk and
Market risk’. The primary objective of ING Bank’s hedging activities is to manage the risks which
arises from structural imbalances in the duration and other profiles of its assets and liabilities. The
objective of economic hedging is to enter into positions with an opposite risk profile to an identified
risk exposure to reduce that exposure. The main risks which are being hedged are interest rate risk
and foreign currency exchange rate risk. These risks are primarily hedged with interest rate swaps,
cross currency swaps and foreign exchange forwards/swaps.
ING Bank uses credit derivatives to manage its economic exposure to credit risk, including total
return swaps and credit default swaps, to sell or buy protection for credit risk exposures in the loan,
investment, and trading portfolios. Hedge accounting is not applied in relation to these credit
derivatives.
Hedge accounting
Derivatives that qualify for hedge accounting under IFRS are classified and accounted for in
accordance with the nature of the instrument hedged and the type of IFRS hedge model that is
applicable. The three models applicable under IFRS are: fair value hedge accounting, cash flow
hedge accounting, and hedge accounting of a net investment in a foreign operation. How and to
what extent these models are applied are described under the relevant headings below. The
company’s detailed accounting policies for these three hedge models are set out in Note 1
‘Accounting policies’ in the section ‘IFRS 9 ‘Financial instruments’ – ‘Accounting policies applied from
1 January 2018’.
Fair value hedge accounting
ING Bank’s fair value hedges principally consist of interest rate swaps that are used to protect
against changes in the fair value of fixed-rate instruments due to movements in market interest
rates. ING Bank’s approach to manage market risk, including interest rate risk, is discussed in Note
50 ‘Risk management – Market risk’. ING Bank’s exposure to interest rate risk is disclosed in
paragraph ‘Interest rate risk in banking book’.
By using derivative financial instruments to hedge exposures to changes in interest rates, ING Bank
also exposes itself to credit risk of the derivative counterparty, which is not offset by the hedged
item. ING Bank minimises counterparty credit risk in derivative instruments by clearing most of the
derivatives through Central Clearing Counterparties. In addition ING Bank only enters into
transactions with high-quality counterparties and requires posting collateral.
ING Bank applies fair value hedge accounting on micro level in which one hedged item is hedged
with one or multiple hedging instruments as well as on macro level whereby a portfolio of items is
hedged with multiple hedging instruments. For these macro hedges of interest rate risk ING applies
the EU carve-out. The EU ‘carve-out’ for macro hedging enables a group of derivatives (or
proportions) to be viewed in combination and jointly designated as the hedging instrument and
removes some of the limitations in fair value hedge accounting relating to hedging core deposits
and under-hedging strategies. In retail operations, exposure on retail funding (savings and current
accounts) and retail lending (mortgages) is initially offset. The remaining exposure is hedged in a
portfolio hedge, using the EU carve-out, in which a portion of the retail lending portfolio and core
deposits are designated as a hedged item for hedge accounting purposes.
For portfolio hedges the fair value is projected based on contractual terms and other variables

ING Bank Annual Report 2018 145
Contents | Who we are | Report of the Management Board | Corporate governance | Consolidated annual accounts | Parent company annual accounts | Other information
> Derivatives and hedge accounting > 37
including prepayment expectations. These projected fair value of the portfolios form the basis for
identifying the notional amount subject to interest rate risk that is designated under fair value
hedge accounting.
Micro fair value hedge accounting is mainly applied on issued debt securities and purchased debt
instruments for hedging interest rate risk.
Before fair value hedge accounting is applied by ING Bank, ING Bank determines whether an
economic relationship between the hedged item and the hedging instrument exists based on an
evaluation of the quantitative characteristics of these items and the hedged risk that is supported
by quantitative analysis. ING Group considers whether the critical terms of the hedged item and
hedging instrument closely align when assessing the presence of an economic relationship. ING
Bank evaluates whether the fair value of the hedged item and the hedging instrument respond
similarly to similar risks. In addition ING is mainly using regression analysis to assess whether the
hedging instrument is expected to be and has been highly effective in offsetting changes in the fair
value of the hedged item.
For the macro hedge on the mortgage portfolio ING Bank follows a dynamic hedging strategy. This
means that on the monthly basis, based on the new portfolio projection, the hedging relationship is
renewed. From an operational point of view, the existing hedging relationship is adjusted based on
the new portfolio projection and additional hedging instruments are added to hedging relationship.
ING Bank uses the following derivative financial instruments in a fair value hedge accounting
relationship:
Assets Liabilities
As at 31 December 2018
Hedging instrument on interest rate risk
– Interest rate swaps 8,584 11,279
– Other interest derivatives 78 63
The derivatives used for fair value hedge accounting are included in the statement of financial
position line-item ‘Financial assets at fair value through profit or loss – Non-trading derivatives’ for
EUR 638 million (2017: EUR 671 million) respectively ‘Financial liabilities at fair value through profit
or loss – Non-trading derivatives’ EUR 1,029 million (2017: EUR 1,084 million). The remaining
derivatives are offset with other derivatives and collaterals paid or received.
For our main currencies the average fixed rate for interest rate swaps used in fair value hedge
accounting are 1.14% for EUR and 3.38% for USD.
Gross carring value of derivatives designated under fair value hedge accounting

ING Bank Annual Report 2018 146
Contents | Who we are | Report of the Management Board | Corporate governance | Consolidated annual accounts | Parent company annual accounts | Other information
> Derivatives and hedge accounting > 37
The following table shows the net notional amount of derivatives designated in fair value hedging
split into the maturity of the instruments. The net notional amounts presented in the table are a
combination of payer (-) and receiver (+) swaps.
As at 31 December 2018 Less than 1 month 1 to 3 months 3 to 12 months 1 to 2 year 2 to 3 years 3 to 4 years 4 to 5 years >5 years Total
Hedging instrument on interest rate risk
– Interest rate swaps 560 –14 –7,819 7,277 514 5,097 11,082 –11,067 5,630
– Other interest derivatives –11 –53 –101 –55 –228 –325 –325 504 –593
Gains and losses on derivatives designated under fair value hedge accounting are recognised in the
statement of profit or loss. The effective portion of the fair value change on the hedged item is also
recognised in the statement of profit or loss. As a result, only the net accounting ineffectiveness
has an impact on the net result.
Maturity derivatives designated in fair value hedging
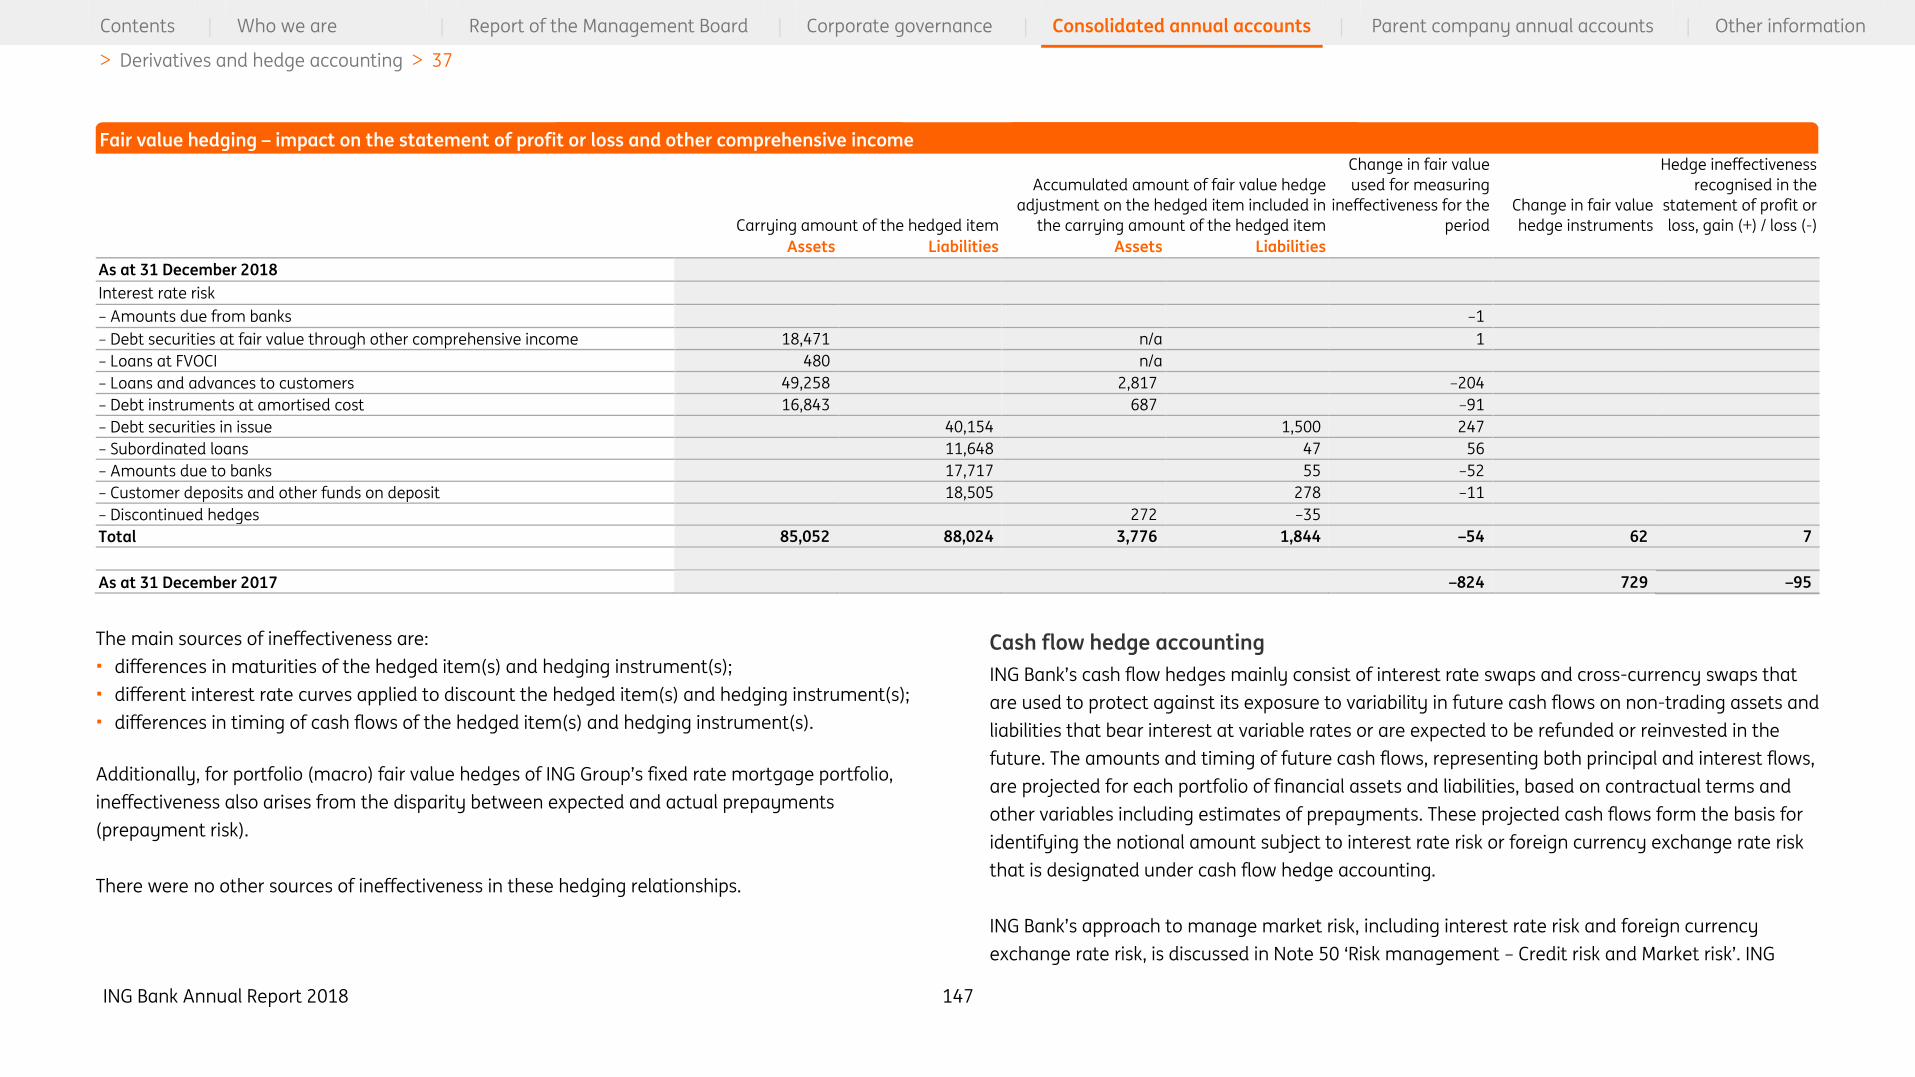
ING Bank Annual Report 2018 147
Contents | Who we are | Report of the Management Board | Corporate governance | Consolidated annual accounts | Parent company annual accounts | Other information
> Derivatives and hedge accounting > 37
Carrying amount of the hedged item
Accumulated amount of fair value hedge
adjustment on the hedged item included in
the carrying amount of the hedged item
Change in fair value
used for measuring
ineffectiveness for the
period
Change in fair value
hedge instruments
Hedge ineffectiveness
recognised in the
statement of profit or
loss, gain (+) / loss (-)
Assets Liabilities Assets Liabilities
As at 31 December 2018
Interest rate risk
– Amounts due from banks –1
– Debt securities at fair value through other comprehensive income 18,471 n/a 1
– Loans at FVOCI 480 n/a
– Loans and advances to customers 49,258 2,817 –204
– Debt instruments at amortised cost 16,843 687 –91
– Debt securities in issue 40,154 1,500 247
– Subordinated loans 11,648 47 56
– Amounts due to banks 17,717 55 –52
– Customer deposits and other funds on deposit 18,505 278 –11
– Discontinued hedges 272 –35
Total 85,052 88,024 3,776 1,844 –54 62 7
As at 31 December 2017 –824 729 –95
The main sources of ineffectiveness are:
• differences in maturities of the hedged item(s) and hedging instrument(s);
• different interest rate curves applied to discount the hedged item(s) and hedging instrument(s);
• differences in timing of cash flows of the hedged item(s) and hedging instrument(s).
Additionally, for portfolio (macro) fair value hedges of ING Group’s fixed rate mortgage portfolio,
ineffectiveness also arises from the disparity between expected and actual prepayments
(prepayment risk).
There were no other sources of ineffectiveness in these hedging relationships.
Cash flow hedge accounting
ING Bank’s cash flow hedges mainly consist of interest rate swaps and cross-currency swaps that
are used to protect against its exposure to variability in future cash flows on non-trading assets and
liabilities that bear interest at variable rates or are expected to be refunded or reinvested in the
future. The amounts and timing of future cash flows, representing both principal and interest flows,
are projected for each portfolio of financial assets and liabilities, based on contractual terms and
other variables including estimates of prepayments. These projected cash flows form the basis for
identifying the notional amount subject to interest rate risk or foreign currency exchange rate risk
that is designated under cash flow hedge accounting.
ING Bank’s approach to manage market risk, including interest rate risk and foreign currency
exchange rate risk, is discussed in Note 50 ‘Risk management – Credit risk and Market risk’. ING
Fair value hedging – impact on the statement of profit or loss and other comprehensive income

ING Bank Annual Report 2018 148
Contents | Who we are | Report of the Management Board | Corporate governance | Consolidated annual accounts | Parent company annual accounts | Other information
> Derivatives and hedge accounting > 37
Bank determines the amount of the exposures to which it applies hedge accounting by assessing
the potential impact of changes in interest rates and foreign currency exchange rates on the future
cash flows from its floating-rate assets and liabilities. This assessment is performed using analytical
techniques.
As noted above for fair value hedges, by using derivative financial instruments to hedge exposures
to changes in interest rates and foreign currency exchange rates, ING Group exposes itself to credit
risk of the derivative counterparty, which is not offset by the hedged items. This exposure is
managed similarly to that for fair value hedges.
Gains and losses on the effective portions of derivatives designated under cash flow hedge
accounting are recognised in Other Comprehensive Income. Interest cash flows on these derivatives
are recognised in the statement of profit or loss in ‘Net interest income’ consistent with the manner
in which the forecasted cash flows affect net result. The gains and losses on ineffective portions of
such derivatives are recognised immediately in the statement of profit or loss in ‘Valuation results
and net trading income’.
ING Bank determines an economic relationship between the cash flows of the hedged item and the
hedging instrument based on an evaluation of the quantitative characteristics of these items and
the hedged risk that is supported by quantitative analysis. ING Bank considers whether the critical
terms of the hedged item and hedging instrument closely align when assessing the presence of an
economic relationship. ING Bank evaluates whether the cash flows of the hedged item and the
hedging instrument respond similarly to the hedged risk, such as the benchmark interest rate of
foreign currency. In addition (for macro FX hedging relationships) a regression analysis is performed
to assess whether the hedging instrument is expected to be and has been highly effective in
offsetting changes in the fair value of the hedged item.
ING Bank uses the following derivative financial instruments in a cash flow hedge accounting
relationship:
Assets Liabilities
As at 31 December 2018
Hedging instrument on interest rate risk
– Interest rate swaps 5,757 3,664
Hedging instrument on combined interest and FX rate risk
– Cross currency interest rate derivatives 204 154
The derivatives used for cash flow hedge accounting are included in the statement of financial
position line-item ‘Financial assets at fair value through profit or loss – Non-trading derivatives’ EUR
1,012 million (2017: EUR 617 million) respectively ‘Financial liabilities at fair value through profit or
loss – Non-trading derivatives’ EUR 458 million (2017: EUR 339 million). The remaining derivatives
are offset with other derivatives and collaterals paid or received.
For the main currencies the average fixed rate for interest rate swaps used in cash flow hedge
accounting are 1.21% for EUR, 2.53% for PLN and 2.49% for USD. The average rates for cross
currency swaps used in cash flow hedge accounting is EUR 1.14 for EUR/USD.
Gross carrying value of derivatives used for cash flow hedge accounting

ING Bank Annual Report 2018 149
Contents | Who we are | Report of the Management Board | Corporate governance | Consolidated annual accounts | Parent company annual accounts | Other information
> Derivatives and hedge accounting > 37
The following table shows the net notional amount of derivatives designated in cash flow hedging
split into the maturity of the instruments. The net notional amounts presented in the table are a
combination of payer (+) and receiver (-) swaps.
As at 31 December 2018 Less than 1 month 1 to 3 months 3 to 12 months 1 to 2 year 2 to 3 years 3 to 4 years 4 to 5 years >5 years Total
Hedging instrument on interest rate risk
– Interest rate swaps –107 –2,546 –7,107 –5,591 –9,883 –7,928 –8,980 –29,629 –71,771
Hedging instrument on combined interest and FX rate risk
– Cross currency interest rate derivatives 5 48 –601 –4,461 –5,622 –2,647 –793 –239 –14,311
Maturity derivatives designated in cash flow hedging
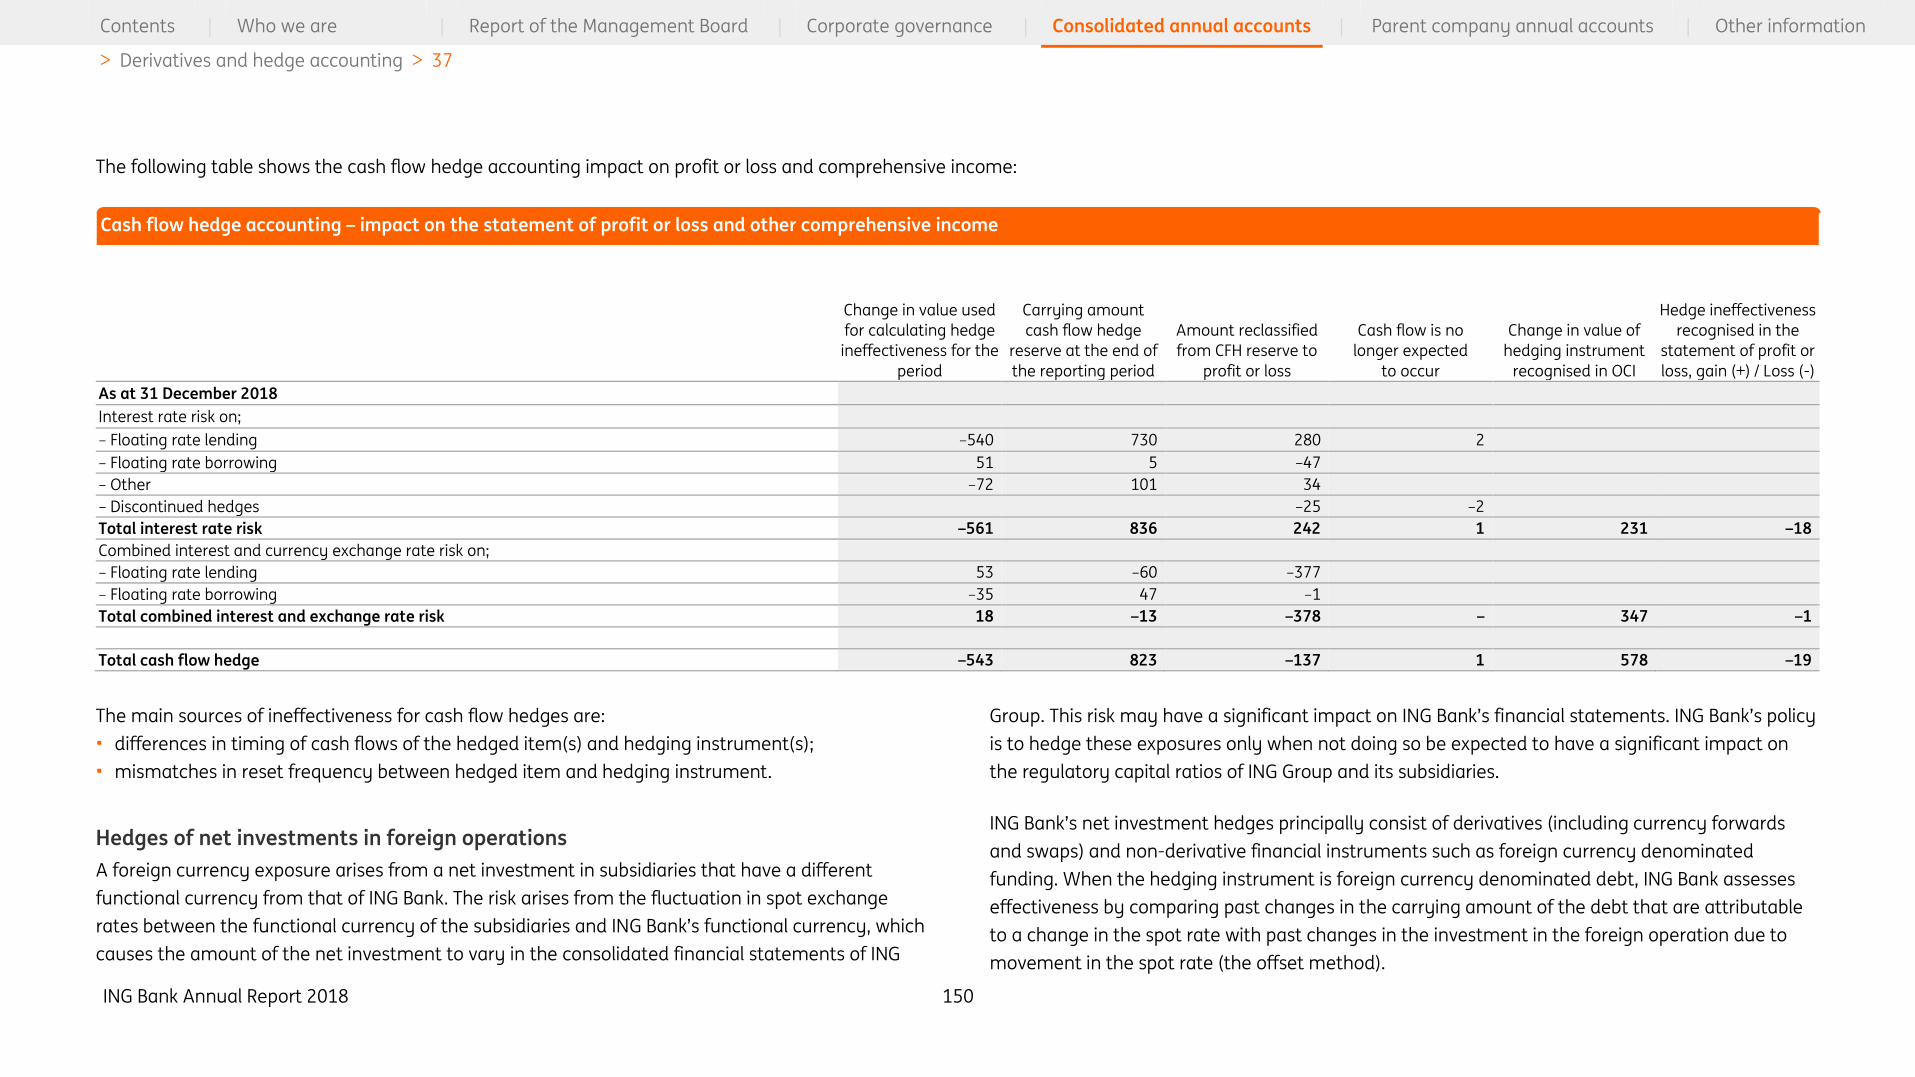
ING Bank Annual Report 2018 150
Contents | Who we are | Report of the Management Board | Corporate governance | Consolidated annual accounts | Parent company annual accounts | Other information
> Derivatives and hedge accounting > 37
The following table shows the cash flow hedge accounting impact on profit or loss and comprehensive income:
Change in value used
for calculating hedge
ineffectiveness for the
period
Carrying amount
cash flow hedge
reserve at the end of
the reporting period
Amount reclassified
from CFH reserve to
profit or loss
Cash flow is no
longer expected
to occur
Change in value of
hedging instrument
recognised in OCI
Hedge ineffectiveness
recognised in the
statement of profit or
loss, gain (+) / Loss (-)
As at 31 December 2018
Interest rate risk on;
– Floating rate lending –540 730 280 2
– Floating rate borrowing 51 5 –47
– Other –72 101 34
– Discontinued hedges –25 –2
Total interest rate risk –561 836 242 1 231 –18
Combined interest and currency exchange rate risk on;
– Floating rate lending 53 –60 –377
– Floating rate borrowing –35 47 –1
Total combined interest and exchange rate risk 18 –13 –378 – 347 –1
Total cash flow hedge –543 823 –137 1 578 –19
The main sources of ineffectiveness for cash flow hedges are:
• differences in timing of cash flows of the hedged item(s) and hedging instrument(s);
• mismatches in reset frequency between hedged item and hedging instrument.
Hedges of net investments in foreign operations
A foreign currency exposure arises from a net investment in subsidiaries that have a different
functional currency from that of ING Bank. The risk arises from the fluctuation in spot exchange
rates between the functional currency of the subsidiaries and ING Bank’s functional currency, which
causes the amount of the net investment to vary in the consolidated financial statements of ING
Group. This risk may have a significant impact on ING Bank’s financial statements. ING Bank’s policy
is to hedge these exposures only when not doing so be expected to have a significant impact on
the regulatory capital ratios of ING Group and its subsidiaries.
ING Bank’s net investment hedges principally consist of derivatives (including currency forwards
and swaps) and non-derivative financial instruments such as foreign currency denominated
funding. When the hedging instrument is foreign currency denominated debt, ING Bank assesses
effectiveness by comparing past changes in the carrying amount of the debt that are attributable
to a change in the spot rate with past changes in the investment in the foreign operation due to
movement in the spot rate (the offset method).
Cash flow hedge accounting – impact on the statement of profit or loss and other comprehensive income
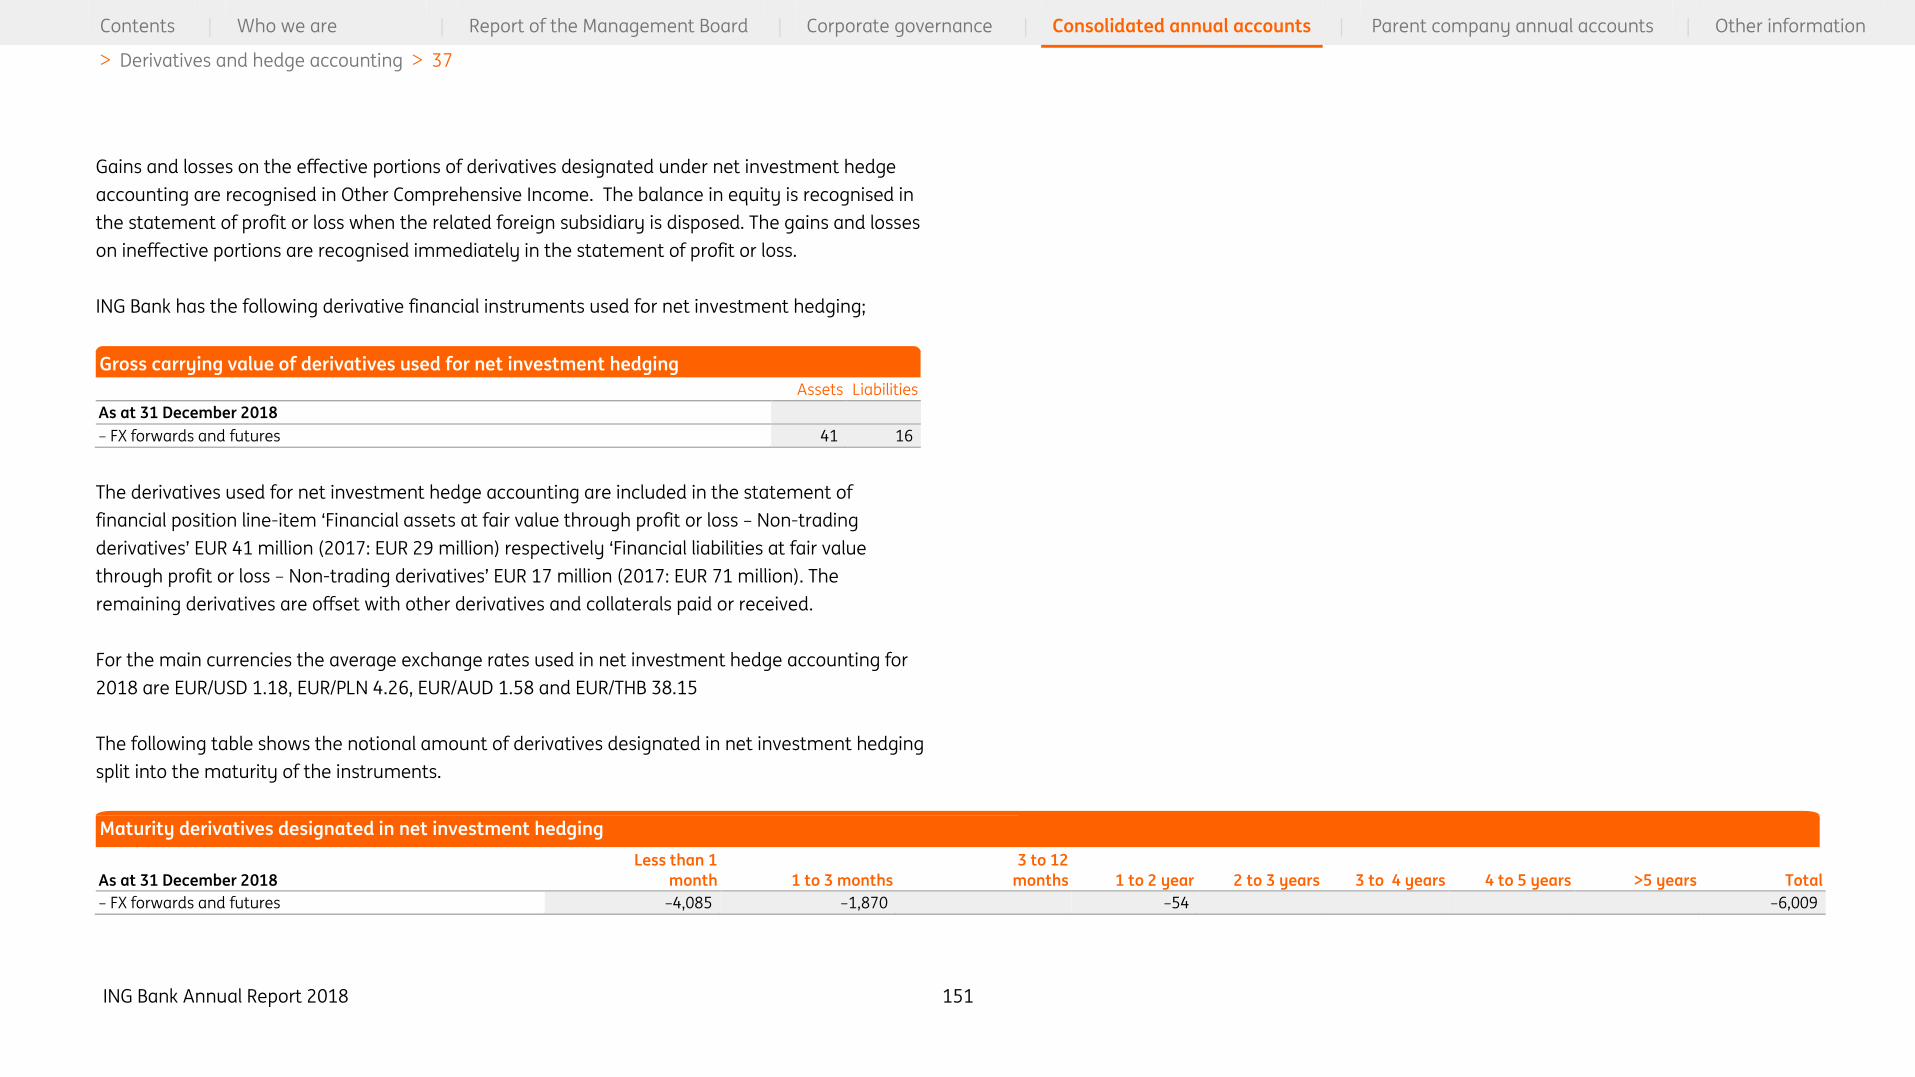
ING Bank Annual Report 2018 151
Contents | Who we are | Report of the Management Board | Corporate governance | Consolidated annual accounts | Parent company annual accounts | Other information
> Derivatives and hedge accounting > 37
Gains and losses on the effective portions of derivatives designated under net investment hedge
accounting are recognised in Other Comprehensive Income. The balance in equity is recognised in
the statement of profit or loss when the related foreign subsidiary is disposed. The gains and losses
on ineffective portions are recognised immediately in the statement of profit or loss.
ING Bank has the following derivative financial instruments used for net investment hedging;
Assets Liabilities
As at 31 December 2018
– FX forwards and futures 41 16
The derivatives used for net investment hedge accounting are included in the statement of
financial position line-item ‘Financial assets at fair value through profit or loss – Non-trading
derivatives’ EUR 41 million (2017: EUR 29 million) respectively ‘Financial liabilities at fair value
through profit or loss – Non-trading derivatives’ EUR 17 million (2017: EUR 71 million). The
remaining derivatives are offset with other derivatives and collaterals paid or received.
For the main currencies the average exchange rates used in net investment hedge accounting for
2018 are EUR/USD 1.18, EUR/PLN 4.26, EUR/AUD 1.58 and EUR/THB 38.15
The following table shows the notional amount of derivatives designated in net investment hedging
split into the maturity of the instruments.
As at 31 December 2018
Less than 1
month 1 to 3 months
3 to 12
months 1 to 2 year 2 to 3 years 3 to 4 years 4 to 5 years >5 years Total
– FX forwards and futures –4,085 –1,870 –54 –6,009
Gross carrying value of derivatives used for net investment hedging
Maturity derivatives designated in net investment hedging
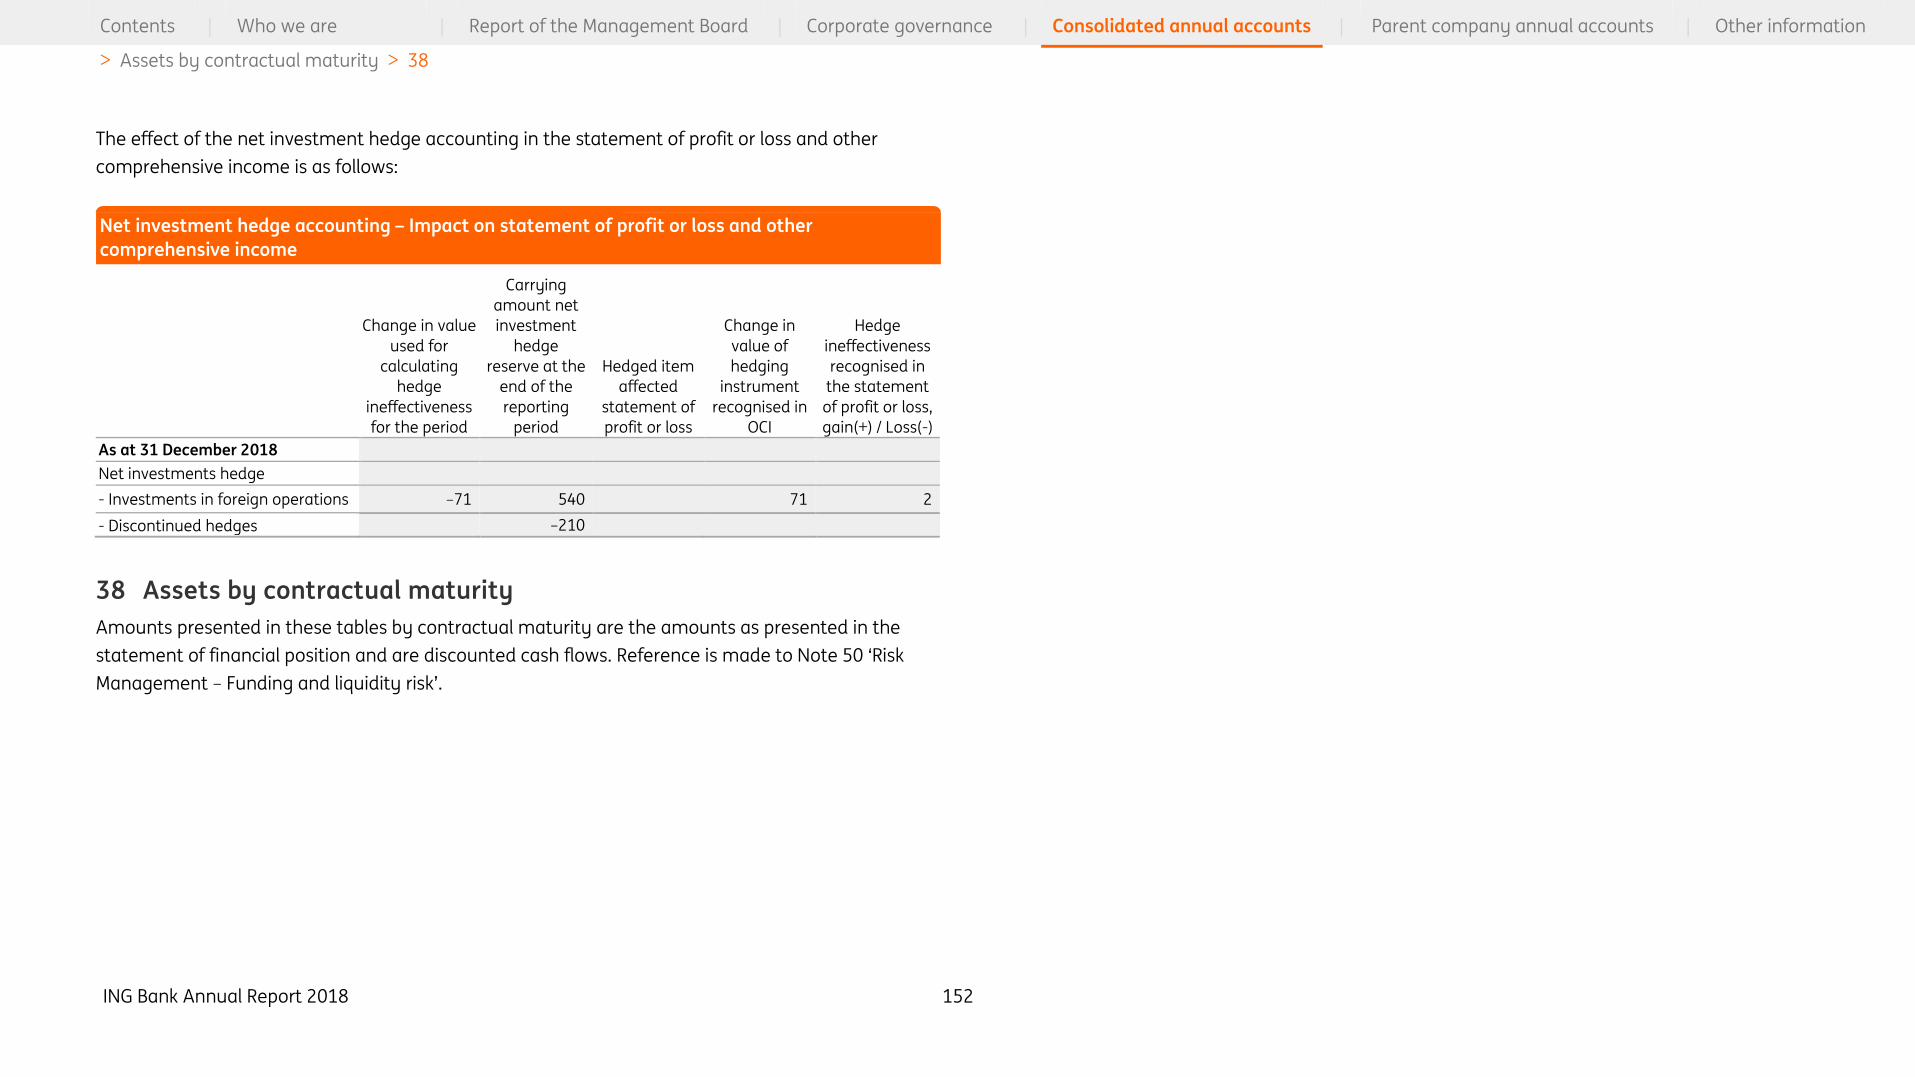
ING Bank Annual Report 2018 152
Contents | Who we are | Report of the Management Board | Corporate governance | Consolidated annual accounts | Parent company annual accounts | Other information
> Assets by contractual maturity > 38
The effect of the net investment hedge accounting in the statement of profit or loss and other
comprehensive income is as follows:
Change in value
used for
calculating
hedge
ineffectiveness
for the period
Carrying
amount net
investment
hedge
reserve at the
end of the
reporting
period
Hedged item
affected
statement of
profit or loss
Change in
value of
hedging
instrument
recognised in
OCI
Hedge
ineffectiveness
recognised in
the statement
of profit or loss,
gain(+) / Loss(-)
As at 31 December 2018
Net investments hedge
- Investments in foreign operations –71 540 71 2
- Discontinued hedges –210
38 Assets by contractual maturity
Amounts presented in these tables by contractual maturity are the amounts as presented in the
statement of financial position and are discounted cash flows. Reference is made to Note 50 ‘Risk
Management – Funding and liquidity risk’.
Net investment hedge accounting – Impact on statement of profit or loss and other
comprehensive income

ING Bank Annual Report 2018 153
Contents | Who we are | Report of the Management Board | Corporate governance | Consolidated annual accounts | Parent company annual accounts | Other information
> Assets by contractual maturity > 38
2018 Less than 1 month 1 1-3 months 3-12 months 1-5 years Over 5 years Maturity not applicable Total
Cash and balances with central banks 49,987 49,987
Loans and advances to banks 15,862 3,693 4,830 5,599 437 30,420
Financial assets at fair value through profit or loss
– Trading assets 15,815 6,032 8,123 9,276 10,917 50,163
– Non-trading derivatives 275 323 173 1,059 841 2,672
– Mandatorily at fair value through profit or loss 48,240 9,047 5,325 1,238 723 210 64,783
– Designated as at fair value through profit or loss 265 208 784 635 994 2,887
Financial assets at fair value through other comprehensive income
– Equity securities 3,228 3,228
– Debt securities 272 234 1,597 13,409 10,103 25,616
– Loans and advances 42 97 254 1,023 962 2,379
Securities at amortised cost 1,126 2,537 2,737 22,169 18,708 47,276
Loans and advances to customers 55,778 17,689 39,443 177,387 302,031 592,328
Intangible assets 120 481 1,238 1,839
Other assets 2 6,895 165 2,429 598 429 214 10,730
Remaining assets (for which maturities are not applicable) 3 2,703 2,703
Total assets 194,560 40,024 65,815 232,874 346,146 7,593 887,012
20174
Cash and balances with central banks 21,989 21,989
Loans and advances to banks 13,928 5,137 5,224 3,931 526 28,746
Financial assets at fair value through profit or loss
– Trading assets 63,858 14,016 12,667 12,619 13,603 116,763
– Non-trading derivatives 124 147 213 789 912 2,185
– Designated as at fair value through profit or loss 488 967 1,839 351 597 4,242
Investments
– Available-for-sale 1,319 2,313 4,301 31,852 25,962 3,983 69,730
– Held-to-maturity 1,020 127 657 2,975 4,564 9,343
Loans and advances to customers 63,122 18,414 40,350 163,444 289,569 574,899
Intangible assets 92 367 1,010 1,469
Other assets 2 8,496 1,520 2,475 869 535 309 14,204
Remaining assets (for which maturities are not applicable) 3 2,748 2,748
Total assets 174,344 42,641 67,818 217,197 336,268 8,050 846,318
1 Includes assets on demand.
2 Includes Other assets, Assets held for sale, and Current and Deferred tax assets as presented in the Consolidated statement of financial position.
3 Included in remaining assets for which maturities are not applicable are property and equipment, and investments in associates and joint ventures. Due to their nature remaining assets consist mainly of assets expected to be recovered after more than 12
months.
4 The amounts for the period ended 31 December 2017 have been prepared in accordance with IAS 39, the adoption of IFRS 9 led to new presentation requirements for 2018; prior period amounts have not been restated Reference is made to Note 1 ‘Accounting
policies’ for information on Changes in accounting principles, estimates and presentation of the consolidated annual accounts and related notes.
Assets by contractual maturity
ING Bank Annual Report 2018 154
Contents | Who we are | Report of the Management Board | Corporate governance | Consolidated annual accounts | Parent company annual accounts | Other information
> Liabilities by maturity > 39
39 Liabilities by maturity
The tables below include all financial liabilities by maturity based on contractual, undiscounted
cash flows. Furthermore, the undiscounted future coupon interest on financial liabilities payable is
included in a separate line and in the relevant maturity bucket. Derivative liabilities are included on
a net basis if cash flows are settled net. For other derivative liabilities the contractual gross cash
flow payable is included.
Non-financial liabilities are included based on a breakdown of the amounts per the statement of
financial position, by expected maturity. Reference is made to the liquidity risk paragraph in Note
50 ‘Risk Management – Funding and liquidity risk’ for a description on how liquidity risk is managed.

ING Bank Annual Report 2018 155
Contents | Who we are | Report of the Management Board | Corporate governance | Consolidated annual accounts | Parent company annual accounts | Other information
> Liabilities by maturity > 39
2018 Less than 1 month 1 1–3 months 3–12 months 1–5 years Over 5 years Maturity not applicable Adjustment 2 Total
Deposits from banks 10,506 1,068 1,940 21,571 2,242 2 37,330 Customer deposits 516,367 18,273 16,623 15,973 13,059 580,294 Financial liabilities at fair value through profit or loss – Other trading liabilities 4,075 1,318 1,465 888 1,655 286 9,687 – Trading derivatives 1,711 1,873 3,680 6,855 6,035 1,374 21,528 – Non-trading derivatives 457 315 252 988 883 –583 2,313 – Designated at fair value through profit or loss 34,927 11,753 4,115 3,506 4,921 –43 59,179 Debt securities in issue 4,066 20,961 30,282 32,659 12,200 1,991 102,159 Subordinated loans 1,700 6,518 5,270 154 13,643
Financial liabilities 572,110 55,561 58,357 84,140 47,513 5,270 3,181 826,133 Other liabilities3 10,556 898 2,422 1,198 831 15,904
Non-financial liabilities 10,556 898 2,422 1,198 831 – – 15,904 Total liabilities 582,665 56,459 60,778 85,338 48,345 5,270 3,181 842,036 Coupon interest due on financial liabilities 1,006 905 2,406 8,283 5,280 282 18,162
2017
Deposits from banks 10,002 648 1,687 21,893 2,591 36,821 Customer deposits 494,841 18,510 23,773 10,855 4,711 552,690 Financial liabilities at fair value through profit or loss – Other trading liabilities 29,755 11,530 1,866 1,506 2,390 636 47,683 – Trading derivatives 2,476 2,420 4,520 8,224 5,947 2,326 25,913
– Non-trading derivatives 339 122 232 746 983 –76 2,346 – Designated at fair value through profit or loss 413 838 1,353 3,688 5,072 –149 11,215 Debt securities in issue 3,296 14,657 26,434 34,215 9,867 1,762 90,231 Subordinated loans 10,601 5,077 153 15,831
Financial liabilities 541,122 48,725 59,865 81,127 42,162 5,077 4,652 782,730 Other liabilities3 9,743 1,864 4,152 2,182 1,270 19,211
Non-financial liabilities 9,743 1,864 4,152 2,182 1,270 – – 19,211 Total liabilities 550,865 50,589 64,017 83,309 43,432 5,077 4,652 801,941 Coupon interest due on financial liabilities4 1,109 1,033 2,829 9,521 8,764 23,256
1 Includes liabilities on demand.
2 This column reconciles the contractual undiscounted cash flows on financial liabilities to the statement of financial position values. The adjustments mainly relate to the impact of discounting, and for derivatives, to the fact that the contractual cash flows are
presented on a gross basis (unless the cash flows are actually settled net).
3 Includes Other Liabilities, Current and Deferred Tax Liabilities, and Provisions as presented in the Consolidated Statement of Financial Position.
4 Coupon interest excludes coupon interest on perpetual instruments.
Liabilities by maturity
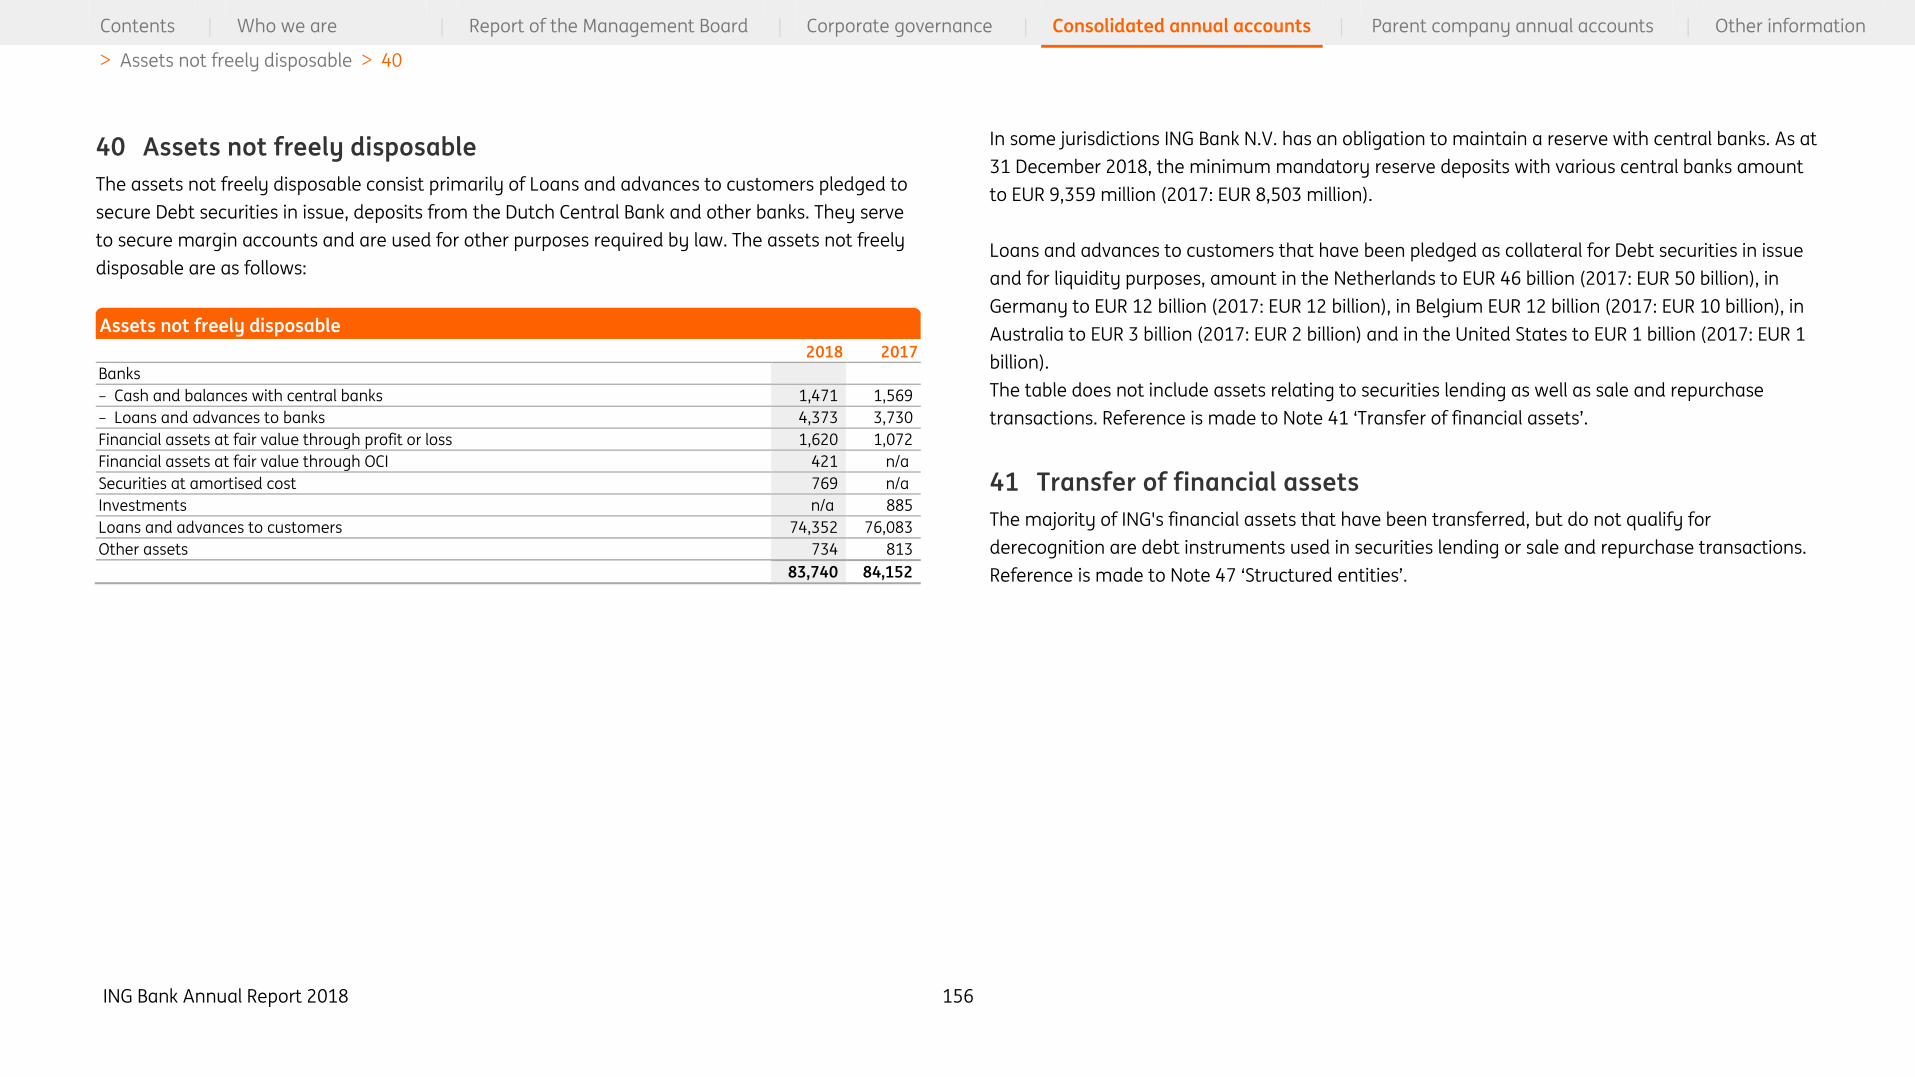
ING Bank Annual Report 2018 156
Contents | Who we are | Report of the Management Board | Corporate governance | Consolidated annual accounts | Parent company annual accounts | Other information
> Assets not freely disposable > 40
40 Assets not freely disposable
The assets not freely disposable consist primarily of Loans and advances to customers pledged to
secure Debt securities in issue, deposits from the Dutch Central Bank and other banks. They serve
to secure margin accounts and are used for other purposes required by law. The assets not freely
disposable are as follows:
2018 2017
Banks
– Cash and balances with central banks 1,471 1,569
– Loans and advances to banks 4,373 3,730
Financial assets at fair value through profit or loss 1,620 1,072
Financial assets at fair value through OCI 421 n/a
Securities at amortised cost 769 n/a
Investments n/a 885
Loans and advances to customers 74,352 76,083
Other assets 734 813
83,740 84,152
In some jurisdictions ING Bank N.V. has an obligation to maintain a reserve with central banks. As at
31 December 2018, the minimum mandatory reserve deposits with various central banks amount
to EUR 9,359 million (2017: EUR 8,503 million).
Loans and advances to customers that have been pledged as collateral for Debt securities in issue
and for liquidity purposes, amount in the Netherlands to EUR 46 billion (2017: EUR 50 billion), in
Germany to EUR 12 billion (2017: EUR 12 billion), in Belgium EUR 12 billion (2017: EUR 10 billion), in
Australia to EUR 3 billion (2017: EUR 2 billion) and in the United States to EUR 1 billion (2017: EUR 1
billion).
The table does not include assets relating to securities lending as well as sale and repurchase
transactions. Reference is made to Note 41 ‘Transfer of financial assets’.
41 Transfer of financial assets
The majority of ING's financial assets that have been transferred, but do not qualify for
derecognition are debt instruments used in securities lending or sale and repurchase transactions.
Reference is made to Note 47 ‘Structured entities’.
Assets not freely disposable
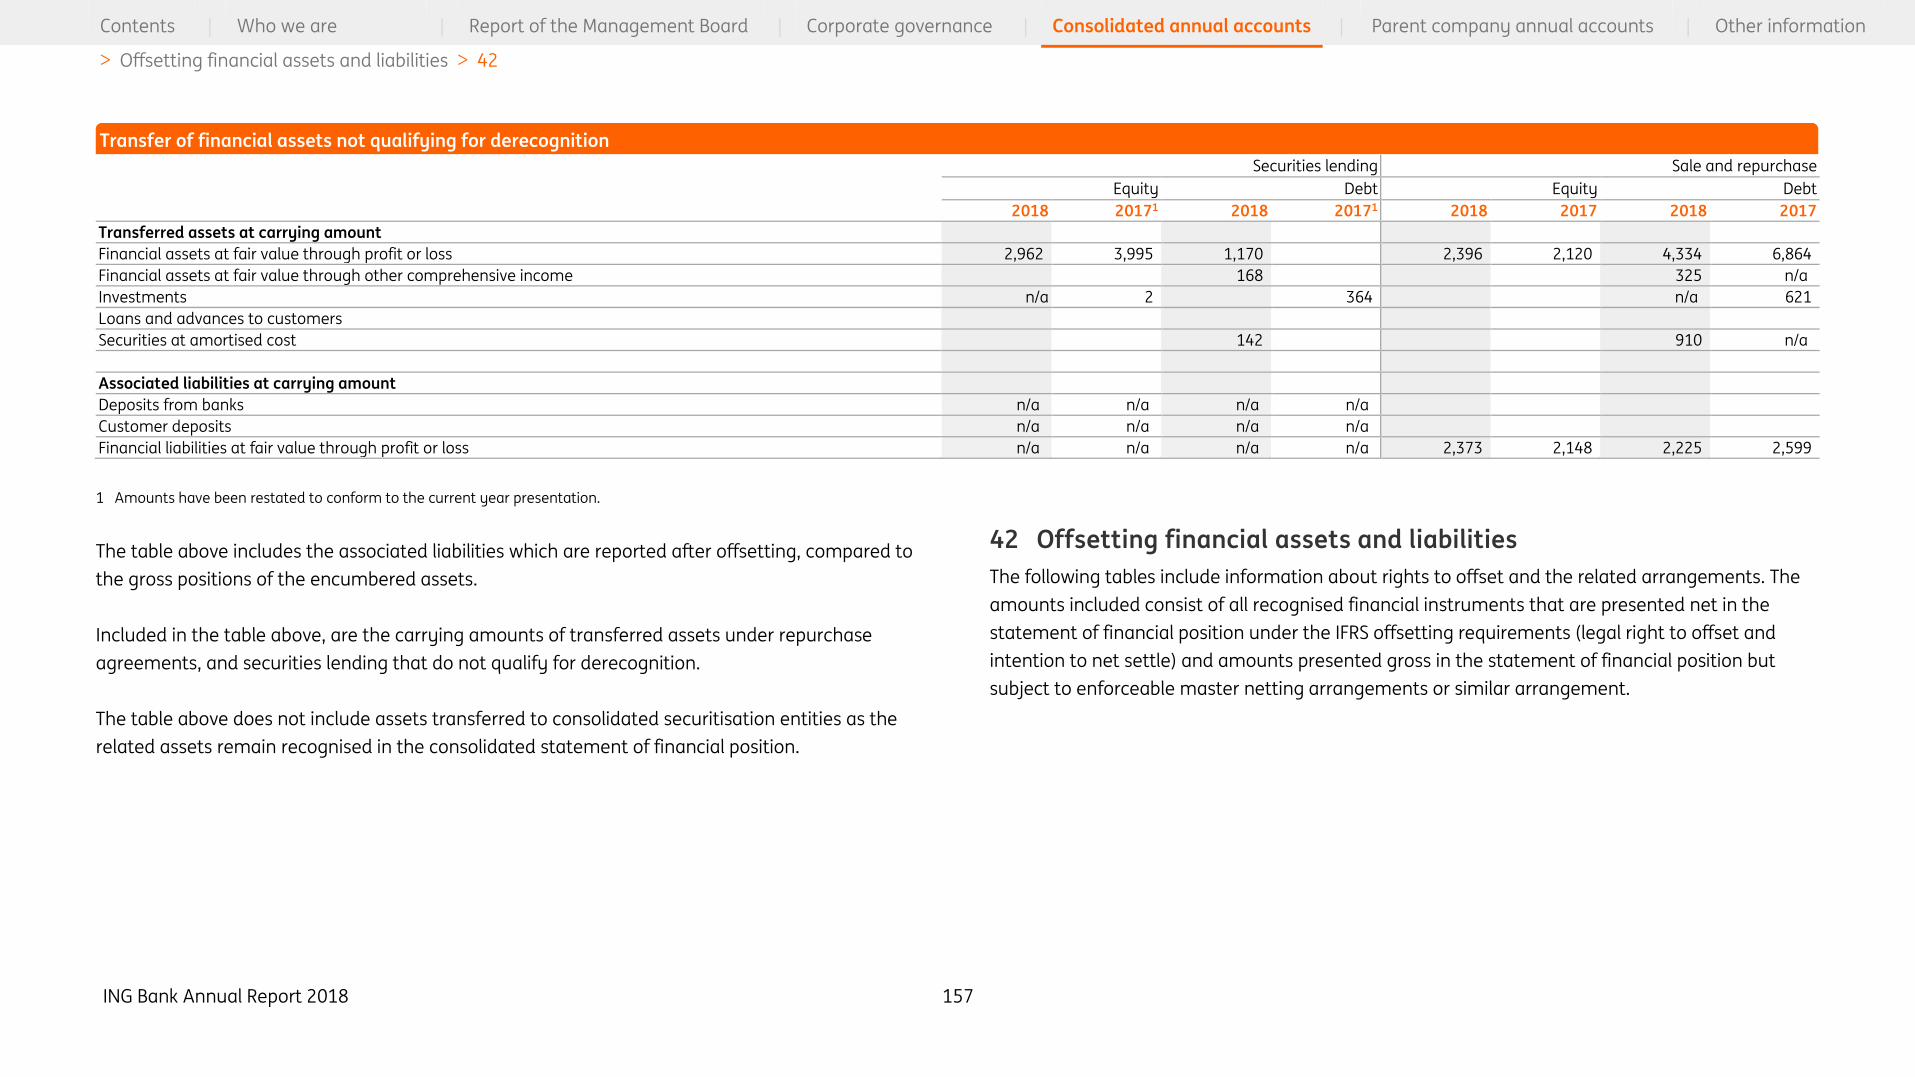
ING Bank Annual Report 2018 157
Contents | Who we are | Report of the Management Board | Corporate governance | Consolidated annual accounts | Parent company annual accounts | Other information
> Offsetting financial assets and liabilities > 42
Securities lending Sale and repurchase
Equity Debt Equity Debt
2018 20171 2018 20171 2018 2017 2018 2017
Transferred assets at carrying amount
Financial assets at fair value through profit or loss 2,962 3,995 1,170 2,396 2,120 4,334 6,864
Financial assets at fair value through other comprehensive income 168 325 n/a
Investments n/a 2 364 n/a 621
Loans and advances to customers
Securities at amortised cost 142 910 n/a
Associated liabilities at carrying amount
Deposits from banks n/a n/a n/a n/a
Customer deposits n/a n/a n/a n/a
Financial liabilities at fair value through profit or loss n/a n/a n/a n/a 2,373 2,148 2,225 2,599
1 Amounts have been restated to conform to the current year presentation.
The table above includes the associated liabilities which are reported after offsetting, compared to
the gross positions of the encumbered assets.
Included in the table above, are the carrying amounts of transferred assets under repurchase
agreements, and securities lending that do not qualify for derecognition.
The table above does not include assets transferred to consolidated securitisation entities as the
related assets remain recognised in the consolidated statement of financial position.
42 Offsetting financial assets and liabilities
The following tables include information about rights to offset and the related arrangements. The
amounts included consist of all recognised financial instruments that are presented net in the
statement of financial position under the IFRS offsetting requirements (legal right to offset and
intention to net settle) and amounts presented gross in the statement of financial position but
subject to enforceable master netting arrangements or similar arrangement.
Transfer of financial assets not qualifying for derecognition
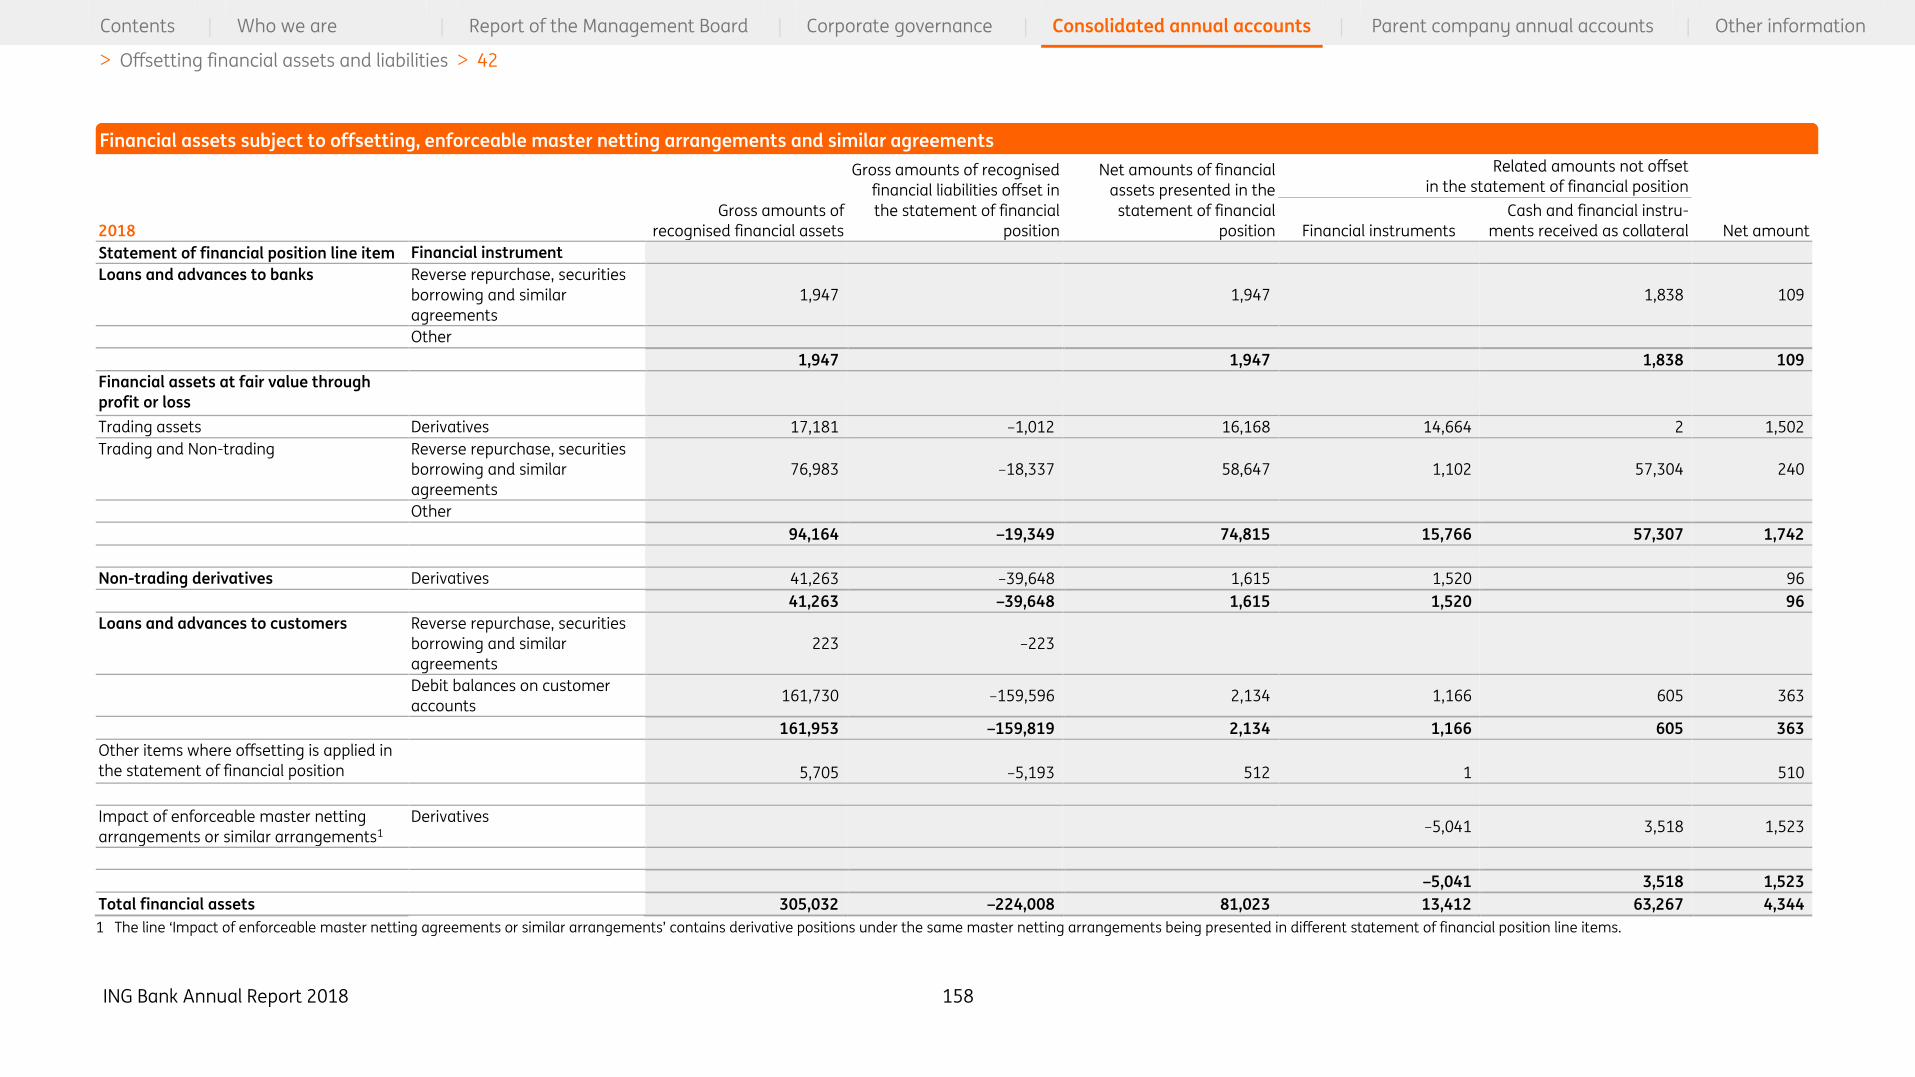
ING Bank Annual Report 2018 158
Contents | Who we are | Report of the Management Board | Corporate governance | Consolidated annual accounts | Parent company annual accounts | Other information
> Offsetting financial assets and liabilities > 42
Gross amounts of
recognised financial assets
Gross amounts of recognised
financial liabilities offset in
the statement of financial
position
Net amounts of financial
assets presented in the
statement of financial
position
Related amounts not offset
in the statement of financial position
2018
Financial instruments
Cash and financial instru-
ments received as collateral Net amount
Statement of financial position line item Financial instrument
Loans and advances to banks Reverse repurchase, securities
borrowing and similar
agreements
1,947 – 1,947 – 1,838 109
Other 0 –0 0 – – 0
1,947 –0 1,947 – 1,838 109
Financial assets at fair value through
profit or loss
Trading assets Derivatives 17,181 –1,012 16,168 14,664 2 1,502
Trading and Non-trading Reverse repurchase, securities
borrowing and similar
agreements
76,983 –18,337 58,647 1,102 57,304 240
Other – – – – – –
94,164 –19,349 74,815 15,766 57,307 1,742
Non-trading derivatives Derivatives 41,263 –39,648 1,615 1,520 –0 96
41,263 –39,648 1,615 1,520 –0 96
Loans and advances to customers Reverse repurchase, securities
borrowing and similar
agreements
223 –223 – – – –
Debit balances on customer
accounts 161,730 –159,596 2,134 1,166 605 363
161,953 –159,819 2,134 1,166 605 363
Other items where offsetting is applied in
the statement of financial position
5,705 –5,193 512 1 – 510
Impact of enforceable master netting
arrangements or similar arrangements1
Derivatives – – – –5,041 3,518 1,523
– – – –0 – 0
– – – –5,041 3,518 1,523
Total financial assets 305,032 –224,008 81,023 13,412 63,267 4,344
1 The line ‘Impact of enforceable master netting agreements or similar arrangements’ contains derivative positions under the same master netting arrangements being presented in different statement of financial position line items.
Financial assets subject to offsetting, enforceable master netting arrangements and similar agreements
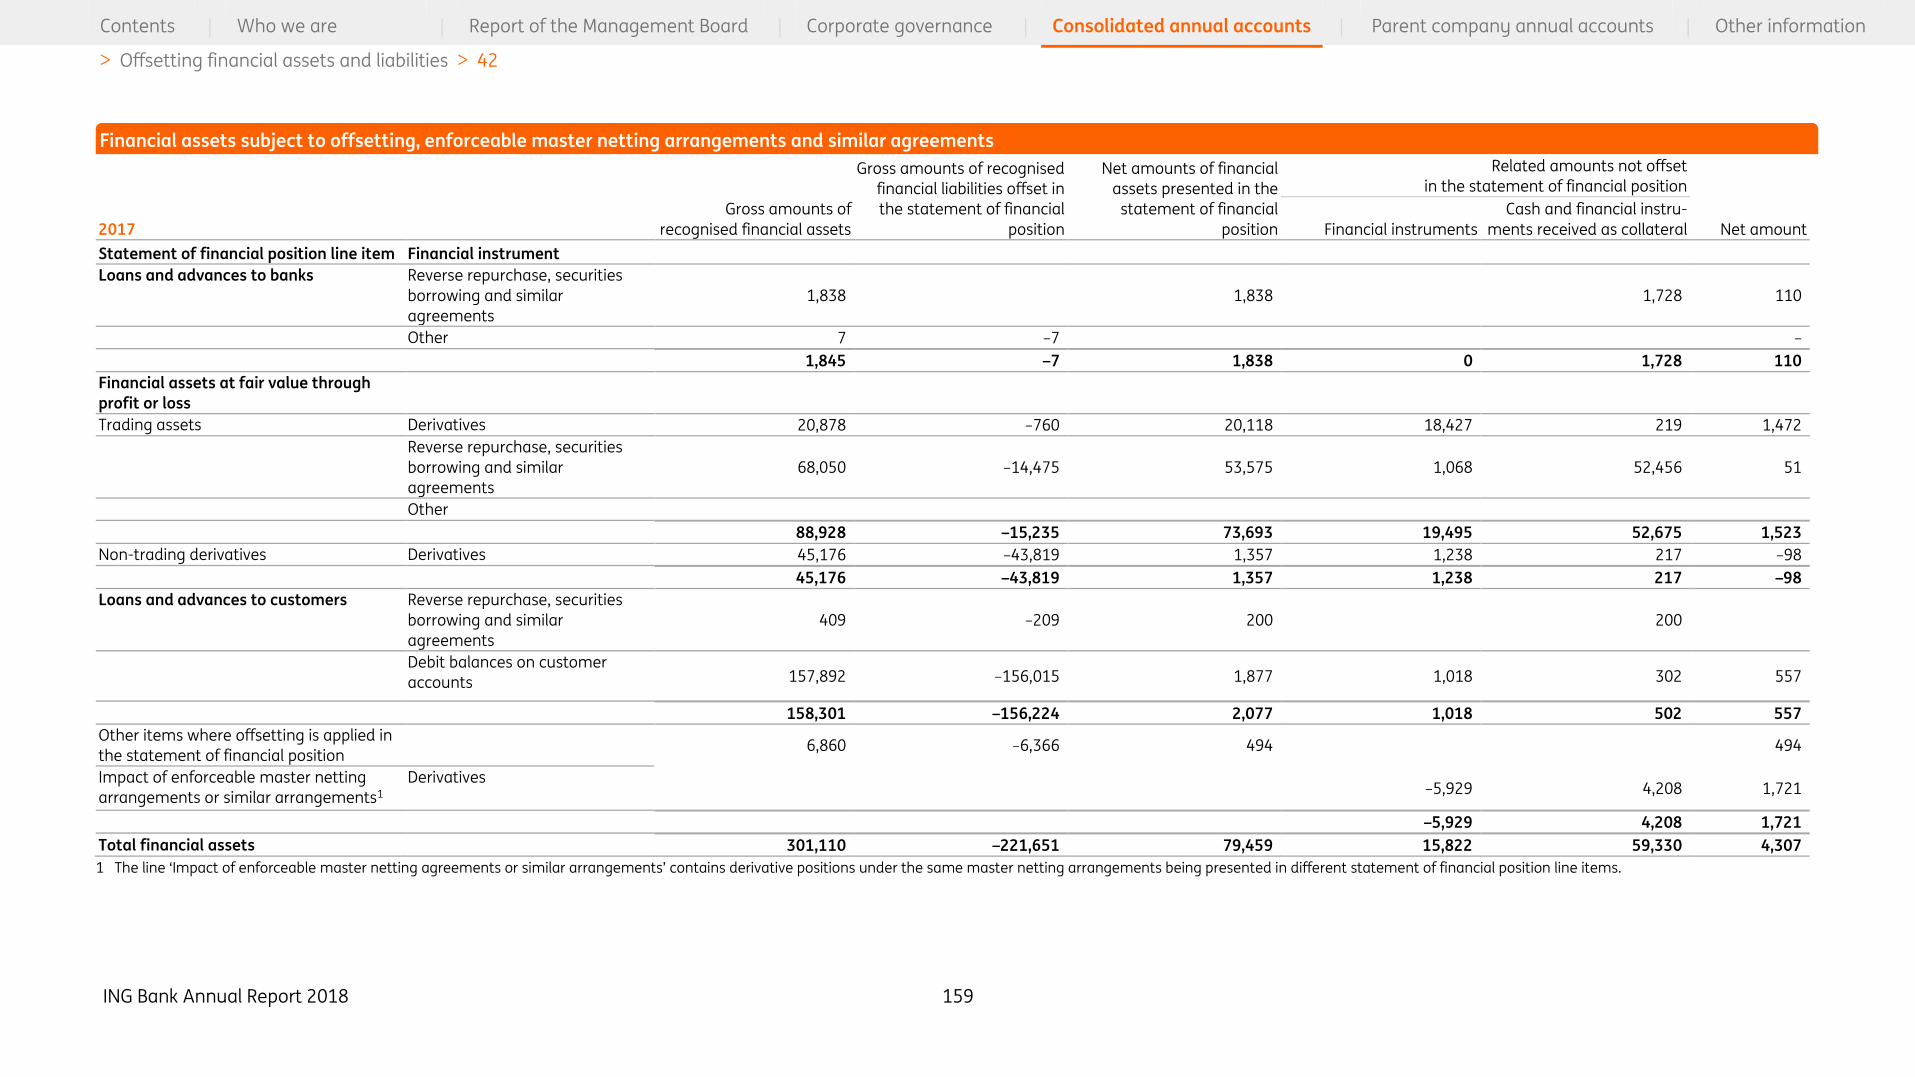
ING Bank Annual Report 2018 159
Contents | Who we are | Report of the Management Board | Corporate governance | Consolidated annual accounts | Parent company annual accounts | Other information
> Offsetting financial assets and liabilities > 42
Gross amounts of
recognised financial assets
Gross amounts of recognised
financial liabilities offset in
the statement of financial
position
Net amounts of financial
assets presented in the
statement of financial
position
Related amounts not offset
in the statement of financial position
2017
Financial instruments
Cash and financial instru-
ments received as collateral Net amount
Statement of financial position line item Financial instrument
Loans and advances to banks Reverse repurchase, securities
borrowing and similar
agreements
1,838 1,838 1,728 110
Other 7 –7 –
1,845 –7 1,838 0 1,728 110
Financial assets at fair value through
profit or loss
Trading assets Derivatives 20,878 –760 20,118 18,427 219 1,472
Reverse repurchase, securities
borrowing and similar
agreements
68,050 –14,475 53,575 1,068 52,456 51
Other
88,928 –15,235 73,693 19,495 52,675 1,523
Non-trading derivatives Derivatives 45,176 –43,819 1,357 1,238 217 –98
45,176 –43,819 1,357 1,238 217 –98
Loans and advances to customers Reverse repurchase, securities
borrowing and similar
agreements
409 –209 200 200
Debit balances on customer
accounts 157,892 –156,015 1,877 1,018 302 557
158,301 –156,224 2,077 1,018 502 557
Other items where offsetting is applied in
the statement of financial position
6,860 –6,366 494 494
Impact of enforceable master netting
arrangements or similar arrangements1
Derivatives –5,929 4,208 1,721
–5,929 4,208 1,721
Total financial assets 301,110 –221,651 79,459 15,822 59,330 4,307
1 The line ‘Impact of enforceable master netting agreements or similar arrangements’ contains derivative positions under the same master netting arrangements being presented in different statement of financial position line items.
Financial assets subject to offsetting, enforceable master netting arrangements and similar agreements

ING Bank Annual Report 2018 160
Contents | Who we are | Report of the Management Board | Corporate governance | Consolidated annual accounts | Parent company annual accounts | Other information
> Offsetting financial assets and liabilities > 42
Gross amounts of
recognised
financial liabilities
Gross amounts of recognised
financial assets offset in the
statement of financial
position
Net amounts of financial
liabilities presented in the
statement of financial
position
Related amounts not offset in the statement of financial position
2018
Financial instruments
Cash and financial instruments
received as collateral Net amount
Statement of financial position line
item Financial instrument
Deposits from banks Repurchase, securities lending
and similar agreements 36 –36 –0 –0
Other
37 –36 0 0 0 –0
Customer deposits Repurchase, securities lending
and similar agreements 224 –186 37 37
Corporate deposits 9,567 –9,078 489 489
Credit balances on customer
accounts 161,552 –150,518 11,034 1,166 4 9,864
171,343 –159,782 11,561 1,166 42 10,353
Financial liabilities at fair value through
profit or loss
Trading liabilities Derivatives 17,105 –1,021 16,084 15,301 2 781
Trading and Non-trading Repurchase, securities lending
and similar agreements 64,324 –18,337 45,987 1,102 44,801 85
Other
81,429 –19,357 62,071 16,403 44,803 866
Non-trading derivatives Derivatives 42,675 –41,198 1,477 1,312 178 –13
Other items where offsetting is applied
in the statement of financial position
4,353 –3,634 718 –4 723
Impact of enforceable master netting
arrangements or similar arrangements1
Derivatives
–5,464 5,773 –309
–0 0
– – – –5,464 5,773 –309
Total financial liabilities 299,836 –224,008 75,827 13,412 50,796 11,619
1 The line ‘Impact of enforceable master netting agreements or similar arrangements’ contains derivative positions under the same master netting arrangements being presented in different statement of financial position line items.
Financial liabilities subject to offsetting, enforceable master netting arrangements and similar agreements
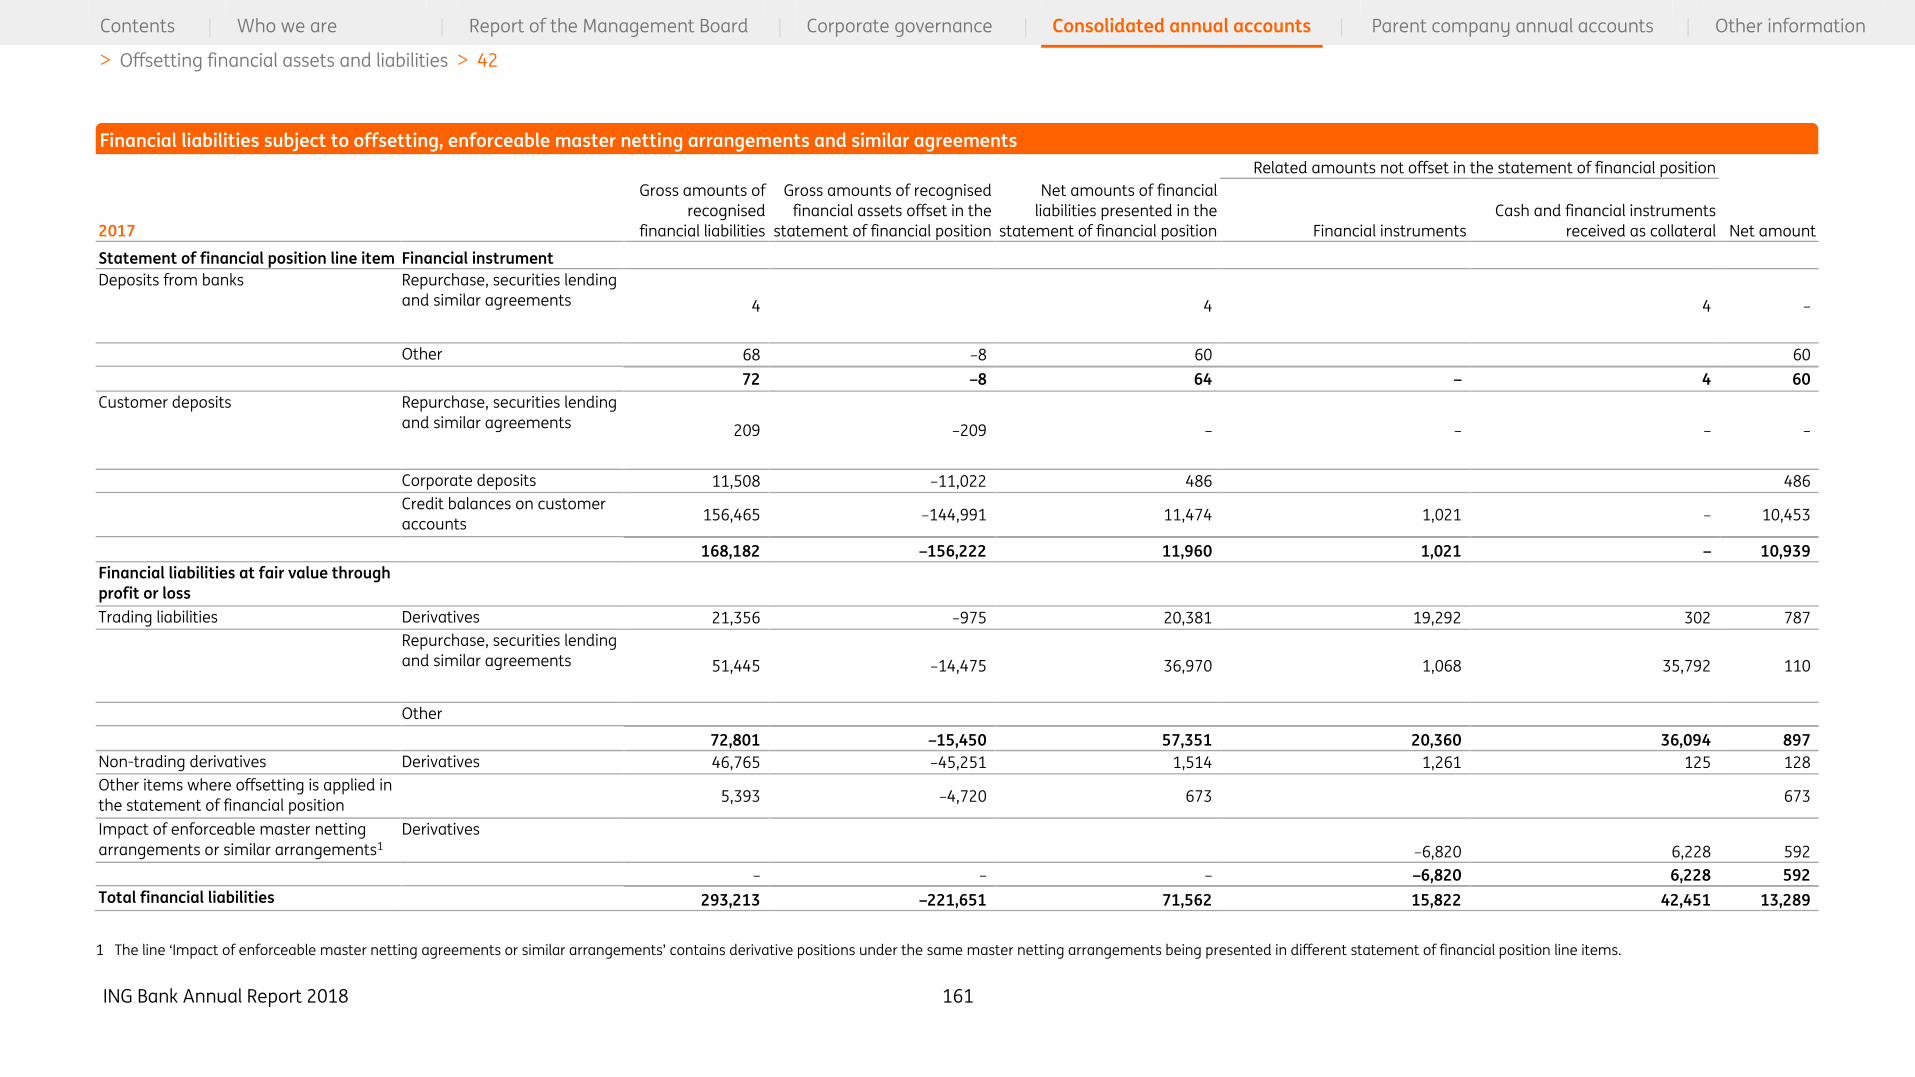
ING Bank Annual Report 2018 161
Contents | Who we are | Report of the Management Board | Corporate governance | Consolidated annual accounts | Parent company annual accounts | Other information
> Offsetting financial assets and liabilities > 42
Gross amounts of
recognised
financial liabilities
Gross amounts of recognised
financial assets offset in the
statement of financial position
Net amounts of financial
liabilities presented in the
statement of financial position
Related amounts not offset in the statement of financial position
2017 Financial instruments
Cash and financial instruments
received as collateral Net amount
Statement of financial position line item Financial instrument
Deposits from banks Repurchase, securities lending
and similar agreements 4 4 4 –
Other 68 –8 60 60
72 –8 64 – 4 60
Customer deposits Repurchase, securities lending
and similar agreements 209 –209 – – – –
Corporate deposits 11,508 –11,022 486 486
Credit balances on customer
accounts 156,465 –144,991 11,474 1,021 – 10,453
168,182 –156,222 11,960 1,021 – 10,939
Financial liabilities at fair value through
profit or loss
Trading liabilities Derivatives 21,356 –975 20,381 19,292 302 787
Repurchase, securities lending
and similar agreements 51,445 –14,475 36,970 1,068 35,792 110
Other
72,801 –15,450 57,351 20,360 36,094 897
Non-trading derivatives Derivatives 46,765 –45,251 1,514 1,261 125 128
Other items where offsetting is applied in
the statement of financial position 5,393 –4,720 673 673
Impact of enforceable master netting
arrangements or similar arrangements1
Derivatives
–6,820 6,228 592
– – – –6,820 6,228 592
Total financial liabilities 293,213 –221,651 71,562 15,822 42,451 13,289
1 The line ‘Impact of enforceable master netting agreements or similar arrangements’ contains derivative positions under the same master netting arrangements being presented in different statement of financial position line items.
Financial liabilities subject to offsetting, enforceable master netting arrangements and similar agreements

ING Bank Annual Report 2018 162
Contents | Who we are | Report of the Management Board | Corporate governance | Consolidated annual accounts | Parent company annual accounts | Other information
> Contingent liabilities and commitments > 43
43 Contingent liabilities and commitments
In the normal course of business, ING Bank is party to activities where risks are not reflected in
whole or in part in the consolidated annual accounts. In response to the needs of its customers, the
Bank offers financial products related to loans. These products include traditional off-balance sheet
credit-related financial instruments.
Less than 1
month 1–3 months 3–12 months 1–5 years Over 5 years
Maturity not
applicable Total
2018 2017 2018 2017 2018 2017 2018 2017 2018 2017 2018 2017 2018 2017
Contingent liabilities in respect of
– Discounted bills 1 1 1 1
– Guarantees 18,369 15,647 374 571 1,324 944 2,094 2,560 4,095 4,189 26,256 23,911
– Irrevocable letters of credit 10,346 9,453 4,499 4,746 998 1,146 374 176 3 12 16,220 15,533
– Other 52 58 115 223 – 167 281
28,768 25,159 4,873 5,317 2,322 2,090 2,584 2,959 4,098 4,201 – – 42,644 39,726
Irrevocable facilities 63,499 56,459 2,699 2,150 8,470 7,504 32,717 30,331 6,876 7,825 114,261 104,269
92,266 81,618 7,572 7,467 10,792 9,594 35,301 33,290 10,974 12,026 – – 156,905 143,995
Reference is made to Parent company annual accounts – Notes to the parent company annual
accounts, Note 30 ‘Other’ for further information on Guarantees issued by ING Bank N.V.
Guarantees relate both to credit and non-credit substitute guarantees. Credit substitute guarantees
are guarantees given by ING Bank in respect of credit granted to customers by a third party. Many
of them are expected to expire without being drawn on and therefore do not necessarily represent
future cash outflows. In addition to the items included in contingent liabilities, ING Bank has issued
guarantees as a participant in collective arrangements of national industry bodies and as a
participant in government required collective guarantee schemes which apply in different
countries.
Irrevocable letters of credit mainly secure payments to third parties for a customer’s foreign and
domestic trade transactions in order to finance a shipment of goods. ING Bank’s credit risk in these
transactions is limited since these transactions are collateralised by the commodity shipped and
are of a short duration.
Other contingent liabilities include acceptances of bills and are of a short-term nature. Other
contingent liabilities also include contingent liabilities resulting from the operations of the Real
Estate business including obligations under development and construction contracts. Furthermore
other contingent liabilities include a contingent liability in connection with a possible Dutch tax
obligation that relates to the deduction from Dutch taxable profit for losses incurred by ING Bank in
Contingent liabilities and commitments

ING Bank Annual Report 2018 163
Contents | Who we are | Report of the Management Board | Corporate governance | Consolidated annual accounts | Parent company annual accounts | Other information
> Legal proceedings > 44
the United Kingdom in previous years. The existence of this obligation will be confirmed only by the
occurrence of future profits in the United Kingdom.
Irrevocable facilities mainly constitute unused portions of irrevocable credit facilities granted to
corporate clients. Many of these facilities are for a fixed duration and bear interest at a floating
rate. ING Bank’s credit risk and interest rate risk in these transactions is limited. The unused portion
of irrevocable credit facilities is partly secured by customers’ assets or counter-guarantees by the
central governments and exempted bodies under the regulatory requirements. Irrevocable facilities
also include commitments made to purchase securities to be issued by governments and private
issuers.
Furthermore, ING Bank leases assets from third parties under operating leases as lessee. The future
rental commitments to be paid under non-cancellable operating leases are as follows:
2018 2017
2018 268
2019 260 195
2020 230 165
2021 201 152
2022 166 116
Years after 2022 521 356
44 Legal proceedings
ING Bank N.V. and its consolidated subsidiaries are involved in governmental, regulatory, arbitration
and legal proceedings and investigations in the Netherlands and in a number of foreign
jurisdictions, including the U.S., involving claims by and against them which arise in the ordinary
course of their businesses, including in connection with their activities as lenders, broker-dealers,
underwriters, issuers of securities and investors and their position as employers and taxpayers. In
certain of such proceedings, very large or indeterminate amounts are sought, including punitive
and other damages. While it is not feasible to predict or determine the ultimate outcome of all
pending or threatened governmental, regulatory, arbitration and legal proceedings and
investigations, ING is of the opinion that some of the proceedings and investigations set out below
may have or have in the recent past had a significant effect on the financial position, profitability or
reputation of ING and/or ING and its consolidated subsidiaries.
Criminal investigations: On 4 September 2018, ING announced that it has entered into a
settlement agreement with the Dutch Public Prosecution Service relating to previously disclosed
investigations regarding various requirements for client on-boarding and the prevention of money
laundering and corrupt practices. Under the terms of the agreement ING has agreed to pay a fine
of EUR 675 million and EUR 100 million for disgorgement. As previously noted, in connection with
the investigations ING also received information requests from the US Securities and Exchange
Commission (SEC). As ING announced on 5 September 2018, ING has received a formal notification
from the SEC that it has concluded its investigation. In the letter dated 4 September 2018 the
Division of Enforcement states that, based on information as of the date thereof, it does not intend
to recommend an SEC enforcement action against ING.
Tax cases: Because of the geographic spread of its business, ING may be subject to tax audits,
investigations and procedures in numerous jurisdictions at any point in time. Although ING believes
that it has adequately provided for all its tax positions, the ultimate resolution of these audits,
investigations and procedures may result in liabilities which are different from the amounts
recognised. ING has also identified issues in connection with its U.S. tax information reporting and
withholding obligations in respect of prior periods. While a provision has been recognised, the
review of such issues is ongoing.
SIBOR – SOR litigation: In July 2016, investors in derivatives tied to the Singapore Interbank Offer
Rate (‘SIBOR’) filed a U.S. class action complaint in the New York District Court alleging that several
banks, including ING, conspired to rig the prices of derivatives tied to SIBOR and the Singapore Swap
Offer Rate (‘SOR’). The lawsuit refers to investigations by the Monetary Authority of Singapore
(‘MAS’) and other regulators, including the U.S. Commodity Futures Trading Commission (‘CFTC’), in
Future rental commitments for operating lease contracts
ING Bank Annual Report 2018 164
Contents | Who we are | Report of the Management Board | Corporate governance | Consolidated annual accounts | Parent company annual accounts | Other information
> Legal proceedings > 44
relation to rigging prices of SIBOR- and SOR based derivatives. In October 2018, the New York
District Court issued a decision dismissing all claims against ING Group and ING Capital Markets LLC,
but leaving ING Bank, together with several other banks, in the case, and directing plaintiffs to file
an amended complaint consistent with the Court's rulings. On 25 October 2018, plaintiffs filed such
amended complaint, which asserts claims against a number of defendants but none against ING
Bank (or any other ING entity), effectively dismissing ING Bank from the case. In December 2018,
plaintiffs sought permission from the Court to file a further amended complaint that names ING
Bank as a defendant. If the Court allows plaintiffs to file that complaint, ING Bank will continue to
defend itself against the allegations. Currently, it is not possible to provide an estimate of the
(potential) financial effect of this claim.
Claims regarding accounts with predecessors of ING Bank Turkey: ING Bank Turkey has received
numerous claims from (former) customers of legal predecessors of ING Bank Turkey. The claims are
based on offshore accounts held with these banks, which banks were seized by the Savings Deposit
Insurance Fund (“SDIF”) prior to the acquisition of ING Bank Turkey in 2007 from OYAK. SDIF has also
filed various lawsuits against ING Bank Turkey to claim compensation from ING Bank Turkey, with
respect to amounts paid out to offshore account holders so far. ING Bank had initiated an
arbitration procedure against OYAK in which ING Bank sought to be held harmless for these claims.
The arbitration court dismissed ING’s prayers for relief. At this moment it is not possible to assess
the outcome of these procedures nor to provide an estimate of the (potential) financial effect of
these claims.
VEB Fortis claim: In January 2011, the Dutch Association of Stockholders (Vereniging van
Effectenbezitters, “VEB”) issued a writ alleging that investors were misled by the prospectus that
was issued with respect to the September 2007 rights issue of Fortis N.V. (now Ageas N.V.) against
Ageas N.V., the underwriters of such rights issue, including ING Bank, and former directors of Fortis
N.V. According to the VEB the prospectus shows substantive incorrect and misleading information.
The VEB stated that the impact and the risks of the sub-prime crisis for Fortis and Fortis’ liquidity
position were reflected incorrectly in the prospectus. The VEB requested a declaratory decision
stating that the summoned parties acted wrongfully and are therefore responsible for the
damages suffered by the investors in Fortis. In March 2016, Ageas, VEB and certain other claimants
announced that the claim in relation to Fortis had been settled. Ageas agreed to pay EUR 1.2 billion
to investors as compensation. On 13 July 2018, the Court of Appeal declared the settlement
agreement binding. The settlement also included a third-party release clause, releasing ING and
the other underwriting banks from the claims made by VEB on behalf of investors in this matter.
Interest rate derivatives claims: ING is involved in several legal proceedings in the Netherlands
with respect to interest rate derivatives that were sold to clients in connection with floating interest
rate loans in order to hedge the interest rate risk of the loans. These proceedings are based on
several legal grounds, depending on the facts and circumstances of each specific case, inter alia
alleged breach of duty of care, insufficient information provided to the clients on the product and
its risks and other elements related to the interest rate derivatives that were sold to clients. In some
cases, the court has ruled in favour of the claimants and awarded damages, annulled the interest
rate derivative or ordered repayment of certain amounts to the claimants. The total amounts that
need to be repaid or compensated in some cases still need to be determined. ING may decide to
appeal against adverse rulings. Although the outcome of the pending litigation and similar cases
that may be brought in the future is uncertain, it is possible that the courts may ultimately rule in
favour of the claimants in some or all of such cases. Where appropriate a provision has been taken.
The aggregate financial impact of the current and future litigation could become material.
As requested by the AFM, ING has reviewed a significant part of the files of clients who bought
interest rate derivatives. In December 2015, the AFM concluded that Dutch banks may have to re-
assess certain client files, potentially including certain derivative contracts that were terminated
prior to April 2014 or other client files. As advised by the AFM, the Minister of Finance appointed a
Committee of independent experts (the “Committee”) which has established a uniform recovery
framework for Dutch SME clients with interest rate derivatives. ING has adopted this recovery
framework and has reassessed individual files against this framework. ING has taken an additional
provision for the financial consequences of the recovery framework. In 2017, ING has informed the
majority of the relevant clients whether they are in scope of the recovery framework, and thus
eligible for compensation, or not. Because implementation by ING of the uniform recovery
framework encountered delay, ING has previously offered advance payments to customers out of

ING Bank Annual Report 2018 165
Contents | Who we are | Report of the Management Board | Corporate governance | Consolidated annual accounts | Parent company annual accounts | Other information
> Legal proceedings > 44
the existing provision. As of December 2018, all customers in scope of the uniform recovery
framework have received an offer of compensation from ING.
Interest surcharges claims: ING received complaints and is involved in litigation with natural
persons (natuurlijke personen) in the Netherlands regarding increases in interest surcharges with
respect to several credit products, including but not limited to residential property
(eigenwoningfinanciering). ING is reviewing the relevant product portfolio. Although the review is
still ongoing, a provision has been taken for certain of these complaints.
Criminal proceedings regarding cash company financing: In June 2017, a Belgian criminal Court
ruled that ING Luxembourg assisted third parties in 2000 to commit a tax fraud in the context of
the purchase of the shares of a cash company. The Court convicted ING Luxembourg, among
others, and ordered ING to pay a penal fine of EUR 120,000 (suspended for half of the total
amount). The court also ordered ING Luxembourg jointly and severally with other parties, to pay
EUR 31.48 million (together with any interest payable under applicable law) to the bankruptcy
trustee of the cash company. In July 2017, ING Luxembourg filed an appeal against this judgment.
A settlement with all the civil parties involved was reached in mid-2018. However, this settlement
does not apply to the criminal conviction of ING Luxembourg, for which ING’s appeal remains
pending. In a separate proceeding the Belgian authorities were also investigating ING Luxembourg
for allegedly assisting third parties in 2001 to commit tax fraud in the context of the purchase of
the shares of a different cash company. In December 2018, the Court has agreed upon a global
(civil and criminal) settlement of any claims in connection with this separate proceeding, which
settlement is binding.
Mortgage expenses claims: ING Spain has received claims and is involved in procedures with
customers regarding reimbursement of expenses associated with the formalisation of mortgages.
In most court proceedings in first instance the expense clause of the relevant mortgage contract
has been declared null and ING Spain has been ordered to reimburse all or part of the applicable
expenses. The courts in first instance have applied in their rulings different criteria regarding the
reimbursement of expenses. ING Spain has filed an appeal against a number of these court
decisions. ING Spain has also been included, together with other Spanish banks, in a class action
filed by a customer association. The outcome of the pending litigation and similar cases that may
be brought in the future is uncertain. A provision has been taken. However, the aggregate financial
impact of the current and future litigation could change. In February 2018, the Spanish Supreme
Court ruled that Stamp Duty (Impuesto de Actos Jurídicos Documentados) expenses are chargeable
to the customer, while in October 2018 it ruled that Stamp Duty is chargeable to the banks. In
November 2018, the Spanish Supreme Court clarified the issue regarding Stamp Duty by stating
that this tax should be borne by the customer. As for the remaining types of the expenses, in
January 2019, the Spanish Supreme Court issued several decisions that stated that the client and
the bank each have to bear half of the notary and management company costs and that registry
costs have to be borne in full by the bank. Allocation of valuation costs between the bank and the
customer were not addressed by the Spanish Supreme Court decisions and remain uncertain.
Imtech claim: In January 2018, ING Bank received a claim from Stichting ImtechClaim.nl and
Imtech Shareholders Action Group B.V. on behalf of certain (former) shareholders of Imtech N.V.
(“Imtech”). Furthermore, on 28 March 2018, ING Bank received another claim on the same subject
matter from the VEB. Each of the claimants allege inter alia that shareholders were misled by the
prospectus of the rights issues of Imtech in July 2013 and October 2014. ING Bank, being one of the
underwriters of the rights issues, is held liable by the claimants for the damages that investors in
Imtech would have suffered. ING Bank responded to the claimants denying any and all
responsibility in relation to the allegations made in the relevant letters. In September 2018, the
trustees in the bankruptcy of Imtech claimed from various financing parties, including ING,
payment of what the security agent has collected following bankruptcy or intends to collect,
repayment of all that was repaid to the financing parties, as well as compensation for the
repayment of the bridge financing. At this moment it is not possible to assess the outcome of these
claims nor to provide an estimate of the (potential) effect of these claims.
Mexican Government Bond litigation: A class action complaint was filed adding ING Bank N.V., ING
Groep N.V., ING Bank Mexico S.A. and ING Financial Markets LLC (“ING”) as defendants to a
complaint that had previously been filed against multiple other financial institutions. The

ING Bank Annual Report 2018 166
Contents | Who we are | Report of the Management Board | Corporate governance | Consolidated annual accounts | Parent company annual accounts | Other information
> Consolidated companies and businesses acquired and divested > 45
complaint alleges that the defendants conspired to fix the prices of Mexican Government Bonds.
ING is defending itself against the allegations. Currently, it is not possible to provide an estimate of
the (potential) financial effect of this claim.
45 Consolidated companies and businesses acquired and divested
Acquisitions
Payvision
ING Bank obtained control over Payvision Holding B.V. (Payvision), a fast-growing, leading
international omnichannel payments service provider, by acquiring 75% of its shares on 13 March
2018. This is in scope of IFRS 3 ‘Business combinations’.
The transaction will enable ING to strengthen its footprint in omnichannel payments services and
expand its merchant services for its business customers, in particular in the fast-growing e-
commerce segment. Total consideration paid of the 75% of shares was, including deferred and
contingent consideration, EUR 260 million.
The share purchase agreement includes also an arrangement for possible acquisition of the
remaining 25% shares of Payvision. This consists of a put option exercisable by the original
shareholders as well as a call option exercisable by ING. In summary, the put is exercisable after 3
years with an exercise price of fair market value (FMV) unless the fair value of the total business is
less than EUR 210 million, then the exercise price is EUR 1. The call option by ING has similar terms
but is only exercisable after 5 years. In addition, there are some early redemption features at
various prices at various times. The put option, exercisable by the non-controlling interest
shareholders, is reported as financial liability with initial recognition through shareholders’ equity of
EUR 87 million.
The following table summarises the acquisition date fair value of consideration transferred.
Payvision
Cash paid 213
Deferred consideration 25
Contingent consideration 22
Total purchase consideration 260
Contingent consideration is payable by ING to the original shareholders of Payvision in the amount
ranging from EUR 0 up to EUR 25 million in 3 tranches upon achievement of 3 milestones. The
milestones should be achieved within (1) 6 months after completion of the acquisition, (2) 6
months after achieving milestone 1 and (3) 3 months after achieving milestone 2 (with some
additional grace periods of 4 months per milestone permitted). The amounts are payable in
tranches of EUR 7 million, EUR 7 million and EUR 11 million respectively. The probability of
achievement of the set milestones and the time value of money were taken into consideration in
the measurement of the contingent consideration at fair value of EUR 22 million on the date of
acquisition. Since the date of acquisition there were no changes in the assumptions used to develop
the estimate of the fair value of the contingent consideration.
In October 2018 ING made a first milestone payment of EUR 7 million.
The incurred acquisition costs amounts to EUR 1 million and are included in the ‘other operating
expenses’ in the Consolidated statement of profit or loss.
The assets and liabilities recognised as a result of the acquisition are as follows;
Consideration transferred
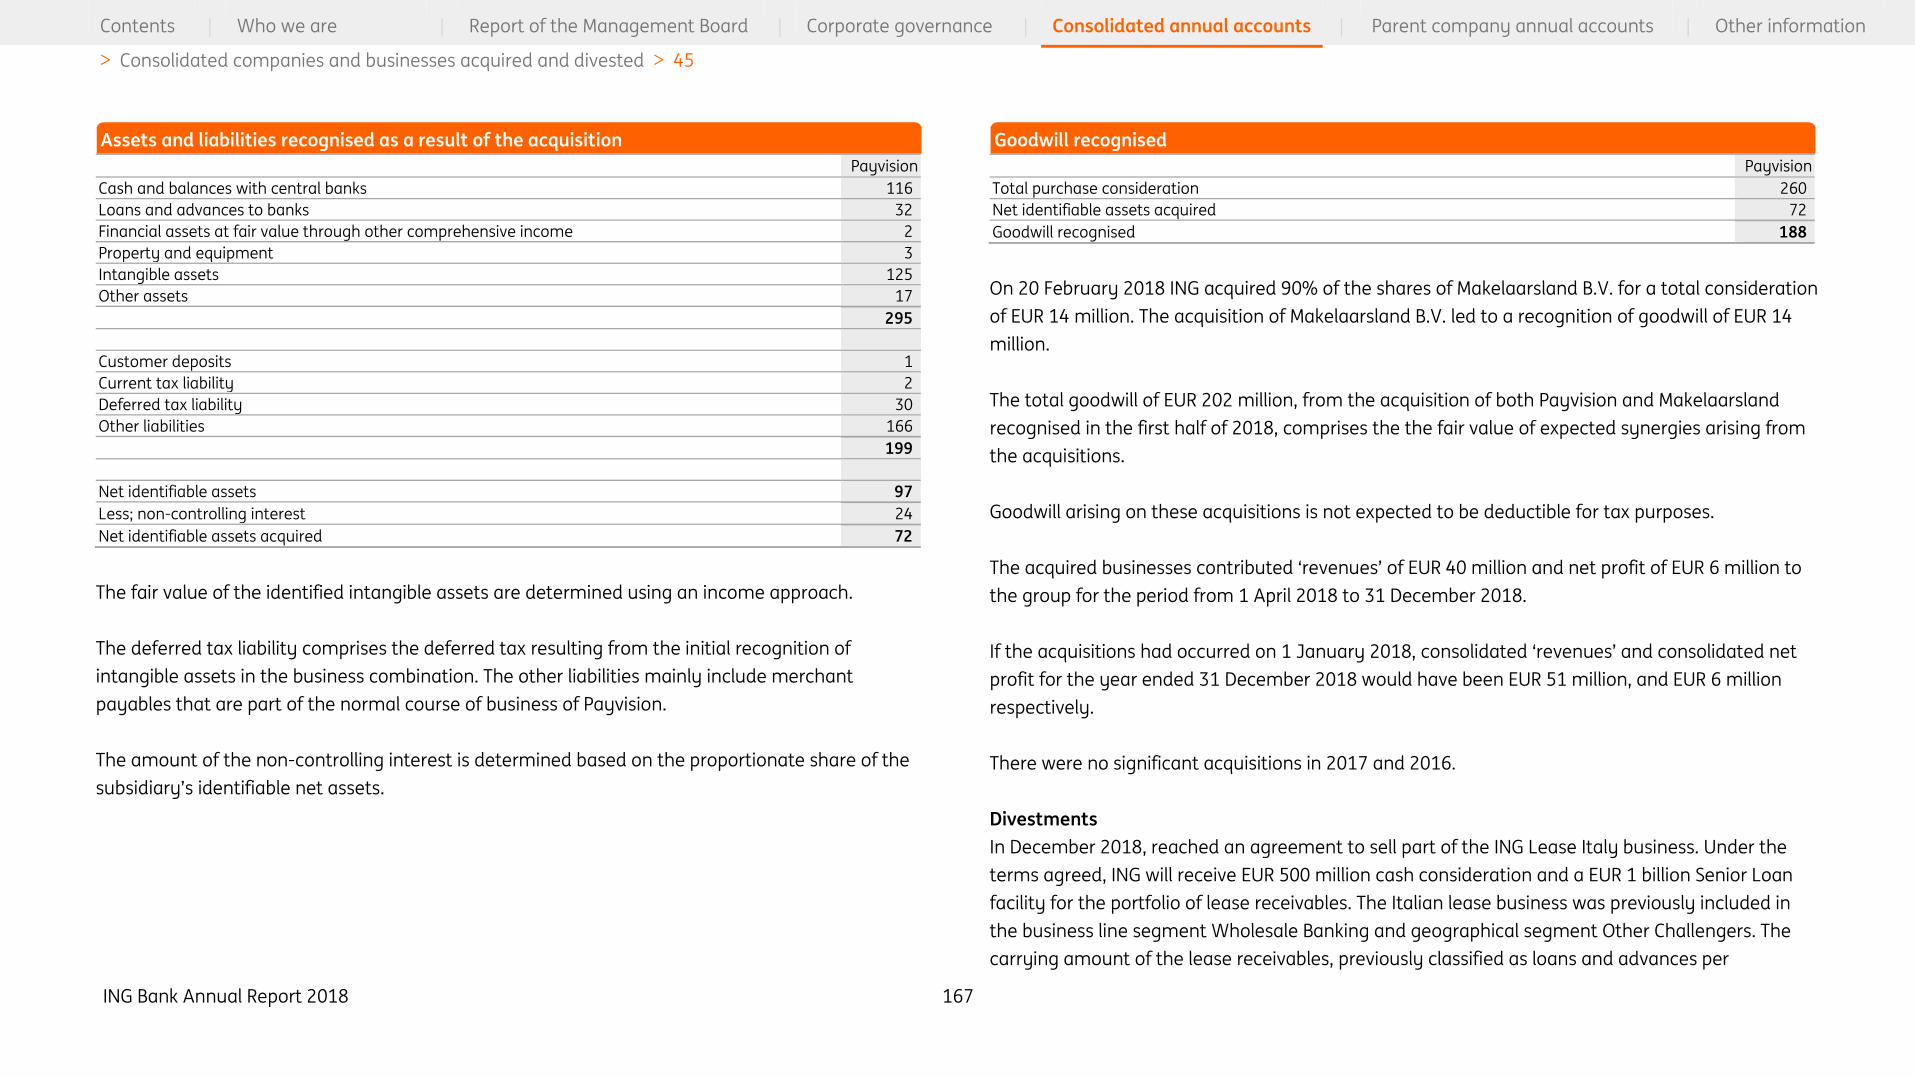
ING Bank Annual Report 2018 167
Contents | Who we are | Report of the Management Board | Corporate governance | Consolidated annual accounts | Parent company annual accounts | Other information
> Consolidated companies and businesses acquired and divested > 45
Payvision
Cash and balances with central banks 116
Loans and advances to banks 32
Financial assets at fair value through other comprehensive income 2
Property and equipment 3
Intangible assets 125
Other assets 17
295
Customer deposits 1
Current tax liability 2
Deferred tax liability 30
Other liabilities 166
199
Net identifiable assets 97
Less; non-controlling interest 24
Net identifiable assets acquired 72
The fair value of the identified intangible assets are determined using an income approach.
The deferred tax liability comprises the deferred tax resulting from the initial recognition of
intangible assets in the business combination. The other liabilities mainly include merchant
payables that are part of the normal course of business of Payvision.
The amount of the non-controlling interest is determined based on the proportionate share of the
subsidiary’s identifiable net assets.
Payvision
Total purchase consideration 260
Net identifiable assets acquired 72
Goodwill recognised 188
On 20 February 2018 ING acquired 90% of the shares of Makelaarsland B.V. for a total consideration
of EUR 14 million. The acquisition of Makelaarsland B.V. led to a recognition of goodwill of EUR 14
million.
The total goodwill of EUR 202 million, from the acquisition of both Payvision and Makelaarsland
recognised in the first half of 2018, comprises the the fair value of expected synergies arising from
the acquisitions.
Goodwill arising on these acquisitions is not expected to be deductible for tax purposes.
The acquired businesses contributed ‘revenues’ of EUR 40 million and net profit of EUR 6 million to
the group for the period from 1 April 2018 to 31 December 2018.
If the acquisitions had occurred on 1 January 2018, consolidated ‘revenues’ and consolidated net
profit for the year ended 31 December 2018 would have been EUR 51 million, and EUR 6 million
respectively.
There were no significant acquisitions in 2017 and 2016.
Divestments
In December 2018, reached an agreement to sell part of the ING Lease Italy business. Under the
terms agreed, ING will receive EUR 500 million cash consideration and a EUR 1 billion Senior Loan
facility for the portfolio of lease receivables. The Italian lease business was previously included in
the business line segment Wholesale Banking and geographical segment Other Challengers. The
carrying amount of the lease receivables, previously classified as loans and advances per
Assets and liabilities recognised as a result of the acquisition
Goodwill recognised

ING Bank Annual Report 2018 168
Contents | Who we are | Report of the Management Board | Corporate governance | Consolidated annual accounts | Parent company annual accounts | Other information
> Principal subsidiaries, investments in associates and joint ventures > 46
transaction date amounted to EUR 1,389 million. The sale is expected to take place during 2019,
with a negotiated long stop date of 31 December 2019.
Reference is made to Note 12 ‘Assets and liabilities held for sale’ and Note 25 ‘Result on the
disposal of group companies’.
In 2017 and 2016 there were no significant divestments of consolidated companies.
46 Principal subsidiaries, investments in associates and joint
ventures
For the majority of ING’s principal subsidiaries, ING Bank N.V. has control because it either directly
or indirectly owns more than half of the voting power. For subsidiaries in which the interest held is
below 50%, control exists based on the combination of ING’s financial interest and its rights from
other contractual arrangements which result in control over the operating and financial policies of
the entity.
For each of the subsidiaries listed, the voting rights held equal the proportion of ownership interest
and consolidation by ING is based on the majority of ownership.
For the principal investments in associates and joint ventures ING Bank has significant influence but
not control. Significant influence generally results from a shareholding of between 20% and 50% of
the voting rights, but also the ability to participate in the financial and operating policies through
situations including, but not limited to one or more of the following:
• Representation on the board of directors;
• Participation in the policymaking process; and
• Interchange of managerial personnel.
The principal subsidiaries, investments in associates and joint ventures of ING Bank N.V. and their
statutory place of incorporation or primary place of business are as follows:
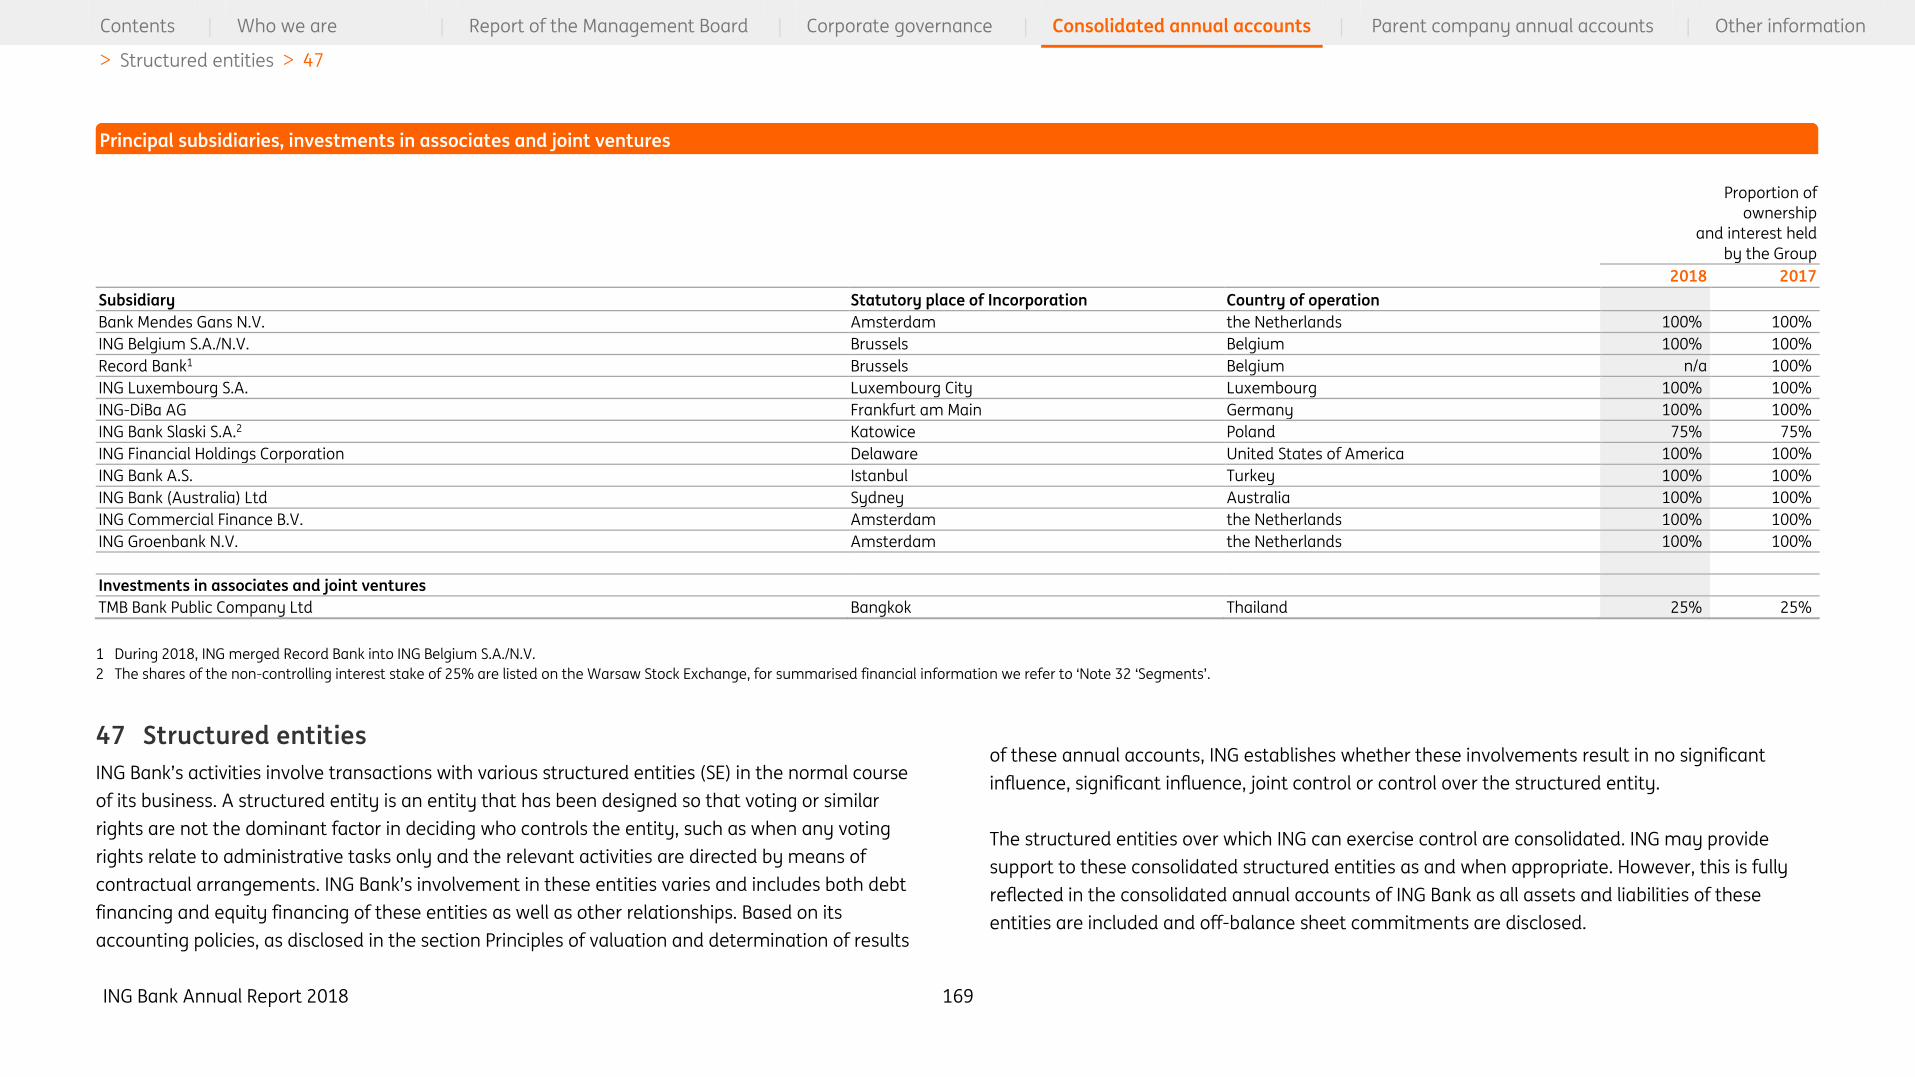
ING Bank Annual Report 2018 169
Contents | Who we are | Report of the Management Board | Corporate governance | Consolidated annual accounts | Parent company annual accounts | Other information
> Structured entities > 47
Proportion of
ownership
and interest held
by the Group
2018 2017
Subsidiary Statutory place of Incorporation Country of operation
Bank Mendes Gans N.V. Amsterdam the Netherlands 100% 100%
ING Belgium S.A./N.V. Brussels Belgium 100% 100%
Record Bank1 Brussels Belgium n/a 100%
ING Luxembourg S.A. Luxembourg City Luxembourg 100% 100%
ING-DiBa AG Frankfurt am Main Germany 100% 100%
ING Bank Slaski S.A.2 Katowice Poland 75% 75%
ING Financial Holdings Corporation Delaware United States of America 100% 100%
ING Bank A.S. Istanbul Turkey 100% 100%
ING Bank (Australia) Ltd Sydney Australia 100% 100%
ING Commercial Finance B.V. Amsterdam the Netherlands 100% 100%
ING Groenbank N.V. Amsterdam the Netherlands 100% 100%
Investments in associates and joint ventures
TMB Bank Public Company Ltd Bangkok Thailand 25% 25%
1 During 2018, ING merged Record Bank into ING Belgium S.A./N.V.
2 The shares of the non-controlling interest stake of 25% are listed on the Warsaw Stock Exchange, for summarised financial information we refer to ‘Note 32 ‘Segments’.
47 Structured entities
ING Bank’s activities involve transactions with various structured entities (SE) in the normal course
of its business. A structured entity is an entity that has been designed so that voting or similar
rights are not the dominant factor in deciding who controls the entity, such as when any voting
rights relate to administrative tasks only and the relevant activities are directed by means of
contractual arrangements. ING Bank’s involvement in these entities varies and includes both debt
financing and equity financing of these entities as well as other relationships. Based on its
accounting policies, as disclosed in the section Principles of valuation and determination of results
of these annual accounts, ING establishes whether these involvements result in no significant
influence, significant influence, joint control or control over the structured entity.
The structured entities over which ING can exercise control are consolidated. ING may provide
support to these consolidated structured entities as and when appropriate. However, this is fully
reflected in the consolidated annual accounts of ING Bank as all assets and liabilities of these
entities are included and off-balance sheet commitments are disclosed.
Principal subsidiaries, investments in associates and joint ventures
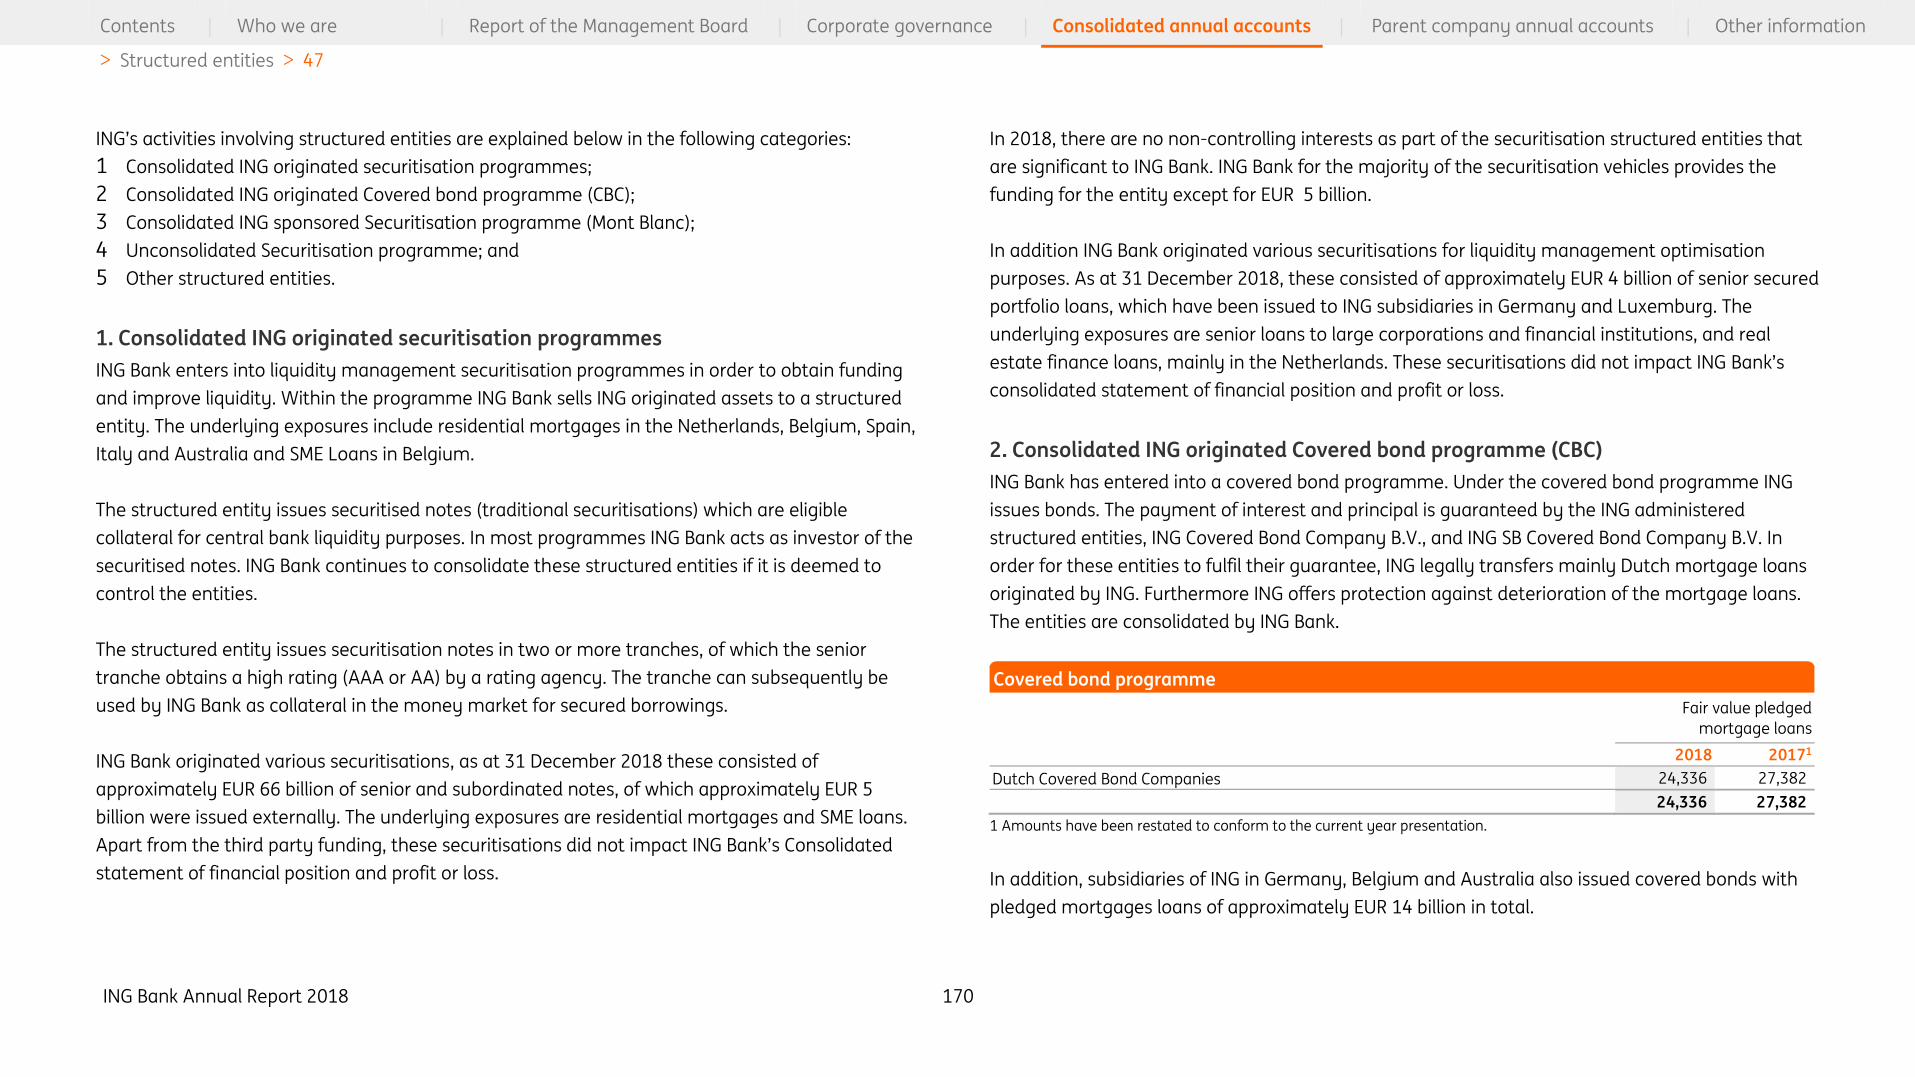
ING Bank Annual Report 2018 170
Contents | Who we are | Report of the Management Board | Corporate governance | Consolidated annual accounts | Parent company annual accounts | Other information
> Structured entities > 47
ING’s activities involving structured entities are explained below in the following categories:
1 Consolidated ING originated securitisation programmes;
2 Consolidated ING originated Covered bond programme (CBC);
3 Consolidated ING sponsored Securitisation programme (Mont Blanc);
4 Unconsolidated Securitisation programme; and
5 Other structured entities.
1. Consolidated ING originated securitisation programmes
ING Bank enters into liquidity management securitisation programmes in order to obtain funding
and improve liquidity. Within the programme ING Bank sells ING originated assets to a structured
entity. The underlying exposures include residential mortgages in the Netherlands, Belgium, Spain,
Italy and Australia and SME Loans in Belgium.
The structured entity issues securitised notes (traditional securitisations) which are eligible
collateral for central bank liquidity purposes. In most programmes ING Bank acts as investor of the
securitised notes. ING Bank continues to consolidate these structured entities if it is deemed to
control the entities.
The structured entity issues securitisation notes in two or more tranches, of which the senior
tranche obtains a high rating (AAA or AA) by a rating agency. The tranche can subsequently be
used by ING Bank as collateral in the money market for secured borrowings.
ING Bank originated various securitisations, as at 31 December 2018 these consisted of
approximately EUR 66 billion of senior and subordinated notes, of which approximately EUR 5
billion were issued externally. The underlying exposures are residential mortgages and SME loans.
Apart from the third party funding, these securitisations did not impact ING Bank’s Consolidated
statement of financial position and profit or loss.
In 2018, there are no non-controlling interests as part of the securitisation structured entities that
are significant to ING Bank. ING Bank for the majority of the securitisation vehicles provides the
funding for the entity except for EUR 5 billion.
In addition ING Bank originated various securitisations for liquidity management optimisation
purposes. As at 31 December 2018, these consisted of approximately EUR 4 billion of senior secured
portfolio loans, which have been issued to ING subsidiaries in Germany and Luxemburg. The
underlying exposures are senior loans to large corporations and financial institutions, and real
estate finance loans, mainly in the Netherlands. These securitisations did not impact ING Bank’s
consolidated statement of financial position and profit or loss.
2. Consolidated ING originated Covered bond programme (CBC)
ING Bank has entered into a covered bond programme. Under the covered bond programme ING
issues bonds. The payment of interest and principal is guaranteed by the ING administered
structured entities, ING Covered Bond Company B.V., and ING SB Covered Bond Company B.V. In
order for these entities to fulfil their guarantee, ING legally transfers mainly Dutch mortgage loans
originated by ING. Furthermore ING offers protection against deterioration of the mortgage loans.
The entities are consolidated by ING Bank.
Fair value pledged
mortgage loans
2018 20171
Dutch Covered Bond Companies 24,336 27,382
24,336 27,382
1 Amounts have been restated to conform to the current year presentation.
In addition, subsidiaries of ING in Germany, Belgium and Australia also issued covered bonds with
pledged mortgages loans of approximately EUR 14 billion in total.
Covered bond programme

ING Bank Annual Report 2018 171
Contents | Who we are | Report of the Management Board | Corporate governance | Consolidated annual accounts | Parent company annual accounts | Other information
> Related parties > 48
In general, the third-party investors in securities issued by the structured entity have recourse only
to the assets of the entity and not to the assets of ING Bank.
3. Consolidated ING sponsored Securitisation programme (Mont Blanc)
In the normal course of business, ING Bank structures financing transactions for its clients by
assisting them in obtaining sources of liquidity by selling the clients’ receivables or other financial
assets (also referred to as factoring) to an ING sponsored Special Purpose Vehicle (SPV). The senior
positions in these transactions are funded by the ING administered multi seller Asset Backed
Commercial Paper (ABCP) conduit; Mont Blanc Capital Corp. (rated A-1/P-1). Mont Blanc Capital
Corp. funds itself externally in the ABCP market.
In its role as administrative agent, ING Bank facilitates these transactions by acting as
administrative agent, swap counterparty and liquidity provider to Mont Blanc Capital Corp. ING Bank
also provides support facilities (i.e. liquidity) backing the transactions funded by the conduit. The
types of asset currently in the Mont Blanc conduit include trade receivables, consumer finance
receivables, car leases and residential mortgages.
ING Bank supports the commercial paper programmes by providing the SPV Mont Blanc Capital
Corp. with short-term liquidity facilities. Once drawn these facilities bear normal credit risk.
The liquidity facilities, provided to Mont Blanc are EUR 1,173 million (2017: EUR 1,139 million). The
drawn liquidity amount is nil as at 31 December 2018 (2017: nil).
The standby liquidity facilities are reported under irrevocable facilities. All facilities, which vary in
risk profile, are granted to the SPV subject to normal ING Bank credit and liquidity risk analysis
procedures. The fees received for services provided and for facilities are charged subject to market
conditions.
4. Unconsolidated Securitisation programme
In 2013 ING transferred financial assets (mortgage loans) for an amount of approximately EUR 2
billion to a newly established special purpose entity (SPE). The transaction resulted in full
derecognition of the financial assets from ING’s statement of financial position. The derecognition
did not have a significant impact on net result. Following this transfer ING continues to have two
types of on-going involvement in the transferred assets: as counterparty to the SPE of a non-
standard interest rate swap and as servicer of the transferred assets. ING has an option to unwind
the transaction by redeeming all notes at their principal outstanding amount, in the unlikely event
of changes in accounting and/or regulatory requirements that significantly impact the transaction.
The fair value of the swap held by ING at 31 December 2018 amounted to EUR –33 million (2017:
EUR –41 million); fair value changes on this swap recognised in the statement of profit or loss in
2018 were EUR 8 million (2017: EUR –36 million). Service fee income recognised, for the role as
administrative agent, in the statement of profit or loss in 2018 amounted to EUR 2 million (2017:
EUR 2 million). The cumulative income recognised in profit or loss since derecognition amounts to
EUR 13 million.
5. Other structured entities
In the normal course of business, ING Bank enters into transactions with structured entities as
counterparty. Predominantly in its structured finance operations, ING can be instrumental in
facilitating the creation of these structured entity counterparties. These entities are generally not
included in the consolidated annual accounts of ING Bank, as ING facilitates these transactions as
administrative agent by providing structuring, accounting, funding, lending, and operation services.
ING Bank offers various investment fund products to its clients. ING Bank does not invest in these
investment funds for its own account nor acts as the fund manager.
48 Related parties
In the normal course of business, ING Bank enters into various transactions with related parties.
Parties are considered to be related if one party has the ability to control or exercise significant
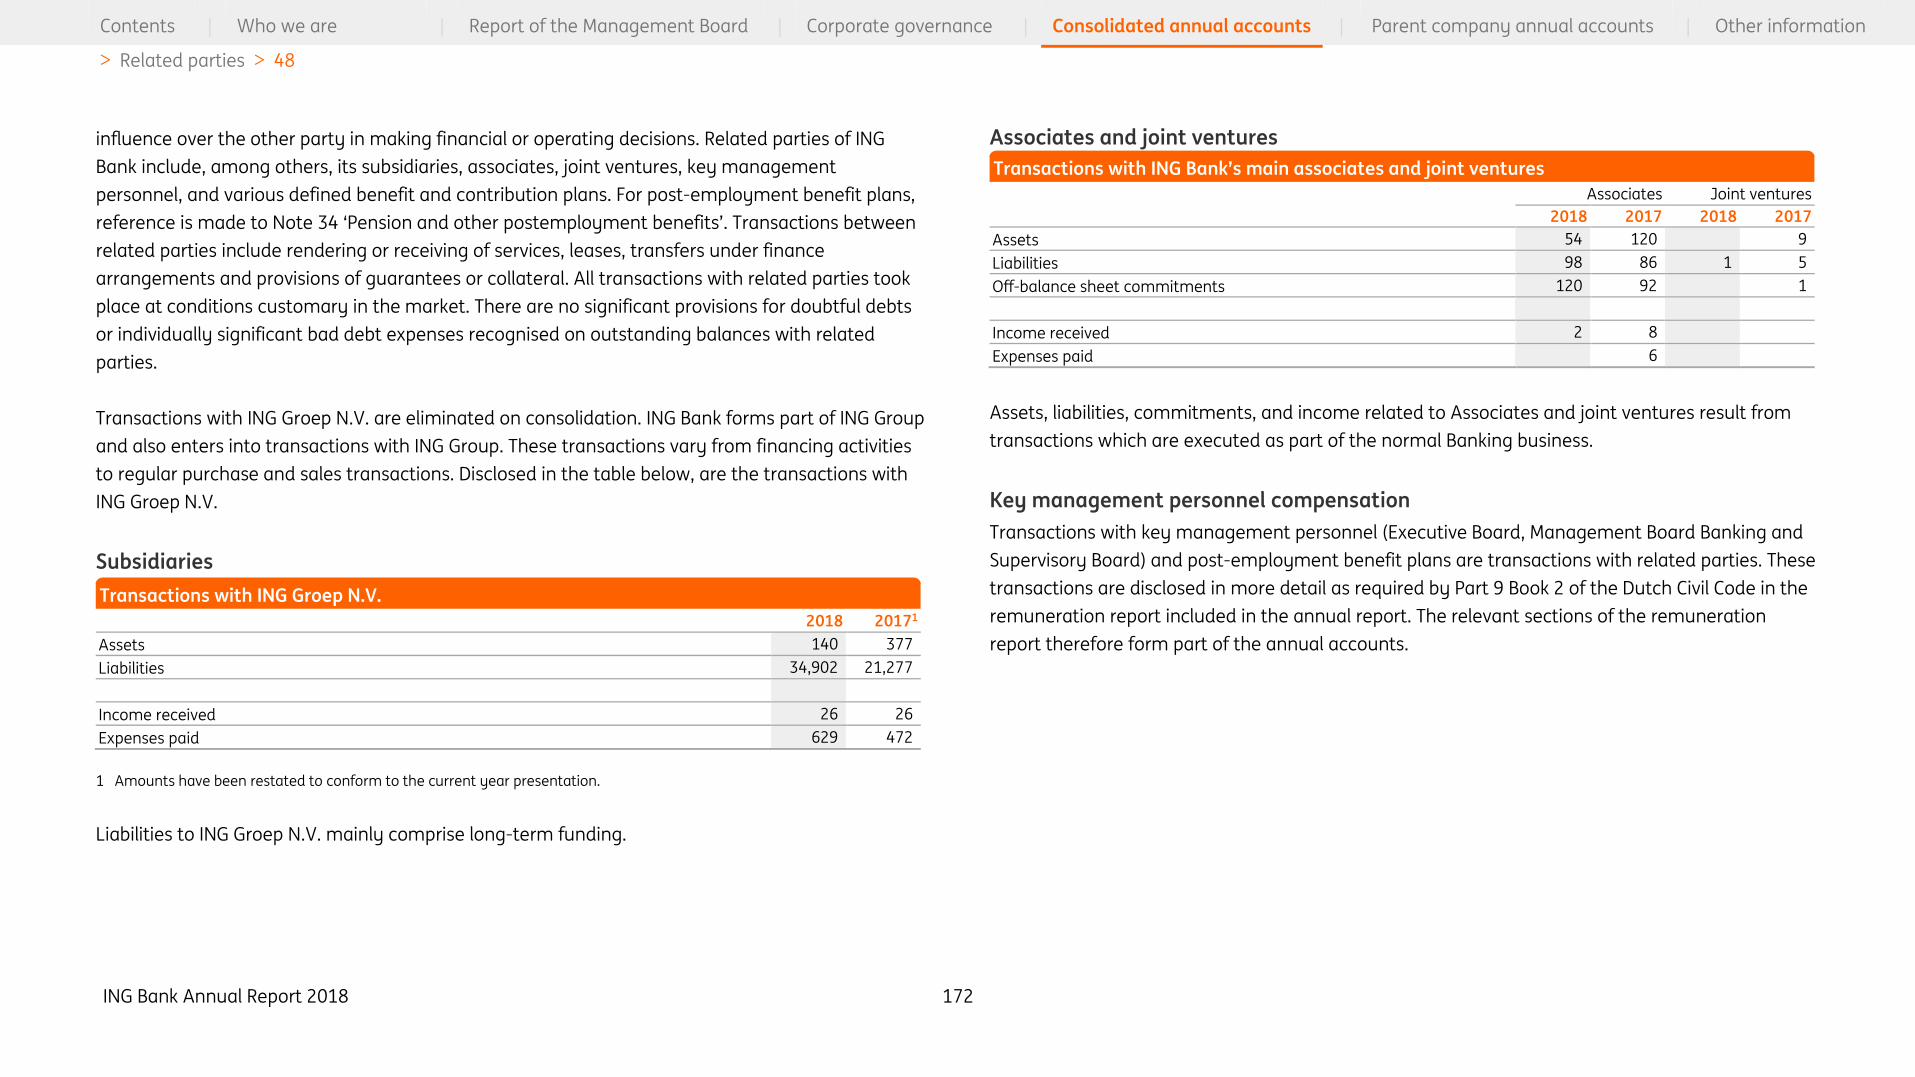
ING Bank Annual Report 2018 172
Contents | Who we are | Report of the Management Board | Corporate governance | Consolidated annual accounts | Parent company annual accounts | Other information
> Related parties > 48
influence over the other party in making financial or operating decisions. Related parties of ING
Bank include, among others, its subsidiaries, associates, joint ventures, key management
personnel, and various defined benefit and contribution plans. For post-employment benefit plans,
reference is made to Note 34 ‘Pension and other postemployment benefits’. Transactions between
related parties include rendering or receiving of services, leases, transfers under finance
arrangements and provisions of guarantees or collateral. All transactions with related parties took
place at conditions customary in the market. There are no significant provisions for doubtful debts
or individually significant bad debt expenses recognised on outstanding balances with related
parties.
Transactions with ING Groep N.V. are eliminated on consolidation. ING Bank forms part of ING Group
and also enters into transactions with ING Group. These transactions vary from financing activities
to regular purchase and sales transactions. Disclosed in the table below, are the transactions with
ING Groep N.V.
Subsidiaries
2018 20171
Assets 140 377
Liabilities 34,902 21,277
Income received 26 26
Expenses paid 629 472
1 Amounts have been restated to conform to the current year presentation.
Liabilities to ING Groep N.V. mainly comprise long-term funding.
Associates and joint ventures
Associates Joint ventures
2018 2017 2018 2017
Assets 54 120 9
Liabilities 98 86 1 5
Off-balance sheet commitments 120 92 1
Income received 2 8
Expenses paid 6
Assets, liabilities, commitments, and income related to Associates and joint ventures result from
transactions which are executed as part of the normal Banking business.
Key management personnel compensation
Transactions with key management personnel (Executive Board, Management Board Banking and
Supervisory Board) and post-employment benefit plans are transactions with related parties. These
transactions are disclosed in more detail as required by Part 9 Book 2 of the Dutch Civil Code in the
remuneration report included in the annual report. The relevant sections of the remuneration
report therefore form part of the annual accounts.
Transactions with ING Groep N.V.
Transactions with ING Bank’s main associates and joint ventures

ING Bank Annual Report 2018 173
Contents | Who we are | Report of the Management Board | Corporate governance | Consolidated annual accounts | Parent company annual accounts | Other information
> Related parties > 48
In 2018 and 2017, three members of the Executive Board of ING Groep N.V. were also members of
the Management Board Banking. The members of the Management Board Banking are considered
to be key management personnel and their compensation is therefore included in the tables below.
2018
in EUR thousands
Executive
Board of ING
Groep N.V.
Manage-
ment Board
Banking 1 Total
Fixed Compensation
– Base salary 4,157 3,672 7,829
– Collective fixed allowances2 1,191 990 2,181
– Pension costs 78 103 181
– Severance benefits3 602 602
Variable compensation4
– Upfront cash
– Upfront shares
– Deferred cash
– Deferred shares
– Other
Total compensation 6,028 4,765 10,793
1 Excluding members that are also members of the Executive Board of ING Groep N.V.
2 The collective fixed allowances consist of two savings allowances applicable to employees in the Netherlands; an individual
savings allowance of 3.5% and a collective savings allowance to compensate for loss of pension benefits with respect to
salary in excess of EUR 105,075.
3 Following the settlement agreement and in consultation with the Supervisory Board, the CFO stepped down from his
position as member of the Executive Board of ING Group on 7 February 2019. In line with applicable regulations a severance
payment was granted. The Supervisory Board has set the severance pay at a level of 50% of fixed annual pay.
4 No variable remuneration for 2018, as the members of the Executive Board and Management Board Banking volunteered to
forfeit their entitlement to variable remuneration immediately, following the settlement agreement with the Dutch Public
Prosecution Service as announced by ING on 4 September 2018.
2017
in EUR thousands
Executive
Board of ING
Groep N.V. 1
Manage-
ment Board
Banking2, 3 Total
Fixed Compensation
– Base salary 4,399 3,772 8,171
– Collective fixed allowances 4 1,418 1,180 2,598
– Pension costs 96 118 214
– Severance benefits 1,204 1,204
Variable compensation
Upfront cash 463 463
Upfront shares 226 485 711
Deferred cash 694 694
Deferred shares 339 728 1,067
Other
Total compensation 7,682 7,440 15,122
1 In 2017 two members left and two members joined the Executive Board. The table includes their compensation earned in
the capacity as Board members.
2 Excluding members that are also members of the Executive Board of ING Groep N.V.
3 In the Management Board Banking, excluding the Executive Board members, one member left and one member joined in
2017. The table includes their compensation earned in the capacity as Board members.
4 The collective fixed allowances consist of two savings allowances applicable to employees in the Netherlands; an individual
savings allowance of 3.5% and a collective savings allowance to compensate for loss of pension benefits with respect to
salary in excess of EUR 103,317.
in EUR thousands 2018 2017
Total compensation 1,032 1,022
The table above shows the fixed remuneration, expense allowances and attendance fees for the
Supervisory Board for 2018 and 2017.
Key management personnel compensation (Executive Board and Management Board Banking)
Key management personnel compensation (Executive Board and Management Board Banking)
Key management personnel compensation (Supervisory Board)
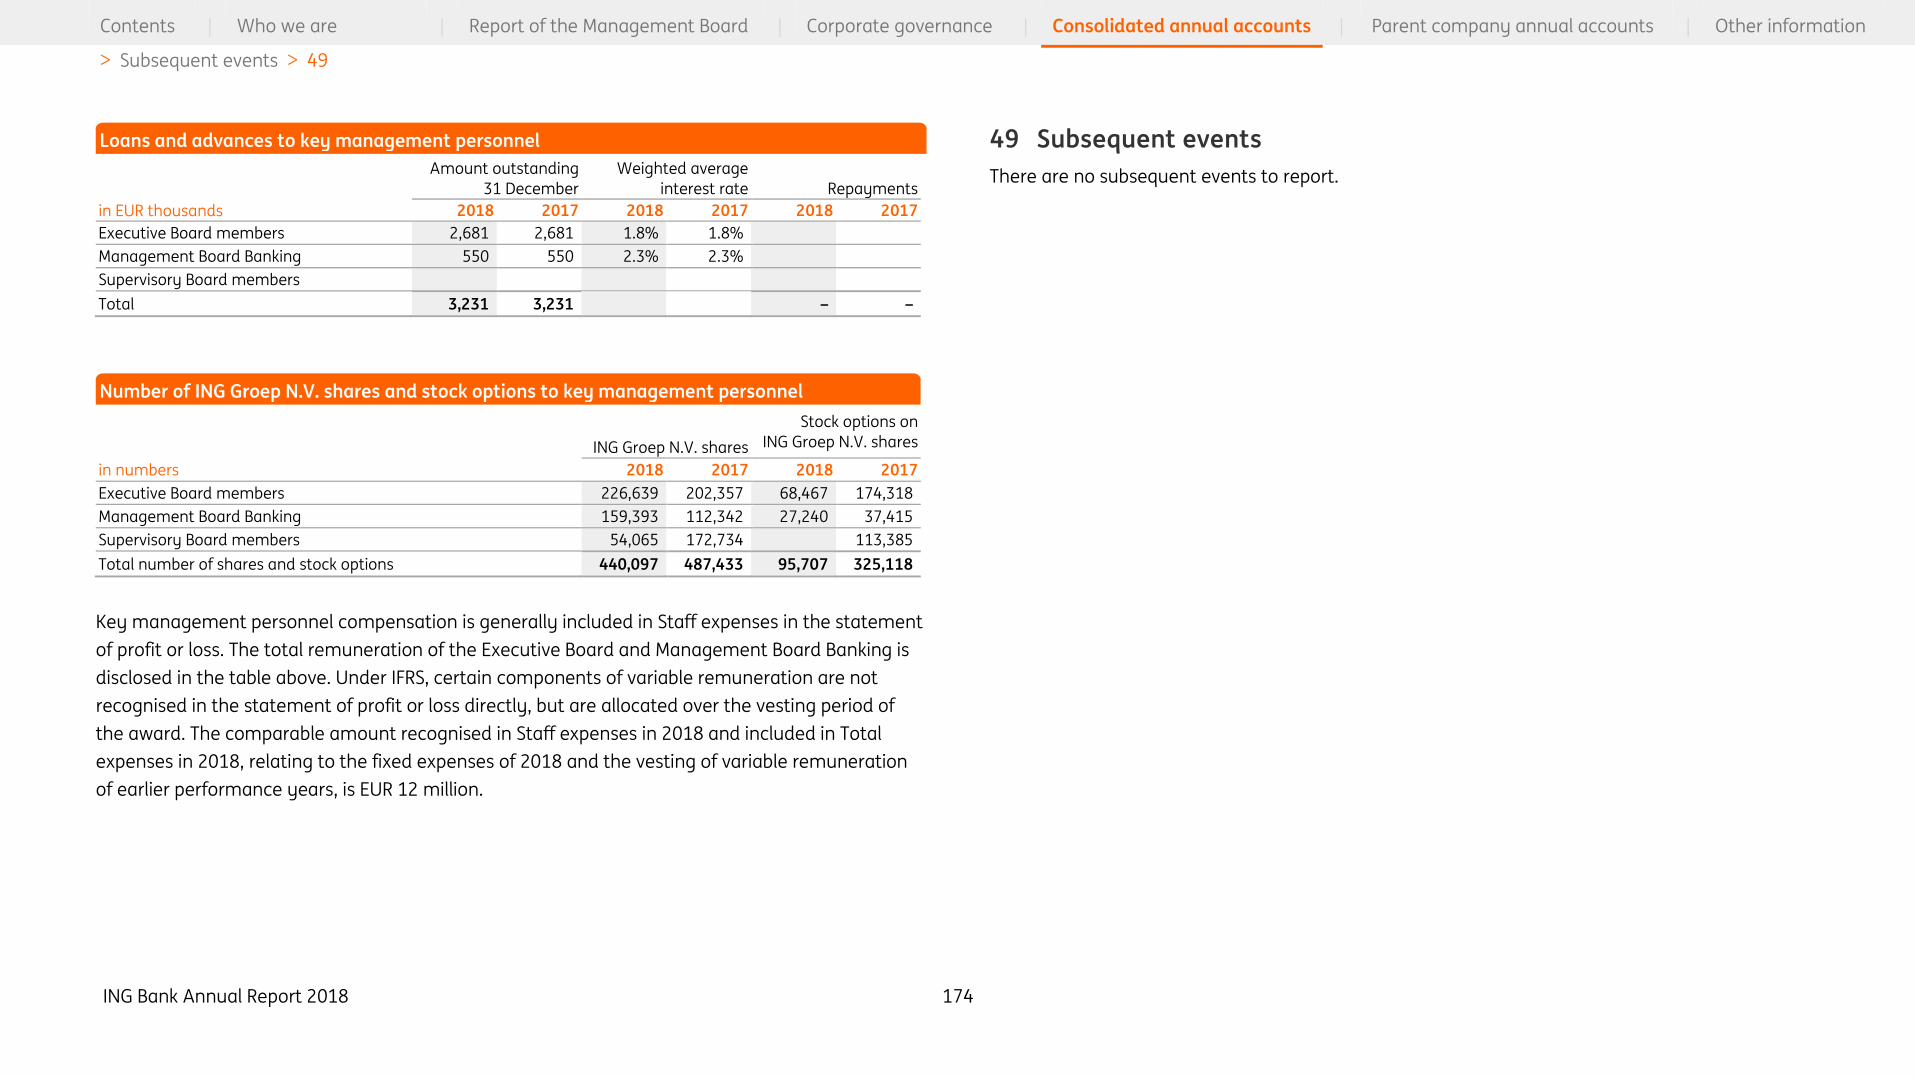
ING Bank Annual Report 2018 174
Contents | Who we are | Report of the Management Board | Corporate governance | Consolidated annual accounts | Parent company annual accounts | Other information
> Subsequent events > 49
Amount outstanding
31 December
Weighted average
interest rate Repayments
in EUR thousands 2018 2017 2018 2017 2018 2017
Executive Board members 2,681 2,681 1.8% 1.8%
Management Board Banking 550 550 2.3% 2.3%
Supervisory Board members
Total 3,231 3,231 – –
ING Groep N.V. shares
Stock options on
ING Groep N.V. shares
in numbers 2018 2017 2018 2017
Executive Board members 226,639 202,357 68,467 174,318
Management Board Banking 159,393 112,342 27,240 37,415
Supervisory Board members 54,065 172,734 113,385
Total number of shares and stock options 440,097 487,433 95,707 325,118
Key management personnel compensation is generally included in Staff expenses in the statement
of profit or loss. The total remuneration of the Executive Board and Management Board Banking is
disclosed in the table above. Under IFRS, certain components of variable remuneration are not
recognised in the statement of profit or loss directly, but are allocated over the vesting period of
the award. The comparable amount recognised in Staff expenses in 2018 and included in Total
expenses in 2018, relating to the fixed expenses of 2018 and the vesting of variable remuneration
of earlier performance years, is EUR 12 million.
49 Subsequent events
There are no subsequent events to report.
Loans and advances to key management personnel
Number of ING Groep N.V. shares and stock options to key management personnel
ING Bank Annual Report 2018 175
Contents | Who we are | Report of the Management Board | Corporate governance | Consolidated annual accounts | Parent company annual accounts | Other information
> Risk Management > 50
50 Risk Management
ING Bank Risk Management
As a global financial institution with a strong European base, offering banking services, ING is
exposed to a variety of risks. ING operates through a comprehensive risk management framework
and integrates risk management in its daily business activities and strategic planning. This
promotes the identification, measurement and control of risks at all levels of the organisation so
that ING Bank’s financial strength can be safeguarded. Taking measured risks is the core of ING’s
business.
Risk management supports the Management Board Banking in formulating the risk appetite,
strategies, policies, limits and provides a review, oversight and support function throughout ING on
risk-related items. The main financial risks ING is exposed to are credit risk (including transfer risk),
market risk (including interest rate, equity, real estate, credit spread, and foreign exchange risks),
funding & liquidity risk and business risk. Furthermore, ING is also exposed to non-financial risks,
e.g. operational and compliance risks. The ING Bank Chief Risk Officer (CRO) is also the CRO of ING
Bank. The way ING manages these risks on a day-to-day basis is described in this Risk Management
section.
The Risk Management section describes the key risks that arise from ING’s business model. It
explains how the risk management function is embedded within the organisation based on the
‘three lines of defence’. The key risks resulting from the bank’s business model are managed by
dedicated risk management departments, with various specific areas of expertise. The risk
management section provide qualitative and quantitative disclosures about credit, market, liquidity
and funding, business, operational and compliance risks.
Basis of disclosures
The risk management section is part of the notes to the consolidated financial statements in which
the nature and the extent of the risks as required by IFRS-EU standards are disclosed. This section
also includes additional disclosures beyond those required by IFRS-EU standards, such as certain
legal and regulatory disclosures. Not all information in this section can be reconciled back to the
primary financial statements and corresponding notes, as it has been prepared using risk and
capital data that differs to the accounting basis of measurement. Examples of such differences
include the exclusion of accrued interest and certain costs and fees from risk and capital data, and
timing differences in exposure values (IFRS 9 models report ECL on underlying exposures).
Disclosures in accordance with Part Eight of the CRR and CRD IV, and as required by the supervisory
authority, are published in our ‘Additional Pillar III Report’, which can be found on our corporate
website ing.com.
Purpose and business model
The purpose of ING’s risk management function is to support the ambition of ING to be the primary
bank for our customers, empowering the business through an integrated enterprise-wide risk
management platform. The following principles support this purpose:
• The risk management function is embedded in all levels of ING’s organisation and is part of the
daily business activities and strategic planning to have a sustainable competitive advantage;
• Products and portfolios are structured, underwritten, priced, approved and managed properly
and compliance with internal and external rules is monitored;
• Delegated authorities are consistent with the overall bank strategy and risk appetite; and
• Transparent communication is provided to internal and external stakeholders on risk
management.
Risk governance
Effective risk management requires firm-wide risk governance. ING’s risk and control structure is
based on the ‘three lines of defence’ governance model, whereby each line has a specific role and
defined responsibilities in such a way that the execution of tasks is separated from the control of
the same tasks. At the same time, they have to work closely together to identify, assess, and
mitigate risks. This governance framework is designed such that risk is managed in line with the risk
appetite as approved by the Management Board Banking (MBB), the EB and the SB, and is cascaded

ING Bank Annual Report 2018 176
Contents | Who we are | Report of the Management Board | Corporate governance | Consolidated annual accounts | Parent company annual accounts | Other information
> Risk Management > 50
throughout ING. The MBB is composed of the Management Board Banking of ING Bank and the
heads of the business lines.
The heads of ING’s business lines and their delegates form the first line of defence and have
primary accountability for the performance, operations, compliance, and effective control of risks
affecting their respective businesses. They originate loans, deposits, onboard clients, monitor
transactions and other products within applicable frameworks and limits, they need to know ING’s
customers and are best-positioned to act in both the customers’ and ING’s best interest. The COO is
responsible for proper security and controls on global applications and IT-platforms servicing the
Bank.
The second line of defence consists of oversight functions (a.o. Finance, Legal, HR, Risk) with a
major role for the risk management organisation headed by the Chief Risk Officer (CRO). Risk
Management is responsible for (i) the development of overall policies and guidance, (ii) objectively
challenge the execution, management, and control processes and (iii) coordinate the reporting of
risks and controls by the first line of defence. It also has an escalation/veto power in relation to
business activities that are judged to present unacceptable risks to ING.
The internal audit function forms the third line of defence. It provides an on-going independent (i.e.
outside of the businesses and the risk organisation) and objective assessment of the effectiveness
of internal controls of the first two lines, including financial and non-financial risk management.
The graph below illustrates the different key senior management level committees in place in the
risk governance structure.
Board level risk oversight
ING has a two-tier board structure consisting of a management board (Executive Board (EB) for ING
Group and Management Board Banking (MBB) for ING Bank) and the Supervisory Board (SB); both
tiers play an important role in managing and monitoring the risk management framework.
ING Bank Annual Report 2018 177
Contents | Who we are | Report of the Management Board | Corporate governance | Consolidated annual accounts | Parent company annual accounts | Other information
> Risk Management > 50
• The SB is responsible for supervising the policy of the EB and the MBB, the general course of
affairs of ING Bank, ING Bank and its business (including its financial policies and corporate
structure). For risk management purposes the SB is advised by two of its sub-committees:
• The Audit Committee, which assists the SB in monitoring the integrity of the financial statements
of ING Bank and ING Bank, in monitoring the compliance with legal and regulatory requirements,
and in monitoring the independence and performance of ING's internal and external auditors;
and
• The Risk Committee, which assists and advises the SB in monitoring the risk profile and approving
the overarching risk appetite of the company as well as the structure and effective operation of
the internal risk management and control systems.
• The EB is responsible for managing risks associated with all activities of ING Bank, whereas the
MBB is responsible for managing risks associated with all activities of ING Bank. The EB and MBB
responsibilities include ensuring that internal risk management and control systems are effective
and that ING Bank and ING Bank comply with relevant legislation and regulations. On a regular
basis, the EB and MBB report on these issues and discuss the internal risk management and
control systems with the SB. On a quarterly basis, the EB and MBB report on ING’s risk profile
versus its risk appetite to the Risk Committee, explaining changes in the risk profile.
As a member of the EB and the MBB, the CRO ensures that risk management issues are heard and
discussed at the highest level. The CRO steers a risk organisation both at head-office and business-
unit levels, which participates in commercial decision-making, bringing countervailing power to
keep the agreed risk profile within the risk tolerance. Every quarter, the CRO reports to the SB
committees on ING’s risk appetite levels and on ING’s risk profile. In addition, the CRO briefs the SB
committees on developments in internal and external risk related issues and ensures the SB
committees understand specific risk concepts.
Executive level
The key risk committees described below act within the overall risk policy and delegated authorities
granted by the MBB:
• Global Credit & Trading Policy Committee (GCTP) discusses and approves policies, methodologies,
and procedures related to credit, trading, country, and reputation (Environmental and Social Risk
or ESR) risks. The GCTP meets on a monthly basis. In addition, the Credit & Trading Risk Policy
Committee (CTRC) is the highest level body, with the exception of the GCTP and the Management
Board Banking, authorised to discuss and approve policies, methodologies, and procedures
related to Credit Risk;
• Global Credit Committee – Transaction Approval (GCC(TA)) discusses and approves transactions
which entail taking credit risk (including investment risk), country, legal, and ESR risk. The GCC(TA)
meets twice a week;
• Asset and Liability Committee Bank (ALCO Bank) discusses and steers, on a monthly basis, the
overall risk profile of all ING Bank’s balance sheet and capital management risks. ALCO Bank
discusses and approves policies, methodologies and procedures regarding solvency, market risk
in the banking book and funding and liquidity risks;
• Non-Financial Risk Committee Bank (NFRC Bank) is accountable for the design and maintenance
of the Non-Financial Risk Management Framework including Operational Risk Management,
Compliance and Legal policies, minimum standards, procedures and guidelines, development of
tools, methods, and key parameters (incl. major changes) for risk identification, measurement,
mitigating and monitoring/ reporting. The minimum frequency of the NFRC Bank is quarterly; and
• The Model Risk Management Committee (MoRMC) has been established to align overall model
strategy, model risk appetite, supporting model frameworks, policies and methodologies.
Regional and business unit level
ING’s regional and/or business unit management have primary responsibility for the management
of risks (credit, market, funding and liquidity, operational and compliance risks) that arise in their
daily operations. They are accountable for the implementation and execution of appropriate risk
frameworks affecting their businesses in order to comply with procedures and processes at the
corporate level. The implementation is adapted to local requirements, if necessary. The regional
and/or business unit CROs are involved in these activities. The local (regional and BU) CRO is
responsible for the analysis, control and management of risks across the whole value chain (from
front to back office). The local risks are discussed in local risk committees that roll-up to the key risk
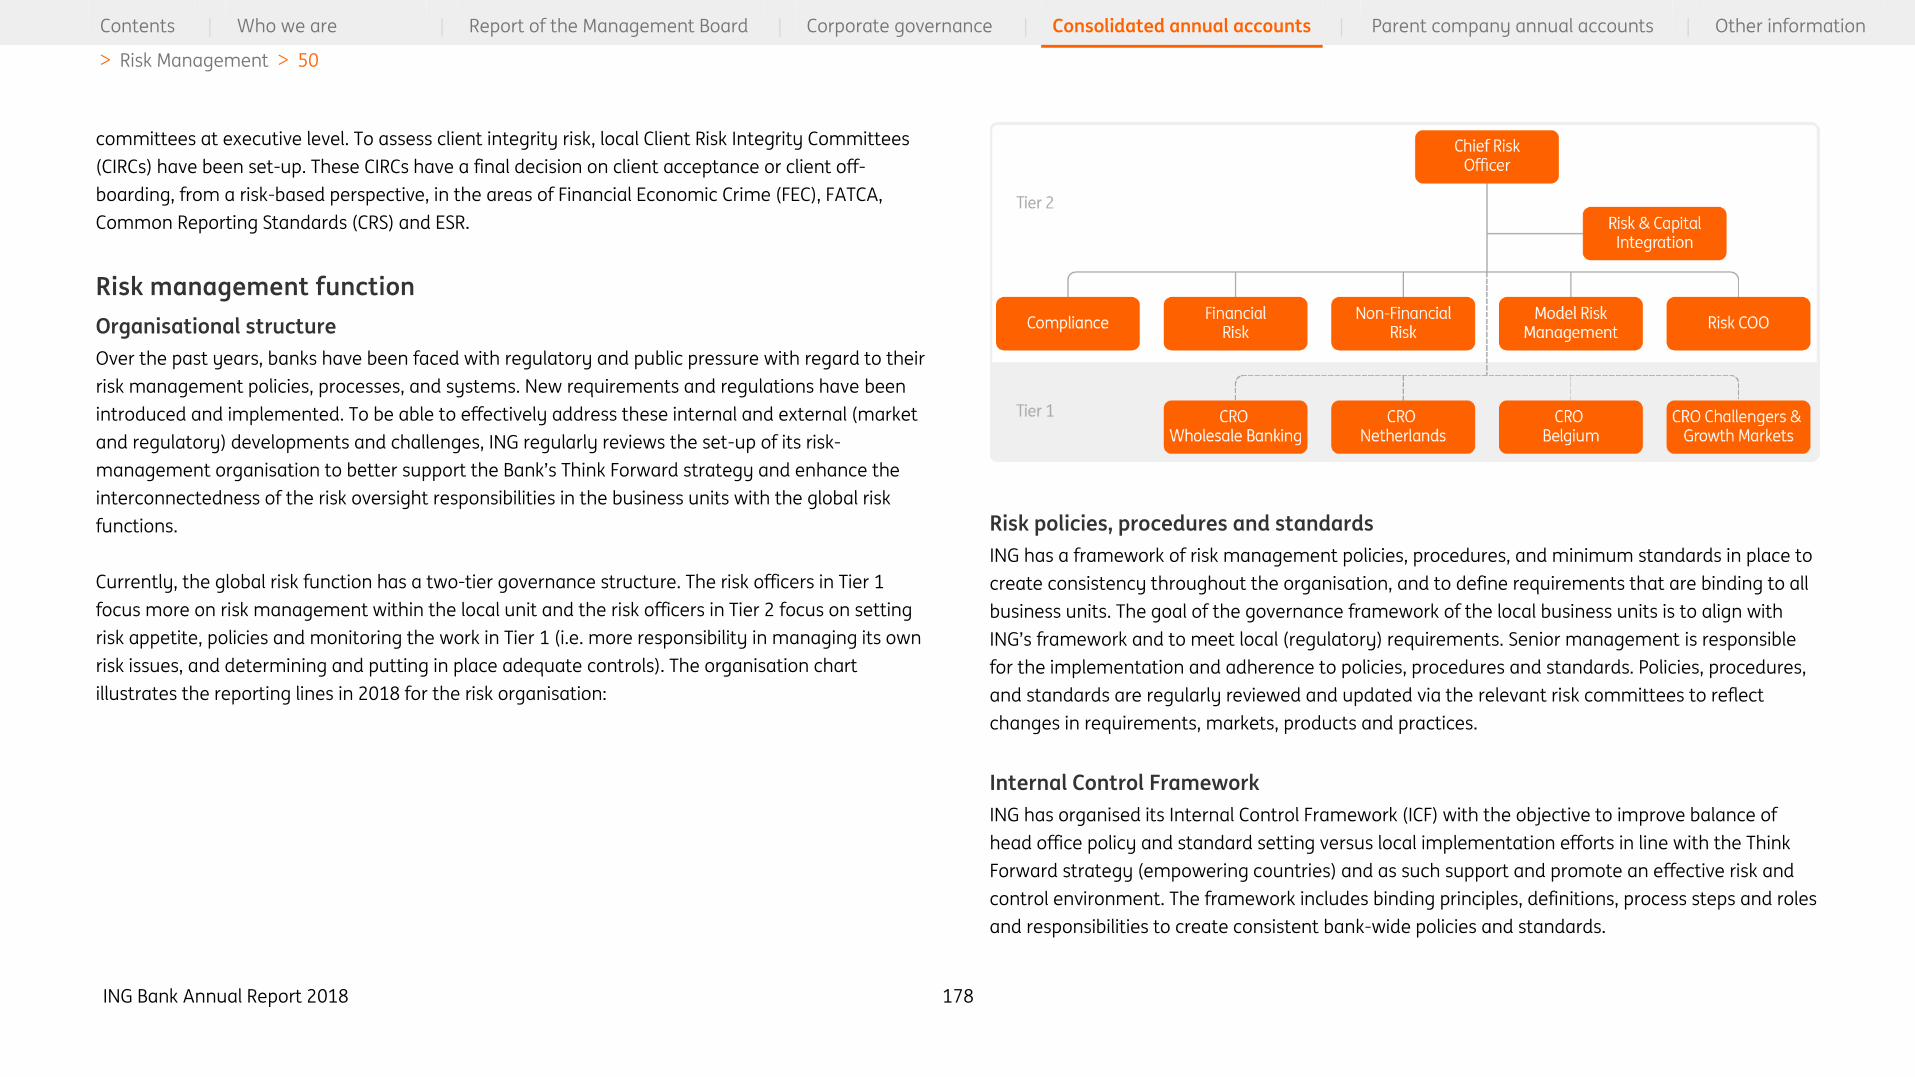
ING Bank Annual Report 2018 178
Contents | Who we are | Report of the Management Board | Corporate governance | Consolidated annual accounts | Parent company annual accounts | Other information
> Risk Management > 50
committees at executive level. To assess client integrity risk, local Client Risk Integrity Committees
(CIRCs) have been set-up. These CIRCs have a final decision on client acceptance or client off-
boarding, from a risk-based perspective, in the areas of Financial Economic Crime (FEC), FATCA,
Common Reporting Standards (CRS) and ESR.
Risk management function
Organisational structure
Over the past years, banks have been faced with regulatory and public pressure with regard to their
risk management policies, processes, and systems. New requirements and regulations have been
introduced and implemented. To be able to effectively address these internal and external (market
and regulatory) developments and challenges, ING regularly reviews the set-up of its risk-
management organisation to better support the Bank’s Think Forward strategy and enhance the
interconnectedness of the risk oversight responsibilities in the business units with the global risk
functions.
Currently, the global risk function has a two-tier governance structure. The risk officers in Tier 1
focus more on risk management within the local unit and the risk officers in Tier 2 focus on setting
risk appetite, policies and monitoring the work in Tier 1 (i.e. more responsibility in managing its own
risk issues, and determining and putting in place adequate controls). The organisation chart
illustrates the reporting lines in 2018 for the risk organisation:
Risk policies, procedures and standards
ING has a framework of risk management policies, procedures, and minimum standards in place to
create consistency throughout the organisation, and to define requirements that are binding to all
business units. The goal of the governance framework of the local business units is to align with
ING’s framework and to meet local (regulatory) requirements. Senior management is responsible
for the implementation and adherence to policies, procedures and standards. Policies, procedures,
and standards are regularly reviewed and updated via the relevant risk committees to reflect
changes in requirements, markets, products and practices.
Internal Control Framework
ING has organised its Internal Control Framework (ICF) with the objective to improve balance of
head office policy and standard setting versus local implementation efforts in line with the Think
Forward strategy (empowering countries) and as such support and promote an effective risk and
control environment. The framework includes binding principles, definitions, process steps and roles
and responsibilities to create consistent bank-wide policies and standards.

ING Bank Annual Report 2018 179
Contents | Who we are | Report of the Management Board | Corporate governance | Consolidated annual accounts | Parent company annual accounts | Other information
> Risk Management > 50
The scope of ICF is the development and maintenance or update of global internal control
documents: policies, minimum standards, product control frameworks, support control frameworks
and process-related control standards. These global documents are designed by head office
functions, that entities and support functions have to adhere to. Domain ownership of policies and
minimum standards is with the 2nd Line of Defence, whereas product and support control
frameworks are owned by the 1st Line of Defence and are approved by 2nd line of Defence. Process
control standards can be owned by both 1st and 2nd Line of Defence, related to the underlying
processes involved.
Domain owners are responsible for a specific risk domain and aim that their internal policies and
standards do not overlap with other documents. The ICF aims for single testing for multiple
purposes meaning that the same control should not have to be tested more than once for different
functions. This means that the test results of one control can be used for more than one sign-off.
The principal role of the independent ICF gatekeeper function is that of a quality assurance role and
provide advice for approval to the SB, EB, MBB and NFRC Bank. The ICF gatekeeper challenges the
alignment of the internal control documents with the agreed methodology and taxonomy and
verifies that the process of development and communication of internal control documents is
executed in adherence to the process as described below and is a guardian of the ICF binding
principles.
The process of developing internal control documents is standardised for each type of internal
control document. Domain owners should adhere to the standardised process, that includes the
following steps: domain owner identification, risk-based approach, impact assessment, approval
body and involvement of local entities for sounding on key and expected controls. The gatekeeper
oversees the steps above.
All policies, procedures and control standards are published on ING’s intranet and new and updated
documents are periodically communicated by means of a policy update to all country Chief
Executive Officers (CEO’s) and to heads of business departments.
Risk model governance and validation
Risk models are built according to ING’s internal risk modelling methodology standards and model
life cycle. After the review and documentation of each model by the Model Development (MD) and
Model Risk Management (MoRM) departments, dedicated risk committees approve new and
changed models. After approval by the applicable risk committee, and where necessary by the
regulator, the risk model is implemented. In addition, MoRM re-validates models on a regular basis.
Validation results and capital impacts are reported on a quarterly basis to senior management, the
risk committees, and to the supervisor.
The MoRM department is one of the cornerstones of ING’s risk model governance. The department
sets and maintains a model risk framework containing the (1) governance setting the
responsibilities, (2) the model risk appetite, (3) model risk management policies and standards as
well as (4) the model management inventory and tooling. MoRM monitors global model risk and
model performance.
Last but not least, the validation teams provide independent model validation which starts with the
determination that a model is appropriate for its intended use followed by an on-going process
whereby the reliability of the model is verified at different stages during its lifecycle: at conception,
before approval, periodically after implementation and when significant changes to the model are
made. The validation process contains a mix of developmental evidence assessment, process
verification and outcome analysis. When model validation identifies model risks, it provides
recommendations to address those.
Risk culture
The reputation and integrity of ING’s organisation are core elements to operate successfully in the
financial world. ING’s risk culture promotes awareness of collectively shared values, ideas and goals,
but also of potential threats and aligns the individual performance objectives with the short- and
long-term strategy. ING therefore aims to make risk responsibilities transparent within the different
levels of the organisation and hold every employee accountable for his/her actions.

ING Bank Annual Report 2018 180
Contents | Who we are | Report of the Management Board | Corporate governance | Consolidated annual accounts | Parent company annual accounts | Other information
> Risk Management > 50
Commonly seen as norms and traditions of behaviour of individuals and of groups within an
organisation, risk culture determines the way in which employees identify, understand, discuss,
and act on the risks the organisation is confronted with and the risks it takes. This is a continuous
long-term commitment and journey. In this respect, The Orange Code has been set as a
declaration of who we are. It describes what we can expect from each other when we turn up to
work each day. It is a set of standards that we collectively value, strive to live up to, and invite
others to measure us by.
The Orange Code is the sum of two parts, the ING Values and ING Behaviours, with integrity being
an important principle. The ING Values (being honest, prudent and responsible) are designed to be
non-negotiable promises we make to the world, principles we seek to stick to, no matter what. The
ING Behaviours (take it on and make it happen, help others to be successful, and be always a step
ahead) represent our way to differentiate ourselves. The Orange Code is embedded in
commitments we make to each other and the standards by which we will measure each other’s
performance.
To support the further embedding of risk culture into business practices, ING has initiated different
programmes and issued several guidelines. Risk awareness is to be alert to potential threats that
can occur during day-to-day business, which can be specific to the sector, the region or the clients
ING is doing business with. Part of the training curriculum to increase risk awareness is the
Promoting Integrity Programme (PIP), which is a long-term, global, educational, and behavioural
change programme supported by the EB and MBB for all ING employees. With the programme, ING
aims to gain a sound risk culture and that every employee in every part of the organisation
understands how his/her actions and behaviour can help earn and retain customer and stakeholder
trust. Additional modules with topics such as ‘Data@Risk’ (on dealing with data), ‘Let’s speak up’
and a KYC awareness module were added to the programme in 2018. To enhance risk awareness,
these topics are discussed between managers and employees through dialogue sessions that
managers organise within their teams to create a clear and consistent understanding of each
subject. The endorsement from the executive level and the emphasis on communication
strengthen the culture.
In addition to the above, a new Centre of Excellence (CoE) on Behavioural Risk was recently set up.
The purpose of this CoE is to strengthen ING’s management of risks by assessing behaviours within
our organisation that could potentially impact our reputation and performance. This CoE will be
responsible for carrying out assessments on risk behaviour to identify, analyse and intervene in
high-risk behaviours. These Behavioural Risk Assessments (BRAs) aim to accomplish the same
objective: to assess the risk culture within ING and to provide support in improving if needed.
In the Netherlands, employees of all financial institutions – and that includes ING – are required to
take the Banker’s Oath. This legal requirement came into force on 1 April 2015 as part of the joint
approach from all banks, known as ‘Future-oriented Banking.'
The introduction of social regulations, the revision of the Dutch Banking Code, and the
implementation of a Banker’s Oath (with the associated rules of conduct and disciplinary law), are a
way for Dutch banks to show society what they stand for and are accountable for, as both
individual banks and as a sector.
Lastly, ING aims to align its remuneration policy with its risk profile and the interests of all
stakeholders. For more information on ING’s compensation and benefits policies and its relation to
the risk taken, please refer to the “Capital Requirements Regulation (CRR) Remuneration disclosure”
published on the corporate website ing.com. https://www.ing.com/About-us/Annual-reporting-
suite.htm
Risk profile
This chart provides high level information on the risks arising from ING’s business activities.
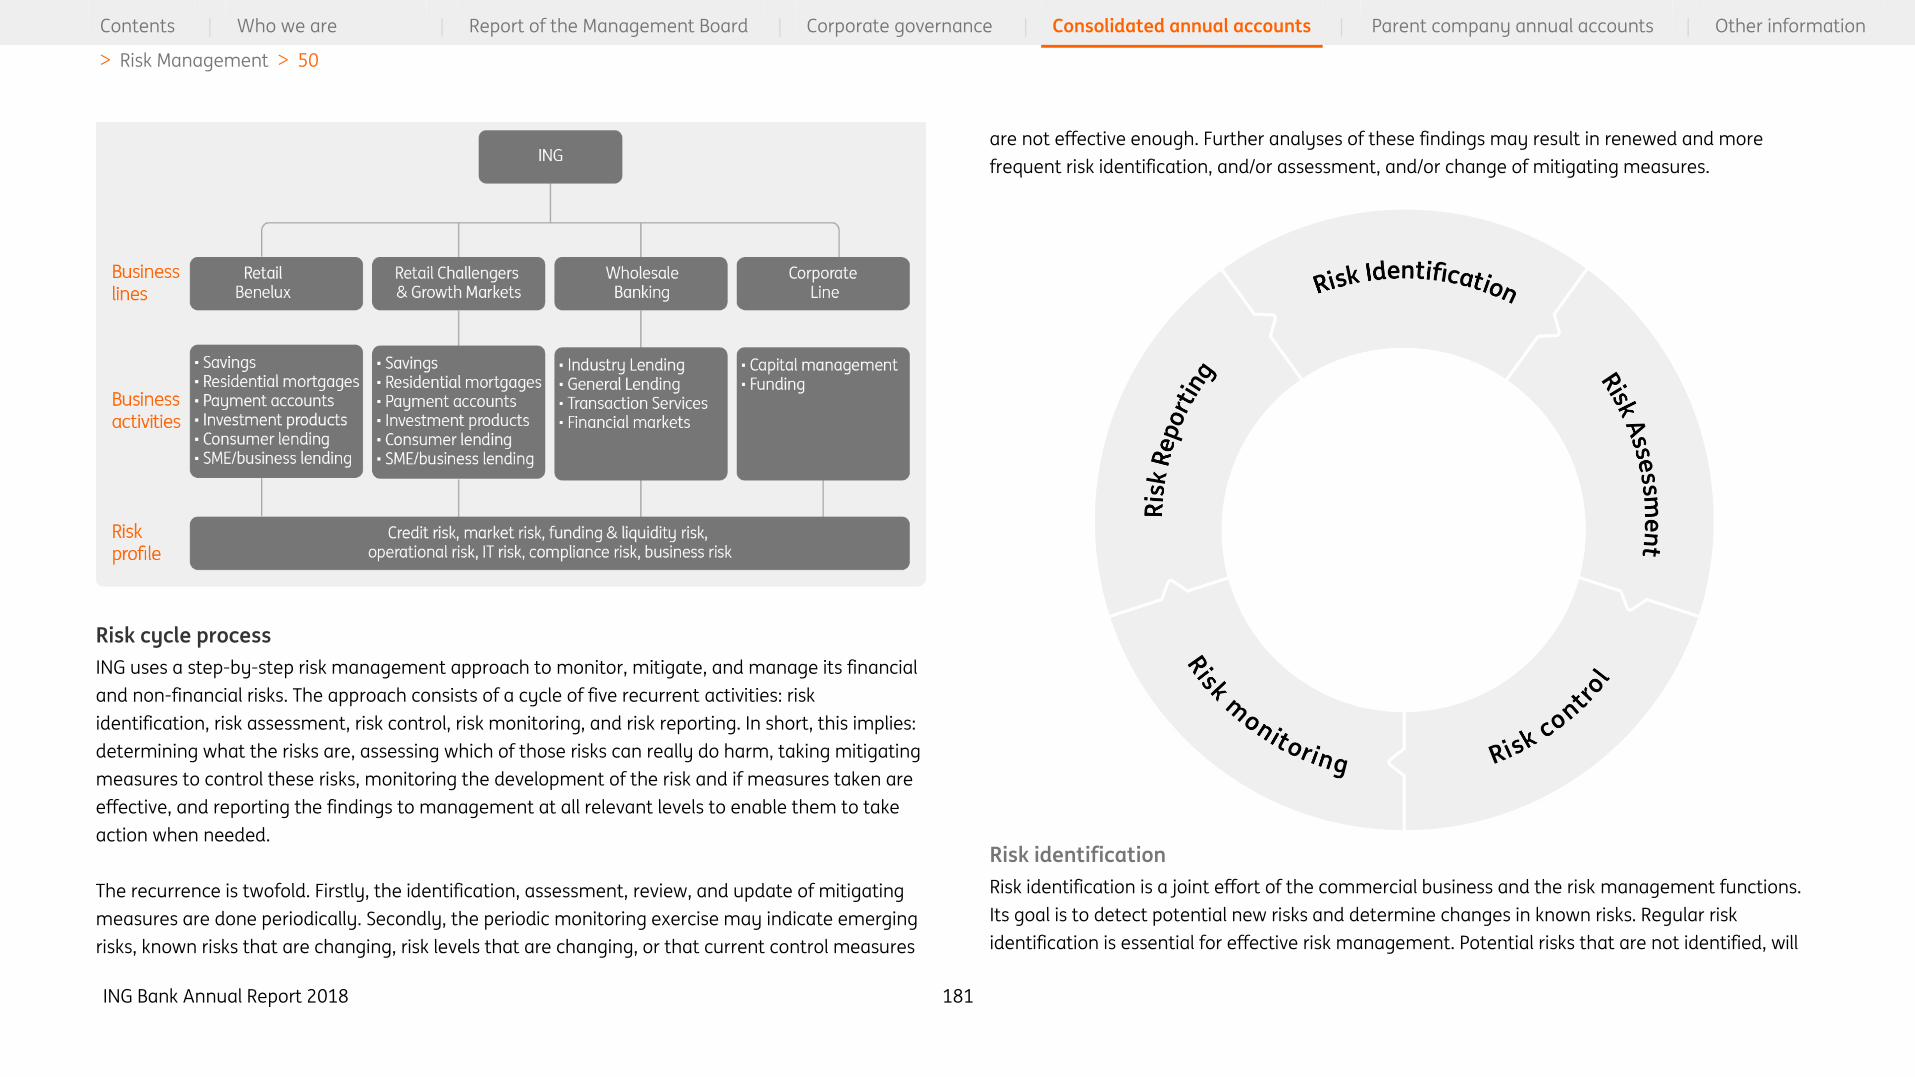
ING Bank Annual Report 2018 181
Contents | Who we are | Report of the Management Board | Corporate governance | Consolidated annual accounts | Parent company annual accounts | Other information
> Risk Management > 50
Risk cycle process
ING uses a step-by-step risk management approach to monitor, mitigate, and manage its financial
and non-financial risks. The approach consists of a cycle of five recurrent activities: risk
identification, risk assessment, risk control, risk monitoring, and risk reporting. In short, this implies:
determining what the risks are, assessing which of those risks can really do harm, taking mitigating
measures to control these risks, monitoring the development of the risk and if measures taken are
effective, and reporting the findings to management at all relevant levels to enable them to take
action when needed.
The recurrence is twofold. Firstly, the identification, assessment, review, and update of mitigating
measures are done periodically. Secondly, the periodic monitoring exercise may indicate emerging
risks, known risks that are changing, risk levels that are changing, or that current control measures
are not effective enough. Further analyses of these findings may result in renewed and more
frequent risk identification, and/or assessment, and/or change of mitigating measures.
Risk identification
Risk identification is a joint effort of the commercial business and the risk management functions.
Its goal is to detect potential new risks and determine changes in known risks. Regular risk
identification is essential for effective risk management. Potential risks that are not identified, will
ING Bank Annual Report 2018 182
Contents | Who we are | Report of the Management Board | Corporate governance | Consolidated annual accounts | Parent company annual accounts | Other information
> Risk Management > 50
not be controlled and monitored and may lead to surprises later. Known risks may have changed
over time and as a consequence the existing mitigating measures and monitoring may be
inadequate or obsolete.
Risk identification is performed periodically. In case of material internal or external change,
additional ad-hoc risk identification can be performed.
Risk assessment and control
Each identified risk is assessed to determine the importance, or risk level. This enables ING to decide
which of the identified risks need control measures and how strict or tolerant these measures
should be. Known risks are re-assessed to either confirm the risk level or detect change.
The importance of a risk is assessed based on the likelihood the risk materialises and the
subsequent financial or reputational impact that may occur should the risk arise. Unlikely risks with
a potentially high impact need to be controlled. A risk that is likely to happen regularly, but is
expected to have a modest financial impact, may not be mitigated and have the consequences
accepted based on the decision of business management.
Risks can be controlled by mitigating measures that either lower the likelihood the risk occurs or
that lower the impact when they occur. The ultimate measure to lower risk is to stop the activity or
service that causes the risk (risk avoidance). Risk controlling and mitigating measures are defined
and maintained at both the bank wide and local level.
Monitoring and reporting
By monitoring the risk control measures, ING checks if they are executed, complied with, have the
expected mitigating effects and follow the development of the risks and their risk levels. Risk
reporting provides senior and local management with information needed to manage risk.
Risk Appetite Framework
The ING Group Risk Appetite Framework (RAF) combines regulatory requirements, bottom-up risk
identification and assessment with the ING’s risk ambitions to set several overarching Risk Appetite
Statements. The ING RAF is embedded in the ING’s planning process via Risk Appetite Statements
that are used as a boundary for setting ING’s strategic and financial planning. An assessment how
these plans compare vis-à-vis these boundaries is part of the quarterly review cycle of the Dynamic
Planning (DP) process. In this planning process, overseen by the EB/MBB, detailed budgetary targets
and objectives are set on a rolling three year basis.
Process
The RAF is focused on setting the risk appetite at the consolidated level and across the different risk
categories, and provides the principles for cascading this risk appetite down into the organisation.
The RAF is approved by the SB on an annual basis, or more frequently if necessary, based on their
quarterly review in the EB, the MBB and the SB. It is therefore a top-down process, which bases itself
on the ambition of the bank in terms of its risk profile and is a function of the capital and liquidity
levels and ambitions, the regulatory environment, and the economic context. The set of limits used
are split based on the approval level needed for them. The limits that need SB approval are called
Boundary and the underlying metrics supporting the boundaries which need EB and MBB approval
are called instruments.
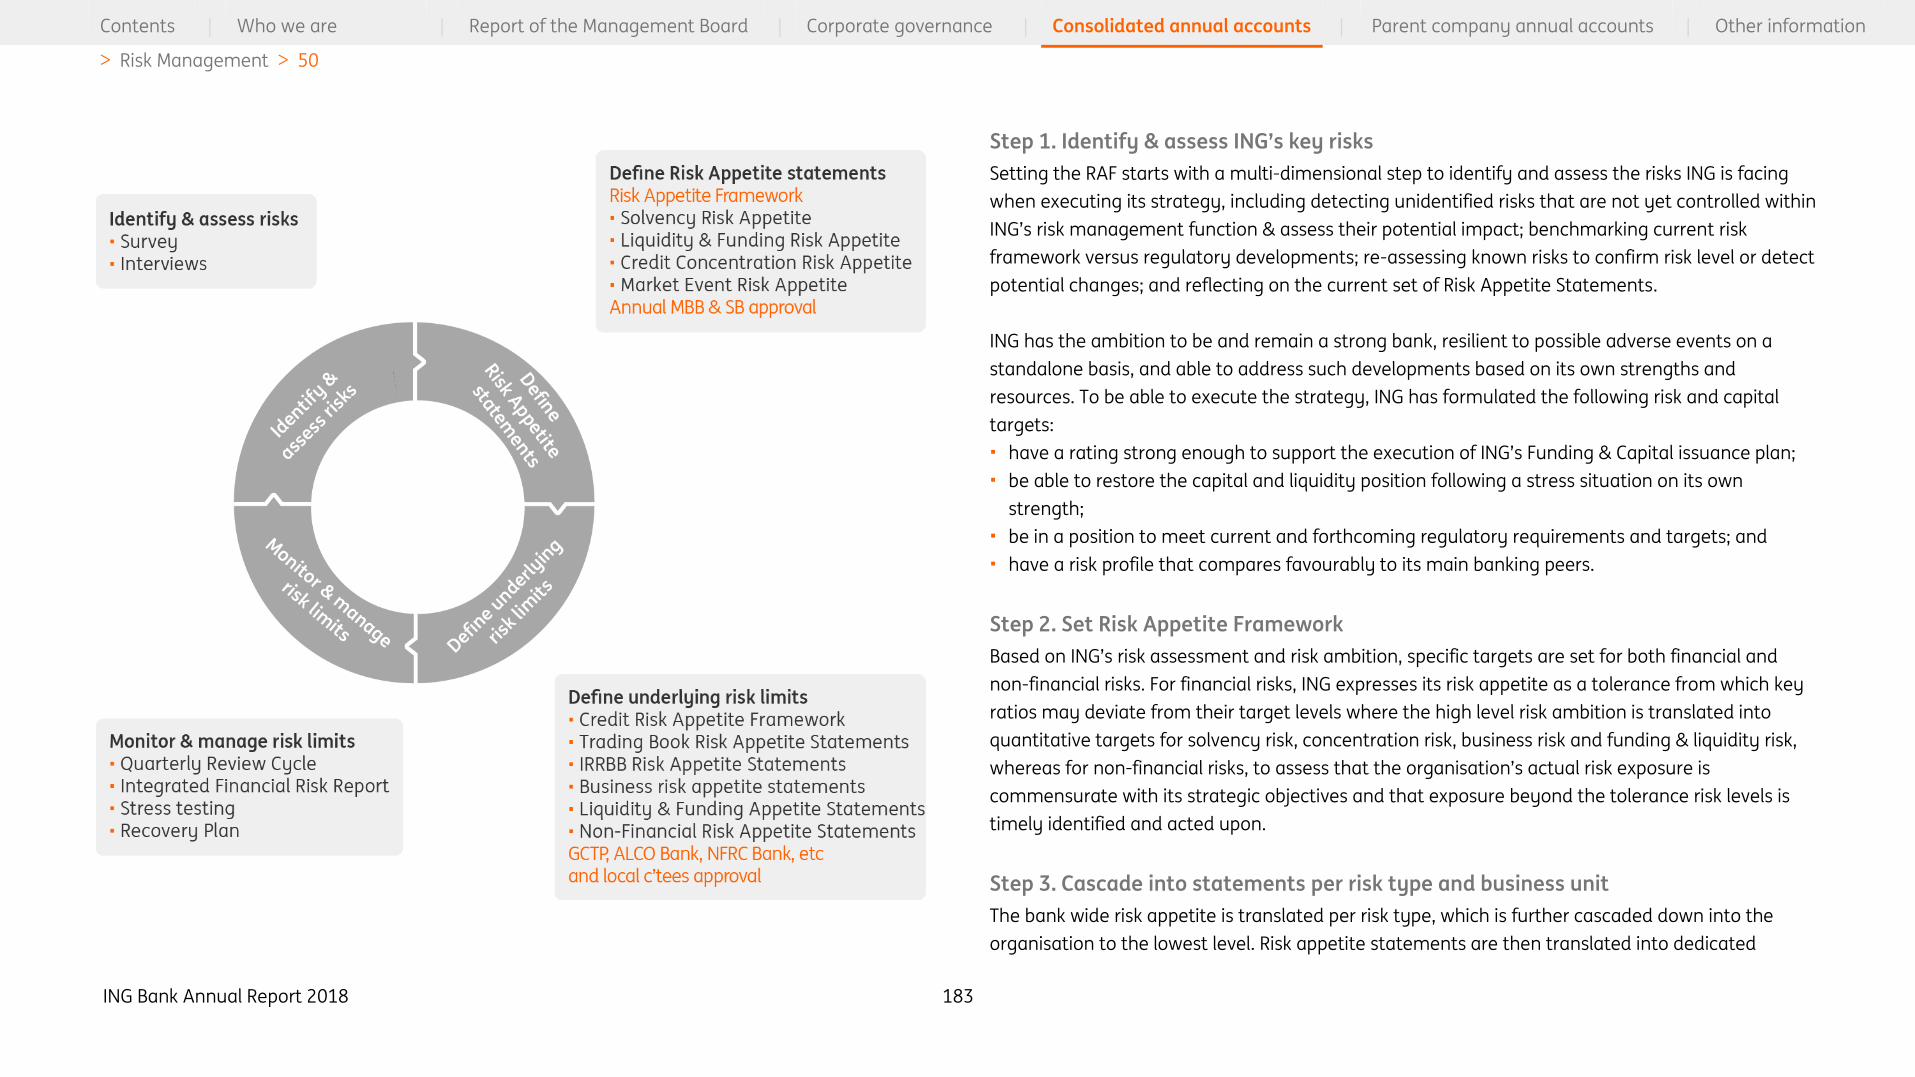
ING Bank Annual Report 2018 183
Contents | Who we are | Report of the Management Board | Corporate governance | Consolidated annual accounts | Parent company annual accounts | Other information
> Risk Management > 50
Step 1. Identify & assess ING’s key risks
Setting the RAF starts with a multi-dimensional step to identify and assess the risks ING is facing
when executing its strategy, including detecting unidentified risks that are not yet controlled within
ING’s risk management function & assess their potential impact; benchmarking current risk
framework versus regulatory developments; re-assessing known risks to confirm risk level or detect
potential changes; and reflecting on the current set of Risk Appetite Statements.
ING has the ambition to be and remain a strong bank, resilient to possible adverse events on a
standalone basis, and able to address such developments based on its own strengths and
resources. To be able to execute the strategy, ING has formulated the following risk and capital
targets:
• have a rating strong enough to support the execution of ING’s Funding & Capital issuance plan;
• be able to restore the capital and liquidity position following a stress situation on its own
strength;
• be in a position to meet current and forthcoming regulatory requirements and targets; and
• have a risk profile that compares favourably to its main banking peers.
Step 2. Set Risk Appetite Framework
Based on ING’s risk assessment and risk ambition, specific targets are set for both financial and
non-financial risks. For financial risks, ING expresses its risk appetite as a tolerance from which key
ratios may deviate from their target levels where the high level risk ambition is translated into
quantitative targets for solvency risk, concentration risk, business risk and funding & liquidity risk,
whereas for non-financial risks, to assess that the organisation’s actual risk exposure is
commensurate with its strategic objectives and that exposure beyond the tolerance risk levels is
timely identified and acted upon.
Step 3. Cascade into statements per risk type and business unit
The bank wide risk appetite is translated per risk type, which is further cascaded down into the
organisation to the lowest level. Risk appetite statements are then translated into dedicated
ING Bank Annual Report 2018 184
Contents | Who we are | Report of the Management Board | Corporate governance | Consolidated annual accounts | Parent company annual accounts | Other information
> Risk Management > 50
underlying risk limits which are used for the day-to-day monitoring and management of ING’s risks.
The suite of risk appetite statements serve as inputs for the MTP process as well as for the
establishment of key performance indicators and targets for senior management.
Step 4. Monitor and manage underlying risk limits
In order to verify that it remains within the risk appetite framework, ING reports its risk positions vis-
à-vis its limits on a regular basis to senior management committees. The Quarterly Risk Update
reflecting the exposure of ING against the risk appetite targets is submitted quarterly to the EB and
the MBB and to the (Risk Committee of the) SB.
Stress testing
Stress testing is an important risk management tool that provides input for strategic decisions and
capital planning. The purpose of stress testing is to assess the impact of plausible but severe stress
scenarios on ING’s capital and liquidity position. Stress tests provide insights into the vulnerabilities
of certain portfolios, with regards to adverse macroeconomic circumstances, stressed financial
markets, and changes in the (geo)political climate.
Types of stress tests
Within ING, different types of stress tests are performed. The most comprehensive type of stress
tests are the firm-wide scenario analyses, which involve setting scenario assumptions for all the
relevant macroeconomic and financial market variables in all countries relevant to ING. These
assumptions usually follow a qualitative narrative that provides a background to the scenario. In
addition to firm-wide scenario analyses, ING executes scenario analyses for specific countries or
portfolios. Furthermore, sensitivity analyses are performed, which focus on stressing one or more
risk drivers; usually without an underlying scenario narrative. Finally, ING performs reverse stress
tests, which aim to determine scenarios that could lead to a pre-defined severe adverse outcome.
Process
The stress testing process of ING consists of several stages, which are:
• Risk identification & risk assessment: It identifies & assesses the risks ING or the relevant entity is
facing when executing its strategy based on the current and possible future economic, political,
regulatory and technological environment. It provides a description of the main risks related to
the nature of ING’s business, activities and vulnerabilities.
• Scenario definition & parameterisation: Based on the outcome of the previous step, a set of
scenarios should be determined where the relevant scope and set of risk drivers is determined for
each scenario, as well as the severity, the key assumptions and input parameters. The output of
this phase includes a quantitative description of the stress scenarios to be analysed, the relevant
output metrics and, when applicable, a narrative description.
• Impact calculation and aggregation: Based on the quantitative description of the stress scenarios
determined in the previous step, the impact is determined for the relevant scenario, scope and
horizon. The impact calculation and aggregation can be part of a recurring process or are part of
a specific process set-up for one-off stress tests.
• Scenario reporting: For each stress test, a report is prepared after each calculation which
describes the results of the scenario, gives a recap of the scenario and its main assumptions and
parameters. It is complemented, if needed, with an advice for management action based on the
stress testing results.
• Scenario control & management assessment: Depending on the outcomes of the stress test and
the likelihood of the scenario, mitigating actions may be proposed. Mitigating actions may
include, but are not limited to, sales or transfers of assets and reductions of risk limits.
Methodology
Detailed and comprehensive models are used to calculate the impact of the scenarios. In these
models, statistical analysis is combined with expert opinion to make sure that the results
adequately reflect the scenario assumptions. The methodologies are granular and portfolio-specific
and use different macroeconomic and market variables as input variables. The calculations are in
line with the IFRS9 calculations and standards integrated in January 2018. The stress testing
models are subject to review by the Model Risk Management department.
ING Bank Annual Report 2018 185
Contents | Who we are | Report of the Management Board | Corporate governance | Consolidated annual accounts | Parent company annual accounts | Other information
> Risk Management > 50
Regulatory environment
After the turmoil in the financial markets and the subsequent need for governments to provide aid
to financial institutions, financial institutions have been under more scrutiny from the public,
supervisors and regulators. This has resulted in more stringent regulations intended to avoid future
crises in the financial system and taxpayer’s aid in the future.
Basel III revisions, CRR/CRD IV and upcoming regulations
In Europe, some changes are currently made to the CRR/CRD IV, among others the formal
introduction of the Leverage Ratio and of Pillar 2 Guidance. This will be implemented in EU
regulation through the CRR II / CRD V, which is expected to be formalised in the first half of 2019.
Next to this, in December 2017, the Basel III revisions were formally announced by the Basel
Committee on Banking Supervision (BCBS). These new prudential rules for banks consist of a revision
to the standardised approach to credit risk, the introduction of a capital floor based on
standardised approaches, the use of internal models, the limitation of options for modelling
operating risks, and new rules for the establishment of risk-weighted items and unused credit lines
at the banks. In Europe, this will be implemented through the CRR III / CRD VI in the coming years.
With this long implementation phase and the transposition into EU regulation still pending, some
question marks remain on how this will shape up.
Principles for Effective Risk Data Aggregation and Risk Reporting
The BCSB239 principles are applied in the group risk data and risk reporting chain. In addition, the
principles are incorporated in ING’s bank-wide internal control framework. This framework is rolled-
out bank-wide, expanding the application of the principles to key local entities (including D-Sibs)
and expanding the application to regulatory reporting. ING considers BCBS239 principles as part of
its continuous improvement initiatives such that the key risk data aggregation and reporting
practices align with the BCBS239 principles.
Targeted Review of Internal Models
In order to make capital levels more comparable and to reduce variability in banks’ internal models,
the European Central Bank (ECB) introduced the Targeted Review of Internal Models (TRIM) in June
2017 to assess the reliability and comparability between banks’ models. The TRIM aims to create a
level playing field by harmonising the regulatory guidance around internal models with the
ultimate goal to restore trust in European banks’ use of internal models. The TRIM is expected to be
finalised at the end of 2019 and could impact ING through more stringent regulation on internal
models as well as increases of RWA.
Top and emerging risks
The risks listed below are defined as material existing and emerging risks that may have a
potentially significant impact on our financial position or our business model. They may have a
material impact on the reputation of the company, introduce volatility in future operation results,
or impact ING’s medium and long-term strategy including the ability to pay dividends, maintain
appropriate levels of capital or meet liquidity and funding targets. An emerging risk is defined as a
risk that has the potential to have a significant negative effect on our performance, but whose
impact on the organisation is currently more difficult to assess than other risk factors that are not
identified as emerging risks.
The topics have emerged either as part of the annual Risk Assessment that is performed as part of
the Stress Testing Framework and the Risk Appetite Framework. The sequence in which the risks are
presented below is not indicative of their likelihood of occurrence or the potential magnitude of
their financial consequences.
During 2018, several changes were made to our top and emerging risks. The top risks in 2018 are
still related to cybercrime, Brexit negotiations, trade-restrictive measures and persistent low
interest rates in Eurozone. Also, climate change risk remains an emerging risk, reflecting the impact
a deterioration of the climate may have for the financial position and/or reputation of ING.
ING Bank Annual Report 2018 186
Contents | Who we are | Report of the Management Board | Corporate governance | Consolidated annual accounts | Parent company annual accounts | Other information
> Risk Management > 50
Macroeconomic developments
The economic environment was marked in 2018 by accelerated economic growth in the United
States, driven by fiscal stimulus, while it slowed in UK in light of continued uncertainty about the
UK’s future with the EU. In the Eurozone, the economic momentum slowed but remained strong.
Further, trade-restrictive measures were also sources of uncertainty. The persistence of a low
interest rate environment in Europe, where central banks held their rates at very low and even
negative levels in some countries, negatively impacted short-term as well as long-term market
rates. The persistence of both low interest-rate levels and the small difference between short
and long-term rates impact ING’s net interest income.
The decision of the United Kingdom and EU to agree regarding leave the European Union (‘Brexit’)
remains a major political and economic event that continues to effect sentiment. Brexit
negotiations took place throughout 2018 and the year ended without an agreement on how the UK
would leave the EU. ING continued to take steps throughout 2018 to prepare for various options,
such as applying for a banking licence in the UK, taking actions for contract continuity and working
to establish alternatives in the EU for those euro clearing activities that are expected to move from
London following Brexit. Economic growth in the UK has slowed against a background of continued
uncertainty about the future relationship with the European Union. Although ING has activities in
the UK through the Wholesale Banking (WB) business line, no material asset quality deterioration
following the Brexit decision has taken place.
Furthermore, pessimism about macro-economic developments such as economic and geo-political
situation in Turkey and a looming trade war between the US and China unsettled financial markets
and dampened consumer confidence in 2018. The trade-restrictive measures negatively affected
the economic growth in some key emerging markets (a.o. China). Further uncertainty about the
forthcoming budget in Italy led to a considerable increase in sovereign spreads and potential
economic recession. In this perspective, ING continued to carefully monitor international
developments.
Cybercrime
Cybercrime remains a continuous threat to companies in general and to financial institutions
specifically. Both the frequency and the intensity of attacks increase on a global scale. Threats from
Distributed Denial of Service (DDoS), targeted attacks (also called Advanced Persistent Threats) and
Ransomware have intensified worldwide. ING builds on its cybercrime resilience through its
dedicated Cyber Crime Expertise and Response Team, further enhancing the control environment
to protect, detect and respond to e-banking fraud, DDoS and targeted attacks. Additional controls
continue to be embedded in the organisation as part of the overall internal control framework and
are continuously reassessed against existing and new threats.
ING also works on strengthening its global cybercrime resilience including strong collaboration
against cybercrime with the financial industry, law enforcement authorities, government (e.g.
National Cyber Security Center) and Internet Service Providers (ISPs).
Climate change risk
The climate is changing and this is an unparalleled challenge to our world. The causes of climate
change are complex but ING understands that it is attributed directly or indirectly to anthropogenic
factors. As a financial institution, ING too has a responsibility to address climate-related risks which
may affect our clients or ING.
ING can play a role in financing solutions to climate change. In addition to investing billions of euros
in wind farms, solar energy and geothermal power production to support the energy transition, ING
will not only stop providing lending services to new coal-fired power plants and coal mines but also
accelerate the reduction of financing to thermal-coal power generation to close to zero by 2025.
Decisions like this have been informed by energy transition risk assessment as well as our own
internal climate ambition to steer our portfolio towards the goals of the Paris Agreement.
There are physical risks associated with climate change such as those caused by changes in the
frequency of extreme weather and rising sea levels. Climate-related damage resulting from storms,
hail and rain may not be insured in many regions and countries of the world where ING or its clients
may have business interests. There are also risks inherent to the transition to a low-carbon

ING Bank Annual Report 2018 187
Contents | Who we are | Report of the Management Board | Corporate governance | Consolidated annual accounts | Parent company annual accounts | Other information
> Risk Management > 50
economy and/or resulting from the implementation of the Paris Accord. These may impact the
financial sector as a result of transition policy and technological developments. The market for
green finance is also changing, creating new opportunities and threats. ING is working to improve
its understanding of physical and transition risks related to climate change. We are increasingly
aware of these risks and are taking steps in the right direction. For example, ING already
announced plans to achieve “greener” commercial real estate and mortgage portfolios. Another
example is the development of the Terra approach, where ING’s sector portfolios are compared
with relevant climate scenarios to identify gaps and inform strategy, will greatly contribute to this
process.
In order to have board-level oversight of strategic climate-related risk and opportunity
management, in 2018, ING established the Climate Change Committee (CCC). This executive
committee is chaired by ING’s CRO and co-chaired by the board member responsible for Wholesale
Banking. The CCC governs ING’s climate-related risk and opportunity management, strategy and
target-setting for the Group.
Credit risk
Introduction
Credit risk is the risk of loss from the default and/or credit rating deterioration of clients. Credit risks
arise in ING's lending, financial markets and investment activities. The credit risk section provides
information on how ING measures, monitors and manages credit risk and gives an insight into the
portfolio from a credit risk perspective.
Governance
Credit risk is a Tier 1 level risk function within ING and is part of the second line of defence. It is
managed within the CRO organisation by regional and/or business unit CROs, focusing on specific
risks in the geographical and/or business areas of their responsibilities. These are the CRO
Wholesale Banking (WB), CRO Challengers & Growth Markets (C&G), CRO Netherlands and CRO
Belgium. The Financial Risk department is a Tier 2 level risk function, which has oversight at a
consolidated level and is responsible for risk appetite setting, risk frameworks, model development
and policies.
ING’s credit risk strategy is to maintain an internationally diversified loan and bond portfolio,
avoiding large risk concentrations. The emphasis is on managing business developments within the
business lines by means of a top-down risk appetite framework, which sets concentration limits for
countries, individual clients, sectors, products, secondary risk (collateral/guarantees) and
investment activities. The aim is to support relationship-banking activities, while maintaining
internal risk/reward guidelines and controls.
Credit analysis at portfolio level is monitored using metrics such as economic capital, regulatory
capital, exposure at default (EAD), probability of default (PD) and loss given default (LGD). To target
effective use of ING’s capital, the risk appetite is monitored and managed at the portfolio level.
Credit analysis at the transactional level focuses on the risk amount, tenor, structure of the facility
and profile of the borrower. ING’s credit risk managers make use of publicly available information,
information provided by the client, transaction data of the client via ING account, peer group
comparisons, industry comparisons and quantitative techniques.
Within ING, the ultimate approval authority for credit proposals resides with the MBB. The MBB has
delegated authorities based on amounts, tenors and risk ratings to lower levels in the organisation.
Transactions are approved via a dual signatory approval system that requires an individual sign-off
from both front office and credit risk management. For larger and higher risk credits a committee
structure exists whereby the credit risk chair takes the final decision with advice from the respective
committee members, thereby ensuring accountability. Retail business units have delegated
authority to decide within policies and mandates approved by credit risk. Any decisions outside
those policies or above the delegated mandate require a specific credit risk approval.
The credit risk function encompasses the following activities:
• Measuring, monitoring and managing credit risks in the bank’s portfolio;

ING Bank Annual Report 2018 188
Contents | Who we are | Report of the Management Board | Corporate governance | Consolidated annual accounts | Parent company annual accounts | Other information
> Risk Management > 50
• Challenging and approving new and modified transactions and borrower reviews;
• Managing the levels of provisioning and risk costs, and advising on impairments; and
• Providing consistent credit risk policies, systems and tools to manage the credit lifecycle of all
activities.
The following committees are in place to review and approve transactions and policies from a credit
risk point of view:
• The GCTP is authorised to approve policies, methodologies and procedures related to credit,
trading, country and reputation risks on a high level for ING.
• The GCC(TA) is mandated to approve transactions with credit risks.
• The CTRC is authorised to approve policies, models, methodologies and procedures related to
credit risk on a more detailed and operational level (with the exception of issues which are
mandated to the GCTP).
• The Model Development Committee (MDC) serves as a technical advisor to the CTRC and is a
planning body for future model development. The committee has a delegated mandate to
approve credit risk models which cover smaller portfolios.
• The Model Risk Management Committee (MoRMC) has been established to align overall model
strategy, model risk appetite, supporting model frameworks, policies and methodologies.
• The ING Provisioning Committee (IPC) is the approval authority for loan loss provisions (LLP) for all
entities.
Credit risk categories
Credit risk uses the following risk categories to differentiate between the different types of credit
risk:
• Lending risk: arises when ING grants a loan to a client, or issues guarantees on behalf of a client.
This includes term loans, mortgages, revolving credits, overdrafts, guarantees, letters of credit,
etc. The risk is measured as the accounting value of the financial obligation that the client has to
repay to ING, excluding any accrued and unpaid interest, discount/premium amortisations or
impairments.
• Investment risk: is the credit default and risk rating migration risk that is associated with ING’s
investments in bonds, commercial paper, equities, securitisations, and other similar publicly
traded securities. This can be viewed as the worst-case loss that ING may incur as a result of
holding a position in underlying securities whose Issuer's credit quality deteriorates or defaults.
All investments in the banking book are classified in the investment risk category. The primary
purpose of ING’s investments in the banking books is for liquidity management.
• Money market (MM) risk: arises when ING places short-term deposits with a counterparty in
order to manage excess liquidity. As such, money market deposits tend to be short-term in
nature. In the event of a counterparty default, ING may lose the deposit placed. Money market
risk is measured as the accounting value of the deposit, excluding any accrued and unpaid
interest or the effect of any impairment.
• Pre-settlement (PS) risk: arises when a client defaults on a transaction before settlement and
ING has to replace the contract by a trade with another counterparty at the then prevailing
(possibly unfavourable) market price. This credit risk category is associated with derivatives
transactions (exchange traded derivatives, Over The Counter (OTC) derivatives and securities
financing transactions).
• Settlement risk: is the risk that arises when there is an exchange of value (funds or instruments)
for the same value date or different value dates and receipt is not verified or expected until after
ING has given irrevocable instructions to pay or has paid or delivered its side of the trade. The risk
is that ING delivers but does not receive delivery from its counterparty. ING manages settlement
risk in the same way as other risks including a risk limit structure per borrower. Due to the short
term nature (1 day), ING does not hold provisions or capital for specific settlement risk. Although
a relatively low risk, ING increasingly uses DVP (Delivery versus Payment) and safe settlement
payment techniques to reduce settlement risk.

ING Bank Annual Report 2018 189
Contents | Who we are | Report of the Management Board | Corporate governance | Consolidated annual accounts | Parent company annual accounts | Other information
> Risk Management > 50
For the reconciliation between credit risk outstandings categories and financial assets, refer to table below:
Credit risk categories Mainly relates to: Notes in the Annual Accounts
Lending risk -Cash and balances with central banks Note 2 Cash and balances with central banks
-Loans and advances to banks Note 3 Loans and advances to banks
-Loans and advances to customers Note 7 Loans and advances to customers
Note 4 Financial assets at fair value through profit or loss
Note 5 Financial assets at fair value through other comprehensive income
-Off-balance sheet items e.g. obligations under financial guarantees and letters of credit and undrawn
credit facilities Note 43 Contingent liabilities and commitments
Investment risk -Debt securities Note 4 Financial assets at fair value through profit or loss
-Equity securities Note 5 Financial assets at fair value through other comprehensive income
Note 6 Securities at amortised cost
Money market (MM) risk -Cash and balances with central banks Note 2 Cash and balances with central banks
-Loans and advances to banks Note 3 Loans and advances to banks
-Loans and advances to customers Note 7 Loans and advances to customers
Pre-settlement (PS) risk -Financial assets at fair value through profit or loss (trading assets and non-trading derivatives) Note 4 Financial assets at fair value through profit or loss
-Financial liabilities at fair value through profit or loss (trading assets and non-trading derivatives) Note 15 Financial liabilities at fair value through profit or loss
-Securities financing
Settlement risk -Financial assets at fair value through profit or loss (trading assets and non-trading derivatives) Note 4 Financial assets at fair value through profit or loss
-Financial liabilities at fair value through profit or loss (trading assets and non-trading derivatives) Note 11 Other assets
-Amounts to be settled Note 15 Financial liabilities at fair value through profit or loss
Note 17 Other liabilities
Reconciliation between credit risk categories and financial position
ING Bank Annual Report 2018 190
Contents | Who we are | Report of the Management Board | Corporate governance | Consolidated annual accounts | Parent company annual accounts | Other information
> Risk Management > 50
Credit Risk Appetite and Concentration Risk Framework
The credit risk appetite and concentration risk framework is designed to prevent undesired high
levels of credit risk and credit concentrations within various levels of the ING portfolio. It is derived
from the concepts of boundaries and instruments as described in the Risk Appetite Framework.
Credit risk appetite and concentration risk boundaries and instruments are set and reviewed on an
annual basis and require approval from the MBB, EB or SB.
Credit risk appetite statements
Credit risk appetite is the maximum level of credit risk ING is willing to accept for growth and value
creation. The credit risk appetite is linked to the overall bank-wide risk appetite framework. The
credit risk appetite is expressed in quantitative and qualitative measures. Having a credit risk
appetite achieves:
• Clarity about the credit risks that ING is prepared to assume, target setting and prudent risk
management;
• Consistent communication to different stakeholders;
• Guidelines on how to align reporting and monitoring tools with the organisational structure and
strategy; and
• Alignment of business strategies and key performance indicators of business units to ING’s credit
risk appetite by means of the Dynamic Planning.
Credit risk appetite is present across different levels within ING, at portfolio level as well as
transaction level. The various credit risk appetite components at the portfolio and transaction levels
together result in the credit risk appetite framework.
The credit risk appetite and concentration risk framework is composed of:
• Country risk concentration: Country risk is the risk that arises due to events in a specific country
(or group of countries). In order to manage the maximum country event loss ING is willing to
accept, boundaries are approved by the SB that ensure ING’s consolidated 3-year average result
before tax can absorb an estimated country event loss due to a country risk occurrence. The
estimated level is correlated to the risk rating assigned to a given country. By means of
instruments, actual country limits are set (each of which should not exceed the country’s
boundary), reviewed monthly and updated when needed. In the case of countries with elevated
levels of geopolitical or severe economic cycle risk, the monitoring is performed on a more
frequent basis with strict pipeline and exposure management to protect ING from adverse
impacts.
• Single name and industry sector concentration: Using the same concepts of boundaries and
instruments mentioned earlier, ING has established a concentration risk framework in order to
identify, measure and monitor single name concentration and industry sector concentration
(systemic risk).
• Product and secondary risk concentration: In addition, ING has established a concentration
framework to identify, measure and monitor product concentration and secondary risk
• Scenarios and stress tests: Stress testing evaluates ING’s financial stability under severe, but
plausible stress scenarios, and supports decision-making that assures ING remains a financially
going concern even after a severe event occurs. In addition to the bank-wide stress testing
framework as described in the Risk Management section, ING performs regularly sensitivity
analysis in order to assess portfolio risks and concentrations. These sensitivity analysis are
consistent with the stress scenario established in the group wide credit risk appetite framework.
• Product approvals: the product approval and review process is implemented to assess and
manage risks associated with the introduction of new or modified products. It safeguards that
sound due diligence is performed by relevant stakeholders and to have the relevant risks (credit,
operational, compliance, etc.) adequately addressed in the Product Approval and Review Process
(PARP).
• Sector policies: being detailed analyses of defined products and/or industries. They identify the
major risk drivers and mitigants, the internal business mandate, and propose the minimum risk
(including business) parameters – and potentially the maximum product and/or portfolio limit -
to undertake that business. A sector policy is always prepared by the front office responsible for
the internal business mandate and requires an approval from the designated approval authority.
Sector policies may carry various names and/or may have geographical and/or business
limitations (e.g. local vs global).
ING Bank Annual Report 2018 191
Contents | Who we are | Report of the Management Board | Corporate governance | Consolidated annual accounts | Parent company annual accounts | Other information
> Risk Management > 50
• Reference benchmarks: being the maximum appetite of credit risk per legal one obligor group. It
is expressed as a (benchmark) exposure at the concentration risk level, which corresponds to
(maximum) internal capital consumption for credit risk. It is used as a reference amount in the
credit approval process and can be waived on the basis of proper credit risk arguments.
• Credit approval process: The purpose of the credit approval process is that individual transactions
and the risk associated with these transactions are assessed on a name-by-name basis. For each
type of client there is a dedicated process with credit risk managers specialised along the
business lines of ING. The credit approval process is supported by a risk rating system and
exposure monitoring system. Ratings are used to indicate a client’s creditworthiness which
translates into a probability of default. This is used as input to determine the maximum risk
appetite that ING has for a given type of client (reference benchmark). The determination of the
delegated authority (the amount that can be approved at various levels of the organisation) is a
function of the risk rating of the client and ING’s credit risk exposure on the client.
Given the nature of the retail business, roles and responsibilities of the local credit risk policy are
delegated to local retail credit risk management. However, the global retail risk policy prescribes
no-go criteria and minimum standards for underwriting. Lending standards, including material
changes to those standards, should be approved by the global head of retail risk.
Environmental and Social Risk Framework
ING makes a positive contribution to global economic growth and sustainable development by
promoting responsible lending and investment practices. The ESR policy framework incorporates
assessment tools that are used in ING’s mainstream processes and systems. It is therefore fully
integrated into regular client and transaction reviews.
The ESR policy framework is reviewed every three years on the basis of significant changes
identified in the sectors that are more vulnerable to environmental and social risks and impacts. In
2018, a full review of the ESR policy framework was conducted to achieve more clarity on the
scope, governance and due diligence. This was done with the active participation of internal
stakeholders (per industry sector) and guidance from external stakeholders (clients, peer banks and
NGOs). The updated ESR policy framework is scheduled to be implemented in early Q2 2019, similar
to the publication on ing.com.
Environmental and social risks for all lending transactions are reviewed during the periodic credit
reviews. ESR transactions, where funds will be used for asset based finance, may require enhanced
ESR due diligence e.g. application of the Equator Principles. Such enhanced ESR evaluation is also
required for any high-risk transaction, such as those that impact indigenous people etc.
As the risk assessment activities are performed globally, each team involved must be familiar with
ING’s environmental and social framework. Hence, ING makes a significant investment in internal
training programs to help CDUs, front office and risk management staff in assessing environmental
and social risks.
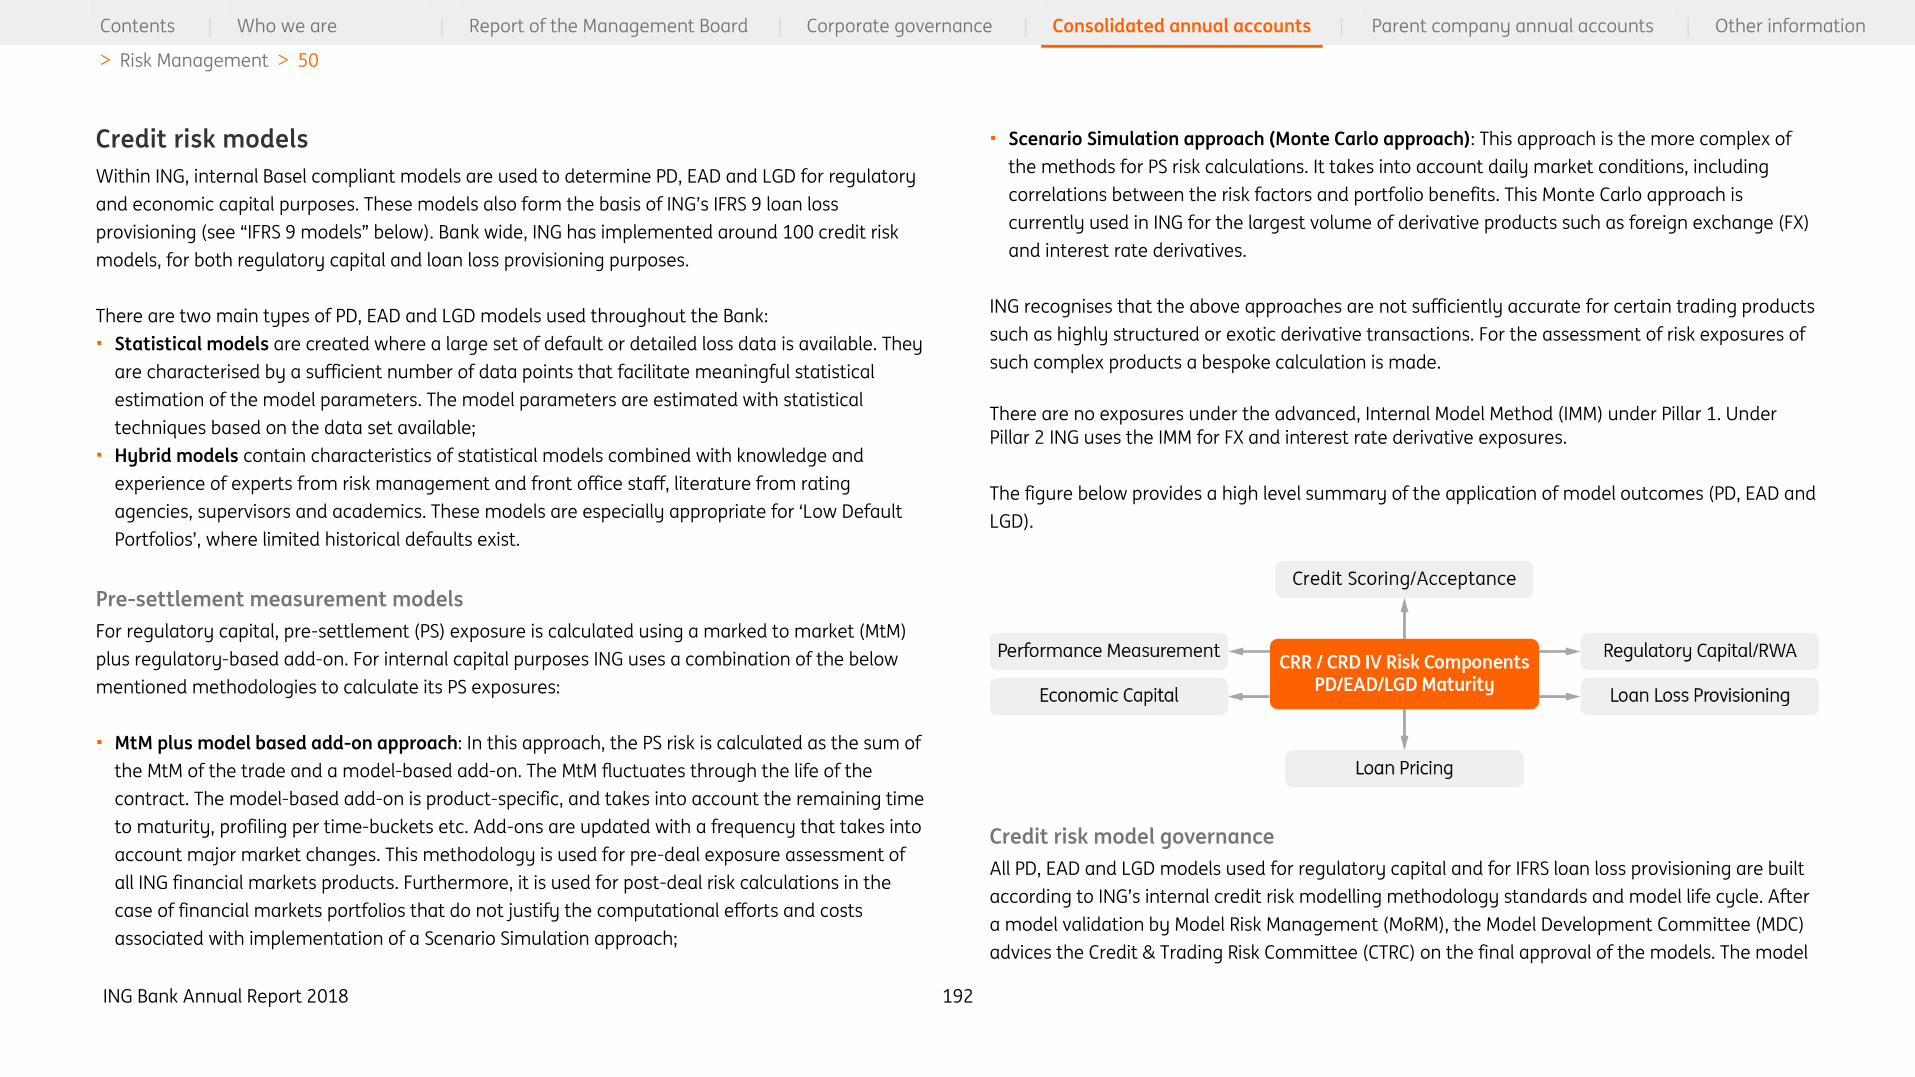
ING Bank Annual Report 2018 192
Contents | Who we are | Report of the Management Board | Corporate governance | Consolidated annual accounts | Parent company annual accounts | Other information
> Risk Management > 50
Credit risk models
Within ING, internal Basel compliant models are used to determine PD, EAD and LGD for regulatory
and economic capital purposes. These models also form the basis of ING’s IFRS 9 loan loss
provisioning (see “IFRS 9 models” below). Bank wide, ING has implemented around 100 credit risk
models, for both regulatory capital and loan loss provisioning purposes.
There are two main types of PD, EAD and LGD models used throughout the Bank:
• Statistical models are created where a large set of default or detailed loss data is available. They
are characterised by a sufficient number of data points that facilitate meaningful statistical
estimation of the model parameters. The model parameters are estimated with statistical
techniques based on the data set available;
• Hybrid models contain characteristics of statistical models combined with knowledge and
experience of experts from risk management and front office staff, literature from rating
agencies, supervisors and academics. These models are especially appropriate for ‘Low Default
Portfolios’, where limited historical defaults exist.
Pre-settlement measurement models
For regulatory capital, pre-settlement (PS) exposure is calculated using a marked to market (MtM)
plus regulatory-based add-on. For internal capital purposes ING uses a combination of the below
mentioned methodologies to calculate its PS exposures:
• MtM plus model based add-on approach: In this approach, the PS risk is calculated as the sum of
the MtM of the trade and a model-based add-on. The MtM fluctuates through the life of the
contract. The model-based add-on is product-specific, and takes into account the remaining time
to maturity, profiling per time-buckets etc. Add-ons are updated with a frequency that takes into
account major market changes. This methodology is used for pre-deal exposure assessment of
all ING financial markets products. Furthermore, it is used for post-deal risk calculations in the
case of financial markets portfolios that do not justify the computational efforts and costs
associated with implementation of a Scenario Simulation approach;
• Scenario Simulation approach (Monte Carlo approach): This approach is the more complex of
the methods for PS risk calculations. It takes into account daily market conditions, including
correlations between the risk factors and portfolio benefits. This Monte Carlo approach is
currently used in ING for the largest volume of derivative products such as foreign exchange (FX)
and interest rate derivatives.
ING recognises that the above approaches are not sufficiently accurate for certain trading products
such as highly structured or exotic derivative transactions. For the assessment of risk exposures of
such complex products a bespoke calculation is made.
There are no exposures under the advanced, Internal Model Method (IMM) under Pillar 1. Under
Pillar 2 ING uses the IMM for FX and interest rate derivative exposures.
The figure below provides a high level summary of the application of model outcomes (PD, EAD and
LGD).
Credit risk model governance
All PD, EAD and LGD models used for regulatory capital and for IFRS loan loss provisioning are built
according to ING’s internal credit risk modelling methodology standards and model life cycle. After
a model validation by Model Risk Management (MoRM), the Model Development Committee (MDC)
advices the Credit & Trading Risk Committee (CTRC) on the final approval of the models. The model
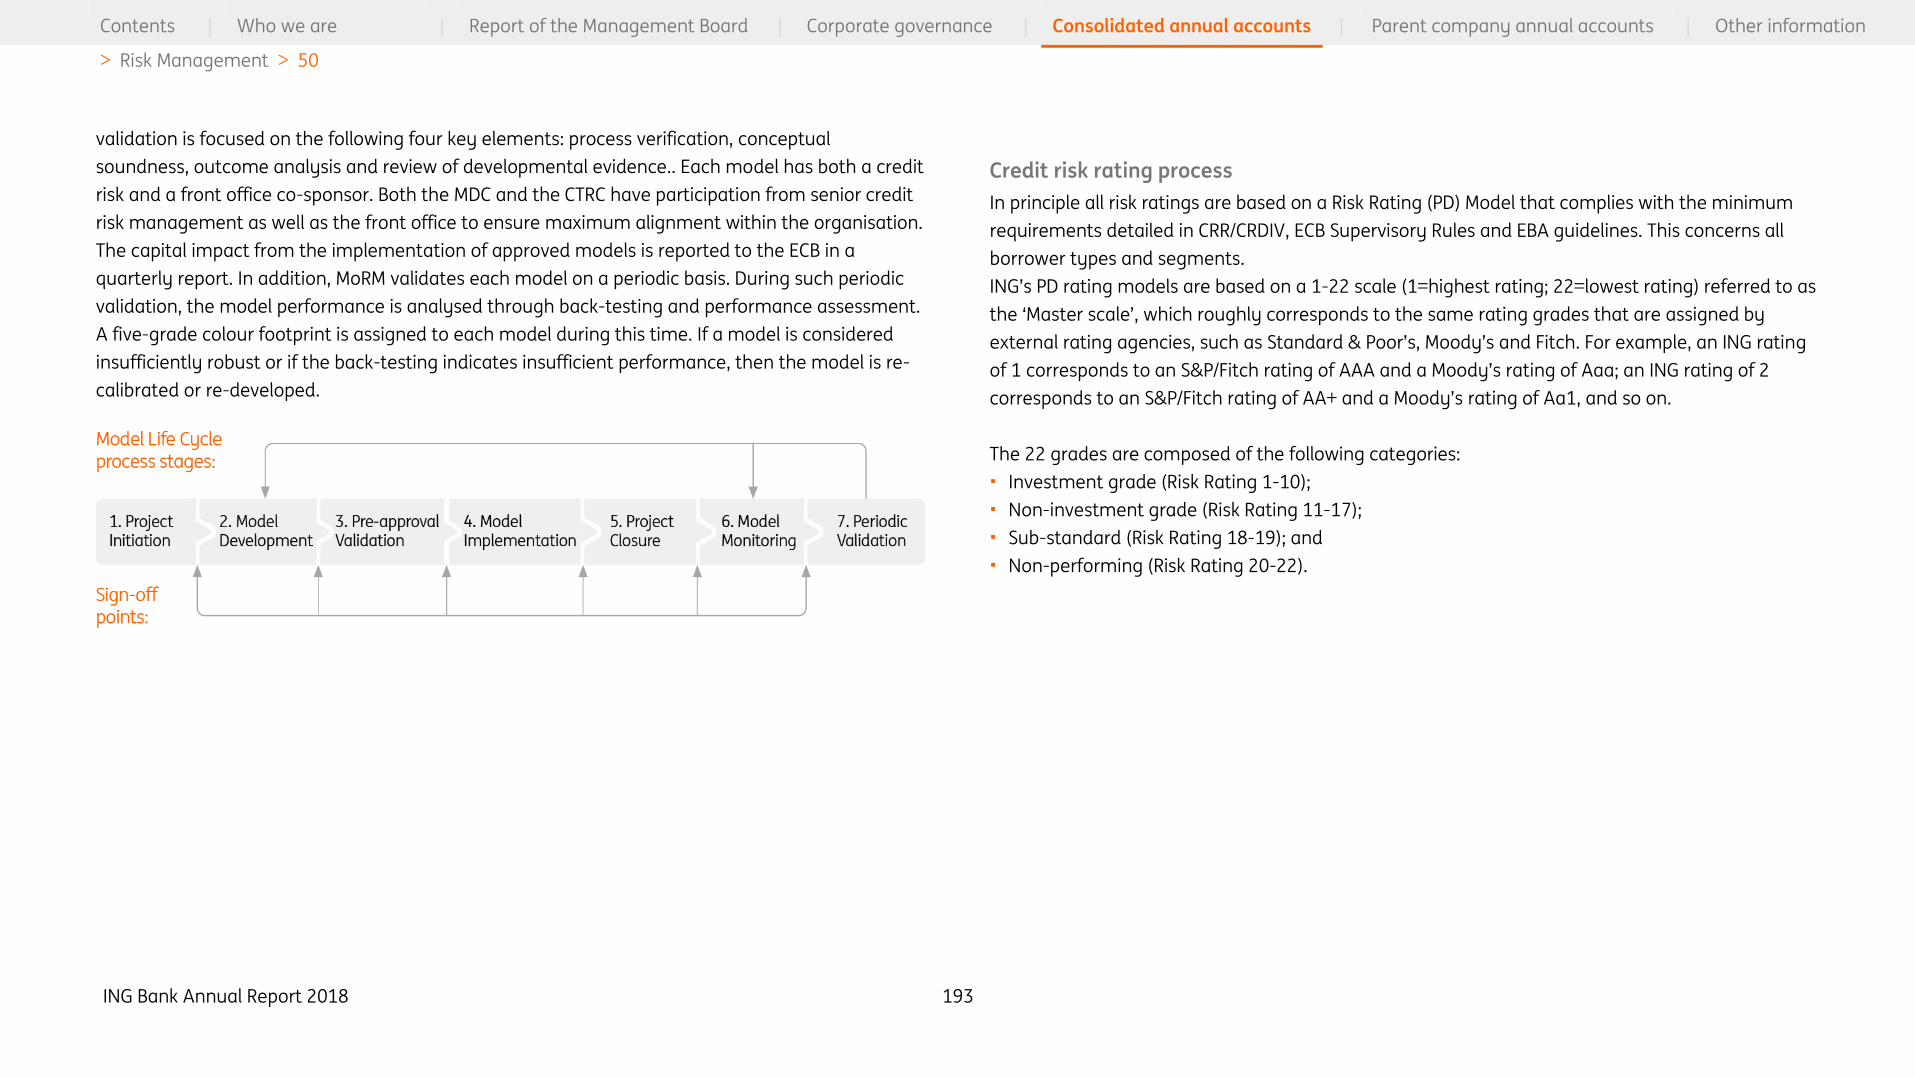
ING Bank Annual Report 2018 193
Contents | Who we are | Report of the Management Board | Corporate governance | Consolidated annual accounts | Parent company annual accounts | Other information
> Risk Management > 50
validation is focused on the following four key elements: process verification, conceptual
soundness, outcome analysis and review of developmental evidence.. Each model has both a credit
risk and a front office co-sponsor. Both the MDC and the CTRC have participation from senior credit
risk management as well as the front office to ensure maximum alignment within the organisation.
The capital impact from the implementation of approved models is reported to the ECB in a
quarterly report. In addition, MoRM validates each model on a periodic basis. During such periodic
validation, the model performance is analysed through back-testing and performance assessment.
A five-grade colour footprint is assigned to each model during this time. If a model is considered
insufficiently robust or if the back-testing indicates insufficient performance, then the model is re-
calibrated or re-developed.
Credit risk rating process
In principle all risk ratings are based on a Risk Rating (PD) Model that complies with the minimum
requirements detailed in CRR/CRDIV, ECB Supervisory Rules and EBA guidelines. This concerns all
borrower types and segments.
ING’s PD rating models are based on a 1-22 scale (1=highest rating; 22=lowest rating) referred to as
the ‘Master scale’, which roughly corresponds to the same rating grades that are assigned by
external rating agencies, such as Standard & Poor’s, Moody’s and Fitch. For example, an ING rating
of 1 corresponds to an S&P/Fitch rating of AAA and a Moody’s rating of Aaa; an ING rating of 2
corresponds to an S&P/Fitch rating of AA+ and a Moody’s rating of Aa1, and so on.
The 22 grades are composed of the following categories:
• Investment grade (Risk Rating 1-10);
• Non-investment grade (Risk Rating 11-17);
• Sub-standard (Risk Rating 18-19); and
• Non-performing (Risk Rating 20-22).
ING Bank Annual Report 2018 194
Contents | Who we are | Report of the Management Board | Corporate governance | Consolidated annual accounts | Parent company annual accounts | Other information
> Risk Management > 50
The three first categories (1-19) are risk ratings for performing loans. The ratings are calculated in IT
systems with internally developed models based on data which is either manually or automatically
fed. Under certain conditions, the outcome of a manually fed model can be challenged through a
rating appeal process. Risk ratings for non-performing loans (NPL) (20-22) are set by the global or
regional credit restructuring department. For securitisation portfolios, the external ratings of the
tranche in which ING has invested are leading.
Risk ratings assigned to clients and reviewed, at least annually with the performance of the
underlying models monitored regularly. Over 90% of ING’s credit exposures have been rated using
one of the in-house developed PD rating models. Some of these models are global in nature, such
as models for Large Corporates, Commercial Banks, Insurance Companies, Central Governments,
Local Governments, Funds, Fund Managers, Project Finance and Leveraged Companies. While other
models are more regional or country specific, such as PD models for Small Medium Enterprise (SME)
companies in Central Europe, the Netherlands, Belgium, Luxembourg, as well as residential
mortgage and consumer loan models in the various retail markets.
Rating Models for retail clients are predominantly statistically driven and automated, such that
ratings can be updated on a monthly or bi-monthly basis. Models for large corporates, institutions
and banks are manually updated and are individually monitored on at least an annual basis.
IFRS 9 models
The IFRS 9 models determine expected credit loss (ECL) based on which collective loan loss
provisions are determined. The IFRS 9 models leverage on the AIRB models (PD, LGD, EAD). For this
purpose, regulatory conservatism is removed from the ECL parameters (PD, LGD and EAD). The IFRS
9 models apply two types of adjustments to the ECL parameters, namely 1) adjustment for
economic outlook and 2) adjustment for lifetime horizon, the latter which is only applicable for
stage 2 and stage 3 assets. The IFRS9 model parameters are estimated based on statistical
techniques and supported by expert judgement.
ING Bank Annual Report 2018 195
Contents | Who we are | Report of the Management Board | Corporate governance | Consolidated annual accounts | Parent company annual accounts | Other information
> Risk Management > 50
Credit risk tools
Credit risk policies
ING’s credit risk policies outline the rules, roles and responsibilities, through the credit lifecycle. All
credit risk policies are created according to policy development standards and reviewed on a
regular basis. Each policy has a credit risk sponsor and is created in close consultation with various
stakeholders within credit risk, front office and, where applicable, other corporate departments. All
policies require approval by the CTRC and, where applicable, by the GCTP.
Credit risk systems and data standards
The acceptance, maintenance, measurement, management and reporting of credit risks at all
levels of ING is executed through promotion of single, common credit risk data standards and the
integration into common credit risk tools that support standardised and transparent credit risk
practices. ING has chosen to develop credit risk tools centrally. The philosophy is to use a single
source of data, in an integrated approach that includes ING policy, the regulatory environment in
which we operate, and the daily processes which are active throughout the group. Application to
these three areas is the essential requirement to aim for high data quality standards and discipline.
The customer-centric data model conforms to the three core business needs of ING:
• To transact efficiently with our clients;
• To be compliant with our internal and external obligations; and
• To monitor the risks we undertake.
Data Governance and Data Quality
ING recognises that information and underlying data are assets that are key (together with people,
processes and IT systems) to further develop its digital profile. Cooperation and mutual agreement
on global data management roles and responsibilities in ING are critical success factors to meet this
objective. As such ING has embraced multiple data management and governance initiatives
triggered by internal and external stakeholders (e.g. Principles for Effective Risk Data Aggregation
and Risk Reporting). In the Financial Risk and Risk COO departments, these principles are embedded
in credit risk data management and enshrined within the Data Governance framework. The
framework outlines roles and responsibilities relevant for the credit risk lifecycle and data quality
assurance.
Credit risk data lifecycle
The credit risk data governance framework used by ING is based on the credit risk data lifecycle.
The governance related to data delivery and exchange is described in various data agreements
between data users and data suppliers.
The scope of credit risk data is the data set determined and assigned for ING’s external and internal
reporting requirements as well as our credit risk modelling requirements. Principally, data can be
categorised into one of the two following types:
• Atomic data: the lowest level of detail and provides the base data for all data transformations.
The guiding principles are that each data element is only input once, and has a clear data owner
and ‘home’ system or database which is leading throughout all uses of that data element. From
the data ‘home’, the data may then be redistributed to other systems or databases that may
require that data in an automated Straight through Processing (STP) method. Depending on the
need, the data may be transferred in real time, near real time, daily, weekly or monthly.
• Derived data: data derived from other data elements (atomic or derived) as a result of data
transformations such as credit risk models, calculations and aggregation. Derived data is hosted
in the central credit risk system (Vortex).
A key component of credit risk data is that this data is continuously used throughout all the stages
of the credit risk management cycle. By using and re-using data, there is a continuous incentive for
all data providers and users to assure high standard data quality with regards to data delivery and
data usage.
The credit risk data lifecycle describes the interlinked stages of the lifecycle from data definition to
data usage as shown in the next figure:

ING Bank Annual Report 2018 196
Contents | Who we are | Report of the Management Board | Corporate governance | Consolidated annual accounts | Parent company annual accounts | Other information
> Risk Management > 50
• Data Definitions: this process step aims that atomic and derived credit risk data terms have a
single definition and definition owner throughout the organisation. It also facilitates that defined
data is fit for the purpose it will be used for.
• Capture: aims that atomic data is captured by business units and is available for exchange
according to pre-agreed standards and specifications.
• Exchange: purpose of this step is that data exchange is executed as agreed between data owner
and data user.
• Processing & Calculation: processes delivered atomic data and uses it to calculate credit risk
derived data. The outcome of this stage is used as an input for credit risk data aggregation in, for
example, risk reporting.
• Data Usage: facilitates data aggregation and usage such that it is fit for multiple purposes e.g.
modelling, regulatory and statutory reporting. Data usage or distribution is facilitated according
to the agreed purpose and data confidentiality, protection, security and retention rules.
• Data Quality Assurance: establishes data quality management with the primary focus on how
credit risk data quality is managed throughout the credit risk data lifecycle. It covers the data
quality cycle, data quality criteria and relevant activities through the stages.
The data quality cycle consists of four stages: define, implement, monitor and improve. During the
data definitions step, data quality rules are determined. Having set the definitions, local data
quality rules are implemented in the source systems, and both successively and simultaneously,
data quality rules are implemented in the central credit risk system. The next stage consists of data
validations, monitoring and control activities performed early in the data exchange and after data
processing and calculation stage. The last stage is the continuous improvement of data quality
which can be split into two categories:
• One-off issues and reoccurring issues that are identified, prioritised and subject to resolution;
• The periodic review of data quality rules and improvements based on lessons learned from
solving issues, audits and best practices.
Credit risk portfolio
ING’s credit exposure is mainly related to traditional lending to individuals and businesses followed
by investments in bonds and securitised assets. Loans to individuals are mainly mortgage loans
secured by residential property. Loans (including guarantees issued) to businesses are often
collateralised, but can be unsecured based on the internal analysis of the borrower’s
creditworthiness. Bonds in the investment portfolio are generally unsecured, but predominantly
consist of bonds issued by Central Governments or equivalent entities, followed by EU and/ or OECD
based financial institutions. Secured bonds, such as mortgage backed securities and asset backed
securities are secured by the underlying diversified pool of assets (commercial or residential
mortgages, car loans and/or other assets) held by the securities issuer. The last major credit risk
source involves pre-settlement exposures which arise from trading activities, including derivatives,
repurchase transactions and securities lending/borrowing transactions. This is also identified as
counterparty credit risk.
Unless specifically stated, the figures in the tables in the credit risk section includes ‘intercompany
loans’ to ING Group.
Portfolio analysis per business line
Risk rating buckets are defined based upon the quality of the exposures in terms of
creditworthiness, varying from investment grade to non-performing loan ratings expressed in S&P,
Moody’s and Fitch rating equivalents.

ING Bank Annual Report 2018 197
Contents | Who we are | Report of the Management Board | Corporate governance | Consolidated annual accounts | Parent company annual accounts | Other information
> Risk Management > 50
ING uses a common industry classification methodology based on the NAICS system (North
American Industry Classification System). This methodology has over 1,500 detailed industry
descriptions, which are aggregated into 22 industry classes at the highest level. Certain countries
require ING to report locally based on other industry classification methodologies, which are
generally derived from the NAICS classifications presented here.
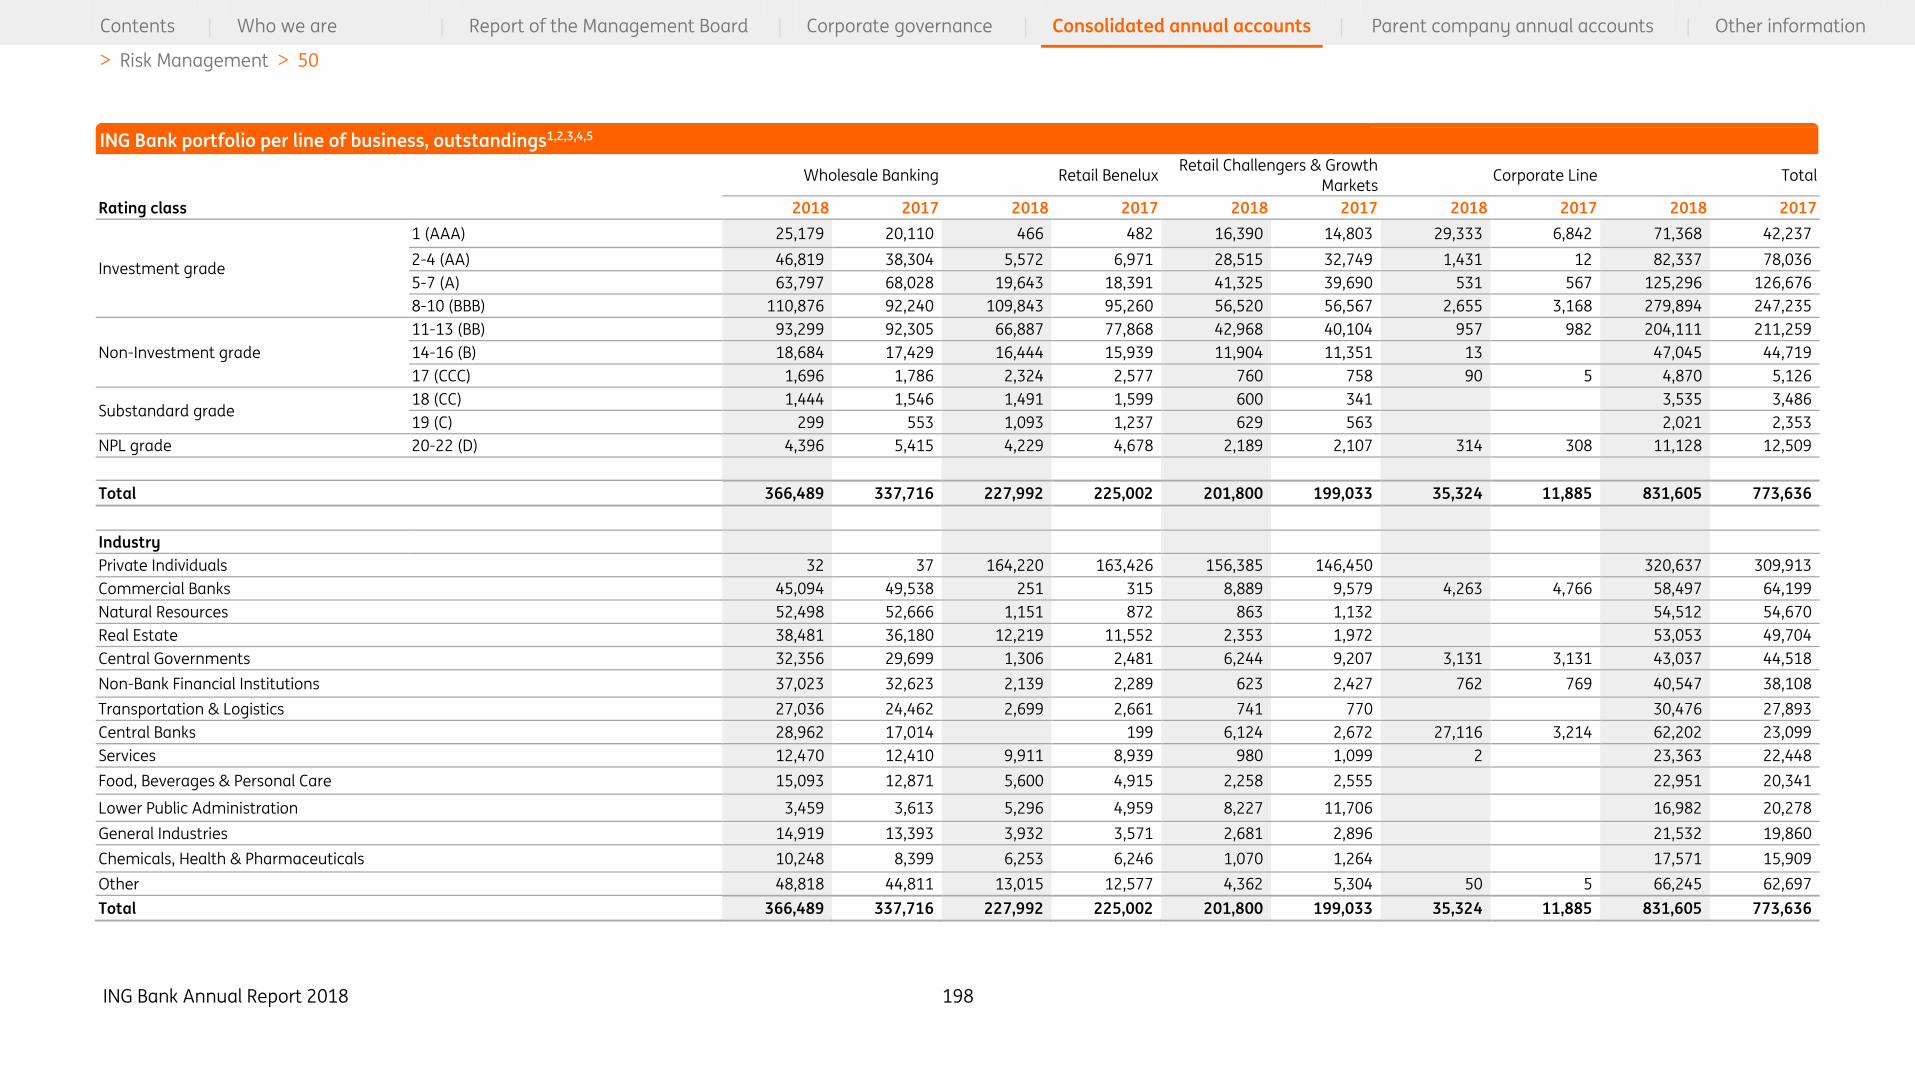
ING Bank Annual Report 2018 198
Contents | Who we are | Report of the Management Board | Corporate governance | Consolidated annual accounts | Parent company annual accounts | Other information
> Risk Management > 50
Wholesale Banking Retail Benelux Retail Challengers & Growth
Markets Corporate Line Total
Rating class 2018 2017 2018 2017 2018 2017 2018 2017 2018 2017
Investment grade
1 (AAA) 25,179 20,110 466 482 16,390 14,803 29,333 6,842 71,368 42,237
2-4 (AA) 46,819 38,304 5,572 6,971 28,515 32,749 1,431 12 82,337 78,036
5-7 (A) 63,797 68,028 19,643 18,391 41,325 39,690 531 567 125,296 126,676
8-10 (BBB) 110,876 92,240 109,843 95,260 56,520 56,567 2,655 3,168 279,894 247,235
Non-Investment grade
11-13 (BB) 93,299 92,305 66,887 77,868 42,968 40,104 957 982 204,111 211,259
14-16 (B) 18,684 17,429 16,444 15,939 11,904 11,351 13 47,045 44,719
17 (CCC) 1,696 1,786 2,324 2,577 760 758 90 5 4,870 5,126
Substandard grade 18 (CC) 1,444 1,546 1,491 1,599 600 341 3,535 3,486
19 (C) 299 553 1,093 1,237 629 563 2,021 2,353
NPL grade 20-22 (D) 4,396 5,415 4,229 4,678 2,189 2,107 314 308 11,128 12,509
Total 366,489 337,716 227,992 225,002 201,800 199,033 35,324 11,885 831,605 773,636
Industry
Private Individuals 32 37 164,220 163,426 156,385 146,450 320,637 309,913
Commercial Banks 45,094 49,538 251 315 8,889 9,579 4,263 4,766 58,497 64,199
Natural Resources 52,498 52,666 1,151 872 863 1,132 54,512 54,670
Real Estate 38,481 36,180 12,219 11,552 2,353 1,972 53,053 49,704
Central Governments 32,356 29,699 1,306 2,481 6,244 9,207 3,131 3,131 43,037 44,518
Non-Bank Financial Institutions 37,023 32,623 2,139 2,289 623 2,427 762 769 40,547 38,108
Transportation & Logistics 27,036 24,462 2,699 2,661 741 770 30,476 27,893
Central Banks 28,962 17,014 199 6,124 2,672 27,116 3,214 62,202 23,099
Services 12,470 12,410 9,911 8,939 980 1,099 2 23,363 22,448
Food, Beverages & Personal Care 15,093 12,871 5,600 4,915 2,258 2,555 22,951 20,341
Lower Public Administration 3,459 3,613 5,296 4,959 8,227 11,706 16,982 20,278
General Industries 14,919 13,393 3,932 3,571 2,681 2,896 21,532 19,860
Chemicals, Health & Pharmaceuticals 10,248 8,399 6,253 6,246 1,070 1,264 17,571 15,909
Other 48,818 44,811 13,015 12,577 4,362 5,304 50 5 66,245 62,697
Total 366,489 337,716 227,992 225,002 201,800 199,033 35,324 11,885 831,605 773,636
ING Bank portfolio per line of business, outstandings1,2,3,4,5
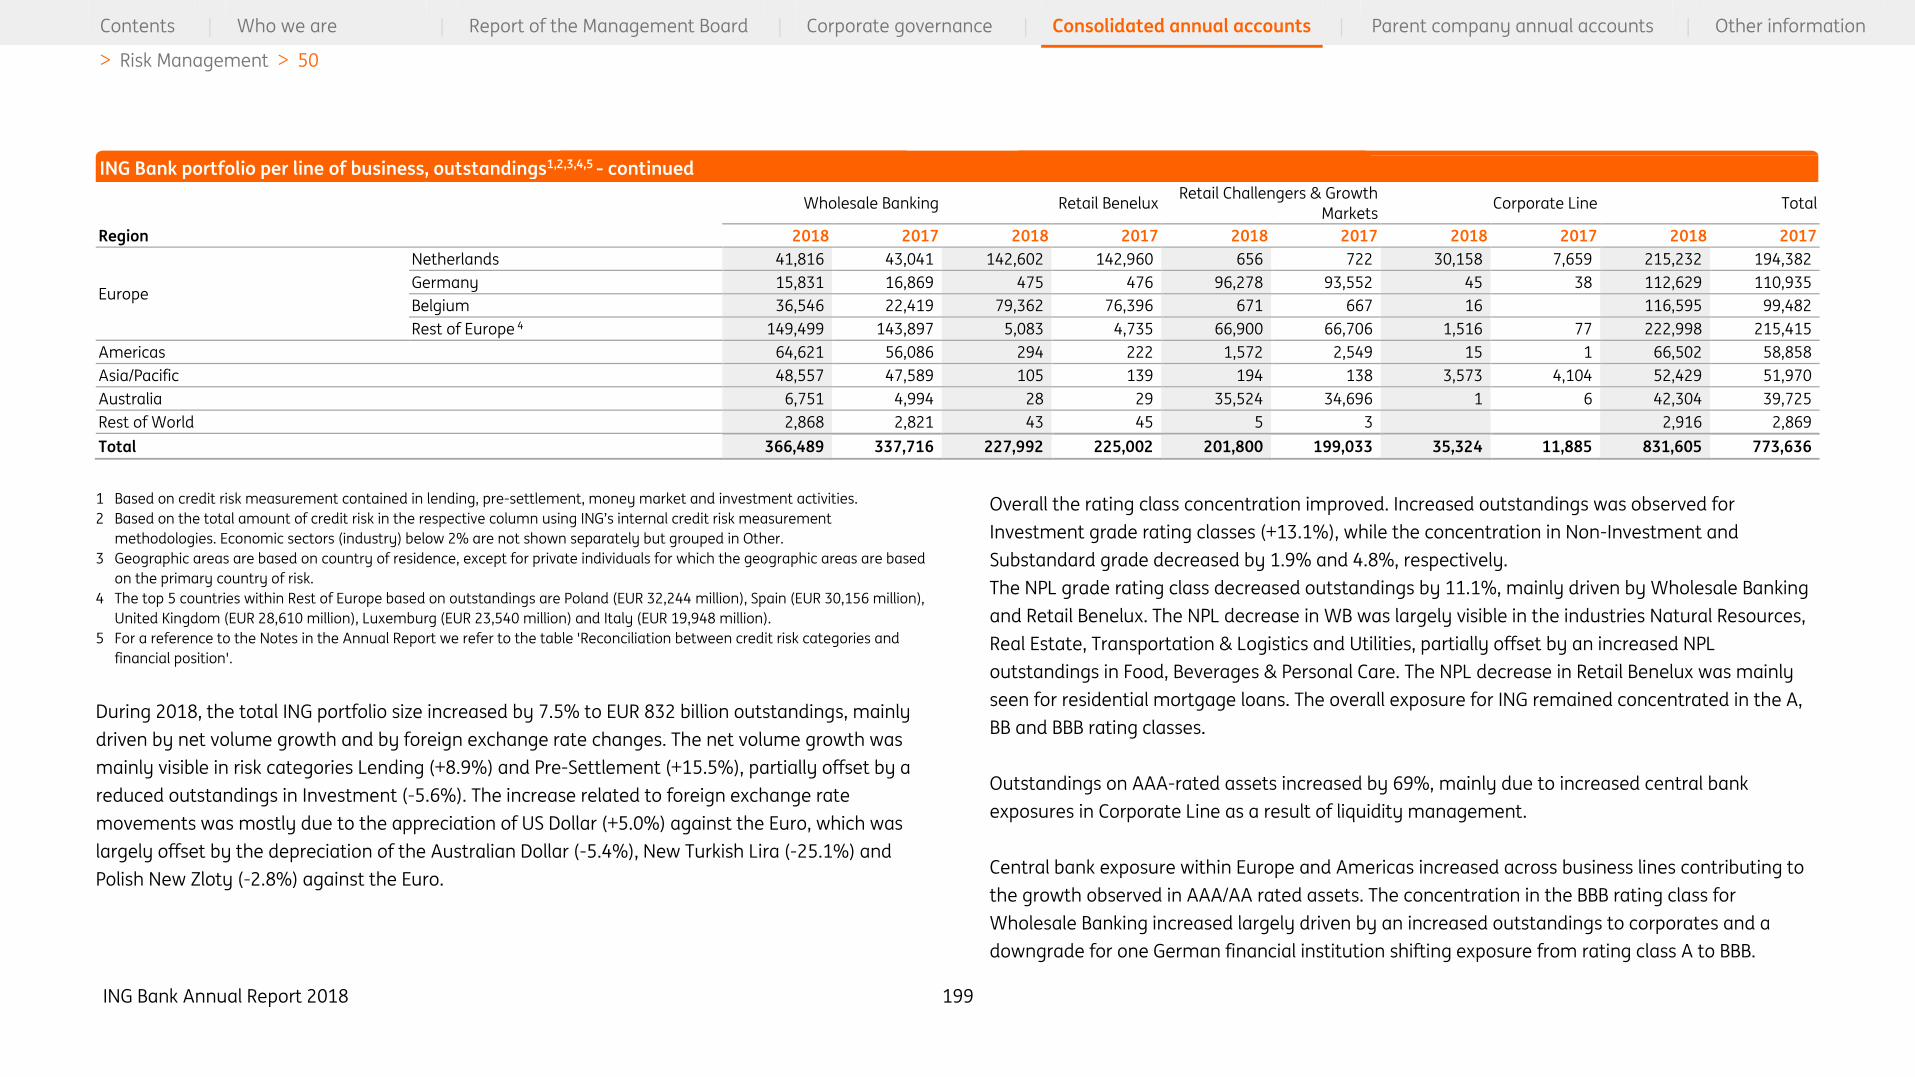
ING Bank Annual Report 2018 199
Contents | Who we are | Report of the Management Board | Corporate governance | Consolidated annual accounts | Parent company annual accounts | Other information
> Risk Management > 50
Wholesale Banking Retail Benelux Retail Challengers & Growth
Markets Corporate Line Total
Region 2018 2017 2018 2017 2018 2017 2018 2017 2018 2017
Europe
Netherlands 41,816 43,041 142,602 142,960 656 722 30,158 7,659 215,232 194,382
Germany 15,831 16,869 475 476 96,278 93,552 45 38 112,629 110,935
Belgium 36,546 22,419 79,362 76,396 671 667 16 116,595 99,482
Rest of Europe 4 149,499 143,897 5,083 4,735 66,900 66,706 1,516 77 222,998 215,415
Americas 64,621 56,086 294 222 1,572 2,549 15 1 66,502 58,858
Asia/Pacific 48,557 47,589 105 139 194 138 3,573 4,104 52,429 51,970
Australia 6,751 4,994 28 29 35,524 34,696 1 6 42,304 39,725
Rest of World 2,868 2,821 43 45 5 3 2,916 2,869
Total 366,489 337,716 227,992 225,002 201,800 199,033 35,324 11,885 831,605 773,636
1 Based on credit risk measurement contained in lending, pre-settlement, money market and investment activities.
2 Based on the total amount of credit risk in the respective column using ING’s internal credit risk measurement
methodologies. Economic sectors (industry) below 2% are not shown separately but grouped in Other.
3 Geographic areas are based on country of residence, except for private individuals for which the geographic areas are based
on the primary country of risk.
4 The top 5 countries within Rest of Europe based on outstandings are Poland (EUR 32,244 million), Spain (EUR 30,156 million),
United Kingdom (EUR 28,610 million), Luxemburg (EUR 23,540 million) and Italy (EUR 19,948 million).
5 For a reference to the Notes in the Annual Report we refer to the table 'Reconciliation between credit risk categories and
financial position'.
During 2018, the total ING portfolio size increased by 7.5% to EUR 832 billion outstandings, mainly
driven by net volume growth and by foreign exchange rate changes. The net volume growth was
mainly visible in risk categories Lending (+8.9%) and Pre-Settlement (+15.5%), partially offset by a
reduced outstandings in Investment (-5.6%). The increase related to foreign exchange rate
movements was mostly due to the appreciation of US Dollar (+5.0%) against the Euro, which was
largely offset by the depreciation of the Australian Dollar (-5.4%), New Turkish Lira (-25.1%) and
Polish New Zloty (-2.8%) against the Euro.
Overall the rating class concentration improved. Increased outstandings was observed for
Investment grade rating classes (+13.1%), while the concentration in Non-Investment and
Substandard grade decreased by 1.9% and 4.8%, respectively.
The NPL grade rating class decreased outstandings by 11.1%, mainly driven by Wholesale Banking
and Retail Benelux. The NPL decrease in WB was largely visible in the industries Natural Resources,
Real Estate, Transportation & Logistics and Utilities, partially offset by an increased NPL
outstandings in Food, Beverages & Personal Care. The NPL decrease in Retail Benelux was mainly
seen for residential mortgage loans. The overall exposure for ING remained concentrated in the A,
BB and BBB rating classes.
Outstandings on AAA-rated assets increased by 69%, mainly due to increased central bank
exposures in Corporate Line as a result of liquidity management.
Central bank exposure within Europe and Americas increased across business lines contributing to
the growth observed in AAA/AA rated assets. The concentration in the BBB rating class for
Wholesale Banking increased largely driven by an increased outstandings to corporates and a
downgrade for one German financial institution shifting exposure from rating class A to BBB.
ING Bank portfolio per line of business, outstandings1,2,3,4,5 - continued

ING Bank Annual Report 2018 200
Contents | Who we are | Report of the Management Board | Corporate governance | Consolidated annual accounts | Parent company annual accounts | Other information
> Risk Management > 50
Additional decreased outstandings in rating class A within Wholesale Banking was seen with
corporates.
The rating distribution for Retail Benelux improved mostly driven by improved risk profile of Dutch
residential mortgages shifting outstandings from rating classes BB to BBB. Similar but smaller in
volume shift from rating classes BB to BBB was seen with residential mortgages in Belgium. The
overall volume growth of Belgium residential mortgages was mainly concentrated in rating class
BBB. Further positive risk migration in Retail Benelux was due to decreased defaulted exposures (-
9.6%), mostly driven by the reduced defaulted exposures in Netherlands Retail (-18.7%). A
reduction of AA outstandings for Retail Challengers & Growth Markets (C&G) was seen mainly in
Germany, caused largely by lowered volumes of bond investments and money market assets with
Local / Regional Authorities. BB rating class increased outstandings in Retail Challengers & Growth
Markets (C&G) mainly in Residential Mortgage Loans with the largest growth seen in Australia and
Spain.
The main concentration in Private Individuals is related to mortgage lending. Mortgage volume
increased, mainly in Germany, Spain, Belgium and Poland, which was partially offset by a decline of
mortgage lending in the Netherlands. Overall the main contributor for the increased outstandings
in Private Individuals was Retail Challengers & Growth Markets.
The outstandings concentration with Central Governments decreased following a reduction in
government bond exposures to Germany, France and Austria within Wholesale Banking and Retail
Challengers & Growth Markets. This was partially offset by an increase in government bond
exposures with Spain, USA and Poland. In Retail Benelux a decrease of central government
exposures was seen in Belgium.
Within Central Banks, the increase in concentration in Corporate Line was solely driven by
increased deposits with the Dutch central bank, while in Wholesale Banking increased outstandings
was seen with Banque Nationale de Belgique SA, partially offset by a reduction in exposures with
Banque Centrale du Luxembourg and Bank of England. An increase was also seen with regulatory
reserve deposits with Deutsche Bundesbank within Retail Challengers & Growth Markets.
Commercial Banks concentration decreased within Wholesale Banking, largely due to decreased
Nostro / Loro exposures in the Netherlands and decreased export finance in China, which was
partially offset by increased trade finance in Republic of Korea. Non-Bank Financial Institutions
concentration increased in Wholesale Banking mostly due to increased securities financing in the
USA, while reduced concentration in Retail Challengers & Growth Markets was mainly due to lower
securitization exposures in United States and Spain.
Within Wholesale Banking: Real Estate concentration increased mainly due to increased lending
exposures in United States, Luxemburg and Australia; Transportation & Logistics outstandinsg
increased mostly in Japan; Food, Beverages & Personal Care outstandings increased mainly in
United States, Switzerland and Luxembourg; Chemicals, Health & Pharmaceuticals outstandings
increased mostly in Germany and United States, while a decreased outstandings was seen in the
Netherlands.
A reduced concentration of Lower public administration was seen within Retail Challengers &
Growth Markets, driven by the reduction of bond investments with Local / Regional Authorities in
Germany.
Portfolio analysis per geographical area
The most noticeable outstandings trends in the Netherlands were the aforementioned decreased
volumes in residential mortgage loans and decreased Nostro / Loro exposures to Commercial
Banks. These were completely offset by the large increase in regulatory reserve deposit with the
Dutch Central Bank.
Increased outstandings in Belgium was mainly due to increased Securities Financing and Money
Market Assets with Central Bank and due to residential mortgage volume growth. These were
slightly offset by a reduction of exposure with Belgian Central Government.
ING Bank Annual Report 2018 201
Contents | Who we are | Report of the Management Board | Corporate governance | Consolidated annual accounts | Parent company annual accounts | Other information
> Risk Management > 50
Outstandings in Germany increased mainly due to increased regulatory reserve deposits with
Deutsche Bundesbank and increased residential mortgage lending, which was partly offset by
lowered volumes of bond investments and money market assets with Local / Regional Authorities.
The concentration of outstandings in the Rest of Europe increased, mainly in Spain, Poland and
Romania, while it decreased in France and Turkey. The increase of outstandings in the Americas
was largely driven by higher exposures to Corporates and Non-Bank Financial Institutions in the
United States. In Asia/Pacific, the concentration of outstandings remained relatively stable, with
noticeable increase of outstandings in Hong Kong, Republic of Korea, Singapore and Japan, partly
offset by a reduction of outstandings in China and Taiwan.
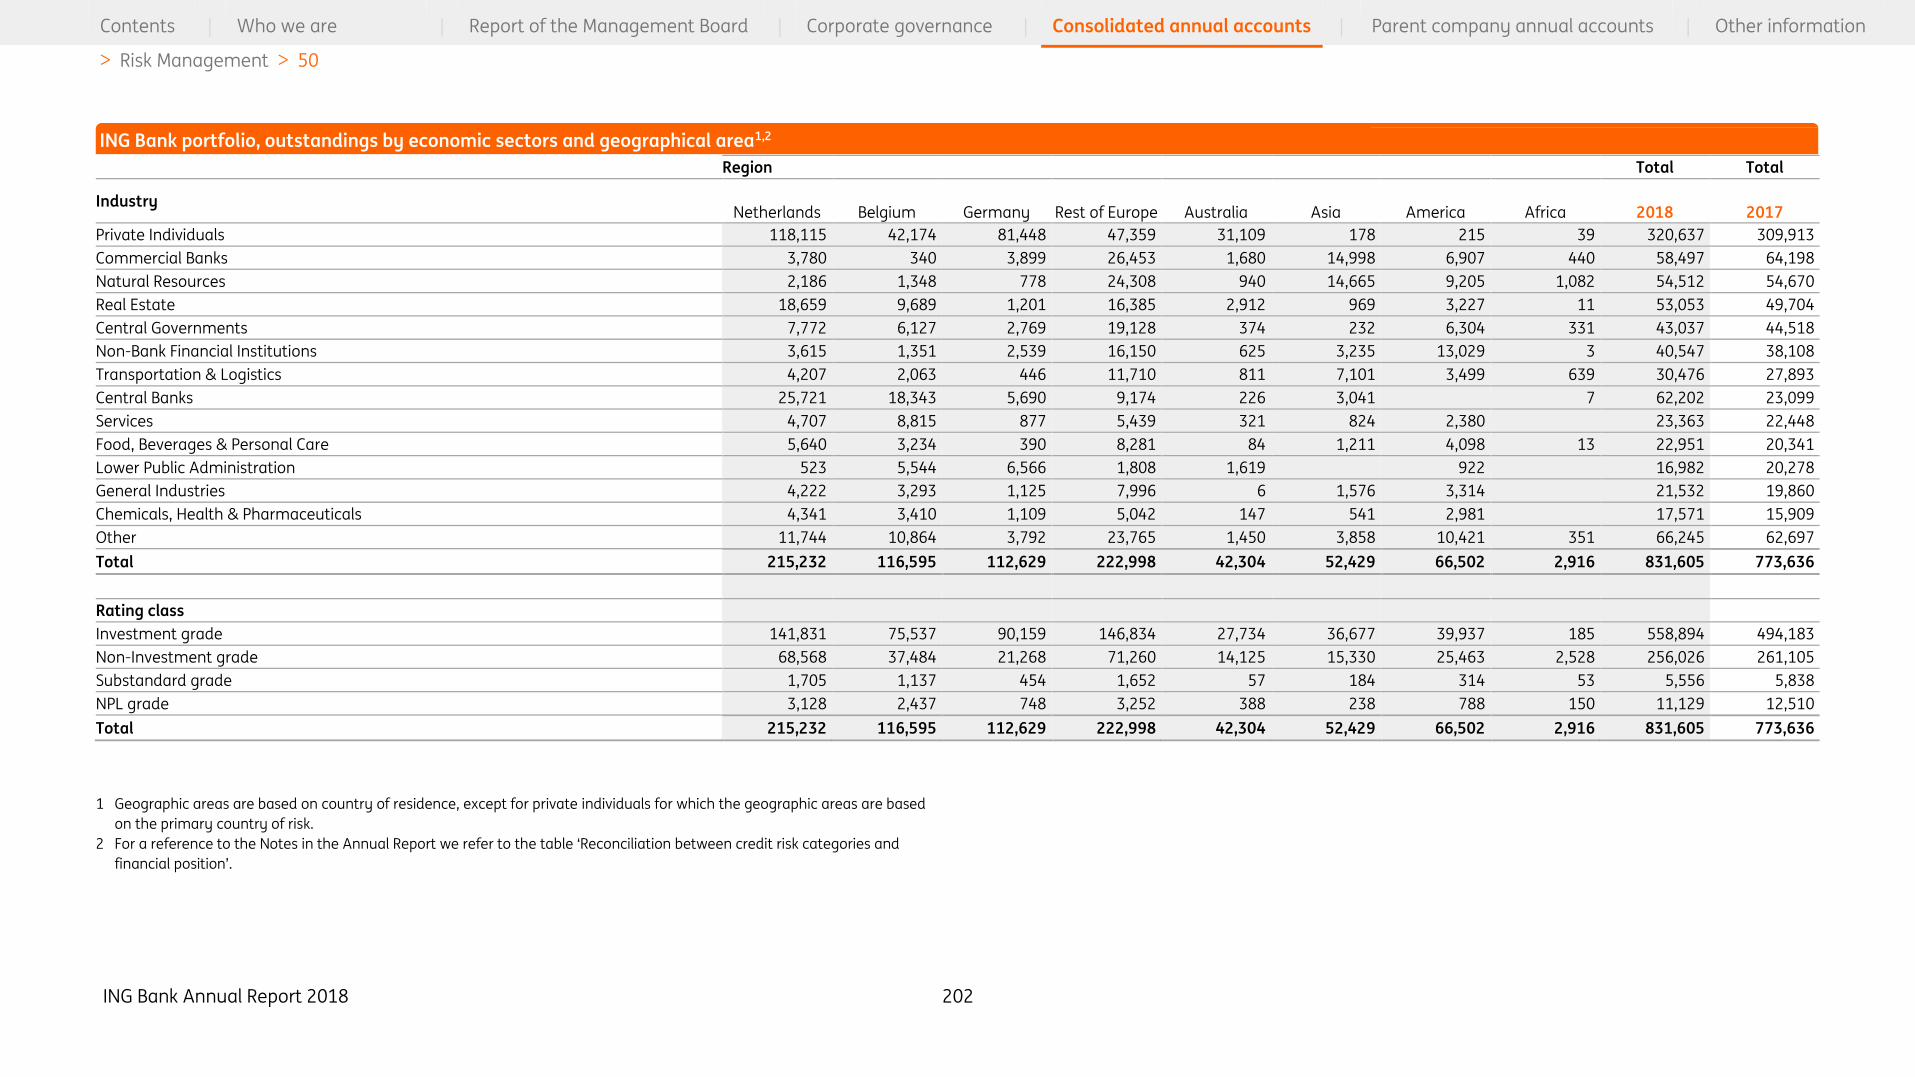
ING Bank Annual Report 2018 202
Contents | Who we are | Report of the Management Board | Corporate governance | Consolidated annual accounts | Parent company annual accounts | Other information
> Risk Management > 50
Region Total Total
Industry Netherlands Belgium Germany Rest of Europe Australia Asia America Africa 2018 2017
Private Individuals 118,115 42,174 81,448 47,359 31,109 178 215 39 320,637 309,913
Commercial Banks 3,780 340 3,899 26,453 1,680 14,998 6,907 440 58,497 64,198
Natural Resources 2,186 1,348 778 24,308 940 14,665 9,205 1,082 54,512 54,670
Real Estate 18,659 9,689 1,201 16,385 2,912 969 3,227 11 53,053 49,704
Central Governments 7,772 6,127 2,769 19,128 374 232 6,304 331 43,037 44,518
Non-Bank Financial Institutions 3,615 1,351 2,539 16,150 625 3,235 13,029 3 40,547 38,108
Transportation & Logistics 4,207 2,063 446 11,710 811 7,101 3,499 639 30,476 27,893
Central Banks 25,721 18,343 5,690 9,174 226 3,041 7 62,202 23,099
Services 4,707 8,815 877 5,439 321 824 2,380 23,363 22,448
Food, Beverages & Personal Care 5,640 3,234 390 8,281 84 1,211 4,098 13 22,951 20,341
Lower Public Administration 523 5,544 6,566 1,808 1,619 922 16,982 20,278
General Industries 4,222 3,293 1,125 7,996 6 1,576 3,314 21,532 19,860
Chemicals, Health & Pharmaceuticals 4,341 3,410 1,109 5,042 147 541 2,981 17,571 15,909
Other 11,744 10,864 3,792 23,765 1,450 3,858 10,421 351 66,245 62,697
Total 215,232 116,595 112,629 222,998 42,304 52,429 66,502 2,916 831,605 773,636
Rating class
Investment grade 141,831 75,537 90,159 146,834 27,734 36,677 39,937 185 558,894 494,183
Non-Investment grade 68,568 37,484 21,268 71,260 14,125 15,330 25,463 2,528 256,026 261,105
Substandard grade 1,705 1,137 454 1,652 57 184 314 53 5,556 5,838
NPL grade 3,128 2,437 748 3,252 388 238 788 150 11,129 12,510
Total 215,232 116,595 112,629 222,998 42,304 52,429 66,502 2,916 831,605 773,636
1 Geographic areas are based on country of residence, except for private individuals for which the geographic areas are based
on the primary country of risk.
2 For a reference to the Notes in the Annual Report we refer to the table ‘Reconciliation between credit risk categories and
financial position’.
ING Bank portfolio, outstandings by economic sectors and geographical area1,2
ING Bank Annual Report 2018 203
Contents | Who we are | Report of the Management Board | Corporate governance | Consolidated annual accounts | Parent company annual accounts | Other information
> Risk Management > 50
Credit risk mitigation
ING’s lending and investment businesses are subject to credit risk. As such, the creditworthiness of
our customers and investments is continually monitored for their ability to meet their financial
obligations to ING. In addition, to determine the credit quality and creditworthiness of the
customer, ING uses various credit risk mitigation techniques and instruments to mitigate the credit
risk associated with an exposure and to reduce the losses incurred subsequent to an event of
default on an obligation a customer may have towards ING. The most common terminology used
in ING for credit risk protection is ‘cover’. While a cover can be an important mitigant of credit risk
and an alternative source of repayment, generally it is ING’s practice to lend on the basis of the
customer’s creditworthiness rather than exclusively relying on the value of the cover. Within ING,
there are two distinct forms of covers: assets and third party obligations.
Cover forms
Assets
The asset that has been pledged to ING as collateral or security gives ING the right to liquidate it in
cases where the customer is unable to fulfil its financial obligation. As such, the proceeds can be
applied towards full or partial compensation of the customer's outstandings exposure. An asset can
be tangible (such as cash, securities, receivables, inventory, plant & machinery and mortgages on
real estate properties) or intangible (such as patents, trademarks, contract rights and licenses).
Third party obligation
Third party obligation, indemnification or undertaking (either by contract and/or by law) is a legally
binding declaration by a third party that gives ING the right to claim from that third party an
amount, if the customer fails on its obligations to ING. The most common examples are guarantees
(such as parent guarantees and export credit insurances), letters of comfort, or third party pledged
/ mortgages.
Cover valuation methodology
General guidelines for cover valuation are established to have consistent application within ING.
These general guidelines also require that the value of the cover needs to be monitored on a
regular basis. Covers are revalued periodically and whenever there is reason to believe that the
market is subject to significant changes in conditions. The frequency of monitoring and revaluation
depends on the type of covers.
The valuation method also depends on the type of covers. For asset collateral, the valuation
sources can be the customer’s balance sheet (e.g. inventory, machinery, and equipment), nominal
value (e.g. cash, receivables), market value (e.g. securities and commodities), independent
valuations (commercial real estate) and market indices (residential real estate). For third party
obligations, the valuation is based on the value which is attributed to the contract between ING and
that third party.
Covers
This section provides insight in the types of covers and to which extent exposures benefit from
collateral or guarantees. The disclosure differentiates between the risk categories (Lending,
Investment, Money Market and Pre-settlement) and the most relevant cover forms mortgages and
financial collateral (cash and securities) and guarantees. ING obtains cover which is eligible for
credit risk mitigation under CRR/CRDIV, as well as cover is not eligible. Collateral covering financial
market transactions is valued on a daily basis. To mitigate the credit risk arising from Financial
Markets transactions, the bank enters into legal agreements governing the exchange of financial
collateral (high quality government bonds and cash).
The cover values are presented for the total portfolio of ING, both the performing and non-
performing portfolio. The non-performing definition is explained in detail in the section ‘Credit
Restructuring’. To further the insight, also a breakdown of ING’s portfolio by industry and
geography is provided. For comparability reasons with previous tables, outstandings is used to
show ING’s portfolio.
ING Bank Annual Report 2018 204
Contents | Who we are | Report of the Management Board | Corporate governance | Consolidated annual accounts | Parent company annual accounts | Other information
> Risk Management > 50
Exposures are categorised into different Value to Loan (VTL) buckets that give insight in the level of
collateralisation of ING’s portfolio. VTL is calculated as the cover value divided by the outstandings
at the balance sheet date. The cover values are indexed where appropriate and exclude any cost of
liquidation. Covers can either be valid for all or some exposures or a particular outstandings of a
borrower, the latter being the most common. For the purpose of aggregation, the coverage of all
outstandings is capped at 100%. Over-collateralisation is ignored in this overview for the VTL. Each
limit is subsequently assigned to one of the six defined VTL buckets: no cover, >0% to 25%, >25% to
50%, >50% to 75%, >75% to <100%, and ≥ 100%. As the nature of the Pre-settlement portfolio
determines that collateral is netted, these VTL buckets are not shown.
The next table gives an overview of the collateralisation of the ING’s total portfolio.

ING Bank Annual Report 2018 205
Contents | Who we are | Report of the Management Board | Corporate governance | Consolidated annual accounts | Parent company annual accounts | Other information
> Risk Management > 50
Cover type Value to Loan
Outstan-
dings Mortgages
Eligible
Financial
Collateral
Other
CRR/CRDIV
eligible Guaran-tees
Non CRR/CRD
IV eligible No Cover
Partially
covered Fully covered
Consumer Lending 318,804 547,832 3,509 280 25,760 39,166 6.6% 7.9% 85.4%
Business Lending 365,480 147,203 19,089 125,472 86,215 132,416 37.7% 23.5% 38.8%
Investment and Money Market 95,701 80 214 145 45 91.0% 8.8% 0.2%
Total Lending, Investment and Money Market 779,985 695,035 22,678 125,966 112,120 171,627 31.6% 15.3% 53.1%
Pre-settlement 1 51,620
Total Bank 831,605
1 More information on the credit risk mitigants can be found in the Pre-settlement section.
Cover type Value to Loan
Outstan-dings Mortgages
Eligible
Financial
Collateral
Other
CRR/CRDIV
eligible Guaran-tees
Non CRR/CRD
IV eligible No Cover
Partially
covered Fully covered
Consumer Lending 308,349 512,709 3,680 338 25,130 38,551 6.3% 9.3% 84.4%
Business Lending 320,153 134,667 15,185 99,569 90,777 128,985 35.3% 24.1% 40.6%
Investment and Money Market 100,449 59 117 522 99.5% 0.4% 0.2%
Total Lending, Investment and Money Market 728,951 647,376 18,923 100,024 116,429 167,536 31.9% 14.6% 53.6%
Pre-settlement 1 44,685
Total Bank 773,636
1 More information on the credit risk mitigants can be found in the Pre-settlement section.
Over the year, the collateralisation level of the total portfolio remained stable. Excluding the pre-
settlement portfolio, 53.1% of ING Bank’s outstandings were fully collateralised in 2018 (2017:
53.6%). Since investments traditionally do not require covers, the percentage for ‘no covers’ in this
portfolio is close to 90%. Improved economic conditions in ING’s main markets contributed to
improved collateral valuations, observed in consumer lending, but an increase in non-lending
outstandings produced a slightly lower coverage ratio for business lending. The increase in lending
for ‘Other CRR/CRDIV eligible’ covers was mainly situated in the Netherlands, accounting for 43.1%
of the difference from 2017. The decrease in ‘Guarantees’ is primarily attributed to the ‘Rest of
Europe’ region, accounting for 81.1% of the decline.
Cover values including guarantees received – Total ING Bank - 2018
Cover values including quarantees received – Total ING Bank - 2017
ING Bank Annual Report 2018 206
Contents | Who we are | Report of the Management Board | Corporate governance | Consolidated annual accounts | Parent company annual accounts | Other information
> Risk Management > 50
Consumer lending portfolio
The consumer lending portfolio accounts for 38.3% of ING Bank’s total outstandings, primarily
consisting of residential mortgage loans (98.5% of performing loans) and other consumer lending
loans, which mainly comprise term loans, revolvers and personal loans to consumers. As a result,
most of the collateral consists of mortgages. The mortgage values are collected in an internal
central database and in most cases external data is used to index the market value (e.g. on a
quarterly basis the mortgage values for the Netherlands are updated using the NVM house price
index).
A significant part of ING’s residential mortgage portfolio is provided in the Netherlands (39.5%),
followed by other main markets such as Germany (24.8%), Belgium & Luxembourg (13.5%) and
Australia (10.6%). Given the size of the Dutch mortgage portfolio, the valuation methodology to
determine the cover values for Dutch residential mortgages is provided below.
Dutch mortgages valuation
When a mortgage loan is granted in the Netherlands, the policy dictates maximum loan to market
value (LTMV) for an existing property and for construction property financing of 100% (in 2017:
101%). The cover values are captured in the local systems which are subsequently fed into a
central data system.
In case of newly built houses mostly the building /purchase agreement is sufficient as valuation. In
the case of existing houses three kind of valuations are allowed. If the LTMV is below 90% a (1) WOZ
(fiscal market value, determined by government authorities) or an (2) automated model valuation
(the Calcasa ING Valuation) is permitted. In most cases a valuation is performed by (3) certified
valuators that are registered at one of the organisations accepted by ING. In addition, the valuator
must be a member of the NVM (Nederlandse Vereniging van Makelaars – Dutch Association of Real
Estate Agents), VBO (Vereniging Bemiddeling Onroerend Goed – Association of Real Estate Brokers),
VastgoedPRO (Association of Real Estate Professionals) or NVR (Nederlandse Vereniging van
Rentmeesters).
Consumer lending portfolio – cover values
The below tables show the values of different covers and the VTL split between performing and
non-performing loans.
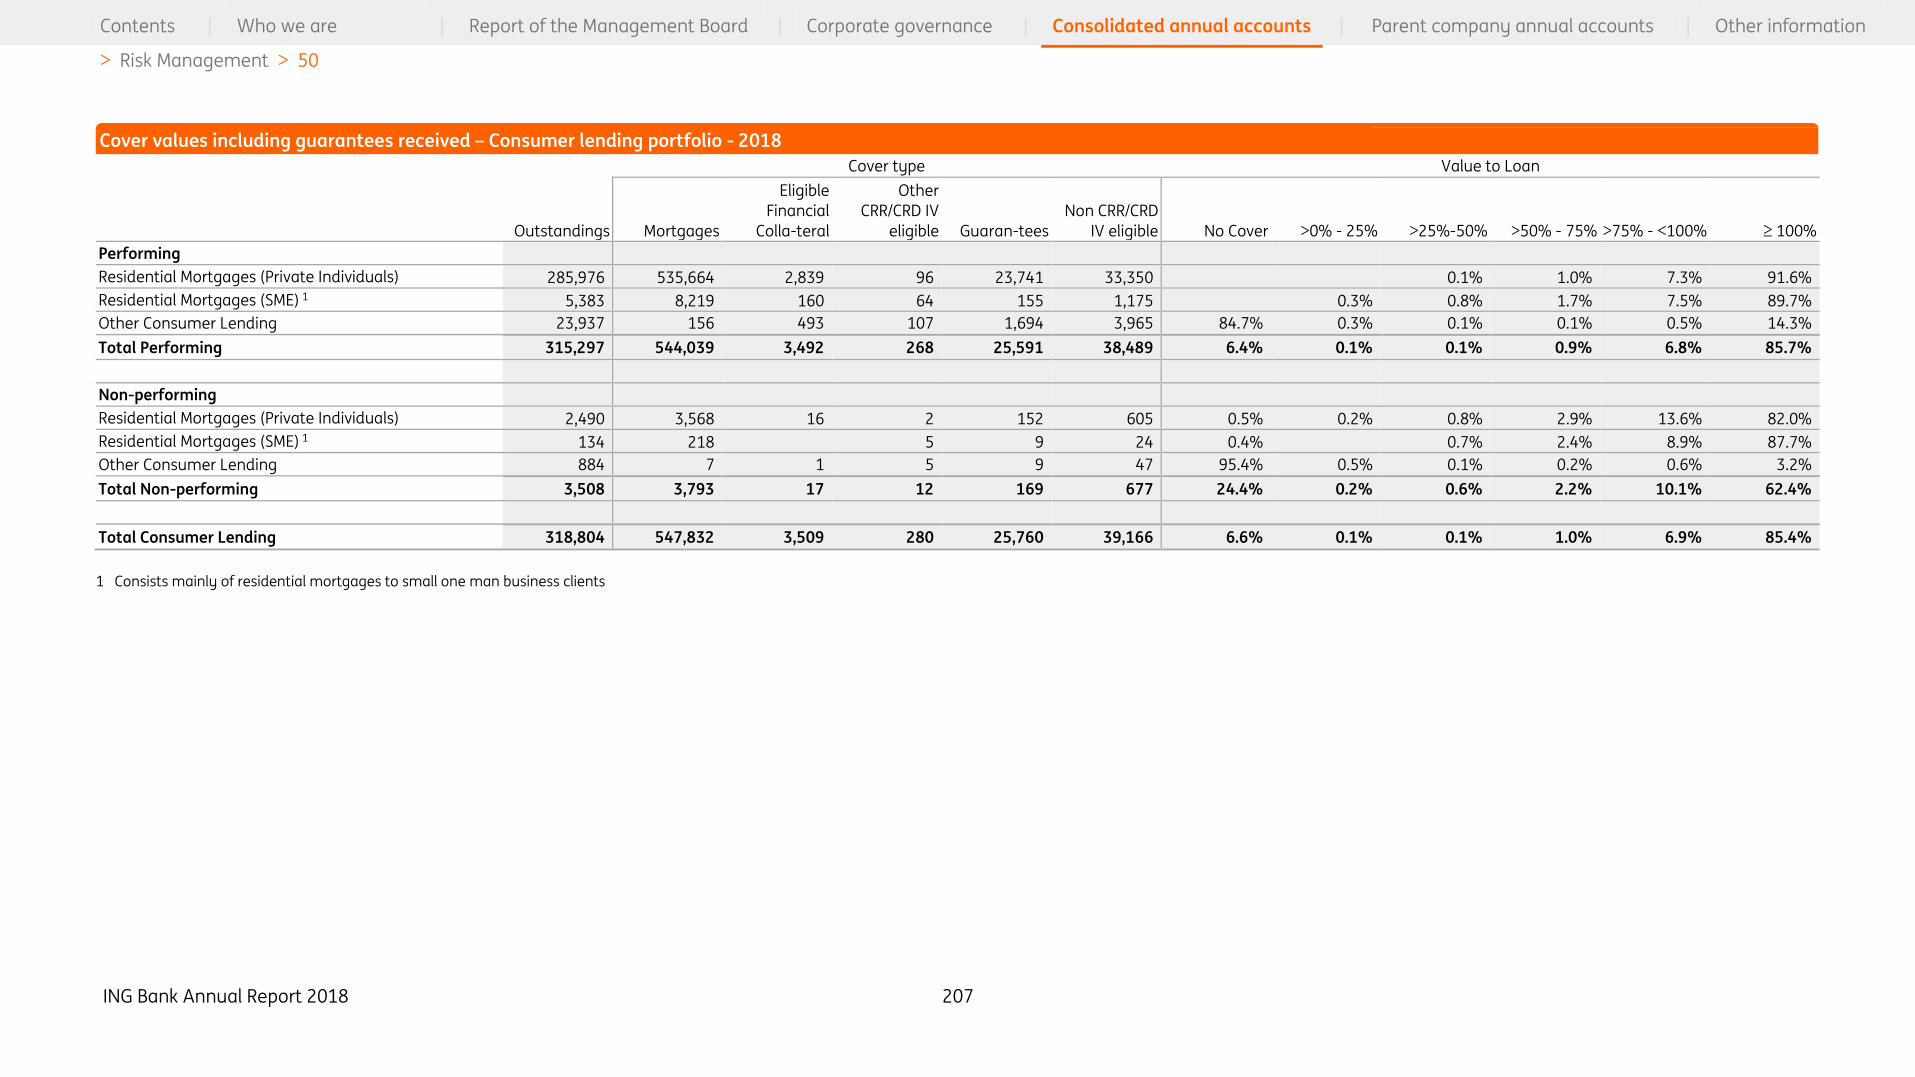
ING Bank Annual Report 2018 207
Contents | Who we are | Report of the Management Board | Corporate governance | Consolidated annual accounts | Parent company annual accounts | Other information
> Risk Management > 50
Cover type Value to Loan
Outstandings Mortgages
Eligible
Financial
Colla-teral
Other
CRR/CRD IV
eligible Guaran-tees
Non CRR/CRD
IV eligible No Cover >0% - 25% >25%-50% >50% - 75% >75% - <100% ≥ 100%
Performing
Residential Mortgages (Private Individuals) 285,976 535,664 2,839 96 23,741 33,350 0.1% 1.0% 7.3% 91.6%
Residential Mortgages (SME) 1 5,383 8,219 160 64 155 1,175 0.3% 0.8% 1.7% 7.5% 89.7%
Other Consumer Lending 23,937 156 493 107 1,694 3,965 84.7% 0.3% 0.1% 0.1% 0.5% 14.3%
Total Performing 315,297 544,039 3,492 268 25,591 38,489 6.4% 0.1% 0.1% 0.9% 6.8% 85.7%
Non-performing
Residential Mortgages (Private Individuals) 2,490 3,568 16 2 152 605 0.5% 0.2% 0.8% 2.9% 13.6% 82.0%
Residential Mortgages (SME) 1 134 218 5 9 24 0.4% 0.7% 2.4% 8.9% 87.7%
Other Consumer Lending 884 7 1 5 9 47 95.4% 0.5% 0.1% 0.2% 0.6% 3.2%
Total Non-performing 3,508 3,793 17 12 169 677 24.4% 0.2% 0.6% 2.2% 10.1% 62.4%
Total Consumer Lending 318,804 547,832 3,509 280 25,760 39,166 6.6% 0.1% 0.1% 1.0% 6.9% 85.4%
1 Consists mainly of residential mortgages to small one man business clients
Cover values including guarantees received – Consumer lending portfolio - 2018
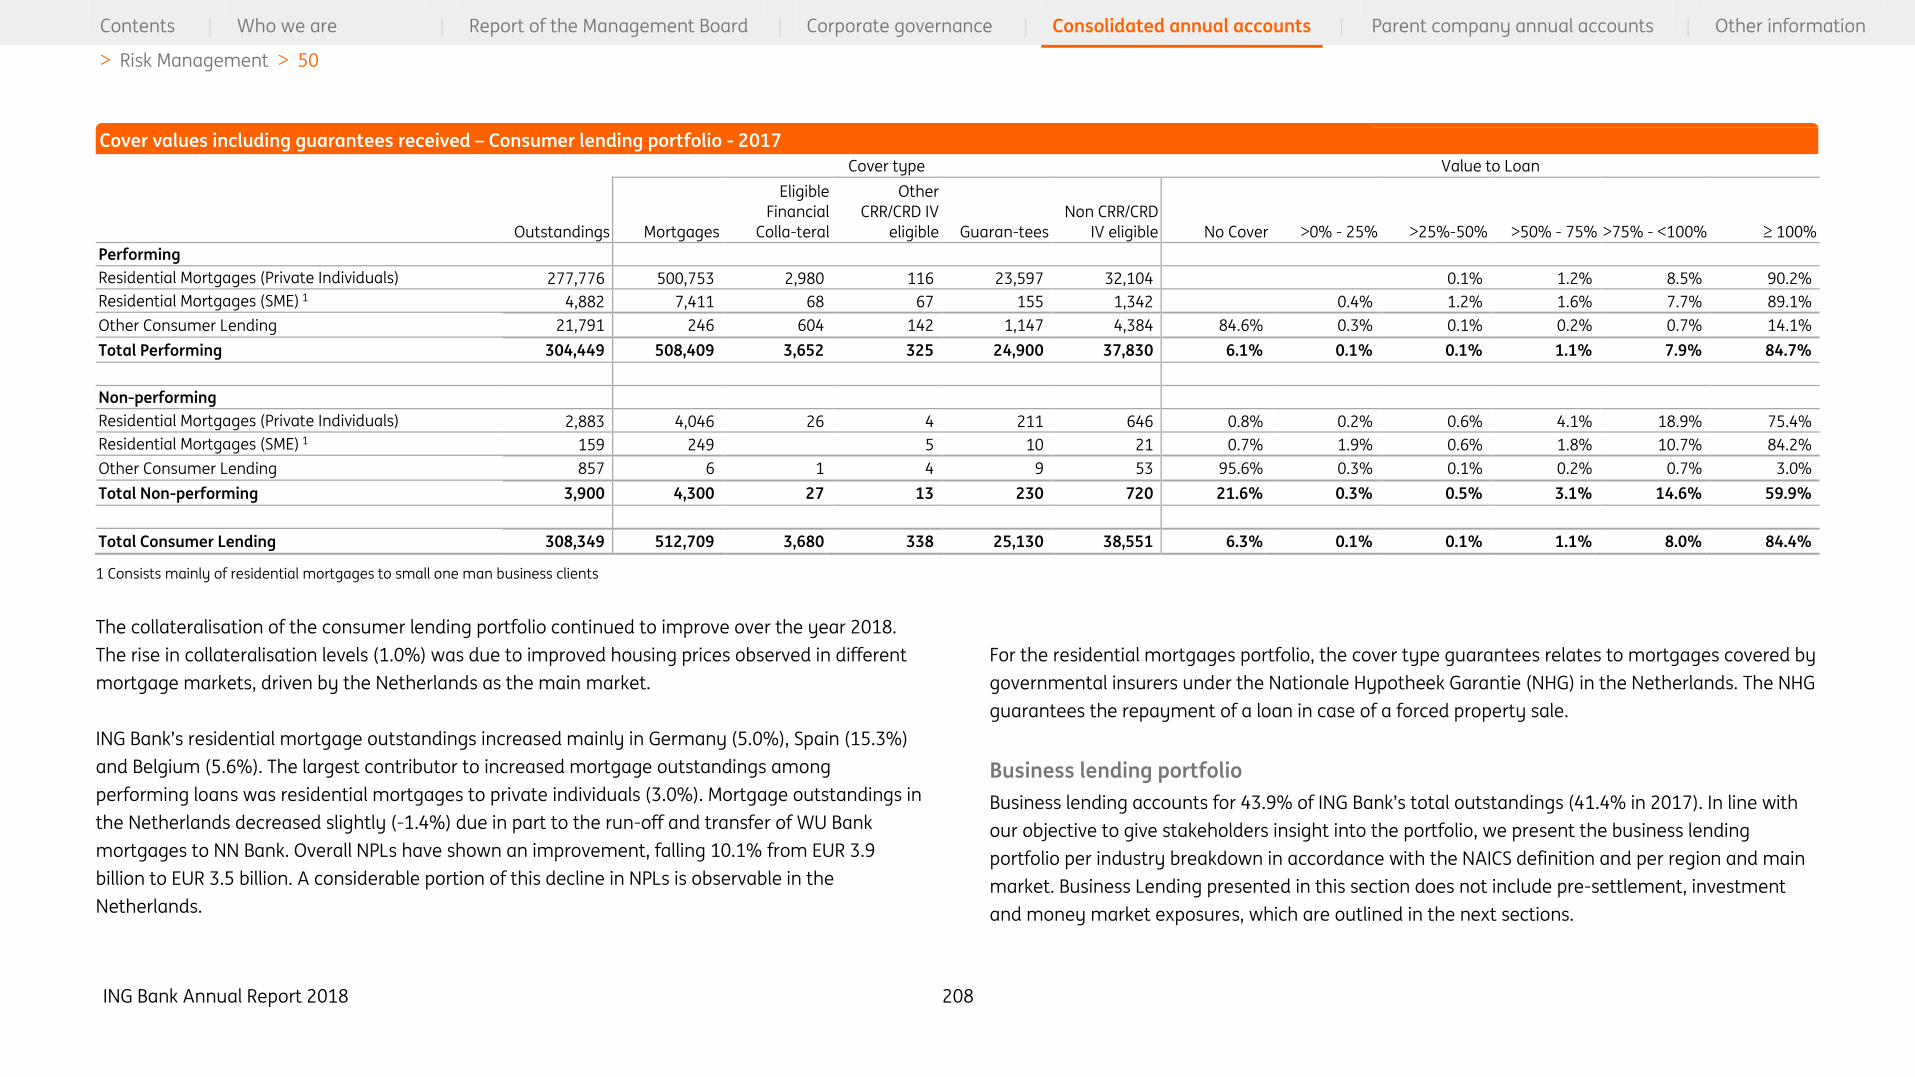
ING Bank Annual Report 2018 208
Contents | Who we are | Report of the Management Board | Corporate governance | Consolidated annual accounts | Parent company annual accounts | Other information
> Risk Management > 50
Cover type Value to Loan
Outstandings Mortgages
Eligible
Financial
Colla-teral
Other
CRR/CRD IV
eligible Guaran-tees
Non CRR/CRD
IV eligible No Cover >0% - 25% >25%-50% >50% - 75% >75% - <100% ≥ 100%
Performing
Residential Mortgages (Private Individuals) 277,776 500,753 2,980 116 23,597 32,104 0.1% 1.2% 8.5% 90.2%
Residential Mortgages (SME) 1 4,882 7,411 68 67 155 1,342 0.4% 1.2% 1.6% 7.7% 89.1%
Other Consumer Lending 21,791 246 604 142 1,147 4,384 84.6% 0.3% 0.1% 0.2% 0.7% 14.1%
Total Performing 304,449 508,409 3,652 325 24,900 37,830 6.1% 0.1% 0.1% 1.1% 7.9% 84.7%
Non-performing
Residential Mortgages (Private Individuals) 2,883 4,046 26 4 211 646 0.8% 0.2% 0.6% 4.1% 18.9% 75.4%
Residential Mortgages (SME) 1 159 249 5 10 21 0.7% 1.9% 0.6% 1.8% 10.7% 84.2%
Other Consumer Lending 857 6 1 4 9 53 95.6% 0.3% 0.1% 0.2% 0.7% 3.0%
Total Non-performing 3,900 4,300 27 13 230 720 21.6% 0.3% 0.5% 3.1% 14.6% 59.9%
Total Consumer Lending 308,349 512,709 3,680 338 25,130 38,551 6.3% 0.1% 0.1% 1.1% 8.0% 84.4%
1 Consists mainly of residential mortgages to small one man business clients
The collateralisation of the consumer lending portfolio continued to improve over the year 2018.
The rise in collateralisation levels (1.0%) was due to improved housing prices observed in different
mortgage markets, driven by the Netherlands as the main market.
ING Bank’s residential mortgage outstandings increased mainly in Germany (5.0%), Spain (15.3%)
and Belgium (5.6%). The largest contributor to increased mortgage outstandings among
performing loans was residential mortgages to private individuals (3.0%). Mortgage outstandings in
the Netherlands decreased slightly (-1.4%) due in part to the run-off and transfer of WU Bank
mortgages to NN Bank. Overall NPLs have shown an improvement, falling 10.1% from EUR 3.9
billion to EUR 3.5 billion. A considerable portion of this decline in NPLs is observable in the
Netherlands.
For the residential mortgages portfolio, the cover type guarantees relates to mortgages covered by
governmental insurers under the Nationale Hypotheek Garantie (NHG) in the Netherlands. The NHG
guarantees the repayment of a loan in case of a forced property sale.
Business lending portfolio
Business lending accounts for 43.9% of ING Bank’s total outstandings (41.4% in 2017). In line with
our objective to give stakeholders insight into the portfolio, we present the business lending
portfolio per industry breakdown in accordance with the NAICS definition and per region and main
market. Business Lending presented in this section does not include pre-settlement, investment
and money market exposures, which are outlined in the next sections.
Cover values including guarantees received – Consumer lending portfolio - 2017
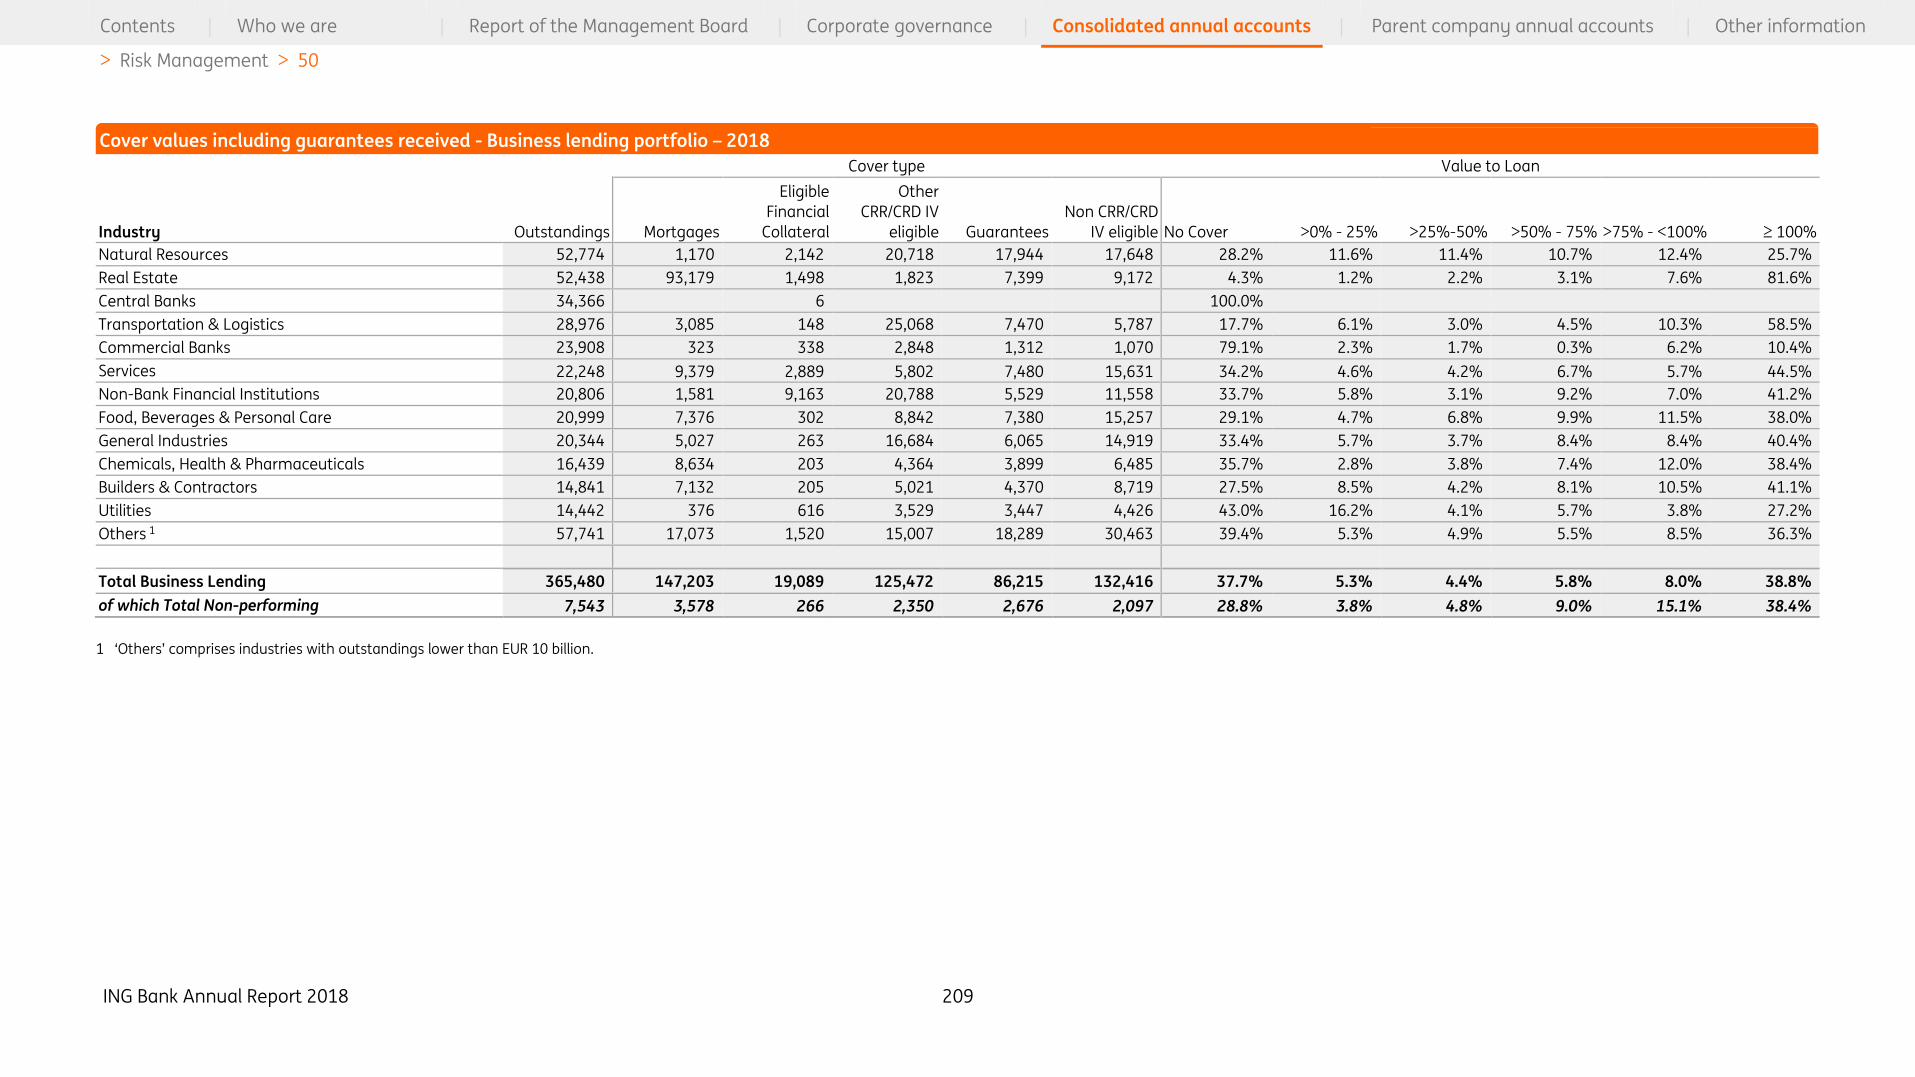
ING Bank Annual Report 2018 209
Contents | Who we are | Report of the Management Board | Corporate governance | Consolidated annual accounts | Parent company annual accounts | Other information
> Risk Management > 50
Cover type Value to Loan
Industry Outstandings Mortgages
Eligible
Financial
Collateral
Other
CRR/CRD IV
eligible Guarantees
Non CRR/CRD
IV eligible No Cover >0% - 25% >25%-50% >50% - 75% >75% - <100% ≥ 100%
Natural Resources 52,774 1,170 2,142 20,718 17,944 17,648 28.2% 11.6% 11.4% 10.7% 12.4% 25.7%
Real Estate 52,438 93,179 1,498 1,823 7,399 9,172 4.3% 1.2% 2.2% 3.1% 7.6% 81.6%
Central Banks 34,366 6 100.0%
Transportation & Logistics 28,976 3,085 148 25,068 7,470 5,787 17.7% 6.1% 3.0% 4.5% 10.3% 58.5%
Commercial Banks 23,908 323 338 2,848 1,312 1,070 79.1% 2.3% 1.7% 0.3% 6.2% 10.4%
Services 22,248 9,379 2,889 5,802 7,480 15,631 34.2% 4.6% 4.2% 6.7% 5.7% 44.5%
Non-Bank Financial Institutions 20,806 1,581 9,163 20,788 5,529 11,558 33.7% 5.8% 3.1% 9.2% 7.0% 41.2%
Food, Beverages & Personal Care 20,999 7,376 302 8,842 7,380 15,257 29.1% 4.7% 6.8% 9.9% 11.5% 38.0%
General Industries 20,344 5,027 263 16,684 6,065 14,919 33.4% 5.7% 3.7% 8.4% 8.4% 40.4%
Chemicals, Health & Pharmaceuticals 16,439 8,634 203 4,364 3,899 6,485 35.7% 2.8% 3.8% 7.4% 12.0% 38.4%
Builders & Contractors 14,841 7,132 205 5,021 4,370 8,719 27.5% 8.5% 4.2% 8.1% 10.5% 41.1%
Utilities 14,442 376 616 3,529 3,447 4,426 43.0% 16.2% 4.1% 5.7% 3.8% 27.2%
Others 1 57,741 17,073 1,520 15,007 18,289 30,463 39.4% 5.3% 4.9% 5.5% 8.5% 36.3%
Total Business Lending 365,480 147,203 19,089 125,472 86,215 132,416 37.7% 5.3% 4.4% 5.8% 8.0% 38.8%
of which Total Non-performing 7,543 3,578 266 2,350 2,676 2,097 28.8% 3.8% 4.8% 9.0% 15.1% 38.4%
1 ‘Others’ comprises industries with outstandings lower than EUR 10 billion.
Cover values including guarantees received - Business lending portfolio – 2018
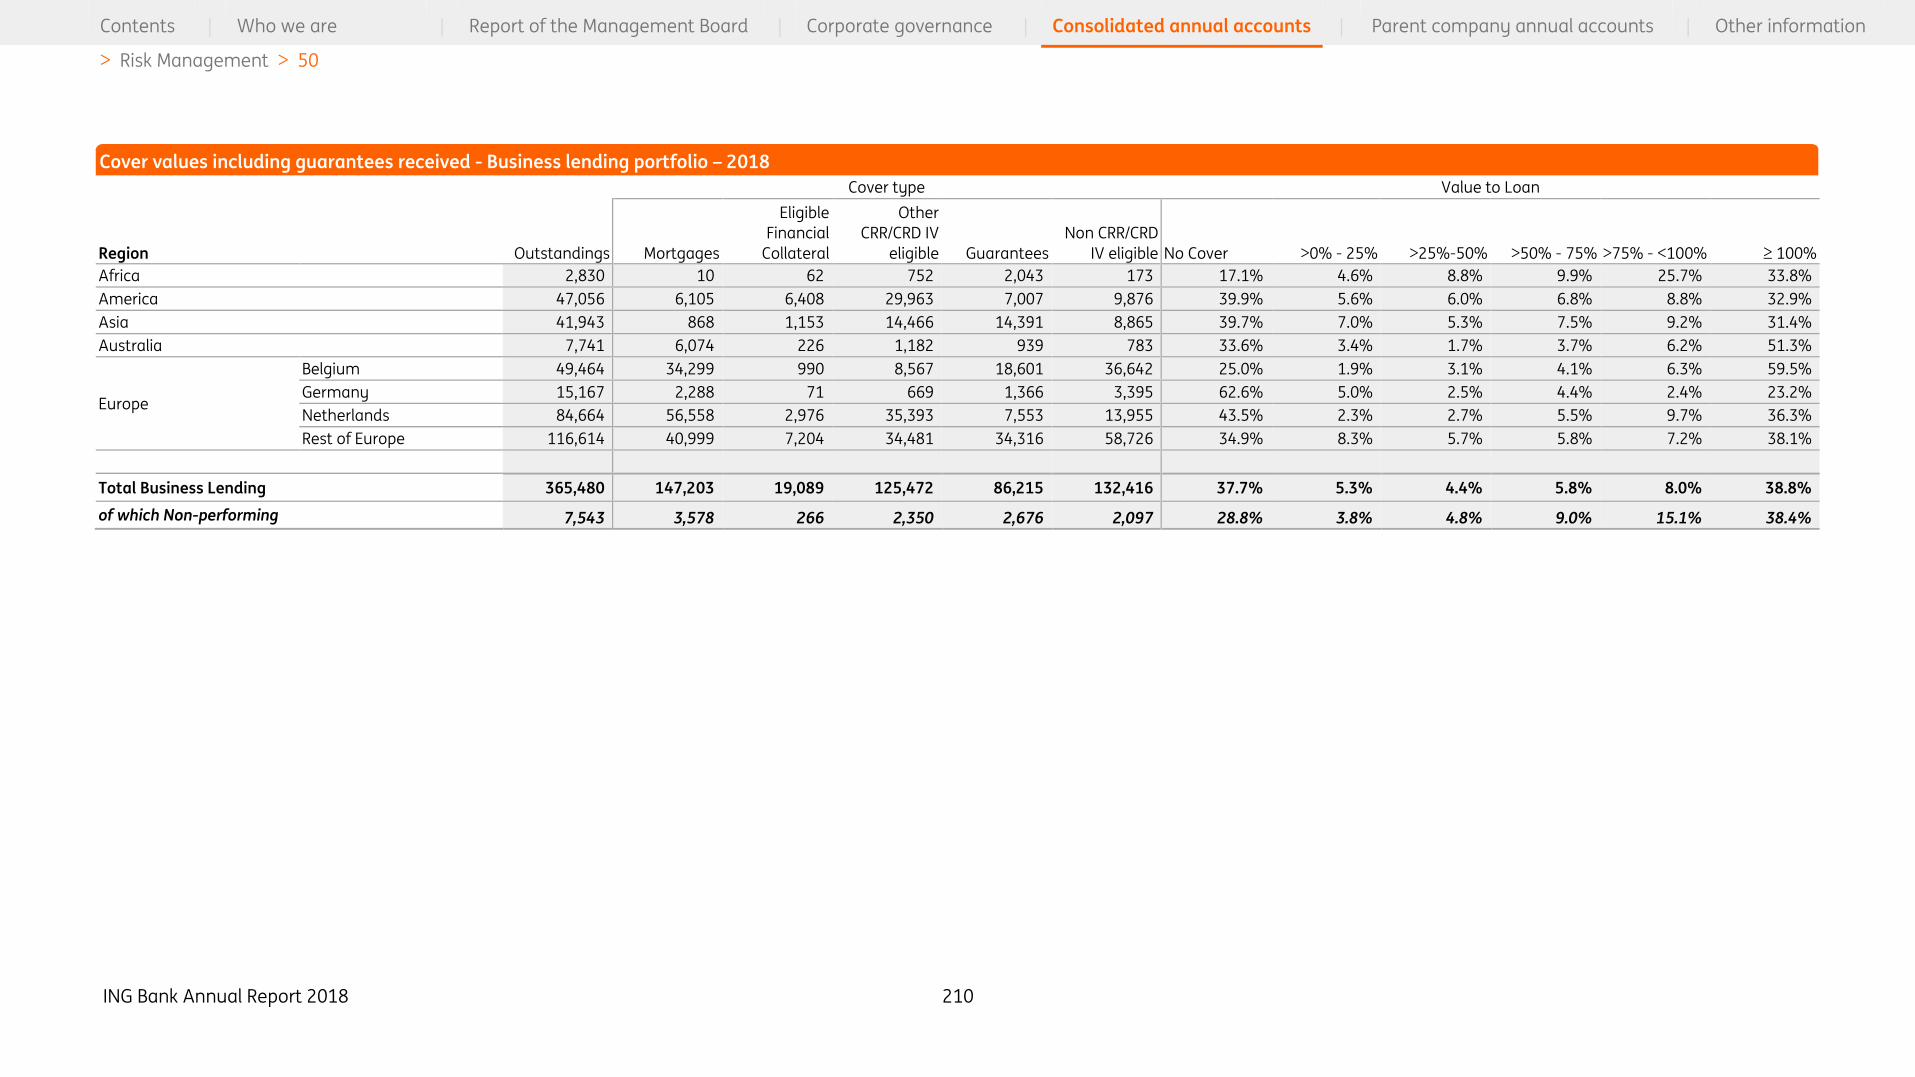
ING Bank Annual Report 2018 210
Contents | Who we are | Report of the Management Board | Corporate governance | Consolidated annual accounts | Parent company annual accounts | Other information
> Risk Management > 50
Cover type Value to Loan
Region Outstandings Mortgages
Eligible
Financial
Collateral
Other
CRR/CRD IV
eligible Guarantees
Non CRR/CRD
IV eligible No Cover >0% - 25% >25%-50% >50% - 75% >75% - <100% ≥ 100%
Africa 2,830 10 62 752 2,043 173 17.1% 4.6% 8.8% 9.9% 25.7% 33.8%
America 47,056 6,105 6,408 29,963 7,007 9,876 39.9% 5.6% 6.0% 6.8% 8.8% 32.9%
Asia 41,943 868 1,153 14,466 14,391 8,865 39.7% 7.0% 5.3% 7.5% 9.2% 31.4%
Australia 7,741 6,074 226 1,182 939 783 33.6% 3.4% 1.7% 3.7% 6.2% 51.3%
Europe
Belgium 49,464 34,299 990 8,567 18,601 36,642 25.0% 1.9% 3.1% 4.1% 6.3% 59.5%
Germany 15,167 2,288 71 669 1,366 3,395 62.6% 5.0% 2.5% 4.4% 2.4% 23.2%
Netherlands 84,664 56,558 2,976 35,393 7,553 13,955 43.5% 2.3% 2.7% 5.5% 9.7% 36.3%
Rest of Europe 116,614 40,999 7,204 34,481 34,316 58,726 34.9% 8.3% 5.7% 5.8% 7.2% 38.1%
Total Business Lending 365,480 147,203 19,089 125,472 86,215 132,416 37.7% 5.3% 4.4% 5.8% 8.0% 38.8%
of which Non-performing 7,543 3,578 266 2,350 2,676 2,097 28.8% 3.8% 4.8% 9.0% 15.1% 38.4%
Cover values including guarantees received - Business lending portfolio – 2018
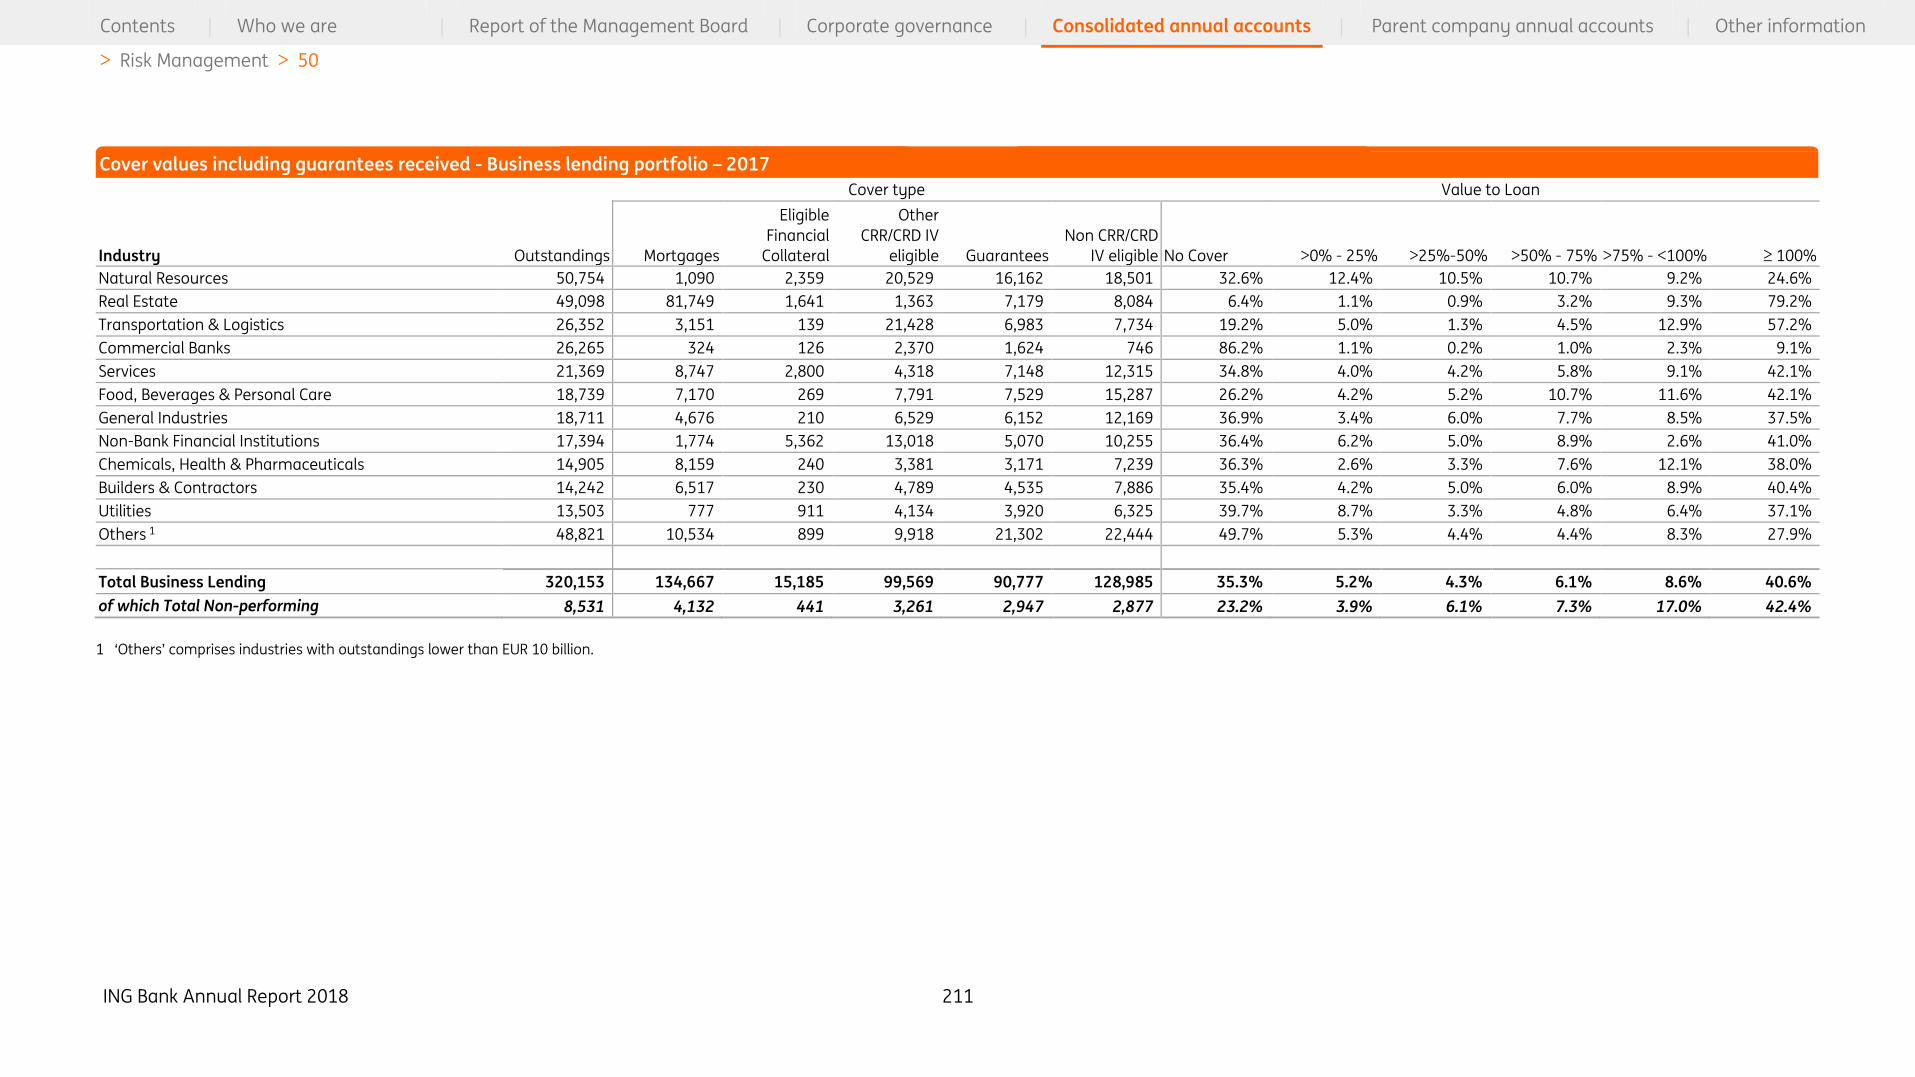
ING Bank Annual Report 2018 211
Contents | Who we are | Report of the Management Board | Corporate governance | Consolidated annual accounts | Parent company annual accounts | Other information
> Risk Management > 50
Cover type Value to Loan
Industry Outstandings Mortgages
Eligible
Financial
Collateral
Other
CRR/CRD IV
eligible Guarantees
Non CRR/CRD
IV eligible No Cover >0% - 25% >25%-50% >50% - 75% >75% - <100% ≥ 100%
Natural Resources 50,754 1,090 2,359 20,529 16,162 18,501 32.6% 12.4% 10.5% 10.7% 9.2% 24.6%
Real Estate 49,098 81,749 1,641 1,363 7,179 8,084 6.4% 1.1% 0.9% 3.2% 9.3% 79.2%
Transportation & Logistics 26,352 3,151 139 21,428 6,983 7,734 19.2% 5.0% 1.3% 4.5% 12.9% 57.2%
Commercial Banks 26,265 324 126 2,370 1,624 746 86.2% 1.1% 0.2% 1.0% 2.3% 9.1%
Services 21,369 8,747 2,800 4,318 7,148 12,315 34.8% 4.0% 4.2% 5.8% 9.1% 42.1%
Food, Beverages & Personal Care 18,739 7,170 269 7,791 7,529 15,287 26.2% 4.2% 5.2% 10.7% 11.6% 42.1%
General Industries 18,711 4,676 210 6,529 6,152 12,169 36.9% 3.4% 6.0% 7.7% 8.5% 37.5%
Non-Bank Financial Institutions 17,394 1,774 5,362 13,018 5,070 10,255 36.4% 6.2% 5.0% 8.9% 2.6% 41.0%
Chemicals, Health & Pharmaceuticals 14,905 8,159 240 3,381 3,171 7,239 36.3% 2.6% 3.3% 7.6% 12.1% 38.0%
Builders & Contractors 14,242 6,517 230 4,789 4,535 7,886 35.4% 4.2% 5.0% 6.0% 8.9% 40.4%
Utilities 13,503 777 911 4,134 3,920 6,325 39.7% 8.7% 3.3% 4.8% 6.4% 37.1%
Others 1 48,821 10,534 899 9,918 21,302 22,444 49.7% 5.3% 4.4% 4.4% 8.3% 27.9%
Total Business Lending 320,153 134,667 15,185 99,569 90,777 128,985 35.3% 5.2% 4.3% 6.1% 8.6% 40.6%
of which Total Non-performing 8,531 4,132 441 3,261 2,947 2,877 23.2% 3.9% 6.1% 7.3% 17.0% 42.4%
1 ‘Others’ comprises industries with outstandings lower than EUR 10 billion.
Cover values including guarantees received - Business lending portfolio – 2017
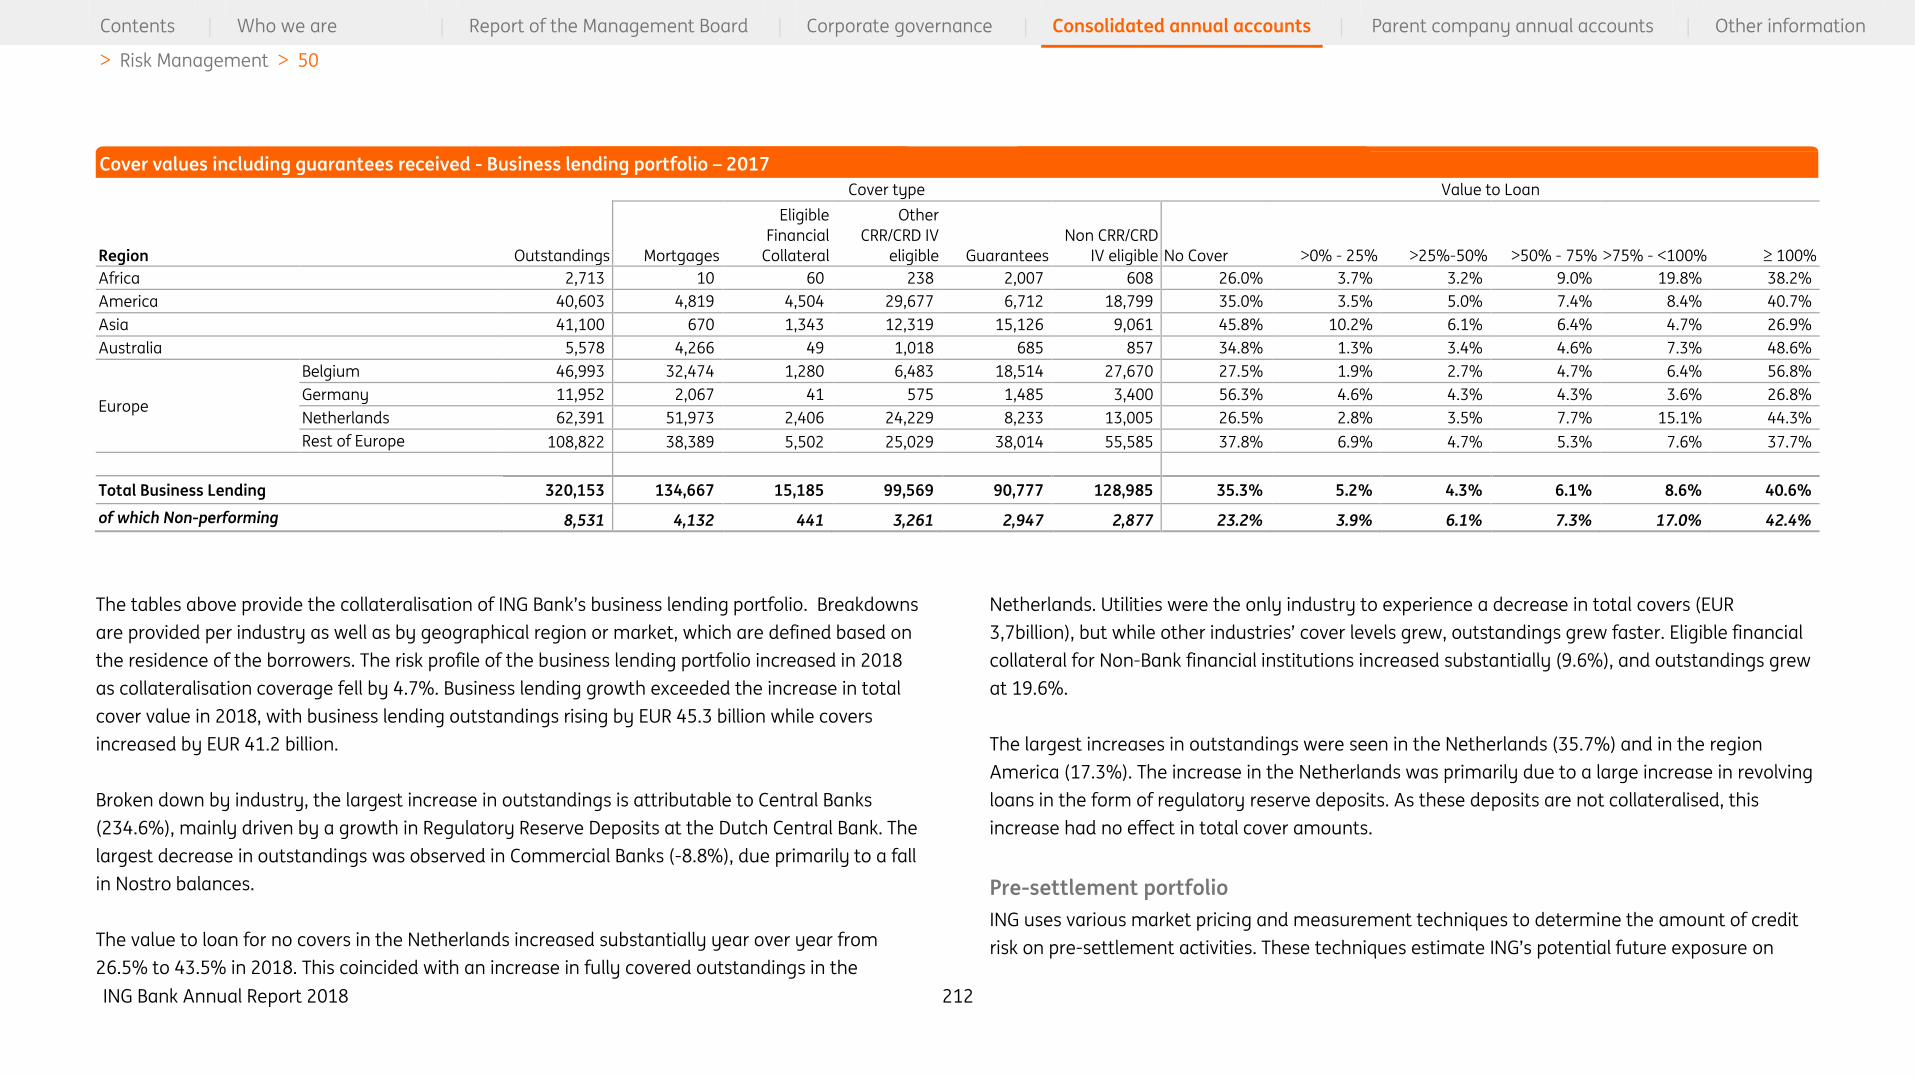
ING Bank Annual Report 2018 212
Contents | Who we are | Report of the Management Board | Corporate governance | Consolidated annual accounts | Parent company annual accounts | Other information
> Risk Management > 50
Cover type Value to Loan
Region Outstandings Mortgages
Eligible
Financial
Collateral
Other
CRR/CRD IV
eligible Guarantees
Non CRR/CRD
IV eligible No Cover >0% - 25% >25%-50% >50% - 75% >75% - <100% ≥ 100%
Africa 2,713 10 60 238 2,007 608 26.0% 3.7% 3.2% 9.0% 19.8% 38.2%
America 40,603 4,819 4,504 29,677 6,712 18,799 35.0% 3.5% 5.0% 7.4% 8.4% 40.7%
Asia 41,100 670 1,343 12,319 15,126 9,061 45.8% 10.2% 6.1% 6.4% 4.7% 26.9%
Australia 5,578 4,266 49 1,018 685 857 34.8% 1.3% 3.4% 4.6% 7.3% 48.6%
Europe
Belgium 46,993 32,474 1,280 6,483 18,514 27,670 27.5% 1.9% 2.7% 4.7% 6.4% 56.8%
Germany 11,952 2,067 41 575 1,485 3,400 56.3% 4.6% 4.3% 4.3% 3.6% 26.8%
Netherlands 62,391 51,973 2,406 24,229 8,233 13,005 26.5% 2.8% 3.5% 7.7% 15.1% 44.3%
Rest of Europe 108,822 38,389 5,502 25,029 38,014 55,585 37.8% 6.9% 4.7% 5.3% 7.6% 37.7%
Total Business Lending 320,153 134,667 15,185 99,569 90,777 128,985 35.3% 5.2% 4.3% 6.1% 8.6% 40.6%
of which Non-performing 8,531 4,132 441 3,261 2,947 2,877 23.2% 3.9% 6.1% 7.3% 17.0% 42.4%
The tables above provide the collateralisation of ING Bank’s business lending portfolio. Breakdowns
are provided per industry as well as by geographical region or market, which are defined based on
the residence of the borrowers. The risk profile of the business lending portfolio increased in 2018
as collateralisation coverage fell by 4.7%. Business lending growth exceeded the increase in total
cover value in 2018, with business lending outstandings rising by EUR 45.3 billion while covers
increased by EUR 41.2 billion.
Broken down by industry, the largest increase in outstandings is attributable to Central Banks
(234.6%), mainly driven by a growth in Regulatory Reserve Deposits at the Dutch Central Bank. The
largest decrease in outstandings was observed in Commercial Banks (-8.8%), due primarily to a fall
in Nostro balances.
The value to loan for no covers in the Netherlands increased substantially year over year from
26.5% to 43.5% in 2018. This coincided with an increase in fully covered outstandings in the
Netherlands. Utilities were the only industry to experience a decrease in total covers (EUR
3,7billion), but while other industries’ cover levels grew, outstandings grew faster. Eligible financial
collateral for Non-Bank financial institutions increased substantially (9.6%), and outstandings grew
at 19.6%.
The largest increases in outstandings were seen in the Netherlands (35.7%) and in the region
America (17.3%). The increase in the Netherlands was primarily due to a large increase in revolving
loans in the form of regulatory reserve deposits. As these deposits are not collateralised, this
increase had no effect in total cover amounts.
Pre-settlement portfolio
ING uses various market pricing and measurement techniques to determine the amount of credit
risk on pre-settlement activities. These techniques estimate ING’s potential future exposure on
Cover values including guarantees received - Business lending portfolio – 2017

ING Bank Annual Report 2018 213
Contents | Who we are | Report of the Management Board | Corporate governance | Consolidated annual accounts | Parent company annual accounts | Other information
> Risk Management > 50
individual and portfolios of trades. Master agreements and collateral agreements are frequently
entered into to reduce these credit risks.
ING matches trades with similar characteristics to determine their eligibility for offsetting. This
offsetting effect is called ‘compensation’. Therefore, ING reduces the amount by any legal netting
that may be permitted under various types of Master Agreements, such as ISDA Master
Agreements, Global Master Repurchase Agreements (GMRA), Global Master Securities Lending
Agreements (GMSLA), etc. Lastly, the amount is further reduced by any collateral that is held by
ING under Credit Support Annexes (CSAs) or other similar agreements.
The use of Central Clearing Parties (CCPs) for the settlement of derivative transactions continues to
grow and consequently the credit risk shifts more and more from the trading Counterparties to the
CCPs. In 2018, the notional Pre-Settlement exposure that was cleared via CCPs formed 58.3% of the
total notional (56.8% in 2017).
As part of its securities financing business, ING entities actively enter into agreements to sell and
buy back marketable securities. These transactions can take many legal forms. Repurchase and
reverse repurchase agreements, buy/sell-back and sell/buyback agreements, and securities
borrowing and lending agreements are the most common. As a general rule, the marketable
securities that have been received under these transactions are eligible to be resold or re-pledged
in other (similar) transactions. ING is obliged to return equivalent securities in such cases.
• The ‘Gross MtM before netting and collateral’ is the exposure calculated in accordance with the
Current Exposure Method (CEM, which in the EU regulation is referred to as the Mark-to-Market
method) without accounting for any netting or collateral benefit;
• The ‘MtM after netting’ is the exposure, according to the CEM, taking into account the benefit of
legally enforceable netting agreements (e.g. ISDAs), but without considering the benefit of
margin collateral (e.g. CSAs);
• The ‘MtM after netting and collateral’ is the exposure according to the CEM, taking into account
both the benefit of netting and marginal collateral. In other words, the gap between the ‘MtM
after netting’ and ‘MtM after netting and collateral’ is the liquid collateral (cash and securities);
and
• The outstandings column represents CEM exposure (MtM after netting plus the Potential Future
Exposure - PFE) at a 97.5% confidence level for derivatives and securities.
During 2018 the pre-settlement portfolio increased when expressed in terms of outstandings. The
pre-settlement portfolio was mainly concentrated in rest of Europe to a central counterparty
clearinghouse and commercial banks in the UK, mostly consisting of Interest Rate Derivatives, FX
Derivatives, Securities Financing and Credit Derivatives. The outstandings increase was due to
security financing to Belgian National Bank.

ING Bank Annual Report 2018 214
Contents | Who we are | Report of the Management Board | Corporate governance | Consolidated annual accounts | Parent company annual accounts | Other information
> Risk Management > 50
2018 2017
Region
Gross MtM
before netting
and collateral
MtM after
netting
MtM after
netting and
collateral Out-standings
Gross MtM
before netting
and collateral
MtM after
netting
MtM after
netting and
collateral Out-standings
Africa 49 38 38 50 107 96 85 119
America 20,671 11,110 7,239 8,276 21,296 10,864 6,846 7,690
Asia 6,723 3,565 3,312 3,617 7,150 3,663 3,020 3,542
Australia 403 288 288 328 483 264 241 532
Europe
Belgium 13,623 2,600 2,561 12,097 5,165 3,761 2,880 2,215
Germany 3,713 1,429 1,256 2,018 4,481 2,091 1,397 2,264
Netherlands 6,114 3,192 2,407 4,243 6,701 4,174 2,771 4,062
Rest of Europe 95,887 19,788 17,341 20,991 104,788 22,404 17,637 24,260
Total Pre-settlement 147,183 42,009 34,442 51,620 150,171 47,316 34,877 44,685
of which Non-performing 19 19 19 25 23 25 25 29
Credit quality
Following the higher credit risk levels seen as a result of the financial crisis and economic downturn,
credit quality has been improving since 2014 and also continued the improving trend in 2018. Regular Watch List Restructuring 1
Non-performing1
Possible ratings 1–19 1–19 11–20 20-22
Typical ratings 1–14 15–17 18–20 20-22
Deterioration in risk Not significant Significant Significant Significant
Significant intervention Not required Not required Required Required
Includes impairments No No Yes Yes
Account Ownership Front Office Front Office Front Office Front Office
Credit Risk Management Regular Regular
Credit
Restructuring
Credit
Restructuring
Primary Manager Front Office Front Office
Credit
Restructuring
Credit
Restructuring
Accounting provisioning Stage 1/2 Stage 1/2 Stage 2/3 Stage 3
1 More information on the Restructuring and Non-performing categories can be found in the Credit restructuring section.
Pre-settlement portfolio
Credit risk categories
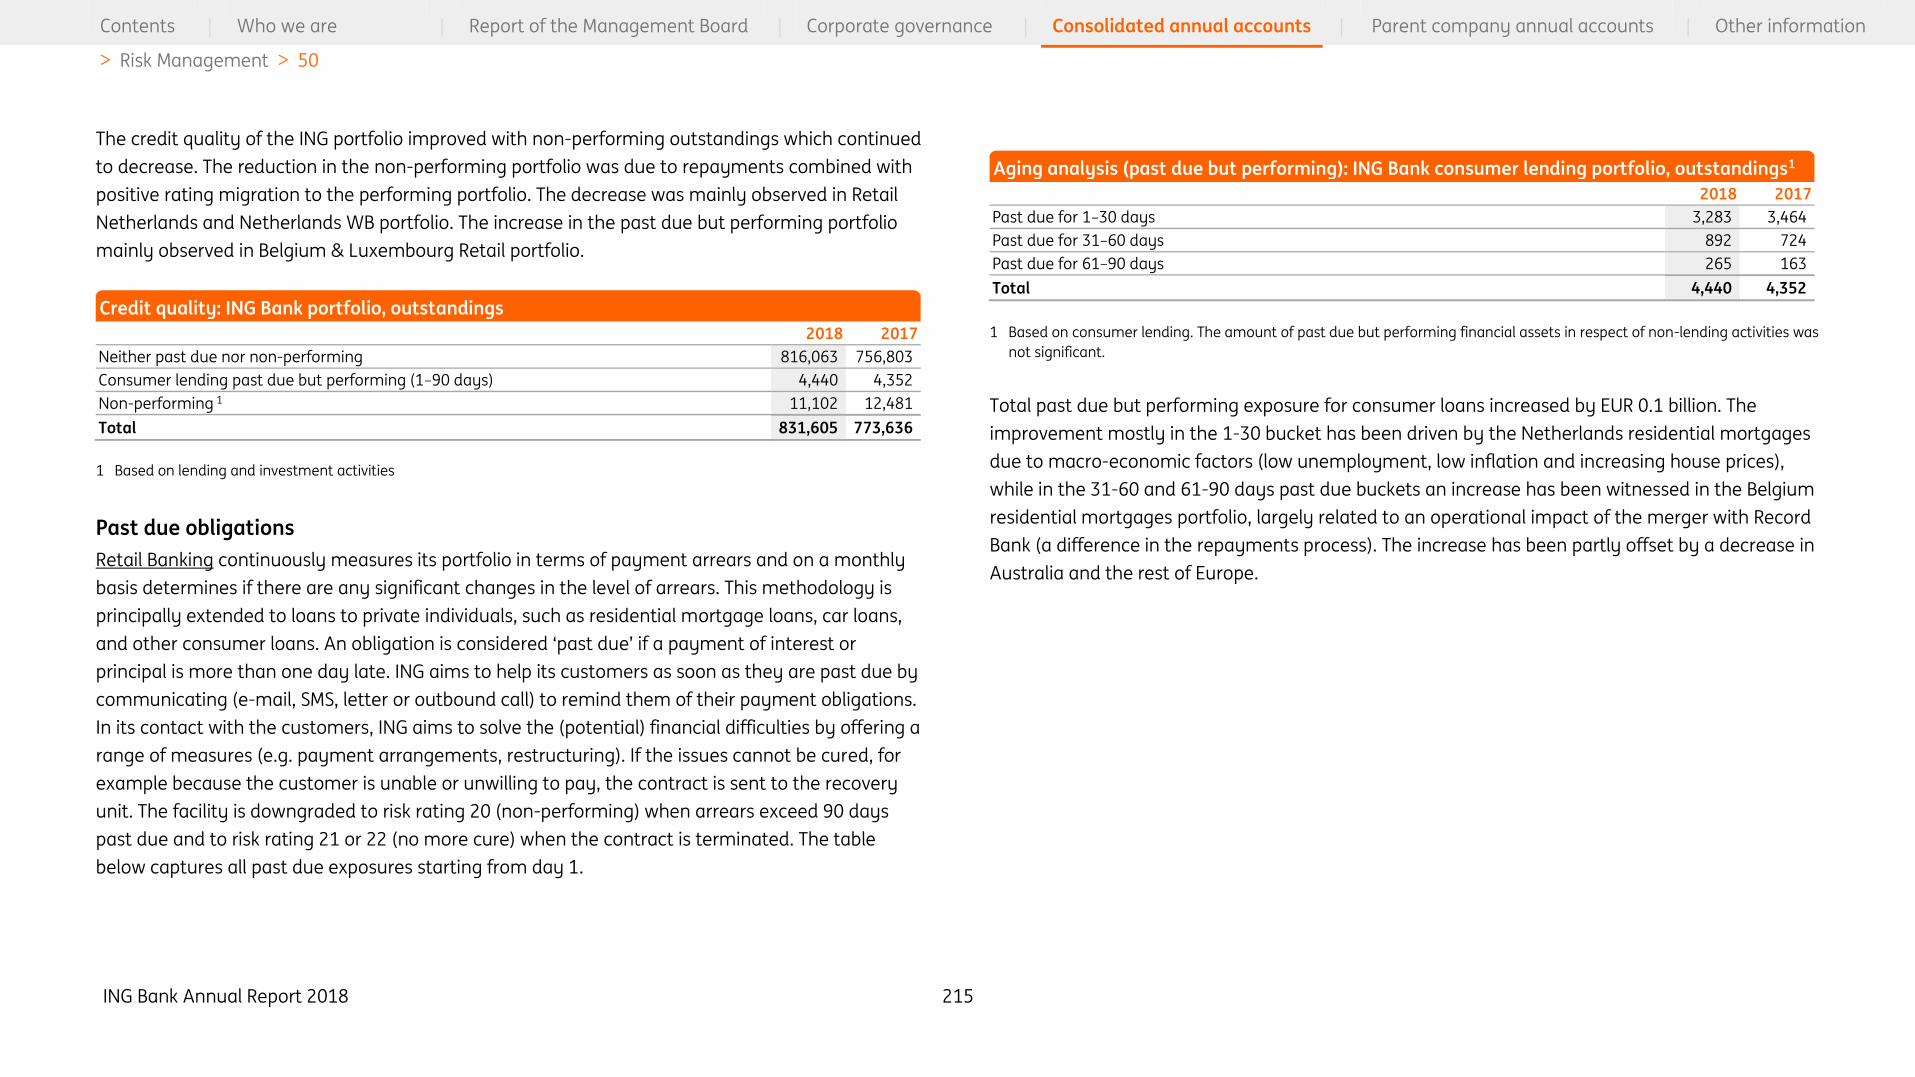
ING Bank Annual Report 2018 215
Contents | Who we are | Report of the Management Board | Corporate governance | Consolidated annual accounts | Parent company annual accounts | Other information
> Risk Management > 50
The credit quality of the ING portfolio improved with non-performing outstandings which continued
to decrease. The reduction in the non-performing portfolio was due to repayments combined with
positive rating migration to the performing portfolio. The decrease was mainly observed in Retail
Netherlands and Netherlands WB portfolio. The increase in the past due but performing portfolio
mainly observed in Belgium & Luxembourg Retail portfolio.
2018 2017
Neither past due nor non-performing 816,063 756,803
Consumer lending past due but performing (1–90 days) 4,440 4,352
Non-performing 1 11,102 12,481
Total 831,605 773,636
1 Based on lending and investment activities
Past due obligations
Retail Banking continuously measures its portfolio in terms of payment arrears and on a monthly
basis determines if there are any significant changes in the level of arrears. This methodology is
principally extended to loans to private individuals, such as residential mortgage loans, car loans,
and other consumer loans. An obligation is considered ‘past due’ if a payment of interest or
principal is more than one day late. ING aims to help its customers as soon as they are past due by
communicating (e-mail, SMS, letter or outbound call) to remind them of their payment obligations.
In its contact with the customers, ING aims to solve the (potential) financial difficulties by offering a
range of measures (e.g. payment arrangements, restructuring). If the issues cannot be cured, for
example because the customer is unable or unwilling to pay, the contract is sent to the recovery
unit. The facility is downgraded to risk rating 20 (non-performing) when arrears exceed 90 days
past due and to risk rating 21 or 22 (no more cure) when the contract is terminated. The table
below captures all past due exposures starting from day 1.
2018 2017
Past due for 1–30 days 3,283 3,464
Past due for 31–60 days 892 724
Past due for 61–90 days 265 163
Total 4,440 4,352
1 Based on consumer lending. The amount of past due but performing financial assets in respect of non-lending activities was
not significant.
Total past due but performing exposure for consumer loans increased by EUR 0.1 billion. The
improvement mostly in the 1-30 bucket has been driven by the Netherlands residential mortgages
due to macro-economic factors (low unemployment, low inflation and increasing house prices),
while in the 31-60 and 61-90 days past due buckets an increase has been witnessed in the Belgium
residential mortgages portfolio, largely related to an operational impact of the merger with Record
Bank (a difference in the repayments process). The increase has been partly offset by a decrease in
Australia and the rest of Europe.
Credit quality: ING Bank portfolio, outstandings
Aging analysis (past due but performing): ING Bank consumer lending portfolio, outstandings1
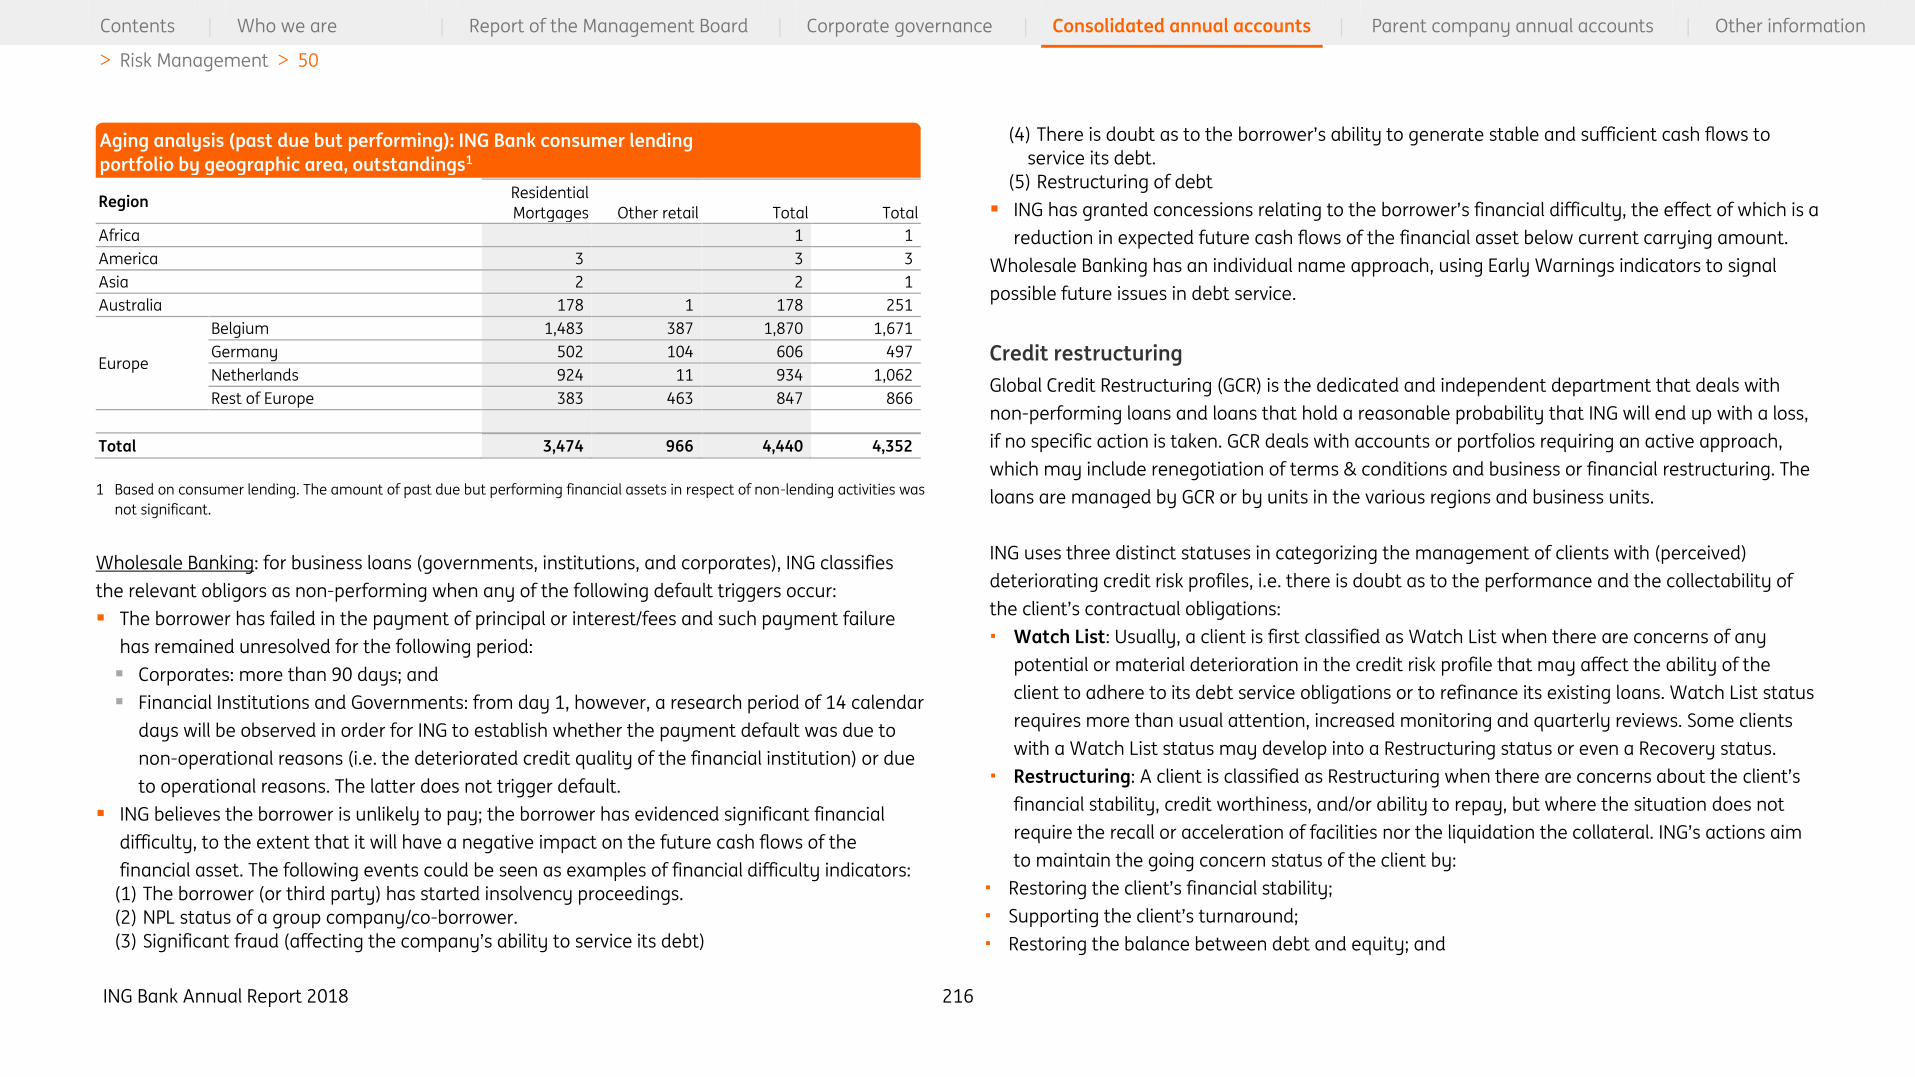
ING Bank Annual Report 2018 216
Contents | Who we are | Report of the Management Board | Corporate governance | Consolidated annual accounts | Parent company annual accounts | Other information
> Risk Management > 50
Region Residential
Mortgages Other retail Total Total
Africa 1 1
America 3 3 3
Asia 2 2 1
Australia 178 1 178 251
Europe
Belgium 1,483 387 1,870 1,671
Germany 502 104 606 497
Netherlands 924 11 934 1,062
Rest of Europe 383 463 847 866
Total 3,474 966 4,440 4,352
1 Based on consumer lending. The amount of past due but performing financial assets in respect of non-lending activities was
not significant.
Wholesale Banking: for business loans (governments, institutions, and corporates), ING classifies
the relevant obligors as non-performing when any of the following default triggers occur:
The borrower has failed in the payment of principal or interest/fees and such payment failure
has remained unresolved for the following period:
Corporates: more than 90 days; and
Financial Institutions and Governments: from day 1, however, a research period of 14 calendar
days will be observed in order for ING to establish whether the payment default was due to
non-operational reasons (i.e. the deteriorated credit quality of the financial institution) or due
to operational reasons. The latter does not trigger default.
ING believes the borrower is unlikely to pay; the borrower has evidenced significant financial
difficulty, to the extent that it will have a negative impact on the future cash flows of the
financial asset. The following events could be seen as examples of financial difficulty indicators:
(1) The borrower (or third party) has started insolvency proceedings.
(2) NPL status of a group company/co-borrower.
(3) Significant fraud (affecting the company’s ability to service its debt)
(4) There is doubt as to the borrower’s ability to generate stable and sufficient cash flows to
service its debt.
(5) Restructuring of debt
ING has granted concessions relating to the borrower’s financial difficulty, the effect of which is a
reduction in expected future cash flows of the financial asset below current carrying amount.
Wholesale Banking has an individual name approach, using Early Warnings indicators to signal
possible future issues in debt service.
Credit restructuring
Global Credit Restructuring (GCR) is the dedicated and independent department that deals with
non-performing loans and loans that hold a reasonable probability that ING will end up with a loss,
if no specific action is taken. GCR deals with accounts or portfolios requiring an active approach,
which may include renegotiation of terms & conditions and business or financial restructuring. The
loans are managed by GCR or by units in the various regions and business units.
ING uses three distinct statuses in categorizing the management of clients with (perceived)
deteriorating credit risk profiles, i.e. there is doubt as to the performance and the collectability of
the client’s contractual obligations:
• Watch List: Usually, a client is first classified as Watch List when there are concerns of any
potential or material deterioration in the credit risk profile that may affect the ability of the
client to adhere to its debt service obligations or to refinance its existing loans. Watch List status
requires more than usual attention, increased monitoring and quarterly reviews. Some clients
with a Watch List status may develop into a Restructuring status or even a Recovery status.
• Restructuring: A client is classified as Restructuring when there are concerns about the client’s
financial stability, credit worthiness, and/or ability to repay, but where the situation does not
require the recall or acceleration of facilities nor the liquidation the collateral. ING’s actions aim
to maintain the going concern status of the client by:
• Restoring the client’s financial stability;
• Supporting the client’s turnaround;
• Restoring the balance between debt and equity; and
Aging analysis (past due but performing): ING Bank consumer lending
portfolio by geographic area, outstandings1
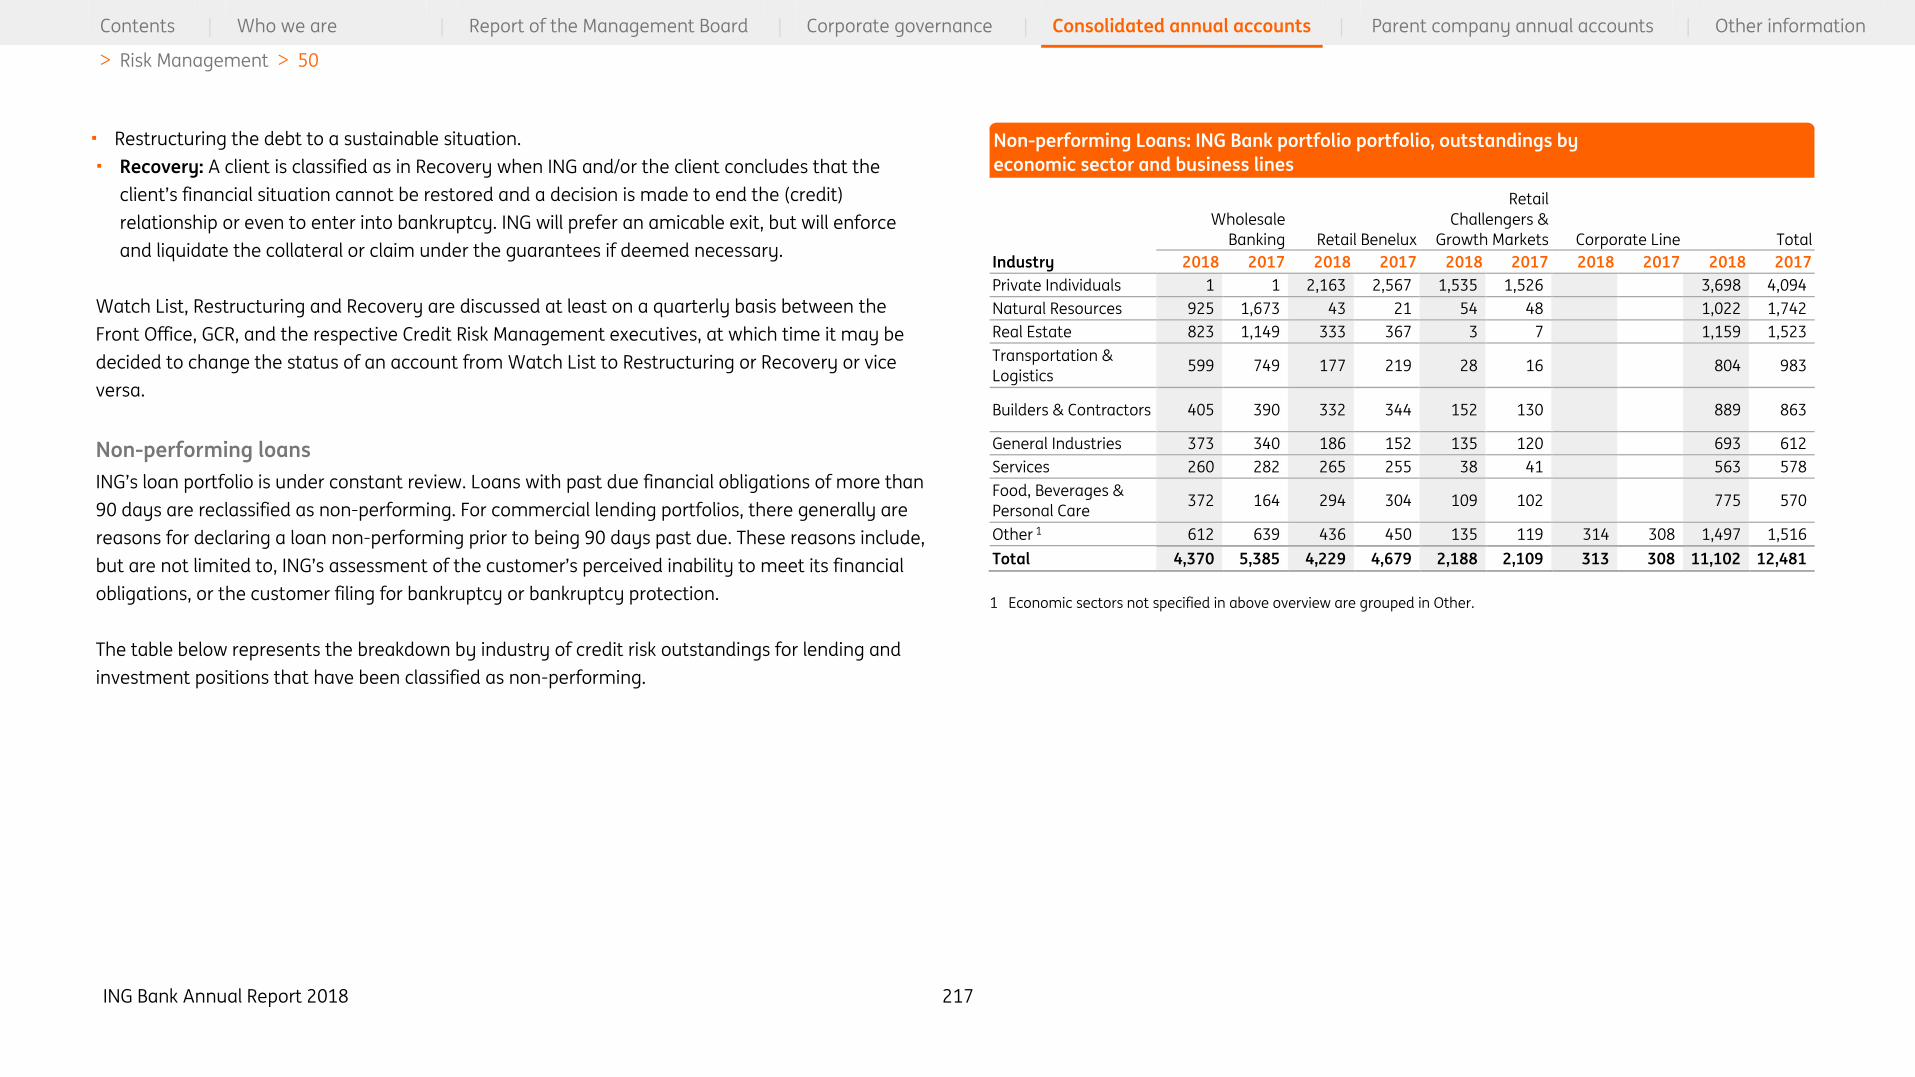
ING Bank Annual Report 2018 217
Contents | Who we are | Report of the Management Board | Corporate governance | Consolidated annual accounts | Parent company annual accounts | Other information
> Risk Management > 50
• Restructuring the debt to a sustainable situation.
• Recovery: A client is classified as in Recovery when ING and/or the client concludes that the
client’s financial situation cannot be restored and a decision is made to end the (credit)
relationship or even to enter into bankruptcy. ING will prefer an amicable exit, but will enforce
and liquidate the collateral or claim under the guarantees if deemed necessary.
Watch List, Restructuring and Recovery are discussed at least on a quarterly basis between the
Front Office, GCR, and the respective Credit Risk Management executives, at which time it may be
decided to change the status of an account from Watch List to Restructuring or Recovery or vice
versa.
Non-performing loans
ING’s loan portfolio is under constant review. Loans with past due financial obligations of more than
90 days are reclassified as non-performing. For commercial lending portfolios, there generally are
reasons for declaring a loan non-performing prior to being 90 days past due. These reasons include,
but are not limited to, ING’s assessment of the customer’s perceived inability to meet its financial
obligations, or the customer filing for bankruptcy or bankruptcy protection.
The table below represents the breakdown by industry of credit risk outstandings for lending and
investment positions that have been classified as non-performing.
Wholesale
Banking Retail Benelux
Retail
Challengers &
Growth Markets Corporate Line Total
Industry 2018 2017 2018 2017 2018 2017 2018 2017 2018 2017
Private Individuals 1 1 2,163 2,567 1,535 1,526 3,698 4,094
Natural Resources 925 1,673 43 21 54 48 1,022 1,742
Real Estate 823 1,149 333 367 3 7 1,159 1,523
Transportation &
Logistics 599 749 177 219 28 16 804 983
Builders & Contractors 405 390 332 344 152 130 889 863
General Industries 373 340 186 152 135 120 693 612
Services 260 282 265 255 38 41 563 578
Food, Beverages &
Personal Care 372 164 294 304 109 102 775 570
Other 1 612 639 436 450 135 119 314 308 1,497 1,516
Total 4,370 5,385 4,229 4,679 2,188 2,109 313 308 11,102 12,481
1 Economic sectors not specified in above overview are grouped in Other.
Non-performing Loans: ING Bank portfolio portfolio, outstandings by
economic sector and business lines

ING Bank Annual Report 2018 218
Contents | Who we are | Report of the Management Board | Corporate governance | Consolidated annual accounts | Parent company annual accounts | Other information
> Risk Management > 50
Region Total Total
Industry Netherl-
ands
Belg-
ium
Germ-
any
Rest of
Europe
Austr-
alia Asia
Ame-
rica Africa 2018 2017
Private Individuals 973 1,137 671 679 230 2 4 1 3,698 4,094
Natural Resources 105 27 169 116 192 322 91 1,022 1,742
Real Estate 369 213 33 542 1 1,159 1,523
Transportation &
Logistics 348 50 1 299 42 10 55 804 983
Builders & Contractors 146 275 1 381 87 889 863
General Industries 153 114 12 374 41 693 612
Services 148 256 115 7 36 563 578
Food, Beverages &
Personal Care 210 125 27 212 26 176 775 570
Other 1 670 238 3 477 55 55 1,497 1,516
Total 3,122 2,435 748 3,248 387 237 777 148 11,102 12,481
1 Economic sectors not specified in above overview are grouped in Other.
Non-Performing portfolio decreased within ING Bank over 2018. The overall outstandings decrease
in non-performing loans were due to positive risk migration and repayments. The biggest decrease
was witnessed in Netherlands Retail and Netherlands WB portfolio. In Netherlands Retail, the
biggest decrease was observed in residential mortgages portfolio.
In Netherlands, EUR 973 million of the non-performing loan portfolio consisted of loans to private
individuals, of which EUR 834 million were residential mortgages. In Belgium, almost half of the
non-performing portfolio consisted of loans to private individuals of which EUR 883 million was
residential mortgages. Similarly, in Germany, more than half of the non-performing portfolio
consisted of residential mortgages.
Loan Loss Provisioning
As of 1 January 2018, the IFRS 9 accounting rules on loan loss provisioning have been
implemented. These accounting rules do not change the actual credit losses, but have an impact
on the timing of when these losses are reflected in the P&L. Under IFRS 9 loan loss provisions are
booked given expected losses, whereas under the IAS 39 accounting practice loan loss provisions
were booked from the moment losses were incurred. More specifically, loan loss provisioning
becomes more forward-looking under IFRS 9 partly due to the fact that provisions will be based on
the macroeconomic outlook, amongst other factors. Furthermore, loan loss provisioning will be
calculated on the lifetime expected losses for assets that have experienced a significant
deterioration in credit quality. As a result of these elements, loan loss provisioning in the P&L could
become more volatile. More information on the impairment methodology for financial assets under
IFRS 9 can be found in ‘Note 1 Accounting policies’ under part b) IFRS 9 ‘Financial instruments’ -
Accounting policies applied from 1 January 2018 sub-section iv) Impairment of financial assets.
Non-performing Loans: ING Bank portfolio, outstandings by economic
sectors and geographical area

ING Bank Annual Report 2018 219
Contents | Who we are | Report of the Management Board | Corporate governance | Consolidated annual accounts | Parent company annual accounts | Other information
> Risk Management > 50
2018 Stage 1 Stage 2 Stage 3 Total
Rating class Outstandings Allowance Outstandings Allowance Outstandings Allowance Outstandings Allowance
Investment grade
1 (AAA) 67,543 1 67,543 1
2-4 (AA) 63,357 3 21 63,378 3
5-7 (A) 95,514 11 1,694 97,208 11
8-10 (BBB) 247,452 54 3,968 5 251,420 59
Non-Investment grade
11-13 (BB) 178,318 227 9,052 72 187,370 299
14-16 (B) 25,241 197 18,723 388 43,964 585
17 (CCC) 294 8 3,987 157 4,281 165
Substandard grade 18 (CC) 3,399 147 3,399 147
19 (C) 1,979 156 1,979 156
NPL grade 20-22 (D) 10,575 3,139 10,575 3,139
Total 677,719 501 42,823 925 10,575 3,139 731,117 4,565
1 Total outstanding excludes non-IFRS 9 eligible assets (for such exposures no IFRS stage is available: mainly guarantees,
letters of credit and pre-settlement exposures).
2 Total provisions exclude EUR 2 million Purchased Credit Impaired.
3 For a reference to the Notes in the Annual Report we refer to the table ‘Reconciliation between credit risk categories and
financial position’
.
Of the total ING Bank portfolio, 81.5% of total outstandings is classified as stage 1, while stage 2
and 3 make up 5.1% and 1.3% of total outstandings, respectively. The remaining 12.1% of the
outstandings is not measured in accordance to IFRS 9 impairments (mainly guarantees, letters of
credit and pre-settlement exposures).
Investment grade outstandings is 84.8% stage 1 and 1.0% stage 2. Non-Investment grade is 79.6%
% stage 1 and 12.4% stage 2. Substandard grade is 96.8% stage 2, while 94.2% of NPL grade
outstandings is classified as stage 3 (the rest of the NPL outstandings is not eligible for IFRS 9).
Sensitivity analysis of key sources of estimation uncertainty
The introduction IFRS 9, with its inherent complexities and potential impact on the carrying
amounts of our assets and liabilities, represents a key source of estimation uncertainty. In
particular, the Group’s reportable ECL numbers are most sensitive to the forward-looking
macroeconomic forecasts used as model inputs, the probability-weights applied to each of the
three scenarios, and the criteria for identifying a significant increase in credit risk. As such, these
crucial components require consultation and management judgement, and are subject to
extensive governance.
• Forward-looking macroeconomics used as model inputs
As a baseline for IFRS 9, the Group use the consensus outlook for economic variables. The Oxford
Economics’ Global Economic Model (OEGEM) is then used to complement the consensus with
ING Bank portfolio per IFRS 9 stage and rating class1,2,3
ING Bank Annual Report 2018 220
Contents | Who we are | Report of the Management Board | Corporate governance | Consolidated annual accounts | Parent company annual accounts | Other information
> Risk Management > 50
consistent projections for variables for which there are no consensus estimates available (most
notably HPI and unemployment), and to ensure general consistency of the scenarios.
The Group’s consensus view of the baseline scenario suggests economic growth will level off over
the initial (three year) forecast period, as the pace of expansion in the main advanced economies
and emerging markets is likely to wane. For the Eurozone, as output gaps close and monetary
policy begins to normalize, growth is expected to decline. For the US, the near-term outlook is still
positive, but over the forecast period we expect growth to fall below the recent trend as the impact
of tax cuts and of higher interest rates begin to take effect. The Group continues to monitor the
potential escalation of an international trade conflict, and the likely outcome of any Brexit deal,
which, at present remains unclear.
The downside scenario sees a relatively synchronized global downturn with economic growth in
advanced economies falling close to zero, and emerging markets suffering a pronounced
slowdown. The upside scenario sees economic growth returning to rates not seen since the
financial crisis and a return to pre-crisis unemployment rates.
• Probability weights applied to each of the three scenarios
The alternative scenarios are based on the forecast errors of the OEGEM. To understand the
baseline level of uncertainty around any forecast, Oxford Economics keeps track of all its forecast
errors of the past 20 years. The distribution of forecast errors for GDP, unemployment, house prices
and share prices is applied to the baseline forecast creating a broad range of alternative outcomes.
For the downside scenario, ING has chosen for the 90th percentile of that distribution because this
corresponds with how within risk management earnings at risk is being defined. The upside
scenario is represented by the 10th percentile of the distribution. The distribution of the scenarios
for economic growth, taking into account the applicable percentile of the distribution, is resulting in
the upside scenario to be weighted at 20%, the downside scenario to be weighted at 20% and
consequently, the base case scenario to be weighted at 60%.
Based on the above two sources of estimation uncertainty, analysis on the sensitivity of key
forward-looking macroeconomic inputs used in the ECL collective-assessment modelling process
and the probability-weights applied to each of the three scenarios is presented below. The
countries included in the analysis are for the Group’s most significant geographic regions, in terms
of both gross contribution to reportable ECL, and sensitivity of ECL to forward-looking
macroeconomics. Accordingly, the Group considers these portfolios to present the most significant
risk of resulting in a material adjustment to the carrying amount of financial assets within the next
financial year. The Group also observes that, in general, the Wholesale business is more sensitive to
the impact of forward-looking macroeconomic scenarios.
Real GPD, Unemployment rate and HPI (in that order) are considered the variables with the largest
impact on the LLP. This is supported by statistical analysis. These forward-looking macroeconomics
(amongst others) are used in the calculation of the Group’s un-weighted ECLs, which are applied
the probability-weightings as disclosed, to arrive at the reportable ECL for collectively-assessed
assets. Whilst the table does give a high-level indication of the sensitivity of the outputs to the
different scenarios, it does not provide insight on the interdependencies and correlations between
different macroeconomic variable inputs. Furthermore, in addition to forward-looking
macroeconomics, there are a number of other model inputs and processes which contribute to the
calculation of un-weighted ECLs. Any sensitivity analysis which relies on this data should consider
these complexities.
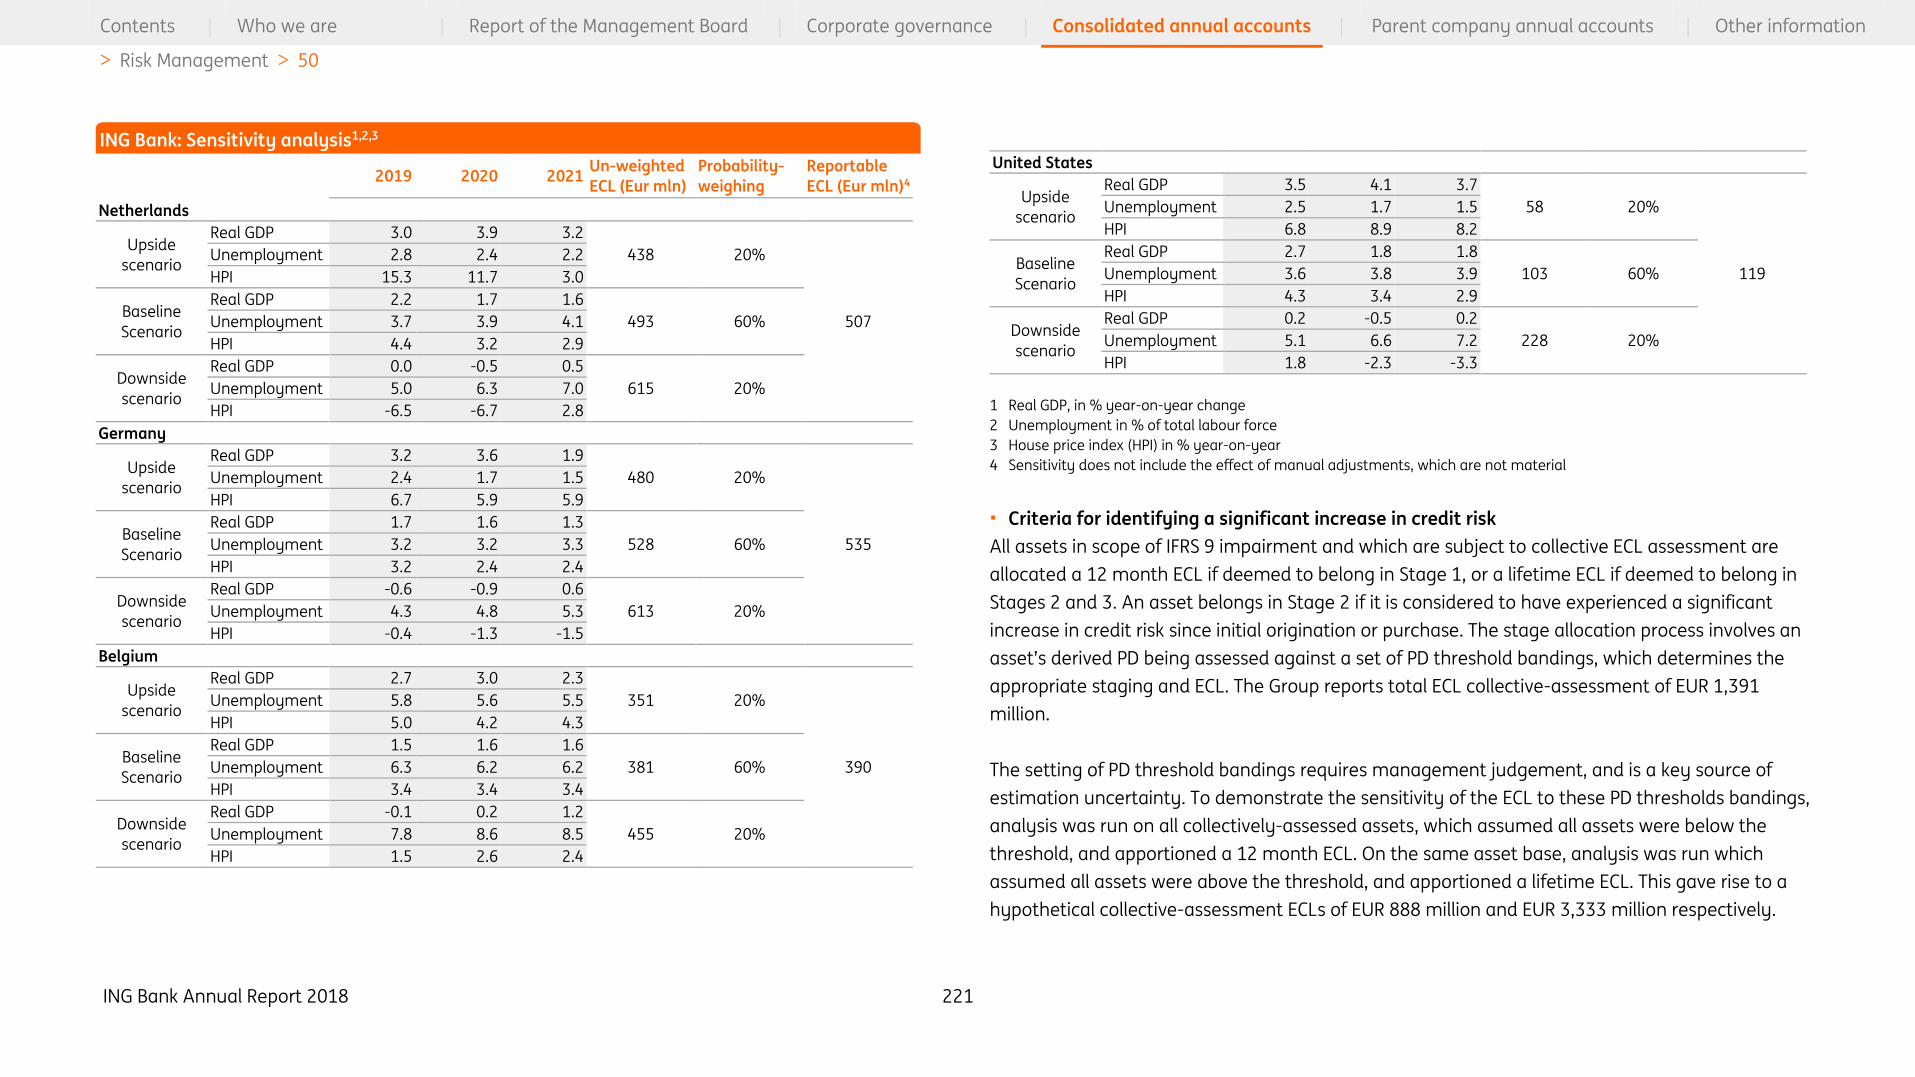
ING Bank Annual Report 2018 221
Contents | Who we are | Report of the Management Board | Corporate governance | Consolidated annual accounts | Parent company annual accounts | Other information
> Risk Management > 50
2019 2020 2021 Un-weighted
ECL (Eur mln)
Probability-
weighing
Reportable
ECL (Eur mln)4
Netherlands
Upside
scenario
Real GDP 3.0 3.9 3.2
438 20%
507
Unemployment 2.8 2.4 2.2
HPI 15.3 11.7 3.0
Baseline
Scenario
Real GDP 2.2 1.7 1.6
493 60% Unemployment 3.7 3.9 4.1
HPI 4.4 3.2 2.9
Downside
scenario
Real GDP 0.0 -0.5 0.5
615 20% Unemployment 5.0 6.3 7.0
HPI -6.5 -6.7 2.8
Germany
Upside
scenario
Real GDP 3.2 3.6 1.9
480 20%
535
Unemployment 2.4 1.7 1.5
HPI 6.7 5.9 5.9
Baseline
Scenario
Real GDP 1.7 1.6 1.3
528 60% Unemployment 3.2 3.2 3.3
HPI 3.2 2.4 2.4
Downside
scenario
Real GDP -0.6 -0.9 0.6
613 20% Unemployment 4.3 4.8 5.3
HPI -0.4 -1.3 -1.5
Belgium
Upside
scenario
Real GDP 2.7 3.0 2.3
351 20%
390
Unemployment 5.8 5.6 5.5
HPI 5.0 4.2 4.3
Baseline
Scenario
Real GDP 1.5 1.6 1.6
381 60% Unemployment 6.3 6.2 6.2
HPI 3.4 3.4 3.4
Downside
scenario
Real GDP -0.1 0.2 1.2
455 20% Unemployment 7.8 8.6 8.5
HPI 1.5 2.6 2.4
United States
Upside
scenario
Real GDP 3.5 4.1 3.7
58 20%
119
Unemployment 2.5 1.7 1.5
HPI 6.8 8.9 8.2
Baseline
Scenario
Real GDP 2.7 1.8 1.8
103 60% Unemployment 3.6 3.8 3.9
HPI 4.3 3.4 2.9
Downside
scenario
Real GDP 0.2 -0.5 0.2
228 20% Unemployment 5.1 6.6 7.2
HPI 1.8 -2.3 -3.3
1 Real GDP, in % year-on-year change
2 Unemployment in % of total labour force
3 House price index (HPI) in % year-on-year
4 Sensitivity does not include the effect of manual adjustments, which are not material
• Criteria for identifying a significant increase in credit risk
All assets in scope of IFRS 9 impairment and which are subject to collective ECL assessment are
allocated a 12 month ECL if deemed to belong in Stage 1, or a lifetime ECL if deemed to belong in
Stages 2 and 3. An asset belongs in Stage 2 if it is considered to have experienced a significant
increase in credit risk since initial origination or purchase. The stage allocation process involves an
asset’s derived PD being assessed against a set of PD threshold bandings, which determines the
appropriate staging and ECL. The Group reports total ECL collective-assessment of EUR 1,391
million.
The setting of PD threshold bandings requires management judgement, and is a key source of
estimation uncertainty. To demonstrate the sensitivity of the ECL to these PD thresholds bandings,
analysis was run on all collectively-assessed assets, which assumed all assets were below the
threshold, and apportioned a 12 month ECL. On the same asset base, analysis was run which
assumed all assets were above the threshold, and apportioned a lifetime ECL. This gave rise to a
hypothetical collective-assessment ECLs of EUR 888 million and EUR 3,333 million respectively.
ING Bank: Sensitivity analysis1,2,3
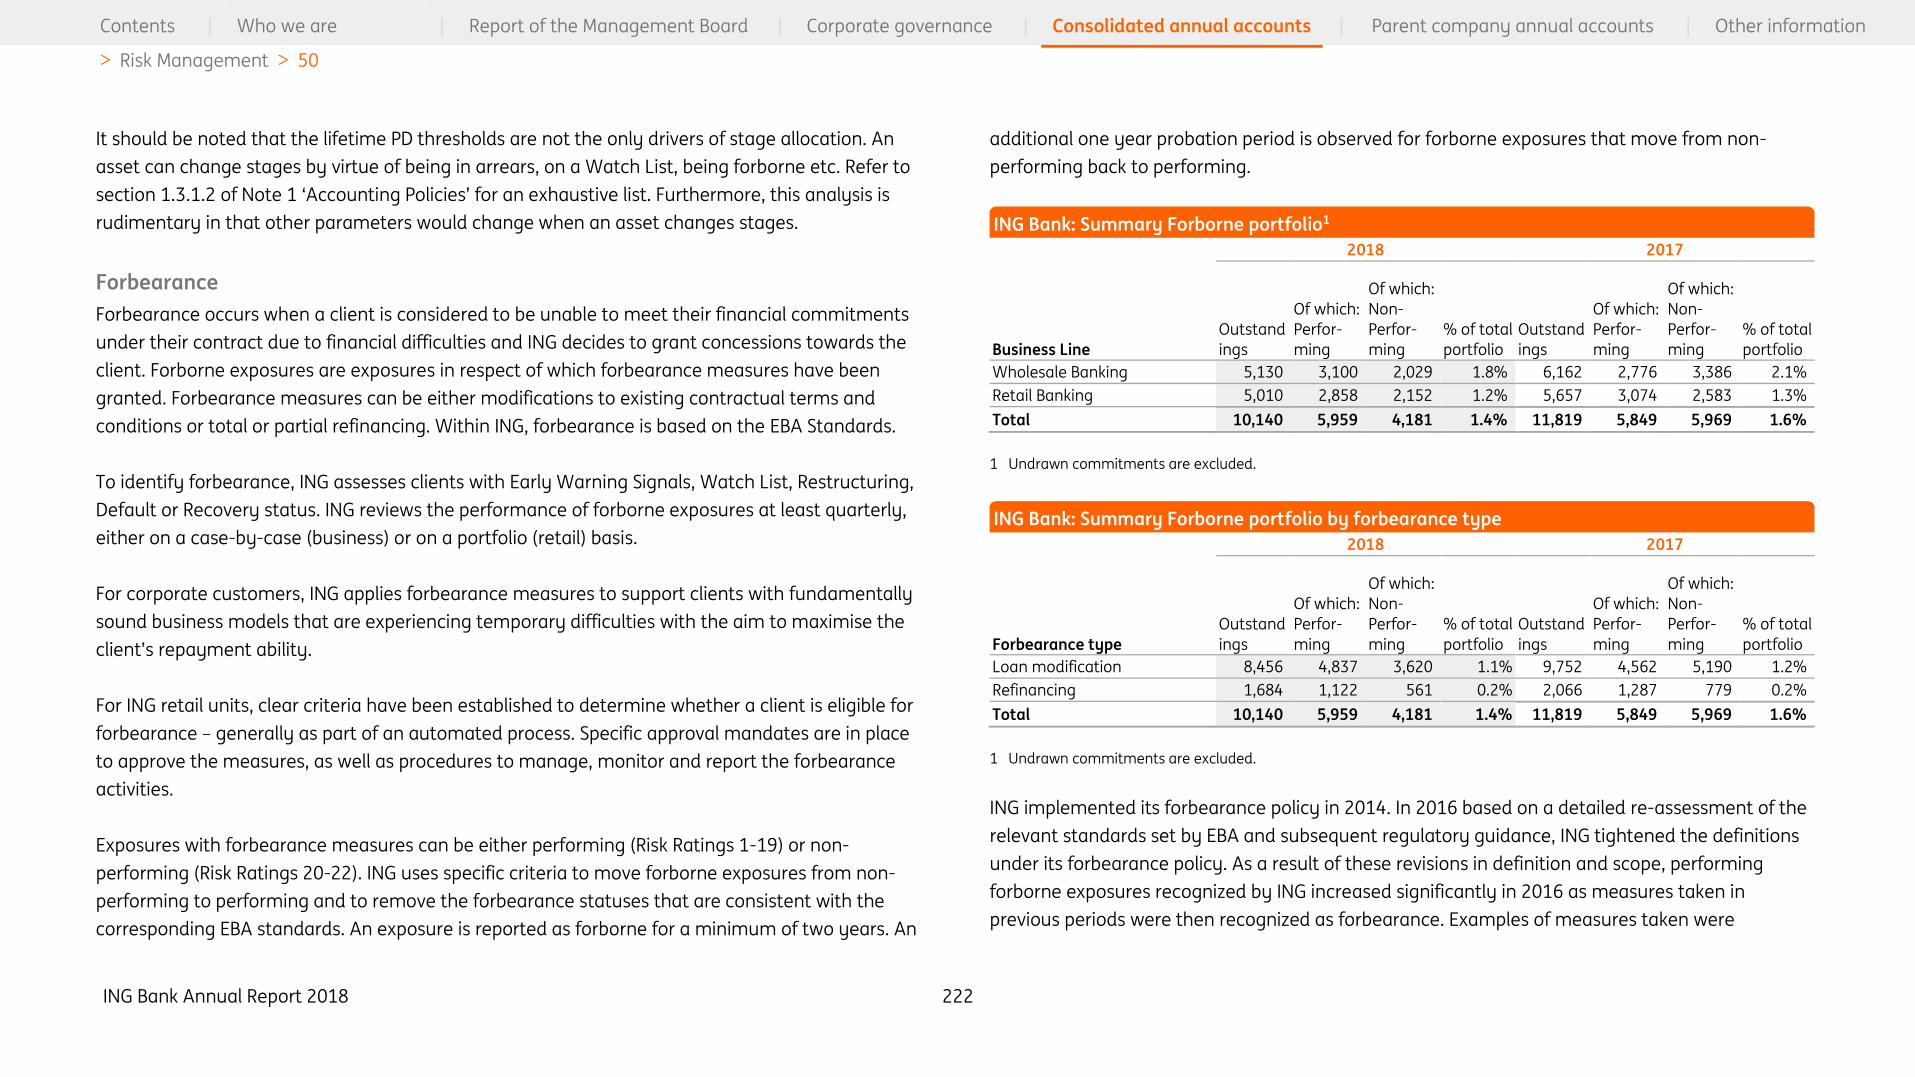
ING Bank Annual Report 2018 222
Contents | Who we are | Report of the Management Board | Corporate governance | Consolidated annual accounts | Parent company annual accounts | Other information
> Risk Management > 50
It should be noted that the lifetime PD thresholds are not the only drivers of stage allocation. An
asset can change stages by virtue of being in arrears, on a Watch List, being forborne etc. Refer to
section 1.3.1.2 of Note 1 ‘Accounting Policies’ for an exhaustive list. Furthermore, this analysis is
rudimentary in that other parameters would change when an asset changes stages.
Forbearance
Forbearance occurs when a client is considered to be unable to meet their financial commitments
under their contract due to financial difficulties and ING decides to grant concessions towards the
client. Forborne exposures are exposures in respect of which forbearance measures have been
granted. Forbearance measures can be either modifications to existing contractual terms and
conditions or total or partial refinancing. Within ING, forbearance is based on the EBA Standards.
To identify forbearance, ING assesses clients with Early Warning Signals, Watch List, Restructuring,
Default or Recovery status. ING reviews the performance of forborne exposures at least quarterly,
either on a case-by-case (business) or on a portfolio (retail) basis.
For corporate customers, ING applies forbearance measures to support clients with fundamentally
sound business models that are experiencing temporary difficulties with the aim to maximise the
client’s repayment ability.
For ING retail units, clear criteria have been established to determine whether a client is eligible for
forbearance – generally as part of an automated process. Specific approval mandates are in place
to approve the measures, as well as procedures to manage, monitor and report the forbearance
activities.
Exposures with forbearance measures can be either performing (Risk Ratings 1-19) or non-
performing (Risk Ratings 20-22). ING uses specific criteria to move forborne exposures from non-
performing to performing and to remove the forbearance statuses that are consistent with the
corresponding EBA standards. An exposure is reported as forborne for a minimum of two years. An
additional one year probation period is observed for forborne exposures that move from non-
performing back to performing.
2018 2017
Business Line
Outstand
ings
Of which:
Perfor-
ming
Of which:
Non-
Perfor-
ming
% of total
portfolio
Outstand
ings
Of which:
Perfor-
ming
Of which:
Non-
Perfor-
ming
% of total
portfolio
Wholesale Banking 5,130 3,100 2,029 1.8% 6,162 2,776 3,386 2.1%
Retail Banking 5,010 2,858 2,152 1.2% 5,657 3,074 2,583 1.3%
Total 10,140 5,959 4,181 1.4% 11,819 5,849 5,969 1.6%
1 Undrawn commitments are excluded.
2018 2017
Forbearance type
Outstand
ings
Of which:
Perfor-
ming
Of which:
Non-
Perfor-
ming
% of total
portfolio
Outstand
ings
Of which:
Perfor-
ming
Of which:
Non-
Perfor-
ming
% of total
portfolio
Loan modification 8,456 4,837 3,620 1.1% 9,752 4,562 5,190 1.2%
Refinancing 1,684 1,122 561 0.2% 2,066 1,287 779 0.2%
Total 10,140 5,959 4,181 1.4% 11,819 5,849 5,969 1.6%
1 Undrawn commitments are excluded.
ING implemented its forbearance policy in 2014. In 2016 based on a detailed re-assessment of the
relevant standards set by EBA and subsequent regulatory guidance, ING tightened the definitions
under its forbearance policy. As a result of these revisions in definition and scope, performing
forborne exposures recognized by ING increased significantly in 2016 as measures taken in
previous periods were then recognized as forbearance. Examples of measures taken were
ING Bank: Summary Forborne portfolio1
ING Bank: Summary Forborne portfolio by forbearance type

ING Bank Annual Report 2018 223
Contents | Who we are | Report of the Management Board | Corporate governance | Consolidated annual accounts | Parent company annual accounts | Other information
> Risk Management > 50
commercially justifiable measures, modifications of covenants as well as waivers of covenant
breaches.
As per December 2018 ING’s total forborne portfolio decreased by EUR 1.7 billion (14%) to EUR 10.1
billion, mainly driven by Wholesale Banking (EUR -1.0 billion). The scope of forbearance has been
narrowed down in accordance with the policy ”Managing Special Assets: Watch List Restructuring
and Recovery”, and as from 2Q18 financial guarantees and letters of credit are excluded, reducing
total forborne portfolio by EUR 249 million.
Wholesale Banking
As per December 2018, Wholesale Banking forborne portfolio amounted to EUR 5.1 billion, which
represented 1.8% of the total Wholesale Banking portfolio.
2018 2017
Region
Outstand
ings
Of which:
Perfor-
ming
Of which:
Outstand
ings
Of which:
Perfor-
ming
Of which:
Non-
Perfor-
ming
Non-
Perfor-
ming
Europe
Netherlands 1,148 687 461 1,593 816 777
Belgium 131 102 29 223 105 118
Germany 127 94 33 45 23 22
Rest of Europe 1,896 1,081 815 2,456 867 1,589
Africa 148 55 93 156 84 72
America 1,173 695 478 1,212 584 628
Asia 378 300 78 428 291 137
Australia 128 86 42 49 7 42
Total 5,130 3,100 2,029 6,162 2,776 3,386
1 Undrawn commitments are excluded.
Wholesale Banking: Forborne portfolio by geographical area1

ING Bank Annual Report 2018 224
Contents | Who we are | Report of the Management Board | Corporate governance | Consolidated annual accounts | Parent company annual accounts | Other information
> Risk Management > 50
2018 2017
Industry
Outstand
ings
Of which:
Perfor-
ming
Of which:
Outstand
ings
Of which:
Perfor-
ming
Of which:
Non-
Perfor-
ming
Non-
Perfor-
ming
Natural Resources 1,474 943 532 1,995 743 1,251
Real Estate 999 601 398 1,467 824 643
Transportation & Logistics 868 445 423 988 398 590
General Industries 405 193 212 329 140 189
Food, Beverages & Personal Care 244 161 83 199 139 60
Chemicals, Health & Pharmaceuticals 189 171 19 56 52 4
Utilities 181 30 152 177 9 168
Builders & Contractors 146 37 109 435 174 261
Services 138 85 53 289 137 151
Automotive 134 131 3 5 3 3
Retail 118 84 34 82 56 26
Telecom 89 88 1 39 14 25
Other 144 132 12 101 86 15
Total 5,130 3,100 2,029 6,162 2,776 3,386
1 Undrawn commitments are excluded.
The main concentration of forborne portfolio in a single country was in the Netherlands with 22%
(2017: 26%) of the total Wholesale Banking forborne portfolio, and 23% (2017: 23%) of the total
non-performing forborne portfolio.
Wholesale Banking forborne portfolio decreased by EUR 1.0 billion compared to 2017, of which the
non-performing forborne portfolio decreased by EUR 1.4 billion which was partially offset by the
increase in the performing forborne portfolio by EUR 0.3 billion.
Wholesale Banking forborne portfolio were mainly concentrated in Natural Resources, Real Estate
and Transportation & Logistics. Together they accounted for 65% (2017: 72%) of the total
Wholesale Banking forborne portfolio and 67% (2017: 73%) of the total Wholesale Banking non-
performing forborne portfolio. Decreases in forborne portfolio were mainly visible in the industries
Natural Resources (EUR 0.5 billion), Real Estate (EUR 0.5 billion) and Builders & Contractors (EUR 0.3
billion).
Retail Banking
As per end of December 2018, Retail Banking forborne portfolio amounted to a total of EUR 5.0
billion, which represented 1.2% of the total Retail Banking portfolio.
2018 2017
Region
Outstand
ings
Of which:
Perfor-
ming
Of which:
Outstand
ings
Of which:
Perfor-
ming
Of which:
Non-
Perfor-
ming
Non-
Perfor-
ming
Europe
Netherlands 2,461 1,514 946 3,036 1,727 1,309
Belgium 1,046 383 663 1,096 399 697
Germany 462 337 126 541 432 109
Rest of Europe 656 397 259 639 342 297
Africa 1 1
America 1 1 1 1
Asia 3 2 1 2 2
Australia 381 225 156 342 172 170
Total 5,010 2,858 2,152 5,657 3,074 2,583
1 Undrawn commitments are excluded.
The main concentration of forborne portfolio in a single country was in the Netherlands with 49%
(2017: 54%) of the total Retail Banking forborne portfolio and 44% (2017: 51%) of the non-
performing forborne portfolio. Retail banking forborne portfolio decreased by EUR 0.6 billion
compared to 2017, of which EUR 0.4 billion driven by the consumer portfolio.
Wholesale Banking: Forborne assets by economic sector1
Retail Banking: Forborne assets by geographical area1
ING Bank Annual Report 2018 225
Contents | Who we are | Report of the Management Board | Corporate governance | Consolidated annual accounts | Parent company annual accounts | Other information
> Risk Management > 50
Securitisations
ING primarily plays three roles in its exposure to securitisations programs which are:
ING as Investor
ING’s goal is to maintain a portfolio of high quality liquid assets that meet the regulatory
requirements of CRR/CRD IV and the Delegated Act of October 2014 regarding liquidity. ING invests
in high quality Asset Backed Securities (ABS) keeping close track of the securitisation investment
positions via monthly monitoring reports and weekly update calls. Additionally, ING may invest in
securitisation positions in order to facilitate client business from its Disintermediation & Asset
Securitisation unit.
ING as Originator
ING occasionally originates its own securitisation transactions for economic and regulatory capital
purposes, as well as liquidity and funding purposes. Securitisations originated by a company may
only be considered for balance sheet derecognition when the requirements for significant credit risk
transfer have been fulfilled. ING has executed a very limited number of external transactions as
originator.
ING as Sponsor
In the normal course of business, ING structures financing transactions for its clients by assisting
them in obtaining sources of liquidity by selling the client’s receivables or other financial assets to a
special purpose vehicle (SPV). Senior positions in these transactions are often funded by the ING
administered multi-seller asset backed commercial paper (ABCP) conduit Mont Blanc Capital Corp.
(rated A-1/P-1). Mont Blanc Capital Corp. funds itself externally in the ABCP markets. In its role as
administrative agent, ING facilitates these transactions by providing structuring, accounting,
funding and operations services. ING also provides support facilities (liquidity facilities) backing the
transactions funded by the conduit. Mont Blanc Capital Corp. is fully consolidated into the ING
annual accounts.
Market risk
Introduction
Market risk is the risk that movements in market variables, such as interest rates, equity prices,
foreign exchange rates, credit spreads and real estate prices negatively impact the bank’s earnings,
capital, market value or liquidity position. Market risk either arises through positions in banking
books or trading books. The banking book positions are intended to be held for the long-term (or
until maturity) or for the purpose of hedging other banking book positions. The trading book
positions are typically held with the intention of short-term trading or in order to hedge other
positions in the trading book. This means that financial instruments in the trading books should be
free of trade restrictions. Policies and processes are in place to monitor the inclusion of positions in
either the trading or banking book as well as to monitor the transfer of risk between the trading
and banking books.
ING recognises the importance of sound market risk management and bases its market risk
management framework on the approach to identify, assess, control and manage market risks.
The approach consists of a cycle of five recurring activities: risk identification, risk assessment, risk
control, risk monitoring and risk reporting.
Risk identification is a joint effort of the first and second lines of defence out of the three lines of
the defence. See the Risk Governance paragraph under the General risk Management section for
details of the “three line of defence” governance model. The goal of risk identification is to detect
potential new risks and any changes in known risks;
Identified risks are assessed and measured by means of various risk metrics to determine the
importance of the risk to ING and subsequently to identify the control measures needed;
Risk control measures used by ING include policies, procedures, minimum standards, limit
frameworks, buffers and stress tests;
Risk monitoring occurs to check if the implemented risk controls are executed, complied with
across the organisation, and are effective; and
ING Bank Annual Report 2018 226
Contents | Who we are | Report of the Management Board | Corporate governance | Consolidated annual accounts | Parent company annual accounts | Other information
> Risk Management > 50
Market risk management results and findings are reported to the necessary governing
departments and approval bodies.
Governance
A governance framework has been established defining specific roles and responsibilities of
business management units, market risk management units, and internal approval bodies per
activity.
Supervision of market risk falls under the responsibility of the MBB and is delegated to the ALCO
function, where ALCO Bank is the highest approval authority and sets the market risk appetite.
ALCO Bank monitors ING’s adherence to the risk appetite for market risk and sets additional limits
where appropriate. These limits are cascaded through the organisation through lower level ALCOs.
This ALCO structure facilitates top-down risk management, limit setting, and the monitoring and
control of market risk.
The monitoring and control of market risk is the responsibility of the Financial Risk (FR) department
and Financial Institutions – Financial Markets (FI-FM) Risk. FR and FI-FM Risk are the designated
departments of the second line of defence that report to the CRO function and are responsible for
the design and execution of the bank’s market risk and counterparty credit risk management
functions in support of the ALCO function. FR focuses on the market risks in the banking books,
whereas FI-FM is responsible for counterparty credit risk and market risks resulting from the
Financial Markets trading books. FR and FI-FM Risk are responsible for determining adequate policies
and procedures for actively managing market risk in the banking and trading books and for
monitoring ING’s compliance with these guidelines.
FR and FI-FM Risk also maintain a limit framework in line with ING’s Risk Appetite Framework. The
businesses are responsible for adhering to limits that are ultimately approved by the ALCO Bank.
Limit excesses are reported to senior management on a timely basis and the business is required to
take appropriate actions to reduce the risk position. To adhere to the established limit framework,
ING implements hedging and risk mitigation strategies that range from the use of traditional
market instruments, such as interest rate swaps, to more sophisticated hedging strategies to
address a combination of risk factors arising at the portfolio level.
The organisational structure facilitates top-down risk management by recognising that risk taking
and risk management to a large extent occur at the regional/local level. Bottom-up reporting from
regional/local units to head office units allows each management level to fully assess the market
risk relevant at the respective levels.
Several committees govern the communication between the parties involved in market risk
management. Market Risk Model Committee (MRMC) is the highest dedicated authority within ING
for the approval of all trading and banking risk models, methodologies and parameters related to
market risk. Trading Pricing Model Committee (TPMC) approves pricing models for trading and
banking books. The Global Credit Trading Policy committee (GCTP) is the highest dedicated
authority with representatives from Financial Risk, CRO Challengers & Growth Markets and CRO
Wholesale Banking for the approval of policies, models, methodologies and parameters related to
credit risk and trading risk, and for the consideration of risk appetite and risk governance.
Systematic risk reporting takes place by the Financial Risk and FI-FM Risk departments to the EB
and MBB, the senior executive management of the CRO function, and the senior executive
management of related business functions.
The FI-FM Risk Management Framework governs the boundary between trading books and banking
books. It defines the activities ING considers to be trading according to a regulatory definition and
for own funds requirement purposes. The trading activity is systematically reviewed and positions
are assessed against the mandates jointly by the first and second lines of defence. As specified in
the framework, the transfer of risk or the transfer of positions between banking and trading books
is in principle not allowed but in exceptional cases when a re-designation is deemed necessary, the
re-designation should be approved by senior management.
This market risk paragraph elaborates on the various elements of the risk management framework
for:

ING Bank Annual Report 2018 227
Contents | Who we are | Report of the Management Board | Corporate governance | Consolidated annual accounts | Parent company annual accounts | Other information
> Risk Management > 50
Market risk economic capital for the trading and banking books;
Market risks in the banking books; and
Market risks in the trading books.
Economic capital for market risk
Economic capital for market risk is the economic capital necessary to withstand unexpected value
movements due to changes in market variables and model risk.
Economic capital for market risk is calculated for exposures both in trading portfolios and banking
portfolios and includes interest rate risk, credit spread risk, equity price risk, foreign exchange rate
risk, real estate risk, model risks and pension risk. Economic capital for market risk is calculated
using internally developed methodologies with a 99.95% confidence interval and a horizon of one
year.
For the trading books and the linear interest rate risk and equity investments in the banking books,
the Value at Risk (VaR) is taken as a starting point for the economic capital calculations for market
risk. The VaR is measured at a 99% confidence interval, a one day holding period.
To arrive at the economic capital for market risk, a simulation based model is used which includes
scaling to the required confidence interval and holding period. In determining this scaling factor,
several other factors are also taken into account like the occurrence of large market movements
(events) and management interventions.
Embedded options, e.g. the prepayment option and offered rate option in mortgages in the
banking books, result in non-linear interest rate risk in the banking books. The embedded options
are economically hedged using a delta-hedging methodology, leaving the mortgage portfolio
exposed to convexity and volatility risk. For the calculation of economic capital for this non-linear
interest rate risk, ING performs a Monte Carlo simulation.
Real estate price risk includes the market risks in both the real estate investment and the
development portfolio of the ING Wholesale Banking business line. The economic capital for real
estate price risk is calculated by stressing the underlying market variables.
While aggregating the different economic capital market risk figures for the different portfolios,
diversification benefits (based on stressed correlations) are taken into account as it is not expected
that all extreme market movements will appear at the same moment.
Market risk in banking books
ING makes a distinction between the trading and banking (non-trading) books. Positions in banking
books originate from the market risks inherent in commercial products that are sold to clients,
Group Treasury exposures, and from the investment of our own funds (core capital). Both the
commercial products and the products used to hedge market risk exposures in these products are
intended to be held until maturity, or at least for the long-term.
Risk transfer
An important element of the management of market risks in the banking book is the risk transfer
process. In this process the interest rate, FX, funding and liquidity risks are transferred from the
commercial books through matched funding to Group Treasury, where it is centrally managed. The

ING Bank Annual Report 2018 228
Contents | Who we are | Report of the Management Board | Corporate governance | Consolidated annual accounts | Parent company annual accounts | Other information
> Risk Management > 50
scheme below presents the transfer and management process of market risks in the banking
books:
The merge of Bank Treasury and Capital Management into Group Treasury was completed by the
end of June 2018.
Risk measurement
The main concepts and metrics used for measuring market risk in the banking book are described
below per risk type.
Interest rate risk in banking book
Interest rate risk in the banking book is defined as the exposure of a bank’s earnings, capital, and
market value to adverse movements in interest rates originated from positions in the banking book.
Governance
The management of interest rate risk follows the Interest Rate Risk in the Banking Book (IRRBB)
framework as approved by ALCO Bank. This framework describes roles, responsibilities, risk metrics,
the policies and procedures related to interest rate risk management. Furthermore ALCO Bank sets
the risk appetite for interest rate risk, which is then translated into limits for the interest rate risk
metrics.
ING’s approach to interest rate risk management, as set forth in this framework, is the
centralisation of risks from commercial books (that capture the products sold to clients) to globally
managed interest rate risk books. This enables a clear demarcation between commercial business
results and results on unhedged interest rate positions.
ING distinguishes between three types of activities that generate interest rate risk in the banking
book:
• Investment of own funds (by Group Treasury);
• Commercial business (e.g. Retail business); and
• The strategic interest rate position (Group Treasury).
Below the three activities are described in more detail:
Group Treasury is responsible for managing the investment of own funds (core capital), more
information can be found in the Capital Management section. Capital is invested for longer periods
to keep earnings stable.

ING Bank Annual Report 2018 229
Contents | Who we are | Report of the Management Board | Corporate governance | Consolidated annual accounts | Parent company annual accounts | Other information
> Risk Management > 50
The commercial activities can result in linear interest rate risk, for example, when re-pricing tenors
of assets differ from those of liabilities. Also, interest rate risk can arise from customer behaviour
depending on the nature of the underlying product characteristics. Customer behaviour risk is
defined as the potential future value loss due to deviations in the actual behaviour of clients versus
the modelled behaviour towards the embedded options in commercial products. General sources of
customer behaviour risk include the state of the economy, competition, changes in regulation,
legislation and tax regime, and developments in the housing market. Since these risk factors
cannot be (fully) mitigated, ING holds capital to be able to absorb possible losses as a result of
changed customer behaviour.
From an interest rate risk perspective, commercial activities can typically be divided into three main
product types: savings and demand deposits, mortgages, and loans.
• Savings and demand deposits are generally invested with the goal to hedge their value and
minimize the sensitivity of the margin to market interest rates. Interest rate risk can arise when
there is a lag between savings rate adjustments and the adjustments experienced through
market rates or when market rate changes cannot be passed on to clients. Interest rate risk is
modelled based on the stability of the deposit and the pass through rate. This takes into account
different elements, such as pricing strategies, volume developments and the level and shape of
the yield curve. Savings volumes are typically assumed not to be sensitive to interest rate
shocks;
• Interest rate risk for mortgages arises through prepayment behaviour. In modelling this risk,
interest rate dependent pre-payments are considered. Next to the dependence on interest rates,
modelled prepayment may include other effects such as loan to value, seasonality and the reset
date of the loan. In addition, the interest sensitivity of embedded offered rate options is
considered; and
• Wholesale Banking loans typically do not experience interest rate prepayment behavior as they
are hedged from an interest rate risk perspective and therefore do not contain significant
convexity risk.
Customer behaviour in relation to mortgages, loans, savings and demand deposits is modelled,
based on extensive research. Per business unit and product type, exposures are typically
segmented into different portfolios based on expected client behaviour. For each of the segments,
model parameters for example for the pass through rate and customer behaviour are determined
based on historical data and expert opinion. Models are typically back tested at least semi-annually
and updated when deemed necessary. Model parameters and the resulting risk measures are
approved by (local) ALCO.
Linear interest rate risk is transferred from the commercial business to the treasury book (Group
Treasury), if necessary, using estimations of customer behaviour. The originating commercial
business is ultimately responsible for estimating customer behaviour, leaving convexity risk and
(unexpected) customer behaviour risk with the commercial business. Risk measurement and the
risk transfer process take place on a monthly basis, but more often if deemed necessary, for
instance in volatile markets.
The commercial business manages the convexity risk that is the result of products that contain
embedded options, like mortgages. Here the convexity risk is defined as the optionality effects in
the value due to interest rate changes, excluding the first-order effects. In some cases, convexity
risk is transferred from the commercial books to treasury books using cap/floor contracts.
Group Treasury manages the strategic interest rate position including capital investments. The
main objective is to maximise the economic value of the book and to generate adequate and stable
annual earnings within the risk appetite boundaries set by ALCO Bank.
In the following sections, the interest rate risk exposures in the banking books are presented. ING
uses risk measures based on both an earnings and a value perspective. Net Interest Income (NII)-
at-Risk is used to provide the earnings perspective and the Net Present Value (NPV)-at-Risk and
Basis Point Value (BPV) figures provide the value perspective. Please note that corrective
management actions are not taken into account in these figures although price adjustments are
included in the earnings risk measure.

ING Bank Annual Report 2018 230
Contents | Who we are | Report of the Management Board | Corporate governance | Consolidated annual accounts | Parent company annual accounts | Other information
> Risk Management > 50
Developments relating to IRRBB
During 2018 ING implemented the following refinements to the risk measurement for Interest Rate
Risk in the Banking Book:
• Review of the risk appetite for Interest Rate Risk for the Banking Book;
• Annual review of the interest rates scenarios used for calculating NII-a-Risk and NPV-at-Risk;
• Implementation of scenarios for the interest rate sub-risk types tenor basis risk, vega optionality
risk and currency diversion risk;
• With respect to the capital investments, the internal view on capital replication is reflected in the
NPV-at-Risk limit for the capital book as of July 2018; and
• Savings model updates for market developments.
Net Interest Income (NII) at Risk
NII-at-Risk measures the impact of changing interest rates on (before tax) net interest income of
the banking book with a time horizon of one year. This excludes credit spread sensitivity and longer
term earnings impact. The NII-at-Risk figures in the tables below reflect a parallel interest rate
shock with a time horizon of one year. Next to parallel scenarios, IRRBB monitoring and
management includes the impact of non-parallel scenarios and the impact over a longer horizon.
The NII-at-Risk asymmetry between the downward scenario and upward shock scenarios is
primarily caused by the convexity risk in the mortgage and savings portfolio due to the embedded
options and pricing constraints.
2018 2017
Ramped, unfloored Ramped, unfloored
parallel ▼ parallel ▲ parallel ▼ parallel ▲
By business
Wholesale Banking –204 239 –185 201
Retail Banking Benelux –49 22 17 –48
Retail Challengers & Growth Markets 165 –186 101 –133
Corporate Line Banking –30 30 –24 13
Total –119 106 –91 33
The NII-at-Risk is mainly influenced by the sensitivity of savings to interest rate movements due to
pass through rate differences between savings rates and investment yields, but is partially offset
by the sensitivity of mortgages. The investment of own funds only impacts the earnings sensitivity
marginally, as only a relatively small part has to be (re)invested within the 1-year horizon.
2018 2017
Ramped, unfloored Ramped, unfloored
parallel ▼ parallel ▲ parallel ▼ parallel ▲
By currency
Euro –81 60 –83 9
US Dollar 20 –20 10 –20
Other –57 65 –19 44
Total –119 106 –91 33
Year-on-year variance analysis
The change in NII-at-Risk is mainly visible for Retail Banking Benelux and Retail Challengers &
Growth Markets. This is driven by the savings model updates for market developments in ING
Belgium, ING Germany, ING Netherlands, ING Spain and ING Poland. The annual update of the
interest rate scenarios also led to a limited increase in the NII-a-Risk for year 1.
NII-at-Risk banking books per business - year 1
NII-at-Risk banking book per currency - year 1
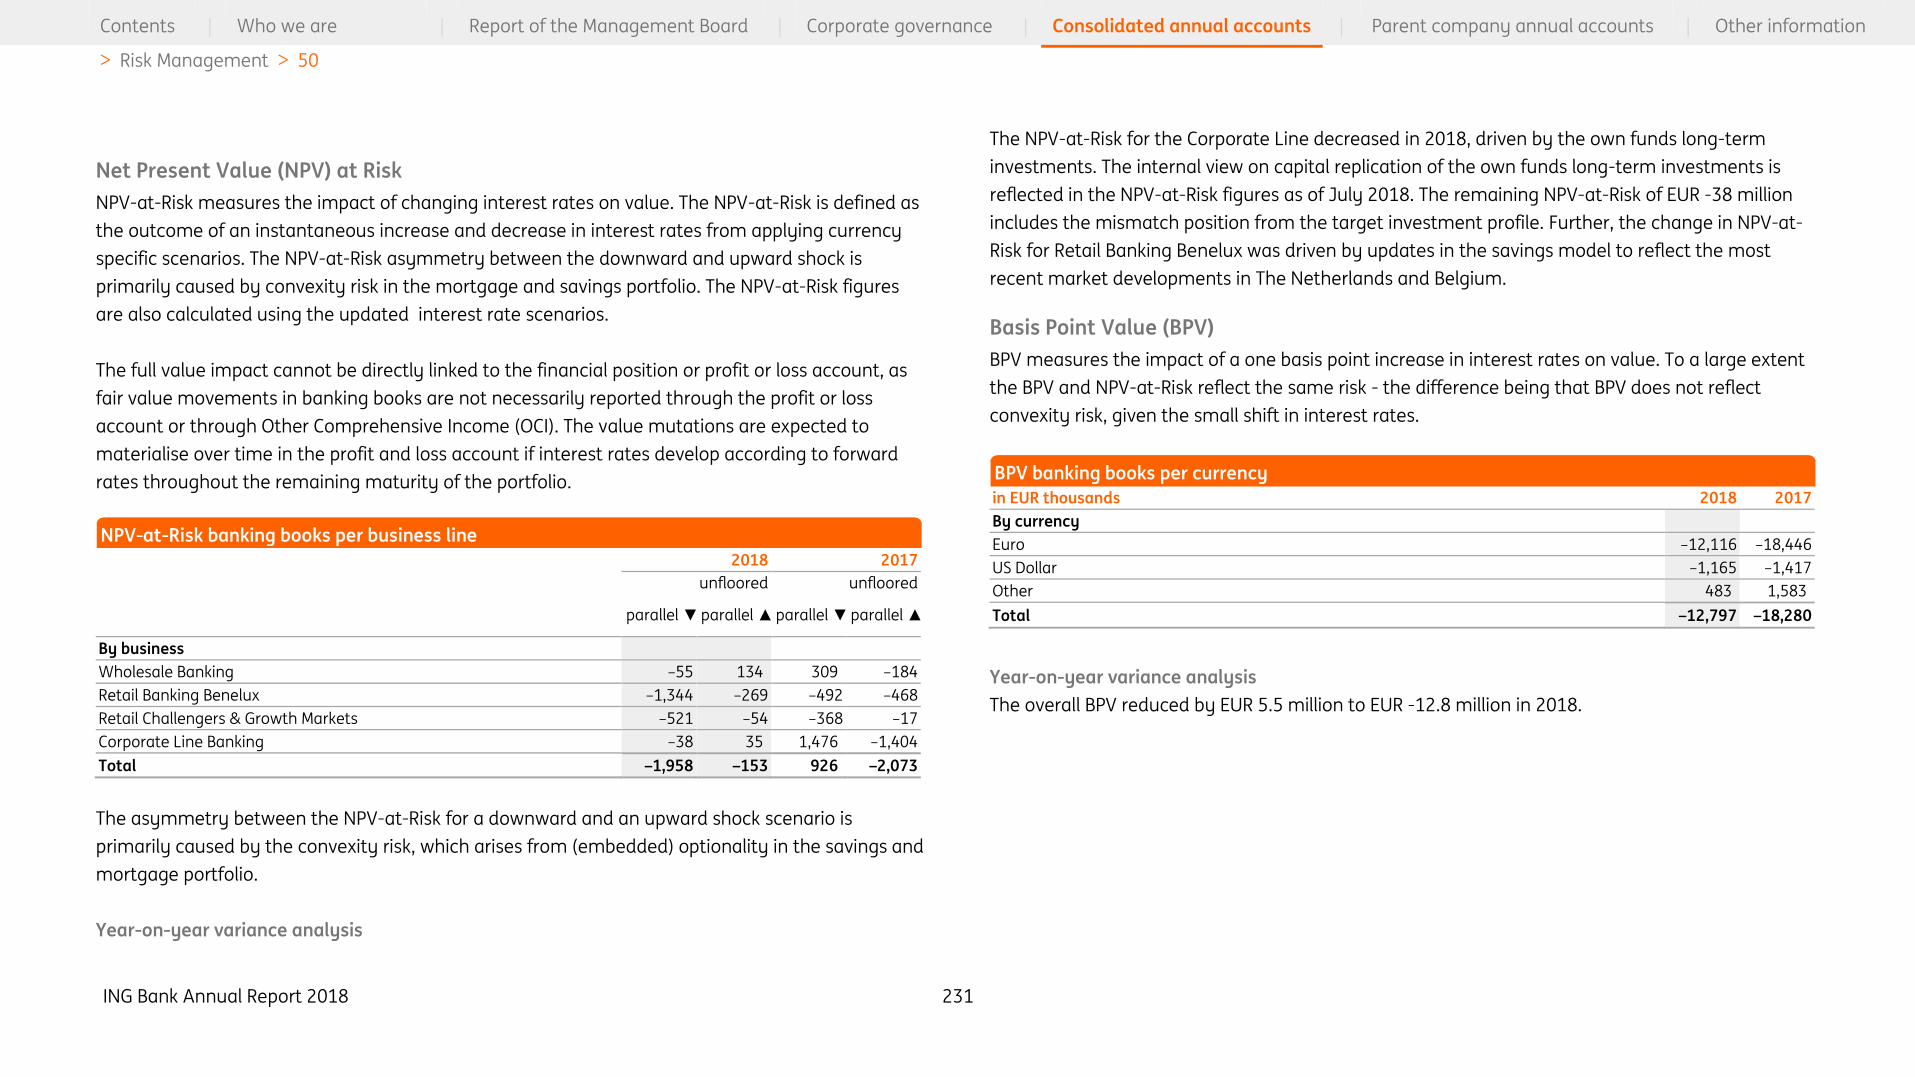
ING Bank Annual Report 2018 231
Contents | Who we are | Report of the Management Board | Corporate governance | Consolidated annual accounts | Parent company annual accounts | Other information
> Risk Management > 50
Net Present Value (NPV) at Risk
NPV-at-Risk measures the impact of changing interest rates on value. The NPV-at-Risk is defined as
the outcome of an instantaneous increase and decrease in interest rates from applying currency
specific scenarios. The NPV-at-Risk asymmetry between the downward and upward shock is
primarily caused by convexity risk in the mortgage and savings portfolio. The NPV-at-Risk figures
are also calculated using the updated interest rate scenarios.
The full value impact cannot be directly linked to the financial position or profit or loss account, as
fair value movements in banking books are not necessarily reported through the profit or loss
account or through Other Comprehensive Income (OCI). The value mutations are expected to
materialise over time in the profit and loss account if interest rates develop according to forward
rates throughout the remaining maturity of the portfolio.
2018 2017
unfloored unfloored
parallel ▼ parallel ▲ parallel ▼ parallel ▲
By business
Wholesale Banking –55 134 309 –184
Retail Banking Benelux –1,344 –269 –492 –468
Retail Challengers & Growth Markets –521 –54 –368 –17
Corporate Line Banking –38 35 1,476 –1,404
Total –1,958 –153 926 –2,073
The asymmetry between the NPV-at-Risk for a downward and an upward shock scenario is
primarily caused by the convexity risk, which arises from (embedded) optionality in the savings and
mortgage portfolio.
Year-on-year variance analysis
The NPV-at-Risk for the Corporate Line decreased in 2018, driven by the own funds long-term
investments. The internal view on capital replication of the own funds long-term investments is
reflected in the NPV-at-Risk figures as of July 2018. The remaining NPV-at-Risk of EUR -38 million
includes the mismatch position from the target investment profile. Further, the change in NPV-at-
Risk for Retail Banking Benelux was driven by updates in the savings model to reflect the most
recent market developments in The Netherlands and Belgium.
Basis Point Value (BPV)
BPV measures the impact of a one basis point increase in interest rates on value. To a large extent
the BPV and NPV-at-Risk reflect the same risk - the difference being that BPV does not reflect
convexity risk, given the small shift in interest rates.
in EUR thousands 2018 2017
By currency
Euro –12,116 –18,446
US Dollar –1,165 –1,417
Other 483 1,583
Total –12,797 –18,280
Year-on-year variance analysis
The overall BPV reduced by EUR 5.5 million to EUR -12.8 million in 2018.
NPV-at-Risk banking books per business line
BPV banking books per currency
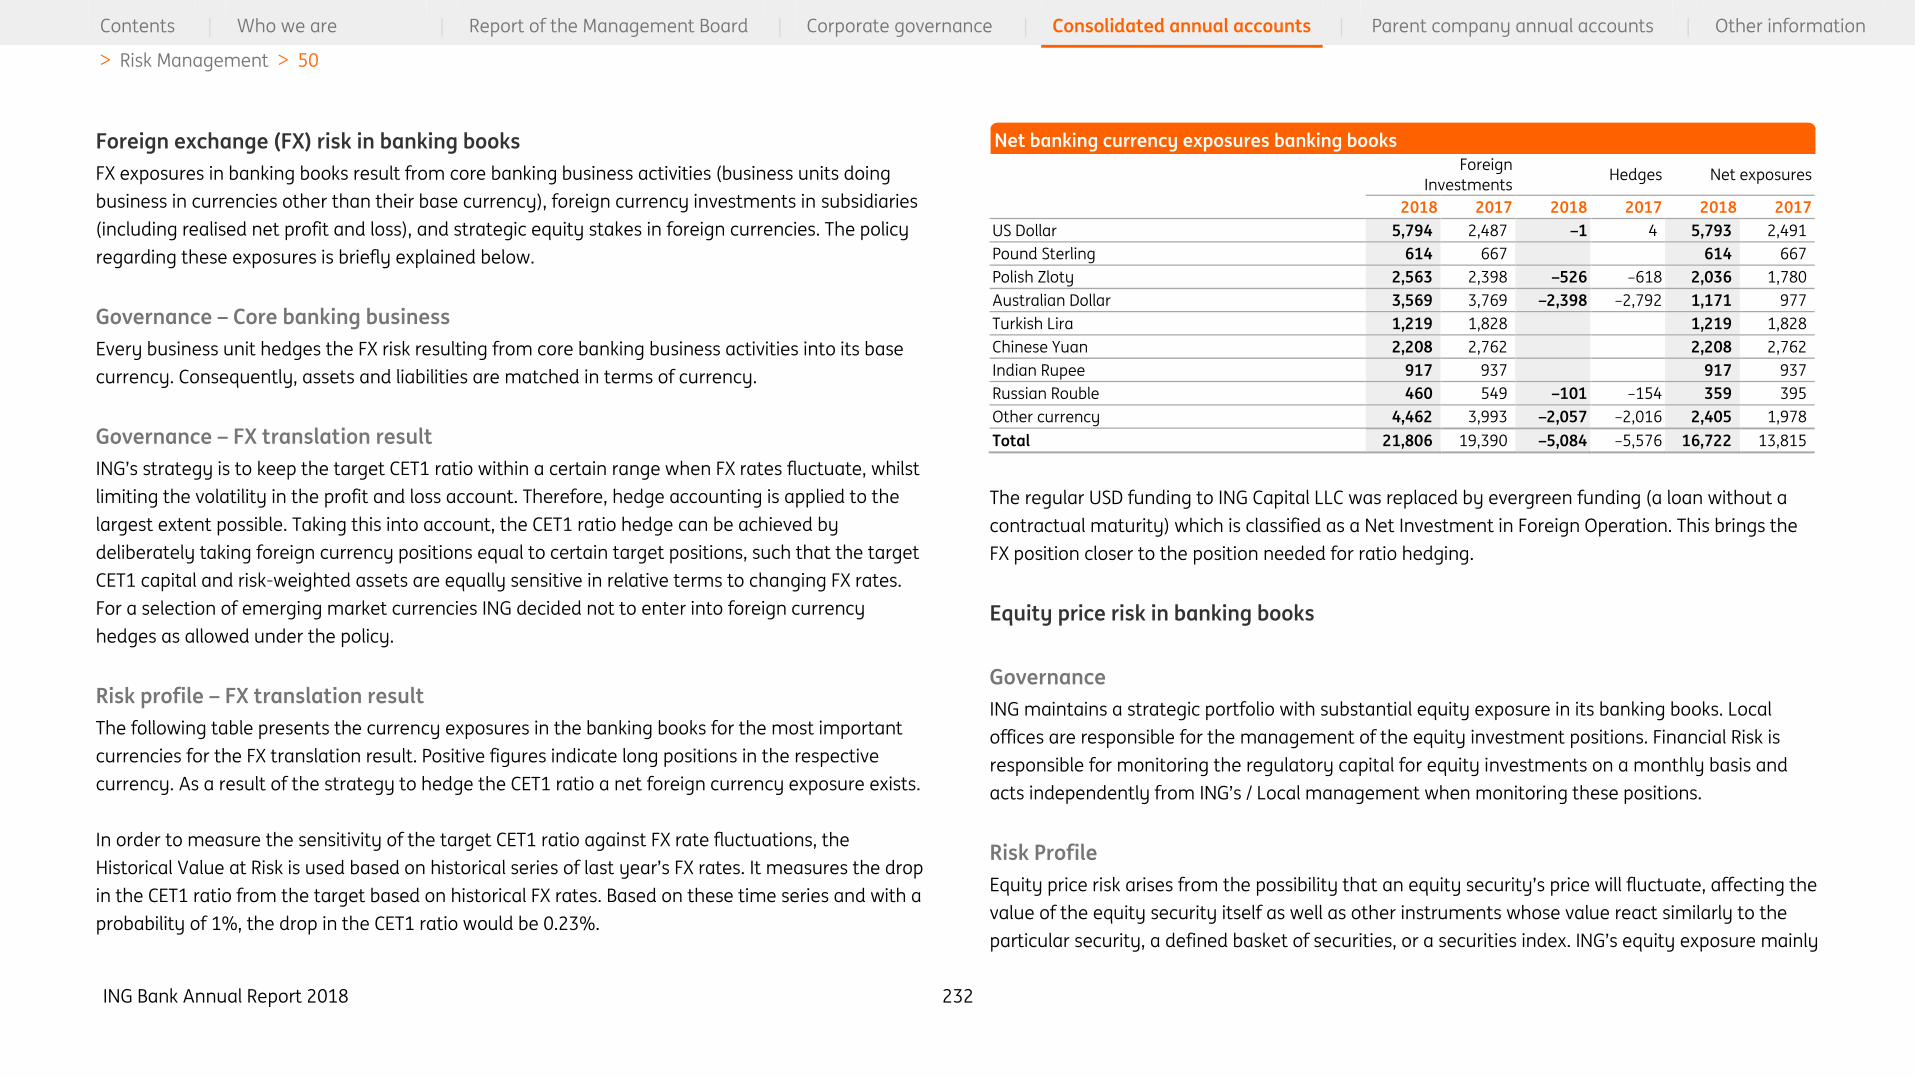
ING Bank Annual Report 2018 232
Contents | Who we are | Report of the Management Board | Corporate governance | Consolidated annual accounts | Parent company annual accounts | Other information
> Risk Management > 50
Foreign exchange (FX) risk in banking books
FX exposures in banking books result from core banking business activities (business units doing
business in currencies other than their base currency), foreign currency investments in subsidiaries
(including realised net profit and loss), and strategic equity stakes in foreign currencies. The policy
regarding these exposures is briefly explained below.
Governance – Core banking business
Every business unit hedges the FX risk resulting from core banking business activities into its base
currency. Consequently, assets and liabilities are matched in terms of currency.
Governance – FX translation result
ING’s strategy is to keep the target CET1 ratio within a certain range when FX rates fluctuate, whilst
limiting the volatility in the profit and loss account. Therefore, hedge accounting is applied to the
largest extent possible. Taking this into account, the CET1 ratio hedge can be achieved by
deliberately taking foreign currency positions equal to certain target positions, such that the target
CET1 capital and risk-weighted assets are equally sensitive in relative terms to changing FX rates.
For a selection of emerging market currencies ING decided not to enter into foreign currency
hedges as allowed under the policy.
Risk profile – FX translation result
The following table presents the currency exposures in the banking books for the most important
currencies for the FX translation result. Positive figures indicate long positions in the respective
currency. As a result of the strategy to hedge the CET1 ratio a net foreign currency exposure exists.
In order to measure the sensitivity of the target CET1 ratio against FX rate fluctuations, the
Historical Value at Risk is used based on historical series of last year’s FX rates. It measures the drop
in the CET1 ratio from the target based on historical FX rates. Based on these time series and with a
probability of 1%, the drop in the CET1 ratio would be 0.23%.
Foreign
Investments Hedges Net exposures
2018 2017 2018 2017 2018 2017
US Dollar 5,794 2,487 –1 4 5,793 2,491
Pound Sterling 614 667 614 667
Polish Zloty 2,563 2,398 –526 –618 2,036 1,780
Australian Dollar 3,569 3,769 –2,398 –2,792 1,171 977
Turkish Lira 1,219 1,828 1,219 1,828
Chinese Yuan 2,208 2,762 2,208 2,762
Indian Rupee 917 937 917 937
Russian Rouble 460 549 –101 –154 359 395
Other currency 4,462 3,993 –2,057 –2,016 2,405 1,978
Total 21,806 19,390 –5,084 –5,576 16,722 13,815
The regular USD funding to ING Capital LLC was replaced by evergreen funding (a loan without a
contractual maturity) which is classified as a Net Investment in Foreign Operation. This brings the
FX position closer to the position needed for ratio hedging.
Equity price risk in banking books
Governance
ING maintains a strategic portfolio with substantial equity exposure in its banking books. Local
offices are responsible for the management of the equity investment positions. Financial Risk is
responsible for monitoring the regulatory capital for equity investments on a monthly basis and
acts independently from ING’s / Local management when monitoring these positions.
Risk Profile
Equity price risk arises from the possibility that an equity security’s price will fluctuate, affecting the
value of the equity security itself as well as other instruments whose value react similarly to the
particular security, a defined basket of securities, or a securities index. ING’s equity exposure mainly
Net banking currency exposures banking books

ING Bank Annual Report 2018 233
Contents | Who we are | Report of the Management Board | Corporate governance | Consolidated annual accounts | Parent company annual accounts | Other information
> Risk Management > 50
consists of the investments in associates and joint ventures of EUR 1,203 million (2017: EUR 1,088
million) and equity securities held at fair value through other comprehensive income (FVOCI) of EUR
3,228 million (2017: held in the Available-for-sale (AFS) portfolio, under IAS 39 for EUR 3,983
million). The value of equity securities held at FVOCI is directly linked to equity security prices with
increases/decreases being recognised in the revaluation reserve. Investments in associates and
joint ventures are measured in accordance with the equity method of accounting and the balance
sheet value is therefore not directly linked to equity security prices.
Year-on-year variance analysis
The revaluation reserve relating to equity securities at FVOCI moved from EUR 2,474 million per
year end 2017 to EUR 1,914 million per year end 2018. In 2018 the securities at FVOCI decreased by
EUR 560 million and is the result of the combined impact of IFRS 9 (EUR 42 million), and the
decrease in the value of primarily Bank of Beijing and Kotak Mahindra Bank.
2018 2017
Gross unrealised gains n/a 2,478
Gross unrealised losses n/a –4
Positive re-measurement 1,923 n/a
Negative re-measurement –8 n/a
Total 1,914 2,474
1 The 2017 figures are presented as Available-for-sale under IAS 39. With the introduction of IFRS 9 these have
been classified as fair value through other comprehensive income.
Real Estate price risk in banking books
Real Estate price risk arises from the possibility that Real Estate prices fluctuate. This affects both
the value of Real Estate assets and the earnings related to Real Estate activities.
Governance
Real Estate is a run-off business consisting of Real Estate Development and Real Estate Investment
Management activities which are being wound down by sale of assets, strict execution of contract
maturity, or through portfolio sales.
Risk profile
ING has two different main categories of Real Estate exposure on its banking books: first, its own
buildings which ING occupies, and second, development assets, which mostly consist of former Real
Estate Development and Real Estate Investment Management activities. The total Real Estate
exposure amounts to EUR 0.9 billion (excluding property from foreclosures and third party interest).
ING has EUR 0.1 billion recognised at fair value through profit and loss and EUR 0.8 billion is
recognised at cost or revalued through equity (with impairments going through profit and loss). A
split on the Real Estate exposure per continent and sector based on the risk management view is
shown below. Revaluation reserve equity securities at fair value through other comprehensive income1

ING Bank Annual Report 2018 234
Contents | Who we are | Report of the Management Board | Corporate governance | Consolidated annual accounts | Parent company annual accounts | Other information
> Risk Management > 50
2018 2017 2018 2017
Continent Sector
Europe 824 827 Residential 64 72
Americas 27 25 Office 791 785
Australia - – Retail 2 8
Asia - – Industrial 16 12
Other 61 82 Other 40 57
Total 913 934 Total 913 934
Market risk in trading books
Within the trading portfolios, positions are maintained in the financial markets. These positions are
often a result of transactions with clients and may serve to benefit from short-term price
movements. In 2018, ING continued its strategy of undertaking trading activities to develop its
client-driven franchise and deliver a differentiating experience by offering multiple market and
trading products.
Governance
The Financial Markets Risk Committee (FMRC) is the market risk committee that, within the risk
appetite set by ALCO Bank, sets market risk limits both on an aggregated level and on a desk level,
and approves new products. FI-FM Risk advises both FMRC and ALCO Bank on the market risk
appetite of trading activities.
With respect to the trading portfolios, FI-FM Risk focuses on the management of market risks of
Wholesale Banking (mainly Financial Markets) as this is the only business line within ING where
trading activities take place. Trading activities include facilitation of client business and market
making. FI-FM Risk is responsible for the development and implementation of trading risk policies
and risk measurement methodologies, the reporting and monitoring of risk exposures against
approved trading limits, and the validation of pricing models. FI-FM Risk also reviews trading
mandates and limits, and performs the gatekeeper role in the product review process. The
management of market risk in trading portfolios is performed at various organisational levels. The
FI-FM Risk Management Framework defines policies and procedures for the overall management of
trading books. Trading activity is systematically reviewed and positions against the mandates are
assessed jointly by the first and second lines of defence.
Risk measurement
ING uses a comprehensive set of methodologies and techniques to measure market risk in trading
books: Value at Risk (VaR) and Stressed Value at Risk (SVaR), Incremental Risk Charge (IRC), and
Event Risk (stress testing). Systematic validation processes are in place to validate the accuracy and
internal consistency of data and parameters used for the internal models and modelling processes.
Basel Committee/CRD IV
ING follows the regulatory framework set out in the Capital Requirements Regulation (CRR/CRD IV)
for its regulatory capital calculations. ING is closely monitoring the progress on CRR II/CRD V
regulation. The CRR II will include among others the European regulations conform the
Fundamental Review of the Trading Book (FRTB) standards by BCBS. In January 2019, the BCBS
released the final FRTB standards. The requirements and timelines of FRTB capital will be specified in
CRR III regulations, FRTB capital requirements are expected to have a significant impact on the Pillar
I calculations.
Value at Risk
FI-FM Risk uses the historical simulation VaR methodology as its primary risk measure. The VaR for
market risk quantifies, with a one-sided confidence level of 99%, the maximum overnight loss that
could occur in the trading portfolio of ING due to changes in risk factors (e.g. interest rates, equity
prices, foreign exchange rates, credit spreads, implied volatilities) if positions remain unchanged for
a time period of one day. Next to general market movements in these risk factors, VaR also takes
into account market data movements for specific moves in e.g. the underlying issuer of securities.
A single model that diversifies general and specific risk is used. In general a full revaluation
Real Estate market risk exposure in banking books (by geographic area and sector type)

ING Bank Annual Report 2018 235
Contents | Who we are | Report of the Management Board | Corporate governance | Consolidated annual accounts | Parent company annual accounts | Other information
> Risk Management > 50
approach is applied, only for a limited number of linear trading positions and a limited number of
risk factors in commodity and equity risk classes a sensitivity-based approach is applied. The
potential impact of historical market movements on today’s portfolio is estimated, based on
equally weighted observed market movements of the previous year (260 days). When simulating
potential movements in risk factors, depending on the risk factor type, either an absolute or a
relative shift is used. The data used in the computations is updated daily. ING uses VaR with a 1-day
horizon for internal risk measurement, management control, and backtesting, and VaR with a 10-
day horizon for determining regulatory capital. To compute VaR with a 10-day horizon the one day
risk factor shifts are scaled by the square root of ten and then used as an input for the revaluation.
The same model is used for all legal entities within ING with market risk exposure in the trading
portfolio.
Limitations
VaR has some limitations, such as the following: VaR uses historical data to forecast future price
behaviour. Future price behaviour could differ substantially from past behaviour. Moreover, the use
of a one-day holding period (or ten days for regulatory capital calculations) assumes that all
positions in the portfolio can be liquidated or hedged in one day. In periods of illiquidity or market
events, this assumption may not hold. Also, the use of 99% confidence level means that VaR does
not take into account any losses that occur beyond this confidence level.
Backtesting
Backtesting is a technique for the ongoing monitoring of the plausibility of the VaR model in use.
Although VaR models estimate potential future trading results, estimates are based on historical
market data. In a backtest, the actual daily trading result (excluding fees and commissions) is
compared with the 1-day VaR. In addition to using actual results for backtesting, ING also uses
hypothetical results, which excludes the effect of intraday trading, fees, and commissions. When
the actual or hypothetical loss exceeds the VaR, an ‘outlier’ occurs. Based on ING’s one-sided
confidence level of 99%, an outlier is expected once in every 100 business days. In 2018 there was
one occurrence where actual and hypothetical daily trading loss exceeded the daily consolidated
VaR of ING. The loss was driven by Foreign Exchange and Equity positions. ING reports the
backtesting results on a quarterly basis to the ECB.
Stressed VaR
The SVaR is intended to replicate a VaR calculation that would be generated on the bank’s current
portfolio with inputs calibrated to the historical data from a continuous 12-month period of
significant financial stress relevant to the bank’s portfolio. To calculate SVaR, ING uses the same
model that is used for VaR with a 10-day horizon. The historical data period used currently includes
the height of the credit crisis around the fall of Lehman Brothers, and is reviewed regularly. The
historical data period is chosen so that it gives the worst scenario loss estimates for the current
portfolio. The same SVaR model is used for management purposes and for regulatory purposes.
The same model is used for all legal entities within ING with market risk exposure in the trading
portfolio.
Incremental Risk Charge
The IRC for ING is an estimate of the default and migration risks for unsecuritised credit products in
the trading book, over a one-year capital horizon, with a 99.9% confidence level. The same IRC
model is used for all legal entities within ING with market risk exposure in the trading portfolio. Non-
securitised trading positions of ING, which are subject to specific interest rate risk included in the
internal model approach for market risk regulatory capital, are in scope of the IRC model. By model
choice, equity is excluded from the model. For the calculation of IRC, ING performs a Monte-Carlo
simulation based on a Gaussian copula model. The asset correlations used in the Gaussian copula
model are determined using the IRB correlation formula. The rating change is simulated for all
issuers over the different liquidity horizons (i.e. time required to liquidate the position or hedge all
significant risks) within one year. Movements across different rating categories and probabilities of
default are governed by a credit-rating transition matrix. An external transition matrix is obtained
from Standard & Poor’s (S&P). The financial impact is then determined for the simulated migration
to default, or for the simulated migration to a different rating category, based on LGD or credit
spread changes, respectively.
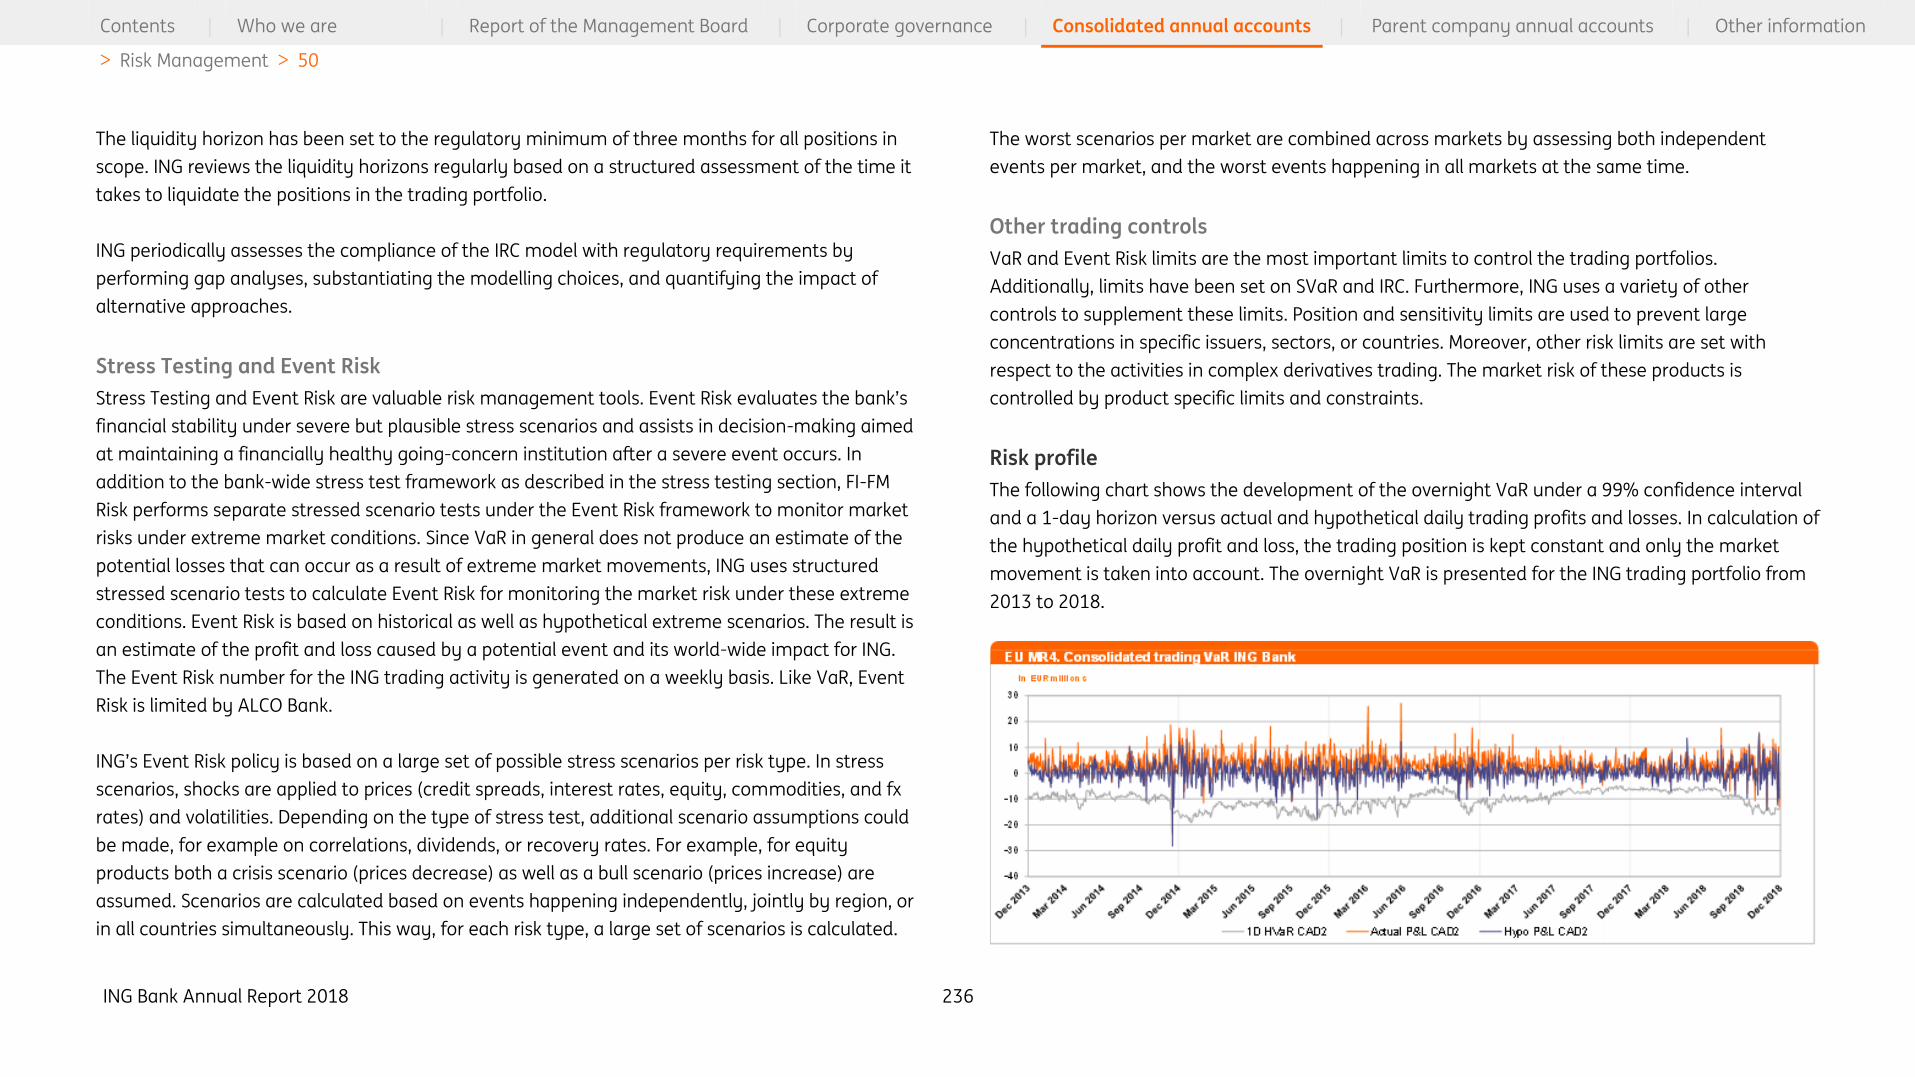
ING Bank Annual Report 2018 236
Contents | Who we are | Report of the Management Board | Corporate governance | Consolidated annual accounts | Parent company annual accounts | Other information
> Risk Management > 50
The liquidity horizon has been set to the regulatory minimum of three months for all positions in
scope. ING reviews the liquidity horizons regularly based on a structured assessment of the time it
takes to liquidate the positions in the trading portfolio.
ING periodically assesses the compliance of the IRC model with regulatory requirements by
performing gap analyses, substantiating the modelling choices, and quantifying the impact of
alternative approaches.
Stress Testing and Event Risk
Stress Testing and Event Risk are valuable risk management tools. Event Risk evaluates the bank’s
financial stability under severe but plausible stress scenarios and assists in decision-making aimed
at maintaining a financially healthy going-concern institution after a severe event occurs. In
addition to the bank-wide stress test framework as described in the stress testing section, FI-FM
Risk performs separate stressed scenario tests under the Event Risk framework to monitor market
risks under extreme market conditions. Since VaR in general does not produce an estimate of the
potential losses that can occur as a result of extreme market movements, ING uses structured
stressed scenario tests to calculate Event Risk for monitoring the market risk under these extreme
conditions. Event Risk is based on historical as well as hypothetical extreme scenarios. The result is
an estimate of the profit and loss caused by a potential event and its world-wide impact for ING.
The Event Risk number for the ING trading activity is generated on a weekly basis. Like VaR, Event
Risk is limited by ALCO Bank.
ING’s Event Risk policy is based on a large set of possible stress scenarios per risk type. In stress
scenarios, shocks are applied to prices (credit spreads, interest rates, equity, commodities, and fx
rates) and volatilities. Depending on the type of stress test, additional scenario assumptions could
be made, for example on correlations, dividends, or recovery rates. For example, for equity
products both a crisis scenario (prices decrease) as well as a bull scenario (prices increase) are
assumed. Scenarios are calculated based on events happening independently, jointly by region, or
in all countries simultaneously. This way, for each risk type, a large set of scenarios is calculated.
The worst scenarios per market are combined across markets by assessing both independent
events per market, and the worst events happening in all markets at the same time.
Other trading controls
VaR and Event Risk limits are the most important limits to control the trading portfolios.
Additionally, limits have been set on SVaR and IRC. Furthermore, ING uses a variety of other
controls to supplement these limits. Position and sensitivity limits are used to prevent large
concentrations in specific issuers, sectors, or countries. Moreover, other risk limits are set with
respect to the activities in complex derivatives trading. The market risk of these products is
controlled by product specific limits and constraints.
Risk profile
The following chart shows the development of the overnight VaR under a 99% confidence interval
and a 1-day horizon versus actual and hypothetical daily trading profits and losses. In calculation of
the hypothetical daily profit and loss, the trading position is kept constant and only the market
movement is taken into account. The overnight VaR is presented for the ING trading portfolio from
2013 to 2018.
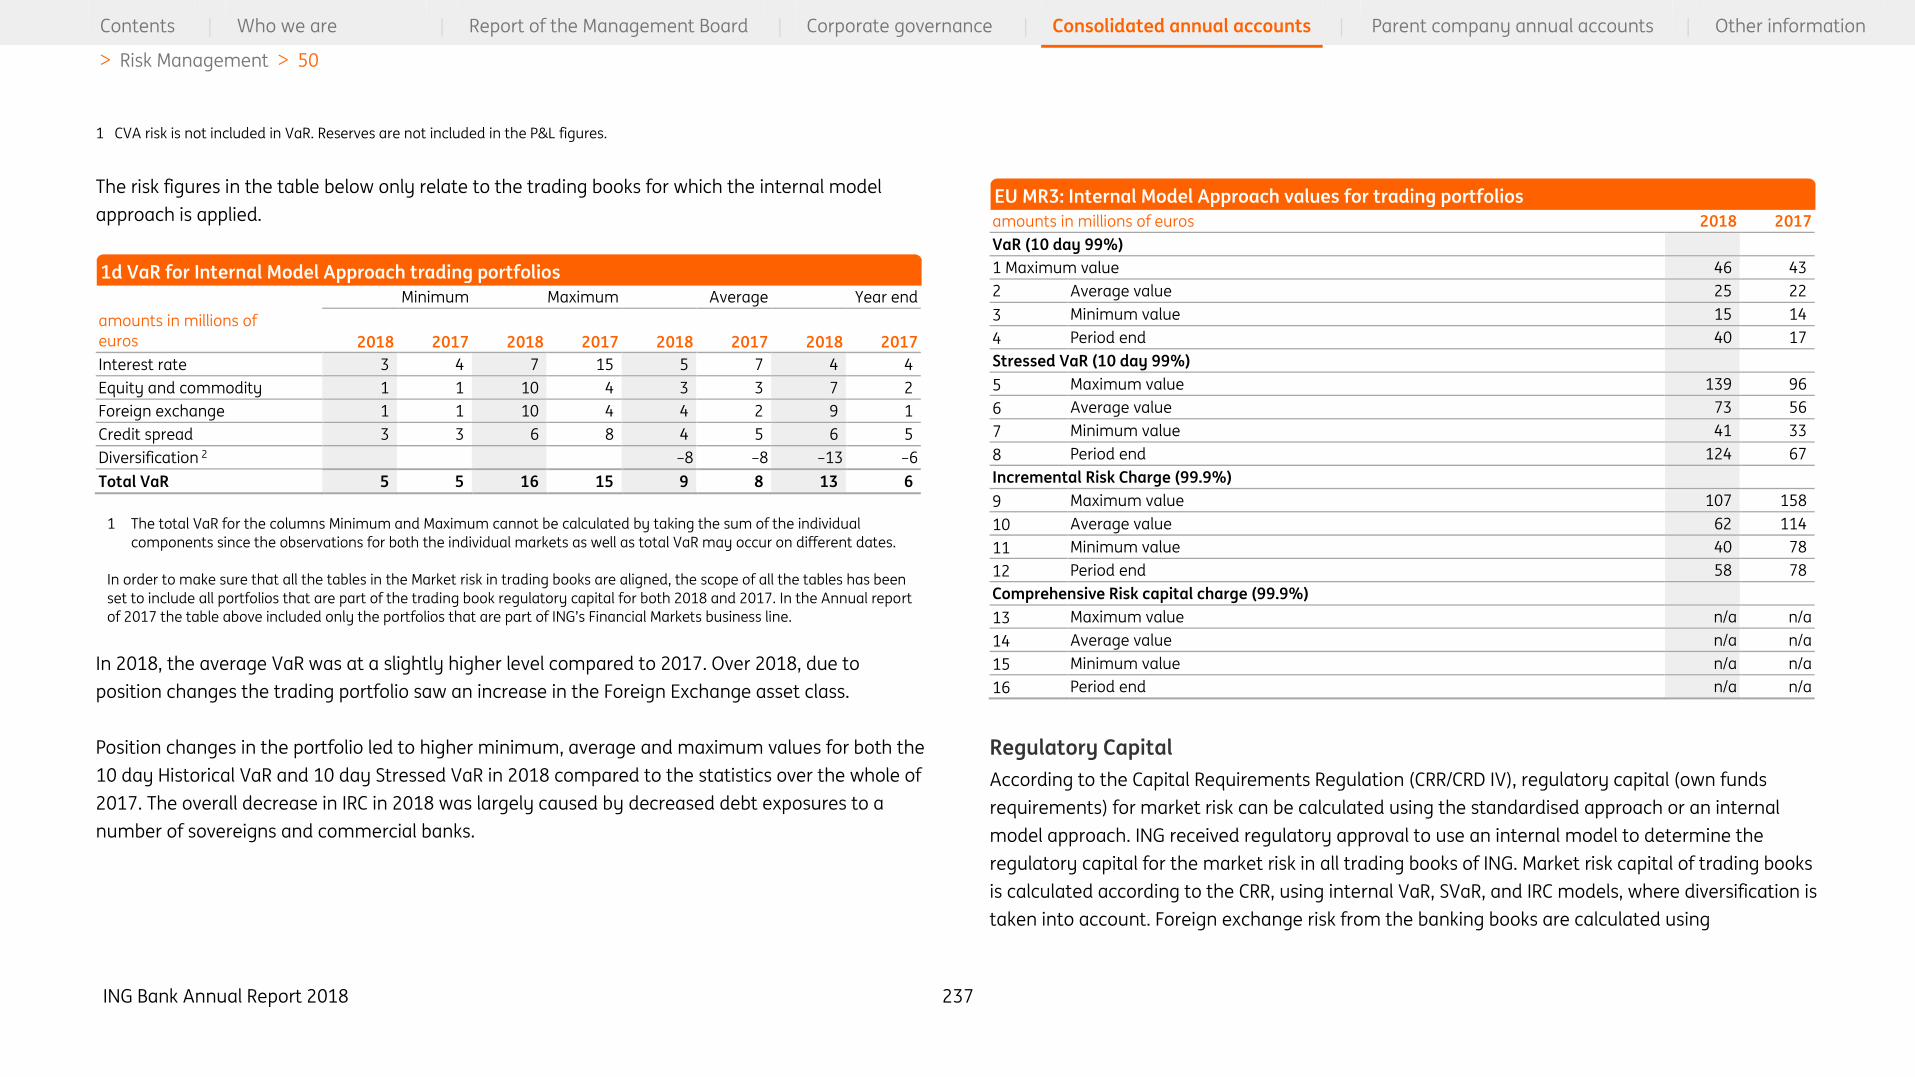
ING Bank Annual Report 2018 237
Contents | Who we are | Report of the Management Board | Corporate governance | Consolidated annual accounts | Parent company annual accounts | Other information
> Risk Management > 50
1 CVA risk is not included in VaR. Reserves are not included in the P&L figures.
The risk figures in the table below only relate to the trading books for which the internal model
approach is applied.
Minimum Maximum Average Year end
amounts in millions of
euros 2018 2017 2018 2017 2018 2017 2018 2017
Interest rate 3 4 7 15 5 7 4 4
Equity and commodity 1 1 10 4 3 3 7 2
Foreign exchange 1 1 10 4 4 2 9 1
Credit spread 3 3 6 8 4 5 6 5
Diversification 2 –8 –8 –13 –6
Total VaR 5 5 16 15 9 8 13 6
1 The total VaR for the columns Minimum and Maximum cannot be calculated by taking the sum of the individual
components since the observations for both the individual markets as well as total VaR may occur on different dates.
In order to make sure that all the tables in the Market risk in trading books are aligned, the scope of all the tables has been
set to include all portfolios that are part of the trading book regulatory capital for both 2018 and 2017. In the Annual report
of 2017 the table above included only the portfolios that are part of ING’s Financial Markets business line.
In 2018, the average VaR was at a slightly higher level compared to 2017. Over 2018, due to
position changes the trading portfolio saw an increase in the Foreign Exchange asset class.
Position changes in the portfolio led to higher minimum, average and maximum values for both the
10 day Historical VaR and 10 day Stressed VaR in 2018 compared to the statistics over the whole of
2017. The overall decrease in IRC in 2018 was largely caused by decreased debt exposures to a
number of sovereigns and commercial banks.
amounts in millions of euros 2018 2017
VaR (10 day 99%)
1 Maximum value 46 43
2 Average value 25 22
3 Minimum value 15 14
4 Period end 40 17
Stressed VaR (10 day 99%)
5 Maximum value 139 96
6 Average value 73 56
7 Minimum value 41 33
8 Period end 124 67
Incremental Risk Charge (99.9%)
9 Maximum value 107 158
10 Average value 62 114
11 Minimum value 40 78
12 Period end 58 78
Comprehensive Risk capital charge (99.9%)
13 Maximum value n/a n/a
14 Average value n/a n/a
15 Minimum value n/a n/a
16 Period end n/a n/a
Regulatory Capital
According to the Capital Requirements Regulation (CRR/CRD IV), regulatory capital (own funds
requirements) for market risk can be calculated using the standardised approach or an internal
model approach. ING received regulatory approval to use an internal model to determine the
regulatory capital for the market risk in all trading books of ING. Market risk capital of trading books
is calculated according to the CRR, using internal VaR, SVaR, and IRC models, where diversification is
taken into account. Foreign exchange risk from the banking books are calculated using
1d VaR for Internal Model Approach trading portfolios
EU MR3: Internal Model Approach values for trading portfolios
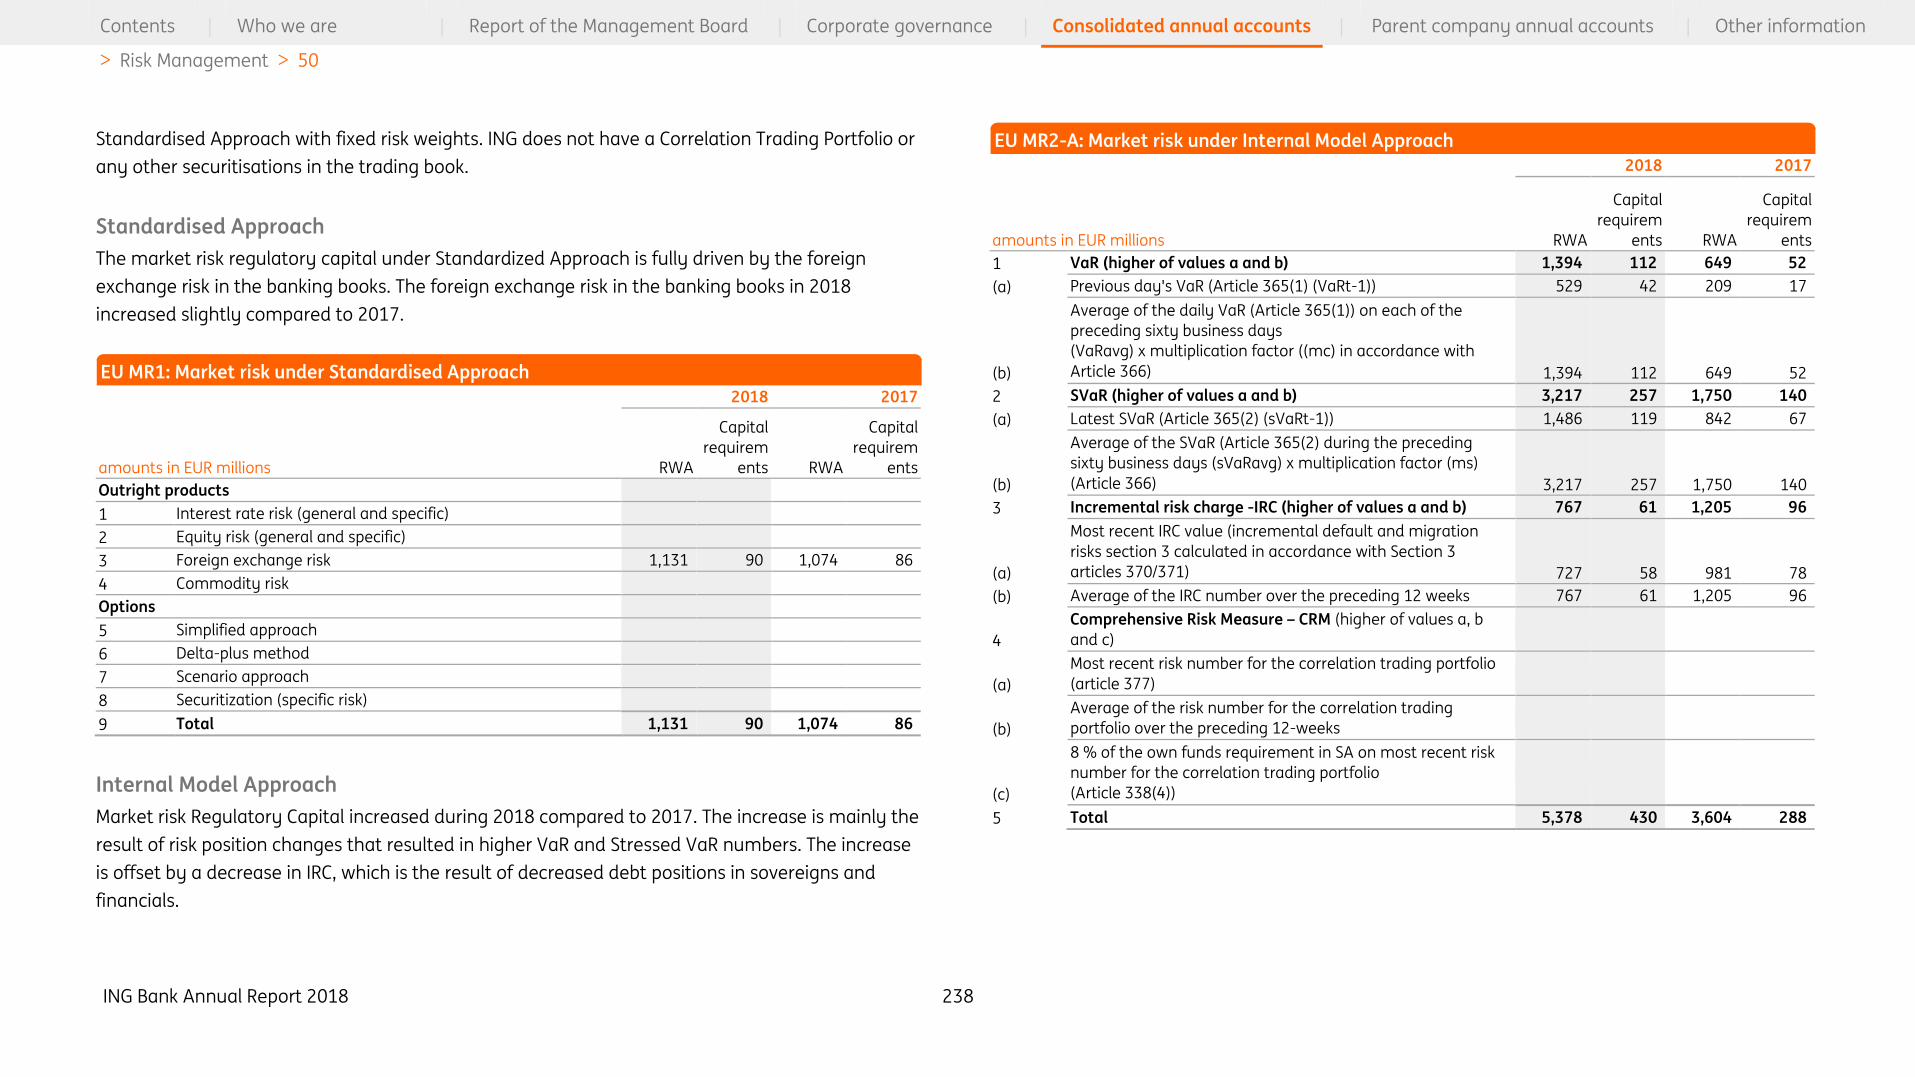
ING Bank Annual Report 2018 238
Contents | Who we are | Report of the Management Board | Corporate governance | Consolidated annual accounts | Parent company annual accounts | Other information
> Risk Management > 50
Standardised Approach with fixed risk weights. ING does not have a Correlation Trading Portfolio or
any other securitisations in the trading book.
Standardised Approach
The market risk regulatory capital under Standardized Approach is fully driven by the foreign
exchange risk in the banking books. The foreign exchange risk in the banking books in 2018
increased slightly compared to 2017.
2018 2017
amounts in EUR millions RWA
Capital
requirem
ents RWA
Capital
requirem
ents
Outright products
1 Interest rate risk (general and specific)
2 Equity risk (general and specific)
3 Foreign exchange risk 1,131 90 1,074 86
4 Commodity risk
Options
5 Simplified approach
6 Delta-plus method
7 Scenario approach
8 Securitization (specific risk)
9 Total 1,131 90 1,074 86
Internal Model Approach
Market risk Regulatory Capital increased during 2018 compared to 2017. The increase is mainly the
result of risk position changes that resulted in higher VaR and Stressed VaR numbers. The increase
is offset by a decrease in IRC, which is the result of decreased debt positions in sovereigns and
financials.
2018 2017
amounts in EUR millions RWA
Capital
requirem
ents RWA
Capital
requirem
ents
1 VaR (higher of values a and b) 1,394 112 649 52
(a) Previous day's VaR (Article 365(1) (VaRt-1)) 529 42 209 17
(b)
Average of the daily VaR (Article 365(1)) on each of the
preceding sixty business days
(VaRavg) x multiplication factor ((mc) in accordance with
Article 366) 1,394 112 649 52
2 SVaR (higher of values a and b) 3,217 257 1,750 140
(a) Latest SVaR (Article 365(2) (sVaRt-1)) 1,486 119 842 67
(b)
Average of the SVaR (Article 365(2) during the preceding
sixty business days (sVaRavg) x multiplication factor (ms)
(Article 366) 3,217 257 1,750 140
3 Incremental risk charge -IRC (higher of values a and b) 767 61 1,205 96
(a)
Most recent IRC value (incremental default and migration
risks section 3 calculated in accordance with Section 3
articles 370/371) 727 58 981 78
(b) Average of the IRC number over the preceding 12 weeks 767 61 1,205 96
4
Comprehensive Risk Measure – CRM (higher of values a, b
and c)
(a)
Most recent risk number for the correlation trading portfolio
(article 377)
(b)
Average of the risk number for the correlation trading
portfolio over the preceding 12-weeks
(c)
8 % of the own funds requirement in SA on most recent risk
number for the correlation trading portfolio
(Article 338(4))
5 Total 5,378 430 3,604 288
EU MR1: Market risk under Standardised Approach
EU MR2-A: Market risk under Internal Model Approach

ING Bank Annual Report 2018 239
Contents | Who we are | Report of the Management Board | Corporate governance | Consolidated annual accounts | Parent company annual accounts | Other information
> Risk Management > 50
Sensitivities
As part of the risk monitoring framework, FI-FM Risk actively monitors the daily changes of
sensitivities of the trading portfolios. Sensitivities measure the impact of movements in individual
market risk factors (foreign exchange rates, interest rates, credit spreads, equity, and commodity
prices) on profit and loss results of the trading positions and portfolios.
The following tables show the five largest foreign exchange trading positions, and interest rate and
credit spread sensitivities. The credit spread sensitivities are furthermore split in different risk
classes and sectors. Due to the nature of the trading portfolios, positions change from day to day.
amounts in EUR millions 2018 2017
Foreign exchange Foreign exchange
US Dollar –957 US Dollar –144
Chinese Yuan Renminbi –18 Polish Zloty 29
Swiss Franc –14 South Korean Won 26
Polish Zloty 14 Japanese Yen –21
South Korean Won 14 Taiwan New Dollar 21
1 In order to make sure that all the tables in the Market risk in trading books are aligned, the scope of all the tables has been
set to include all portfolios that are part of the trading book regulatory capital for both 2018 and 2017. In the Annual report
of 2017 the table above included only the portfolios that are part of ING’s Financial Markets business line.
amounts in EUR thousands 2018 2017
Interest Rate (BPV) 1 Interest Rate (BPV) 1
Euro –214 US Dollar 292
US Dollar 189 Russian Ruble –65
Great-Britain Pound –112 Japanese Yen 61
Taiwan New Dollar 96 Taiwan New Dollar 52
Polish Zloty 54 Great-Britain Pound –45
Credit Spread (CSO1) 2 Credit Spread (CSO1) 2
Germany 345 United States 464
United States 330 France 164
Russian Federation 177 United Kingdom 144
Netherlands 164 Supranational –92
France 151 Germany 89
1 Basis Point Value (BPV) measures the impact on value of a 1 basis point increase in interest rates. The figures include
commodity risk in banking books.
2 Credit Spread Sensitivity (CS01) measures the impact on value of a 1 basis point increase in credit spreads. Exposures to
supranational institutions are not assigned to a specific country.
3 In order to make sure that all the tables in the Market risk in trading books are aligned, the scope of all the tables has been
set to include all portfolios that are part of the trading book regulatory capital for both 2018 and 2017. In the Annual report
of 2017 the table above included only the portfolios that are part of ING’s Financial Markets business line.
Most important foreign exchange year-end trading positions1
Most important interest rate and credit spread sensitivities at year-end3

ING Bank Annual Report 2018 240
Contents | Who we are | Report of the Management Board | Corporate governance | Consolidated annual accounts | Parent company annual accounts | Other information
> Risk Management > 50
2018 2017
amounts in EUR thousands Corporate
Financial
Institutions Corporate
Financial
Institutions
Credit Spread (CSO1) 1
Risk classes
1 (AAA) –6 90 –19 –233
2–4 (AA) 3 –24 4 –35
5–7 (A) 117 78 –19 79
8–10 (BBB) 245 –2 87 –23
11–13 (BB) 85 6 –70 –90
14–16 (B) 37 13 –12 –
17–22 (CCC and NPL) 18 – –2 1
Not rated 1 – 3 –
Total 500 161 –28 –300
1 Credit Spread Sensitivity (CS01) measures the impact on value of a 1 basis point increase in credit spreads.
2 In order to make sure that all the tables in the Market risk in trading books are aligned, the scope of all the tables has been
set to include all portfolios that are part of the trading book regulatory capital for both 2018 and 2017. In the Annual report
of 2017 the table above included only the portfolios that are part of ING’s Financial Markets business line.
Funding and liquidity risk
Introduction
Funding and liquidity (F&L) risk is the risk that ING Group or one of its subsidiaries cannot meet its
financial liabilities when they are due at reasonable cost and in a timely manner. ING incorporates
funding and liquidity management in its business strategy and applies a funding and liquidity risk
framework in order to manage such risks within pre-defined boundaries.
A high level overview of the F&L framework is provided in this graph.
Credit spread sensitivities per risk class and sector at year-end2
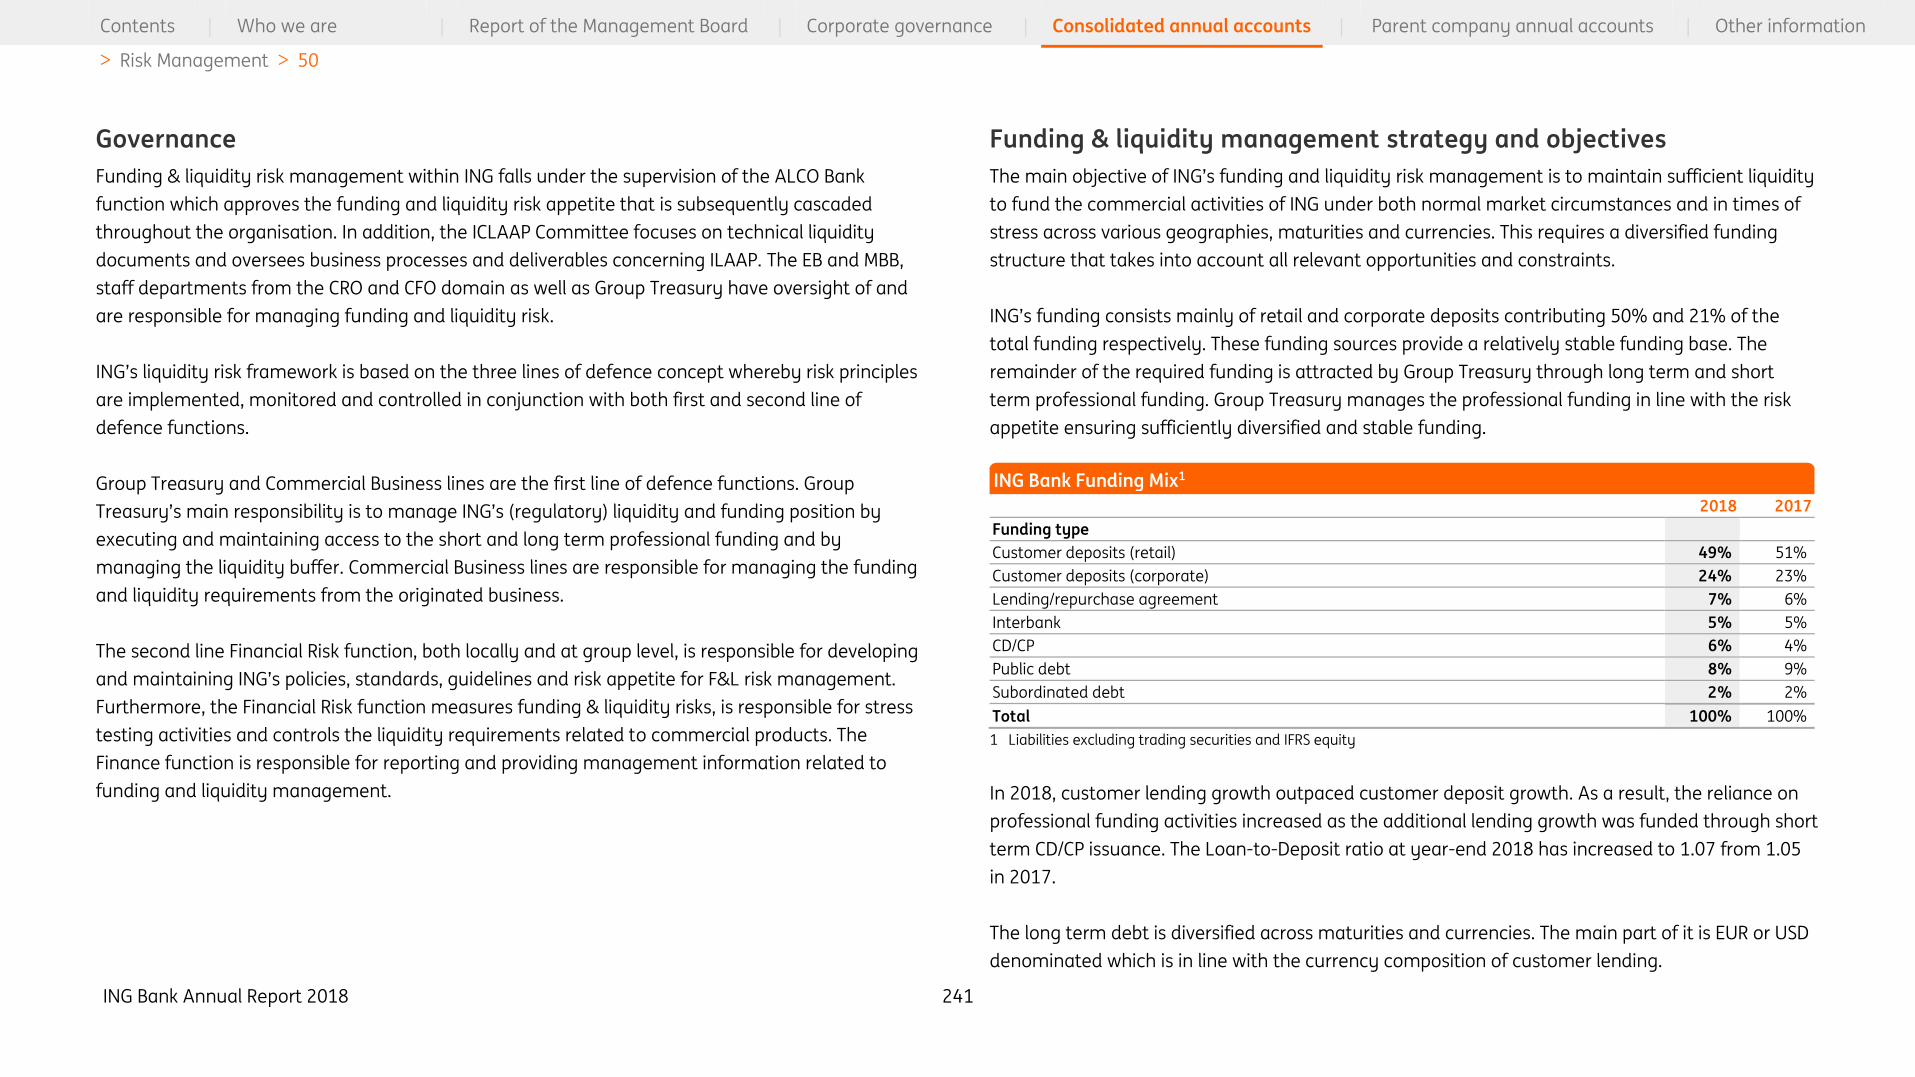
ING Bank Annual Report 2018 241
Contents | Who we are | Report of the Management Board | Corporate governance | Consolidated annual accounts | Parent company annual accounts | Other information
> Risk Management > 50
Governance
Funding & liquidity risk management within ING falls under the supervision of the ALCO Bank
function which approves the funding and liquidity risk appetite that is subsequently cascaded
throughout the organisation. In addition, the ICLAAP Committee focuses on technical liquidity
documents and oversees business processes and deliverables concerning ILAAP. The EB and MBB,
staff departments from the CRO and CFO domain as well as Group Treasury have oversight of and
are responsible for managing funding and liquidity risk.
ING’s liquidity risk framework is based on the three lines of defence concept whereby risk principles
are implemented, monitored and controlled in conjunction with both first and second line of
defence functions.
Group Treasury and Commercial Business lines are the first line of defence functions. Group
Treasury’s main responsibility is to manage ING’s (regulatory) liquidity and funding position by
executing and maintaining access to the short and long term professional funding and by
managing the liquidity buffer. Commercial Business lines are responsible for managing the funding
and liquidity requirements from the originated business.
The second line Financial Risk function, both locally and at group level, is responsible for developing
and maintaining ING’s policies, standards, guidelines and risk appetite for F&L risk management.
Furthermore, the Financial Risk function measures funding & liquidity risks, is responsible for stress
testing activities and controls the liquidity requirements related to commercial products. The
Finance function is responsible for reporting and providing management information related to
funding and liquidity management.
Funding & liquidity management strategy and objectives
The main objective of ING’s funding and liquidity risk management is to maintain sufficient liquidity
to fund the commercial activities of ING under both normal market circumstances and in times of
stress across various geographies, maturities and currencies. This requires a diversified funding
structure that takes into account all relevant opportunities and constraints.
ING’s funding consists mainly of retail and corporate deposits contributing 50% and 21% of the
total funding respectively. These funding sources provide a relatively stable funding base. The
remainder of the required funding is attracted by Group Treasury through long term and short
term professional funding. Group Treasury manages the professional funding in line with the risk
appetite ensuring sufficiently diversified and stable funding.
2018 2017
Funding type
Customer deposits (retail) 49% 51%
Customer deposits (corporate) 24% 23%
Lending/repurchase agreement 7% 6%
Interbank 5% 5%
CD/CP 6% 4%
Public debt 8% 9%
Subordinated debt 2% 2%
Total 100% 100%
1 Liabilities excluding trading securities and IFRS equity
In 2018, customer lending growth outpaced customer deposit growth. As a result, the reliance on
professional funding activities increased as the additional lending growth was funded through short
term CD/CP issuance. The Loan-to-Deposit ratio at year-end 2018 has increased to 1.07 from 1.05
in 2017.
The long term debt is diversified across maturities and currencies. The main part of it is EUR or USD
denominated which is in line with the currency composition of customer lending.
ING Bank Funding Mix1

ING Bank Annual Report 2018 242
Contents | Who we are | Report of the Management Board | Corporate governance | Consolidated annual accounts | Parent company annual accounts | Other information
> Risk Management > 50
Funding & liquidity adequacy and risk appetite
ING Bank distinguishes several key drivers of future liquidity and funding needs:
• The boundaries set by current and future regulatory requirements;
• The boundaries set by risk appetite statements (EUR and USD currency);
• The findings from various stress tests;
• The boundaries regarding the distribution and transferability of liquidity; and
• Any funding/refinancing needs.
Based on all these perspectives, ING Bank assesses the current and future adequacy of its liquidity
position and, if deemed necessary, takes steps to further improve the position with the aim to
ensure that ING Bank has sufficient counterbalancing capacity. That is achieved through the
quarterly update of the Liquidity Adequacy Statement and the execution of the ILAAP process.
ING has a Funding & Liquidity framework in place such that ING has sufficient liquidity under
normal, adverse and stressed market circumstances. In general, ING considers the adequacy of its
F&L position through three main lenses: (i) Stress, (ii) Sustainability and (iii) Regulatory.
(i) Through the Stress lens ING considers its ability to withstand a period of prolonged F&L stress,
either idiosyncratic, market related or a combination of both, leading to customer deposit outflow
or reduced access to funding markets;
ii) Through the Sustainability lens ING assesses the extent to which our customers, professional
counterparties and investors are comfortable providing funding in tenors, currencies and
instruments that ING needs to sustainably fund its business (intraday, short term and long term) in
a going concern situation;
(iii) Through the Regulatory lens ING ascertains that it is in the position to meet current and
forthcoming regulatory requirements.
For each lens, ING has in place a set of risk appetite statements which define its risk appetite profile
commensurate with the principles of liquidity adequacy. These are summarised in the next graph.
These risk appetite statements are subsequently translated into a number of metrics with
appropriate boundaries and instruments that are used to measure and manage ING’s funding and
liquidity adequacy.
For the stress lens, the risk appetite is set such that there is sufficient counterbalancing capacity in
the form of liquid assets under different internally defined stress scenarios. From the Sustainability
perspective, an internally defined Stable funding to Loans ratio (supplemented by other metrics) is
used to have a diversified funding base and to prevent overreliance on (short term) professional
funding. Finally, the regulatory metrics Liquidity Coverage Ratio (LCR) and NSFR (Net Stable Funding
Ratio) are monitored to comply with ING’s risk appetite and with regulatory requirements.
The LCR is a measure that compares the available buffer of High Quality Liquid Assets (HQLA) to Net
outflows (Outflows- Inflows) in a 30-day stress scenario defined by the regulator. The liquidity
ING Bank Annual Report 2018 243
Contents | Who we are | Report of the Management Board | Corporate governance | Consolidated annual accounts | Parent company annual accounts | Other information
> Risk Management > 50
buffer of ING is part of the counterbalancing capacity which serves as a cushion for liquidity needs
under normal and stressed conditions.
The liquidity buffer consists mainly of ‘Level 1’ assets which are the most liquid ones and are
predominantly represented by government or central bank assets. Only assets that are freely
available (not pledged under existing contracts) for liquidity purposes are included in the buffer. The
size and composition of the Liquidity buffer is determined by ING’s risk appetite and regulatory
liquidity requirements.
The Macroeconomic and Market environment are important considerations in the Funding and
Liquidity Framework.
Shifts in the macroeconomic environment are exogenous factors that ING has no control over but
which may have a material impact on the F&L position both in terms of the strategic goals and in
terms of the risk framework. The main macroeconomic factors which are analysed on a regular
basis include:
Global and local economic performances such as shifts in GDP, the inflation rate, unemployment
rates and public deficit/surplus;
Changing geopolitical trends;
Monetary policy with special focus on the impact of eventual reversal of unconventional
measures taken by central banks in recent years on ING’s F&L position; and
Regulatory requirements: understanding of the changing regulatory landscape and of the
different, sometimes contradicting, effects ING’s actions have on regulatory boundaries.
In terms of the market environment, the strategic ambitions of ING, together with the design and
execution of funding plans, are always considered under current and projected market conditions.
Key emphasis is placed on understanding overall market trends and developments, credit ratings
and peer comparison.
Liquidity Stress Testing
The Funding & Liquidity Stress Testing forms part of the overall Funding & Liquidity framework. It
allows ING to examine the effects of exceptional but plausible future events on ING’s liquidity
position and provides insight into which entities, business lines or portfolios are vulnerable to which
types of risk and/or under which scenarios.
The scope of the Funding & Liquidity Stress Testing framework includes the funding and liquidity
risks of the consolidated balance sheet of ING Groep N.V. including all entities, business lines, on-
and off-balance sheet positions as well as contingent assets and liabilities. The Net Liquidity
Position (NLP) and Time-to-Survive (TTS) are two pre-determined output metrics both of which are
affected as a result of the application of specific scenarios and parameters.
The Funding & Liquidity Stress Testing framework distinguishes between idiosyncratic and market-
wide scenarios (and a combination of the two) and differentiates between stress events that
develop in a gradual or fast manner. The generic design of the Funding & Liquidity Stress Testing
framework, which is based on empirical evidence supplemented with expert judgment, can easily
be applied to a specific scenario for example as input for the firm-wide stress testing or reverse
stress testing.
The outcomes of the stress tests are taken into consideration across all the key aspects of ING’s
F&L risk framework and liquidity management:
risk appetite framework (through risk appetite statements);
risk identification and assessment;
monitoring of the liquidity position;
the contingency funding plan; and
early warning indicators.
The Funding & Liquidity Stress Testing framework is also subject to regular internal validation.
In line with ECB regulation, ING’s liquidity position is stress tested on a monthly basis under a
particular scenario that forms part of the F&L Risk Appetite Statement. In addition, the results of
the stress scenarios are monitored and evaluated on a regular basis and provide input for any
follow-up on the need for additional contingency measures.

ING Bank Annual Report 2018 244
Contents | Who we are | Report of the Management Board | Corporate governance | Consolidated annual accounts | Parent company annual accounts | Other information
> Risk Management > 50
In the contingency funding plan, contingency liquidity risk is addressed which specifically relates to
the organisation and planning of liquidity management in times of stress. The contingency funding
plans are developed in conjunction with the ING Recovery Plan and are tested on a regular basis
both centrally and at business unit level.
Non-financial risk and compliance risk
Introduction
The Non-Financial Risk (NFR) function encompasses Operational Risk Management (ORM),
Information Risk Management (IRM), the Independent Validation Unit (IVU) and Corporate Security
& Investigations (CSI). The Compliance Risk Management function encompasses the FCC (Financial
Crime Compliance) and RCC (Regulatory Compliance & Conduct) teams. Risk controls for these
functional areas have been implemented by means of policies and minimum standards which
apply to ING’s business processes in the entities. ING has a system of internal controls that is
reviewed and updated periodically and when necessary. ING’s goal is to create an environment of
continuous improvement in managing non-financial and compliance risks. There is an
infrastructure in place enabling management to track events, compliance and non-financial risk
issues.
ING believes that an effective control environment is essential to build and maintain sustainable
businesses, and preserve and enhance the trust of its customers, employees and shareholders. The
Orange Code is a manifesto that describes our way of working and sets the foundation for the
ethical standards ING expects from all its employees, business activities, and partners. It is
comprised of ING Values, requiring all staff to act with integrity, whilst being honest, prudent and
responsible - and the ING Behaviours - our way of being that makes us different from our
competitors.
Governance
The Head of Corporate ORM, Corporate IRM, IVU and CSI report to the Global Head of Non-Financial
Risk. The Head of Financial Crime Compliance and the Head of Regulatory Compliance & Conduct
both report to the Chief Compliance Officer (CCO).
The Global Head of Non-Financial Risk is responsible to develop the framework of non-financial risk
policies and standards within ING, and for monitoring the quality of non-financial risk management
in the ING entities.
The Chief Compliance Officer (CCO) is the Global Head of the Compliance Risk Management
function. This is an independent function responsible for developing and establishing the Bank-wide
policies and minimum standards for managing compliance risks. The CCO assists the SB, EB and
MBB in managing ING’s compliance risks and control framework. The CCO is a permanent
participant of the Risk Committee of the Supervisory Board. The CCO and the Global Head of Non-
Financial Risks meet regularly the Chairman of the Risk Committee of the SB.
Non-Financial Risk Committees (NFRCs) and Management Teams (MTs) measure, monitor and
manage operational, information and compliance risks. The Bank NFRC is the primary approval and
oversight committee for non-financial risk matters. Additionally NFRCs exist at the Division and/or
Entity level providing input to the Bank NFRC. They are chaired by the first line of defence with the
purpose to steer the risk management activities of the first and second lines of defence in their
respective scope. Non-financial risk topics are an integral part of the agenda of regular MTs at
various levels of the organisation. Since 2018, with the changes in guidelines issued by the EBA, a
Group NFRC has been established covering the ING Group entities that are not in scope of the Bank
NFRC.
The NFR and Compliance functions use a layered functional approach within divisions to support a
systematic and consistent implementation of the framework of policies and minimum standards
within ING. To avoid potential conflicts of interests, it is imperative that staff in this function are
independent and objective when advising business management on non-financial or compliance
ING Bank Annual Report 2018 245
Contents | Who we are | Report of the Management Board | Corporate governance | Consolidated annual accounts | Parent company annual accounts | Other information
> Risk Management > 50
risk matters in their business unit or business line. To facilitate this, a functional reporting line to the
next higher level within Operational Risk Management (ORM), Information Risk Management (IRM)
and Compliance Risk Management is in place. The functional reporting line has clear
accountabilities with regard to objectives setting, remuneration, performance management and
appointment of new staff as well as a mandate to instruct, veto and escalate.
Framework
Non-financial risk is the risk of financial loss, legal or regulatory sanctions, or reputational damage
due to inadequate or failing internal processes, people and systems; a failure to comply with laws,
regulations and standards; or external events. ING has a framework for non-financial risks that
supports and governs the process of identifying, measuring, mitigating, monitoring and reporting
non-financial and compliance risks. It reflects the stages described in the Enterprise Risk
Management model of COSO (Committee of Sponsoring Organisations of the Treadway
Commission).
Processes aim at identifying key threats, vulnerabilities and the associated risks which might cause
adverse events. Event identification is performed and precedes a risk assessment. Different
techniques for event identification exist within ING, such as Risk & Control Self-Assessments,
business environment assessment, scenario analysis, internal events analyses (e.g. lessons learned
based on information from event reporting), external events inventories, and monitoring.
Risk & Control Self-Assessment
Risk & Control Self-Assessment (RCSA) of non-financial risks inherent to ING products, activities,
people, processes and systems provide management with an understanding of the operational risk
profile. Based on the identification and assessment, internal controls are designed for the
mitigation of risks to remain within the risk appetite.
Business Environment Assessment
The Business Environment Assessment (BEA) assesses internal control factors and external factors
that could influence the internal and external operating environment in the future, and which may
lead to unacceptable operational risk exposure and endanger achieving our strategic objectives.
Scenario analysis
Scenario analysis is a process used to consider the impact of rare, significant, yet plausible future
events, taking into consideration alternative possible outcomes for those events, their severity and
frequency. Input for scenario analysis includes the results of various internal and external
assessments such as the BEA. Scenario analysis is an important component in the calculation of
operational risk capital.
Internal events analyses
Analysis of internal non-financial loss data assists in identifying, quantifying, mitigating and
monitoring operational risk exposure. It provides insight into causes and effectiveness of associated
controls. Supporting the creation and sharing of Lessons Learned for significant internal events is
one of the means by which NFR enhances the internal control framework of ING.
External events inventories
External non-financial loss data provides valuable information about the losses experienced by
other entities outside ING, and assists ING to quantify its exposure to risk events that have not been
experienced internally. External loss data is an important component in the calculation of
operational risk capital.
Risk responses
Business units and departments perform regular monitoring activities, BEAs and Risk & Control Self-
Assessments (RCSAs) to identify and assess risks. These are conducted with involvement of the
business and their ORM, IRM, Compliance and/or Legal departments. Based on the results of the risk
ING Bank Annual Report 2018 246
Contents | Who we are | Report of the Management Board | Corporate governance | Consolidated annual accounts | Parent company annual accounts | Other information
> Risk Management > 50
assessment, response measures should be determined for the identified risks beyond the risk
appetite.
Risk response can be achieved through several combinations of mitigation strategies, for example,
reducing the likelihood of occurrence, reducing the impact, risk avoidance, risk acceptance or
through the transfer of risk. Tracking takes place through ING’s global action tracking system iRisk.
Risk appetite and reporting
The specific Non-Financial Risk appetite (defined as the acceptable and authorised maximum level
of non-financial risk) is approved by the MBB based on a proposal made by the Bank NFRC.
Adherence to this risk appetite is monitored quarterly through the NFR Dashboard which reports
the key non-financial risk exposures. The NFR Dashboard provides management at country,
divisional and bank level with an overview of key risks within the non-financial risk areas including
compliance risks, information security risks, continuity risks, control & processing risks, fraud risks,
unauthorised activities risks, and personal and physical security risks, enabling management to
focus and set priorities.
The yearly objective setting process for both business management and NFR professionals aims to
keep improving the management of non-financial and compliance risks throughout ING to
safeguard that ING stays in control of its current and future non-financial and compliance risks.
The Non-Financial Risk reporting deliverables consist primarily of the quarterly Non-Financial Risk
Dashboard (NFRD) report and a monthly NFRD booklet. The iRisk system serves as the single source
of truth for NFR and Compliance risk management information and supports the three lines of
defence in their Risk Management and Reporting activities.
Advanced Measurement Approach (AMA)
ING has an Operational Risk Capital model in place in which the risk profile is closely tailored to its
internal risk profile and its divisions, by using scenario data for capturing severe unlikely risks and
internal losses, and RCSA data for capturing day-to-day risks. The business has a leading role in
assessing scenario severities, with the ORM function validating and challenging the results. The
internal data are combined with external loss data (ORX) in the AMA capital calculation. Since April
2013, ING is allowed to use its AMA model for regulatory capital calculation purposes. ING reports
the regulatory capital numbers on a quarterly basis.
Risk mitigations
ING is currently not using any insurance or risk transfer mechanisms for the mitigation of risk in the
context of the AMA capital calculation.
Operational risk
Definition
Operational risk is defined as the risk of direct or indirect loss resulting from inadequate or failed
internal processes, people and systems or from external events.
Risk categories
ING categorises operational risks in a number of risk areas:
• Information (Technology) risk is the risk of financial loss, regulatory sanctions or reputational
damage due to breaches of confidentiality, integrity or availability within business processes or
information or lack of information quality;
• Continuity risk is the risk of financial loss, regulatory sanctions or reputational damage due to
business disruptions (loss of people, processes, systems, data, premises);
• Control and processing risk are the risks of financial loss, regulatory sanctions or reputational
damage due to ineffective organisation structures and governance procedures (including unclear
roles and responsibilities and inadequate reporting structure), failed (transaction) processing
(input, execution, output) or failing process management; monitoring and enforcement of risk
mitigating measures; and risk culture;
• Internal fraud risk is the risk of financial loss, regulatory sanctions or reputational damage due to
deliberate abuse of procedures, systems, assets, products and/or services of ING by employees
ING Bank Annual Report 2018 247
Contents | Who we are | Report of the Management Board | Corporate governance | Consolidated annual accounts | Parent company annual accounts | Other information
> Risk Management > 50
(incl. temporary workers, third party contractors, internships and consultants) who intend to
deceitfully or unlawfully benefit themselves or others;
• External fraud risk is the risk of financial loss, regulatory sanctions or reputational damage due to
deliberate abuse of procedures, systems, assets, products and/or services of ING by external
parties (clients, potential clients or other third parties, including vendors and outside agencies)
who intend to deceitfully or unlawfully benefit themselves or others;
• Unauthorised activity risk is the risk of financial loss, regulatory sanctions or reputational damage
due to employees performing outside the normal course of their business, intentionally giving
unauthorised approvals or overstepping their authority;
• Personal and physical security risk is the risk of financial loss, regulatory sanctions or reputational
damage due to criminal and environmental threats that might endanger the security or safety of
ING personnel at work, people in ING locations, ING assets or assets entrusted to ING, people at
ING event locations, or might have an impact on ING organisation's confidentiality, integrity or
availability; and
• Employment practice risk is the risk of financial loss, regulatory sanctions or reputational damage
due to acts that are inconsistent with employment, health and/or safety laws, regulations or
agreements, from payment of personal injury claims, or from diversity/discrimination events.
Operational risk includes the related risk of reputation loss, as well as legal risk; strategic risks are
not included. Reputational risk is defined as the possibility that adverse publicity regarding ING’s
business practices and associations, whether accurate or not, will cause a loss of confidence in the
integrity of ING. Reputational risk is multidimensional and reflects the perception of other market
participants, like customers, counterparties, shareholders, investors or regulators that can
adversely affect ING’s ability to maintain existing, or establish new, business relationships and
continued access to sources of funding (e.g. through the interbank or securitisation markets).
Legal risk is defined as the risk related to (i) a failure (or perceived failure) to adhere to applicable
laws, regulations and standards, (ii) contractual liabilities or contractual obligations that are
defaulted or cannot be enforced as intended, or are enforced in an unexpected or adverse way,
and (iii) liability towards third parties due to an act or omission contributable to ING (potentially)
resulting in impairment of ING’s integrity, leading to damage to ING’s reputation, legal or regulatory
sanctions, or financial loss.
Given the heavy reliance on IT systems in financial institutions, controls that monitor the various
aspects of IT risk, such as integrity and confidentiality, are embedded in ING’s risk and control
framework.
Business Continuity Management Framework
The Business Continuity Management (BCM) policy and its accompanying minimum standard
establish the principles, governance and framework around which BCM capability is designed, built
and maintained such that ING is prepared to respond to a variety of external and internal disruptive
events and can effectively recover from a severe business disruption at pre-defined service levels.
ING’s BCM life-cycle is a business driven process.
Main developments in 2018
Cybercrime & Fraud
Cybercrime remains a significant threat to ING with attack methodologies capable of rapidly
evolving to adapt to new or enhanced security measures. Relatively unskilled, criminally
motivated hackers are increasingly adopting the tactics, techniques and procedures (TTPs)
typically used by more sophisticated nation-stated backed adversaries. Moreover, evidence
suggests that sophisticated techniques are becoming more widely commoditised. In 2018 an
uptick in “Cybercrime-as-a-Service” made large scale DDoS or phishing attacks increasingly
affordable and available for threat actors of all capability levels.
Controls continue to be embedded in the organisation as part of the overall internal control
framework and are continuously re-assessed against existing and new threats. The identification
and monitoring of threat actors and campaigns relevant to ING also informs this process as does
the closer alignment between IT security and fraud teams. In addition, ING continues to
strengthen its global cybercrime and fraud resilience through extensive collaboration with

ING Bank Annual Report 2018 248
Contents | Who we are | Report of the Management Board | Corporate governance | Consolidated annual accounts | Parent company annual accounts | Other information
> Risk Management > 50
financial industry peers, law enforcement authorities, government (e.g. National Cyber Security
Center) and internet service providers (ISPs).
Concerns over the potential impact of insider threat continues to increase but specific
information relating to instances or trends in the financial industry remains limited.
The increasing use of third party vendors for services and the implementation of PSD2 is likely to
represent fraud management and IT security challenges in the short term as criminal actors
target financial data outside the traditional banking environment.
Dealing with current and upcoming fraud threats effectively requires continuous improvement
of fraud prevention methodologies, automated fraud detection and better alignment of cross
border fraud response across ING.
User Access Management (UAM) User Access Management (UAM) is one of the focus areas of ING and an important element in our
control framework to mitigate the risk of unauthorized and / or inappropriate access to systems,
processes and the data and information contained therein. Consequently, the User Access
Management processes, controls and practices are periodically reviewed, tested, adapted and
improved by a dedicated UAM team to address ongoing developments in and outside ING. In 2019
process will continue to mature, with attention to standardization, harmonisation of processes, day
to day practices and further automation of UAM controls.
Outsourcing Risk
In 2018, a new Sourcing Policy became effective which outlines the inherent critical and high risks
that can materialise during the sourcing life-cycle and the control objectives to effectively mitigate
these risks. In addition the Support Control Framework (SCF) Sourcing defines the controls that have
to be implemented and tested to effectively mitigate the risks. The scope of sourcing encompasses
outsourcing to external providers as well as intra-group sourcing. In the second half of 2018, ING
provided input to the EBA, via European Banking Forum (EBF), during the consultation round of its
draft Guidelines on Outsourcing. In 2019 NFR will perform a gap-analysis on the final guidelines in
order to identify and implement additional requirements.
Compliance risk
Definition
Compliance risk is defined as the risk of impairment of ING’s integrity, leading to damage to ING’s
reputation, legal or regulatory sanctions, or financial loss, due to a failure (or perceived failure) to
comply with applicable laws, regulations and standards and the ING Values as part of the Orange
Code. We aim to effectively manage compliance risks that could expose ING to reputational
damage, fines, civil and criminal penalties, payment of damages, court orders and suspension or
revocation of licenses that would adversely impact our customers, staff, shareholders and other
stakeholders.
The Compliance Risk Management function established a compliance control framework in which
controls are defined based on laws, regulations, and standards that are part of the internal control
framework of ING applicable to non-financial risks. To support management in mitigating
compliance risks, the Compliance Risk Management function supports training and advises the
business in managing compliance risks related to e.g. money laundering, terrorist financing,
sanction and export control compliance, conflicts of interests, misselling, corruption and protection
of customers’ interests, Financial Account Tax Compliance Act (FATCA), Common Reporting
Standard (CRS), and US withholding tax and information reporting regulations.
Risk categories
ING categorises compliance risk into four conduct-related integrity risk areas:
• Client conduct refers to the compliance risks arising from the relationship with or generated by
the conduct of our clients and/or business partners, like money laundering or terrorist financing.
Those risks are generally defined within ING as Financial Economic Crimes. Furthermore, client
conduct refers also to the compliance risks relating to FATCA, CRS, and US withholding tax and
information reporting regulations;
• Personal conduct refers to the compliance risks arising from the conduct of ING employees;

ING Bank Annual Report 2018 249
Contents | Who we are | Report of the Management Board | Corporate governance | Consolidated annual accounts | Parent company annual accounts | Other information
> Risk Management > 50
• Financial Services conduct refers to the compliance risks arising from or generated by the
conduct of ING when developing, marketing and/or selling products and services to its clients;
and
• Organisational conduct refers to the compliance risks arising from the way the Bank is organising
itself to develop its activities. This category covers for instance the licences required to perform
its regulated banking activities.
Controls aiming to mitigate the compliance risks associated with the above mentioned risk areas
are designed and applied to the day-to-day processes in the bank. The effectiveness of the controls
is tested periodically, and senior management has the responsibility that their processes are
compliant with applicable laws and regulations, ING’s internal policies, and the Orange Code.
In cases where an employee of ING suspects an actual or potential irregularity or misconduct
within ING that leads or could lead to a violation of ING Orange Code, any ING policy and/or any
applicable law, regulation or code, can be reported anonymously in line with the Whistle-blower
Policy, via internal or external channels next to normal reporting channels.
Financial Economic Crime (FEC) Policy and Minimum Standards
The FEC Policy and Minimum Standards reflect relevant national and international laws, regulations
and industry standards. The FEC Policy is mandatory and applies to all ING entities, majority owned
ING business, businesses under management control, staff departments, product lines and to all
client engagements and transactions.
Management of ING entities maintain local procedures aiming at enabling them to comply with
local laws, regulations and the FEC Policy and Minimum Standards. Where local laws and
regulations are more stringent, the local laws and regulations are applied. Likewise the FEC Policy
and Minimum Standards prevail when the standards therein are stricter than stipulated in local
laws and regulations and if not specifically forbidden.
The FEC Policy and Minimum Standards set the requirements for all ING entities to guard against
involvement in criminal activity. The requirements in the FEC Policy cover minimum standards and
controls related to: money laundering, terrorist financing, export trade controls, proliferation
financing, sanctions (economic, financial and trade) and countries designated by ING as Ultra High
Risk Countries (UHRC).
As a result of frequent evaluation of the businesses from economic, strategic and risk perspective
ING continues to believe that for business reasons doing business involving certain specified
countries should be discontinued. In that respect, ING has a policy not to enter into new
relationships with clients from these countries and processes remain in place to discontinue
existing relationships involving these countries. At present these countries are Cuba, Iran, North
Korea, Sudan and Syria. Each of these countries is subject to EU and/or US sanctions regimes. Iran,
Sudan, and Syria are identified by the US as state sponsors of terrorism and are subject to US
economic sanctions and export controls.
Main developments in 2018
Regulatory developments
Compliance with applicable laws and regulations is resource-intensive. Banks continue to be faced
with new and increasingly onerous regulatory requirements, and we expect the scope and extent
of regulations in the jurisdictions in which we operate to generally increase further.
Regulation is becoming increasingly more extensive and complex. An example is the
implementation of the Common Reporting Standard (CRS), which like FATCA requires financial
institutions to report detailed client-related information to the competent authorities. Customer
due diligence (CDD) and transaction monitoring impose obligations on financial institutions to
maintain appropriate policies, procedures and controls to detect, prevent and report money
laundering , terrorist financing, and fraud.
Despite our efforts to comply with applicable laws and regulations, there are a number of risks in
areas where applicable regulations are unclear, or under development, are in conflict with each

ING Bank Annual Report 2018 250
Contents | Who we are | Report of the Management Board | Corporate governance | Consolidated annual accounts | Parent company annual accounts | Other information
> Risk Management > 50
other, or where regulators revise their guidance or courts set new legal standards. Meeting these
requirements within the strict timelines that are set poses a significant challenge for banks. ING will
continuously work on embedding in our IT systems and data the processes and procedures needed
for effective compliance and developing its people to have the right knowledge and skills.
4th AML Directive
The 4th AML Directive, as issued by the European Union, has been incorporated into the update of
the ING Financial Economic Crime Policy and Minimum Standards, which has been renamed Know
Your Client (KYC) Policy, incorporating also KYC-related requirements of the FATCA/CRS policy, as
well as certain elements of the Environmental Social Risk policy. The main changes in this Directive
(compared to the 3rd AML Directive) are related to: the establishment of an Ultimate Beneficial
Owner (UBO) register (at national level with the potential to share the information within the
European Economic Area (EEA)) and a stronger approach towards the application of due diligence
on ING’s customers. The implementation date of the Directive was 26 June 2017. The
implementation of the directive into Dutch law has taken place in July 2018.
On 5 July 2017 the European Commission presented a new proposal for a Directive amending the
4th AML Directive (so called 5th AML Directive). The aim of the proposal is to tackle new means of
terrorist financing, increase transparency to combat money laundering and help strengthen the
fight against tax avoidance. On 8 June 2018, the EU Council adopted its position on the proposed
Directive.
In addition, the European Supervisory Authorities (ESAs) issued their final Guidelines on risk factors
on 26 June 2018, which became applicable by 26 June 2018. These Guidelines promote a common
understanding of the risk-based approach to AML/CFT and set out how it should be applied in the
context of the 4th EU AML Directive. Furthermore, on 22 September 2018 the ESAs also issued their
final Guidelines to prevent the abuse of funds transfers for terrorist financing and money
laundering purposes. These guidelines applied from six months after the date on which they are
issued.
FEC/KYC
In September 2018, ING was impacted by the EUR 775 million settlement agreement with the
Dutch Public Prosecution Service related to the previously disclosed criminal investigations that
found serious shortcomings in the execution of customer due diligence requirements to prevent
financial economic crime at ING Netherlands in the period investigated (2010-2016).
The implementation and execution of policies and procedures related to anti-money laundering
(AML) is an ongoing activity. In addition, ING has taken a number of specific measures to
strengthen its management of compliance risks and address the root causes of the shortcomings.
These measures are being implemented as part of the bank-wide, global Know Your Customer (KYC)
Enhancement Programme, a multi-year improvement programme with integral steering. This
specific programme was officially launched early in 2017 and is expected to run until end-2020. ING
is committed to periodically providing the Dutch central bank (DNB) with regular updates on the
progress made.
The KYC Enhancement Programme encompasses all client segments in all ING business units,
leveraging on experiences from the enhancement programme already started in the Netherlands.
The programme consists of three parts: (a) look-back analysis on past deficiencies in post-
transaction monitoring. The look-back analysis consists of screening of transactions executed in the
past. In case unusual transactions are identified, ING is committed to following the applicable
reporting process; (b) enhancement of customer due diligence files with the aim to document
sufficiently the knowledge the bank has about its clients in the line with past and new
requirements; (c) structural solutions that should support getting sustainably better in addressing
money laundering risks in our portfolio and complying with laws and regulations.
The structural solutions comprise five pillars:
• Development and global roll-out of KYC risk appetite statements, KYC risk assessments on
clients, capability structure and maturity assessments. Setting acceptance criteria based on
which clients are on-boarded, transactions are processed or taxes are withheld. This pillar covers

ING Bank Annual Report 2018 251
Contents | Who we are | Report of the Management Board | Corporate governance | Consolidated annual accounts | Parent company annual accounts | Other information
> Risk Management > 50
also the use of a uniform risk assessment methodology for KYC-related integrity risks and a
common taxonomy to measure effectiveness.
• Development and global roll-out of a bank-wide KYC digital service platform, including
processes and tooling around CDD, screening and workflow management. This includes the
fulfilment of the client acceptance and maintenance life cycle within one global digital platform.
All required screening components (name screening, pre-transaction screening, adverse media
screening) will be incorporated into the client acceptance due diligence process. Once a customer
is onboarded, ongoing screening and monitoring of transactions can then be activated.
• Translation of risk assessment outcomes into scenarios and alert definitions that can be
applied in transaction monitoring. This includes the design and definitions of the applicable
financial economic crime (FEC) and client activity monitoring (CAM) scenarios per entity, the
building of the alert definitions (including data feeds) and migration to a central tool where
relevant and possible, and validating and testing the approach from risks to alerts.
• Set up central KYC organisation that defines standards and drives global execution and
improvements. This includes the set-up of the new KYC organisation now in place. As of 4Q 2018,
we have strengthened the KYC governance by including the heads of the business lines in the
KYC Committee. Going forward we will further develop the global KYC function to ensure
structural embedding of standardised and uniform ways of working, with regular improvement
cycles and support of advanced technologies and insights.
• Develop and rollout KYC communication and awareness initiatives and set up a behavioural
risk department that performs risk assessments. In its internal communications, ING has made
it clear that non-financial risk and compliance are just as important as financial risk and will be
embedded in ING’s DNA. An online training module to enhance awareness of KYC was rolled out
to all employees worldwide. MBB members spent a considerable amount of time engaging with
staff to explain and discuss our responsibility as gatekeepers of the financial system. In these
meetings, the impact of the settlement, the root causes, the shortcomings and our commitment
and efforts to enhance were discussed. ING started behavioural risk assessments during which
more than 100 interviews were held and more than 200 surveys were done to understand better
how people, teams and departments interact and work together. Based on these insights,
actions for improvement will be considered.
ING recognises that fighting Financial Economic Crime requires close cooperation with other banks
and supervisory and regulatory authorities. ING is therefore working with the Dutch Banking
Association (NVB) and the Dutch central bank (DNB) on harmonising efforts in the fight against FEC
and participates actively in various working groups and project teams in this area. As such, ING
actively participates in public-private partnerships to combat FEC, such as participating in the FEC
Council PPS (‘FEC-RAAD Public Private Cooperation’) in which Dutch authorities and financial
institutions cooperate on supervision, control, prosecution or investigation with financial sector
parties to strengthen the integrity of the sector. This is done by means of preventative action to
identify and combat threats to integrity. ING believes that introducing clear accountabilities and
standard processes across the financial industry will allow ING to manage and control KYC activities
and integrity risks more effectively.
As previously noted, in connection with the above-mentioned investigations ING also received
information requests from the US Securities and Exchange Commission (SEC). ING has received a
formal notification from the SEC that it has concluded its investigation and, based on the
information at that time, the Division of Enforcement does not intend to recommend SEC
enforcement action against ING.
Financial Account Tax Compliance Act (FATCA)
Under provisions of US tax law commonly referred to as FATCA, non-US financial institutions are
required to provide certain information on their US account holders and/or certain US investors to
the US Internal Revenue Service (“IRS”). A 30% withholding tax will be imposed on ‘withholdable
payments’ made to non-compliant non-US financial institutions. As part of the actions taken to
comply with FATCA and other US withholding tax regulations, ING is for example updating and
strengthening its withholding compliance programme and reviewing, amending and filing the
necessary tax returns and information reports.
Many countries, including the Netherlands, have entered into agreements (‘intergovernmental
agreements’ or ‘IGAs’) with the US to facilitate the type of information reporting required under
FATCA. While the existence of IGAs will not eliminate the risk of the withholding described above,
ING Bank Annual Report 2018 252
Contents | Who we are | Report of the Management Board | Corporate governance | Consolidated annual accounts | Parent company annual accounts | Other information
> Risk Management > 50
these agreements are expected to reduce that risk for financial institutions and investors in
countries that have entered into IGAs. IGAs often require financial institutions in those countries to
report information on their US account holders to the taxing authorities of those countries, who
then passes the information to the IRS.
If the Bank cannot rely on IGA or satisfy the requirements, certain payments to the Bank may be
subject to withholding under FATCA. Certain payments may also be subject to other US withholding
tax regulations. The possibility of such withholding and the need for account holders and investors
to provide certain information may adversely affect the sales of certain of the Bank’s products. In
addition, compliance with the terms of such IGAs and with FATCA, any regulations or other
guidance promulgated thereunder, or any legislation promulgated under an IGA, and offering
products that generate ‘withholdable payments’, may substantially increase the Bank’s compliance
costs. Failure to comply with FATCA and other US withholding tax regulations could harm our
reputation and could subject the Bank to enforcement actions, fines and penalties, which could
have a material adverse effect on our business, reputation, revenues, results of operations, financial
condition and prospects.
In December 2018, the US IRS released proposed regulations that aim to reduce taxpayer burden
with respect to certain requirements under Chapter 3 and Chapter 4 (FATCA) of the US code.
Common Reporting Standard (CRS)
Similarly, the Organisation for Economic Cooperation and Development (‘OECD’) has developed a
Common Reporting Standard (‘CRS’) and model competent authority agreement to enable the
multilateral and automatic exchange of financial account information. CRS requires financial
institutions to identify and report the tax residency and account details of non-resident customers
to the relevant authorities in jurisdictions adhering to CRS. As of 29 October 2018, 104 jurisdictions
(‘signatory countries’), including the Netherlands, have signed a multilateral competent authority
agreement to automatically exchange information pursuant to CRS. The majority of countries
where ING has a presence have committed to CRS. The EU has made CRS mandatory for all its
member states. The first information exchange by the Netherlands (as for approximately half of
the signatory countries) was executed in 2017. Other signatory countries commenced their
information exchange in 2018.
In 2018, the OECD has introduced two new measures to tackle global tax avoidance/evasion:
Mandatory Disclosure Rules for Addressing CRS Avoidance Arrangements and Opaque Offshore
Structures
Preventing Abuse of Residence by Investment (RBI) and Citizenship by Investment (CBI) Schemes
to Circumvent the CRS
These measures are in the process of being implemented in local laws. With regard to the
mandatory disclosure rules for EU jurisdictions, this was done via the amendment to Directive
2011/16 (“DAC6”). See below.
DAC6 (EU2018/822, an amendment to EU Directive 2011/16)
DAC6 imposes mandatory disclosure requirements for taxpayers and intermediaries involving the
reporting of cross-border arrangements affecting at least one EU Member State that fall within one
of a number of “hallmarks”. These hallmarks are broad categories setting out particular
characteristics identified as potentially indicative of aggressive tax avoidance. The reporting
obligations apply to “intermediaries” (financial institutions like ING may fall under this term) or, in
some circumstances, the taxpayer itself. There will be a mandatory automatic exchange of
information on such reportable cross-border schemes via the Common Communication Network
(CCN) between the Member States which will be set-up by the EU. Although DAC6 is not effective
until 1 July 2020, taxpayers and intermediaries need to monitor cross-border arrangements
already as of 25 June 2018.
MiFID II
Integrity and transparency in financial markets are essential for public and investor confidence. The
revised Markets in Financial Instruments Directive European legislation (MiFID II) came into effect in
January 2018. A central programme continued in 2018 to support ING’s commitment to embed the
revised legislation throughout the organisation.
ING Bank Annual Report 2018 253
Contents | Who we are | Report of the Management Board | Corporate governance | Consolidated annual accounts | Parent company annual accounts | Other information
> Risk Management > 50
GDPR
As per 25 May 2018 the European General Data Protection Regulation (GDPR) became effective.
GDPR affords greater protection to individuals and requires more control on data and transparency
regarding the use of data by companies. In 2018 ING continued its central programme, which was
initiated in 2016, to implement these GDPR standards.
Awareness & Learning
Promoting Integrity Programme
The Promoting Integrity Programme was started in 2010 and consists of e-learning modules on key
bank-wide topics that can be followed-up with dialogue sessions in which managers discuss the
issues raised with their teams. The programme is sponsored by board members and senior
managers and is created for the benefit of every employee in every part of ING to enhance the
understanding of how their actions and behaviour can help earn and retain customer and
stakeholder trust. In 2018, integrity led behaviour was addressed by means of the mandatory PIP
e-learning ‘Dealing with Dilemmas’ and ‘Data@Risk’ which were rolled out globally.
Compliance Forum ING
In 2018, we continued training the Compliance Officers within ING worldwide in the Compliance
Forum ING. This forum is about building expertise and sharing experience. The focus is on regulatory
developments, innovation and the future of compliance – what compliance officers can do to Think
Forward. Participants are engaged in lively discussions on current topics, take part in workshops and
plenary sessions to experience and develop the new ways of working within ING. Participants can
connect with colleagues from across the globe and share knowledge and views on the compliance
function of the future. Part of the Compliance community was trained in 2017 and in 2018 the
remainder has been trained.
Speak-up A speak-up awareness campaign was launched for all ING Bank employees to enhance the
awareness to raise any concern related to breaches of the Orange Code, any suspected or actual
criminal conduct, unethical conduct or other misconduct by or within ING. The awareness campaign
was supported by the launch of a revised whistleblower policy and a mandatory global e-learning.
Compliance Risk Culture Monitoring
The Compliance Risk Management function continued to enhance its control framework by
monitoring on drivers for conduct or the ‘soft controls’. By assessing both hard controls and soft
controls, such as leadership, group dynamics and decision making via in-depth interviews with ING
staff, ING further strengthens the mitigation of compliance risks and provides management with
knowledge and tools how to further develop a sound risk and integrity-led culture throughout the
global ING organisation. In addition to Compliance Risk Culture Monitoring, ING is further developing
in the area of hard control monitoring on the Orange Code values.
Dilemma Dialogue
As also stated in our Orange Code, balancing the rights and interests of all involved is key to
ongoing viability of the bank. ING employees are expected to take the time and effort to reflect on
dilemmas or difficult decisions they have to take, and to do so in a sustainable manner. To support
this ING enrolled the Orange Code Dilemma Dialogue model. This is a decision making model that
takes employees through the steps of analysing an issue or dilemma, defining stakeholders, listing
arguments and weighing them to make clear what in the specific case is the right thing to do. The
launch of the Dilemma Dialogue model was supported by a mandatory e-learning for all staff and
additional training to all compliance staff to enable them to facilitate the dialogue on dilemmas in
their own local business unit.
ING Bank Annual Report 2018 254
Contents | Who we are | Report of the Management Board | Corporate governance | Consolidated annual accounts | Parent company annual accounts | Other information
> Capital management > 51
Business Risk
Introduction
Business Risk for ING has been defined as the exposure to value loss due to fluctuations in
volumes/margins as well as expenses. It is the risk inherent to strategy decisions and internal
efficiency. Business risk capital is calculated via the variance-covariance methodology for expense
risk, covering the risk that expenses will deviate from the expected expenses over the horizon of the
relevant activities. This risk primarily relates to the (inflexibility) to adjust expenses, when that is
needed. Expense risk only concerns non-financial expenses (e.g. staff and IT expenses); financial
expenses are not in scope.
Governance and risk management
ING applies an explicit Risk Appetite Statements regarding business risk, focusing on earnings
stability and diversification of the business mix, as avoiding to put all eggs in one basket reduces
the risk that volumes and/or margins will suddenly drop due to unexpected changes in the business
environment for certain markets and products. Furthermore, the underlying risk types (expense risk
and volume-margin risk) are also mitigated and managed in a different way. Expense risk is
monitored and managed via the financial performance of the bank and the local units, whereby
the reported expense numbers are compared on a quarterly basis with the projected cost/income
ratio. Deviations from this ambition are monitored as part of the financial projections that are
discussed continuously within different parts of the organisation.
51 Capital management
Objectives
Group Treasury (“GT”) is the result of a merger between Capital Management and Bank Treasury
which was approved by the ING management board in 2017. The merger is a logical continuation of
the efforts that were done since the creation of Bank Treasury in 2011 to streamline ING’s
operations related to capital, funding, liquidity and balance sheet management.
This empowers GT to manage the balance sheet holistically. GT covers the full spectrum all the way
from day-to-day operational management to the more strategic advisory function, and all the way
from cash management, to liquidity and funding management to solvency and capital
management.
GT Capital Management, part of the Balance Sheet & Capital Management, is responsible for
maintaining the adequate capitalisation of ING Group and ING Bank entities, to manage the risk
associated with ING’s business activities. This involves not only managing, planning and allocating
capital within ING Group, ING Bank and its various entities, but also helping to execute necessary
capital market transactions, term (capital) funding and risk management transactions. ING takes
an integrated approach to assess the adequacy of its capital position in relation to its risk profile
and operating environment. This means Capital Management takes into account both regulatory
and internal metrics and requirements as well as the interests of key stakeholders such as
shareholders and rating agencies.
ING applies the following main capital definitions:
Common Equity Tier 1 capital - Common Equity Tier 1 (CET1) capital is defined as shareholders’
equity less regulatory adjustments. CET1 capital divided by risk-weighted assets equals the CET1
ratio.
Tier 1 capital – Tier 1 capital is defined as CET1 capital including Additional Tier 1 (hybrid)
securities and other regulatory adjustments. Tier 1 capital divided by risk-weighted assets equals
the Tier 1 capital ratio.
ING Bank Annual Report 2018 255
Contents | Who we are | Report of the Management Board | Corporate governance | Consolidated annual accounts | Parent company annual accounts | Other information
> Capital management > 51
Total capital – Total capital is Tier 1 capital including subordinated Tier 2 liabilities and regulatory
adjustments. Total capital divided by risk-weighted assets equals the Total capital ratio.
Common Equity Tier 1 ratio ambition – Common Equity Tier 1 ratio ambition is built on potential
impact of a standardised and pre-determined 1-in-10-year stress event (i.e. at a 90% confidence
level with a 1-year horizon) as described in the Risk Management section.
Leverage ratio – Leverage ratio is defined as Tier 1 capital divided by the total exposure amount.
Bail-inable capital – Total capital, Senior HoldCo and Opco debt qualify as Bail-inable capital.
ING also applies the following risk appetite definitions:
RAF – Risk appetite framework which includes Solvency, Liquidity & funding risk, Credit risk,
Market risk and Non-Financial risk appetite statements
FX ratio hedging – the objective is to protect the Common Equity Tier 1 ratio of ING consolidated
figures against FX fluctuations.
Capital investment hedge.
Developments
The capital position remained robust in 2018 reflecting strong profitability based on core lending
growth, with a lower risk weight and complemented with the optimisation of the capital structure.
ING Bank N.V. has a fully-loaded Common Equity Tier 1 ratio and a phased-in Common Equity Tier 1
ratio of 12.9%, thereby complying with CRR/CRD IV solvency requirements. ING Bank N.V. paid
€2,517 million of dividend to ING Group in 2018. The fully loaded in Tier 1 ratios (including
grandfathered securities) decreased from 14.7% to 14.5%, while the phased-in Tier 1 ratio
(including grandfathered securities) remained stable at 14.6%, primarily reflecting developments in
ING Bank’s Common Equity Tier 1 ratio. The Banks’s fully loaded and phased-in total capital ratio
(including grandfathered securities) decreased from 18.3% to 17.2% and 18.2% to 17.2%,
respectively.
Policies
The activities of Capital Management are executed on the basis of established policies, guidelines
and procedures. For Debt and Capital Issuance there are additional policies and limits that guide
the execution of capital market transactions.
Processes for managing capital
Besides measuring capital adequacy, Capital Management also ensures the availability of sufficient
capital through target and limit setting for the above mentioned metrics for ING Group and ING
Bank. Additionally, Capital Management ensures adherence to the set limits and targets by
planning and executing capital management transactions. The ongoing assessment and
monitoring of capital adequacy is
embedded in the capital planning process. Following the dynamic business planning process, ING
prepares a capital and funding plan on a regular basis for all its material businesses and assesses
continuously the timing, need and feasibility for capital management actions in scope its execution
strategy. Sufficient financial flexibility should be preserved to meet important financial objectives.
ING’s risk appetite statements set targets and are at the foundation of the capital plan. These limits
are cascaded to the different businesses in line with our risk management strategy.
Adverse planning and stress testing are integral components of ING’s risk and capital management
framework. It allows us to (i) identify and assess potential vulnerabilities in our businesses, business
model, portfolios or operating environment; (ii) understand the sensitivities of the core assumptions
used in our strategic and capital plans; and (iii) improve decision-making and business steering
through balancing risk and return following a foresighted and prudent management approach. In
addition to internal stress test scenarios reflecting the outcomes of the annual risk assessment, ING
also participates in regulatory stress test exercises. ING participated in the 2018 EU-wide stress test
conducted by EBA.

ING Bank Annual Report 2018 256
Contents | Who we are | Report of the Management Board | Corporate governance | Consolidated annual accounts | Parent company annual accounts | Other information
> Capital management > 51
Capital adequacy assessment
As at 1 January 2014, the CRR/CRD IV capital rules entered into force. The capital position table
reflects own funds according to the Basel 3 rules as specified in the CRR/CRD IV. As CRD IV will be
phased-in gradually until 2019, the table shows the CRD IV positions according to the 2019 end-
state rules and the 2018 rules. ING reports these metrics for ING Group and ING Bank. During 2018,
ING Group and ING Bank were adequately capitalised.
(fully-loaded) (phased-in)
2018 2017 2018 2017
Shareholders’ equity 44,173 43,662 44,173 43,662
Interim profit not included in CET1 capital1 –174 –44 –174 –44
Other adjustments –3,621 –3,043 –3,568 –3,017
Regulatory adjustments –3,794 –3,087 –3,742 –3,061
Available common equity Tier 1 capital 40,379 40,576 40,431 40,602
Additional Tier 1 securities2 5,179 4,989 5,179 4,989
Regulatory adjustments additional Tier 1 62 53 62 –374
Available Tier 1 capital 45,619 45,618 45,671 45,217
Supplementary capital Tier 2 bonds3 8,248 11,086 8,248 11,086
Regulatory adjustments Tier 2 66 47 69 –44
Available Total capital 53,933 56,751 53,988 56,259
Risk weighted assets 313,572 309,287 313,572 309,287
Common equity Tier 1 ratio 12.88% 13.12% 12.89% 13.13%
Tier 1 ratio 14.55% 14.75% 14.56% 14.62%
Total capital ratio 17.20% 18.35% 17.22% 18.19%
1 The interim profit not included in CET1 capital as per 31 December 2018 (€174 million) includes €44 million for 4Q 2018 (Full
year 2018: €2,646 million).
2 Including €3,271 million which is CRR/CRD IV-compliant (2017: €3,123 million) and €1,907 million to be replaced as capital
recognition is subject to CRR/CRD IV grandfathering rules (2017: €1,866 million).
3 Including €8,079 million which is CRR/CRD IV-compliant (2017: €8,995 million), and € 168 million to be replaced as capital
recognition is subject to CRR/CRD IV grandfathering rules (2017: €2,091 million).
Regulatory requirements
Capital adequacy and the use of required regulatory capital are based on the guidelines developed
by the Basel Committee on Banking Supervision (The Basel Committee) and the European Union
Directives, as implemented by the Dutch Central Bank (Dutch Central Bank until 3 November 2014,
the ECB thereafter) for supervisory purposes. In 2010, the Basel Committee issued new solvency
and liquidity requirements that superseded Basel II. The minimum requirements, excluding buffers,
for the CET 1 ratio is 4.5%, the minimum Tier 1 requirement is 6% and the Total capital ratio is 8%
of all risk-weighted assets.
ICAAP/SREP process
Annually, ING provides in-depth documentation on its Internal Capital Adequacy Assessment
Process (ICAAP) in the scope of ECB’s Supervisory Review and Evaluation Process (SREP). This
submission includes all ICAAP related documentation such as information on ING’s internal capital
models, risk measurement, assessment and aggregation, risk appetite framework, capital planning
both under base case and adverse scenarios including stress testing. Based on this documentation
and continuous supervisory dialogue, the ECB conducts the SREP assessment of ING and its main
subsidiaries. This assessment covered four areas: business model, internal governance and risk
management, risks to capital and risks to liquidity and funding on a yearly basis.
Ratings
Standard & Poor’s Moody’s Fitch
Rating Outlook Rating Outlook Rating Outlook
ING Bank N.V.
Long-term A+ Stable Aa3 Stable A+ Positive
Short-term A-1 P-1 F1
ING’s key credit ratings and outlook are shown in the table above. Each of these ratings reflects
only the view of the applicable rating agency at the time the rating was issued, and any
explanation of the significance of a rating may be obtained only from the rating agency.
ING Bank NV capital position according to CRR/CRD IV
Main credit ratings of ING at 31 December 2018

ING Bank Annual Report 2018 257
Contents | Who we are | Report of the Management Board | Corporate governance | Consolidated annual accounts | Parent company annual accounts | Other information
> Capital management > 51
A security rating is not a recommendation to buy, sell or hold securities and each rating should be
evaluated independently of other ratings. There is no assurance that any credit rating will remain in
effect for any given period of time or that a rating will not be lowered, suspended or withdrawn
entirely by the rating agency if, in the rating agency’s judgment, circumstances so warrant. ING
accepts no responsibility for the accuracy or reliability of the ratings.

ING Bank Annual Report 2018 258
Contents | Who we are | Report of the Management Board | Corporate governance | Consolidated annual accounts | Parent company annual accounts | Other information
> Authorisation of Consolidated Annual Accounts
The Supervisory Board
G.J. (Hans) Wijers, chairman
H.J.M. (Hermann-Josef) Lamberti, vice-chairman
J.P. (Jan Peter) Balkenende
E.F.C.B. (Eric) Boyer de la Giroday
H.W. (Henk) Breukink
M. (Mariana) Gheorghe
M. (Margarete) Haase
R.W.P. (Robert) Reibestein
The Management Board Banking
R.A.J.G. (Ralph) Hamers, CEO and chairman of the Management
Board Banking
T. (Tanate) Phutrakul, CFO
S.J.A. (Steven) van Rijswijk, CRO
M. I. (Isabel) Fernandez Niemann, head of Wholesale Banking
R.M.M. (Roel)Louwhoff, COO/CTO
A. (Aris) Bogdaneris, head of Challengers & Growth Markets
R.B. (Roland) Boekhout, head of Market Leaders
Authorisation of Consolidated Annual Accounts Amsterdam, 4 March 2019

ING Bank Annual Report 2018 259
Contents | Who we are | Report of the Management Board | Corporate governance | Consolidated annual accounts | Parent company annual accounts | Other information
in EUR million 2018 2017 in EUR million 2018 2017
Assets Liabilities
Cash and balances with central banks 1 30,508 7,390 Deposits from banks 12 60,300 59,133
Short-dated government paper 2 517 712 Customer deposits 13 315,012 306,512
Loans and advances to banks 3 72,553 87,827 Debt securities in issue 14 91,552 84,080
Loans and advances to customers 4 344,672 336,567 Other liabilities 15 41,361 48,248
Debt securities 5 37,844 36,404 General provisions 16 797 1,247
Equity securities 6 7,103 12,103 Subordinated loans 13,957 16,370
Investments in group companies 7 32,815 32,325 Total liabilities 522,979 515,590
Investments in associates and joint ventures 8 932 808
Intangible assets 9 1,097 855 Equity 17
Equipment 10 431 412 Share capital 525 525
Other assets 11 38,680 43,849 Share premium 16,542 16,542
Revaluation reserves 2,187 2,898
Legal and statutory reserves 1,317 1,415
Other reserves 19,155 17,416
Unappropriated result 4,447 4,866
Total equity 44,173 43,662
Total assets 567,152 559,252 Total liabilities and equity 567,152 559,252
References relate to the accompanying notes. These form an integral part of the Parent company annual accounts.
Parent company statement of financial position as at 31 December before appropriation of result

ING Bank Annual Report 2018 260
Contents | Who we are | Report of the Management Board | Corporate governance | Consolidated annual accounts | Parent company annual accounts | Other information
in EUR million 2018 2017
Interest income 14,577 28,957
Interest expense –8,214 –22,599
Net interest income 18 6,363 6,358
Investment income and results from participating interests 19 3,123 2,958
Commission income 1,948 1,791
Commission expense –532 –463
Net commission income 20 1,416 1,328
Results from financial transactions 21 655 314
Other income 22 –53 120
Total income 11,505 11,078
Staff expenses 23 3,030 2,837
Depreciation and amortisation 24 244 223
Other expenses 25 2,656 1,980
Addition to loan loss provisions 137 194
Total expenses 6,066 5,234
Result before tax 5,439 5,844
Taxation 26 832 825
Result after tax 4,607 5,019
References relate to the accompanying notes. These form an integral part of the Parent company annual accounts.
Parent company statement of profit or loss for the years ended 31 December
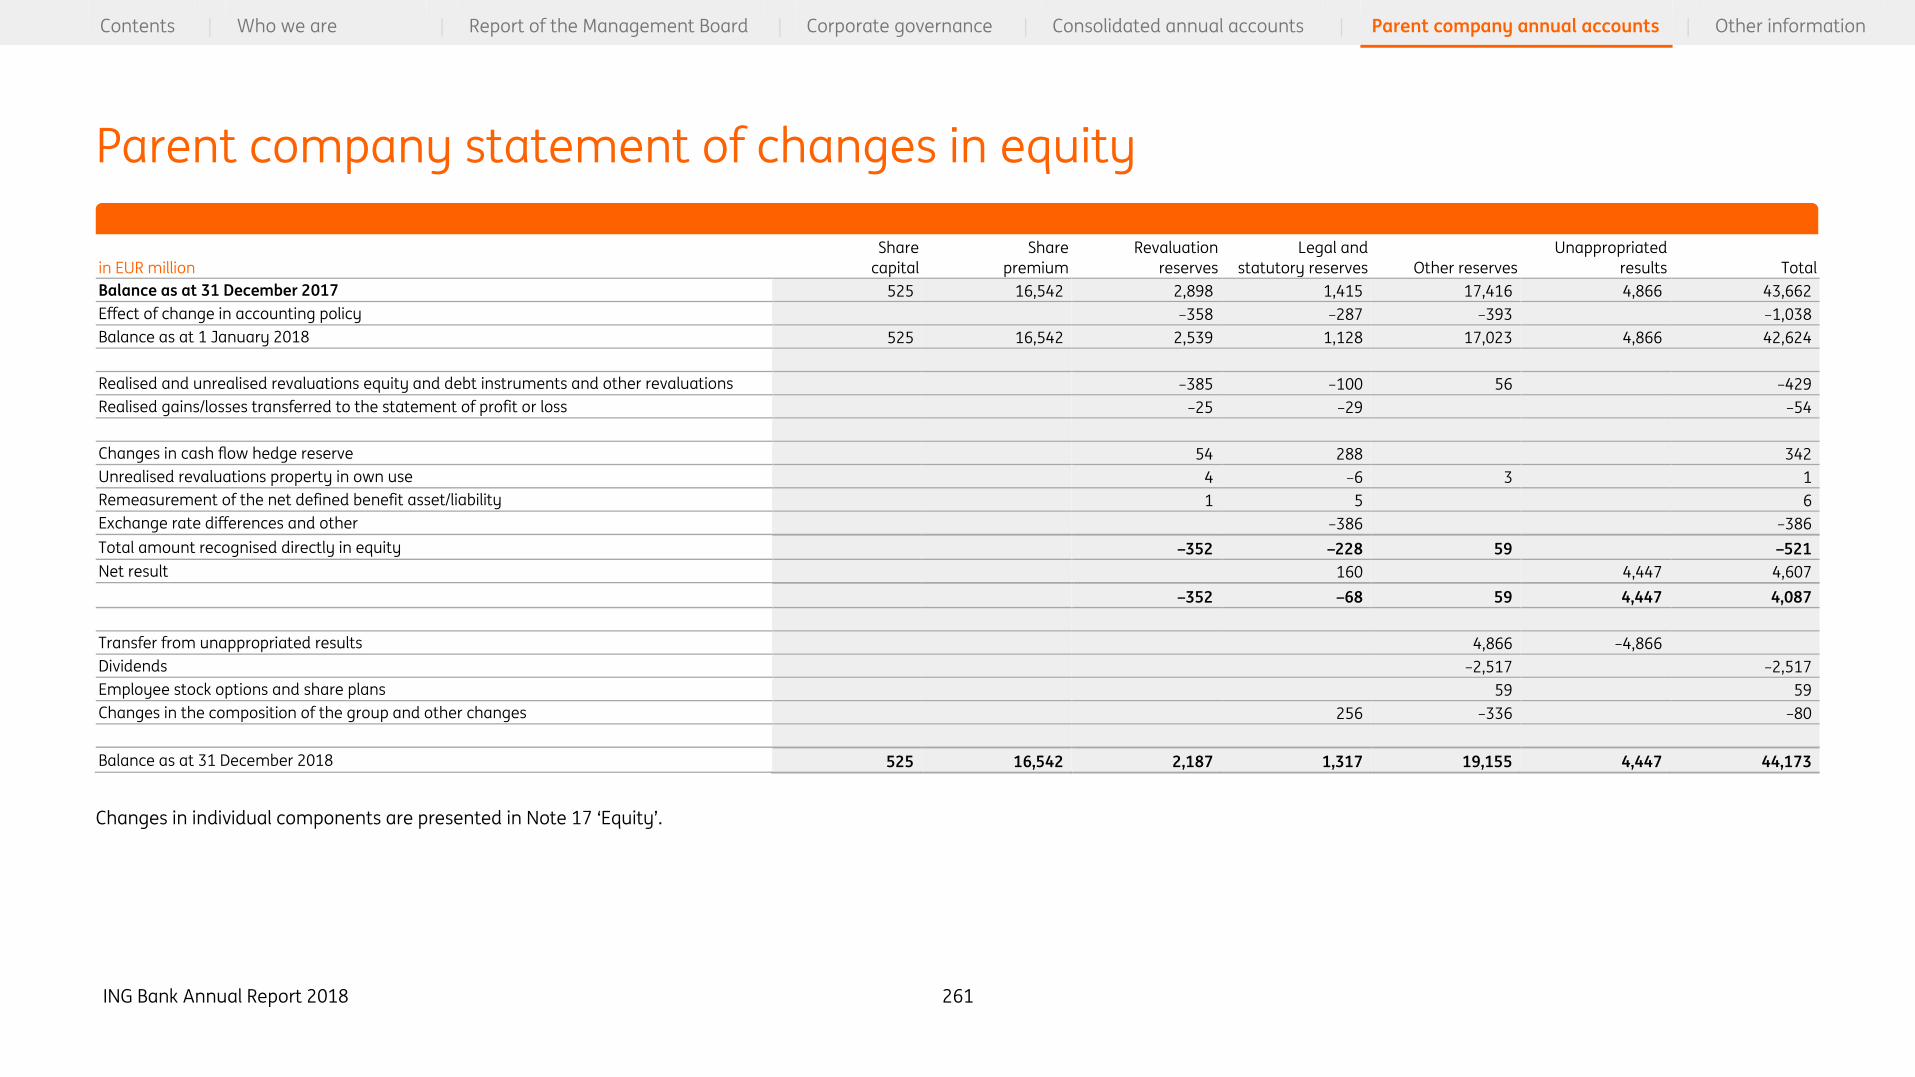
ING Bank Annual Report 2018 261
Contents | Who we are | Report of the Management Board | Corporate governance | Consolidated annual accounts | Parent company annual accounts | Other information
in EUR million
Share
capital
Share
premium
Revaluation
reserves
Legal and
statutory reserves Other reserves
Unappropriated
results Total
Balance as at 31 December 2017 525 16,542 2,898 1,415 17,416 4,866 43,662
Effect of change in accounting policy –358 –287 –393 –1,038
Balance as at 1 January 2018 525 16,542 2,539 1,128 17,023 4,866 42,624
Realised and unrealised revaluations equity and debt instruments and other revaluations –385 –100 56 –429
Realised gains/losses transferred to the statement of profit or loss –25 –29 –54
Changes in cash flow hedge reserve 54 288 342
Unrealised revaluations property in own use 4 –6 3 1
Remeasurement of the net defined benefit asset/liability 1 5 6
Exchange rate differences and other –386 –386
Total amount recognised directly in equity –352 –228 59 –521
Net result 160 4,447 4,607
–352 –68 59 4,447 4,087
Transfer from unappropriated results 4,866 –4,866
Dividends –2,517 –2,517
Employee stock options and share plans 59 59
Changes in the composition of the group and other changes 256 –336 –80
Balance as at 31 December 2018 525 16,542 2,187 1,317 19,155 4,447 44,173
Changes in individual components are presented in Note 17 ‘Equity’.
Parent company statement of changes in equity
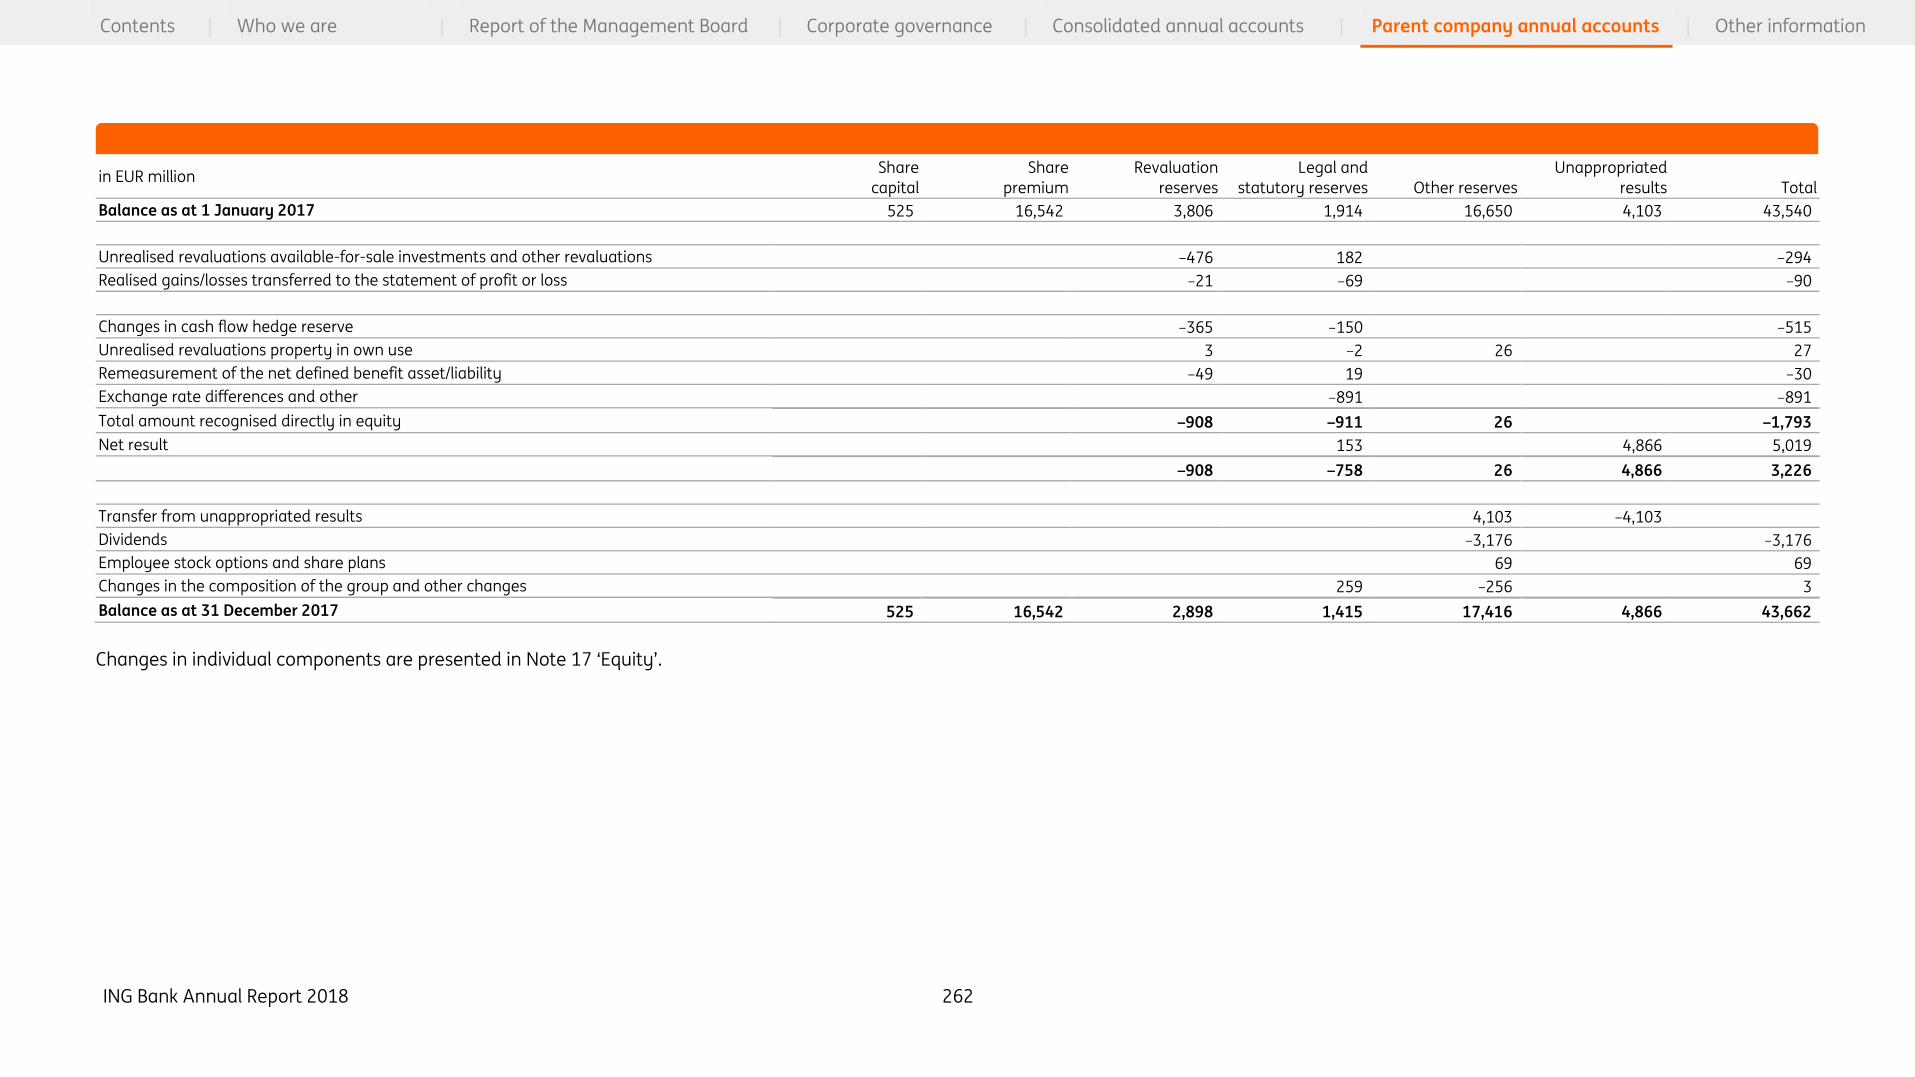
ING Bank Annual Report 2018 262
Contents | Who we are | Report of the Management Board | Corporate governance | Consolidated annual accounts | Parent company annual accounts | Other information
in EUR million Share
capital
Share
premium
Revaluation
reserves
Legal and
statutory reserves Other reserves
Unappropriated
results Total
Balance as at 1 January 2017 525 16,542 3,806 1,914 16,650 4,103 43,540
Unrealised revaluations available-for-sale investments and other revaluations –476 182 –294
Realised gains/losses transferred to the statement of profit or loss –21 –69 –90
Changes in cash flow hedge reserve –365 –150 –515
Unrealised revaluations property in own use 3 –2 26 27
Remeasurement of the net defined benefit asset/liability –49 19 –30
Exchange rate differences and other –891 –891
Total amount recognised directly in equity –908 –911 26 –1,793
Net result 153 4,866 5,019
–908 –758 26 4,866 3,226
Transfer from unappropriated results 4,103 –4,103
Dividends –3,176 –3,176
Employee stock options and share plans 69 69
Changes in the composition of the group and other changes 259 –256 3
Balance as at 31 December 2017 525 16,542 2,898 1,415 17,416 4,866 43,662
Changes in individual components are presented in Note 17 ‘Equity’.
ING Bank Annual Report 2018 263
Contents | Who we are | Report of the Management Board | Corporate governance | Consolidated annual accounts | Parent company annual accounts | Other information
Basis of presentation
ING Bank N.V. is a company domiciled in Amsterdam, the Netherlands and is registered at the
Commercial Register of Amsterdam under number 33031431.
The Parent company annual accounts of ING Bank N.V. are prepared in accordance with the
financial reporting requirements included in Part 9 of Book 2, of the Dutch Civil Code. In accordance
with subsection 8 of section 362, Book 2 of the Dutch Civil Code, the recognition and measurement
principles applied in these Parent company annual accounts are the same as those applied in the
ING Bank Consolidated annual accounts, reference is made to Note 1 ‘Accounting policies’ of the
Consolidated annual accounts.
Investments in group companies are accounted in the Parent company accounts according to the
equity method.
A list containing the information referred to in Section 379 (1), Book 2, of the Dutch Civil Code has
been filed with the office of the Commercial Register of Amsterdam, in accordance with Section 379
(5), Book 2 of the Dutch Civil Code.
Parent company equity and related reserves
The total amount of equity in the Parent company annual accounts equals Shareholders’
equity (parent) in the Consolidated annual accounts. Certain components within equity
are different, as a result of the following presentation differences between the parent
company accounts and consolidated accounts:
• Unrealised revaluations including those related to cash flow hedges within consolidated group
companies, presented in Other reserves - Revaluation reserve in the consolidated accounts, are
presented in the Share of associates and joint ventures reserve in the parent company accounts;
• Foreign currency translation on consolidated group companies, presented in Other reserves -
Currency translation reserve in the consolidated accounts, is presented in the Share of associates
and joint ventures reserve in the parent company accounts;
• Revaluations on investment property and certain participations recognised in income and
consequently presented in Retained earnings in the consolidated accounts, is presented in the
Share of associates and joint ventures reserve in the parent company accounts.
A legal reserve is carried at an amount equal to the share in the results of associates and joint
ventures since their first inclusion at net asset value less the amount of profit distributions to which
rights have accrued in the interim. Profit distributions which can be repatriated to the Netherlands
without restriction are likewise deducted from the Share of associates and joint ventures reserve.
Notes to the parent company annual accounts amounts in millions of euros, unless stated otherwise
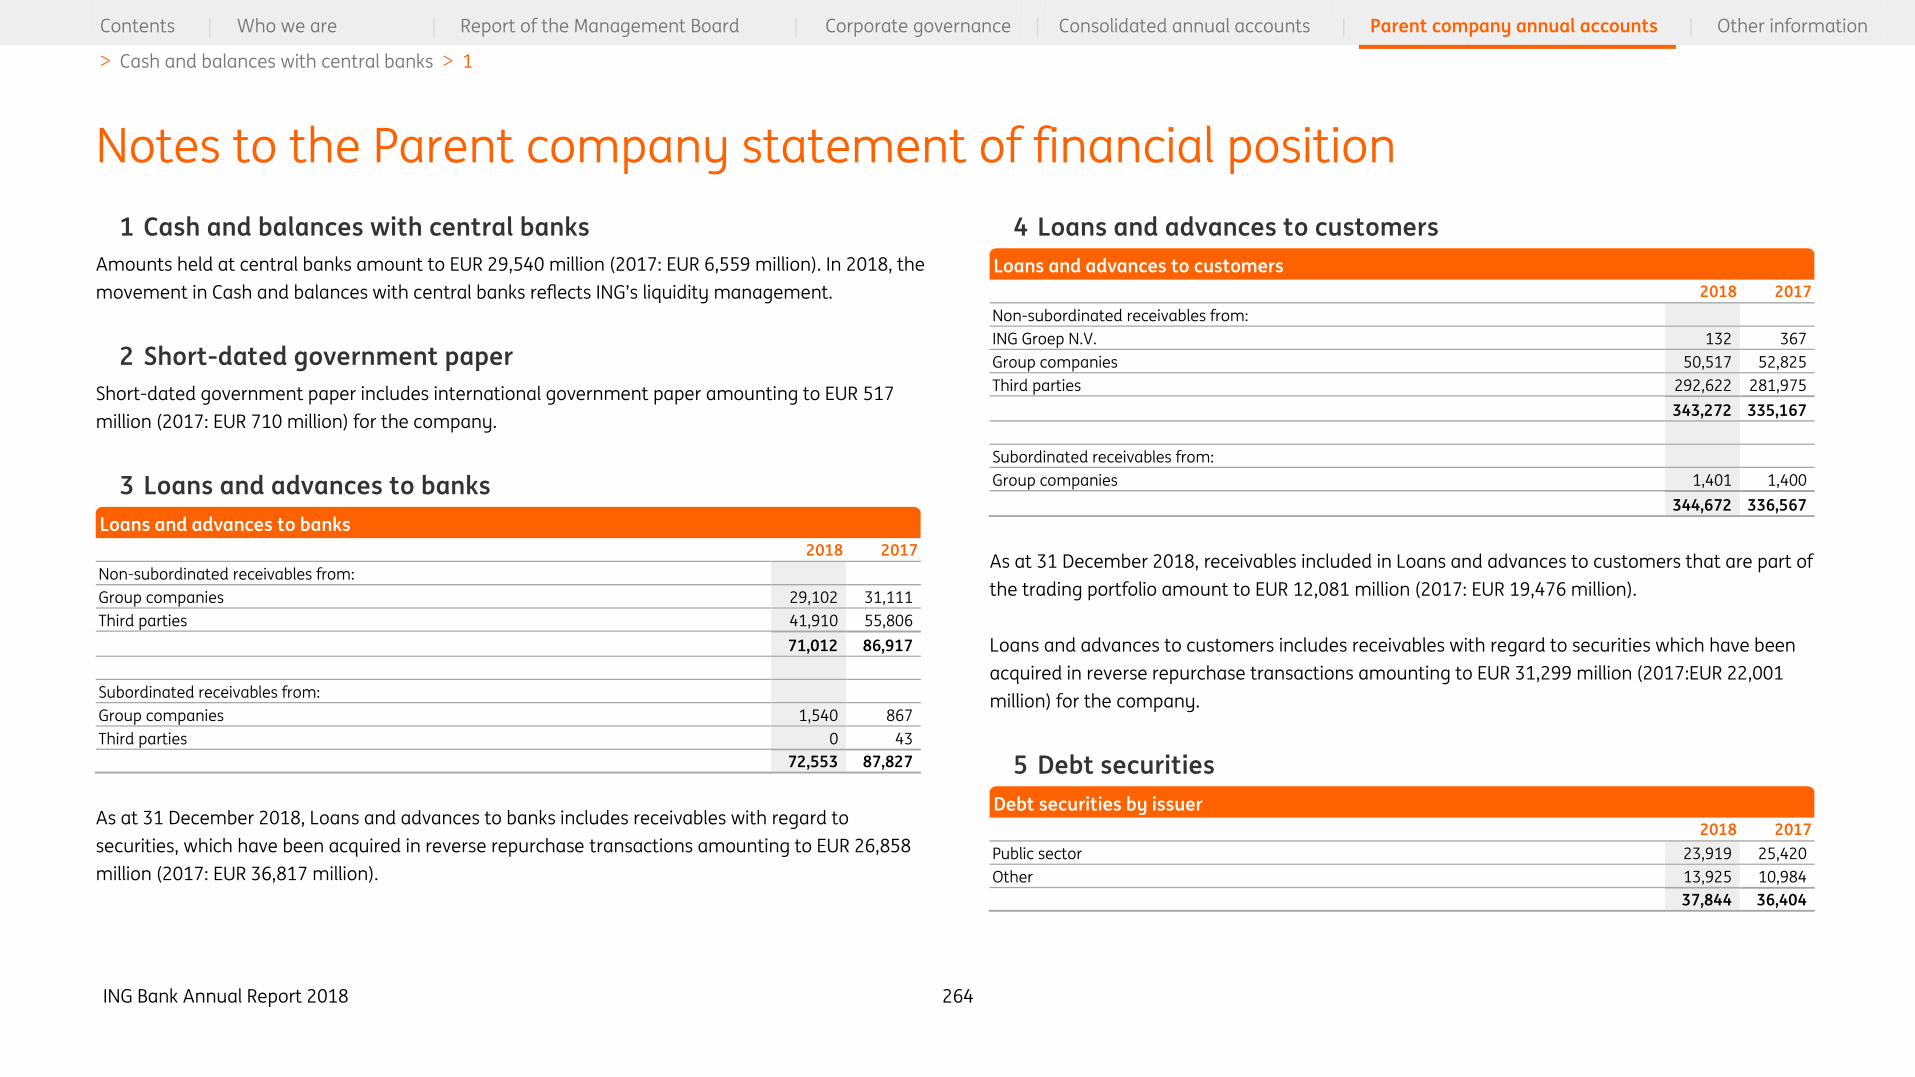
ING Bank Annual Report 2018 264
Contents | Who we are | Report of the Management Board | Corporate governance | Consolidated annual accounts | Parent company annual accounts | Other information
> Cash and balances with central banks > 1
1 Cash and balances with central banks
Amounts held at central banks amount to EUR 29,540 million (2017: EUR 6,559 million). In 2018, the
movement in Cash and balances with central banks reflects ING’s liquidity management.
2 Short-dated government paper
Short-dated government paper includes international government paper amounting to EUR 517
million (2017: EUR 710 million) for the company.
3 Loans and advances to banks
2018 2017
Non-subordinated receivables from:
Group companies 29,102 31,111
Third parties 41,910 55,806
71,012 86,917
Subordinated receivables from:
Group companies 1,540 867
Third parties 0 43
72,553 87,827
As at 31 December 2018, Loans and advances to banks includes receivables with regard to
securities, which have been acquired in reverse repurchase transactions amounting to EUR 26,858
million (2017: EUR 36,817 million).
4 Loans and advances to customers
2018 2017
Non-subordinated receivables from:
ING Groep N.V. 132 367
Group companies 50,517 52,825
Third parties 292,622 281,975
343,272 335,167
Subordinated receivables from:
Group companies 1,401 1,400
344,672 336,567
As at 31 December 2018, receivables included in Loans and advances to customers that are part of
the trading portfolio amount to EUR 12,081 million (2017: EUR 19,476 million).
Loans and advances to customers includes receivables with regard to securities which have been
acquired in reverse repurchase transactions amounting to EUR 31,299 million (2017:EUR 22,001
million) for the company.
5 Debt securities
2018 2017
Public sector 23,919 25,420
Other 13,925 10,984
37,844 36,404
Notes to the Parent company statement of financial position
Loans and advances to banks
Loans and advances to customers
Debt securities by issuer

ING Bank Annual Report 2018 265
Contents | Who we are | Report of the Management Board | Corporate governance | Consolidated annual accounts | Parent company annual accounts | Other information
> Equity securities > 6
2018 2017
Listed 35,462 33,961
Unlisted 2,382 2,443
37,844 36,404
2018 2017
Non-subordinated debt securities issued by:
Third parties 37,197 36,404
37,197 36,404
2018 2017
Opening balance 22,336 27,624
Effect of change in accounting policy 8,077
Balance as at 1 January 2018 30,413
Additions 16,606 8,396
Amortisation –102 –93
Changes in unrealised revaluations –259 –255
Disposals and redemptions –16,677 –12,896
Exchange rate differences 302 –445
Other changes –45 5
Closing balance 30,240 22,336
6 Equity securities
2018 2017
Listed 6,895 11,890
Unlisted 208 213
7,103 12,103
2018 2017
Opening balance 2,759 2,970
Effect of change in accounting policy –2
Balance as at 1 January 2018 2,757
Additions 26 254
Changes in unrealised revaluations –572 –310
Provision for impairments –1
Disposals 1 –9
Exchange rate differences –16 –171
Other changes 2 26
Closing balance 2,199 2,759
The cost or purchase price of the shares in the trading portfolio approximates their fair value. As at
31 December 2018 the cost or purchase price of shares excluding trading portfolio is EUR 1,914
million lower (2017: EUR 2,134million lower) than the carrying amount.
Debt securities analysed by listing
Debt securities – subordinated and non subordinated
Changes in debt securities (amortised cost and FVOCI)
Equity securities analysed by listing
Changes in equity securities (excluding trading)

ING Bank Annual Report 2018 266
Contents | Who we are | Report of the Management Board | Corporate governance | Consolidated annual accounts | Parent company annual accounts | Other information
> Investments in group companies > 7
7 Investments in group companies
2018 2017
Interest
held (%)
Statement of financial
position value
Interest
held (%)
Statement of financial
position value
ING België N.V. 100 10,256 100 10,211
ING Holding Deutschland GMBH 100 8,200 100 8,086
ING Bank (Australia) Limited 100 2,757 100 2,675
ING Financial Holdings Corporation 100 2,484 100 2,101
ING Bank Slaski S.A. 75 2,316 75 2,084
ING Bank A.S. 100 1,305 100 1,476
ING Mauritius Investments I Limited 100 920 100 939
ING Real Estate B.V. 100 443 100 454
ING Australia Holdings Limited 100 726 100 1,014
ING Corporate Investments B.V. 100 588 100 546
Other (including financing companies) 2,819 2,739
32,815 32,325
As at 31 December 2018, Investments in group companies includes credit institutions of EUR 17,809
million (2017: EUR 17,637 million).
As at 31 December 2018 listed investments in group companies amount to EUR 2,316 million
(2017: EUR 2,084 million).
2018 2017
Opening balance 32,325 32,946
Effect of change in accounting policy –511
Repayment of capital injection –178 –707
Revaluations 198 19
Results from group companies 3,025 2,825
Dividends received –1,647 –1,986
Capital contribution 73 26
Exchange rate differences –546 –788
Other changes 76 –10
Closing balance 32,815 32,325
8 Investments in associates and joint ventures
2018 2017
Interest
held (%)
Statement of financial
position value
Interest
held (%)
Statement of financial
position value
TMB Public Company Limited 25 832 25 737
Other 100 71
932 808
Investments in group companies
Changes in investments in group companies
Investments in associates and joint ventures
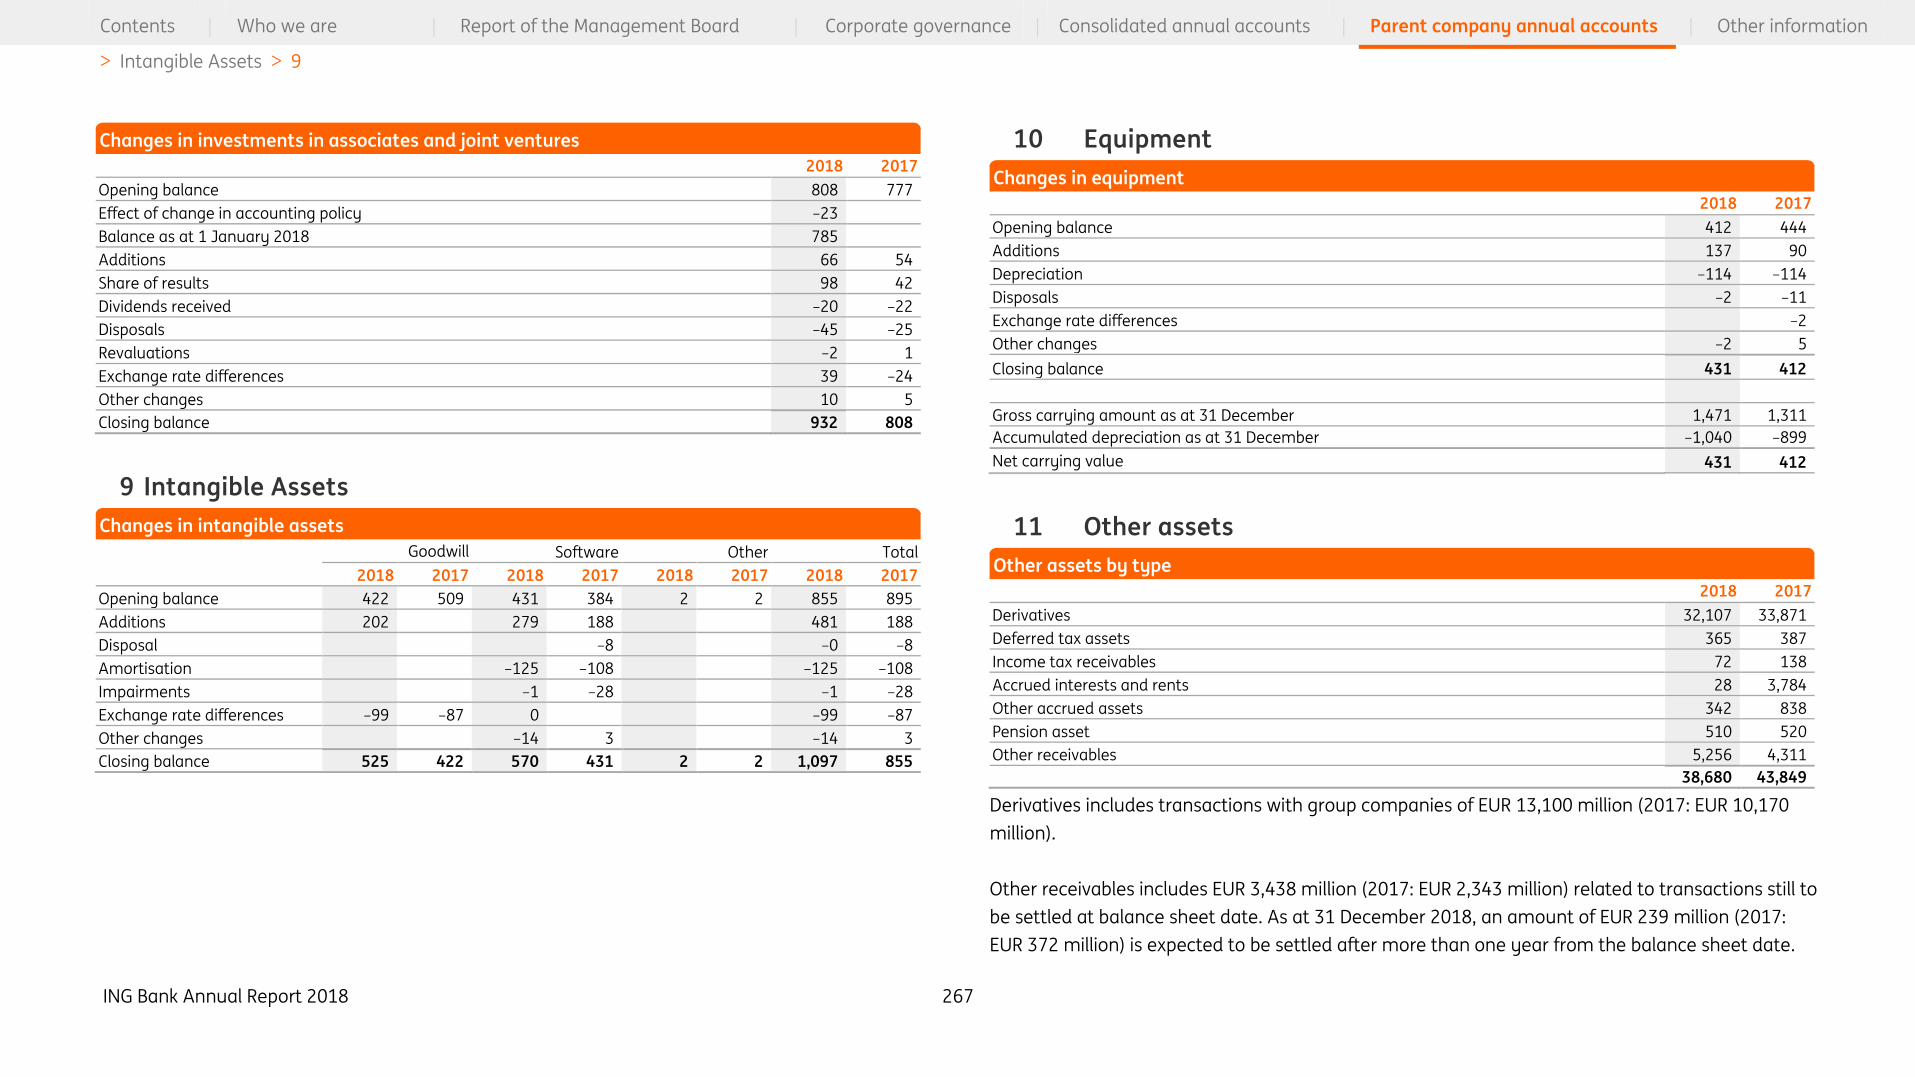
ING Bank Annual Report 2018 267
Contents | Who we are | Report of the Management Board | Corporate governance | Consolidated annual accounts | Parent company annual accounts | Other information
> Intangible Assets > 9
2018 2017
Opening balance 808 777
Effect of change in accounting policy –23
Balance as at 1 January 2018 785
Additions 66 54
Share of results 98 42
Dividends received –20 –22
Disposals –45 –25
Revaluations –2 1
Exchange rate differences 39 –24
Other changes 10 5
Closing balance 932 808
9 Intangible Assets
Goodwill Software Other Total
2018 2017 2018 2017 2018 2017 2018 2017
Opening balance 422 509 431 384 2 2 855 895
Additions 202 279 188 481 188
Disposal –8 –0 –8
Amortisation –125 –108 –125 –108
Impairments –1 –28 –1 –28
Exchange rate differences –99 –87 0 –99 –87
Other changes –14 3 –14 3
Closing balance 525 422 570 431 2 2 1,097 855
10 Equipment
2018 2017
Opening balance 412 444
Additions 137 90
Depreciation –114 –114
Disposals –2 –11
Exchange rate differences –2
Other changes –2 5
Closing balance 431 412
Gross carrying amount as at 31 December 1,471 1,311
Accumulated depreciation as at 31 December –1,040 –899
Net carrying value 431 412
11 Other assets
2018 2017
Derivatives 32,107 33,871
Deferred tax assets 365 387
Income tax receivables 72 138
Accrued interests and rents 28 3,784
Other accrued assets 342 838
Pension asset 510 520
Other receivables 5,256 4,311
38,680 43,849
Derivatives includes transactions with group companies of EUR 13,100 million (2017: EUR 10,170
million).
Other receivables includes EUR 3,438 million (2017: EUR 2,343 million) related to transactions still to
be settled at balance sheet date. As at 31 December 2018, an amount of EUR 239 million (2017:
EUR 372 million) is expected to be settled after more than one year from the balance sheet date.
Changes in investments in associates and joint ventures
Changes in intangible assets
Changes in equipment
Other assets by type
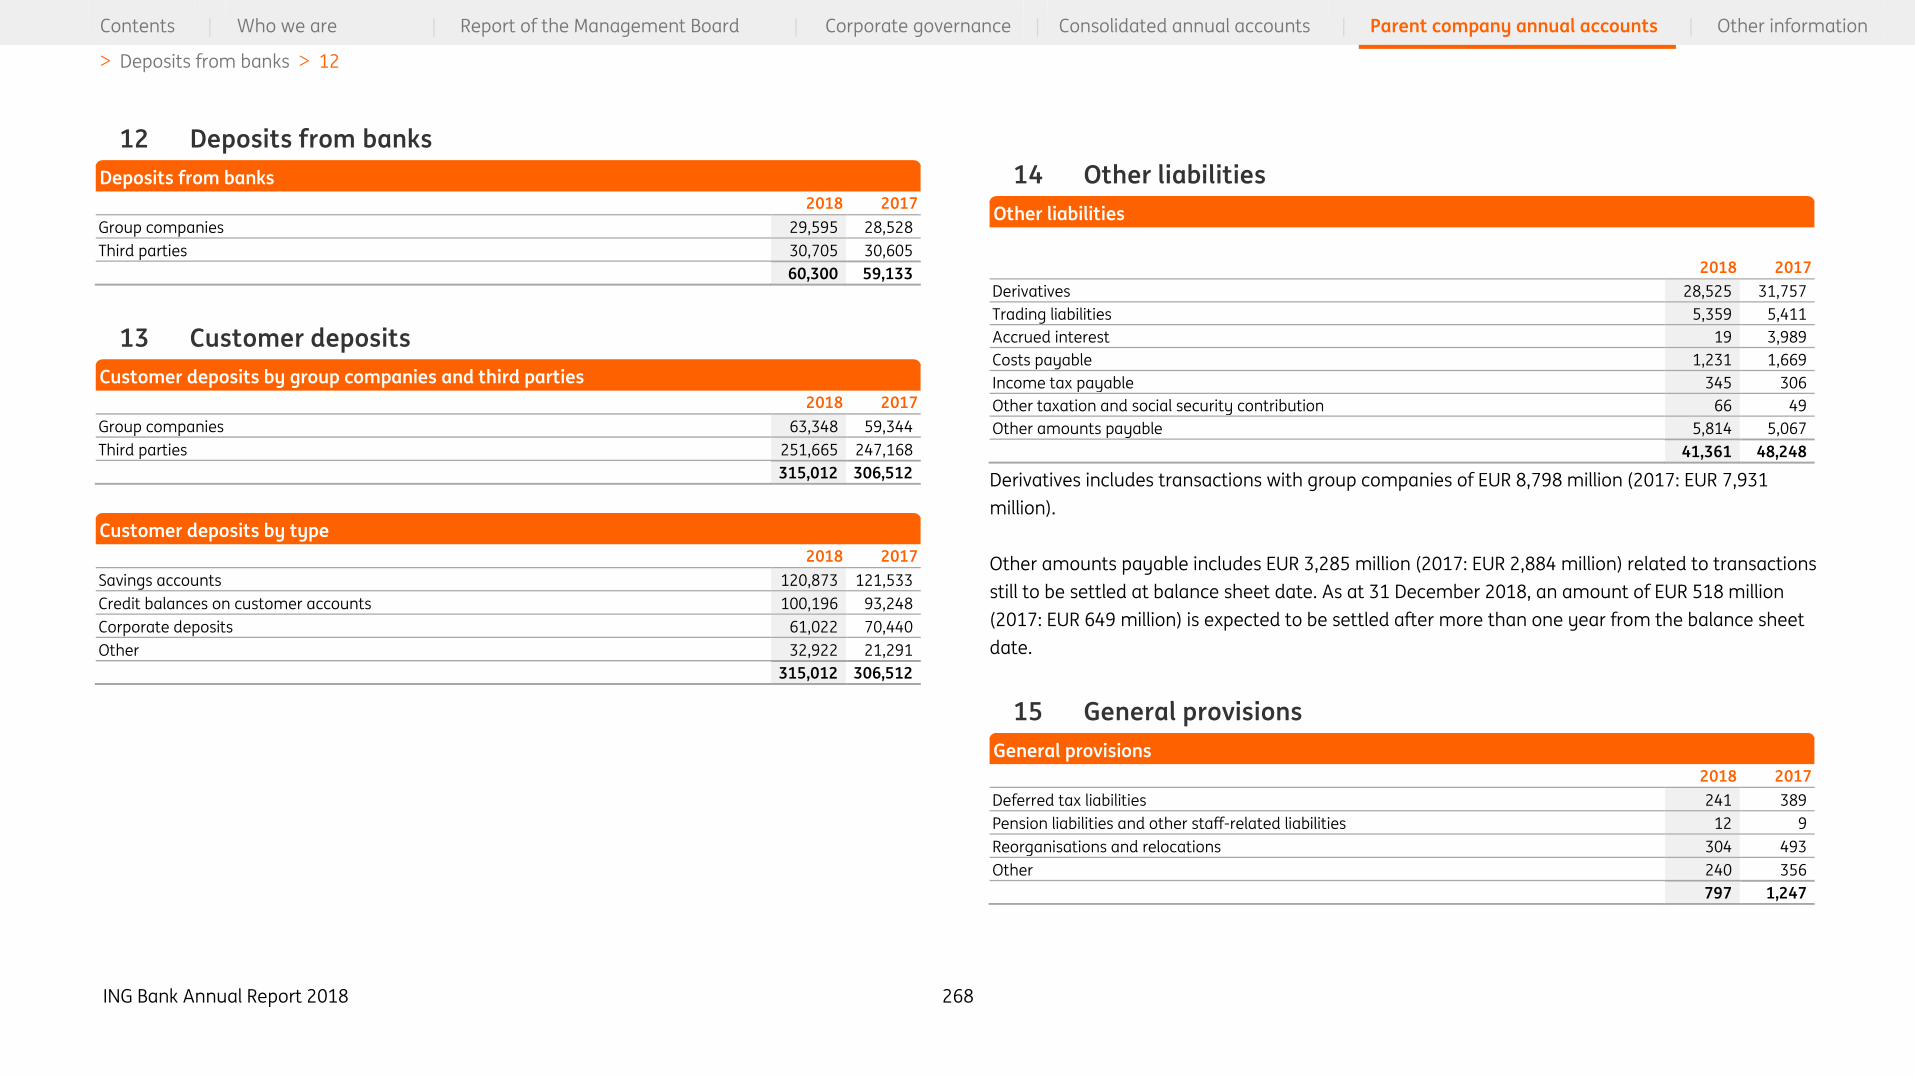
ING Bank Annual Report 2018 268
Contents | Who we are | Report of the Management Board | Corporate governance | Consolidated annual accounts | Parent company annual accounts | Other information
> Deposits from banks > 12
12 Deposits from banks
2018 2017
Group companies 29,595 28,528
Third parties 30,705 30,605
60,300 59,133
13 Customer deposits
2018 2017
Group companies 63,348 59,344
Third parties 251,665 247,168
315,012 306,512
2018 2017
Savings accounts 120,873 121,533
Credit balances on customer accounts 100,196 93,248
Corporate deposits 61,022 70,440
Other 32,922 21,291
315,012 306,512
14 Other liabilities
2018 2017
Derivatives 28,525 31,757
Trading liabilities 5,359 5,411
Accrued interest 19 3,989
Costs payable 1,231 1,669
Income tax payable 345 306
Other taxation and social security contribution 66 49
Other amounts payable 5,814 5,067
41,361 48,248
Derivatives includes transactions with group companies of EUR 8,798 million (2017: EUR 7,931
million).
Other amounts payable includes EUR 3,285 million (2017: EUR 2,884 million) related to transactions
still to be settled at balance sheet date. As at 31 December 2018, an amount of EUR 518 million
(2017: EUR 649 million) is expected to be settled after more than one year from the balance sheet
date.
15 General provisions
2018 2017
Deferred tax liabilities 241 389
Pension liabilities and other staff-related liabilities 12 9
Reorganisations and relocations 304 493
Other 240 356
797 1,247
Deposits from banks
Customer deposits by group companies and third parties
Customer deposits by type
Other liabilities
General provisions

ING Bank Annual Report 2018 269
Contents | Who we are | Report of the Management Board | Corporate governance | Consolidated annual accounts | Parent company annual accounts | Other information
> Subordinated loans > 16
As at 31 December 2018, an amount of EUR 385 million (2017: EUR 297 million) is expected to be
settled after more than one year from the balance sheet date.
16 Subordinated loans
2018 2017
Group companies 10,358 8,177
Third parties 3,598 8,193
13,957 16,370
2018 2017
Capital debentures 4,734 9,228
Private loans 9,222 7,142
13,957 16,370
The subordinated loans rank subordinated to the other liabilities in a winding-up of ING Bank.
17 Equity
2018 2017
Share capital 525 525
Share premium 16,542 16,542
Revaluation reserves 2,187 2,898
Legal and statutory reserves 1,317 1,415
Other reserves 19,155 17,416
Unappropriated result 4,447 4,866
Total equity 44,173 43,662
Ordinary shares (par value EUR 1.13)
Number x 1,000 Amount
2018 2017 2018 2017
Authorised share capital 1,600,000 1,600,000 1,808 1,808
Unissued share capital 1,134,965 1,134,965 1,283 1,283
Issued share capital 465,035 465,035 525 525
No changes occurred in the issued share capital and share premium in 2018 and 2017.
Subordinated loans by group companies and third parties
Subordinated loans by type
Equity
Share capital
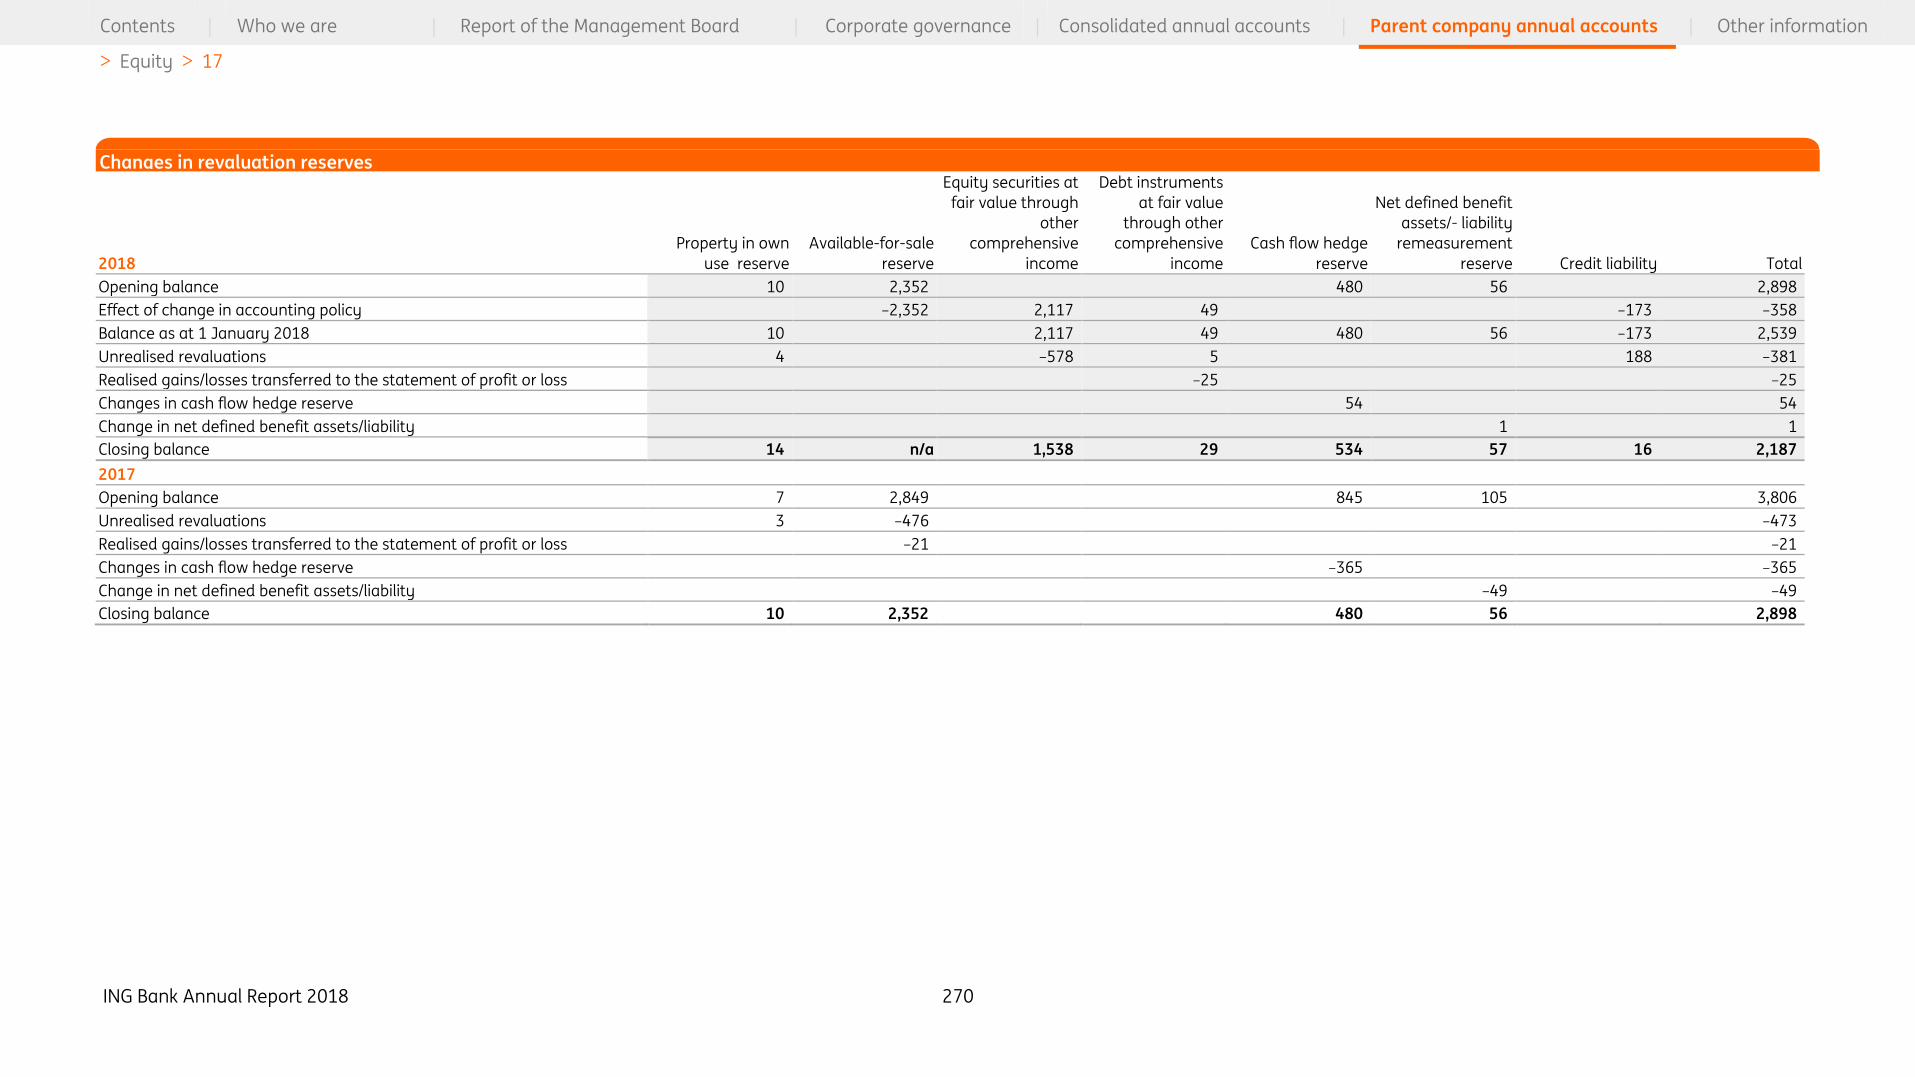
ING Bank Annual Report 2018 270
Contents | Who we are | Report of the Management Board | Corporate governance | Consolidated annual accounts | Parent company annual accounts | Other information
> Equity > 17
2018
Property in own
use reserve
Available-for-sale
reserve
Equity securities at
fair value through
other
comprehensive
income
Debt instruments
at fair value
through other
comprehensive
income
Cash flow hedge
reserve
Net defined benefit
assets/- liability
remeasurement
reserve Credit liability Total
Opening balance 10 2,352 480 56 2,898
Effect of change in accounting policy –2,352 2,117 49 –173 –358
Balance as at 1 January 2018 10 2,117 49 480 56 –173 2,539
Unrealised revaluations 4 –578 5 188 –381
Realised gains/losses transferred to the statement of profit or loss –25 –25
Changes in cash flow hedge reserve 54 54
Change in net defined benefit assets/liability 1 1
Closing balance 14 n/a 1,538 29 534 57 16 2,187
2017
Opening balance 7 2,849 845 105 3,806
Unrealised revaluations 3 –476 –473
Realised gains/losses transferred to the statement of profit or loss –21 –21
Changes in cash flow hedge reserve –365 –365
Change in net defined benefit assets/liability –49 –49
Closing balance 10 2,352 480 56 2,898
Changes in revaluation reserves

ING Bank Annual Report 2018 271
Contents | Who we are | Report of the Management Board | Corporate governance | Consolidated annual accounts | Parent company annual accounts | Other information
> Equity > 17
2018
Share of associates and joint
ventures reserves Currency translation reserve Statutory reserves Capitalised software Total
Opening balance 1,238 –1,645 1,478 344 1,415
Effect of change in accounting policy –287 –287
Balance as at 1 January 2018 952 –1,645 1,478 344 1,128
Result for the year 160 160
Unrealised revaluations available-for-sale investments and other –129 –129
Realised gains/losses transferred to the statement of profit or loss
Changes in cash flow hedge reserve 288 288
Unrealised revaluation property in own use –3 –3
Changes in net defined benefit asset/liability remeasurement reserve 5 5
Exchange rate differences and other 19 –405 –386
Changes in composition of the group and other changes 121 132 253
Closing balance 1,252 –2,050 1,638 476 1,317
2017
Opening balance 1,098 –795 1,325 286 1,914
Result for the year 153 153
Unrealised revaluations available-for-sale investments and other 182 182
Realised gains/losses transferred to the statement of profit or loss –69 –69
Changes in cash flow hedge reserve –150 –150
Unrealised revaluation property in own use –2 –2
Changes in net defined benefit asset/liability remeasurement reserve 19 19
Exchange rate differences and other –41 –850 –891
Changes in composition of the group and other changes 201 – 58 259
Closing balance 1,238 –1,645 1,478 344 1,415
The Share of associates and joint ventures reserve includes the following components: Reserve for
non-distributable retained earnings of associates of EUR 758 million (2017: EUR 652 million),
Revaluation reserve of associates and joint ventures EUR 963 million (2017: EUR 1,079 million),
Currency translation reserve of EUR –18 million (2017: EUR -37 million) and Net defined benefit
asset/liability remeasurement reserve of EUR –451 million (2017: EUR –456 million).
The Statutory reserves include non-distributable reserves of EUR 1,638 million (2017: EUR 1,478
million) related to the former Stichting Regio Bank and the former Stichting Vakbondspaarbank SPN
that cannot be freely distributed in accordance with the article 23.1 of the articles of association.
Changes in the value of hedging instruments that are designated as net investment hedges, are
included in the line Exchange rate differences and other.
Changes in legal and statutory reserves

ING Bank Annual Report 2018 272
Contents | Who we are | Report of the Management Board | Corporate governance | Consolidated annual accounts | Parent company annual accounts | Other information
> Equity > 17
2018
Retained
earnings Total
Opening balance 17,416 17,416
Effect of change in accounting policy –393 –393
Balance as at 1 January 2018 17,023 17,023
Transfer from unappropriated result 4,866 4,866
Dividends –2,517 –2,517
Employee stock options and share plans 59 59
Changes in the composition of the group and other changes –277 –277
Closing balance 19,155 19,155
2017 Retained earnings Total
Opening balance 16,650 16,650
Transfer from unappropriated result 4,103 4,103
Dividends –3,176 –3,176
Employee stock options and share plans 69 69
Changes in the composition of the group and other changes –230 –230
Closing balance 17,416 17,416
The reserve for cash flow hedges is included in the Share of associates and joint ventures reserve on
a net basis. The Revaluation reserve, Share of associates and joint ventures reserve and Currency
translation reserve cannot be freely distributed. Retained earnings can be freely distributed, except
for an amount equal to the negative balance in each of the components of the Revaluation reserve
, Share of associates and joint ventures reserve and the Currency translation reserve. Unrealised
gains and losses on derivatives, other than those used in cash flow hedges, are presented in the
statement of profit or loss and are therefore part of Retained earnings and are not included in
Share of associates and joint ventures reserve.
The total amount of non-distributable reserves, in accordance with the financial reporting
requirements per Part 9 of Book 2 of the Dutch Civil Code, is EUR 7,603 million (2017: EUR 7,603
million).
Reference is made to Note 20 ‘Equity’ and the Capital Management section in the consolidated
annual accounts for additional information, including restrictions with respect to dividend and
repayment of capital.
Changes in other reserves
Changes in other reserves
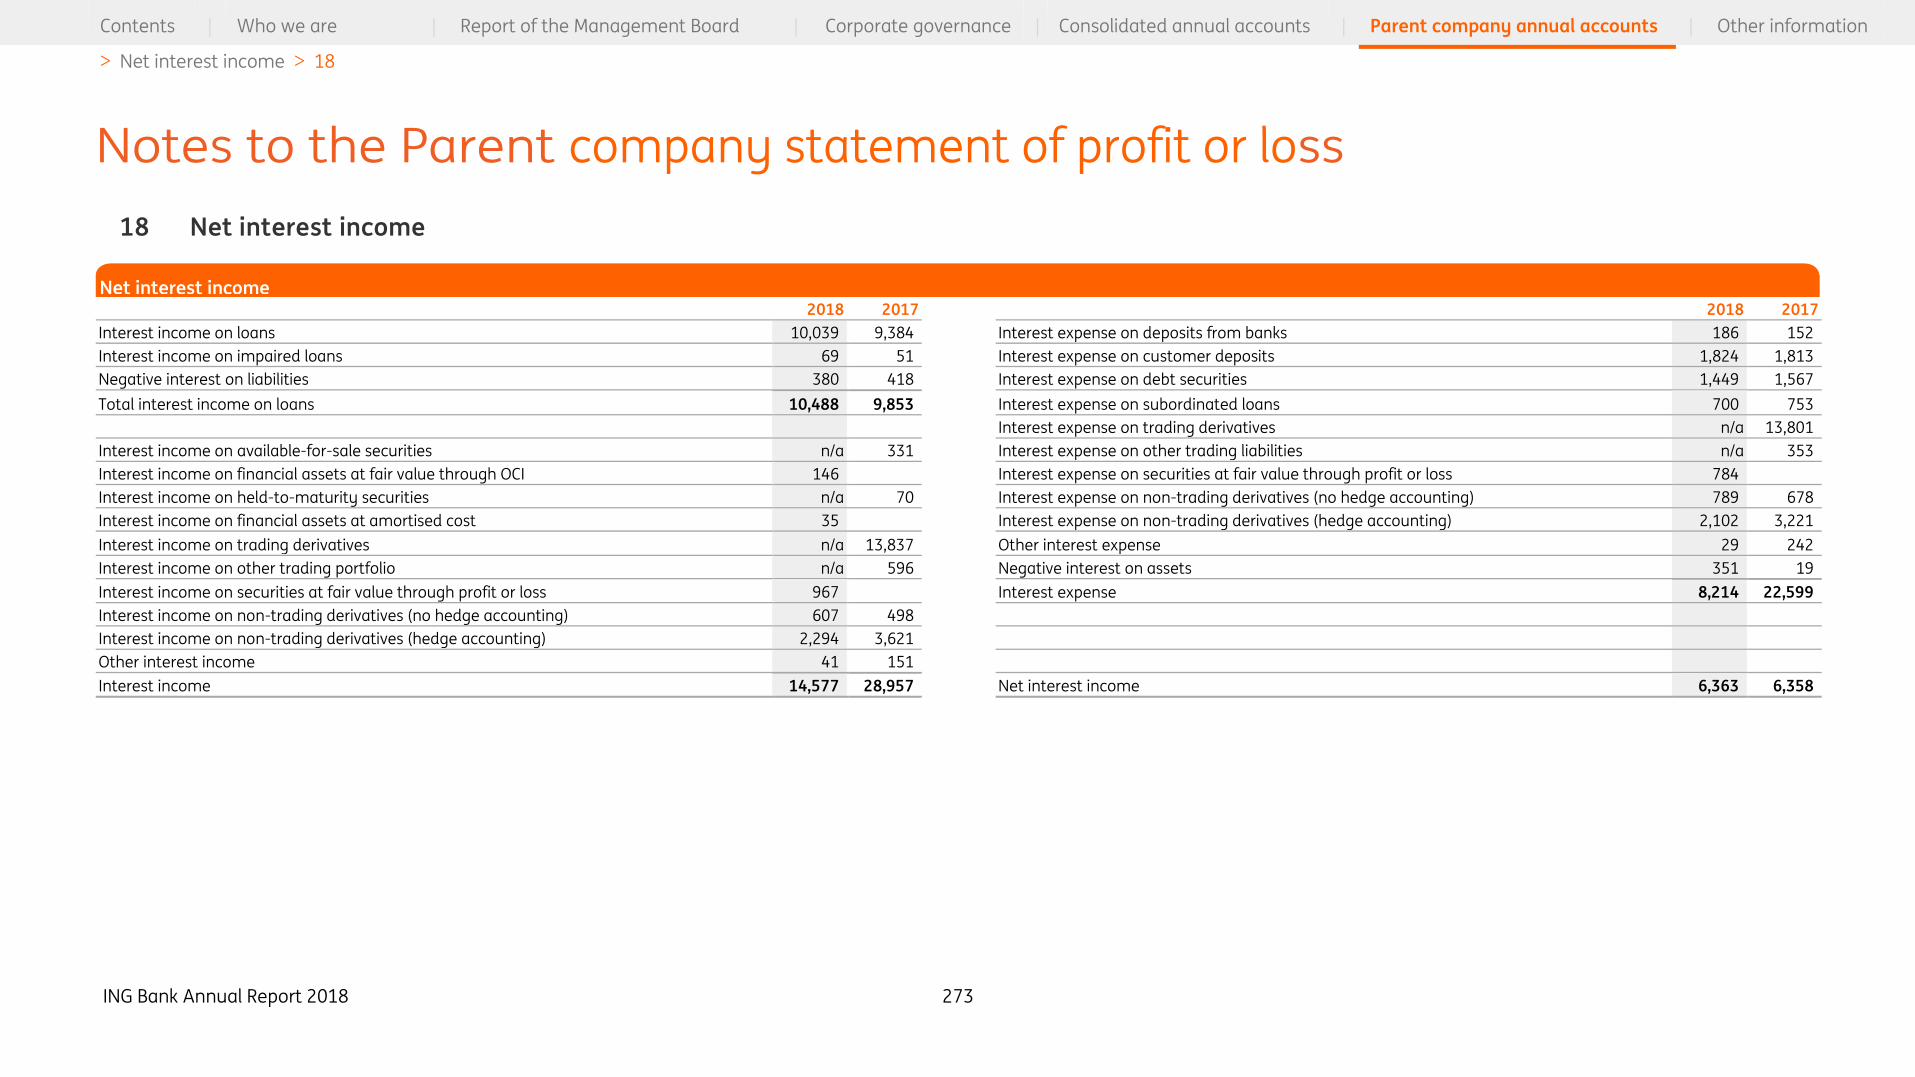
ING Bank Annual Report 2018 273
Contents | Who we are | Report of the Management Board | Corporate governance | Consolidated annual accounts | Parent company annual accounts | Other information
> Net interest income > 18
18 Net interest income
2018 2017 2018 2017
Interest income on loans 10,039 9,384 Interest expense on deposits from banks 186 152
Interest income on impaired loans 69 51 Interest expense on customer deposits 1,824 1,813
Negative interest on liabilities 380 418 Interest expense on debt securities 1,449 1,567
Total interest income on loans 10,488 9,853 Interest expense on subordinated loans 700 753
Interest expense on trading derivatives n/a 13,801
Interest income on available-for-sale securities n/a 331 Interest expense on other trading liabilities n/a 353
Interest income on financial assets at fair value through OCI 146 Interest expense on securities at fair value through profit or loss 784
Interest income on held-to-maturity securities n/a 70 Interest expense on non-trading derivatives (no hedge accounting) 789 678
Interest income on financial assets at amortised cost 35 Interest expense on non-trading derivatives (hedge accounting) 2,102 3,221
Interest income on trading derivatives n/a 13,837 Other interest expense 29 242
Interest income on other trading portfolio n/a 596 Negative interest on assets 351 19
Interest income on securities at fair value through profit or loss 967 Interest expense 8,214 22,599
Interest income on non-trading derivatives (no hedge accounting) 607 498
Interest income on non-trading derivatives (hedge accounting) 2,294 3,621
Other interest income 41 151
Interest income 14,577 28,957 Net interest income 6,363 6,358
Notes to the Parent company statement of profit or loss
Net interest income

ING Bank Annual Report 2018 274
Contents | Who we are | Report of the Management Board | Corporate governance | Consolidated annual accounts | Parent company annual accounts | Other information
> Investment income and results from participating interests > 19
19 Investment income and results from participating interests
2018 2017
Results from shares and other non-fixed income securities 125 89
Results from group companies 3,025 2,825
Results from associates, joint ventures and other participations –27 44
3,123 2,958
20 Net commission income
2018 2017
Funds transfer 789 753
Securities business 321 243
Insurance broking 38 30
Asset management fees 52 37
Brokerage and advisory fees 266 256
Other 483 472
1,948 1,791
2018 2017
Funds transfer 279 261
Securities business 113 68
Asset management fees 4 5
Brokerage and advisory fees 35 36
Other 100 93
532 463
21 Results from financial transactions
2018 2017
Results from securities trading portfolio –737 643
Results from currency trading portfolio 183 1,228
Results from non-trading derivatives 866 –1,392
Other 344 –165
655 314
In 2018, Other includes EUR 341 million (2017: EUR -269 million) related to fair value changes on
trading derivatives.
22 Other income
In 2017, Other income includes EUR 121 million related to a tax charge at ING Australia Holdings
Ltd, for which a full reimbursement is expected to be received from NN Group. The remainder of
Other income is made up of a number of small items, which are individually insignificant.
23 Staff expenses
2018 2017
Staff expenses
– Salaries 1,671 1,630
– Social security costs 226 204
Pension costs and other staff related benefit costs 289 275
Other management fees 843 728
3,030 2,837
Remuneration of Senior management, Management board and Supervisory board
Reference is made to Note 48 ‘Related parties’ (page 171 up to and including page 174) in the ING
Bank Consolidated annual accounts.
Investment income and results from participating interests
Fee and commission income
Fee and commission expenses
Results from financial transactions
Staff expenses
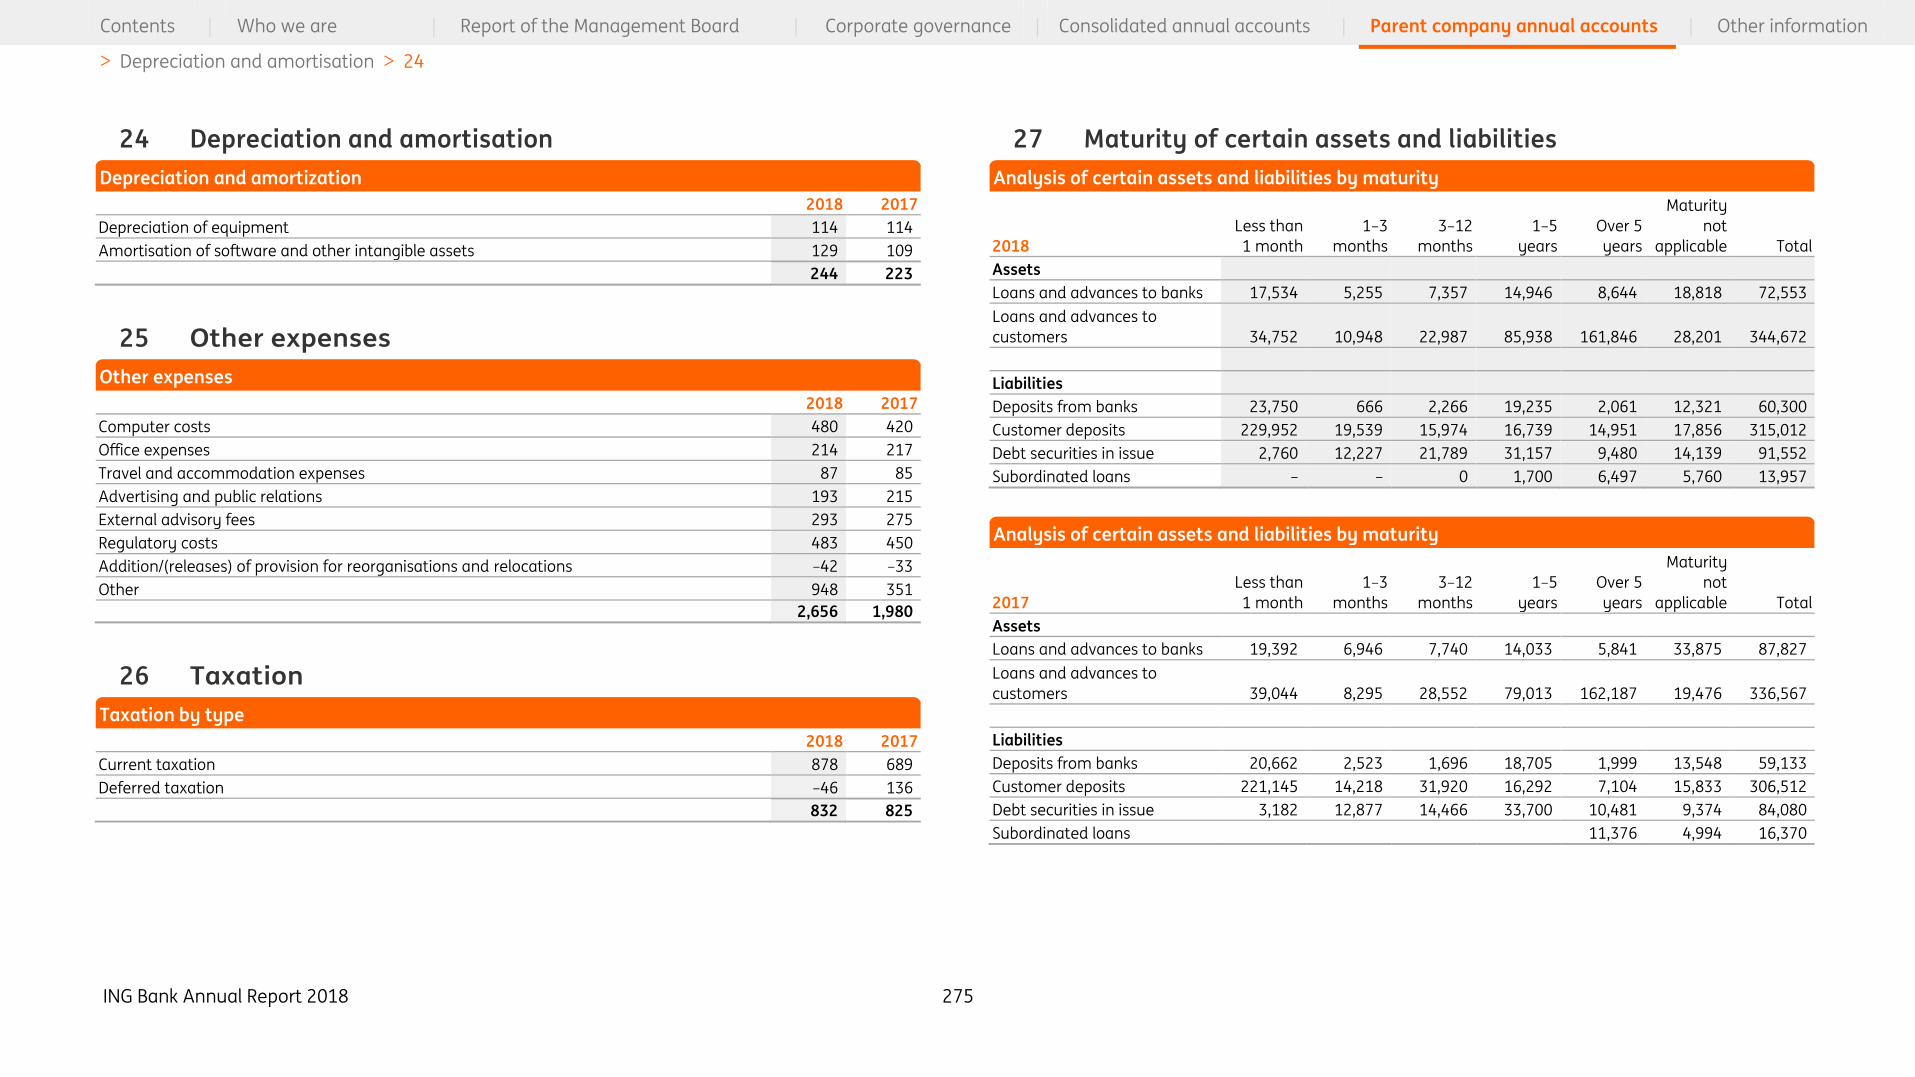
ING Bank Annual Report 2018 275
Contents | Who we are | Report of the Management Board | Corporate governance | Consolidated annual accounts | Parent company annual accounts | Other information
> Depreciation and amortisation > 24
24 Depreciation and amortisation
2018 2017
Depreciation of equipment 114 114
Amortisation of software and other intangible assets 129 109
244 223
25 Other expenses
2018 2017
Computer costs 480 420
Office expenses 214 217
Travel and accommodation expenses 87 85
Advertising and public relations 193 215
External advisory fees 293 275
Regulatory costs 483 450
Addition/(releases) of provision for reorganisations and relocations –42 –33
Other 948 351
2,656 1,980
26 Taxation
2018 2017
Current taxation 878 689
Deferred taxation –46 136
832 825
27 Maturity of certain assets and liabilities
2018
Less than
1 month
1–3
months
3–12
months
1–5
years
Over 5
years
Maturity
not
applicable Total
Assets
Loans and advances to banks 17,534 5,255 7,357 14,946 8,644 18,818 72,553
Loans and advances to
customers 34,752 10,948 22,987 85,938 161,846 28,201 344,672
Liabilities
Deposits from banks 23,750 666 2,266 19,235 2,061 12,321 60,300
Customer deposits 229,952 19,539 15,974 16,739 14,951 17,856 315,012
Debt securities in issue 2,760 12,227 21,789 31,157 9,480 14,139 91,552
Subordinated loans – – 0 1,700 6,497 5,760 13,957
2017
Less than
1 month
1–3
months
3–12
months
1–5
years
Over 5
years
Maturity
not
applicable Total
Assets
Loans and advances to banks 19,392 6,946 7,740 14,033 5,841 33,875 87,827
Loans and advances to
customers 39,044 8,295 28,552 79,013 162,187 19,476 336,567
Liabilities
Deposits from banks 20,662 2,523 1,696 18,705 1,999 13,548 59,133
Customer deposits 221,145 14,218 31,920 16,292 7,104 15,833 306,512
Debt securities in issue 3,182 12,877 14,466 33,700 10,481 9,374 84,080
Subordinated loans 11,376 4,994 16,370
Depreciation and amortization
Other expenses
Taxation by type
Analysis of certain assets and liabilities by maturity
Analysis of certain assets and liabilities by maturity
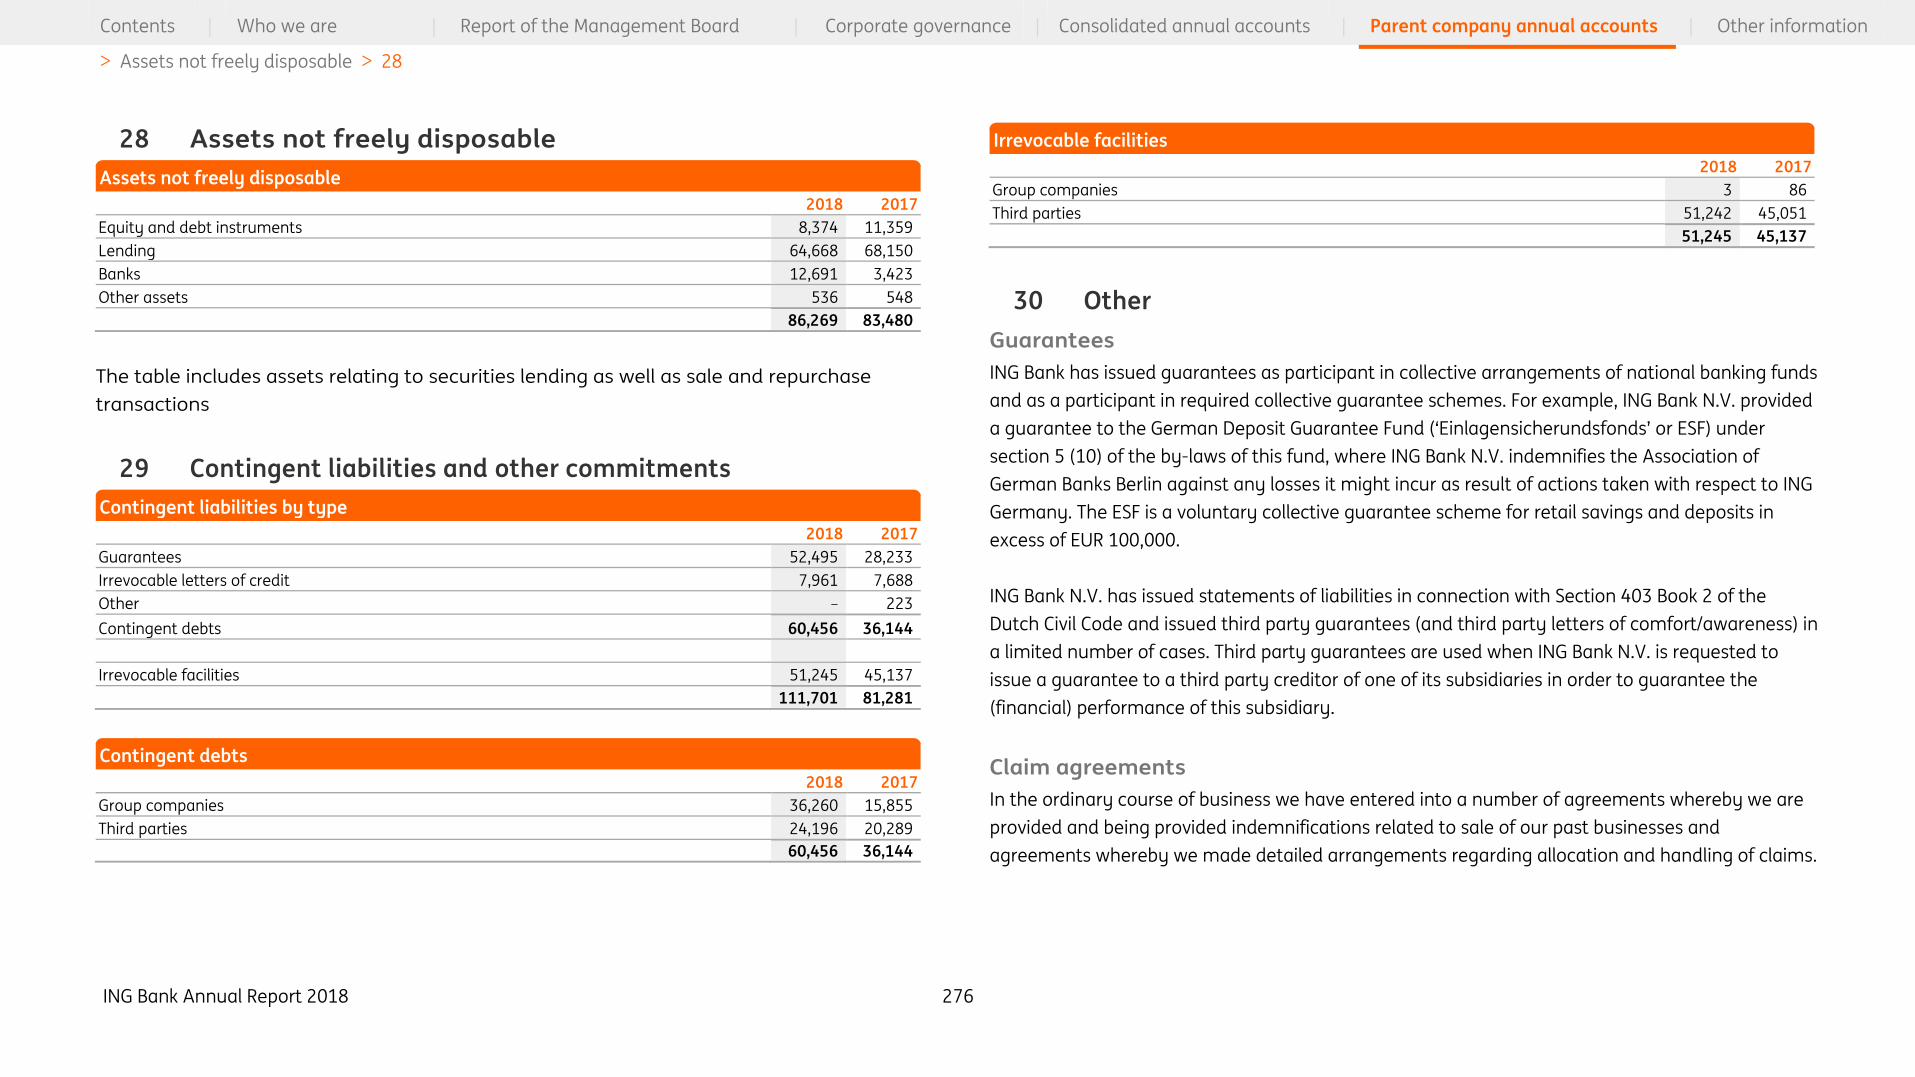
ING Bank Annual Report 2018 276
Contents | Who we are | Report of the Management Board | Corporate governance | Consolidated annual accounts | Parent company annual accounts | Other information
> Assets not freely disposable > 28
28 Assets not freely disposable
2018 2017
Equity and debt instruments 8,374 11,359
Lending 64,668 68,150
Banks 12,691 3,423
Other assets 536 548
86,269 83,480
The table includes assets relating to securities lending as well as sale and repurchase
transactions
29 Contingent liabilities and other commitments
2018 2017
Guarantees 52,495 28,233
Irrevocable letters of credit 7,961 7,688
Other – 223
Contingent debts 60,456 36,144
Irrevocable facilities 51,245 45,137
111,701 81,281
2018 2017
Group companies 36,260 15,855
Third parties 24,196 20,289
60,456 36,144
2018 2017
Group companies 3 86
Third parties 51,242 45,051
51,245 45,137
30 Other
Guarantees
ING Bank has issued guarantees as participant in collective arrangements of national banking funds
and as a participant in required collective guarantee schemes. For example, ING Bank N.V. provided
a guarantee to the German Deposit Guarantee Fund (‘Einlagensicherundsfonds’ or ESF) under
section 5 (10) of the by-laws of this fund, where ING Bank N.V. indemnifies the Association of
German Banks Berlin against any losses it might incur as result of actions taken with respect to ING
Germany. The ESF is a voluntary collective guarantee scheme for retail savings and deposits in
excess of EUR 100,000.
ING Bank N.V. has issued statements of liabilities in connection with Section 403 Book 2 of the
Dutch Civil Code and issued third party guarantees (and third party letters of comfort/awareness) in
a limited number of cases. Third party guarantees are used when ING Bank N.V. is requested to
issue a guarantee to a third party creditor of one of its subsidiaries in order to guarantee the
(financial) performance of this subsidiary.
Claim agreements
In the ordinary course of business we have entered into a number of agreements whereby we are
provided and being provided indemnifications related to sale of our past businesses and
agreements whereby we made detailed arrangements regarding allocation and handling of claims.
Assets not freely disposable
Contingent liabilities by type
Contingent debts
Irrevocable facilities
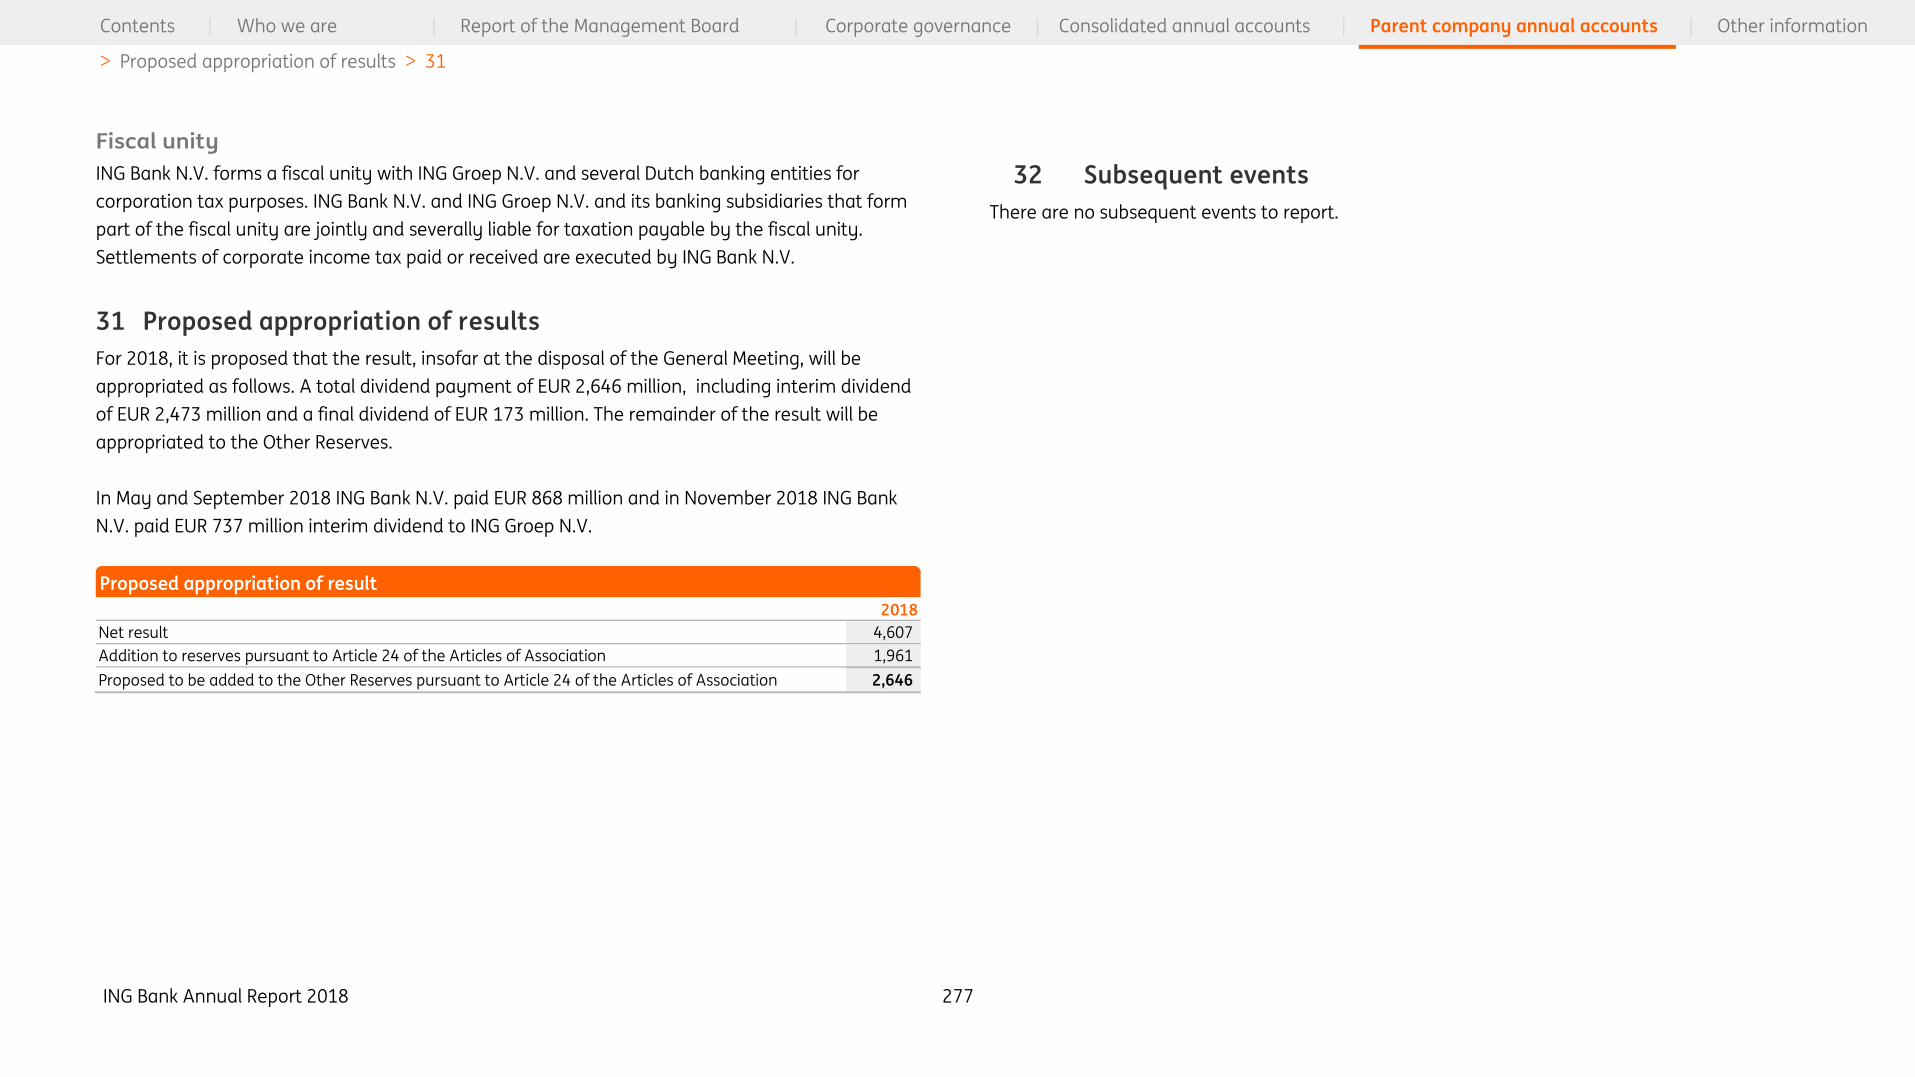
ING Bank Annual Report 2018 277
Contents | Who we are | Report of the Management Board | Corporate governance | Consolidated annual accounts | Parent company annual accounts | Other information
> Proposed appropriation of results > 31
Fiscal unity
ING Bank N.V. forms a fiscal unity with ING Groep N.V. and several Dutch banking entities for
corporation tax purposes. ING Bank N.V. and ING Groep N.V. and its banking subsidiaries that form
part of the fiscal unity are jointly and severally liable for taxation payable by the fiscal unity.
Settlements of corporate income tax paid or received are executed by ING Bank N.V.
31 Proposed appropriation of results
For 2018, it is proposed that the result, insofar at the disposal of the General Meeting, will be
appropriated as follows. A total dividend payment of EUR 2,646 million, including interim dividend
of EUR 2,473 million and a final dividend of EUR 173 million. The remainder of the result will be
appropriated to the Other Reserves.
In May and September 2018 ING Bank N.V. paid EUR 868 million and in November 2018 ING Bank
N.V. paid EUR 737 million interim dividend to ING Groep N.V.
2018
Net result 4,607
Addition to reserves pursuant to Article 24 of the Articles of Association 1,961
Proposed to be added to the Other Reserves pursuant to Article 24 of the Articles of Association 2,646
32 Subsequent events
There are no subsequent events to report.
Proposed appropriation of result
ING Bank Annual Report 2018 278
Contents | Who we are | Report of the Management Board | Corporate governance | Consolidated annual accounts | Parent company annual accounts | Other information
The Supervisory Board
G.J. (Hans) Wijers, chairman
H.J.M. (Hermann-Josef) Lamberti, vice-chairman
J.P. (Jan Peter) Balkenende
E.F.C.B. (Eric) Boyer de la Giroday
H.W. (Henk) Breukink
M. (Mariana) Gheorghe
M. (Margarete) Haase
R.W.P. (Robert) Reibestein
The Management Board Banking
R.A.J.G. (Ralph) Hamers, CEO and chairman of the Management
Board Banking
T (Tanate). Phutrakul, CFO
S.J.A. (Steven) van Rijswijk, CRO
M. I. (Isabel) Fernandez Niemann, head of Wholesale Banking
R.M.M (Roel) Louwhaff, COO/CTO
A. (Aris) Bogdaneris, head of Challenders & Growth Markets
R.B (Ronald) Boekhout, head of Market Leaders
Authorisation of Parent company annual accounts Amsterdam, 4 March 2019

ING Bank Annual Report 2018 279
Contents | Who we are | Report of the Management Board | Corporate governance | Consolidated annual accounts | Parent company annual accounts | Other information

ING Bank Annual Report 2018 280
Contents | Who we are | Report of the Management Board | Corporate governance | Consolidated annual accounts | Parent company annual accounts | Other information

ING Bank Annual Report 2018 281
Contents | Who we are | Report of the Management Board | Corporate governance | Consolidated annual accounts | Parent company annual accounts | Other information

ING Bank Annual Report 2018 282
Contents | Who we are | Report of the Management Board | Corporate governance | Consolidated annual accounts | Parent company annual accounts | Other information
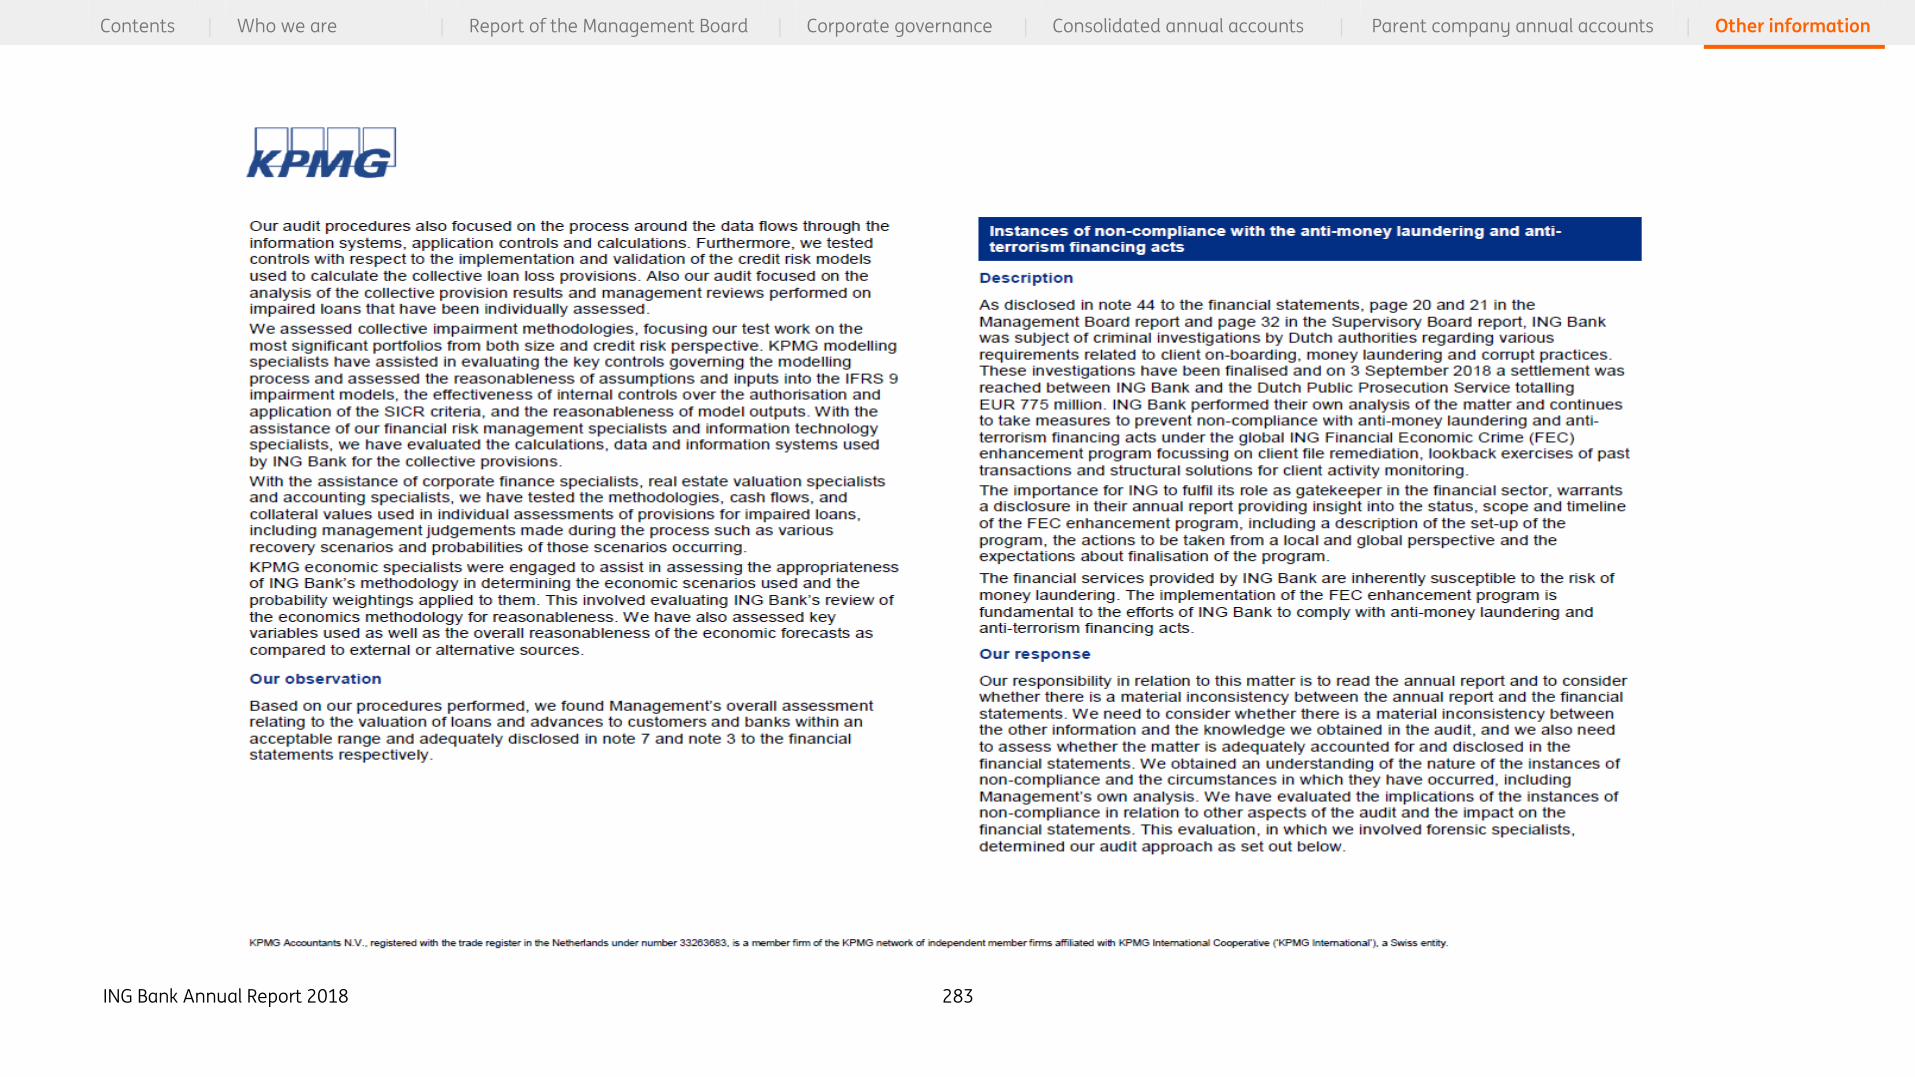
ING Bank Annual Report 2018 283
Contents | Who we are | Report of the Management Board | Corporate governance | Consolidated annual accounts | Parent company annual accounts | Other information
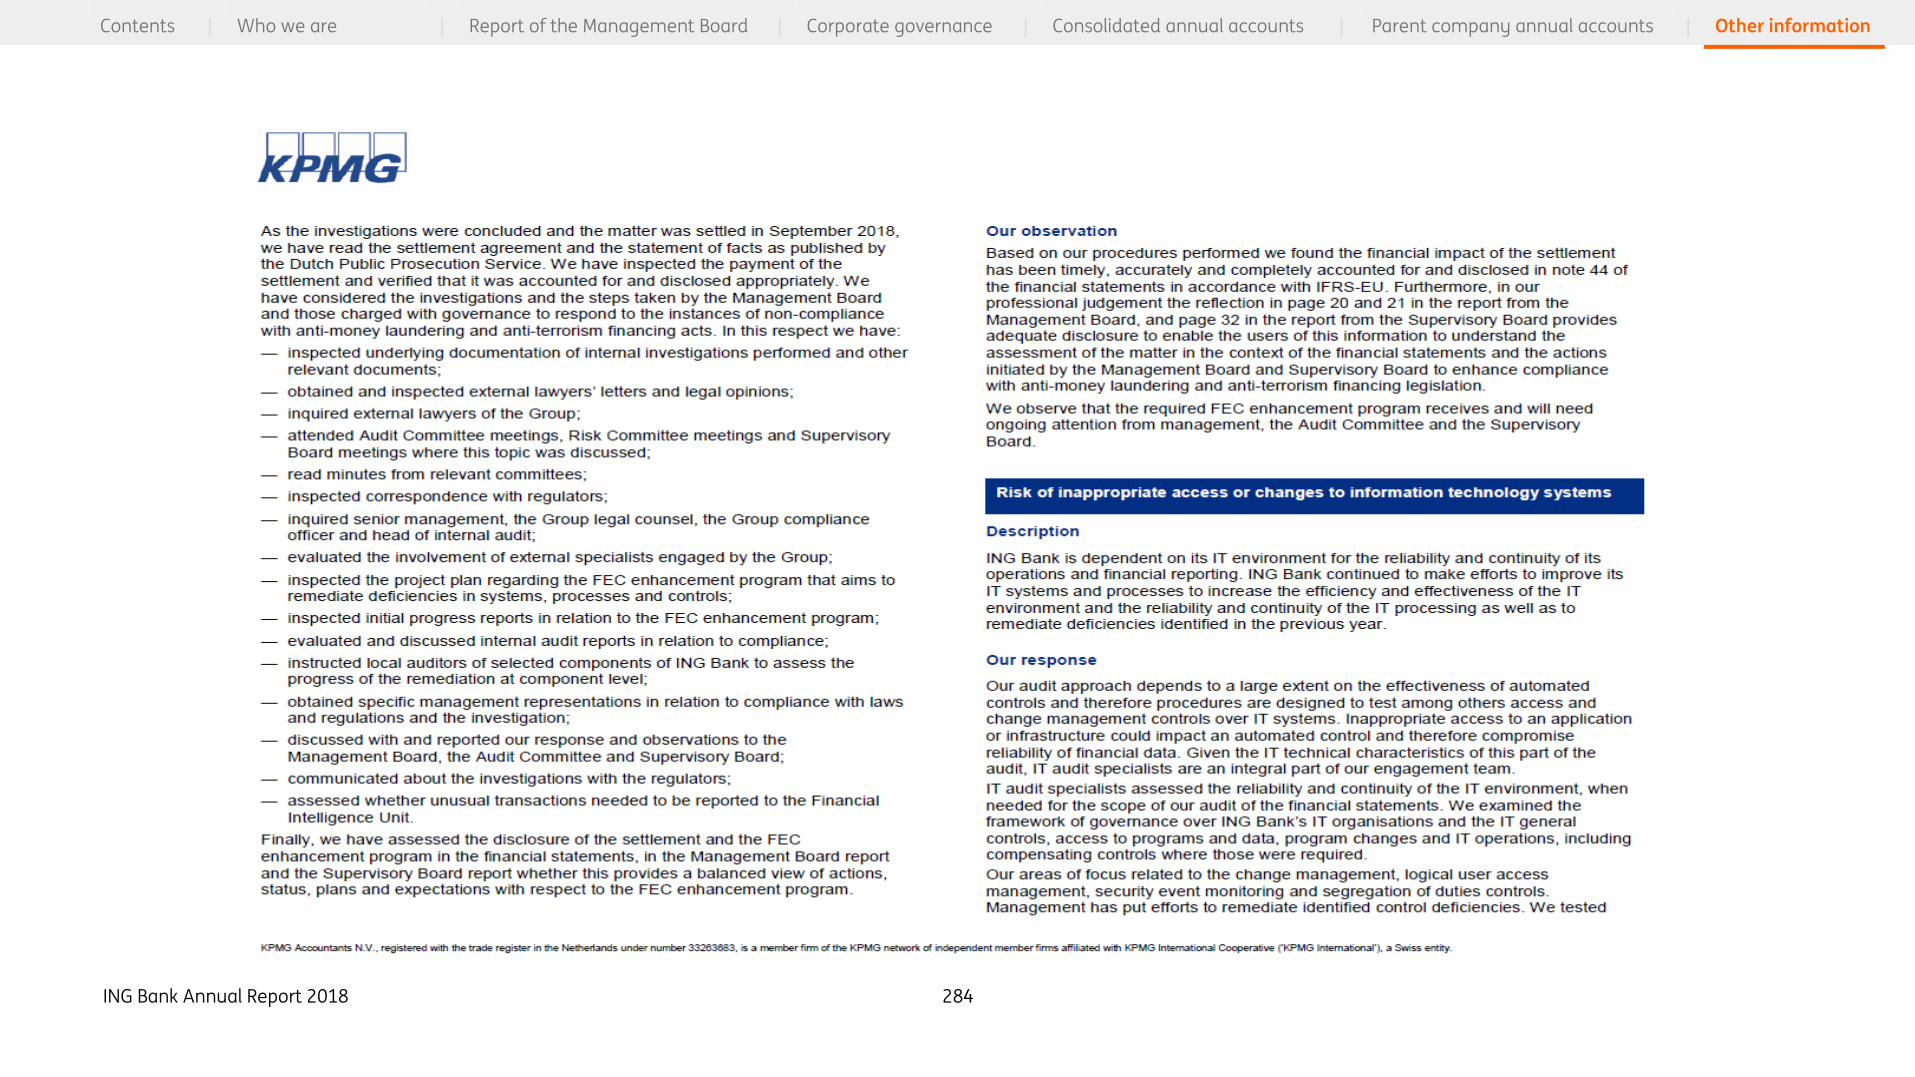
ING Bank Annual Report 2018 284
Contents | Who we are | Report of the Management Board | Corporate governance | Consolidated annual accounts | Parent company annual accounts | Other information
ING Bank Annual Report 2018 285
Contents | Who we are | Report of the Management Board | Corporate governance | Consolidated annual accounts | Parent company annual accounts | Other information
ING Bank Annual Report 2018 286
Contents | Who we are | Report of the Management Board | Corporate governance | Consolidated annual accounts | Parent company annual accounts | Other information

ING Bank Annual Report 2018 287
Contents | Who we are | Report of the Management Board | Corporate governance | Consolidated annual accounts | Parent company annual accounts | Other information
Appropriation of results
The result is appropriated pursuant to Article 24 of the Articles of Association of ING Bank N.V., the
relevant stipulations of which state that the result shall firstly be appropriated to the Stichting
Regio Bank Reserve, respectively the Reserve Stichting Vakbondsspaarbank SPN or charged to that
reserves in proportion to the ratio between the Stichting Regio Bank Reserve, respectively the
Reserve Stichting Vakbondsspaarbank SPN and the company's equity at the end of the relevant
financial year and that the remainder shall be at the disposal of the General Meeting.
Articles of Association – Appropriation of results
ING Bank Annual Report 2018 288
Contents | Who we are | Report of the Management Board | Corporate governance | Consolidated annual accounts | Parent company annual accounts | Other information
Disclaimer
Certain of the statements contained herein are not historical facts, including, without limitation,
certain statements made of future expectations and other forward-looking statements that are
based on management’s current views and assumptions and involve known and unknown risks and
uncertainties that could cause actual results, performance or events to differ materially from those
expressed or implied in such statements. Actual results, performance or events may differ
materially from those in such statements due to a number of factors, including, without limitation:
(1) changes in general economic conditions, in particular economic conditions in ING’s core
markets, (2) changes in performance of financial markets, including developing markets, (3)
potential consequences the United Kingdom leaving the European Union or a break-up of the euro,
(4) changes in the fiscal position and the future economic performance of the US including
potential consequences of a downgrade of the sovereign credit rating of the US government (5)
potential consequences of a European sovereign debt crisis (6) changes in the availability of, and
costs associated with, sources of liquidity such as interbank funding, (7) changes in conditions in
the credit and capital markets generally, including changes in borrower and counterparty
creditworthiness, (8) changes affecting interest rate levels, (9) inflation and deflation in our principal
markets, (10) changes affecting currency exchange rates, (11) changes in
investor and customer behaviour, (12) changes in general competitive factors, (13) changes in or
discontinuation of ‘benchmark' indices (14) changes in laws and regulations and the interpretation
and application thereof, (15) changes in compliance obligations including, but not limited to, those
posed by the implementation of DAC6, (16) geopolitical risks, political instability and policies and
actions of governmental and regulatory authorities, (17) changes in standards and interpretations
under International Financial Reporting Standards (IFRS) and the application thereof, (18)
conclusions with regard to purchase accounting assumptions and methodologies, and other
changes in accounting assumptions and methodologies including changes in valuation of issued
securities and credit market exposure, (19) changes in ownership that could affect the future
availability to us of net operating loss, net capital and built-in loss carry forwards, (20) changes in
credit ratings,
(21) the outcome of current and future legal and regulatory proceedings, (22) operational risks,
such as system disruptions or failures, breaches of security, cyber-attacks, human error, changes in
operational practices or inadequate controls including in respect of third parties with which we do
business,
(23) risks and changes related to cybercrime including the effects of cyber-attacks and changes in
legislation and regulation related to cybersecurity and data privacy, (24) the inability to protect our
intellectual property and infringement claims by third parties, (25) the inability to retain key
personnel, (26) business, operational, regulatory, reputation and other risks in connection with
climate change,
(27) ING’s ability to achieve its strategy, including projected operational synergies and cost-saving
programmes and (28) the other risks and uncertainties detailed in the most recent annual report of
ING Groep N.V. (including the Risk Factors contained therein) and ING’s more recent disclosures,
including press releases, which are available on www.ING.com. (29) this annual report contains
inactive textual addresses to internet websites operated by us and third parties. Reference to such
websites is made for information purposes only, and information found at such websites is not
incorporated by reference into this annual report. ING does not make any representation or
warranty with respect to the accuracy or completeness of, or take any responsibility for, any
information found at any websites operated by third parties. ING specifically disclaims any liability
with respect to any information found at websites operated by third parties. ING cannot guarantee
that websites operated by third parties remain available following the filing of this annual report or
that any information found at such websites will not change following the filing of this annual
report. Many of those factors are beyond ING’s control.
Any forward looking statements made by or on behalf of ING speak only as of the date they are
made, and ING assumes no obligation to publicly update or revise any forward-looking statements,
whether as a result of new information or for any other reason.
This document does not constitute an offer to sell, or a solicitation of an offer to purchase, any
securities in the United States or any other jurisdiction.


