
7/23/2019 Influence of Cohesion on Scour Around Bridge Piers
http://slidepdf.com/reader/full/influence-of-cohesion-on-scour-around-bridge-piers 1/14
Revision received March 20, 2002. Open for discussion till April 30, 2003.
JOURNAL OF HYDRAULIC RESEARCH, VOL. 40, 2002, NO. 6 717
Influence of cohesion on scour around bridge piers
Influence de la cohésion des sédiments sur l’affouillement autour des piles de ponts
S. A. ANSARI, Reader, Dept. Of Civil Engineering, Aligarh Muslim University, Aligarh, INDIA
U. C. KOTHYARI, Associate Professor, Dept. Of Civil Engineering, Indian Institute of Technology, Roorkee (Formerly: University of Roorkee), Roorkee, INDIA
K. G. RANGA RAJU, Professor of Civil Engineering and Deputy Director, Indian Institute of Technology, Roorkee) (Formerly: Univer-
sity of Roorkee), Roorkee, INDIA
ABSTRACTExperimental results on temporal variation of scour around circular bridge piers founded in cohesionless and cohesive sediments under steady clearwater flows are reported. The difference between scour patterns in cohesionless and cohesive sediments is brought out. Considering the horse shoevortex to be the prime agent causing scour, a procedure is developed for computing the temporal variation of scour depth in cohesive sediments.Empirical relationships have also been obtained for maximum scour depth around bridge piers in cohesive sediments.
RÉSUMÉOn présente dans cet article des résultats expérimentaux sur l’évolution temporelle des affouillements creusés par des écoulements permanents en eauclaire autourde piles de ponts circulaires fondéessur dessédimentscohésifs ou non cohésifs.On meten évidence lesdifférences entre lesconfigurationsde l’affouillement selon que les sédiments sont cohésifs ou non. En considérant que le vortex en fer à cheval est la cause principale du phénomène,une procédure est développée pour calculer la variation en temps de la profondeur de l’affouillement en sédiments cohésifs. On obtient également desrelations empiriques donnant la profondeur maximum de l’affouillement autour des piles de pont en sédiments cohésifs.
1. IntroductionThe estimation of scour depth around bridge piers is a major con-
cern of bridge engineers. Underestimation of the depth of scour
and its areal extent results in design of too shallow a foundation
which may consequently get exposed to the flow endangering the
safety of the bridge. Overestimation of the scour depth results in
uneconomical design. Great difficulty is experienced sometimesin straightening the pier wells which tend to get tilted while sink-
ingto large depths. Therefore, knowledgeof theanticipatedmaxi-
mum scour depth for design discharge is essential for a proper
design of the foundation of the bridge piers, abutment etc.
Local scour around a bridge pier is affected by a large number of
variables primarily the flow, fluid, sediment and pier characteris-
tics. The process of local scour has been studied extensively for
cohesionless alluvial materials. However, often river beds and
banks are found to be composed of a mixture of bars of gravel,
sand, clay and silt. Little is known so far about the effect of the
presence of cohesive material on pier scour.
The phenomenon of scour around bridge piers has been studied
by a large number of investigators. Shen et al. (1969) distin-
guished between (i) clear-water scour; when upstream flow does
not transport sediment and (ii) live-bed scour; when upstream
flow transports sediment. Detailed studies on the mechanism of
scour around bridge piers were made amongst others by Laursen
and Toch (1956), Nakagawa and Suzuki (1975), Ettema (1980),
Qadar (1981), Baker (1981), Hjorth (1975), Melville (1975),
Raudkivi and Ettema, (1983), Chiew and Melville (1987),
Raudkivi (1988), Kothyari et al.(1992 a), Ahmad and Rajaratnam
(1998), Graf and Yulistiyanto (1998). The system of horseshoe
vortex and associated downflow at the pier are found to be the
main agents responsible for pier scour.
Theavailable methods for estimation of scour depth include those
by Laursen and Toch (1956), Shen et al. (1969), Melville and
Sutherland (1988), Jain (1981), Kothyari et al. (1992a and
1992b), HEC-18(U.S. Army Corps of Engineers 1991) etc. These
methods cover both cases of clear-water and live-bed scour. Inaddition, the effects of sediment nonuniformity and/or stratifica-
tion on scour have also been studied (Ettema, 1980, Kothyari, et
al. 1992 a). Most of the methods available for determination of
scour depth at bridge piers are applicable for steady flow condi-
tions. However, the flow in a river during a flood is unsteady and
discharge changes in it are quite rapid. In this context, the tempo-
ral variation of scour depth also assumes importance and it forms
an important tool for calculation of scour depth in case of un-
steady flows (Kothyari et al., 1992a). The temporal variation of
scour depth is studied in detail by Chabert and Engeldinger
(1956), Ettema (1980), Yanmaz and Altinbilek (1991), Kothyari
et al. (1992a, 1992b), Melville and Chiew (1999).
All the above - mentioned studies pertain to scour around piers
founded in cohesionless sediment. Study on the problem of local
scour around bridge piers in cohesive sediments is still in its ini-
tial stage. Unlike in the case of non-cohesive sediments, the flow
condition at which cohesive materials get eroded is difficult to
predict as it depends upon a variety of factors such as the type
and percentage of clay content present, stage of compaction or
consolidation etc (Raudkivi, 1990). Kand (1993) and Namjoshi
(1992) analysed data fromseven bridges in India that are founded
in cohesive sediment beds. They concluded that the scour depth

7/23/2019 Influence of Cohesion on Scour Around Bridge Piers
http://slidepdf.com/reader/full/influence-of-cohesion-on-scour-around-bridge-piers 2/14
718 JOURNAL OF HYDRAULIC RESEARCH, VOL. 40, 2002, NO. 6
below general river bed in these bridges did not exceed 1.5 b.
Here, b is the pier diameter. However, both the above studies are
based on very limited data and lack a experimental or analytical
support. Further, no study is available on the temporal variation
of scour depth around bridge piers founded in cohesive sedi-
ments.
The main aim of the present investigation is to study the process
of scour and the temporal variation of scour depth around a circu-
lar bridge pier founded in cohesive sediments. Experiments were
conducted on temporal variation and equilibrium depth of pier
scourunder clear-water conditions in cohesivesediments. Details
of these are presented herein.
2. Experimental equipment and procedure
The experimental work being reported herein was part of a major
experimental programme for study on the influence of cohesion
on local scour, details of which are given in Ansari (1999). These
experiments were conducted in the Hydraulics Laboratory of theUniversity of Roorkee, Roorkee, India.
2.1 Properties of the cohesive sediments used
A cohesionless sediment (medium sand) was used as base mate-
rial to which clay was added in various proportions to simulate
the cohesive sediments. Wide range of natural conditions was
simulated by varying the bulk properties of the thus - formed co-
hesive sediments. Experiments were also conducted for determi-
nation of theproperties of clay and sand and their mixtures.These
are described below.
2.2 Properties of clay and sand
Locallyavailable clay excavated from a depth of about 3 m below
the general ground level was used. Tests were conducted as per
IS-1498 (Raj, 1995) to determine the engineering properties of
this clay.
A laser particle size analyser was used to obtain the particle size
distribution of the clay. The clay material was found to have me-
diansize(d 50) equal to 0.0053mm andgeometrical standard devi-
ation (σg) equal to 2.1, while the sand had d 50 size of 0.27 mm
and σg
of 1.48. Relative density of sand was 2.65. Other proper-
ties of the clay material were : Liquid limit, W L = 53%, Plastic
limit, W P = 27%, Plasticity index, PI = 26%, Maximum dry den-
sity, (γ d )max = 17.4 KN/m3, Optimum Moisture Content, O.M.C.
= 18%, Cohesion, C u at Optimum Moisture Content = 65.66
KN/m2, Angle of internal friction, φc = 14o and Relative density
= 2.60. As per IS-1498 (Raj, 1995) the clay was classified as CH
i.e. clay with high compressibility. The differential free swell for
clay was obtained as 28.6% indicating the clay to be moderately
expansive (Raj, 1995).
The X-ray diffraction test wasconducted for identification of clay
minerals. Three slides of clay viz. heated slide, glycolated slide
andordinary slide were tested. Thepercentage composition of theclay minerals found as per Weir et al., (1975) was Kaoline =
10%, Illite = 74.5% and Montmorillonite = 15.5%.
2.3 Properties of clay-sand mixtures
Cohesive sedimentswere prepared by properly mixingclay mate-
rial with sand in proportions varying from 10% to 60%. The
physical properties of cohesive sediments were found to be con-
siderably influenced by the amount of moisture content present in
them. As moisture is removed from the cohesive sediment, it
passes through a series of states, i.e., liquid (viscous), plastic and
semi-solid (non-plastic)
In the present investigation, the maximum possible range of ante-
cedent moisture content was considered so to represent various
statesof cohesive sedimentsfound in natural conditions. Thetests
were performed at all the possible moisture consistencies of the
cohesive sediment ranging from very soft with negligible cohe-
sion (viscous state) to hard soil with a very high value of cohe-
sion, i.e. up to 250 KN/m2. Values of liquid limit, plastic limit
and plasticity indices of the cohesive sediments used are given in
Table 1 which indicates that plastic behaviour occurred when the
percentage of clay material present exceeded 20%.
Table 1 Liquid limit, plastic limit and plasticity index values for sedi-
ments used
Clay Content (%) W L (%) W P (%) PI (%)
10 - - NP
20 - - NP
30 18 14 4
40 22 15 7
50 25 16 9
60 31 18 13
NP: Non – Plastic
2.4 Details of set-up
A 30.0m long, l.0m wide and 0.60m deep fixed bed masonry
flume was used for the experiments. The experiments were car-
ried out with the longitudinal slope of the flume, equal to 6.67 x
10-4. The pier was placed in a working section located at 12.0m
downstream of the flume entrance having a length of 4.0m, width
of 1.0m and depth of 1.2m. The sediment was filled in this recessupto the level of the flume bed and the pier was then placed in
this bed. The roughness in the flume bed was simulated by uni-
formly pasting the sediment on the bed upstream of the working
section.
2.5 Preparation of bed
The sun-dried powdered clay and sand were used for preparation
of sediments. The moisture present in the clay powder and the
sand was determined through measurement of change in weight
after oven drying for 24 hours. The amount of moisture required
to be added further to reach a desired value was thus worked out.Accurately weighed clay powder and sand and pre-determined
7/23/2019 Influence of Cohesion on Scour Around Bridge Piers
http://slidepdf.com/reader/full/influence-of-cohesion-on-scour-around-bridge-piers 3/14
JOURNAL OF HYDRAULIC RESEARCH, VOL. 40, 2002, NO. 6 719
moisture were mixed thoroughly. The sediment thus prepared was
covered with polythene and left in place for 20 hours for uniform
distribution of moisture. It was again well mixed before place-
ment in the test section. Depending upon the antecedent moisture
content one of the following two methods of filling the test sec-
tion was adopted:
(i) Dynamic compaction method and
(ii) Kneading method
In the dynamic method of compaction, the sediment was com-
pacted in the test section in different layers each having thickness
of 0.10 m. Each layer was compacted by controlling number of
blows of 10 Kg weight hammer having 0.10 m base diameter. It
was allowed to drop freely under gravity from a height of 0.30 m.
The top surface of the compacted layer was roughened before
laying the next layer over it to ensure bonding between these. The
test section was slightly over-filled with sediment. Later, extra
sediment was trimmed off using a large knife. Uniformity of
placement was ensured by observing the density of compacted
sediment at three different locations. For uniformly laid sedi-ments the observed densities were similar. This method was used
for sediments having consistencies of solid, semi – solid and plas-
tic states.
The second method was used for sediments having soft and very
soft consistencies. Such sediments were dropped in small lumps
from a height of l.0 m. In this case also the test section was over-
filled to form a mound and extra sediment was trimmed off with
the help of a large knife. Following the sediment placement, the
bed was wetted for 20 hours prior to starting of the experiments.
The moisture contents and dry unit weights presented in this
study are those taken at the time of compaction or kneading.
2.6 Measurements
The scour depths were measured using an electronic profile indi-
cator MK-V manufactured in the Delft Hydraulics Laboratory,
Holland. It is sensitive to bed level variation of 0.2 mm. In-situ
vane shear strength for soft cohesive beds was measured by using
a laboratory vane shear apparatus designed as per Standard Code
of practice, IS-2720 (Raj, 1995). For hard cohesive beds, in-situ
vane shear apparatus designed as per IS:4434 (Raj, 1995) was
used. In-situ bulk unit weight of sediments was obtained by using
standard core cutter method and sand replacement method as per
IS:2720 (Raj, 1995). Values of dry densities and void ratios were
computed by making use of observed values of bulk density and
antecedent moisture content.
Only two runs were taken using sand (d50 = 0.27 mm) in clear-
water scour conditions. The diameter of the pier was 0.1125 m.
The shear velocity for initiation of motion for the non – cohesive
sediment, u*cs used was determined using Shields’ criterion. In the
first run the flow parameters were set at u* /u*cs = 0.95 and in the
second run at u* /u*cs = 1.0. Here u* is the shear velocity in the
approach flow which is equal to (τu / ρ f )0.5, where,τu is the average
shear stress in the approach flow and ρ f is the mass density of the
fluid. The temporal variation of scour depth was measured by us-ing the electronic bed profile recorder and an electronic watch.
Both the runs were carried out until the equilibrium scour depth
was attained, that is when the scour depth did not change appre-
ciably with time. Such a condition was attained after a period of
about 30 hours. The equilibrium scour depths were also noted.
For studying the influence of cohesion, two categories of experi-
ments were carried out, viz. (a) by keeping the antecedent mois-
ture content as constant (close to optimum moisture content
which wasdetermined by Standard Proctor CompactionTest)and
varying the number of blows used for compaction, and (b) keep-
ing the number of blows as constant and by varying the anteced-
ent moisture content.
To account for compaction in both these cases initial dry density
and the initial value of cohesion (vane shear strength) were mea-
sured. In all, 84 runs were conducted on cohesive sediments (clay
contents varying from 5% to 60%) out of which 28 runs corre-
sponded to critical condition i.e. when u* /u*cc = 1.0 (when clay
content varied from 5% to 20%). Here u*cc is the shear velocity
corresponding to the incipient motion of the cohesive sediment.
The remaining 56 runs corresponded to much less than critical
shear stress flow conditions i.e. and for these, clay con-
u
u cc
*
*
.<<1 0
tent varied from 30% to 60%. Temporal variation of scour depth
was observed in similar manner as for non-cohesive sediments.
However, the duration of experimental runs for cohesive sedi-
ments was much different viz. 6 to 60 hours. The range of vari-
ables covered in the experimental investigation is given in Table
2.
2.7 Scouring process and monitoring of deepest scour
Cohesive sediments are composed of small particles having large
specific area. Due to this the surface physio-chemical forces be-
come much more important for these compared to the particleweight. The surface physio-chemical forces include the attractive
vander waal forces and other bonding forces such as hydrogen
bond, cation bond, chemical cementation between particles the
double layer and particle interaction forces etc in the clay water
medium. These forces are not yet fully understood as these vary
with degree of saturation, type of shear application, drainage con-
dition, clay percentage, type of clay etc. Analysis of data on scour
around bridgepiers in cohesivesedimentshas revealedinteresting
aspects about the process of scour. In cohesive sediments, the
geometry, location and extent of scour hole are found to be signif-
icantly different from those in cohesionless sediments.
Observations revealed that scouring in sediments having clay
content between 5% to 10% commenced from the sides of the
pier. The scour then propagated upstream along the sides of the
pier and met at the nose of the pier. The time required for this to
happen depended on the sedimentcharacteristics.The scour depth
then increased rapidly creating the deepest scour hole at the pier
nose.

7/23/2019 Influence of Cohesion on Scour Around Bridge Piers
http://slidepdf.com/reader/full/influence-of-cohesion-on-scour-around-bridge-piers 4/14
720 JOURNAL OF HYDRAULIC RESEARCH, VOL. 40, 2002, NO. 6
Photograph 1 Deepest scour occurring at the sides of the pier
(a) Pc = 20%, PI = 0, W/W * = 1.1, γ d / γ ω
= 1.62
h = 0.15 m, U = 0.45 m/s, u* = 0.0.28 m/s, b = 0.1125 m(b) Pc = 60%, PI = 13, W/W * = 0.53, γ d / γ ω = 1.68
h = 0.15 m, U = 0.45 m/s, u* = 0.0.28 m/s, b = 0.1125 m
Table 2 Range of experimental data on pier scour in cohesive sediments
S.
No.
Variables For Non Plastic
Sediments
(PI = 0)
Range
For Plastic
Sediments
(PI > 0)
Range
Remarks
1. Maximum scour depth, d smc (m) 0.075 - 0.215 0.011 – 0.179 Pier width, b=0.1125m
Flume width, B = 1.0 m
Opening ratio,
α = (B-b)/B= 0.89
2. Dry unit weight, γ d (KN/m3) 14 - 17.5 12.2 – 18.9
3. Antecedent moisture
Content, W (per cent)
6 – 26 8.5 – 48.1 Slope of flume,
S=6.67x10⁻⁴
4. Plasticity Index, PI
(per cent)
NP 4 – 13
5. Percentage clay, Pc 5 – 20 30 – 60
6. Arithmetic mean diameter, d a (mm) 0.217 - 0.257 0.111 – 0.191
7. Vane shear strength, S v (KN/m2) 0 – 175 0 – 240
8. Flow depth upstream of pier, h (m) 0.05 - 0.18 0.05 – 0.18
9. Flow velocity upstream of pier, U (m/s) 0.21 - 0.48 0.21 – 0.48
10. Duration of experimental runs (hr) 6 - 48 6 – 60
For sediments with clay content ranging from 20% to 40% a simi-
lar behaviour was observed so long as the antecedent moisture
was lower than that for saturation condition. However, for satu-
rated sediments, the deepest scour was found to occur at the sides
of the pier.
For sediments with higher clay contents, i.e., more than 50%,
scour initially developed at the pier sides, propagated towards the
pier nose but could not reach the nose even at low values of ante-
cedent moisture content. Thus negligible scour occurred at the
pier nose. The deepest scour was observed at the pier sides.
Shapes of the scour holes for the above conditions can be seen in
Photographs 1 (a) and (b). In case of cohesive sediments depend-
ing upon the antecedent moisture conditions the maximum scour
depth around a pier can be smaller or larger than that occurring
around the same pier if it was founded in cohesionless sediment
(seeFig. 1). In Fig. 1 W * is the antecedent moisture content of the
sediment at the state of saturation. Thus for plastic sediments W *= W L.
3. Analytical considerations
(i) The review of literature revealed that little information is
available regarding the process of scour around bridge piers in
cohesive sediments. Therefore, an attempt is made to formulate
a mathematical model for computation of the temporal variation
of pier scour in cohesive sediments. The mathematical formula-
tions are mainly based on the works of Kothyari et al. [1992(a)
and (b)].
Measurements of the shear stress on a rigid flat bed around the
pier by Hjorth (1975), Ettema (1980), Graf and Yulistiyanto
(1998) and Ahmad and Rajaratnam (1998) showed that the aver-
age shear stress under the horse – shoe vortex at the pier nose τ p,
is about four times the value of τu and at the sides of the pier it is

7/23/2019 Influence of Cohesion on Scour Around Bridge Piers
http://slidepdf.com/reader/full/influence-of-cohesion-on-scour-around-bridge-piers 5/14
JOURNAL OF HYDRAULIC RESEARCH, VOL. 40, 2002, NO. 6 721
Fig. 1 Temporal variation of scour depth around circular bridge pier
D
h
b
h
v =
0 28
0 85
.
.
(1)
Q = A U = A .U p p p sd s
2 (2)
Thus
Taking
, ( ) .( ) ( ) .( ) .
, ( ) . ( )
4
2 5
2 2 2 2
2 2
A U A U
U U
sd s p p
s p
=
(3)
Weobtain
Hence
( ) ( ) /
.
A A
A A
sd p
sd p
2 2 10
0 316
=
= (4)
A = A + At o s
(5)
Fig. 2 Geometry of deepest scour hole on the pier sides when negligi-
ble scour occurs at pier noise
A
d s
scn
sc=
2
2 cot φ for scour at pier nose (6)
and for scour at pier side A d s scs
= π4
2 (7)
approximately ten times the value of τu , irrespective of the flow
condition and the pier size, so long as the contraction caused by
the pier is not severe. Therefore, it has been assumed that before
scour begins shear stress at the pier sides, τs 10 τu. Thusτs 2.5
τ pn.
Due to large shear stress on pier sides scour invariably begins
from the sides in case of the both non-cohesive and the cohesive
sediments. The scour hole initially formed at the pier sides ex-
pands towards the pier nose provided that 4 τu (i.e., shear stress
at pier nose) τcc. Here τcc is the critical shear stress for incipient
motion of cohesive sediments. Under this scenario the maximumscour is found to occur at the pier nose since live-bed scour con-
dition occurs at the sides of the pier. In case, when 4 τu< τcc
10τu, scour occurs only at the pier sides. However, no scour
would occur when 10 τu τcc.
The following relationship as suggested by Kothyari et al.
(1992a) for the diameter of the principal vortex of the horse-shoe
vortex system, Dv is adopted for use in the present model:
Here h is the flow depth. Downstream to the pier nose the horse-
shoe vortex system is swept away along the pier sides where it
gets stretchedin thestreamwise direction,beforejoining thewake
region (Graf and Yulistiyanto, 1998). It is considered that the
horseshoe vortex acting on the plane bed at pier nose is contained
in a vortex tube of cross-sectional area A p and carrying a dis-
charge of Q p . In any one side of the pier, the cross-sectional area
of the vortex tube is equal to Asd and the discharge is Q p /2. It is
noted previously that τs 2.5 τ p. The bed shear stress may be
taken proportional to the square of the velocity; therefore the fol-
lowing relation would hold good between Asd and A p :
Here U p and U s are the average values of the streamwise velocity
in the vortex tubes at pier nose and pier sides respectively.
As the scour hole develops at pier nose or sides, the horseshoe
vortex expands and sinks into it and the cross-sectional area of the
scouring vortex increases to At given as per Kothyari et al. (1992
a):
Here, Ao is the original cross-sectional area of the vortex. Note
that Ao at the pier nose is equal to A p while at pier sides Ao isequal to Asd and As is the cross-sectional area of the scour hole at
the pier nose/pier sides.
Experiments on bridge pier scour in cohesive sediments have in-
dicated that the geometry of the scour hole occurring at pier nose
resembles approximately that of the scour hole in cohesionless
sediments (i.e. an inverted frustum of a cone), while the cross-
section of the scour hole at pier sides is approximately cylindrical
as depicted in Fig. 2.
Therefore,
Here d scn and d scs are the instantaneous scour depths below origi-

7/23/2019 Influence of Cohesion on Scour Around Bridge Piers
http://slidepdf.com/reader/full/influence-of-cohesion-on-scour-around-bridge-piers 6/14
722 JOURNAL OF HYDRAULIC RESEARCH, VOL. 40, 2002, NO. 6
τ τ pn t u
o
t
A
A,
.
.=
4 0
0 57
(8)
and τ τ ps t u
o
t
A
A,
.
.=
10 0
0 57
(9)
t C d
p uc
a
o tc n t
*
, * ,
= 3 (10a)
t C d
p uc
a
o tc s t
*
’
, * ,
= 3 (10b)
pd
for d
o t
p t
s a
p t
s a
,
,
.
,. ; =
0 45
3 45
τ
γ
τ
γ ∆ ∆ ≤≤ 0 25. (11a)
p for d
o t
p t
s a
,
,; = 1
τ
γ ∆ >> 0 25. (11b)
p for o t
p t
cs
p t
cs
,
,
.
,. ; . =
≤0 0027 5 56
3 45
τ
τ
τ
τ(12a)
and p for o t
p t
cs
,
,. ; .= >1 0 5 56
τ
τ (12b)
p for o tc
p t
cc
p t
cc
,
,
.
,. ; =
≤0 0027
3 45
τ
τ
τ
τ 5 56. (13a)
and p for o tc
p t
cc,
,
. ; .= >1 0 5 56
τ
τ (13b)
nal bed level at the pier nose and the pier side respectively and φsc
is the slope of the sides of the scour hole.
As per Kothyari et al. (1992 a) the following forms of relation-
ships have been assumed to hold good for the shear stress at the
pier nose and at the pier sides due to development of scour depth
up to time t since start of the scour:
Here, τ pn,t and τ ps,t are the shear stresses at the pier nose and the
pier sides at time t respectively.
3.1 Estimation of time required for removal of a single sediment particle
If the shear stress τ pn,t or τ ps,t acting at the pier nose or pier side
at any instant of time can be obtained from a relationship such as
Eq. (8) or (9), then the time t *c , required for a single sediment
particle to get scoured can be estimated using the equation having
the following form (Paintal, 1971):
Here and depending upon theun t pn t f * , ,
/ = τ ρ us t ps t f * , ,
/ = τ ρlocation of the deepest scour hole , d a is the arithmetic mean size
of clay – sand mixture, C 3 and are constants and po,tc is theC 3
’
average probability of movement of the sediment particle. It may
be mentioned that cohesive sediments mostly get eroded in the
form of a cluster of sediment particles called lumps. The size of
these lumps varies with clay content, moisture conditions, shear
stress etc. and no definite relationships are available at present for
of these sizes. Therefore, cohesive sediments are considered to
get eroded in the form of aggregates having size equal to the aver-
age size of the sediment mixture. However, the empirical coeffi-
cients C 3 and introduced in Eq. (10) would account for theC 3
’
difference of the actual sizes from the observed values. It is,
therefore, expected that the values of C 3 and in Eq. (10) shallC 3
’
be much different from each other in magnitude due to the above-
mentioned reasons and due to different scour hole geometries,
shear stresses etc. The average probability of movement of
cohesionless sediment, po,t was related to the shear stress by
Paintal (1971). This relationship can be written as
Here, τ p,t represents the shear stress at any given location around
the bridge pier, and∆γ s = γ s - γ w, γ s and γ w are the specific weights
of cohesive sediments and water respectively.
The critical shear stress for incipient motion at high value of
Reynolds number of coarse sediment (non-cohesive), τcs, can be
taken to be equal to 0.045 ∆γ sd a (Yalin and Karahan, 1979). By
making use of such a relation, the term ∆γ sd a is substituted in Eq.
(10) by τcs as below:
Following the above the equation for probability of movement of
cohesive sediments, po,tc can be written as
Here τcc is the critical shear stress for incipient motion of the co-
hesive sediments.
3.2 Temporal variation of scour around bridge piers
For the computation of temporal variation of scour depth in cohe-
sive sediments the following scheme is proposed on the basis of
the premises set out above (see Fig. 3).
(i) For given flow depth and pier diameter, τu
is calculated and
theinitial diameter of the horseshoe vortex computed using
Eq. (1).
(ii) For the known flow conditions, pier diameter and average
size of sediment, the shear stresses at the pier nose and pier
sides are computed using Eqs. (8) and (9) using the condi-
tion that at t = 0, d scn or d scs = 0.
(iii) Location of the maximum scour is first ascertained by us-
ing the following criterion:
Maximum scour occurs at pier nose if 4τu τcc and if 4τu <
τcc 10τu then the maximum scour occurs on the pier sides.
However, no scour will occur if τcc > 10τu.
(iv) The average probability of movement is computed usingEq. (13).
(v) The time t *c , required by a single sediment aggregate hav-

7/23/2019 Influence of Cohesion on Scour Around Bridge Piers
http://slidepdf.com/reader/full/influence-of-cohesion-on-scour-around-bridge-piers 7/14
JOURNAL OF HYDRAULIC RESEARCH, VOL. 40, 2002, NO. 6 723
Fig. 3 Algorithm for calculation of temporal variation of scour depth around a bridge pier in cohe-
sive sediments
ing size equal to average size of sediment d a, to get scoured
is computed using Eq. (13).
(vi) The scour depth d scn or d scs after time t *c is equal to d a.
(vii) The changed cross-sectional area of the horseshoe vortex
is computed using Eq.(5).
(viii) The changed shear stress due to the development of the
scour hole is computed using Eqs. (8) and (9), and the
changed value of average probability of movement is com-
puted using Eq. (13).
(ix) The new value of time t *c, required for a single sediment
aggregate to get scoured or the time required for the scour
depth to increase from d scn (or d scs )+ d a is computed using
Eq. (10).
(x) Steps (vi) to (ix) are repeated to obtain the variation of
scour depth with time.
(xi) The computations should be stopped when the value of the
shear stress in the scour hole reduces to the value of the
critical shear stress for incipient motion of cohesive sedi-
ment particles in the scour hole. This shear stress can be
computed using any appropriate relationship. However, it
7/23/2019 Influence of Cohesion on Scour Around Bridge Piers
http://slidepdf.com/reader/full/influence-of-cohesion-on-scour-around-bridge-piers 8/14
724 JOURNAL OF HYDRAULIC RESEARCH, VOL. 40, 2002, NO. 6
Fig. 4 Temporal variation of scour depth around a bridge pier in cohe-
sive sediment with PI = 0
Fig. 5 Temporal variation of scour depth around a bridge pier with PI= 0
may need minor changes because of the complex three di-
mensional flow in the scour hole as well as effects of the
slopes of the scour hole on critical shear stress.
The experimental data on scour at pier nose founded on cohesive
sediments were used for estimating the value of constant C 3 in
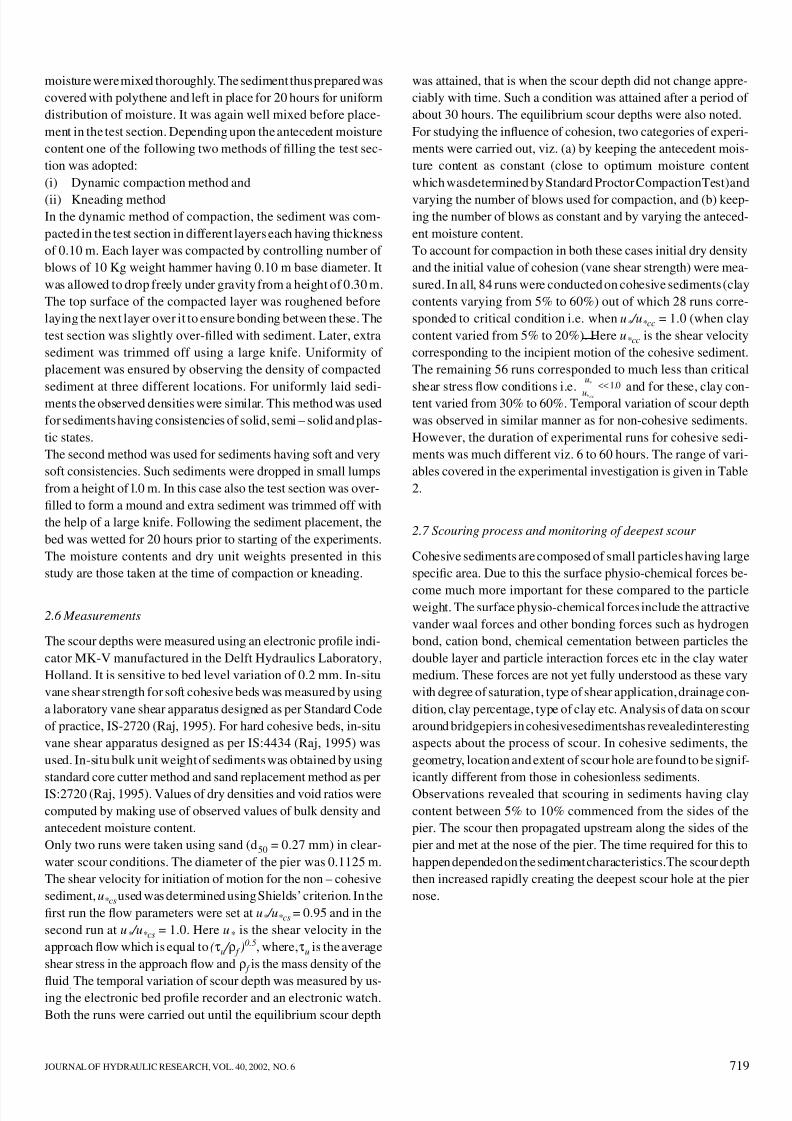
Eq. (10 a). The method of grid search was used for this purpose.
In this method, for a set of C 3 values, the scour depth was com-
puted using the proposed algorithm. Thesum of the squares of the
difference between thescour depth so computed and theobserved
scour depth at given time periods was also computed for each
selected value of C 3. The value of C 3 giving minimum sum of
squares of the error between computed and observed values of
scour is 8.0 for the condition when the maximum scour occurs at
the pier nose.
The scour depths computed using the present method are com-
pared with the observed depths in Figs. 4 and 5 for a few typical
cases. In some cases (Fig. 4 for instance) the agreement is good
whereas there are large differences in some other cases (see Fig.5). The larger difference as obtained in the initial stages of scour
activity is ascribed to the fact that for the non-plastic cohesive
sediments, the scour on pier sides is dominant in the beginning
while during the later stages the scour at the pier nose is domi-
nant. Such variation is not accounted for in the model. However,
it can be concluded from Figs. 4 and 5 (and some other figures
not shown here) that the present method is able to estimate the
maximum scour depth occurring at the pier nose reasonably satis-
factorily.
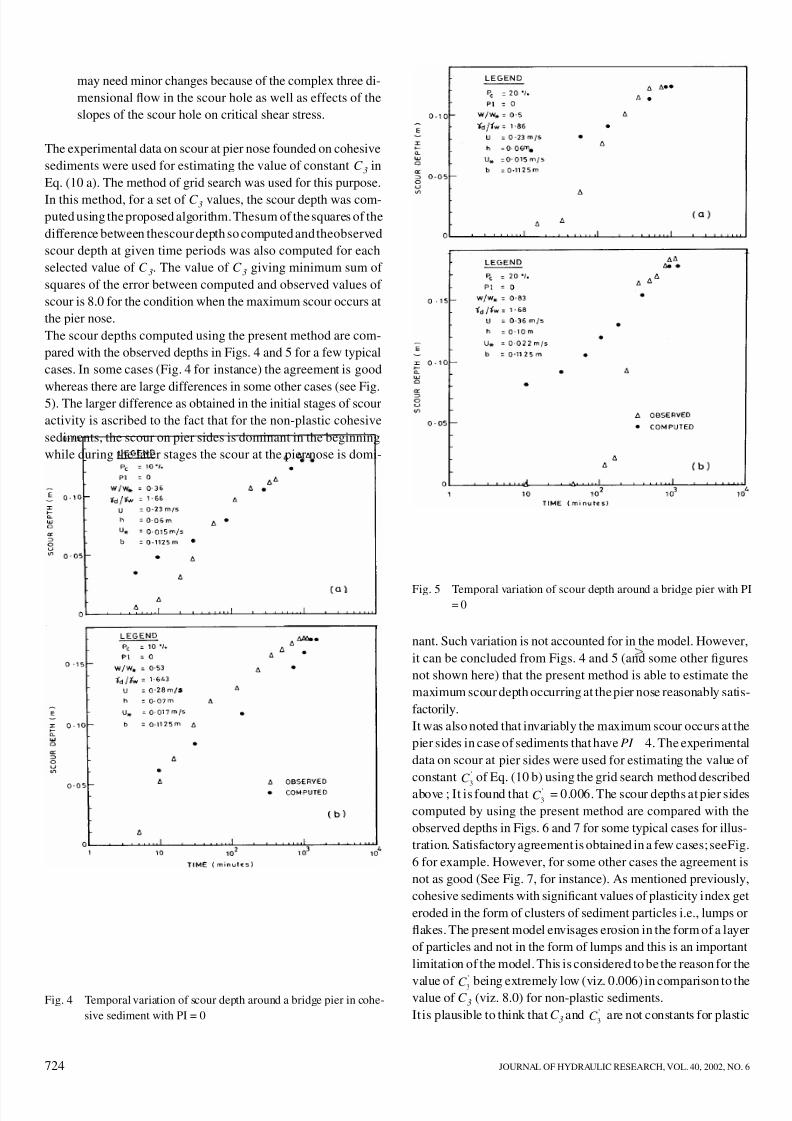
It was also noted that invariably the maximum scour occurs at the
pier sides in case of sediments that have PI 4. The experimental
data on scour at pier sides were used for estimating the value of
constant of Eq. (10 b) using the grid search method describedC 3
’
above ; It is found that = 0.006. The scour depths at pier sidesC 3
’
computed by using the present method are compared with the
observed depths in Figs. 6 and 7 for some typical cases for illus-
tration. Satisfactory agreement is obtained in a few cases; seeFig.
6 for example. However, for some other cases the agreement is
not as good (See Fig. 7, for instance). As mentioned previously,
cohesive sediments with significant values of plasticity index get
eroded in the form of clusters of sediment particles i.e., lumps or
flakes. The present model envisages erosion in the form of a layer
of particles and not in the form of lumps and this is an important
limitation of the model. This is considered to be the reason for the
value of being extremely low (viz. 0.006) in comparison to theC 3’
value of C 3 (viz. 8.0) for non-plastic sediments.
It is plausible to think that C 3 and are not constants for plasticC 3
’
7/23/2019 Influence of Cohesion on Scour Around Bridge Piers
http://slidepdf.com/reader/full/influence-of-cohesion-on-scour-around-bridge-piers 9/14
JOURNAL OF HYDRAULIC RESEARCH, VOL. 40, 2002, NO. 6 725
τcc * a s w= f (W, W , PI, e, d , , )γ γ (14)
d = f (d ,W,W , P , d , C , , , PI, , , )smc sms * c a u c s d s
φ φ γ γ ω (15)
Fig. 6 Temporal variation of scour depth around a bridge pier in cohe-
sive sediment with PI > 0 Fig. 7 Temporal variation of scour depth around a bridge pier in cohe-sive sediment with PI > 0
C P C
d
c u
s a
*
.
.=
−( )γ γ ω
(16a)
sediments but are dependent on and PI . Preliminary analysisW
W ∗did indeed indicate that such is the case but the data are too
meagre to establish a relation amongst these parameters for pre-
dictive purposes. Hence constant values of C 3 = 8.0 and
= 0.006 are recommended till the aspect of erosion in lumpsC 3
’
is fully accounted for in the model.
4 Maximum pier scour
The maximum scour depth around circular piers in cohesive sedi-
ments can be obtained by using the model for computation of
temporal variation described above as the scour depth at very
large time. However, in order to provide a working tool the analy-
sis of the data on maximum scour depth is separately carried out.
A scrutiny of the computational procedure for the temporal varia-
tion of scour depth indicates that the depth of scour in cohesive
sediments is mainly a function of τu , h, b, d a , τcc and other cohe-
sive sediment properties The variables namely τu, h, b and d a are
known to influence the depth of pier scour in cohesionless sedi-
ments also while the variables affecting τcc can be written in the
functional relationship as
Here e is the void ratio. Keeping the above in mind the following
functional form of relationship is written for maximum scour in
cohesive sediments.
Here, d smc is the maximum scour depth in cohesive sediments,
d sms is the maximum scour depth in cohesionlesssediments under
the same flow and pier conditions, Pc
is the clay content of cohe-
sive sediment in fraction, C u and φc are the cohesion and angle of
internal friction for clay at optimum moisture content, φs is the
angle of repose/internal friction for the cohesionless sediments
present in the mixture and γ d is the dry density of cohesive sedi-
ments.
The parameters Pc, C u, γ s, γ ω
, φc, φs and d a can be merged into
dimensionless parameters as below:

7/23/2019 Influence of Cohesion on Scour Around Bridge Piers
http://slidepdf.com/reader/full/influence-of-cohesion-on-scour-around-bridge-piers 10/14
726 JOURNAL OF HYDRAULIC RESEARCH, VOL. 40, 2002, NO. 6
and φ φ φ
φ*
. tan tan
tan=
+ −( )P Pc c c s
s
1(16b)
d = f (d ,W,W , C , , ,smc sms * * * d φ γ γ ω
(17)
d
d f
W
W
C smc
sms
d =
*
*
*
, ,φ
γ γ ω
(18)
d
d f
C W
W
smc
sms
=
*
* *
,φ
(19)
Fig. 8 Variation of with (PI = 0)d
d
C
0
smc
sms
*
*
0.2
i
/
W
W*
d
d
W
W
C for PI smc
sms
=
=1 51 0
0 35 0 2
. ;*
.
*
*
.
φ(20)
d
d
W
W
W
W
C f smc
sms
=−
+
6 02 10 82 5 41
2
0 2
. . .
;* *
*
*
.
φ
oor PI ≥ 4 (21)
It may be noted that in cohesive sediments which are formed by
mixture of clay, silt and sand, the terms C * and φ* are better indi-
cators of the cohesiveness of the sediment mixture because these
values are derived by giving weightages to C u and φc values ac-
cording to the fraction of clay content available in the sediment
mixture.
Thus, for given values of plasticity index Eq. (15) reduces as
The variables of Eq. (17) can be easily arranged into the follow-
ing non-dimensional form.
Such a functional relationship can be used to develop an expres-
sion for the equilibrium scour depth in cohesive sediments. The
values of d sms to be used in Eq. (18) can be determined by making
use of an appropriate equation for pier scour in cohesionless sedi-
ments. Relationship of Kothyari et al. (1992 a) is used in the pres-
ent study as it was found to produce realistic estimates of the
equilibrium scour depth in cohesionless sediments. In the func-
tional relationship for maximum scour depth in cohesive sedi-
ments (viz. Eq. (18)), the range of γ d / γ w covered by the data is
only from 1.25 to 1.89. Analysis of data indicated that variation
in γ d / γ w within this small range has no systematic influence on
the value of d smc /d sms. Therefore, the variable γ d / γ w was droppedfrom the analysis and the new functional relationship for d smc was
written as below :
This is to be mentioned here that appreciable difference is ob-
served between the scour processes of non cohesive sediments,
i. e. while PI = 0 and that of the cohesive sediments i. e. while
PI > 0. However, no data is available at present for study of scour
process while 0 < PI < 4. Analysis of the available data indicated
that d smc /d sms is proportional to for sediments havingC *
*
.
φ
0 2
PI = 0 whereas it is proportional to for cohesiveC *
*
.
φ
−0 2
sediments having PI 4. The values of d smc /d sms were also found
to vary differently with W/W * depending upon the value of PI for
cohesive sediments. Figure 8 shows the variation of
with W/W * for PI = 0. It is seen from this figure thatd
d
C smc
sms
/ *
*
.
φ
0 2
pier scour in these sediments increases with an increase in W/W *
values and the value of . Figure 9 shows the variation of C
*
*φ
with W/W * for PI 4. The mean curve drawn in thisd
d
C smc
sms
*
*
.
φ
0 2
figure is valid for 4 PI 13.
Figure 9 indicates that pier scour in cohesive sediments having
non-zero value of PI first decreases with an increase in W/W * and
after attaining the minimum value at W/W * 1.0 it starts increas-
ing with further increase in W/W *. These results are in conformitywith the findings on general transport of cohesive sediment by
Grissinger (1966). He found that the erosive rate of cohesive sedi-
ments having PI > 0, is the least when W/W * approaches unity.
The erosive rate was found to be more for smaller as well as
higher values of W/W *. The variation shown in Figs. 8 and 9 can
be expressed by the following equations.
and
As expected Eq. (21) indicates that scour depth in plastic
sediments decreases with an increase in ; the parameterC
*
*φ
is representative of the cohesive strength of the sediments.C
*
*φ
In the case of non-plastic sediments, however, d smc /d sms increases
7/23/2019 Influence of Cohesion on Scour Around Bridge Piers
http://slidepdf.com/reader/full/influence-of-cohesion-on-scour-around-bridge-piers 11/14
JOURNAL OF HYDRAULIC RESEARCH, VOL. 40, 2002, NO. 6 727
Fig. 9 Variation of with (PI > 4)d
d
C
0
smc
sms
*
*
0.2
i
/
W
W*
d
d
C PI smc
sms
=
=1 51 0
0 2
. ;*
*
.
φ(22)
d
d
C for PI smc
sms
=
≥
−
0 5 4
0 2
. ;*
*
.
φ(23)
with increase in . In these cases the clay content is ratherC
*
*φ
low (< 20%) and the clay particles are easily removed from the
scour hole and are washed away with the flow having such highshear stresses. As such, there is no increase in resistance to scour
due to cohesion. Comparison between observed values of
d smc /d sms and those computed using Eqs. (20) and (21) (not shown
here) indicated that Eq. (20) is able to estimate the maximum
scour depth with a maximum error of ± 15%, while the corre-
sponding error for Eq. (21) is ± 30%.
For use in the field conditions, one would need to know the value
of W/W * , apart from information on other parameters appearing
in Eqs. (20) and (21) during flood flows. However, for perennial
rivers and in rivers where large flows occur for long periods, satu-
ration conditions can be expected to have been reached prior to
the occurrence of flood peak and thus W/W * 1.0. For these con-
ditions Eqs. (20) and (21) reduce to the following:
and
The effect of the pier size and the flow conditions on the scourare considered to be accounted for by the term d sms.
6. Conclusions
The geometry, location andextent of the scour hole around bridge
piers are much different in cohesive sediments from those in
cohesionless sediments. A mathematical model has been devel-
oped for computation of temporal variation of scour depth in co-
hesive sediments. This model uses the characteristics of the
horseshoe vortex for scour computations following the method of
Kothyari et al. for cohesionless sediments. The shear stress under
thehorseshoe vortex hasbeen quantifiedby considering theinitial
size of the principal vortex tube of the horseshoe vortex system
at the pier sides to be approximately 0.316 times the initial size of
the vortex formed at the nose of the pier. The scheme developed
through the mathematical modelling for the computation of tem-
poral variation of scour depth in cohesive sediments is outlined.
The values of the constant C 3 and to be used in the schemeC 3
’
have been determined as 8.0 and 0.006 respectively for the sedi-
ments having PI = 0 a n d PI 4 respectively. The scheme is found
to fit the data on the temporal variation of scour depth reasonablywell.
Equations (20) and (21) have been developed for the estimation
of the maximum scour depth around a bridge pier founded in co-
hesive sediments. For the commonly obtained field conditions,
Eqs. (22) and (23) have been suggested in which full saturation
is assumed. One would need to usethese equations in conjunction
with an appropriate predictor for the maximum scour depth
around the pier in cohesionless sediments.
Notations
Ao Cross sectional area of horseshoe vortex at t = 0 As Cross sectional area of scour hole
Asd Cross-sectional area of the vortex tube at the pier side
A p Cross-sectional area of the vortex tube at the pier nose
At Cross sectional area of horseshoe vortex at time ‘t ’
B Flume width
b Diameter of circular bridge pier
C u Cohesion
C 3, CoefficientC 3
’
C * Dimensionless clay content defined as P C
d
c u
s a
.
.∆γ Dv Diameter of horseshoe vortex
d a
Arithmetic mean size of the sediment used for sand-clay
mixture
d sc Instantaneous scour depth below the original bed level in
cohesive sediment
d scn Instantaneous scour depth below the original bed level at
the pier nose in cohesive sediment
d scs Instantaneous scour depth below the original bed level at
the pier side in cohesive sediment
d sms Maximum scour depth below the bed level for pier scour
and maximum scour depth for jet scour in cohesionless
sediment
d smc Maximum scour depth below the bed level for pier scour
and maximum scour depth for jet scour in cohesive sedi-ment
h Flow depth

7/23/2019 Influence of Cohesion on Scour Around Bridge Piers
http://slidepdf.com/reader/full/influence-of-cohesion-on-scour-around-bridge-piers 12/14
728 JOURNAL OF HYDRAULIC RESEARCH, VOL. 40, 2002, NO. 6
PI Plasticity index
Pc Clay content
po,tc Average probability of movement of cohesive sediment
particles at time t
po,t Average probability of movement of sand particles at
time t
t *c Time required for singlecohesive sediment particle to get
scoured
U Average velocity of flow
U s Average value of streamwise velocity in the vortex tube
at pier nose
U p Average value of streamwise velocity in the vortex tube
at pier side
u*cs Shields’ shearvelocitycorresponding to incipient motion
of cohesionless sediment in the approach flow
u*cc Shear velocity corresponding to incipient motion of co-
hesive sediment in the approach flow
u*t Shear velocity at time t
W Antecedent moisture content (%)W P Plastic limit (%)
W * Antecedent moisture content required to saturate the soil
sample
Greek Notations
α Opening ratio B b
B
−
γ f Specific weight of fluid
γ s Specific weight of sediment
γ w Specific weight of water
∆γ s Difference in specific weights of sediment and water (γ s -γ f )
γ d ry unit weight
ρ f Mass density of fluid
ρs Mass density of sediment
τcc Critical shear stress for cohesive sediment
τ pn Shear stress at the pier nose
τ pn,t Shear stress at the pier nose at time t
τ ps,t Shear stress at the pier side at time t
τu Shear stress in approach flow
φs Angle of repose or internal friction for sand
φsc
Slope of the scour hole occurred at pier nose in cohesive
sediment
φc Angle of reposeor internal friction for cohesive sediment
References
Ahmed, F. and Rajaratnam, N. (1998) Flow around bridge
piers J. Hyd. Engg., A.S.C.E., Vol. 124, No. 3, March pp. 288-
299.
Ansari, S.A. (1999). Influence of cohesion on local scour. Ph.D.
Thesis, Department of Civil Engineering, University of
Roorkee, Roorkee, India.
Baker, C.J. (1981). New design equation for scour aroundbridge piers. J. of Hydraulic Division, A.S.C.E., Vol. 107, HY-
4.
Chabert, J . a n d Engeldinger, P. (1956). Etude des
affouillementsautourdespilesdespoints.LaboratorieNational
d’Hydraulique, Chatou, France.
Chiew, Y.M. and Melville, B.M. (1987). Local scour around
bridge piers. J. of Hydraulic Reserach, I.A.H.R., Vol. 25, No.1.
Ettema, R. (1980). Scour at bridge piers. Report No. 216, Dept.
of Civil Engg., Univ. of Auckland, Auckland, New Zealand.
Graf, W.H. and Yulistiyanto (l998). Experiments on flow
around a cylinder the veolocity and vorticity fields. J. Hydrau-
lic Research, I.A.H.R., Vol. 36, No. 4, pp. 637-653.
Grissinger, E. H. (1966). Resistance of selected clay systems
to erosion by water.J. Water Resources Research, Vol.1, No.1,
pp.131-139.
HEC-18 (1991). Evaluating scourat bridges. Hydraulic Engineer-
ing Circular No. 18, Federal Highway Adminstration (FHWA),
USDOT, Washington, D.C.
Hjorth, P. (1975). Studies on the nature of local scour. Dept. of
Water Resources Engg., University of Lund, Bulleting No. 46.
Jain
,S.C.(1981).Maximumclear-waterscouraroundcylindricalpiers. J. of Hydraulic Div., A.S.C.E., Vol. 107, HY-5, pp. 611-
626.
Kand, C.V. (1993). Pier scour in sand, clay and boulders. Bridge
Engineering (India)Vol. IX and X.
Kothyari, U.C., Garde,R.J.andRangaRaju, K.G. (1992 a).
Temporal variation of scour around circular bridge piers. J. of
Hydraulic Engg., A.S.C.E., Vol. 118, No. 8, Aug., pp. 1091-
1105.
Kothyari,U.C.,Garde,R.J.andRangaRaju, K.G. (1992 b).
Live-bed scour around cylindrical bridge piers. J. of Hydralic
Research, I.A.H.R., Vol. 30, No. 5, pp. 701-715.
Laursen, E.M. and Toch, A. (1956). Scour around bridge piersand abutments. Bull. No. 4, Iowa Highway Research Board,
U.S.A., May.
Melville, B.W. (1975). Local scour at bridge sites. Report No.
117, Univ. of Auckland, School of Engg., Auckland, New Zea-
land.
Melville, B.W. and Sutherland, A.J. (1988). Design
method for local scour at bridge piers. J. of Hydraulic Engg.,
A.S.C.E., Vol. 114, No. 10, pp. 1210-1226.
Melville, B.W. and Chiew, Y.M. (1999). Time Scale for Lo-
cal Scour at Bridge Piers, J. of Hydraulic Engg., A.S.C.E., Vol.
125, No. January, pp. 59-65.
Nakagawa, H. and Suzuki, K. (1975). An application of
stochastic model of sediment motion of local scour around a
bridge pier. Proc. 16th Congress, I.A.H.R., Sao Paulo, Brazil,
Vol, 2, pp. 228-235.
Namjoshi, A . G. (1 99 2 ). A n tic ip a te d s c ou r d e pth in
nonalluvial/clayey beds. Proc. of International Seminar on
Bridge Structure and Foundations. Conference Documentation
3, Vol. 2.
Paintal, A.S. (1971). A stochastic model of bed load transport.
J. Hyd. Res., I.A.H.R., Vol. 9, No. 4.
Qadar, A. (1981). The vortex scour mechanism at bridge piers.
Proceedings of Institution of Civil Engineers, Vol. 71, Pt. 2.Raj, P.P. (1995), Geotechnical Engineering, Tata McGraw-Hill
Publishing Company Limited, New Delhi, India.

7/23/2019 Influence of Cohesion on Scour Around Bridge Piers
http://slidepdf.com/reader/full/influence-of-cohesion-on-scour-around-bridge-piers 13/14
JOURNAL OF HYDRAULIC RESEARCH, VOL. 40, 2002, NO. 6 729
Raudkivi, A.J. (1988). Functional trends of scour at bridge
piers. J. of Hydraulic Engg., A.S.C.E., Vol 112, No. 1, pp. 1-
13.
Raudkivi, A.J. (1990). Loose boundary hydraulics. 3rd Edition,
Pergamon Press, Chap. 9, New York, U.S.A.
Raudkivi, A.J. and Ettema, R. (1983). Clear-water scour at
cylindricla piers. J. of Hydraulic Div., A.S.C.E., Vol. 109, No.
10, pp. 338-350.
Shen, H.W., Schneider, V.R. and Karaki, S. (1969). Local
scour around bridge pers. J. of Hydraulic Div., A.S.C.E., Vol.
95, No. 6, pp. 1919-1940.
Weir A. H., Oremerod, E. C. and Ei – Mansey, M. I. (1975).
Clay Minerology of Sediments of the Western Nile Delta, Clay
Mineralogy, Vol. 10, pp. 369 –386.
Yalin, M.S. and Karahan, E. (1979). Inception of sediment
transport. J. Hyd. Div., A.S.C.E., Vol. 105, Hy-11, November.
Yanmaz, M.A. and Altinbilek, H.D. (1991). Study of time
dependent local scour around bridge piers. J. of Hydraulic
Engg., A.S.C.E. Vol. 117, No. 10, Oct., pp. 1247-1263.

7/23/2019 Influence of Cohesion on Scour Around Bridge Piers
http://slidepdf.com/reader/full/influence-of-cohesion-on-scour-around-bridge-piers 14/14


