Download - Inflamação nut desp 13_versão slide share
Nutrição no Exercício Físico e Desporto Pedro Carrera Bastos, 2013
INFLAMAÇÃO NO DESPORTO
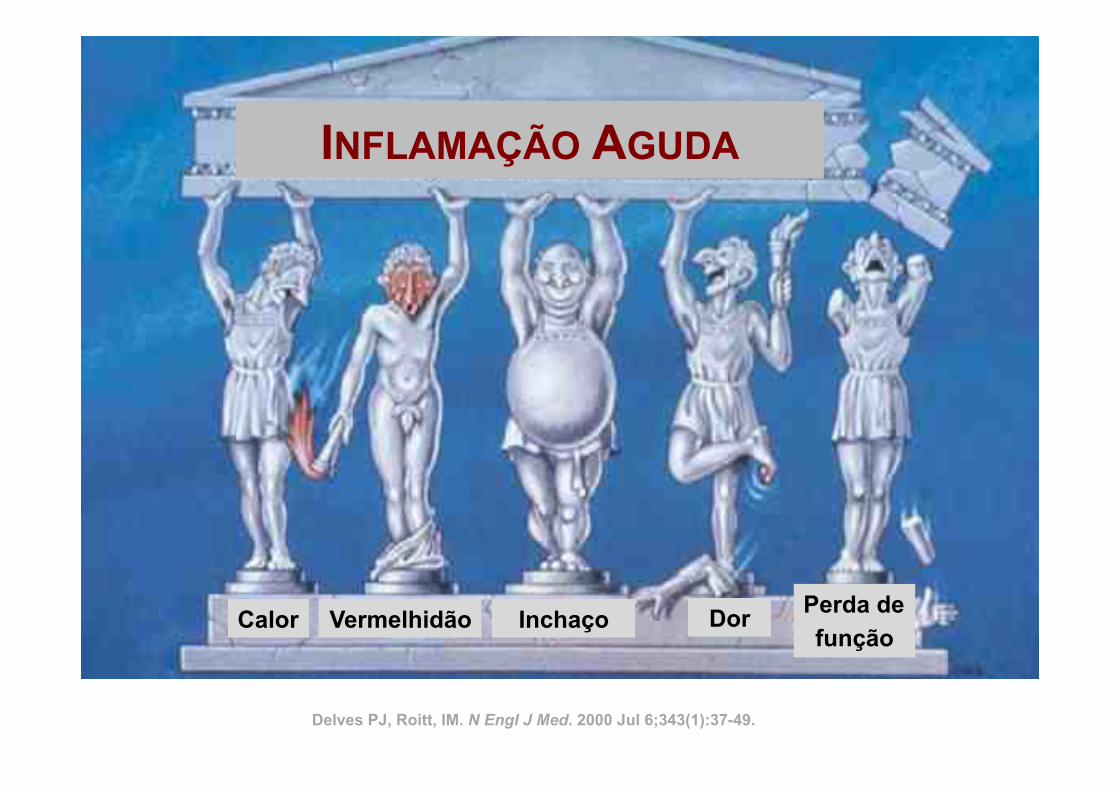
INFLAMAÇÃO AGUDA
Delves PJ, Roitt, IM. N Engl J Med. 2000 Jul 6;343(1):37-49.
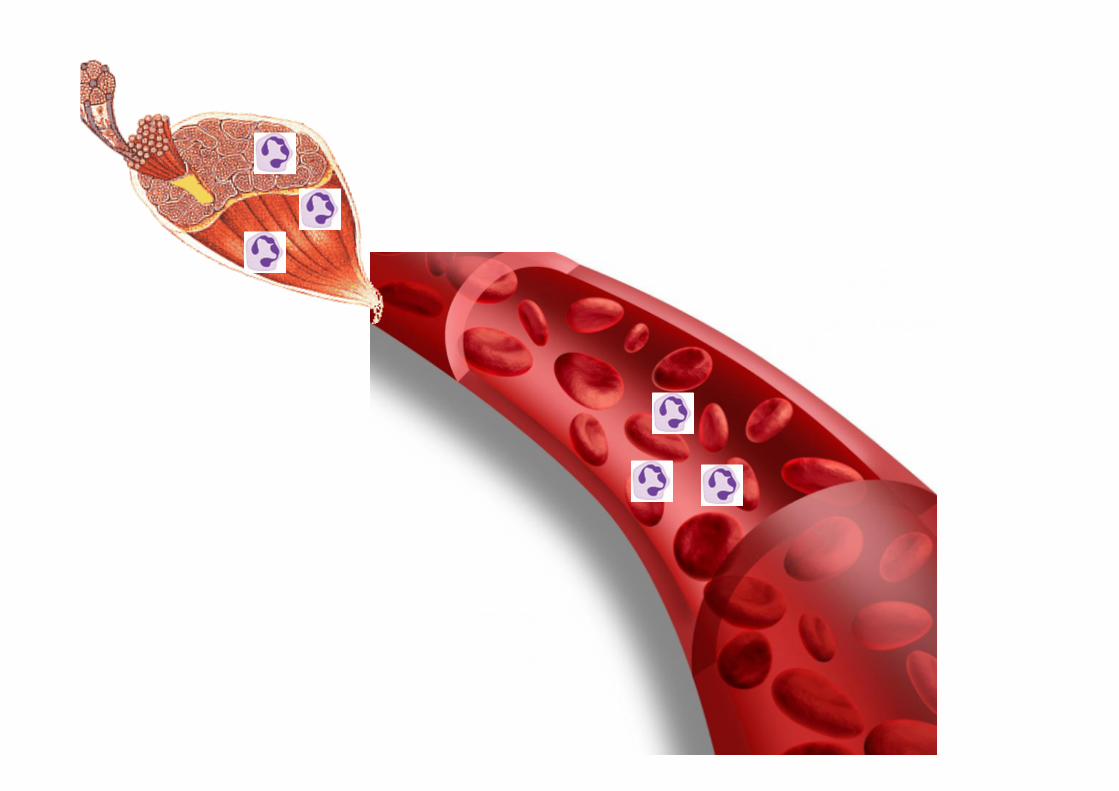
Calor Vermelhidão Inchaço Dor Perda de função
P1: JZPc01 BLBK217-Frayn November 30, 2009 13:31 Printer Name: Yet to Come
24 The Underlying Principles of Human Metabolism
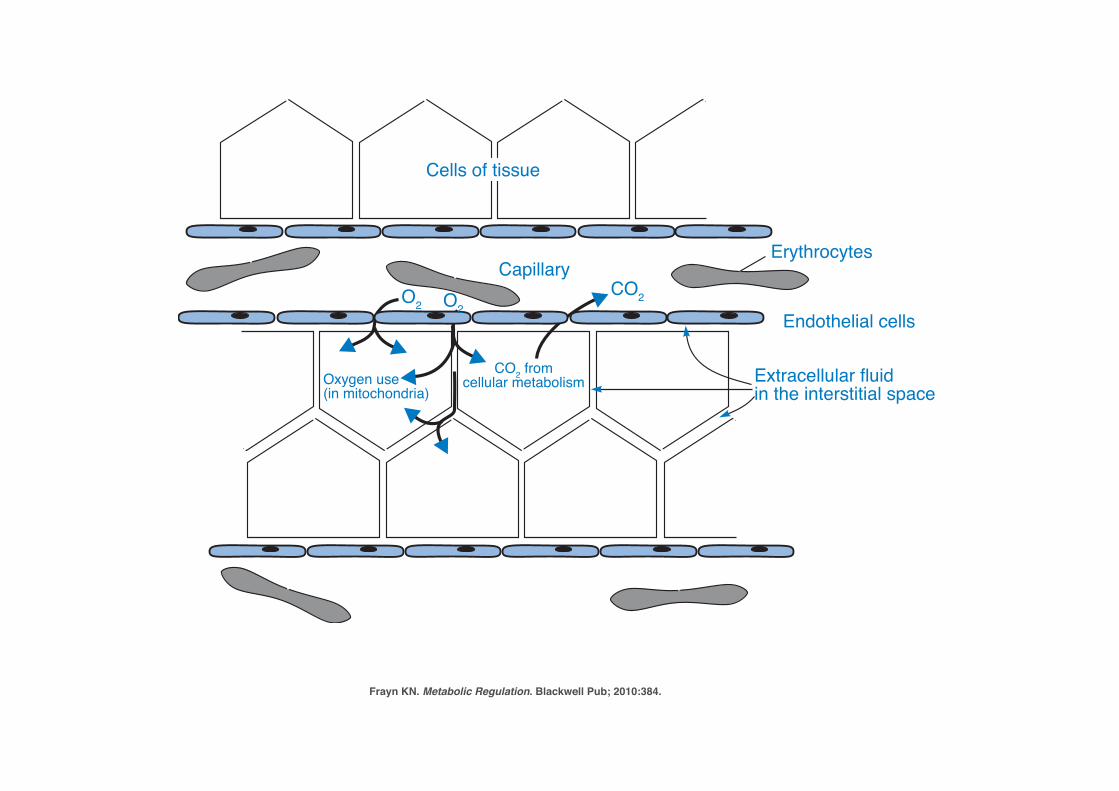
Cells of tissue
O2 O2CO2
CO2 fromcellular metabolismOxygen use
(in mitochondria)
Capillary
Endothelial cells
Erythrocytes
Extracellular fluidin the interstitial space
Figure 1.12 Diffusion of chemical substances through the interstitial fluid. A typicaltissue is shown (schematically) in cross-section. The diffusion of oxygen from erythrocytes to cells in thetissue is shown as an example. Oxygen diffuses down a concentration gradient, from the erythrocytes,via the plasma and the interstitial fluid, into the cells, where its concentration is depleted as it is usedin mitochondrial oxidation. CO2 diffuses back to the plasma in the same way. The interstitial fluidoccupies the space between cells known as the extracellular space; this is not a true empty space, butin reality is occupied by glycoproteins and other molecules joining the cells. Nevertheless, it offers apath for diffusion of substances.
The bloodstream is the major means of carrying substances from one tissue toanother – for instance, it carries non-esterified fatty acids liberated from adiposetissue to other tissues where they will be oxidized, and it carries hormones fromendocrine organs to their target tissues. The term the circulation is often used tomean ‘the bloodstream’; we speak of a substance being carried in the circulation,or even of circulating glucose (for instance), meaning glucose in the bloodstream. Inthe metabolic diagrams used extensively later in this book, the clear area in whichdifferent organs and tissues sit is meant to represent the bloodstream, and it may beassumed that substances will be efficiently carried across these blank spaces from onetissue to another.
1.3.2 Blood, Blood Plasma and SerumThe blood itself is an aqueous environment, consisting of the liquid plasma – a solu-tion of salts, small organic molecules such as glucose and amino acids, and a varietyof peptides and proteins – and the blood cells, mostly red blood cells (erythrocytes).The erythrocyte membrane is permeable to, or has carriers for, some molecules but
Frayn KN. Metabolic Regulation. Blackwell Pub; 2010:384.
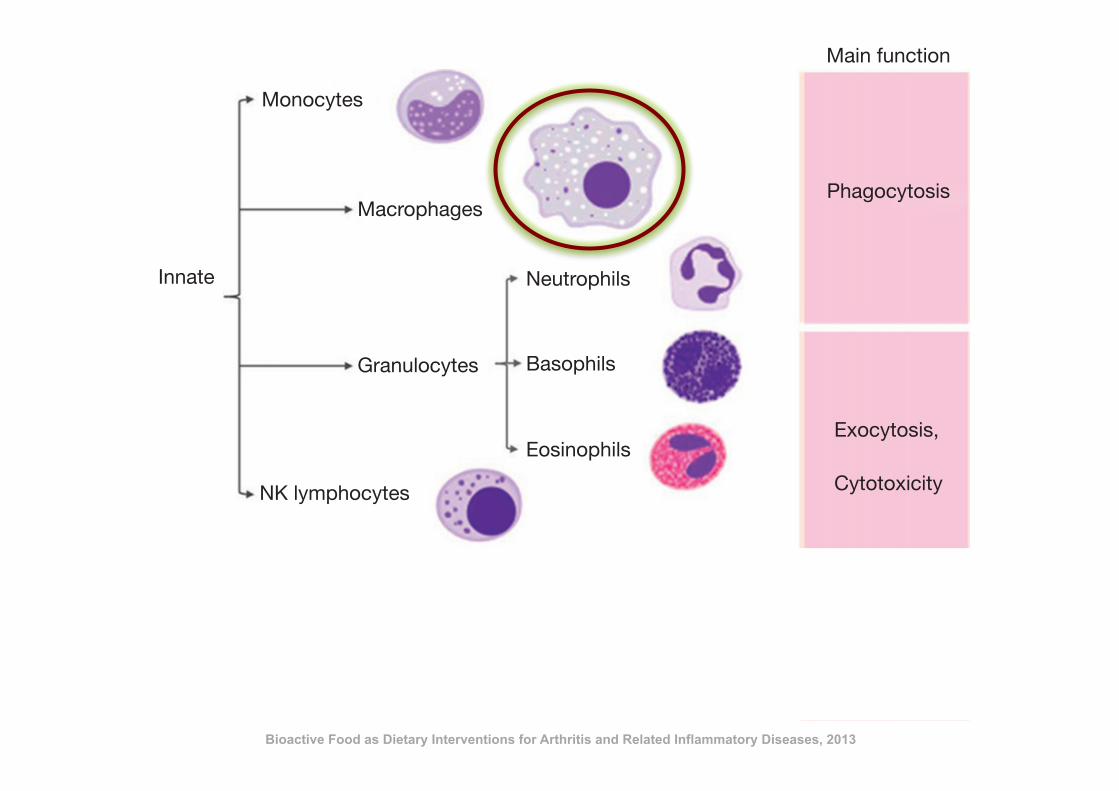
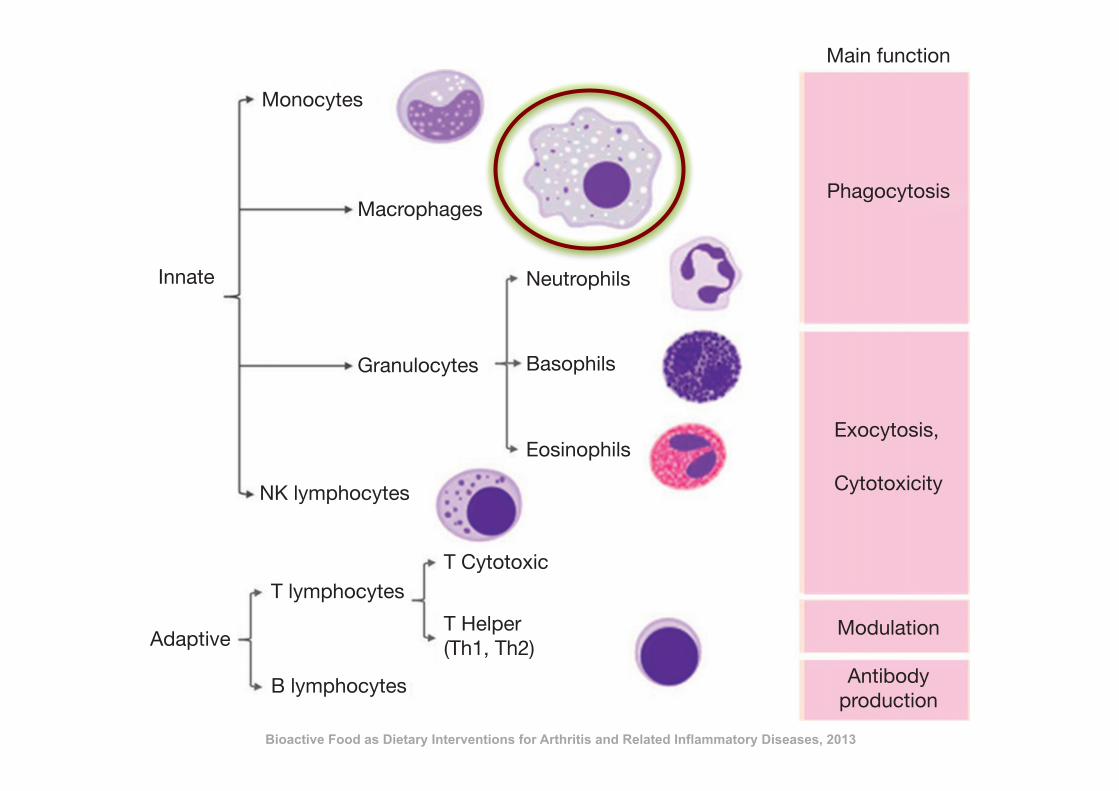
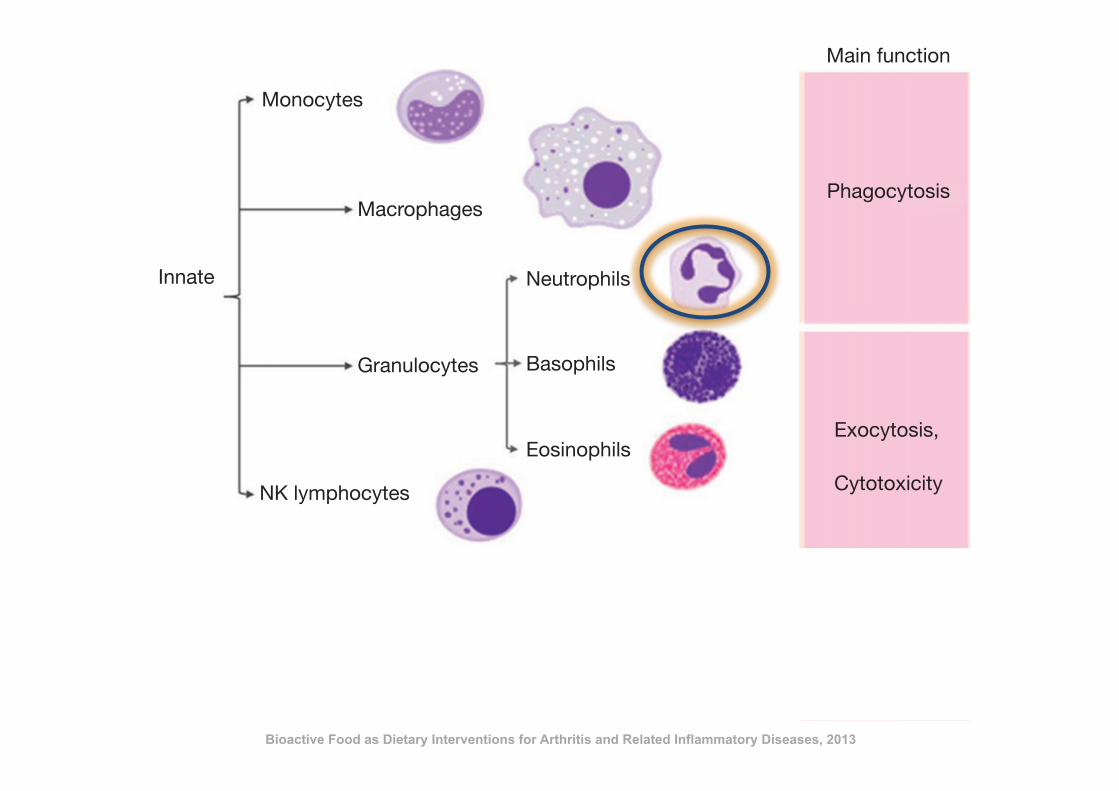
immune response is required. This response is more complex and sophisticated and its key
feature is to be specifically effective for those antigens that triggered the response. The adap-
tive response is mainly mediated by lymphocytes and classified into two types: humoral and
cellular. In general terms, the humoral response involves mainly B lymphocytes while T
cells are in charge of the cell-mediated immune response (Figure 10.1). Both responses
are linked and together result in a highly effective antigen-driven specific immune re-
sponse. T helper (Th) lymphocytes are characterized by their capacity to produce cytokines
and participate in the initiation and development of the immune response. Th1 cells pro-
mote the cell-mediated response while Th2 stimulate the humoral response. Several dis-
eases are related to the inadequate activation or activity of the immune responses, and
they appear to be associated with inappropriate bias towards either Th1 or Th2 re-
sponses. It must be mentioned that a genetic predisposition exists for this bias, and it
is commonly linked to antigen-presentation sensitive genes.
1.2 Immune-Related DiseasesAlthough there are plenty of factors involved in the etiology of disease, most conditions
are related to the immune system, they frequently being infectious, inflammatory, or
autoimmune processes. Infectious diseases are caused by viruses, bacteria, parasites,
Macrophages
Monocytes
Innate
Main function
Phagocytosis
Exocytosis,
Cytotoxicity
Modulation
Antibodyproduction
Adaptive
Basophils
Eosinophils
T CytotoxicT lymphocytes
B lymphocytes
T Helper(Th1, Th2)
Neutrophils
Granulocytes
NK lymphocytes
Figure 10.1 Cellular components of the immune system and their main functions.
146 J. Romeo et al.
Bioactive Food as Dietary Interventions for Arthritis and Related Inflammatory Diseases, 2013
immune response is required. This response is more complex and sophisticated and its key
feature is to be specifically effective for those antigens that triggered the response. The adap-
tive response is mainly mediated by lymphocytes and classified into two types: humoral and
cellular. In general terms, the humoral response involves mainly B lymphocytes while T
cells are in charge of the cell-mediated immune response (Figure 10.1). Both responses
are linked and together result in a highly effective antigen-driven specific immune re-
sponse. T helper (Th) lymphocytes are characterized by their capacity to produce cytokines
and participate in the initiation and development of the immune response. Th1 cells pro-
mote the cell-mediated response while Th2 stimulate the humoral response. Several dis-
eases are related to the inadequate activation or activity of the immune responses, and
they appear to be associated with inappropriate bias towards either Th1 or Th2 re-
sponses. It must be mentioned that a genetic predisposition exists for this bias, and it
is commonly linked to antigen-presentation sensitive genes.
1.2 Immune-Related DiseasesAlthough there are plenty of factors involved in the etiology of disease, most conditions
are related to the immune system, they frequently being infectious, inflammatory, or
autoimmune processes. Infectious diseases are caused by viruses, bacteria, parasites,
Macrophages
Monocytes
Innate
Main function
Phagocytosis
Exocytosis,
Cytotoxicity
Modulation
Antibodyproduction
Adaptive
Basophils
Eosinophils
T CytotoxicT lymphocytes
B lymphocytes
T Helper(Th1, Th2)
Neutrophils
Granulocytes
NK lymphocytes
Figure 10.1 Cellular components of the immune system and their main functions.
146 J. Romeo et al.

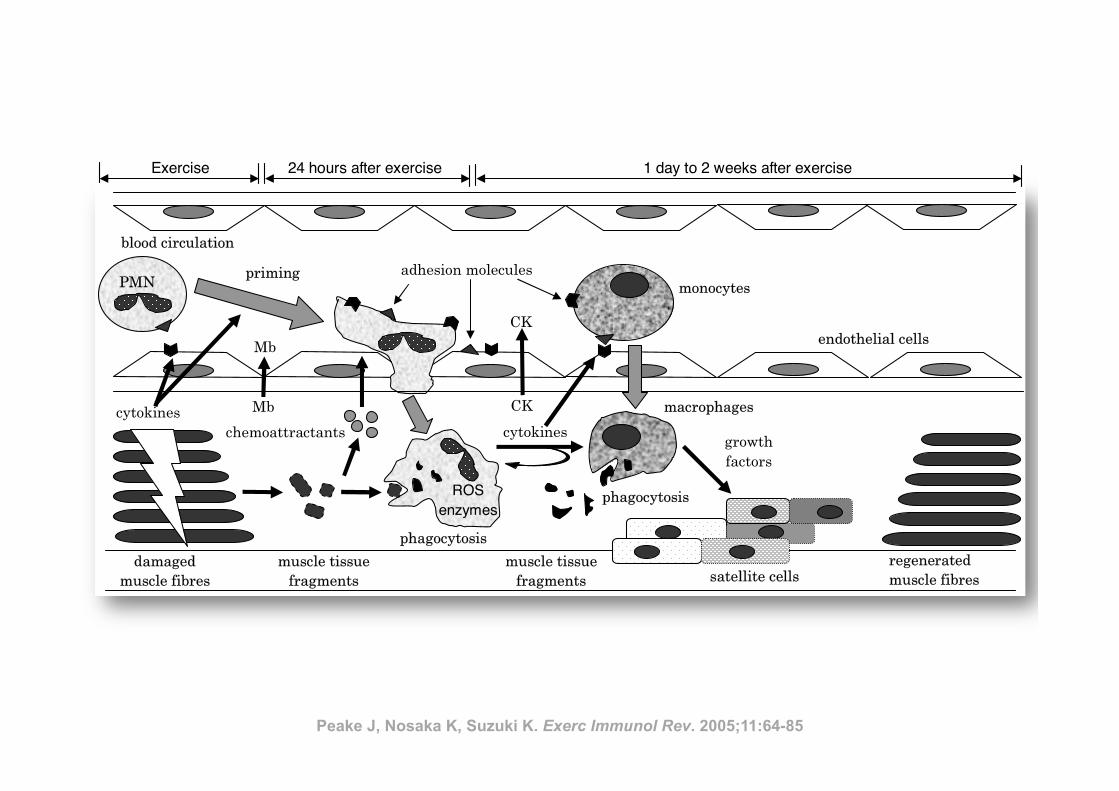
Inflamm
ation and eccentric exercise • 77
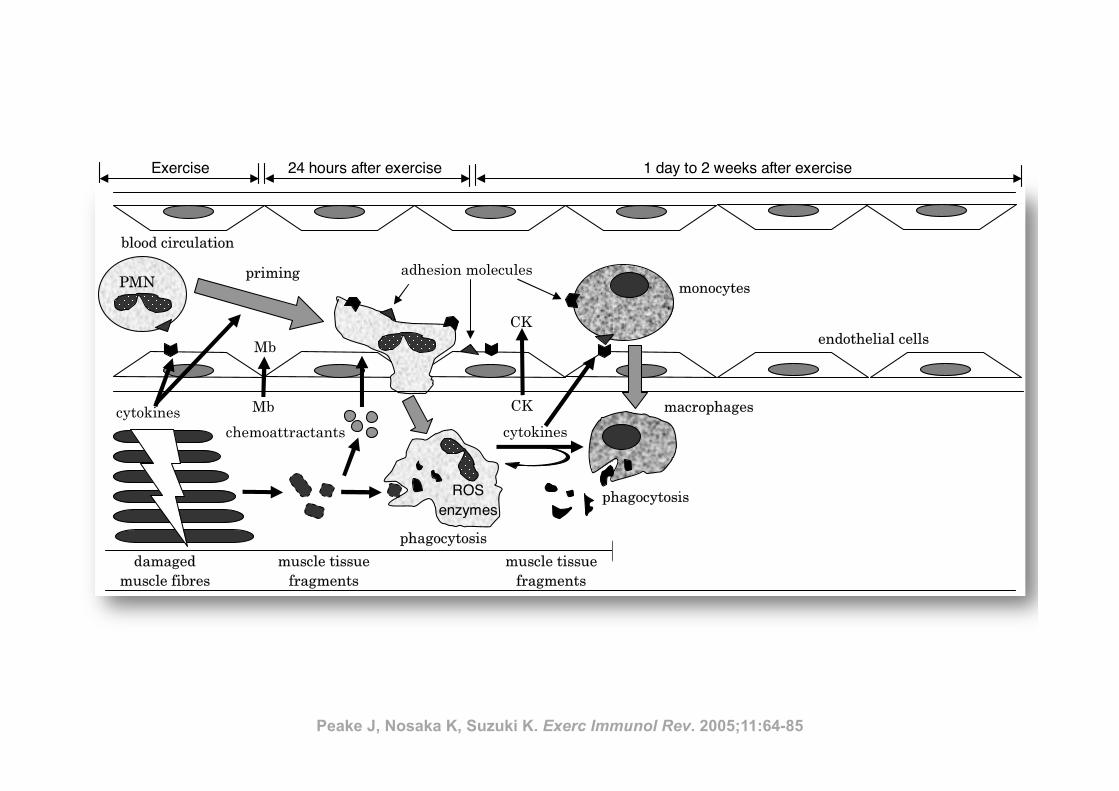
Figure 1 Exercise-induced muscle damage and subsequent muscle inflammation and regeneration process
(PMN, polymorphonuclear leucocyte; Mb, myoglobin; CK, creatine kinase; ROS, reactive oxygen species)
PMN
satellite cellsregenerated
muscle fibres
Recovery
• proliferation of satellite cells
• acquisition of protective effect
After exercise
• leukocyte infiltration
• inflammation
During exercise
mechanical damage to muscle
tissue
monocytes
macrophages
growth
factors
cytokines
phagocytosis
cytokines
chemoattractants
priming
damaged
muscle fibres
ROS enzymes
muscle tissue
fragments
CK
CK
Mb
Mb
muscle tissue
fragments
phagocytosis
adhesion molecules
endothelial cells
blood circulation
Exercise 24 hours after exercise 1 day to 2 weeks after exercise
Inflamm
ation and eccentric exercise • 77
Figure 1 Exercise-induced muscle damage and subsequent muscle inflammation and regeneration process
(PMN, polymorphonuclear leucocyte; Mb, myoglobin; CK, creatine kinase; ROS, reactive oxygen species)
PMN
satellite cellsregenerated
muscle fibres
Recovery
• proliferation of satellite cells
• acquisition of protective effect
After exercise
• leukocyte infiltration
• inflammation
During exercise
mechanical damage to muscle
tissue
monocytes
macrophages
growth
factors
cytokines
phagocytosis
cytokines
chemoattractants
priming
damaged
muscle fibres
ROS enzymes
muscle tissue
fragments
CK
CK
Mb
Mb
muscle tissue
fragments
phagocytosis
adhesion molecules
endothelial cells
blood circulation
Exercise 24 hours after exercise 1 day to 2 weeks after exercise
Peake J, Nosaka K, Suzuki K. Exerc Immunol Rev. 2005;11:64-85
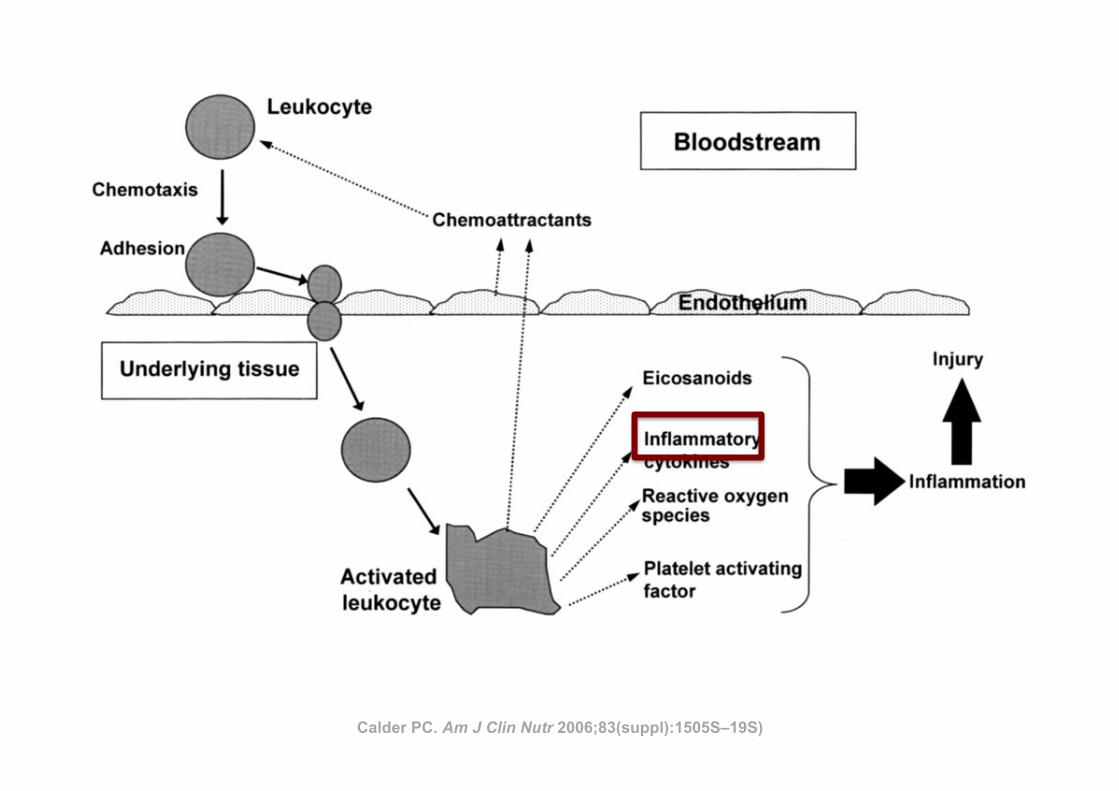
bowel disease. Chronic overproduction of TNF-! and IL-1 cancause adipose tissue and muscle wasting and loss of bone massand may account for alterations in body composition and tissueloss seen in inflammatory diseases and in cancer cachexia. Aswell as its clear and obvious association with classic inflamma-tory diseases, inflammation is now recognized to play an impor-tant role in the pathology of other diseases, such as cardiovas-cular disease and neurodegenerative diseases of aging.Additionally, the realization that adipose tissue is a source ofinflammatory cytokines has given rise to the notion that obesity,the metabolic syndrome, and type 2 diabetes have an inflamma-tory component.
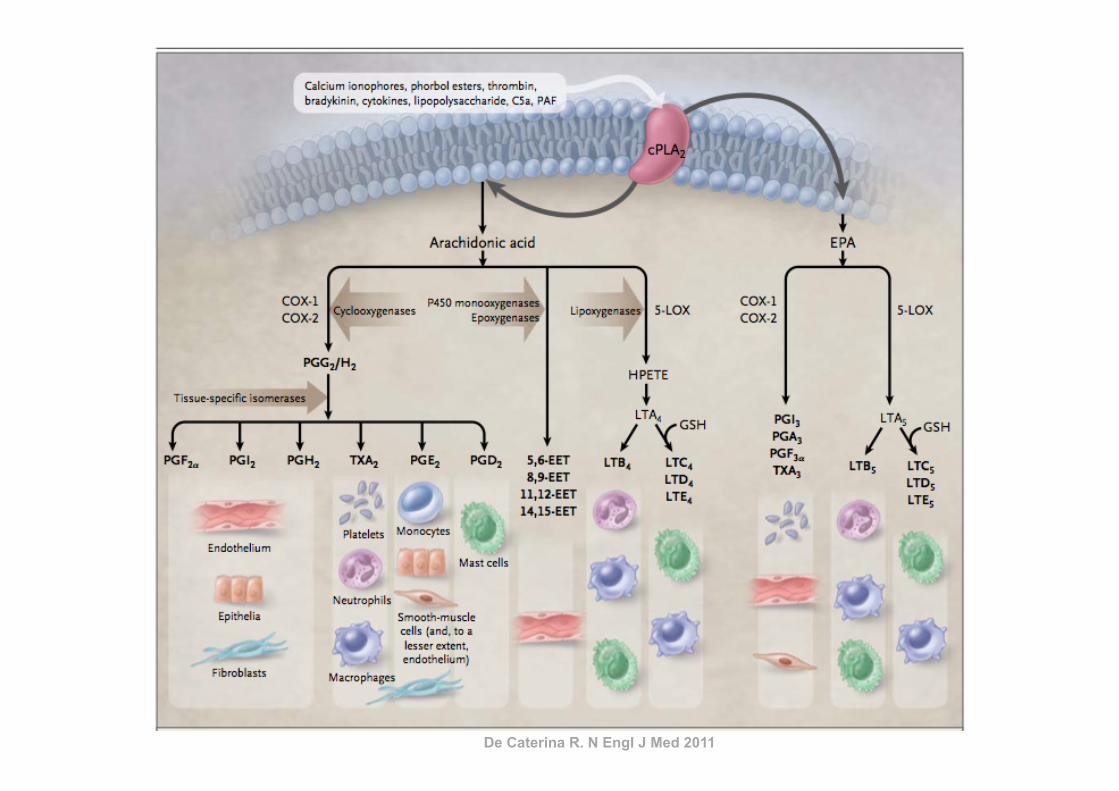
ARACHIDONIC ACID–DERIVED EICOSANOIDS ANDINFLAMMATION
The key link between polyunsaturated fatty acids (PUFAs)and inflammation is that eicosanoids, which are among the me-diators and regulators of inflammation, are generated from 20-carbon PUFAs. Because inflammatory cells typically contain ahigh proportion of the n!6 PUFA arachidonic acid (20:4n!6)and low proportions of other 20-carbon PUFAs, arachidonic acidis usually the major substrate for eicosanoid synthesis. Eico-sanoids, which include PGs, thromboxanes, leukotrienes (LTs),and other oxidized derivatives, are generated from arachidonicacid by the metabolic processes summarized in Figure 3. Eico-sanoids are involved in modulating the intensity and duration ofinflammatory responses (see references 2 and 3 for reviews),have cell- and stimulus-specific sources, and frequently haveopposing effects (Table 1). Thus, the overall physiologic (orpathophysiologic) outcome will depend on the cells present, thenature of the stimulus, the timing of eicosanoid generation, theconcentrations of different eicosanoids generated, and the sen-sitivity of the target cells and tissues to the eicosanoids generated.Recent studies have shown that PGE2 induces cyclooxygenase 2(COX-2) in fibroblasts cells and so up-regulates its own produc-tion (5), induces the production of IL-6 by macrophages (5),inhibits 5-lipoxygenase (5-LOX) and so decreases production ofthe 4-series LTs (6), and induces 15-LOX and so promotes theformation of lipoxins (6, 7), which have been found to haveantiinflammatory effects (8, 9). Thus, PGE2 possesses both pro-and antiinflammatory actions (Table 1).
FIGURE 1. The role of inflammatory cells and mediators in regulating the whole-body metabolic and immunologic responses to infection and injury.Modified from reference 1 with permission from the American Oil Chemists’ Society.
FIGURE 2. Diagrammatic representation of the movement of leukocytesthrough the endothelium and the subsequent generation of inflammatorymediators.
1506S CALDER
by on September 23, 2007
ww
w.ajcn.org
Dow
nloaded from
Calder PC. Am J Clin Nutr 2006;83(suppl):1505S–19S)
P1: JZPc01 BLBK217-Frayn November 30, 2009 13:31 Printer Name: Yet to Come
The Chemistry of Food – and of Bodies 11
Aqueous (polar) environment outside cell
Phospholipid molecule Intrinsic protein
(e.g. sugar carrier,hormone receptor)
Cholesterolmolecules
Non-polar(hydrophobic)
regionwithin
membrane
Aqueous (polar) environment inside cell
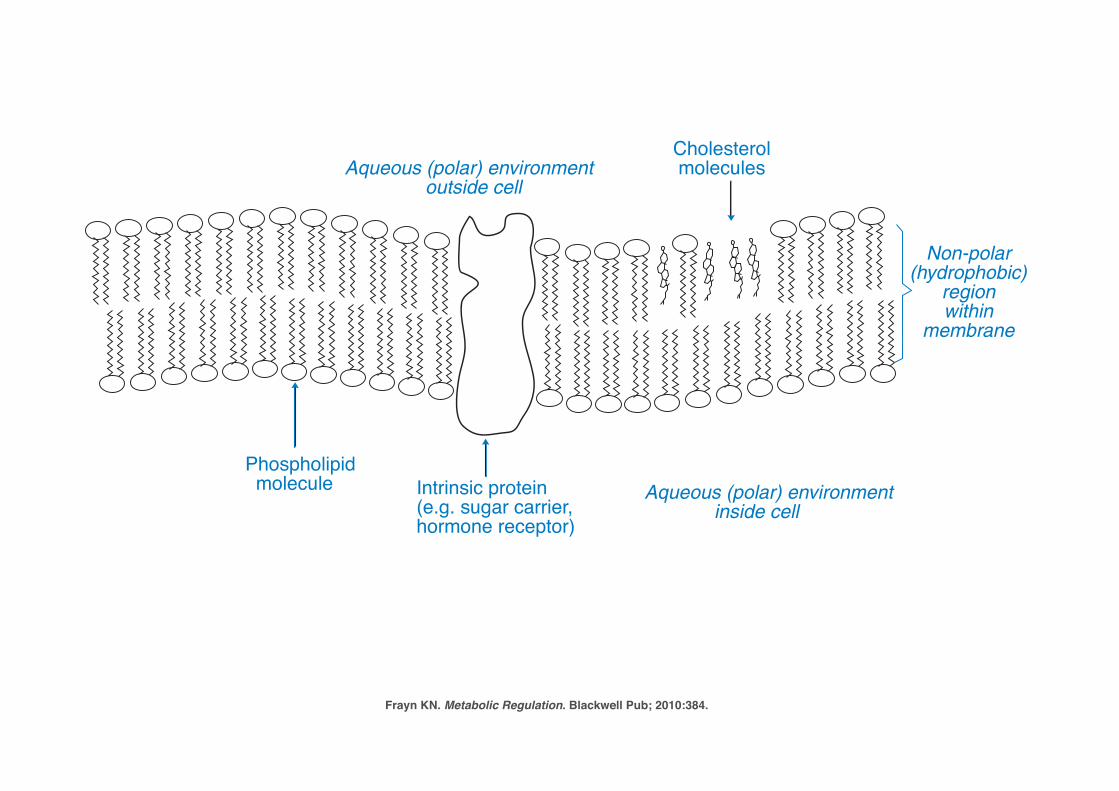
Figure 1.5 Structure of biological membranes in mammalian cells. Cell membranesand intracellular membranes such as the endoplasmic reticulum are composed of bilayers of phos-pholipid molecules with their polar head-groups facing the aqueous environment on either side andtheir non-polar ‘tails’ facing inwards, forming a hydrophobic center to the membrane. The membranealso contains intrinsic proteins such as hormone receptors, ion channels, and sugar transporters, andmolecules of cholesterol which reduce the ‘fluidity’ of the membrane. Modern views of cell mem-brane structure emphasize that there are domains, known as ‘rafts,’ in which functional proteinsco-locate, enabling interactions between them. These lipid rafts are characterized by high concentra-tions of cholesterol and of certain phospholipids (glycosphingolipids): see Further Reading for moreinformation.
CH3CH3
CH3
HO
CH3
H C3
Cholesterol
A typical cholesteryl ester (cholesteryl oleate)
Figure 1.6 Cholesterol and a typical cholesteryl ester (cholesteryl oleate). In the struc-ture of cholesterol, not all atoms are shown (for simplicity); each ‘corner’ represents a carbon atom,or else ---CH or ---CH2. Cholesterol itself has amphipathic properties because of its hydroxyl group,but when esterified to a long-chain fatty acid the molecule is very non-polar.
Frayn KN. Metabolic Regulation. Blackwell Pub; 2010:384.
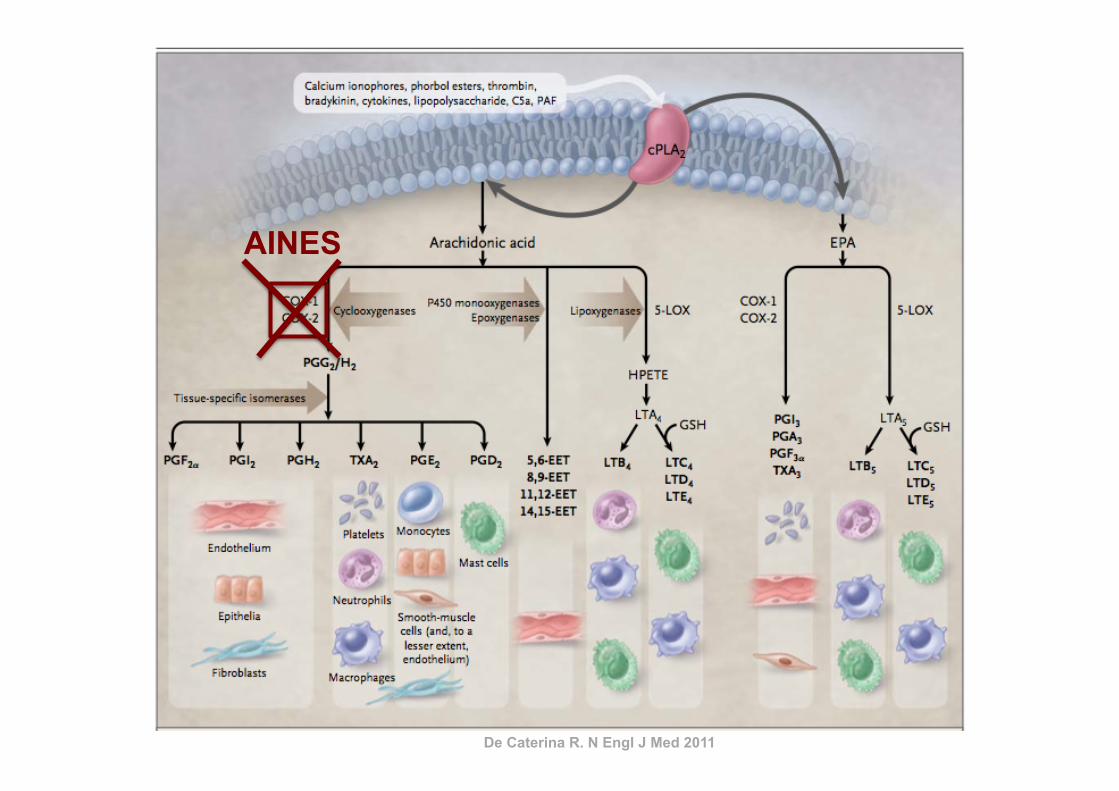
De Caterina R. N Engl J Med 2011
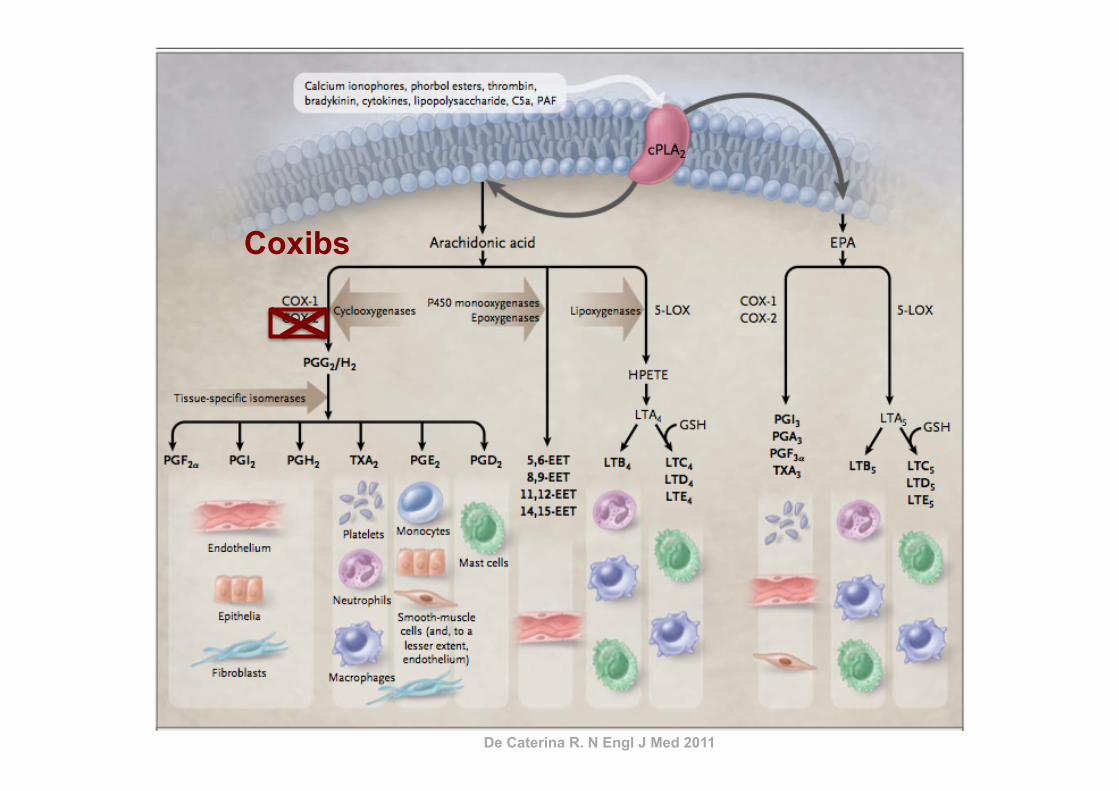
De Caterina R. N Engl J Med 2011
AINES
De Caterina R. N Engl J Med 2011
Coxibs
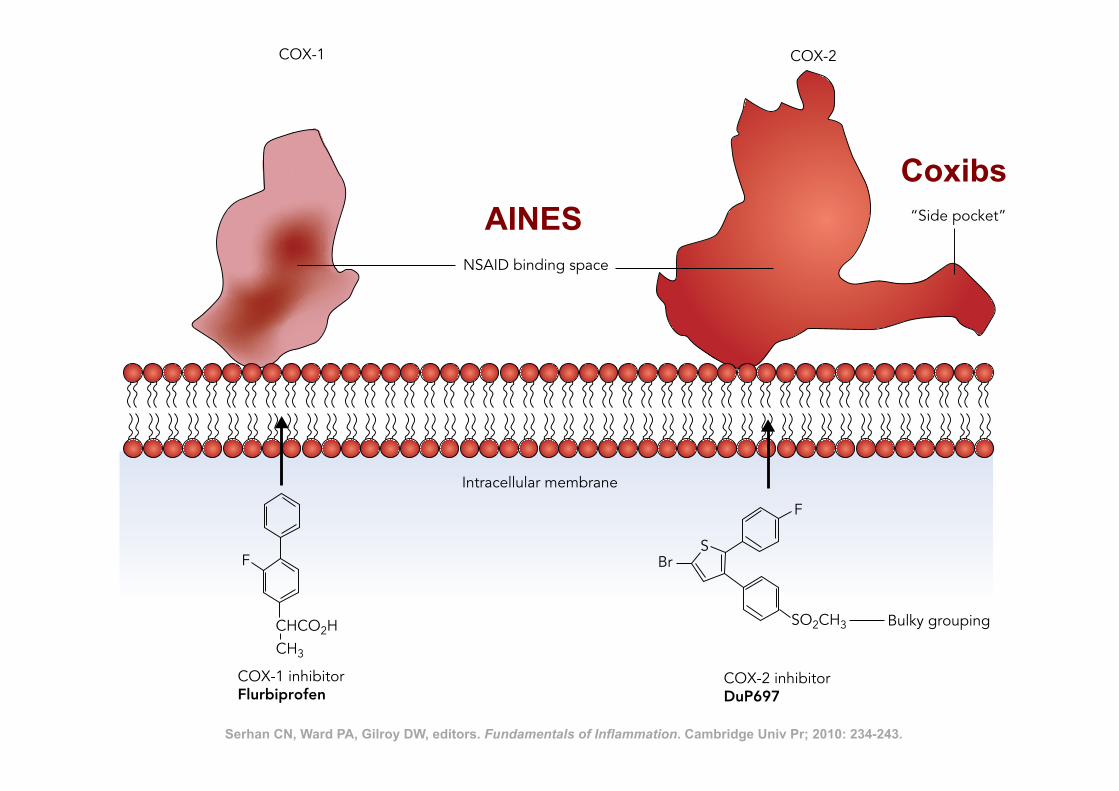
Nonsteroidal Anti-Inflammatory Drugs 241
possible expression in these species. A COX-1 variant, which may be related, is involved in thermoregulation in normothermic animals. Whilst being a weak anti-inflammatory drug, paracetamol produced the same effect as NSAIDs at the latter phase of acute inflamma-tion, in that it prevented resolution of the inflamma-tory reaction (our unpublished observations).
SUMMARY
The NSAID field has undergone major transformation since the mechanism of action of these drugs was dis-covered, but what of the future? At the time of writing, the unique role of COX-2 selective inhibitors in therapy remains to be fully clarified and the propensity of the entire range of NSAIDs to cause hypertension requires elucidation. It is ironic that the precise mechanism of paracetamol action continues to elude us, as indeed does the mechanism of action of salicylate itself which is the major metabolite of aspirin and which has anti-inflammatory actions in its own right. Clearly there is
PARACETAMOL
Whilst it is an excellent analgesic and antipyretic, the anti-inflammatory activity of paracetamol is very low and seems to be restricted to a few special cases (e.g., inflammation following dental extraction). As already mentioned paracetamol potently reduced prostaglandin synthesis in the central nervous sys-tems (CNS), but not in the periphery. In experimental animals, analgesia and antipyresis with paracetamol were accompanied by the reduction in prostaglandin synthesis in the CNS. As paracetamol is a weak inhibi-tor of COX-1 and COX-2 activities, its pharmacologi-cal actions cannot be explained by inhibition of these enzymes. COX-3 identified as a splice variant of COX-1 in 2002 in canine tissues was shown to be inhibited by paracetamol. It was thus hoped that the discovery of COX-3 might provide a neat explanation for its phar-macological actions. However, the existence of COX-3 in rodent and human tissues is disputed because reten-tion of intron-1 results in an out-of-reading frame sequence, despite some evidence in the literature on its
F
CHCO2HCH3
BrS
F
SO2CH3 Bulky grouping
COX-1 inhibitorFlurbiprofen
COX-2 inhibitorDuP697
Intracellular membrane
NSAID binding space
COX-1 COX-2
“Side pocket”
Figure 18.2. Serhan CN, Ward PA, Gilroy DW, editors. Fundamentals of Inflammation. Cambridge Univ Pr; 2010: 234-243.
AINES Coxibs
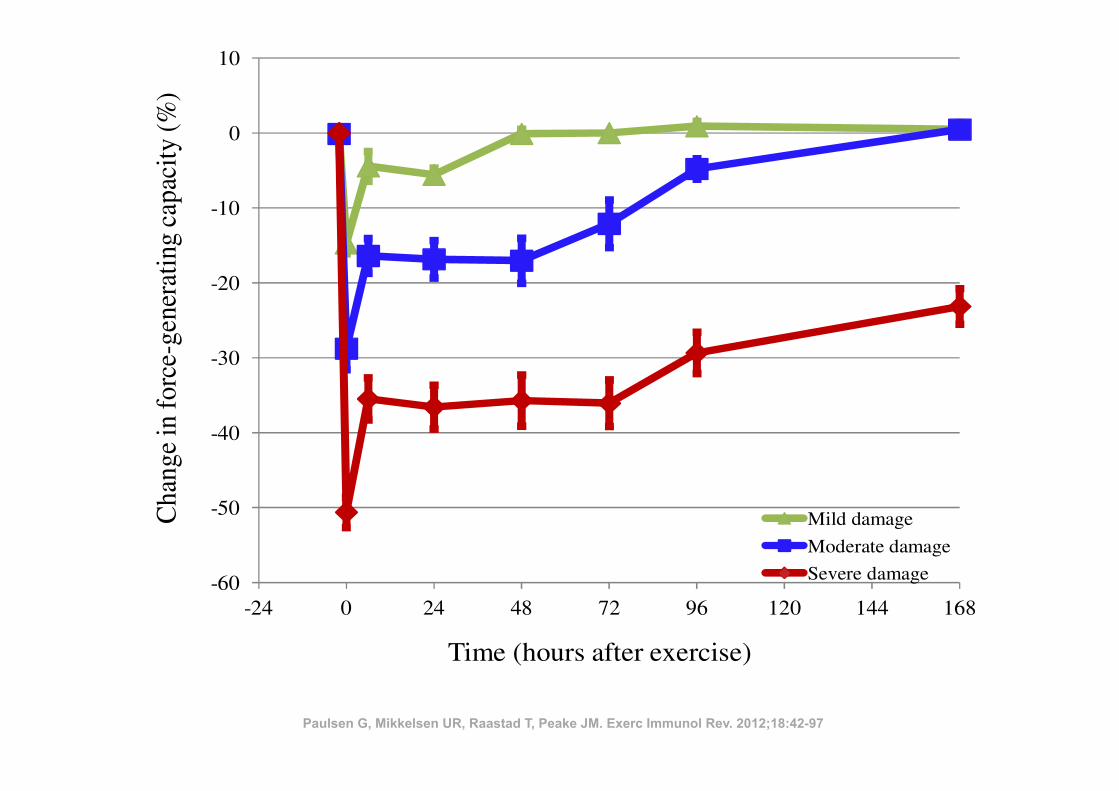
ples that exhibited intracellular leucocyte accumulation were typically collectedfrom ‘high responder’ subjects who showed a substantial decline in muscle func-tion (50!73% lower immediately after exercise, and 17!42% lower 1 week later),indicating they had suffered severe muscle damage.
Beaton et al. (25) did not observe necrotic myofibres, but did observereduced immunohistochemical staining of both desmin and dystrophin, as well asincreased numbers of macrophages between myofibres 4 and 24 hours after exer-cise. It is likely that necrosis was not evident at these early time points. Theauthors suggested that these findings were related to increased activity of theCa2+-dependent calpain system, as mentioned in Figure 1.
Figure 2 (middle curve) demonstrates the typical recovery of the force-gen-erating capacity in subjects that have performed unaccustomed eccentric exerciseand some subjects that have performed heavy traditional resistance exercise. Wesuggest using the term ‘moderate exercise-induced muscle damage’ if the largestreduction in the force-generating capacity is between 20!50%, and/or recovery iscompleted between 2 and 7 days after exercise.
52 • Exercise-induced muscle damage and inflammation
EIR 18 2012
-60
-50
-40
-30
-20
-10
0
10
-24 0 24 48 72 96 120 144 168
Cha
nge
info
rce-
gene
rati
ngca
paci
ty(%
)
Time (hours after exercise)
Mild damage
Moderate damage
Severe damage
Figure 2. Recovery of the force-generating capacity of subjects that have performed heavyresistance exercise or maximal eccentric exercise (subjects from several studies are com-bined: (230,248-251), as well as unpublished data). The subjects are organized so thatthose who recover their force-generating capacity within 48 hours are represented as mildexercise-induced muscle damage (34 subjects). Those who recover between 2 and 7 daysare presented as moderate exercise-induced muscle damage (17 subjects). Finally, subjectsthat do not recover within one week are presented as severe exercise-induced muscle dam-age (21 subjects). See further comments in the text. All data are gathered at the NorwegianSchool of Sport Sciences by Professor Truls Raastad. Data are presented as means ± stan-dard error of the mean.
Paulsen G, Mikkelsen UR, Raastad T, Peake JM. Exerc Immunol Rev. 2012;18:42-97
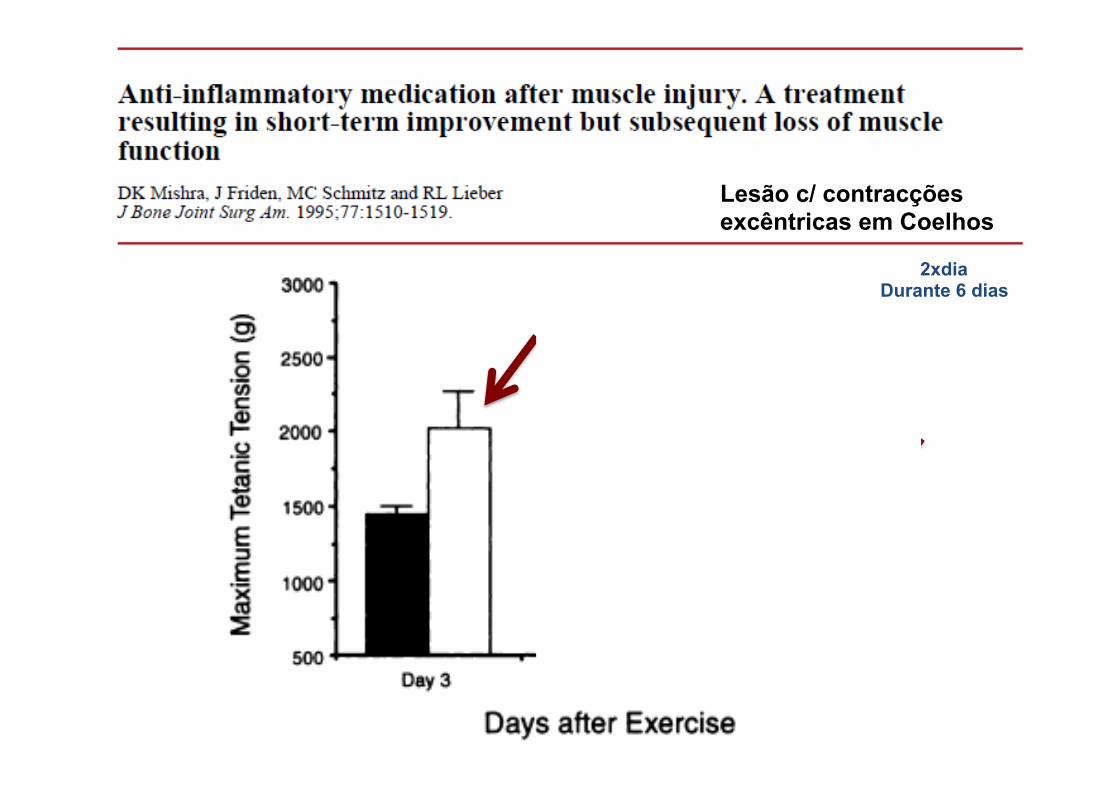
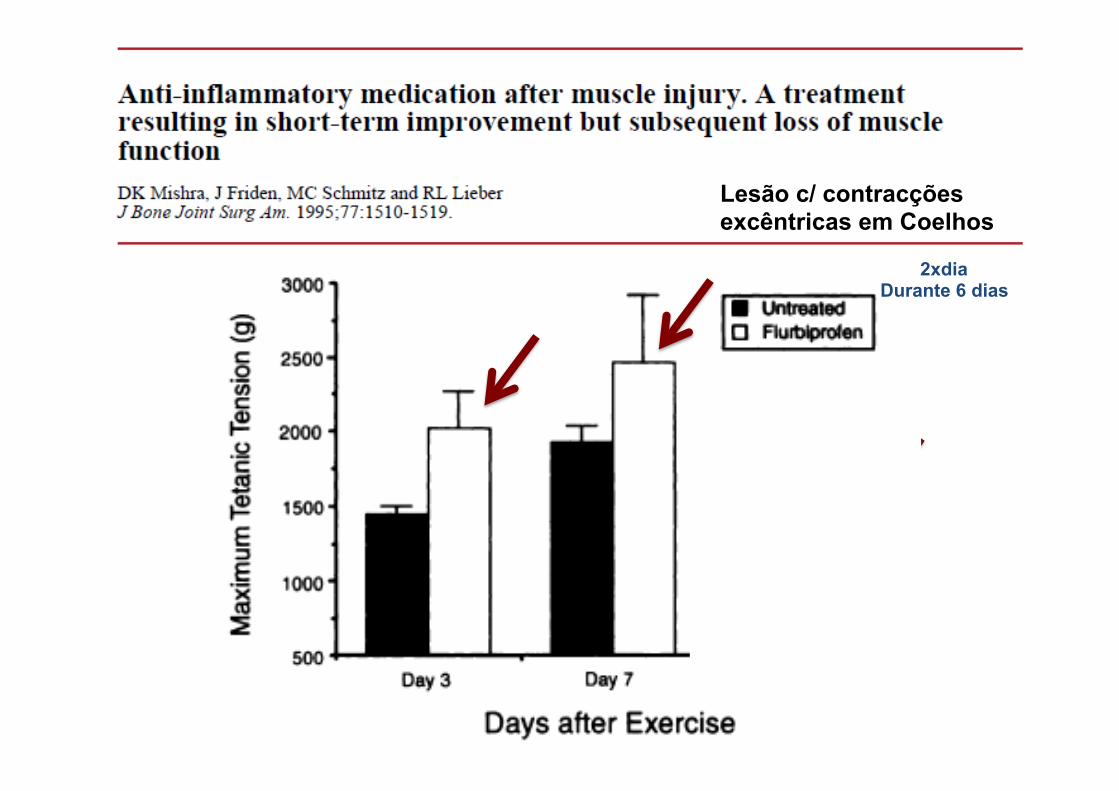
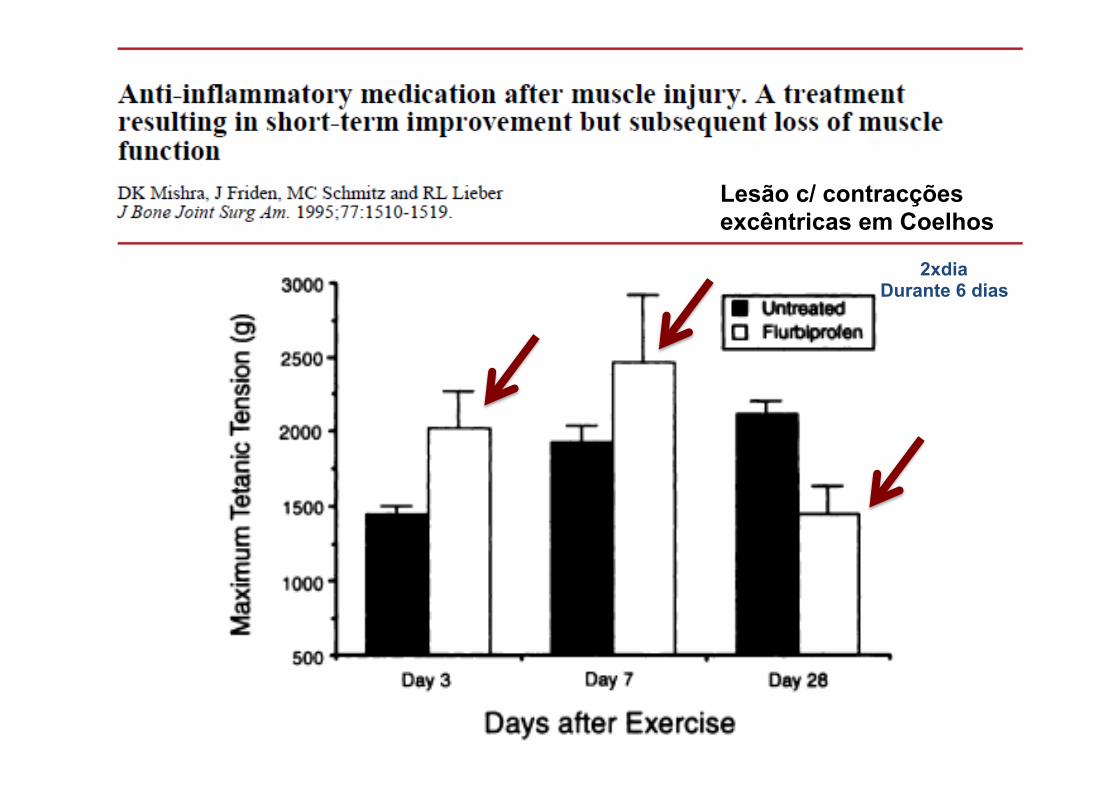
Lesão c/ contracções excêntricas em Coelhos
2xdia Durante 6 dias
Lesão c/ contracções excêntricas em Coelhos
2xdia Durante 6 dias
Lesão c/ contracções excêntricas em Coelhos
2xdia Durante 6 dias
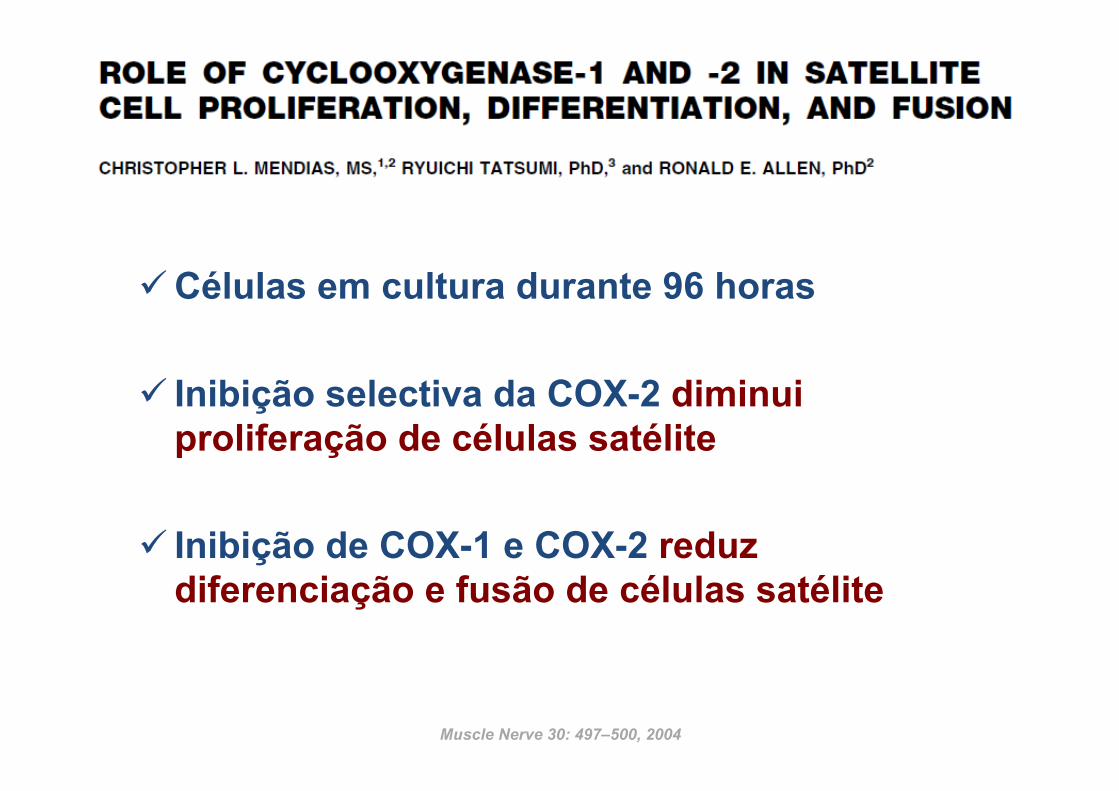
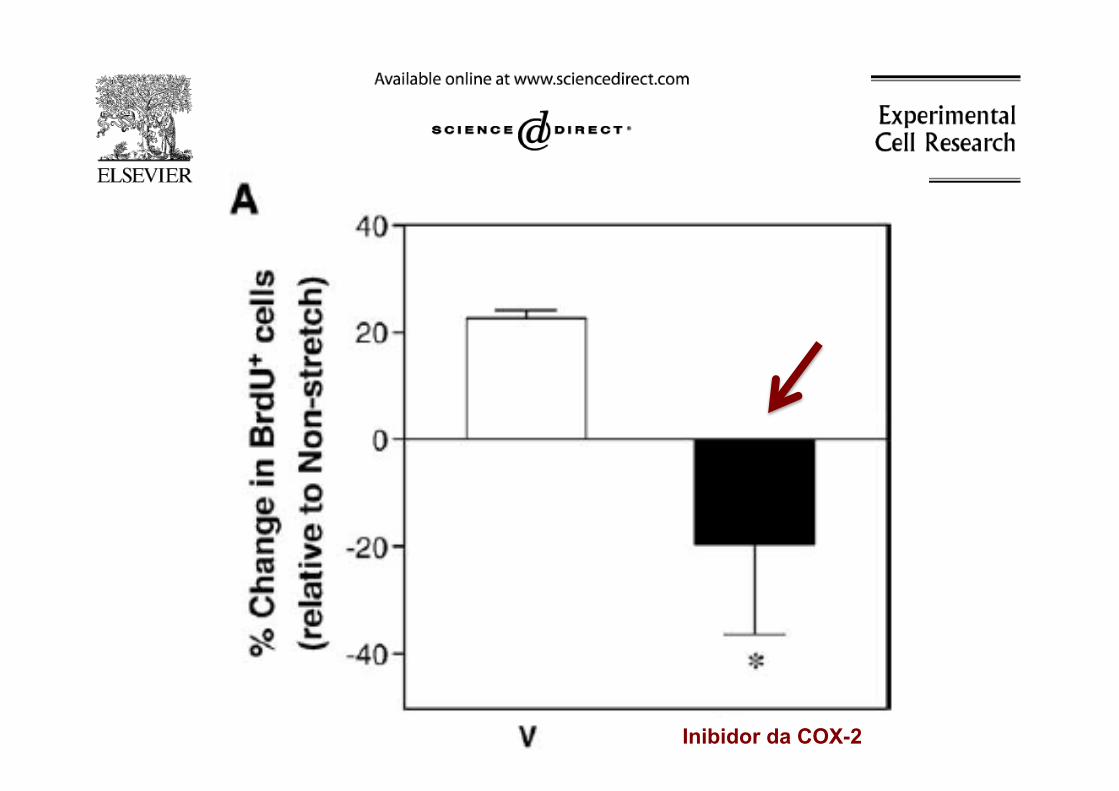
ü Células em cultura durante 96 horas
ü Inibição selectiva da COX-2 diminui proliferação de células satélite
ü Inibição de COX-1 e COX-2 reduz diferenciação e fusão de células satélite
Muscle Nerve 30: 497–500, 2004
fibers, as previously mentioned.These cells have also been usedextensively for transplantation.Distinct from both the satellite
cell and the myoblast populationsare the muscle derived stem cells(MDSCs). Although MDSCs aresimilar to satellite cells in playinga role in skeletal muscle regenera-tion, they are a separate popula-tion of cells that express distinctmarkers and phenotypes (Deasyet al., 2001; Huard et al., 2003).MDSCs are believed to be an ear-lier progenitor than satellite cells,expressing stem cell markers suchas cluster of differentiation 34(CD34) and stem cell antigen 1(Sca-1), and they have the abilityto differentiate down nonmusclelineages to contribute to repair(Qu-Petersen et al., 2002). Pax-7and Sca-1 positive cells have notbeen colocalized in skeletal mus-cle, providing further evidencethat satellite cells and MDSCs arelikely distinct populations (Zammitand Beauchamp, 2001; Fig. 1).In the incidence of a traumatic
injury or muscle damage due to a
genetic disease (such as Duch-enne muscular dystrophy [DMD]),the muscle goes through a com-plex and dynamic series of eventsresulting in an inflammatoryphase, the activation of progenitorcells, regeneration of muscle tis-sue, formation of fibrosis, andvarying degrees of restoration offunction. These phases aredetailed below.
Phases of Skeletal Muscle Injuryand Repair
Acute skeletal muscle injuriesare common injuries, whichaccount for a large segment of thepatients presenting to orthopaedicpractitioners (Crisco et al., 1994;Woolf and Pfleger, 2003; Physi-cians, 2005; Carling et al., 2011).Research has shown that the nat-ural progression of muscle injuryproceeds through a highly interde-pendent sequence of steps, lead-ing to the restoration of tissuearchitecture and function (Moyerand Wagner, 2011). However, theregenerative capacity of injured
skeletal muscle is limited and veryoften, fibrotic tissue forms, delay-ing the muscle’s full functional re-covery and predisposing it torecurrent injury (Li and Huard,2002). Clinical findings reveal ahigh recurrence rate of skeletalmuscle strain injuries, approach-ing 30% among some professio-nal-level athletes (Woods et al.,2004). Numerous investigationshave led to the identification ofthe molecular events and cellulartransformations following muscleinjury; however, the clinical treat-ment of this common conditionstill relies on conventional thera-pies of rest, ice, and antiinflamma-tory medications, which have alimited efficacy in preventing ortreating the formation of posttrau-matic muscle fibrosis (Alme-kinders, 1993; Jarvinen and Lehto,1993; Worrell, 1994). Researchconducted by our group andothers showed that injured muscleundergoes a sequential processof healing phases, including mus-cle degeneration/inflammation, re-generation, and fibrosis (Huard
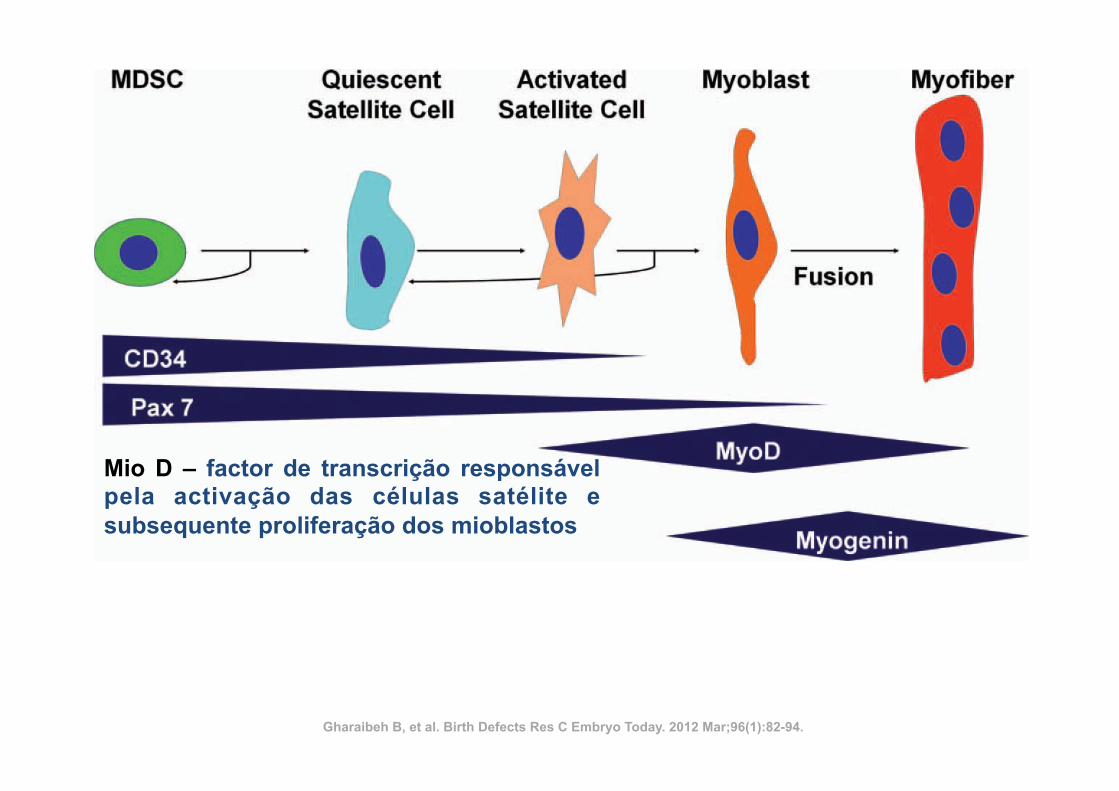
Figure 1. Generalized scheme of myogenic differentiation. Other markers are used by different investigators. (Adapted from Deasyet al., 2001, Blood Cells Mol Dis, 27, 924–933)
MODULATING SKELETAL MUSCLE REPAIR BY MUSCLE DERIVED STEM CELLS AND ANTIFIBROTIC AGENTS 83
Birth Defects Research (Part C) 96:82–94, (2012)
Mio D – factor de transcrição responsável pela activação das células satélite e subsequente proliferação dos mioblastos
Gharaibeh B, et al. Birth Defects Res C Embryo Today. 2012 Mar;96(1):82-94.
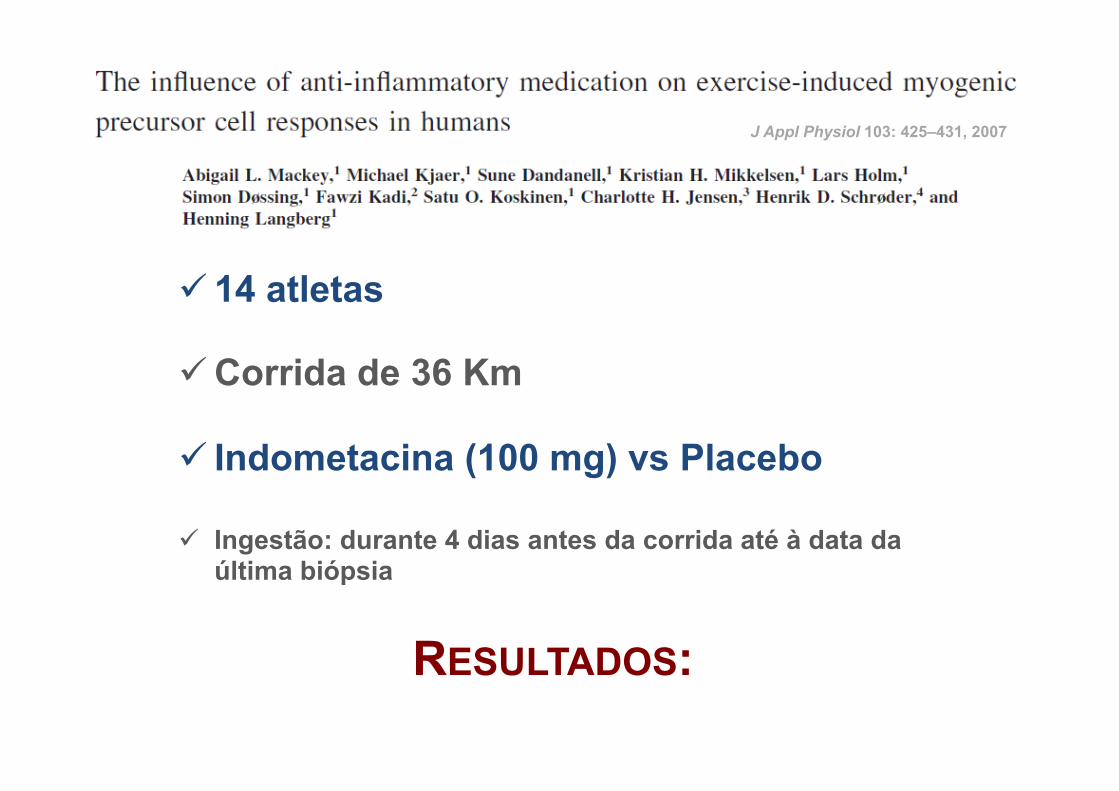
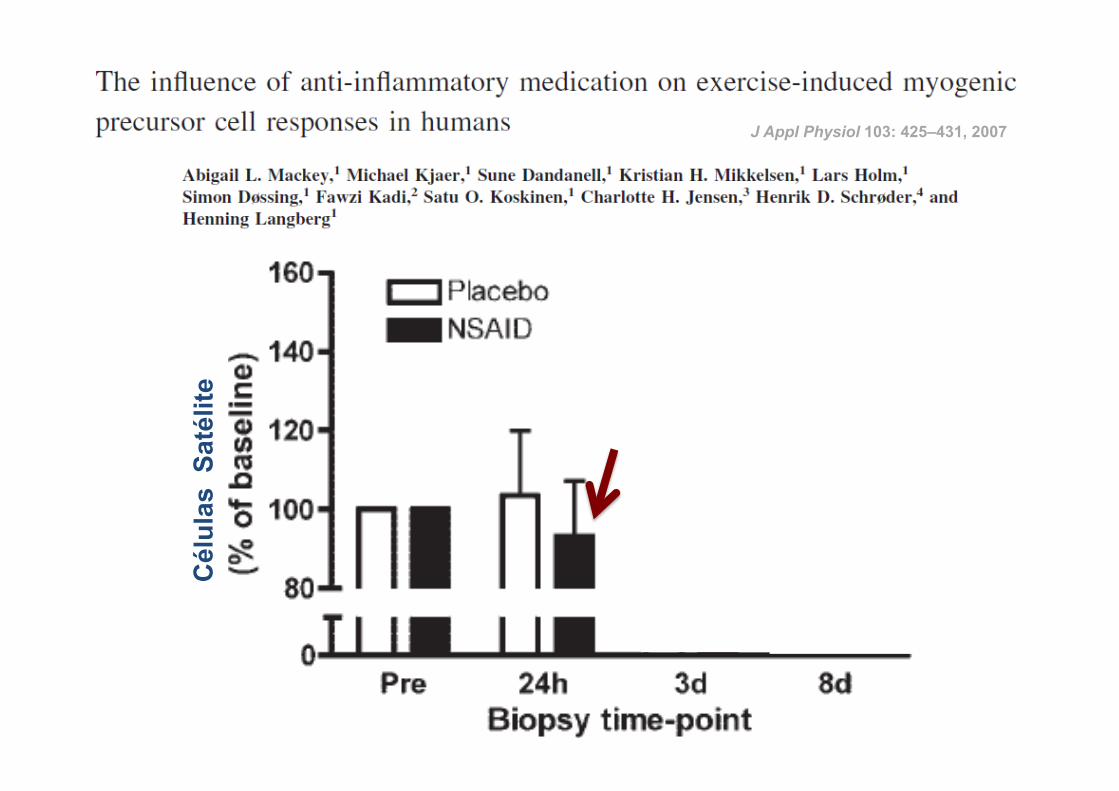
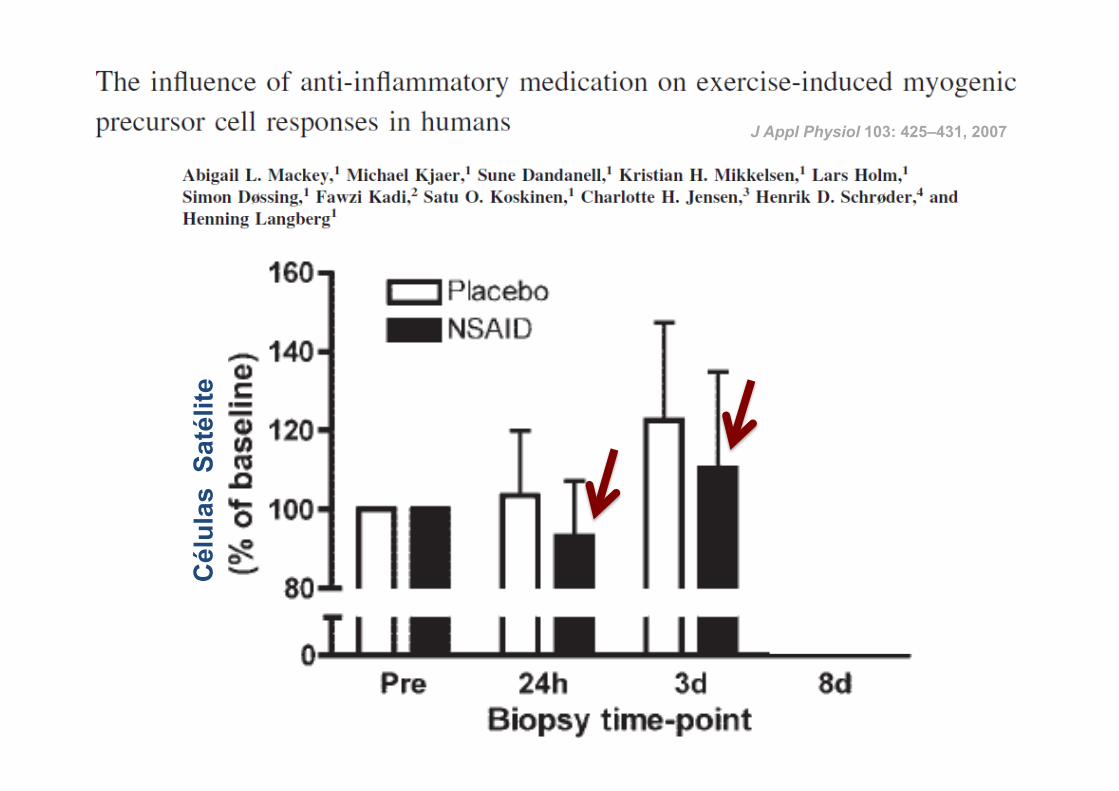
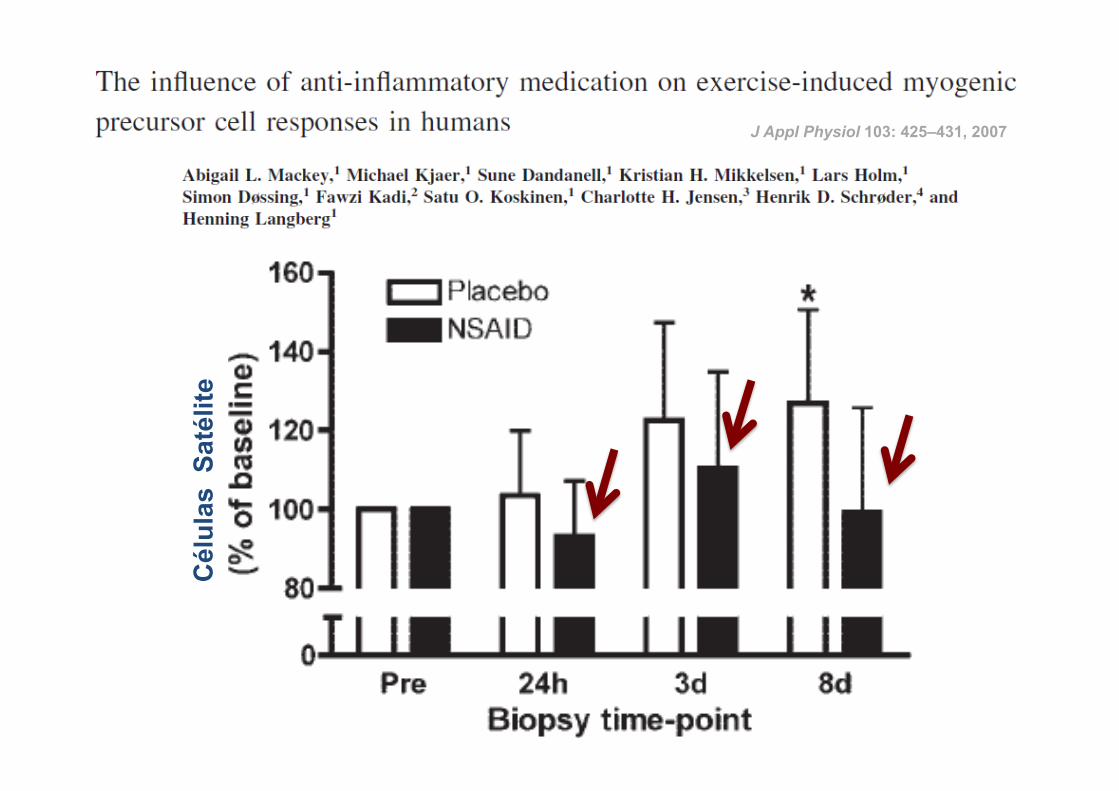
ü 14 atletas
ü Corrida de 36 Km
ü Indometacina (100 mg) vs Placebo
ü Ingestão: durante 4 dias antes da corrida até à data da última biópsia
RESULTADOS:
J Appl Physiol 103: 425–431, 2007
23
Cél
ulas
Sat
élite
J Appl Physiol 103: 425–431, 2007
24
Cél
ulas
Sat
élite
J Appl Physiol 103: 425–431, 2007
25
Cél
ulas
Sat
élite
J Appl Physiol 103: 425–431, 2007
26
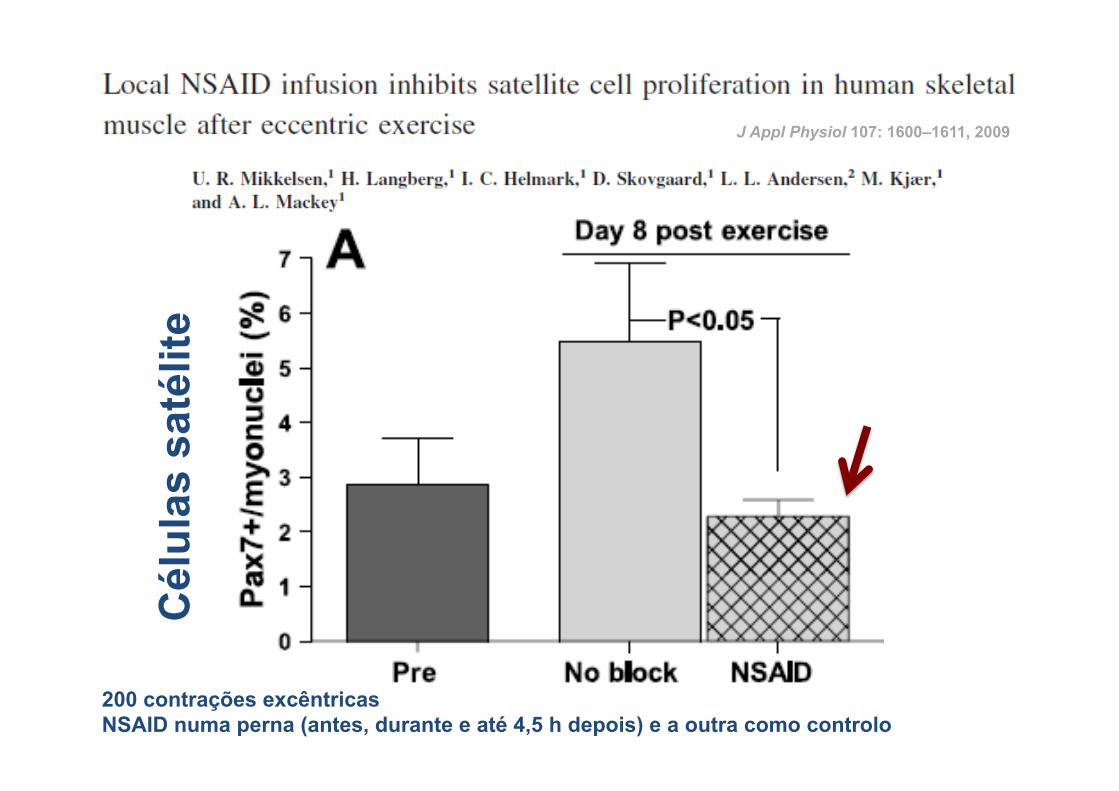
J Appl Physiol 107: 1600–1611, 2009
200 contrações excêntricas NSAID numa perna (antes, durante e até 4,5 h depois) e a outra como controlo
Cél
ulas
sat
élite
protein accretion seen in eccentric protocols. Other studies,however, seem to refute whether a reversal of the sizeprinciple actually does occur. An extensive review of theliterature by Chalmers (26) concluded that the preponder-ance of evidence does not support selective recruitment offast-twitch fibers during eccentric contractions. These resultsheld constant in 9 out of 10 studies deemed suitable toaddress the topic and were applicable over a wide range ofefforts and speeds.
Another alternative hypothesis proposes that hypertrophicbenefits associated with eccentric exercise may be due toa greater imposed mechanical stress compared with concen-tric or isometric actions (112). Indeed, muscles are capable ofgenerating greater absolute force when contracting eccen-trically vs. concentrically (123). Despite this fact, however,muscle activation during maximal eccentric actions is
generally less compared with those performed concentri-cally. This paradox was demonstrated by Grabiner et al. (55),who found that the maximum EMG of the vastus lateralisduring eccentric knee extension was only 84 6 41% of thatobtained concentrically. Hence, although the potential toexert peak force is greater with eccentric exercise, most find itextremely difficult to achieve the maximum force duringeccentric actions, ultimately resulting in an incomplete acti-vation of the spectrum of motor neurons for a given workingmuscle (43).
Perhaps more importantly, the use of absolute maximalloads is not necessarily paramount for optimal muscle growth.Although mechanical force appears to be the primary stim-ulus for eliciting hypertrophic gains, there is evidence thata threshold may exist beyond which other factors pre-dominate (130). Hypertrophy-oriented routines traditionally
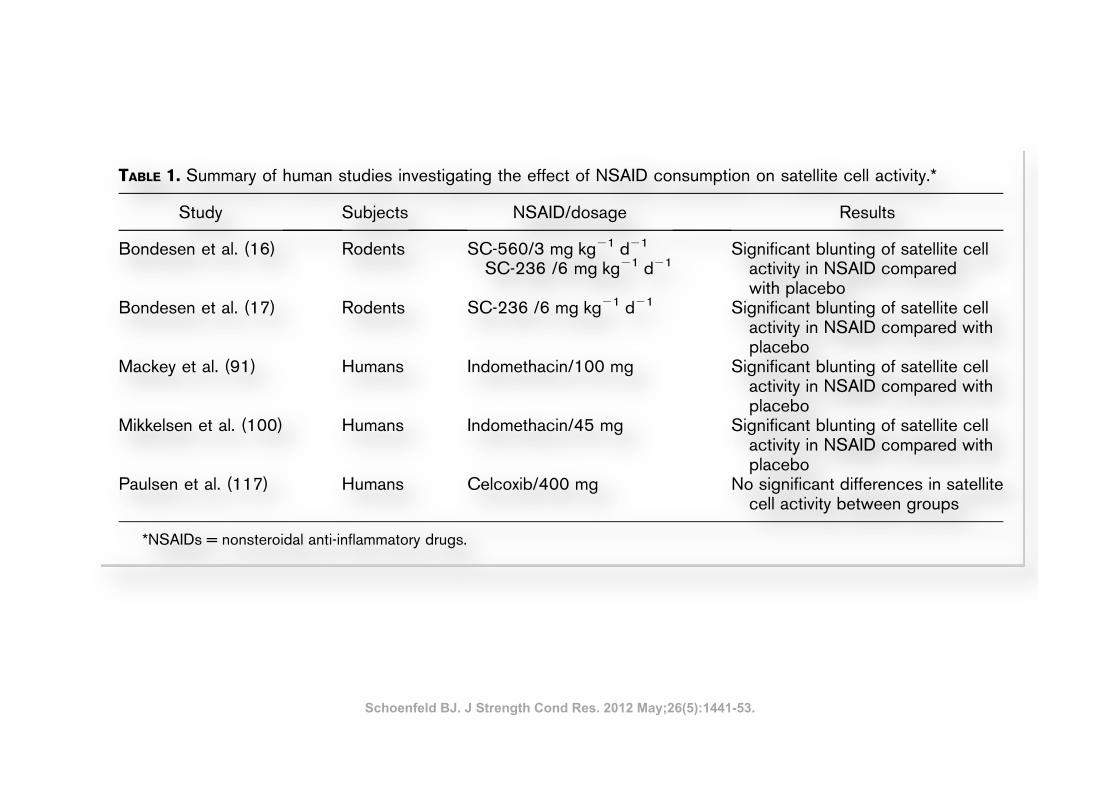
TABLE 1. Summary of human studies investigating the effect of NSAID consumption on satellite cell activity.*
Study Subjects NSAID/dosage Results
Bondesen et al. (16) Rodents SC-560/3 mg!kg21!d21
SC-236 /6 mg!kg21!d21Significant blunting of satellite cell
activity in NSAID comparedwith placebo
Bondesen et al. (17) Rodents SC-236 /6 mg!kg21!d21 Significant blunting of satellite cellactivity in NSAID compared withplacebo
Mackey et al. (91) Humans Indomethacin/100 mg Significant blunting of satellite cellactivity in NSAID compared withplacebo
Mikkelsen et al. (100) Humans Indomethacin/45 mg Significant blunting of satellite cellactivity in NSAID compared withplacebo
Paulsen et al. (117) Humans Celcoxib/400 mg No significant differences in satellitecell activity between groups
*NSAIDs = nonsteroidal anti-inflammatory drugs.
TABLE 2. Summary of studies directly investigating the relationship between EIMD and muscle hypertrophy.*
Study SubjectsMethod of EIMD
assessment Results
Komulainen et al. (80) Rodents Beta-glucuronidaseactivity
Damage was significantly higher in the eccentric groupcompared with the concentric group (7.1-fold vs.2.6-fold, respectively), but no differences in musclecross-sectional area were seen between groups.
Flann et al. (46) Humans Creatine kinase levels,perceived musclesoreness
Muscle damage was significantly higher in the pretrainedgroup compared with the naive group, but increasesin muscle girth was statistically similar betweengroups (7.5 vs. 6.5%, respectively).
*EIMD = exercise-induced muscle damage.
1448 Journal of Strength and Conditioning Researchthe TM
Exercise-Induced Muscle Damage
Copyright © National Strength and Conditioning Association Unauthorized reproduction of this article is prohibited.
Schoenfeld BJ. J Strength Cond Res. 2012 May;26(5):1441-53.
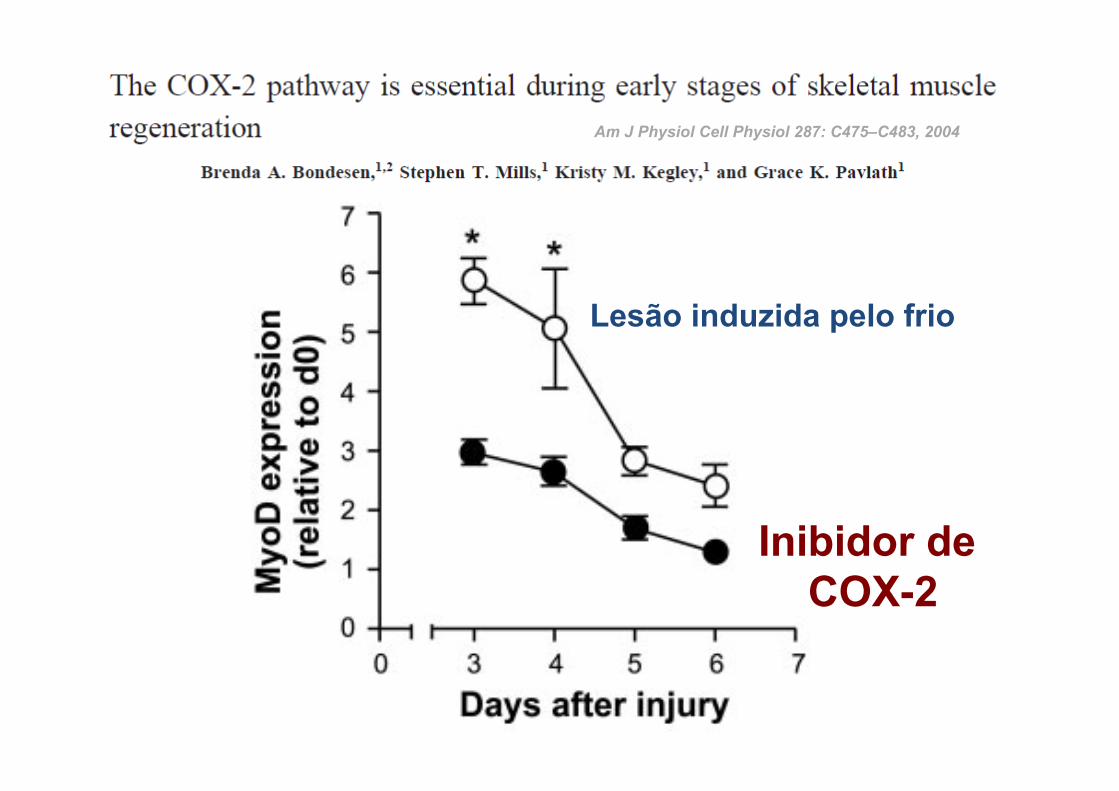
Am J Physiol Cell Physiol 287: C475–C483, 2004
Inibidor de COX-2
Lesão induzida pelo frio
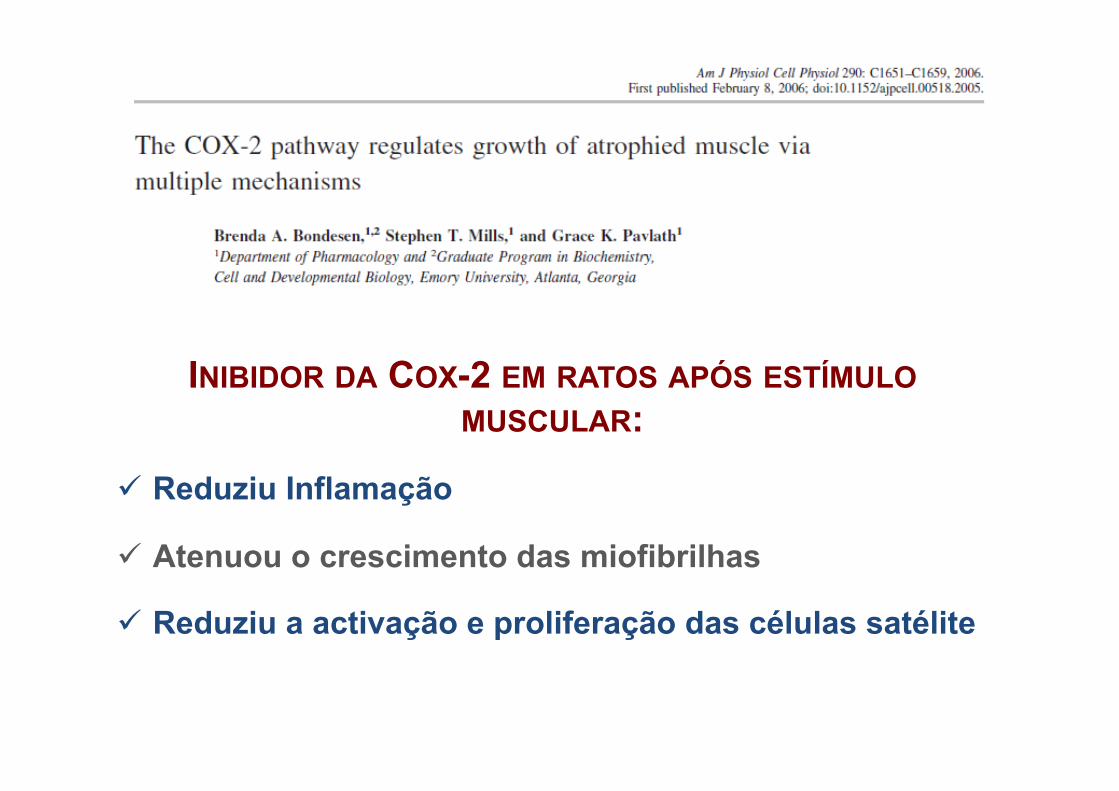
INIBIDOR DA COX-2 EM RATOS APÓS ESTÍMULO MUSCULAR:
ü Reduziu Inflamação
ü Atenuou o crescimento das miofibrilhas
ü Reduziu a activação e proliferação das células satélite
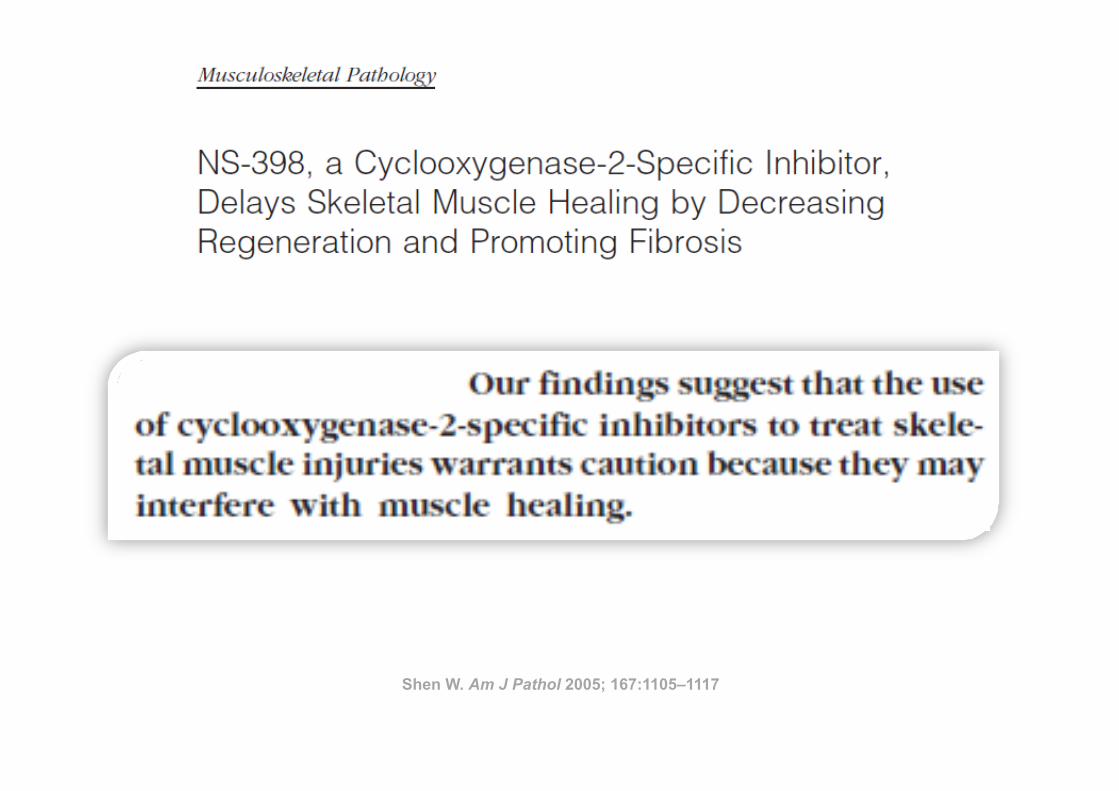
Shen W. Am J Pathol 2005; 167:1105–1117
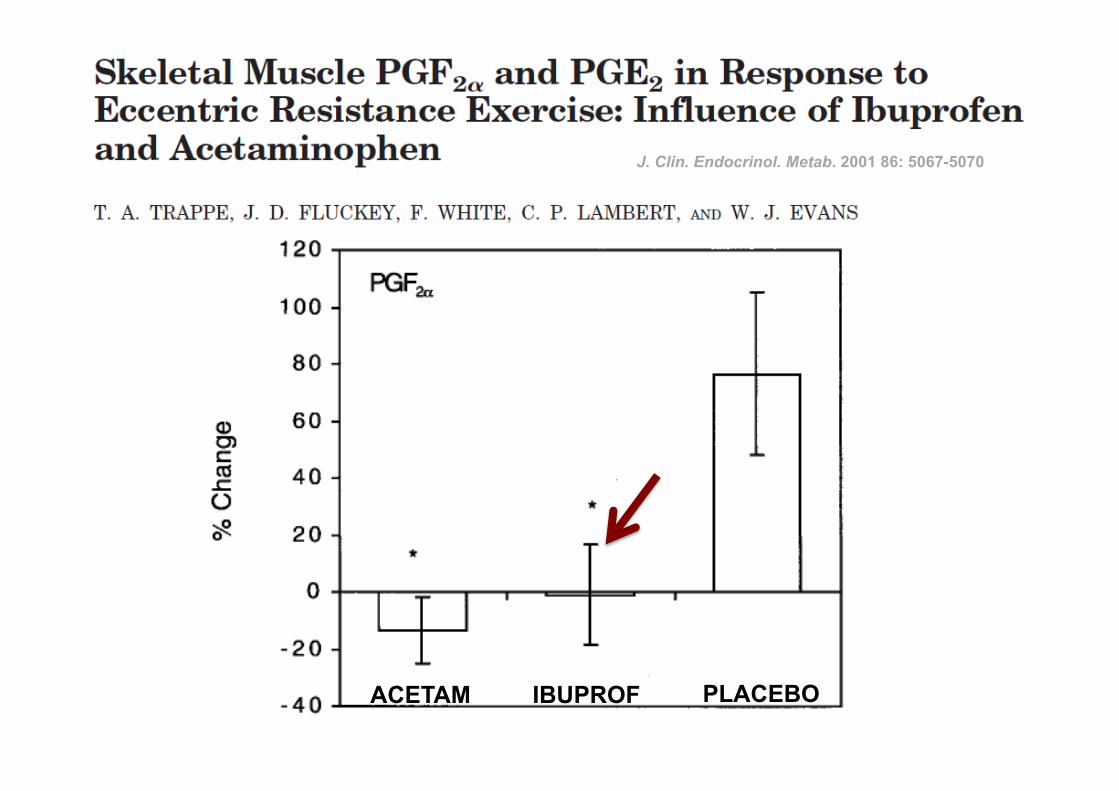
ACETAM IBUPROF PLACEBO
J. Clin. Endocrinol. Metab. 2001 86: 5067-5070
Inibidor da COX-2
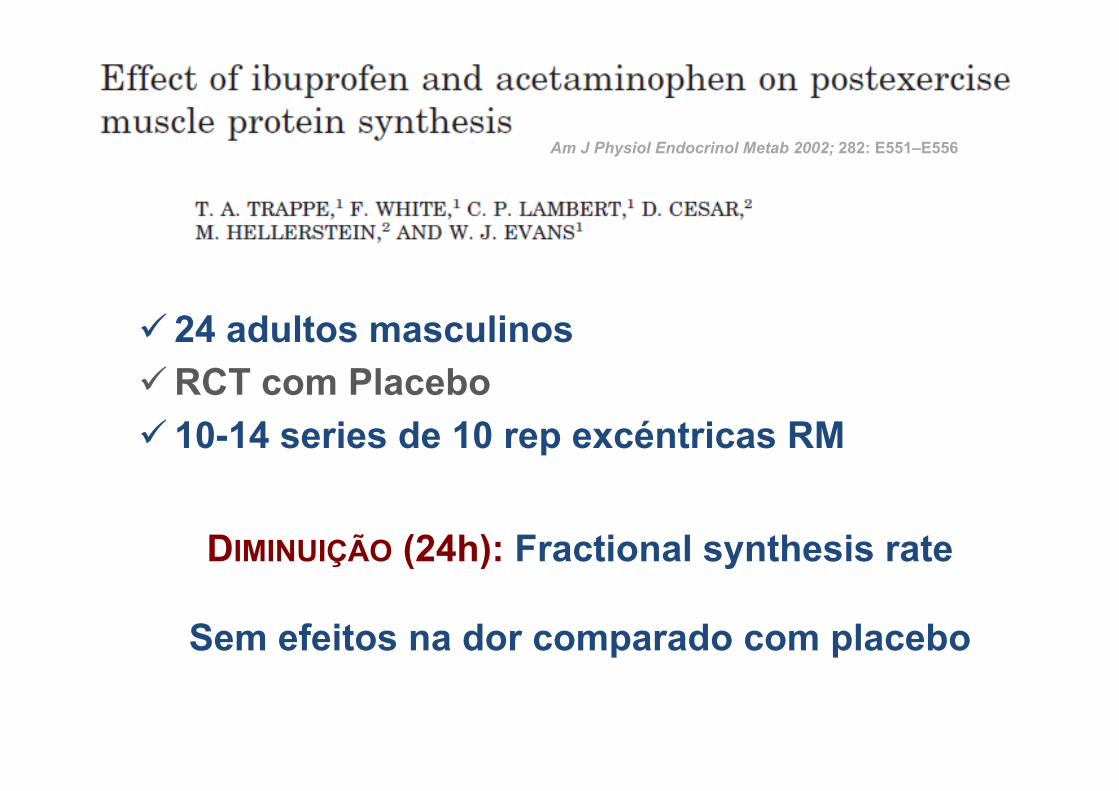
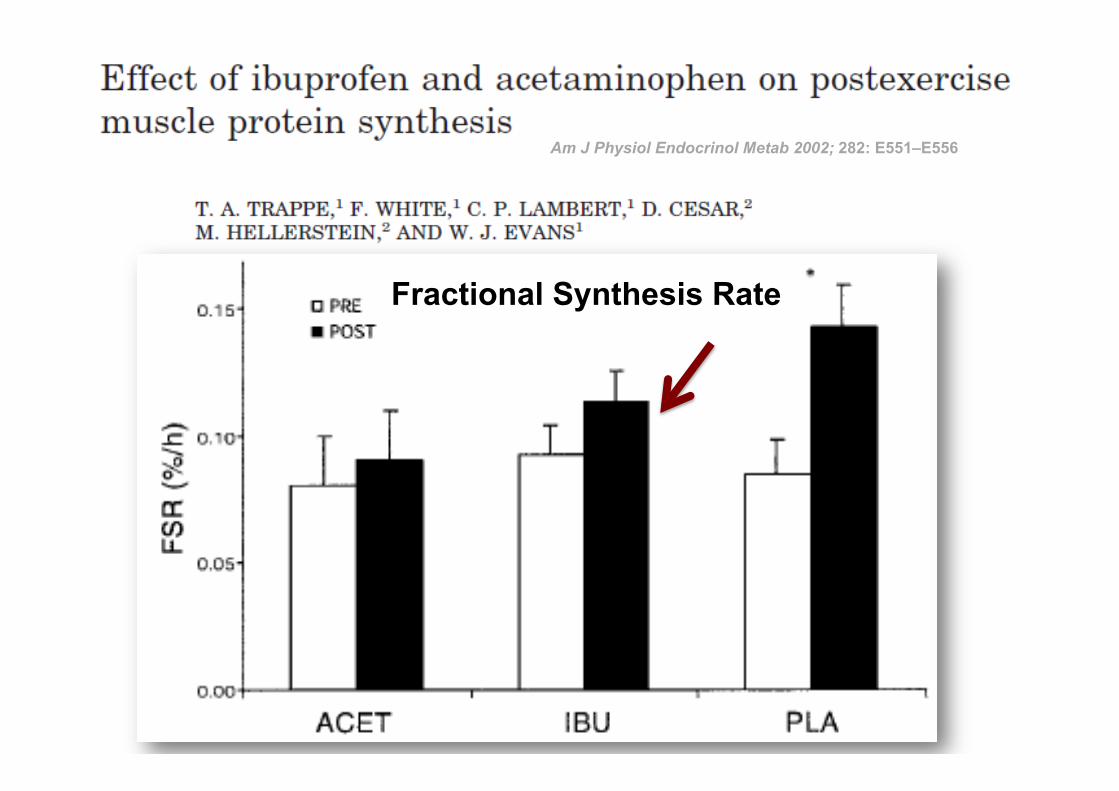
ü 24 adultos masculinos ü RCT com Placebo ü 10-14 series de 10 rep excéntricas RM
DIMINUIÇÃO (24h): Fractional synthesis rate
Sem efeitos na dor comparado com placebo
Am J Physiol Endocrinol Metab 2002; 282: E551–E556
34
Am J Physiol Endocrinol Metab 2002; 282: E551–E556
Fractional Synthesis Rate
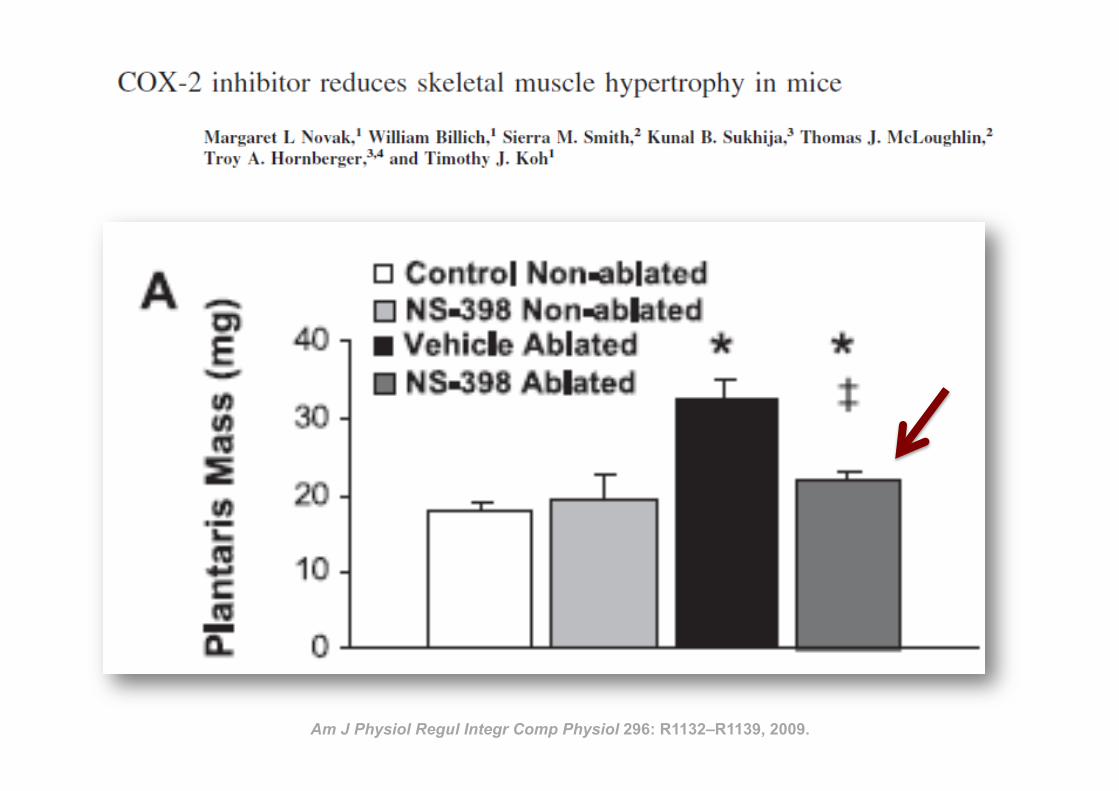
35 Am J Physiol Regul Integr Comp Physiol 296: R1132–R1139, 2009.
Inflamm
ation and eccentric exercise • 77
Figure 1 Exercise-induced muscle damage and subsequent muscle inflammation and regeneration process
(PMN, polymorphonuclear leucocyte; Mb, myoglobin; CK, creatine kinase; ROS, reactive oxygen species)
PMN
satellite cellsregenerated
muscle fibres
Recovery
• proliferation of satellite cells
• acquisition of protective effect
After exercise
• leukocyte infiltration
• inflammation
During exercise
mechanical damage to muscle
tissue
monocytes
macrophages
growth
factors
cytokines
phagocytosis
cytokines
chemoattractants
priming
damaged
muscle fibres
ROS enzymes
muscle tissue
fragments
CK
CK
Mb
Mb
muscle tissue
fragments
phagocytosis
adhesion molecules
endothelial cells
blood circulation
Exercise 24 hours after exercise 1 day to 2 weeks after exercise
Peake J, Nosaka K, Suzuki K. Exerc Immunol Rev. 2005;11:64-85
Inflamm
ation and eccentric exercise • 77
Figure 1 Exercise-induced muscle damage and subsequent muscle inflammation and regeneration process
(PMN, polymorphonuclear leucocyte; Mb, myoglobin; CK, creatine kinase; ROS, reactive oxygen species)
PMN
satellite cellsregenerated
muscle fibres
Recovery
• proliferation of satellite cells
• acquisition of protective effect
After exercise
• leukocyte infiltration
• inflammation
During exercise
mechanical damage to muscle
tissue
monocytes
macrophages
growth
factors
cytokines
phagocytosis
cytokines
chemoattractants
priming
damaged
muscle fibres
ROS enzymes
muscle tissue
fragments
CK
CK
Mb
Mb
muscle tissue
fragments
phagocytosis
adhesion molecules
endothelial cells
blood circulation
Exercise 24 hours after exercise 1 day to 2 weeks after exercise
Peake J, Nosaka K, Suzuki K. Exerc Immunol Rev. 2005;11:64-85
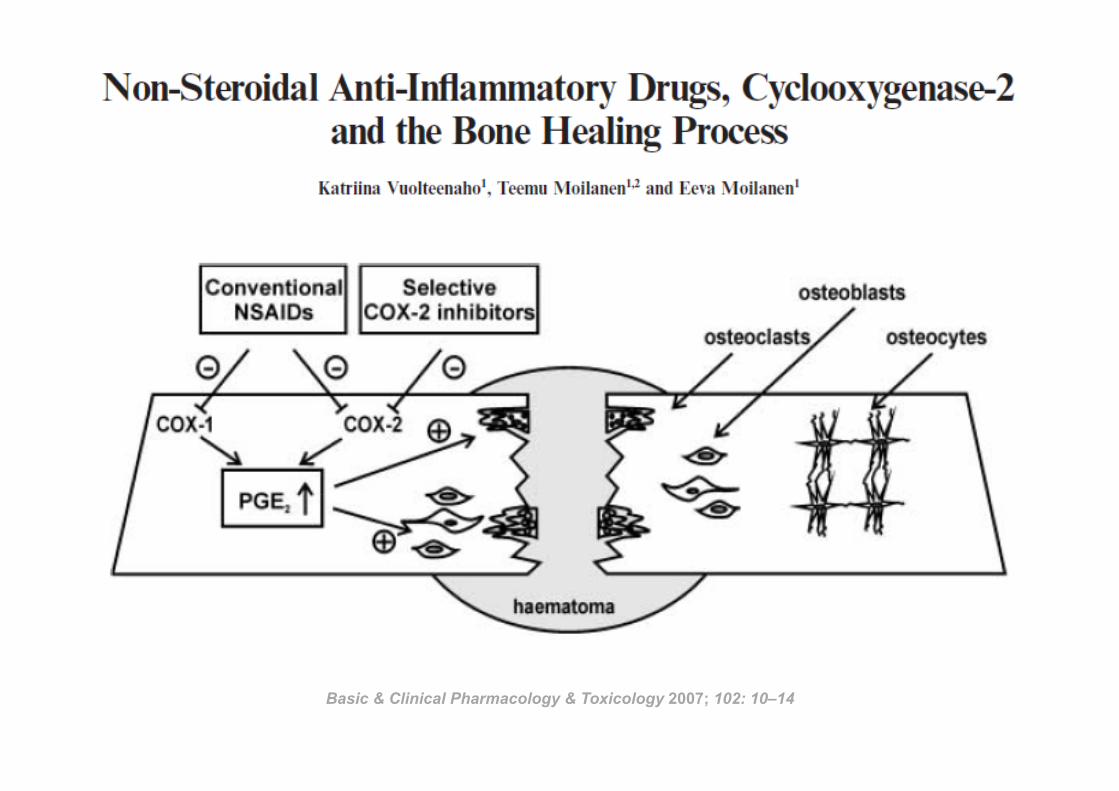
Basic & Clinical Pharmacology & Toxicology 2007; 102: 10–14
39
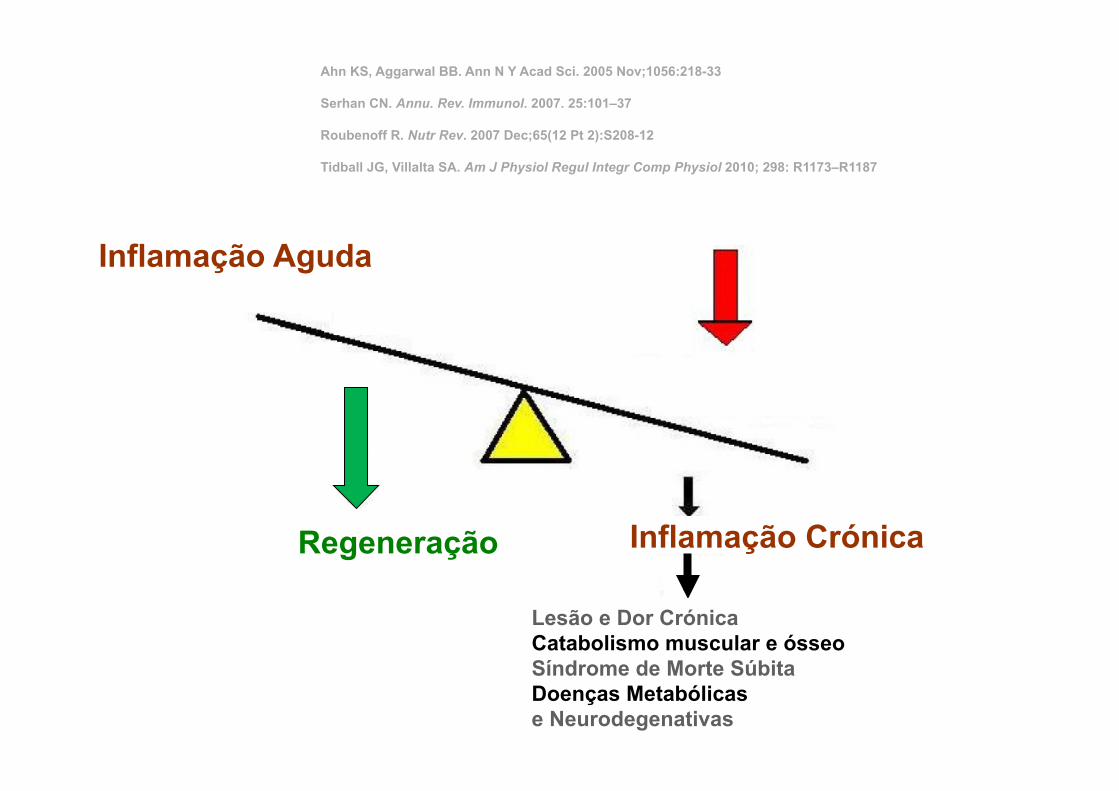
Inflamação Aguda
Inflamação Crónica
Lesão e Dor Crónica Catabolismo muscular e ósseo Síndrome de Morte Súbita Doenças Metabólicas e Neurodegenativas
Regeneração
Ahn KS, Aggarwal BB. Ann N Y Acad Sci. 2005 Nov;1056:218-33 Serhan CN. Annu. Rev. Immunol. 2007. 25:101–37 Roubenoff R. Nutr Rev. 2007 Dec;65(12 Pt 2):S208-12 Tidball JG, Villalta SA. Am J Physiol Regul Integr Comp Physiol 2010; 298: R1173–R1187
40
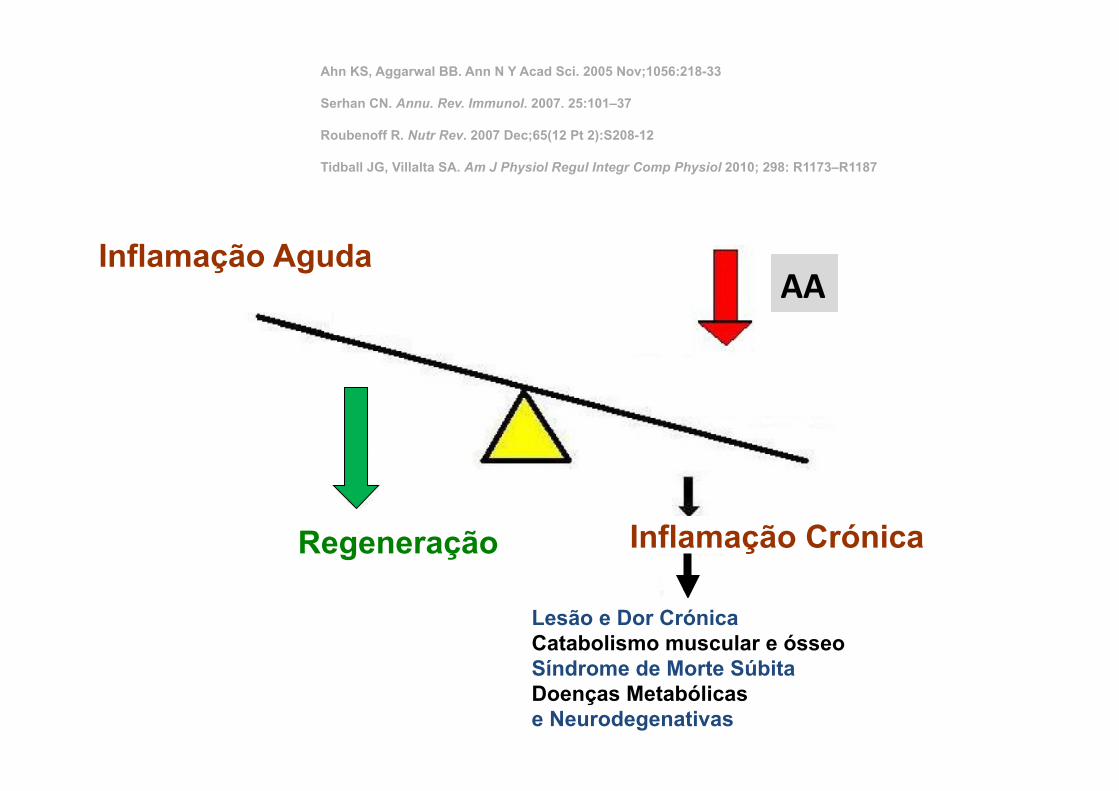
Inflamação Aguda
Inflamação Crónica
Lesão e Dor Crónica Catabolismo muscular e ósseo Síndrome de Morte Súbita Doenças Metabólicas e Neurodegenativas
Regeneração
Ahn KS, Aggarwal BB. Ann N Y Acad Sci. 2005 Nov;1056:218-33 Serhan CN. Annu. Rev. Immunol. 2007. 25:101–37 Roubenoff R. Nutr Rev. 2007 Dec;65(12 Pt 2):S208-12 Tidball JG, Villalta SA. Am J Physiol Regul Integr Comp Physiol 2010; 298: R1173–R1187
AA
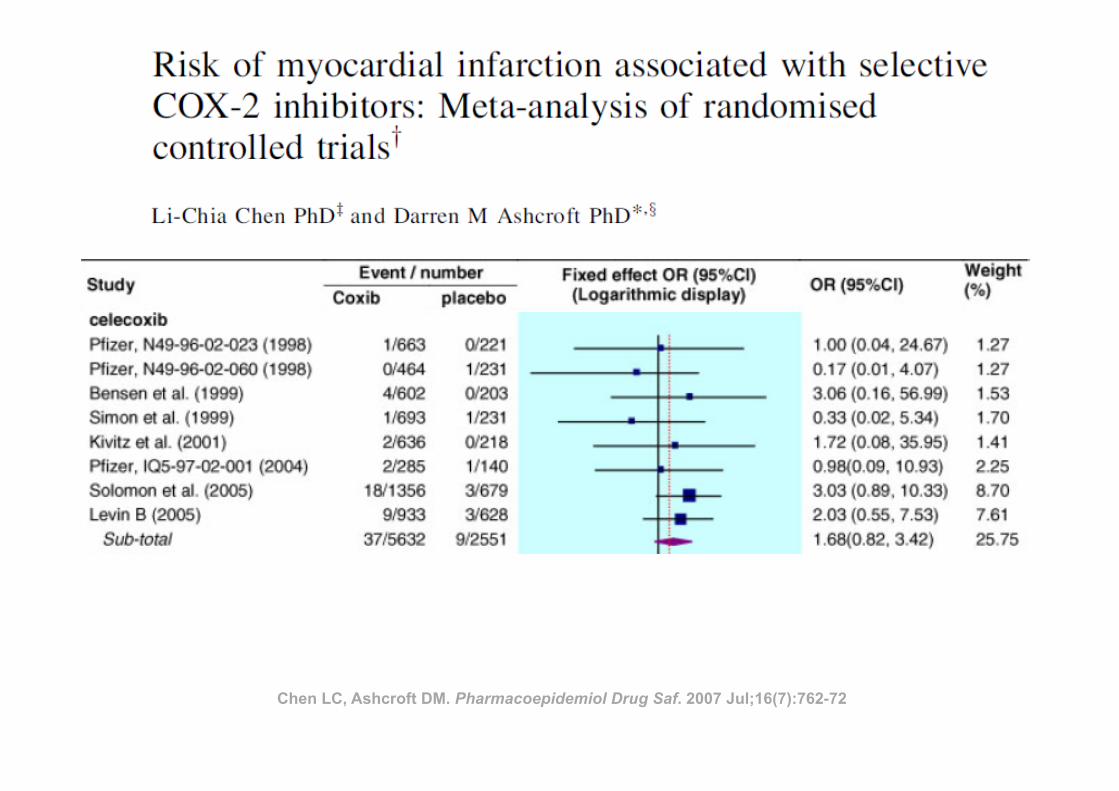
Chen LC, Ashcroft DM. Pharmacoepidemiol Drug Saf. 2007 Jul;16(7):762-72

De Caterina R. N Engl J Med 2011
Ácido Eicosapentaenóico (EPA)
20:5 n-3
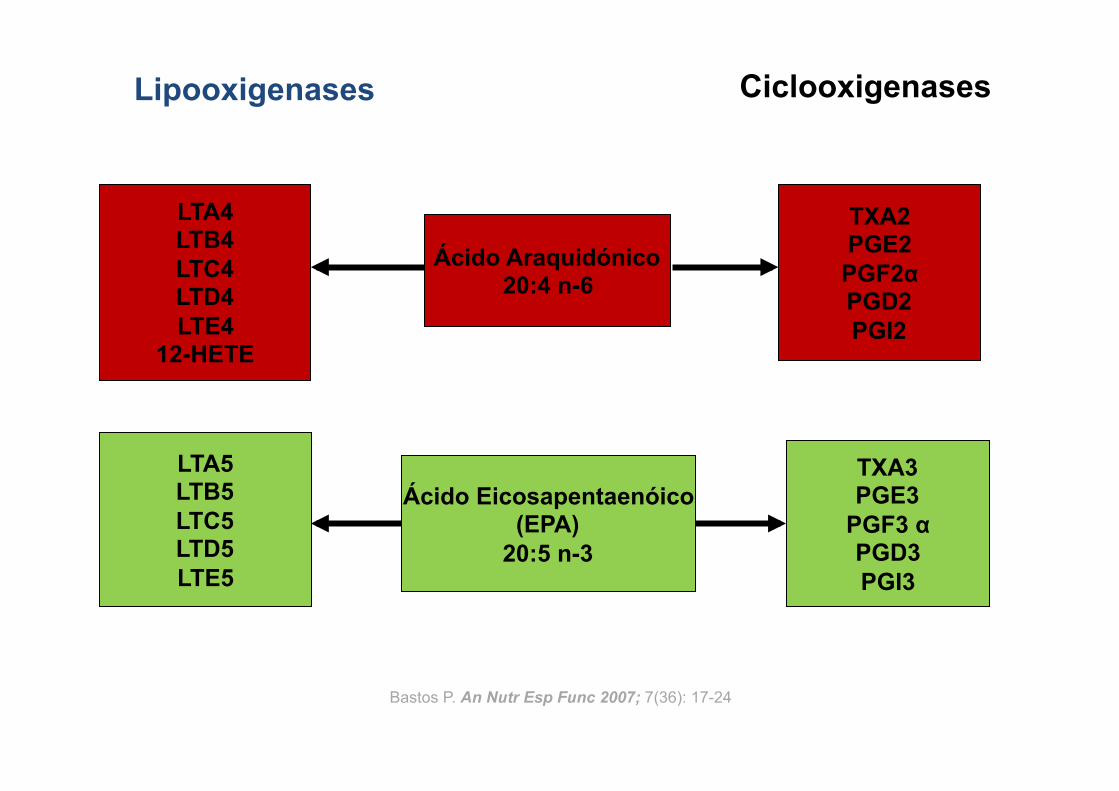
Lipooxigenases Ciclooxigenases
Ácido Araquidónico 20:4 n-6
LTA4 LTB4 LTC4 LTD4 LTE4
12-HETE
TXA2 PGE2 PGF2α PGD2 PGI2
TXA3 PGE3
PGF3 α PGD3 PGI3
LTA5 LTB5 LTC5 LTD5 LTE5
Bastos P. An Nutr Esp Func 2007; 7(36): 17-24
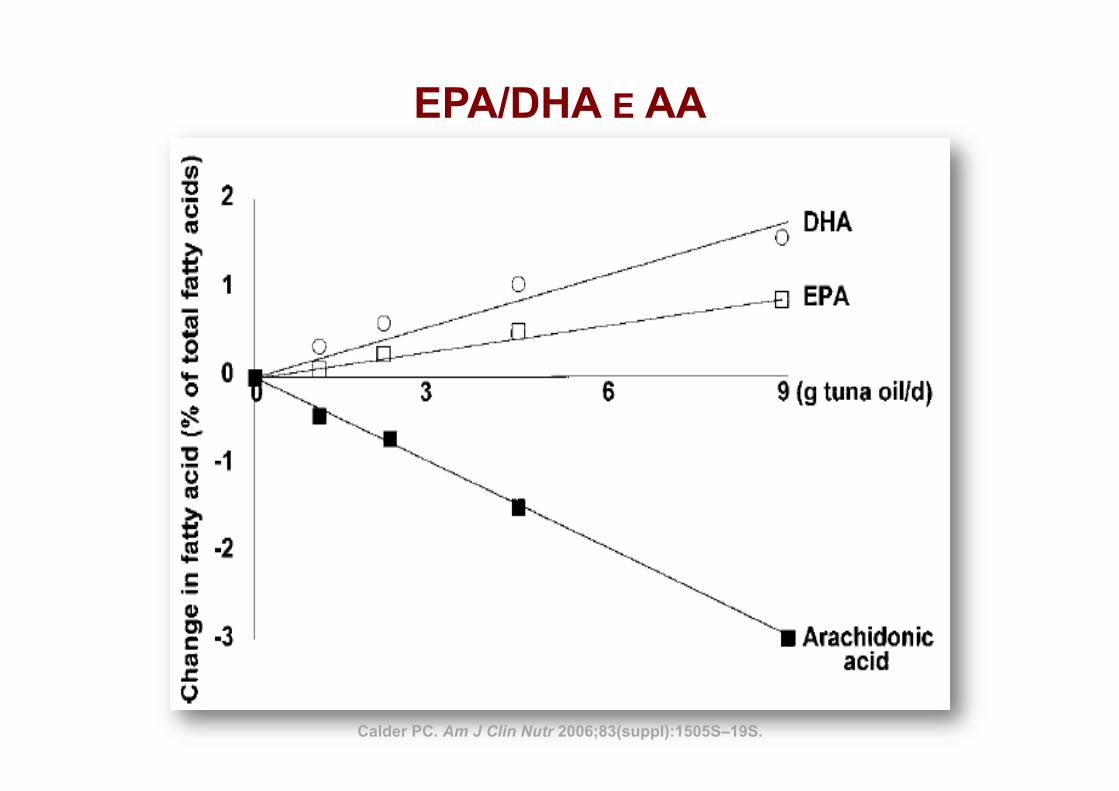
EPA/DHA E AA
Calder PC. Am J Clin Nutr 2006;83(suppl):1505S–19S.
7
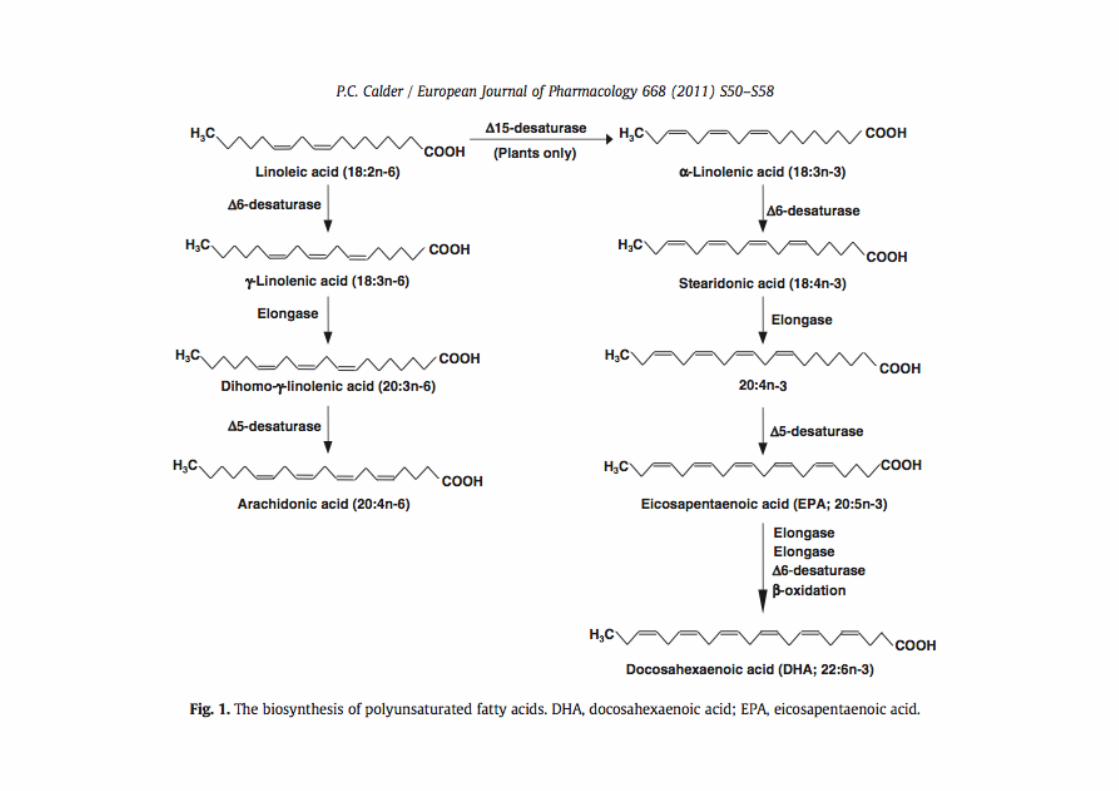
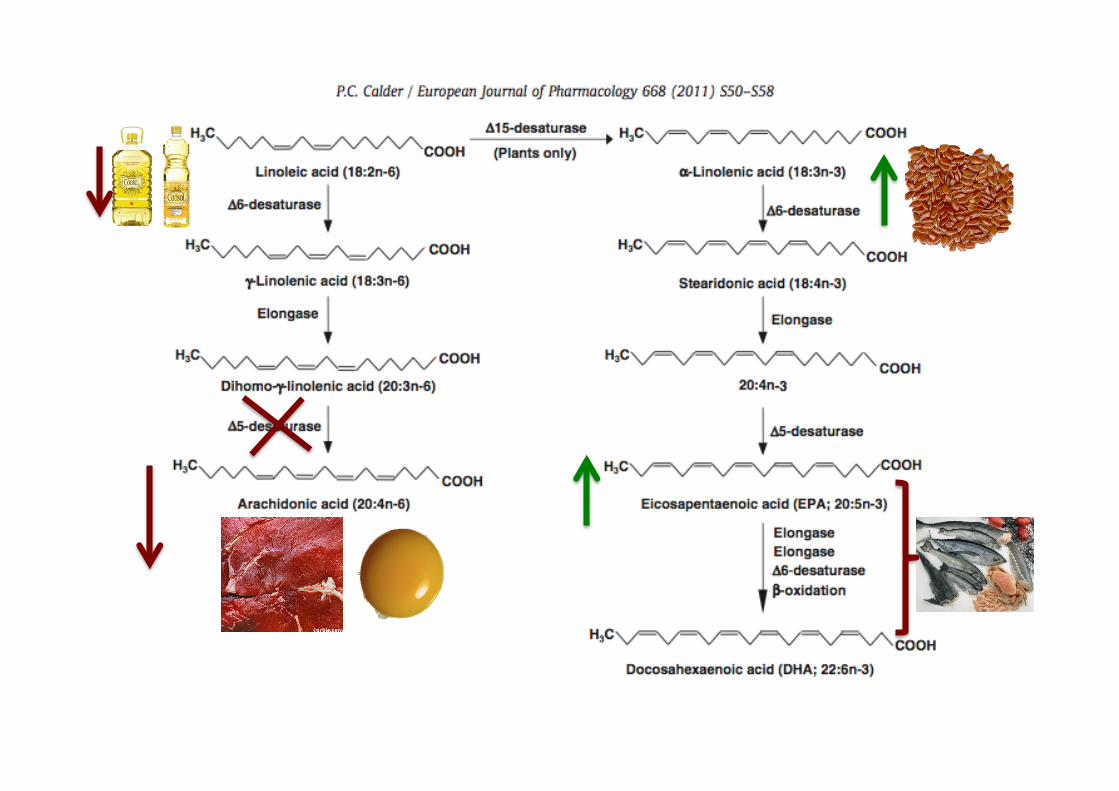
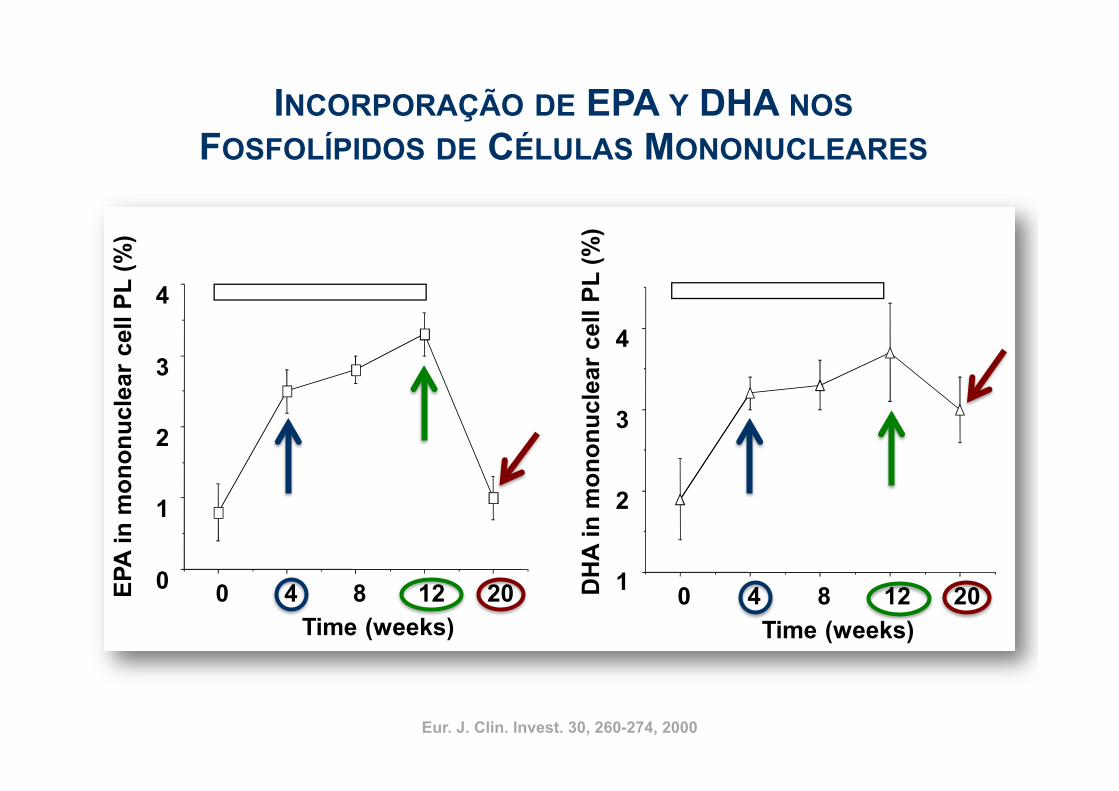
EPA e DHA
Į-Linolênico
Time course relativo à incorporação de EPA e DHAem fosfolipídios de membrana de células mononucleares
Indivíduos saudáveis: 2,1 g EPA + 1,1 g DHA/dia/12 semanas
0 4 8 12 200
1
2
3
4
Time (weeks)
EP
A i
n m
on
on
ucle
ar
cell P
L (
%)
0 4 8 12 201
2
3
4
Time (weeks)
DH
A i
n m
on
on
ucle
ar
cell P
L (
%)
Eur. J. Clin. Invest. 30, 260-274, 2000 Mozaffarian et al. (2006) JAMA 296, 1885-1899Eur. J. Clin. Invest. 30, 260-274, 2000
INCORPORAÇÃO DE EPA Y DHA NOS FOSFOLÍPIDOS DE CÉLULAS MONONUCLEARES
Calder PC. Am J Clin Nutr 2006;83(suppl):1505S–19S)
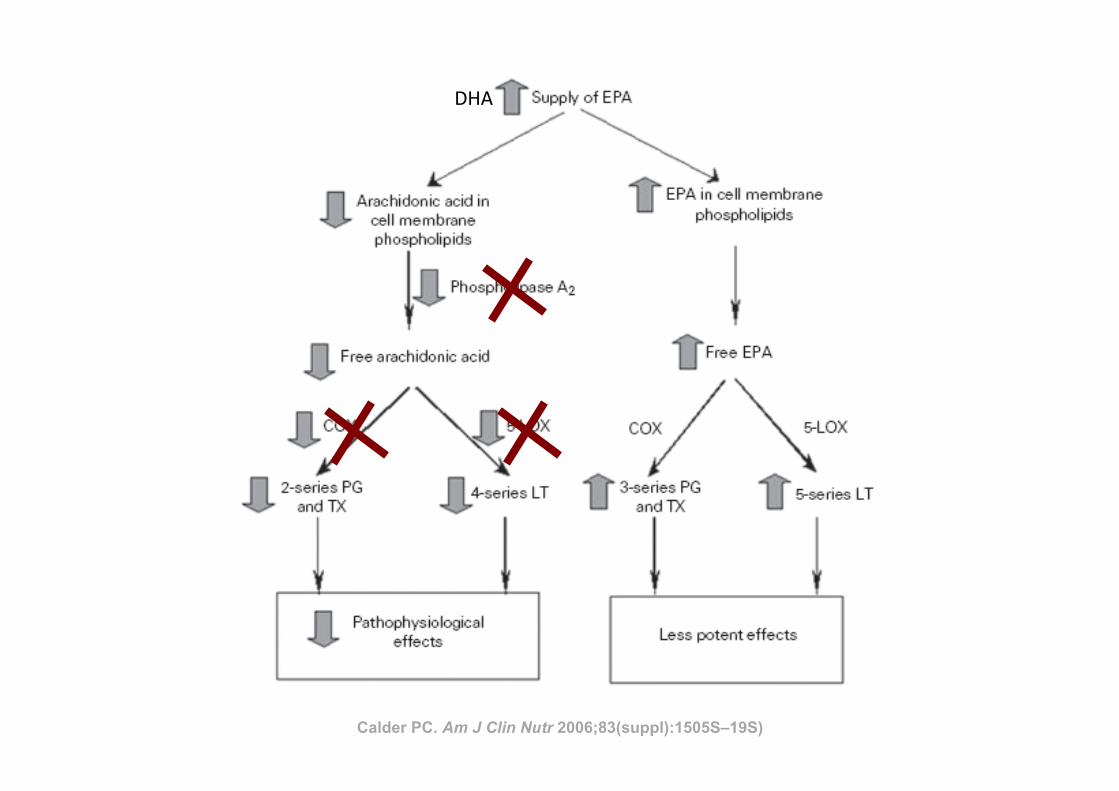
DHA
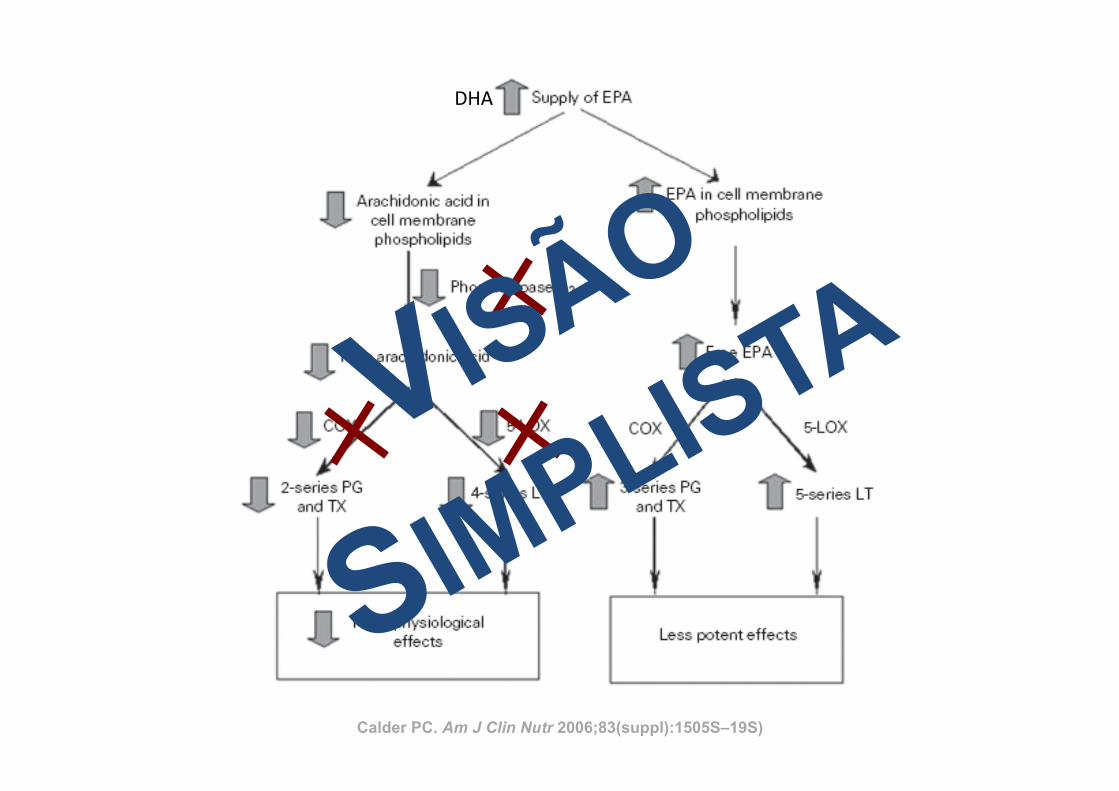
Calder PC. Am J Clin Nutr 2006;83(suppl):1505S–19S)
DHA
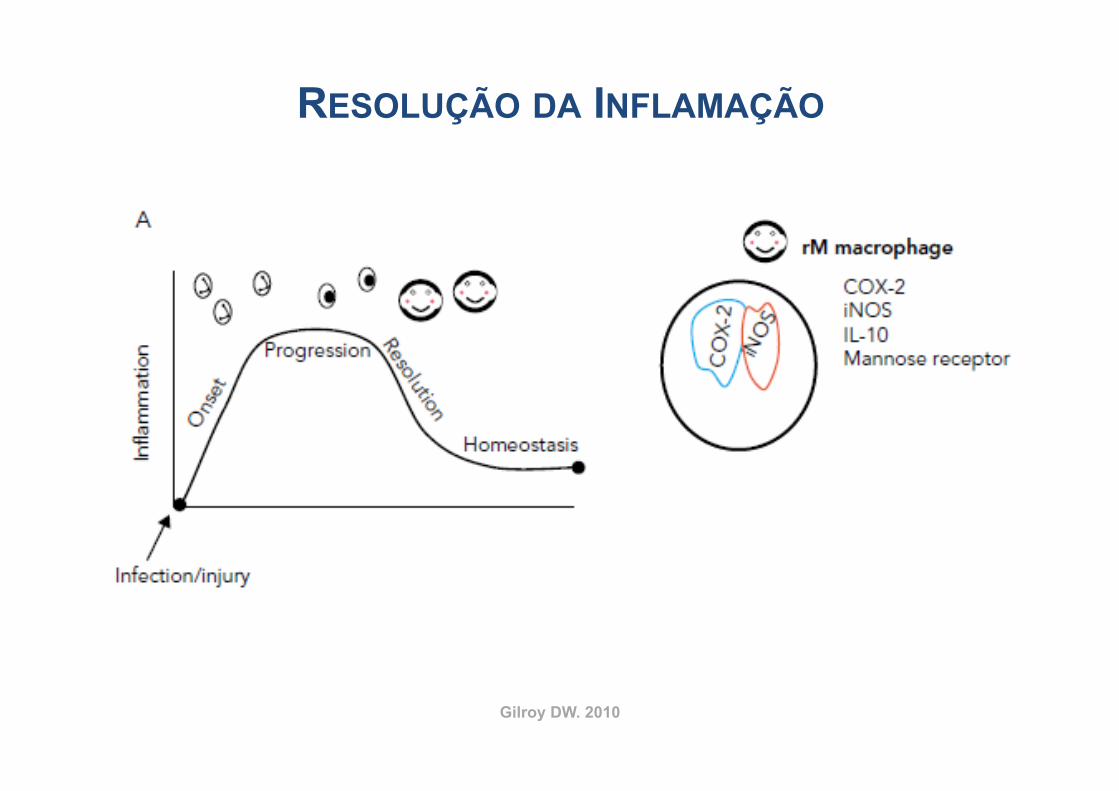
Gilroy DW. 2010
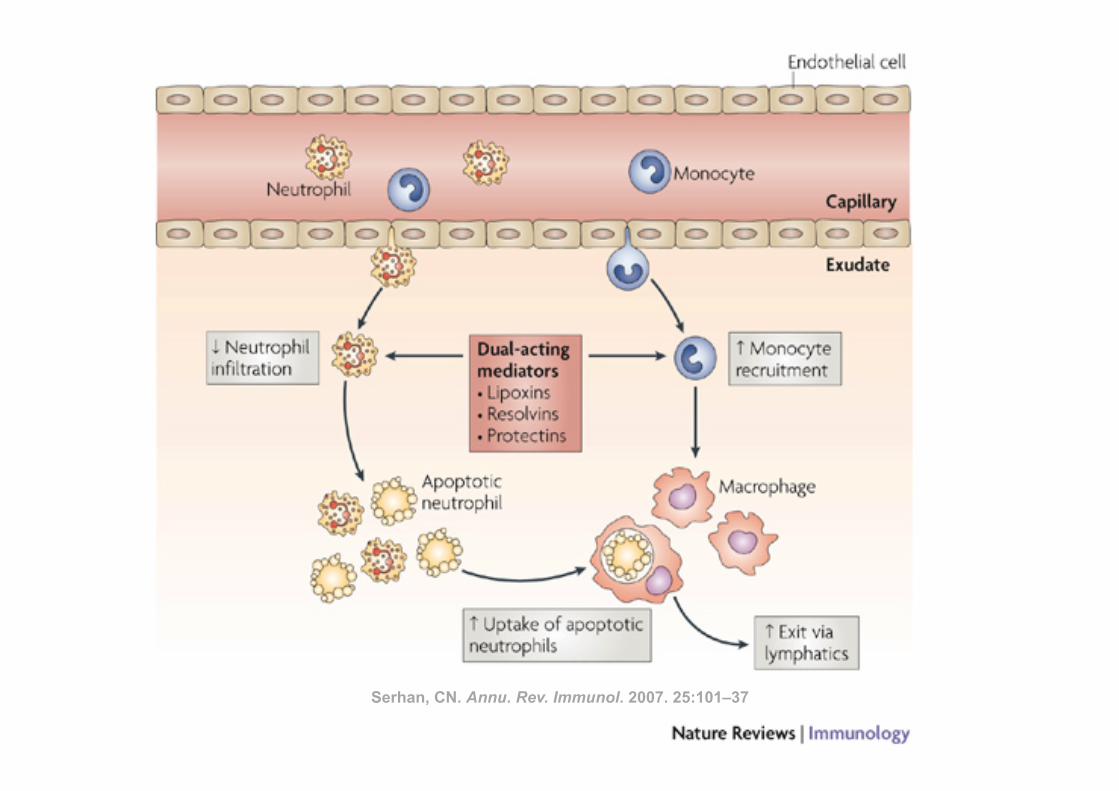
RESOLUÇÃO DA INFLAMAÇÃO
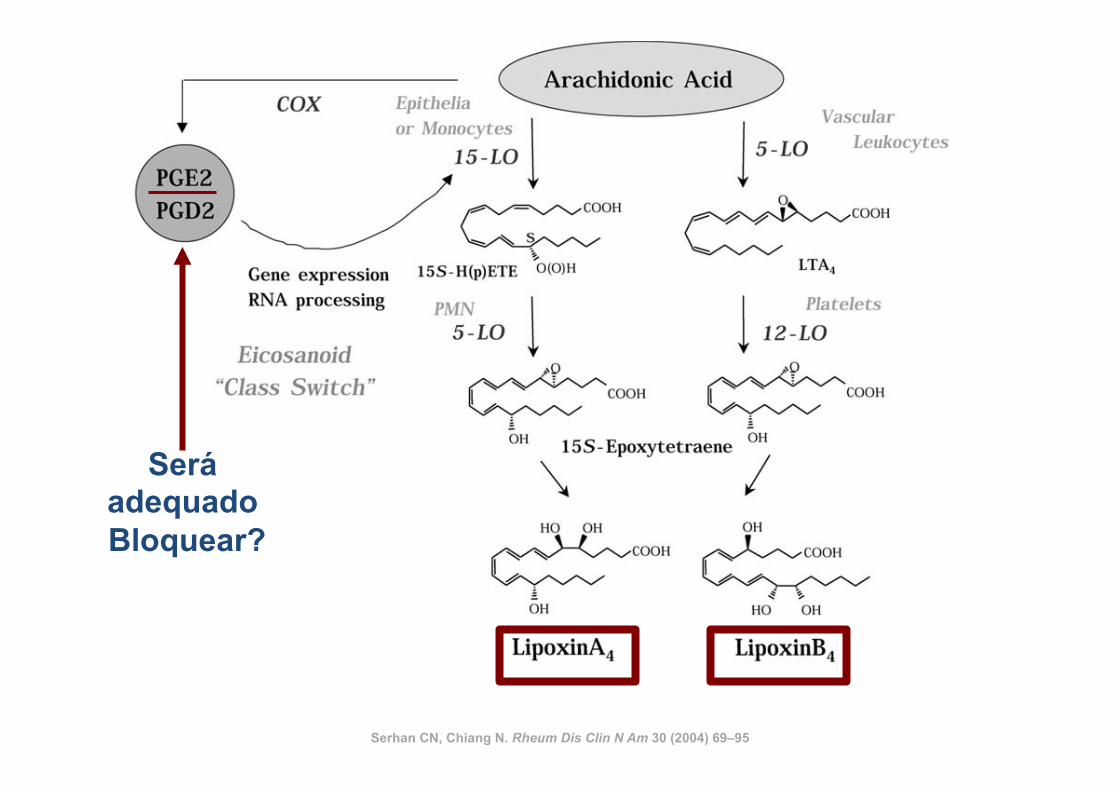
Serhan CN, Chiang N. Rheum Dis Clin N Am 30 (2004) 69–95
Será adequado Bloquear?
Serhan CN, Chiang N. Rheum Dis Clin N Am 30 (2004) 69–95
burden. Because PMN are the first line of host defense37,38
and rapidly respond to microbes as well as to soluble exo-and endogenous stimuli (bacterial peptide chemoattrac-tants, lipid mediators, for example, LTB4, chemokines, andcomplement components1), we considered it important tolearn the host’s mechanisms that control resolution. Fromancient times, in the war of acute inflammation, pus/exudatewas thought to passively retreat with the neutralization of theoffending agents or microbes or dissipation of the chemo-tactic signals for leukocytes.39 The importance of pus as anoble substance was known to ancient physicians, hence,the Latin phrase Pus bonum et laudable or “good and laud-able pus.” This, according to Prof. Guido Majno, referred towhitish creamy pus (enriched with leukocytes), which was a“good or preferable” response, whereas a thin or malodor-ous pus suggested to the practitioner a poor defenseand/or highly vicious bacteria.39 Today it is well appreciatedthat PMN play an essential role in host defense; their aber-rant and prolonged activation can give rise to tissue injuryobserved in many chronic diseases.1,37,40 Trauma and sur-gical treatments can also lead to injury from within, whereactivated PMN are central in exacerbating the injured tis-sues by releasing noxious agents. Although intended forhost defense from invading organisms/microbes, phago-
cytes can amplify injury via the release of proinflamma-tory mediators, reactive oxygen species (ROS), andenzymes (Figure 1). This is well appreciated and helpsexplain the pathophysiologies observed in many clini-cal scenarios.41– 44
Specialized Anti-Inflammatory andPro-resolving Mediators (SPM) inProgrammed Resolution
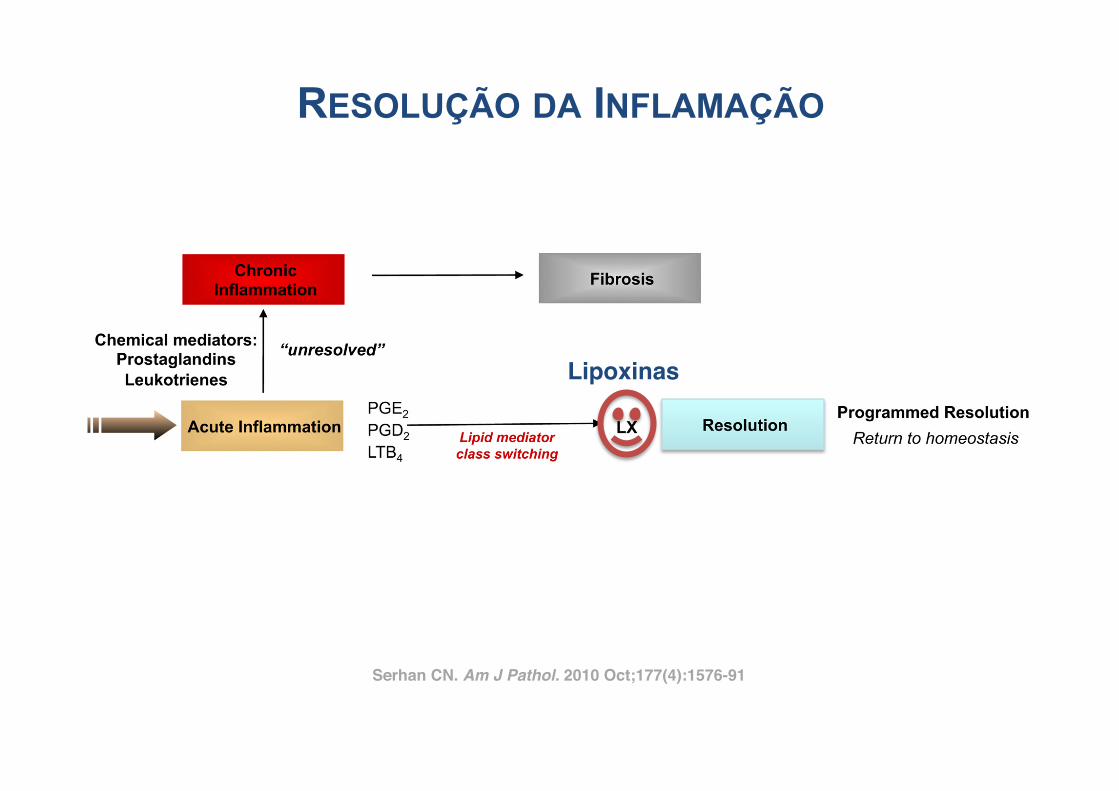
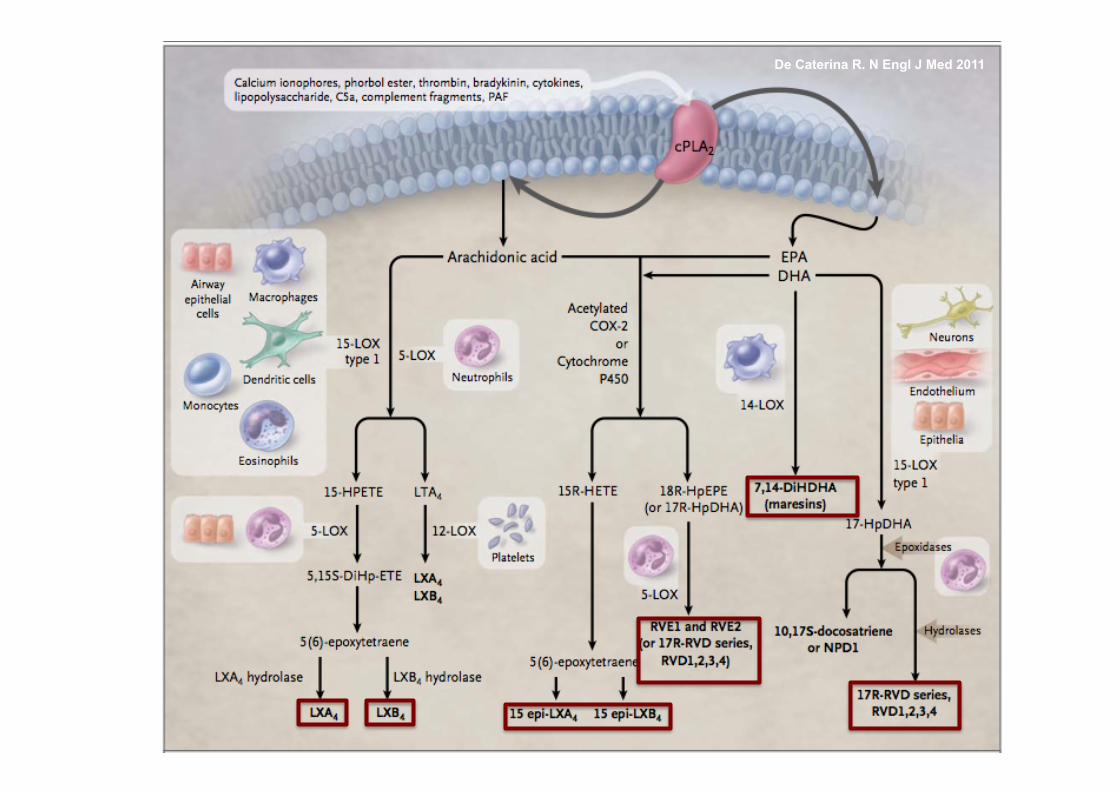
During acute self-limited inflammation, murine exudatephagocytes as well as human PMN and M! biosynthesizespecific, functionally distinct profiles of lipid-derived medi-ators (LM) that are agonist-dependent and temporally dis-sociated. Those that are proinflammatory include eico-sanoids, such as classic prostaglandins (PG) andleukotrienes (LT).45,46 New LM profiles8,9 including SPM(Figure 2) are generated by leukocyte exudates duringresolution. This new genus, comprising four novel chemicalmediator families, includes lipoxins (LX) from arachidonicacid, Rv and PD from !-3 essential fatty acids (EFA) (re-viewed in ref. 18), and the new maresins.21 Rv and PDs
Figure 2. Ideal outcome of acute inflammation: complete resolution. Using a systems approach to mapping resolution, temporal and spatial dissociation ofeicosanoids was uncovered, which is termed lipid mediator class switching. Prostaglandins and leukotrienes are generated early in the response. ProstaglandinsE2 and D2 stimulate the transcriptional regulation in human leukocytes for the production of enzymes required for lipoxin biosynthesis. Unresolved acuteinflammation is associated with increased prostaglandin and leukotriene production and chronic inflammation. Inset: Experimental acute inflammation shows thetemporal theoretical events in edema formation and its decline as well as leukocyte trafficking with nonphlogistic recruitment of PMNs.1,4 During the decline ofPMNs, specialized proresolving mediators are temporally produced in vivo in inflammatory exudates; see text for details.
1578 SerhanAJP October 2010, Vol. 177, No. 4
Serhan CN. Am J Pathol. 2010 Oct;177(4):1576-91!
Lipoxinas!
RESOLUÇÃO DA INFLAMAÇÃO
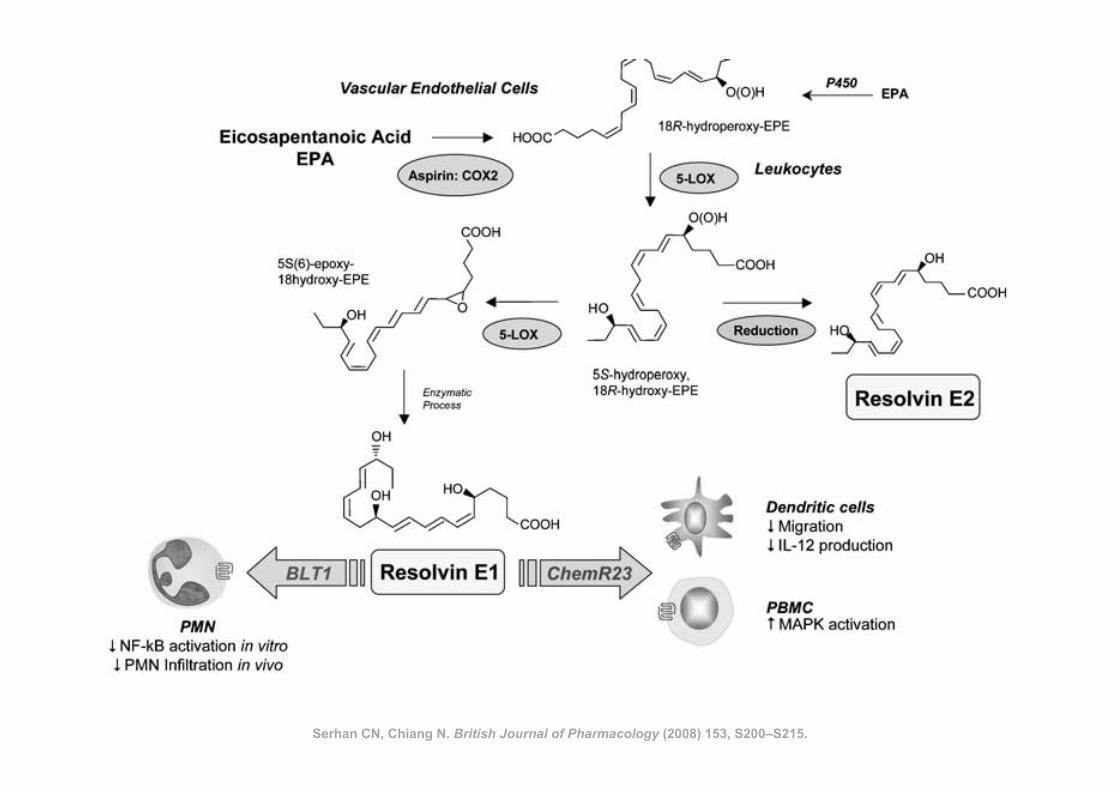
Serhan CN, Chiang N. British Journal of Pharmacology (2008) 153, S200–S215.
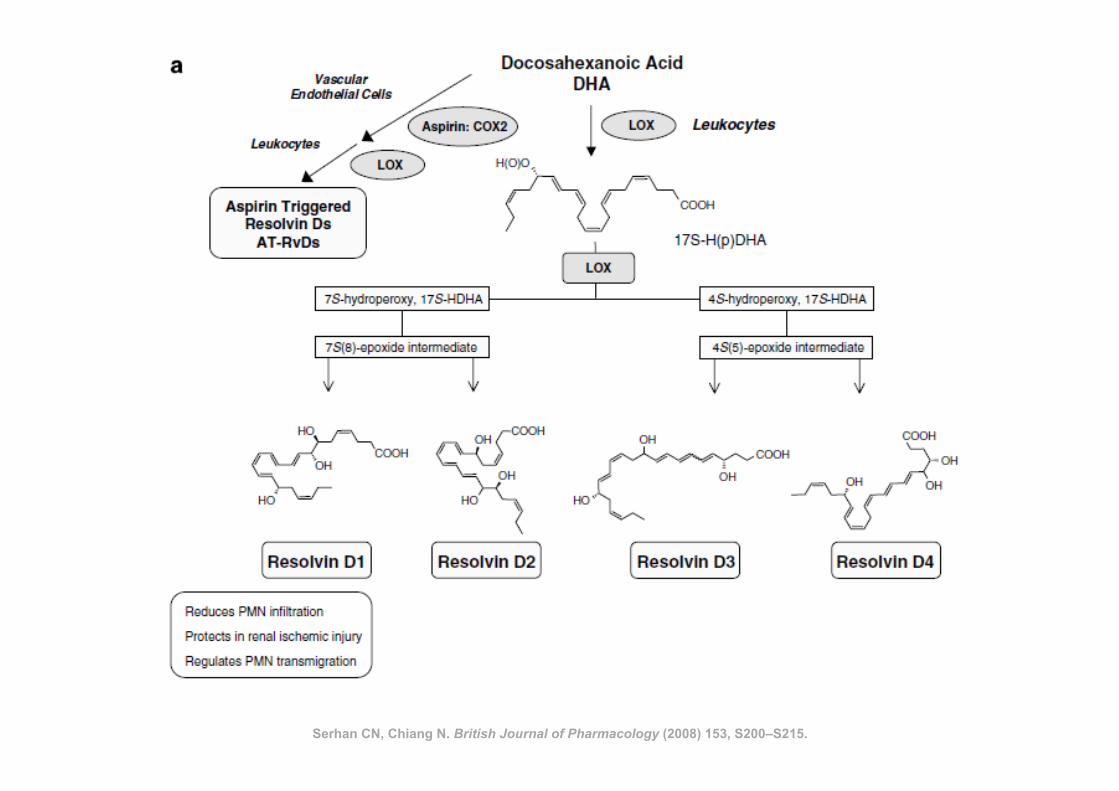
Serhan CN, Chiang N. British Journal of Pharmacology (2008) 153, S200–S215.
Serhan, CN. Annu. Rev. Immunol. 2007. 25:101–37
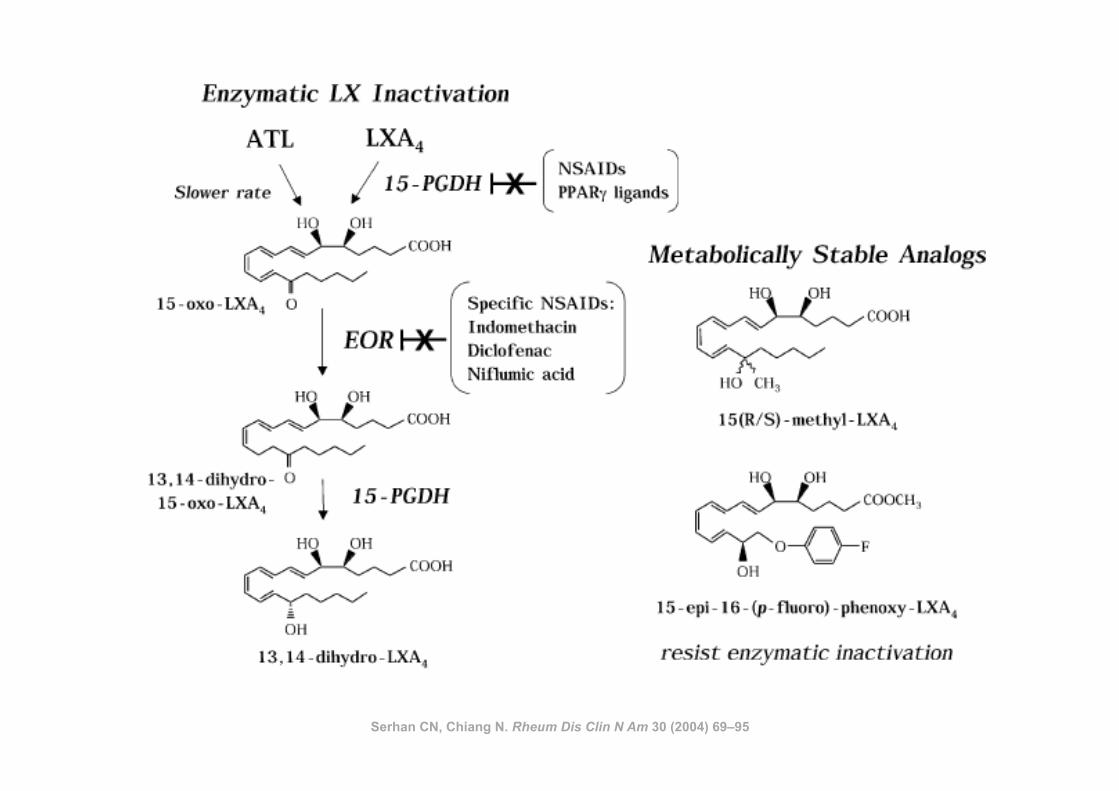
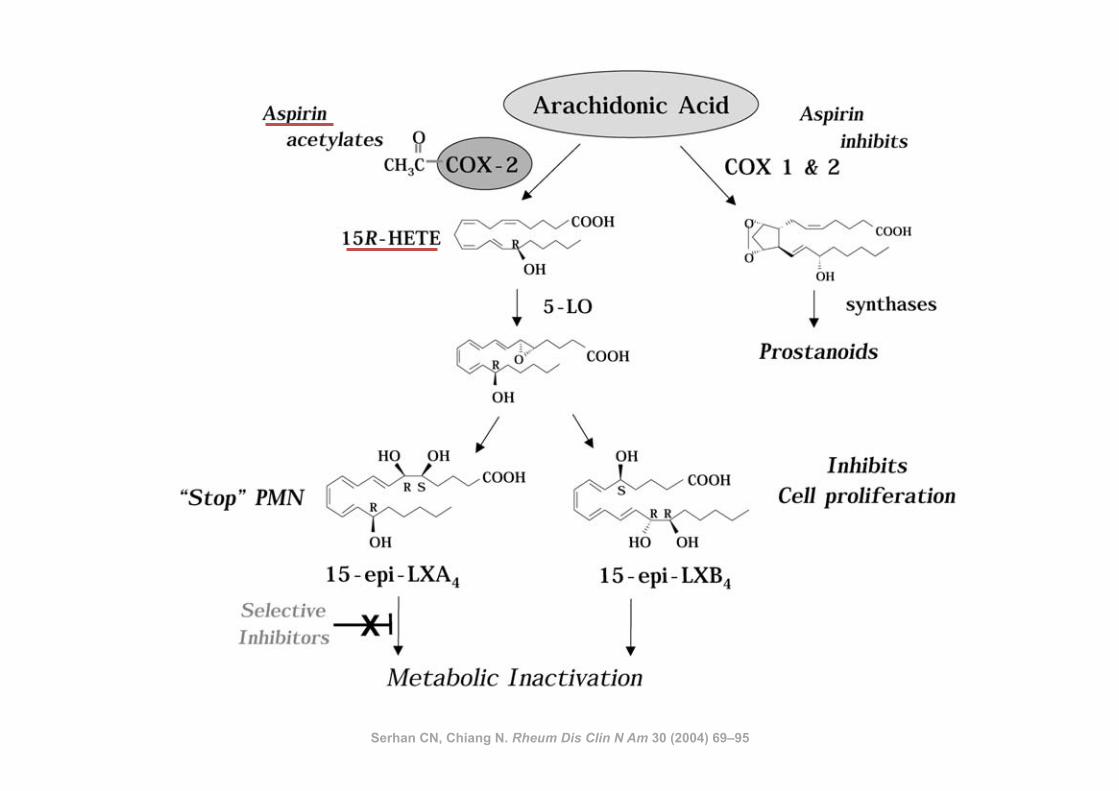
Serhan CN, Chiang N. Rheum Dis Clin N Am 30 (2004) 69–95
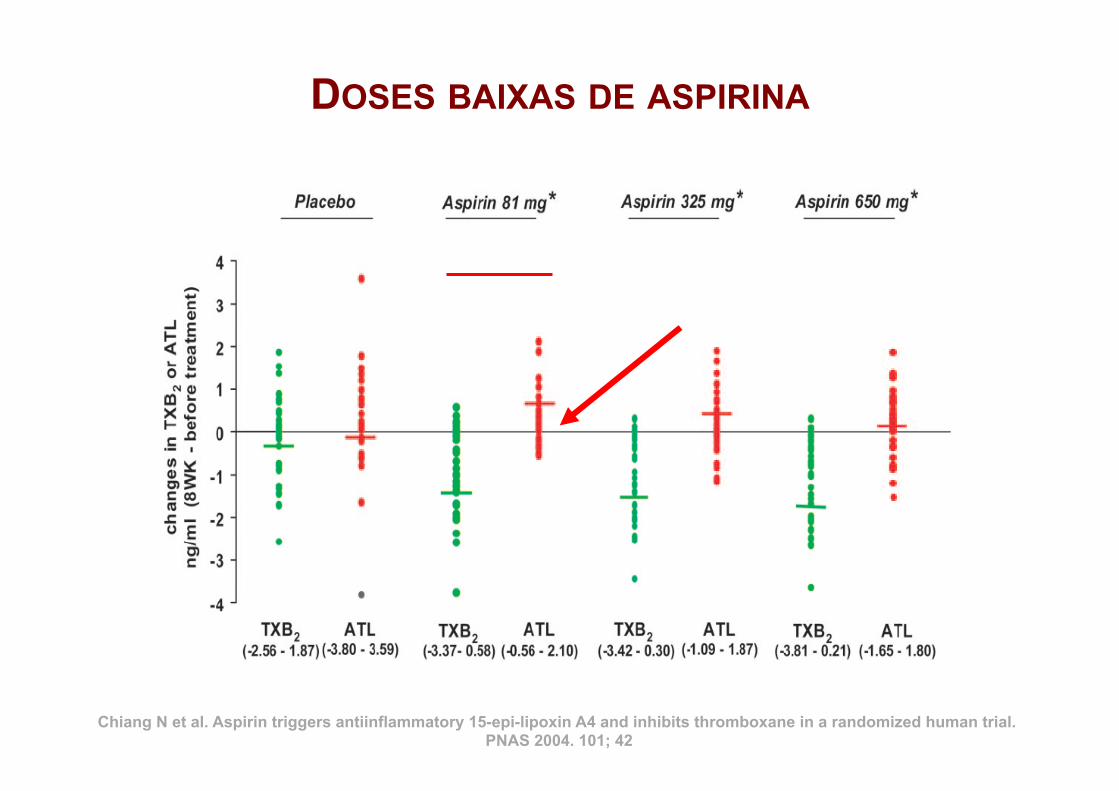
DOSES BAIXAS DE ASPIRINA
Chiang N et al. Aspirin triggers antiinflammatory 15-epi-lipoxin A4 and inhibits thromboxane in a randomized human trial. PNAS 2004. 101; 42
De Caterina R. N Engl J Med 2011
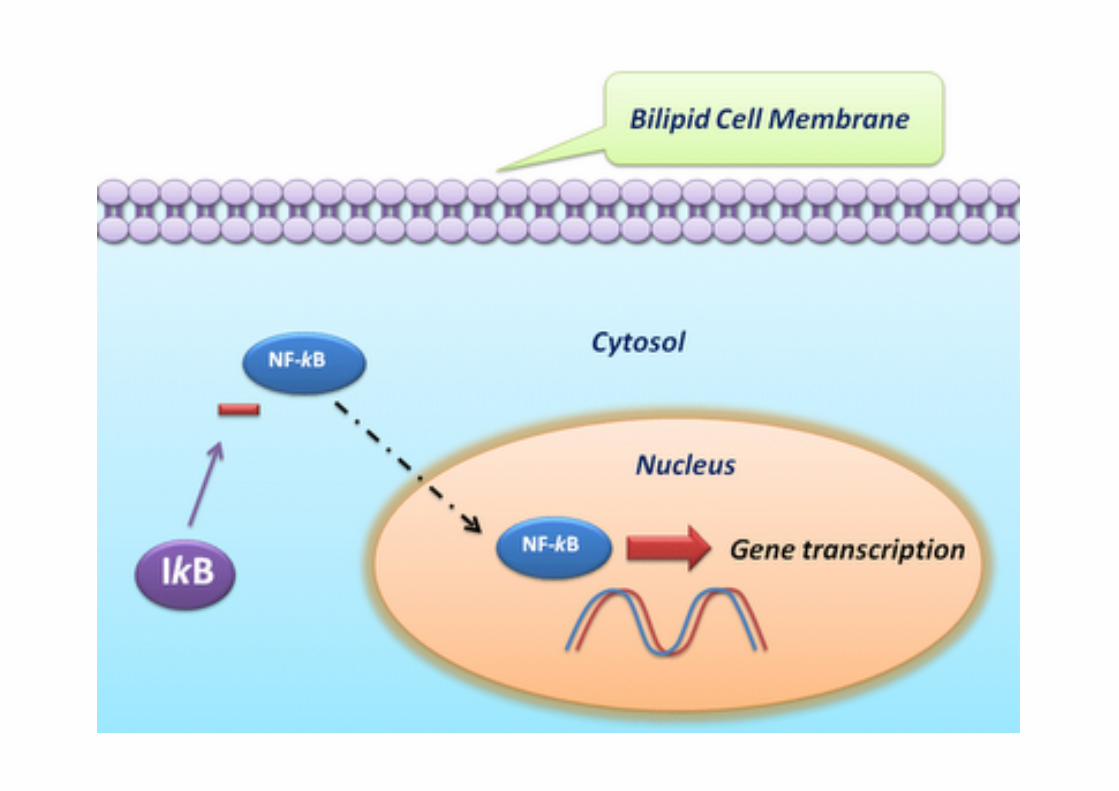
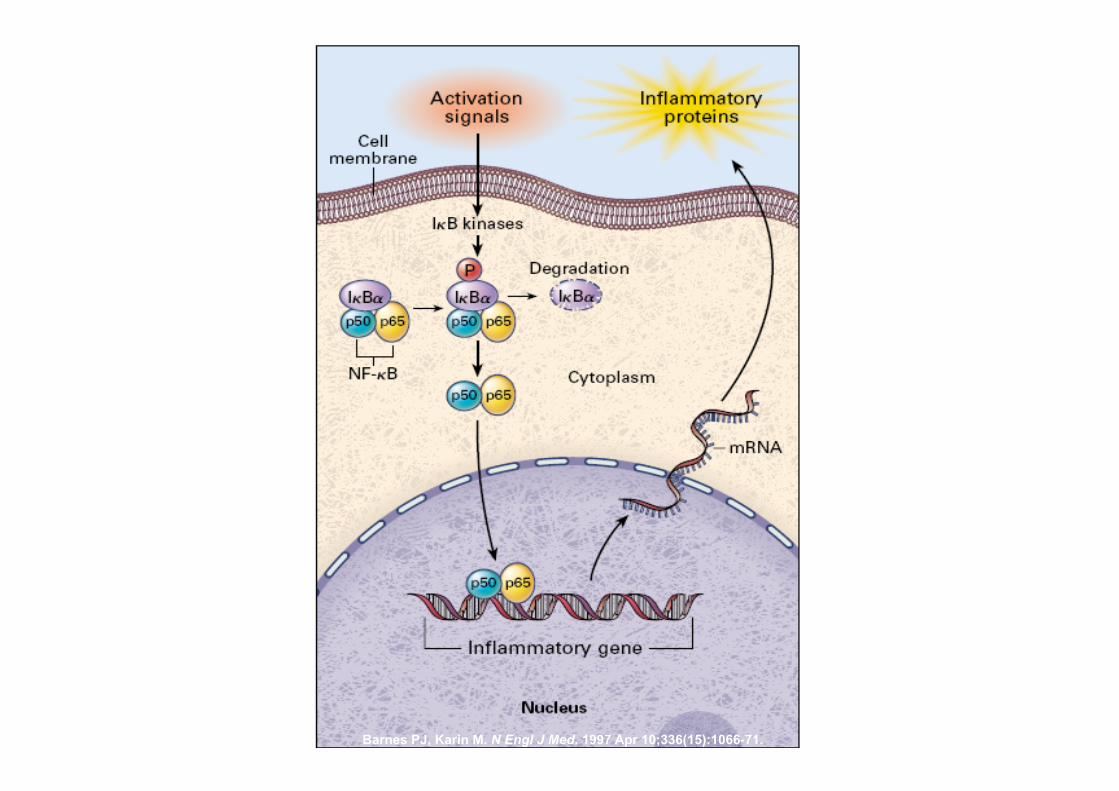
Barnes PJ, Karin M. N Engl J Med. 1997 Apr 10;336(15):1066-71.
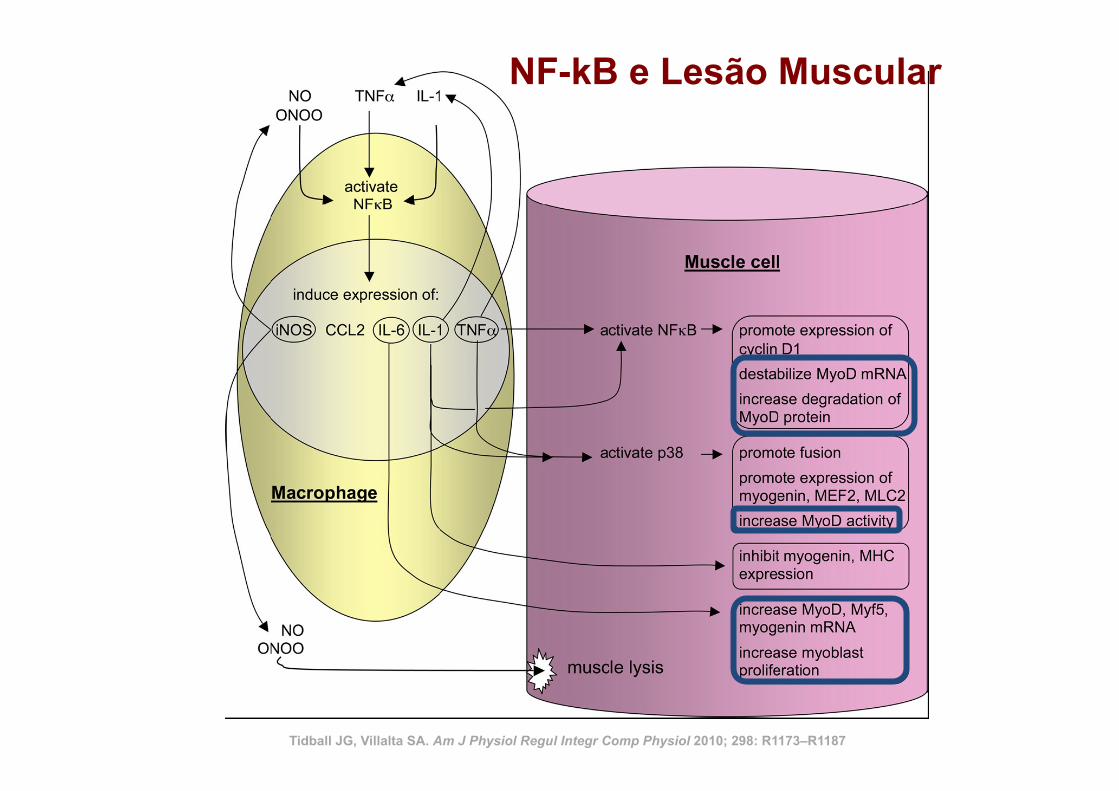
Tidball JG, Villalta SA. Am J Physiol Regul Integr Comp Physiol 2010; 298: R1173–R1187
NF-kB e Lesão Muscular
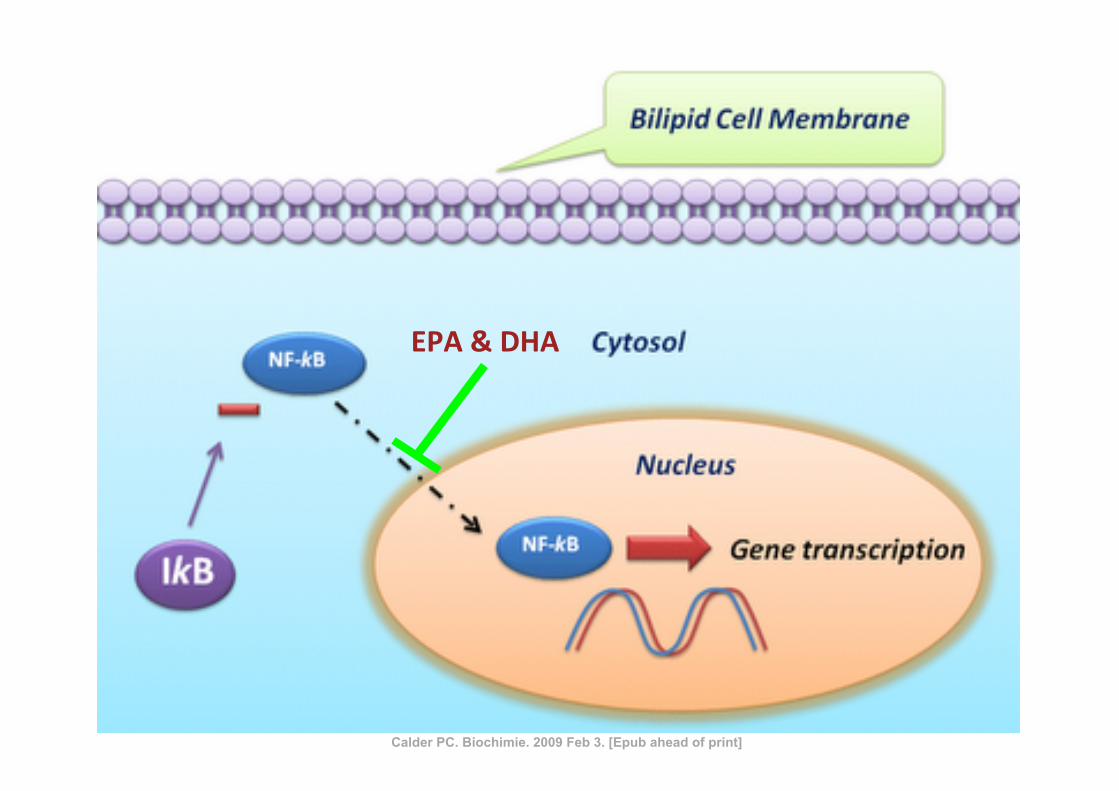
EPA & DHA
Calder PC. Biochimie. 2009 Feb 3. [Epub ahead of print]
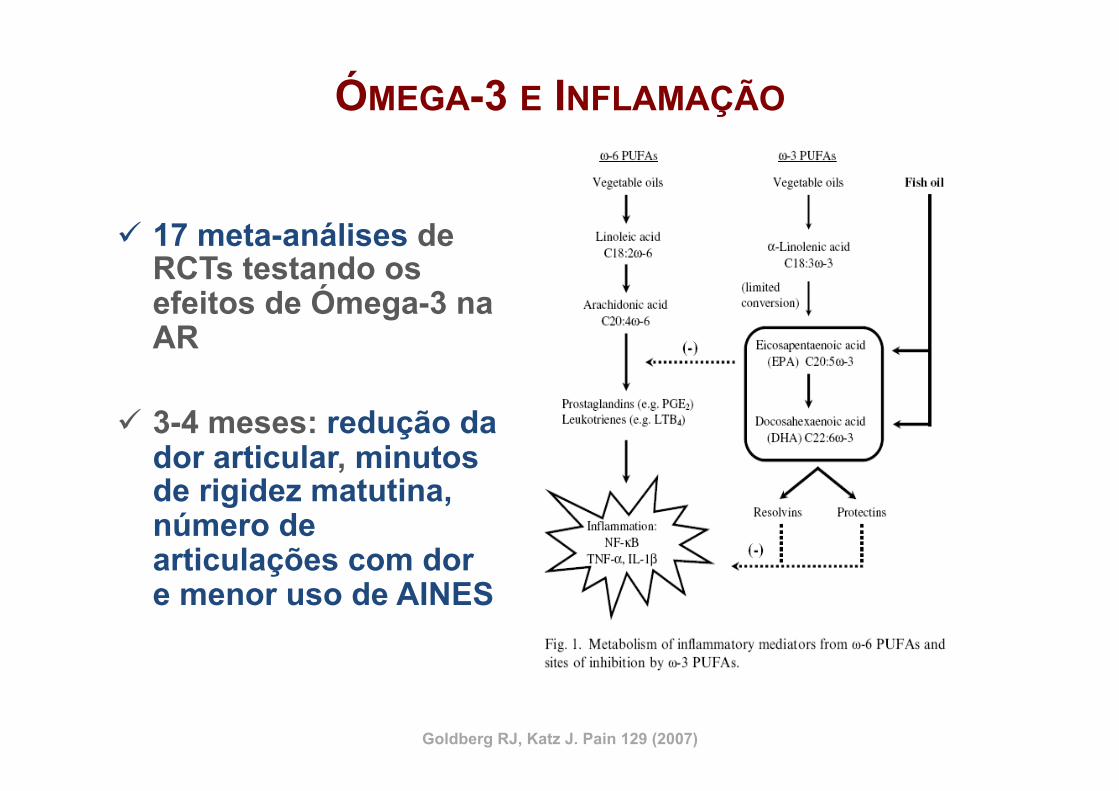
ÓMEGA-3 E INFLAMAÇÃO
ü 17 meta-análises de RCTs testando os efeitos de Ómega-3 na AR
ü 3-4 meses: redução da dor articular, minutos de rigidez matutina, número de articulações com dor e menor uso de AINES
Goldberg RJ, Katz J. Pain 129 (2007)
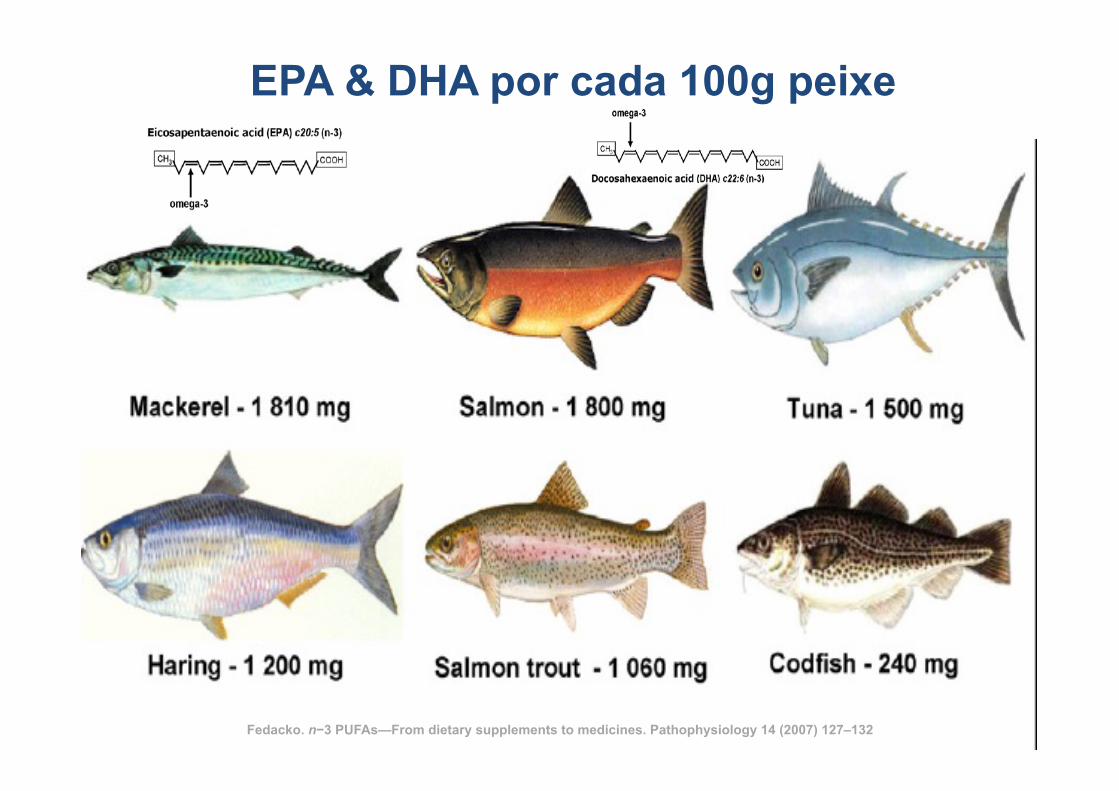
EPA & DHA por cada 100g peixe
Fedacko. n−3 PUFAs—From dietary supplements to medicines. Pathophysiology 14 (2007) 127–132
66
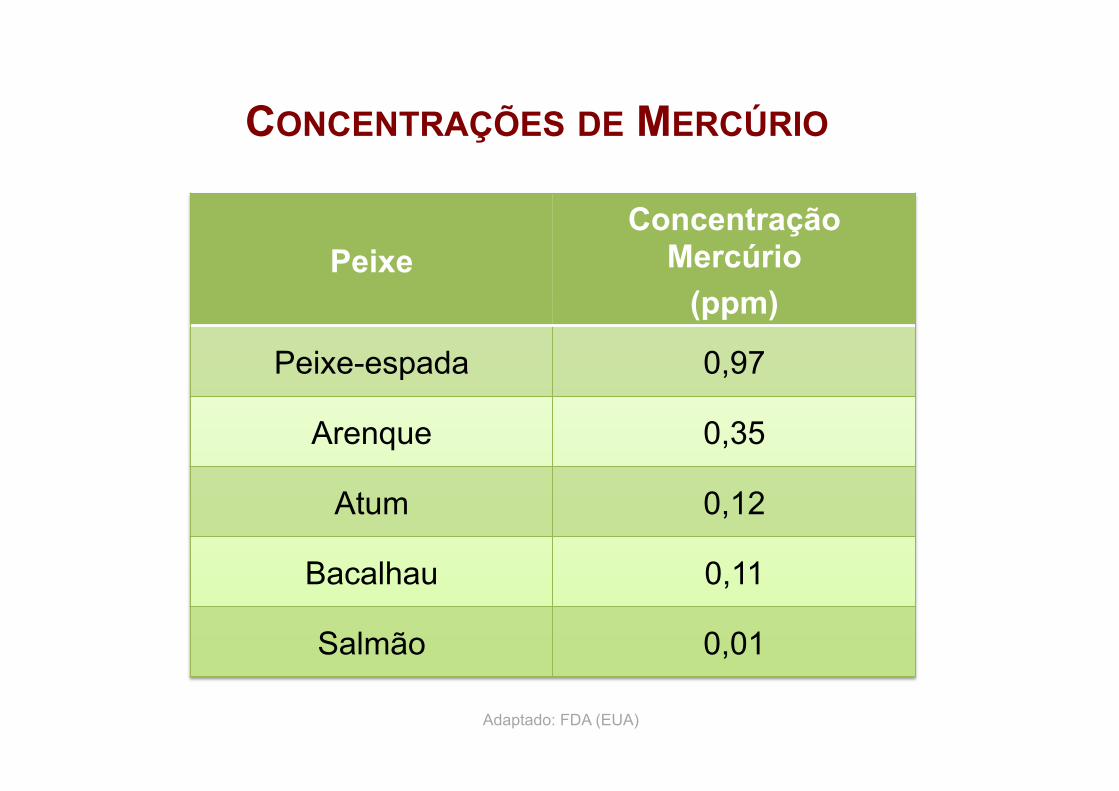
CONCENTRAÇÕES DE MERCÚRIO
Peixe Concentração
Mercúrio (ppm)
Peixe-espada 0,97
Arenque 0,35
Atum 0,12
Bacalhau 0,11
Salmão 0,01
Adaptado: FDA (EUA)
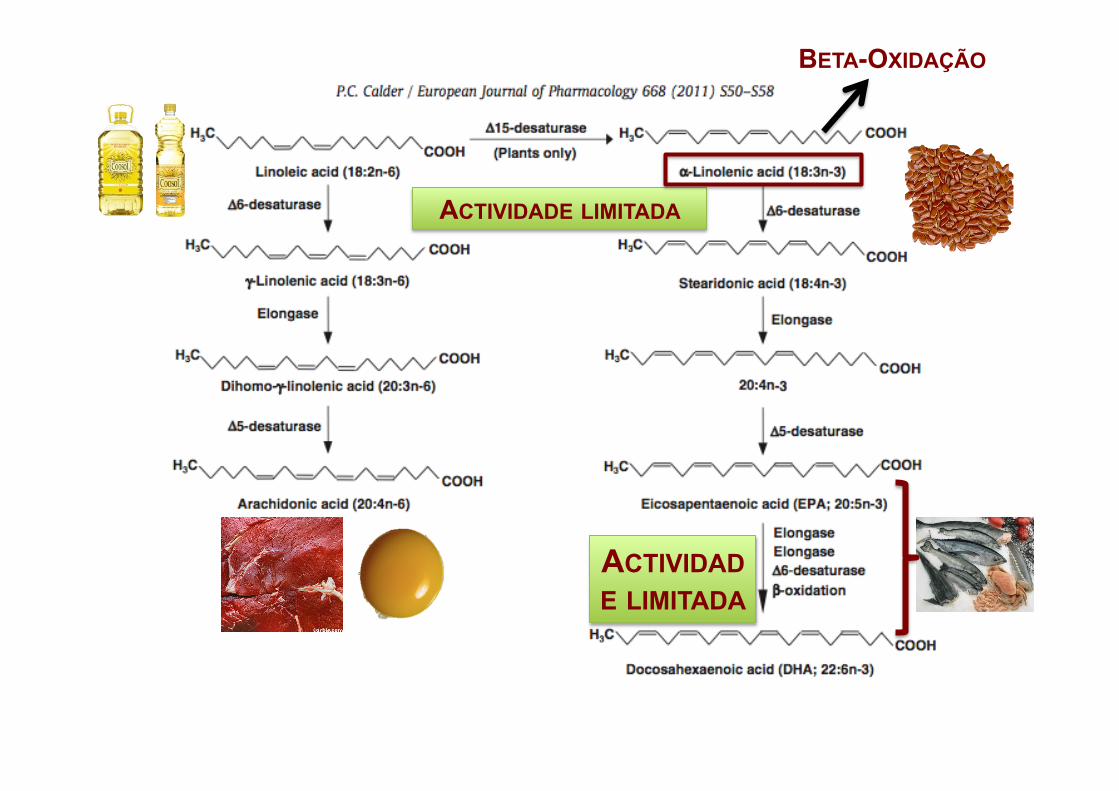
ACTIVIDADE LIMITADA
ACTIVIDADE LIMITADA
BETA-OXIDAÇÃO
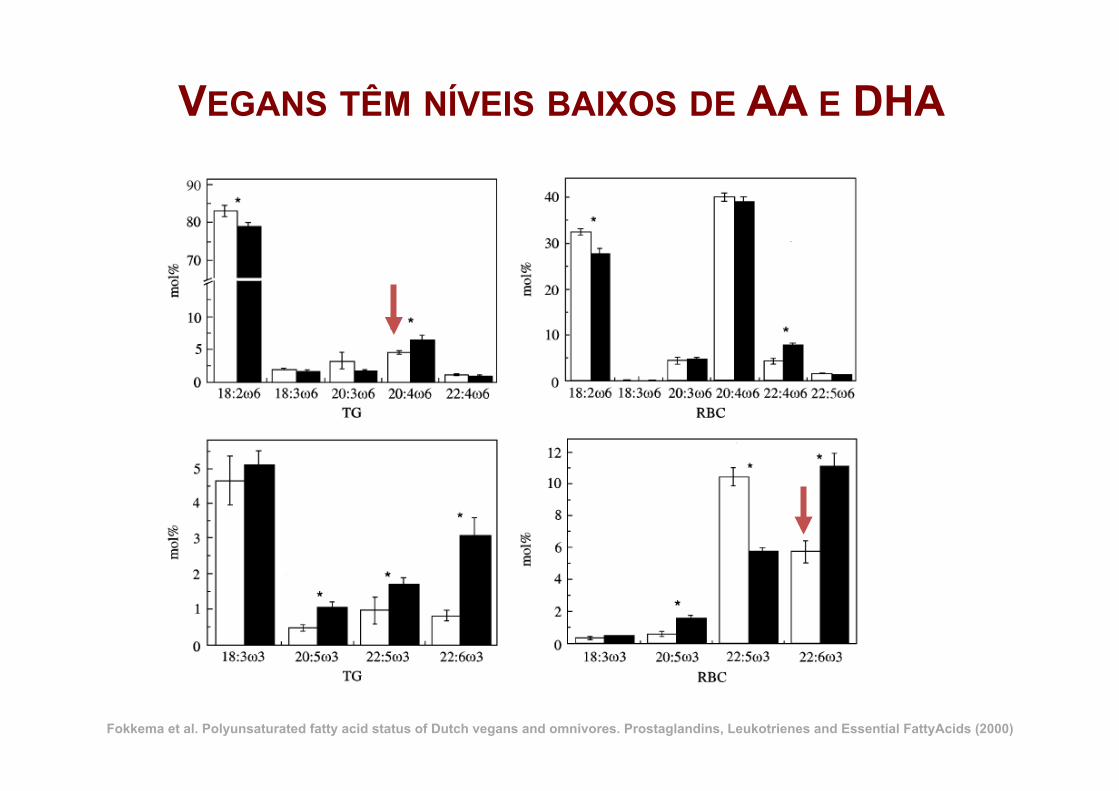
VEGANS TÊM NÍVEIS BAIXOS DE AA E DHA
Fokkema et al. Polyunsaturated fatty acid status of Dutch vegans and omnivores. Prostaglandins, Leukotrienes and Essential FattyAcids (2000)
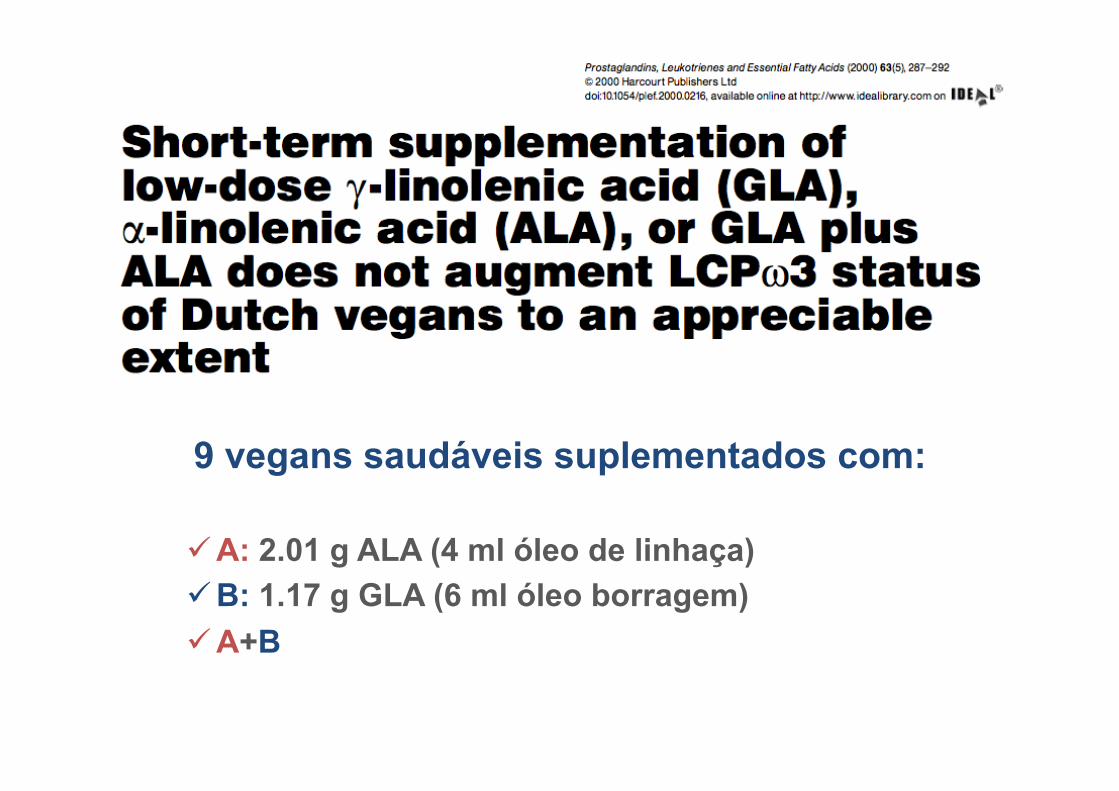
9 vegans saudáveis suplementados com:
ü A: 2.01 g ALA (4 ml óleo de linhaça) ü B: 1.17 g GLA (6 ml óleo borragem) ü A+B
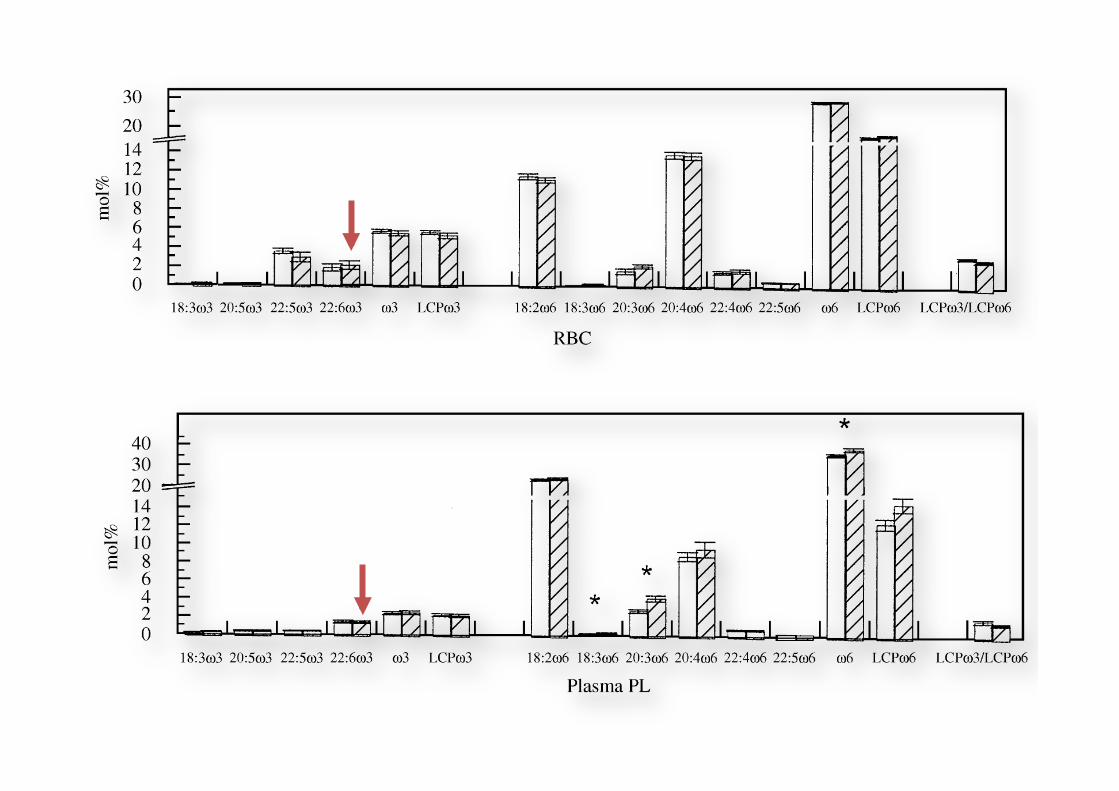
Fig. 1 Contents ofo3 ando6 fattyacids in RBC,PLT, plasma PL, plasma CEandplasmaTGof the combinedgroups Aand Bat baseline (openbars) andafter 8weekssupplementationwithALAandGLA (stripedbars).Datarepresentmean+SEM forninevegans.TheLCPo3/LCPo6 ratiowasmultiplied by10.The supplementation regimenwas:4 weeks 2.01g ALA (group A) and1.17 g GLA (group B), followedby 4 weeks1.17 gGLA! 2.01g ALA (groups Aand B).*Significantly different at P5 0.05 by Student’s t - test.
Short-term supplementation of low-dose GLA, ALAor GLA plus ALAdoes not significantly augment LCPo 3 status 291
& 2000 Harcourt Publishers Ltd Prostaglandins, Leukotrienes and Essential FattyAcids (2000) 63(5), 287^292
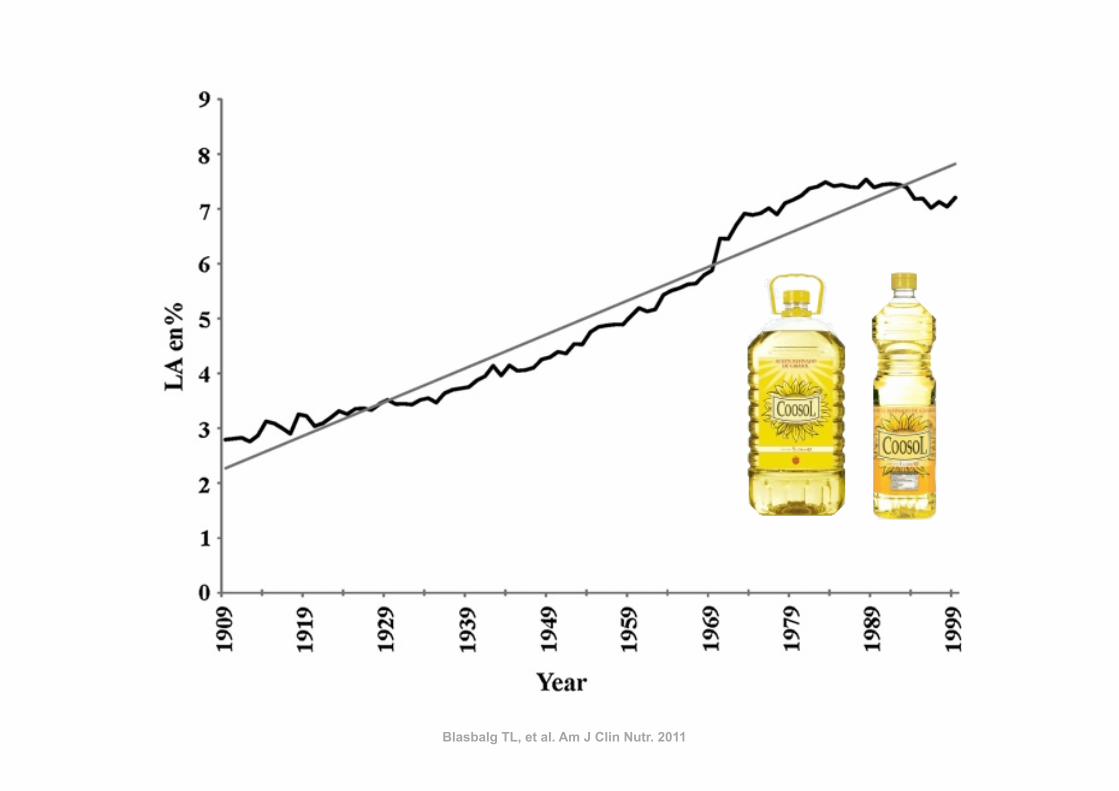
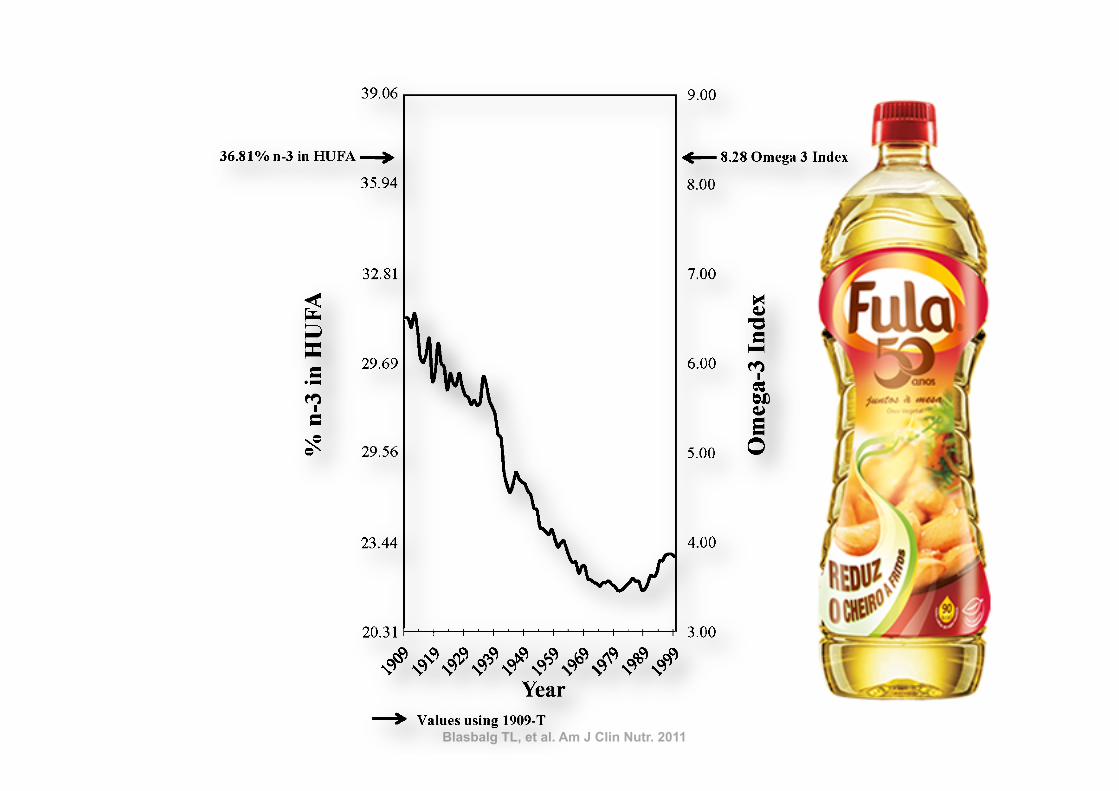
Blasbalg TL, et al. Am J Clin Nutr. 2011
.1000-fold. In the case of LA, soybean oil replaced all othersources in general. In contrast, soybean oil specifically replaceddairy, fats, and pork as a primary source of ALA.
There has been little change in the sources of other essentialfatty acids (Figure 7). Dietary AA came primarily from poultry,eggs, beef, and pork, with the contribution from poultry in-creasing 211%, from eggs decreasing 22%, and from beef de-creasing 39% (Table 9). EPA and DHAwere obtained primarilyfrom finfish, with smaller amounts from shellfish, poultry, eggs,and beef. Contributions from poultry and shellfish have been in-creasing, whereas contributions from finfish and beef have beendecreasing (Tables 10 and 11). DPA n23 came from poultry,finfish, shellfish, and beef. The increased estimated per capitaconsumption of poultry led to an increase in its role as a source ofDPA n23 (5-fold) (Table 12). Although there has been littlechange in the estimated per capita consumption of finfish, itsimportance as a source of DPA n23 has decreased by 47%.
Changes in the estimated composition of HUFAs in tissuemembranes
With the use of standard CNPP methods to compared 1909-Cto 1999 diets, the predicted percentage of n23 in HUFAs de-creased 27% from 31.28% to 22.95% (Figure 8, Table 6),
whereas the estimated omega-3 index decreased 41% from 6.51to 3.84. With the use of the nutrient-composition data sets tocompare 1909-T to 1999 diets, the percentage of n23 in HUFAsdecreased 38%, from 36.81% to 22.95%, and the omega-3 indexdecreased 54% from 8.28 to 3.84.
Source of change in the estimated composition of n23HUFAs in tissues membranes over time
The series of 6 additional plots that used the LA percentage ofenergy data input into the tissue equation of Lands et al (2) for theprediction of the percentage of n23 in HUFAs closely resembledthe results of the original prediction function that used the actualhistorical data (Figure 9A). The series of plots that used theALA percentage of energy data indicated that changes in ALAdid not contribute much to the predicted changes in the per-centage of n23 in HUFAs compared with in LA (Figure 9B).
DISCUSSION
The most striking modification of the US food supply duringthe 20th century was the .1000-fold increase in the estimatedper capita consumption of soybean oil from 0.006% to 7.38%of energy. The increased soybean oil availability produced
FIGURE 4. Regression analysis for the availability of linoleic acid (LA)between 1909 and 1999. The linear relation [LA percentage of energy(en%) = 2115.4221 + 0.0617 · x] was significant at P , 0.000001 witha coefficient of determination of r2 = 0.95 (STATISTICA for Windowsversion 8.0; StatSoft, Tulsa, OK).
TABLE 6Measures of essential fatty acid status1
Percentage difference
1909 Traditional 1909 Current 1999 Traditional Current
Total n26 to n23 ratio 5.4 6.7 9.6 77 42LA to ALA ratio 6.5 7.3 10.0 55 38Percentage of n23 in HUFAs 36.81 31.28 22.95 238 227Percentage of n26 in HUFAs 63.19 68.72 77.05 22 12Total HUFAs (%) 100 100 100 — —Omega-3 index 8.28 6.51 3.84 254 241
1 LA, linoleic acid; ALA, a-linolenic acid; HUFAs, highly unsaturated fatty acids.
FIGURE 5. Changes in ratios of n26 to n23 fatty acids in the US foodsupply from 1909 to 1999. Linoleic acid (LA)/a-linolenic acid (ALA) isindicated by a solid line, total n–6/total n–3 fatty acids by a dashed grayline, and n–6 highly unsaturated fatty acids (HUFAs)/n–3 HUFAs by a dottedline. 1909-T (foods produced by traditional early 20th century practices)data are indicated by the solid arrow for the LA/ALA ratio and by adashed gray arrow for the ratio of total n26 to n23. The LA:ALA ratiowas lowest for 1909-T foods (6.4) and highest for 1999 foods (10.0). Theratio of total n26 to n23 was 5.4 in 1909-T and 9.6 in 1999.
ESSENTIAL FATTY ACID INTAKE IN THE 20TH CENTURY 7 of 13
Blasbalg TL, et al. Am J Clin Nutr. 2011
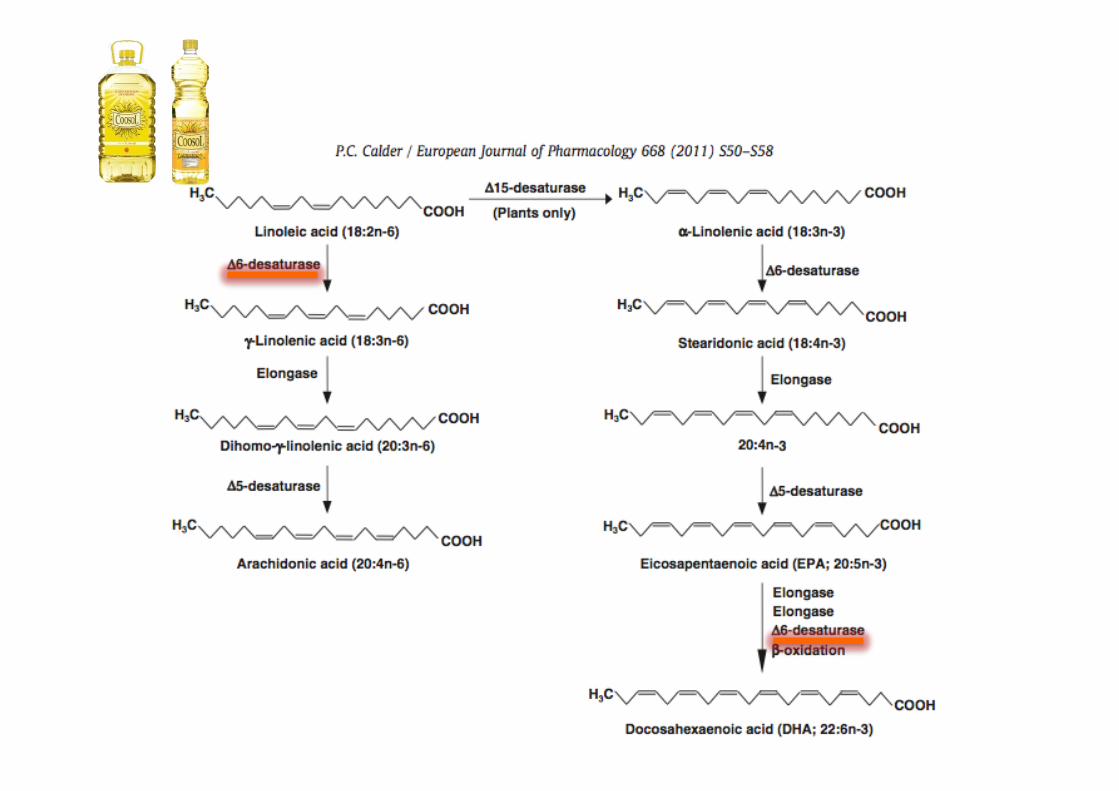
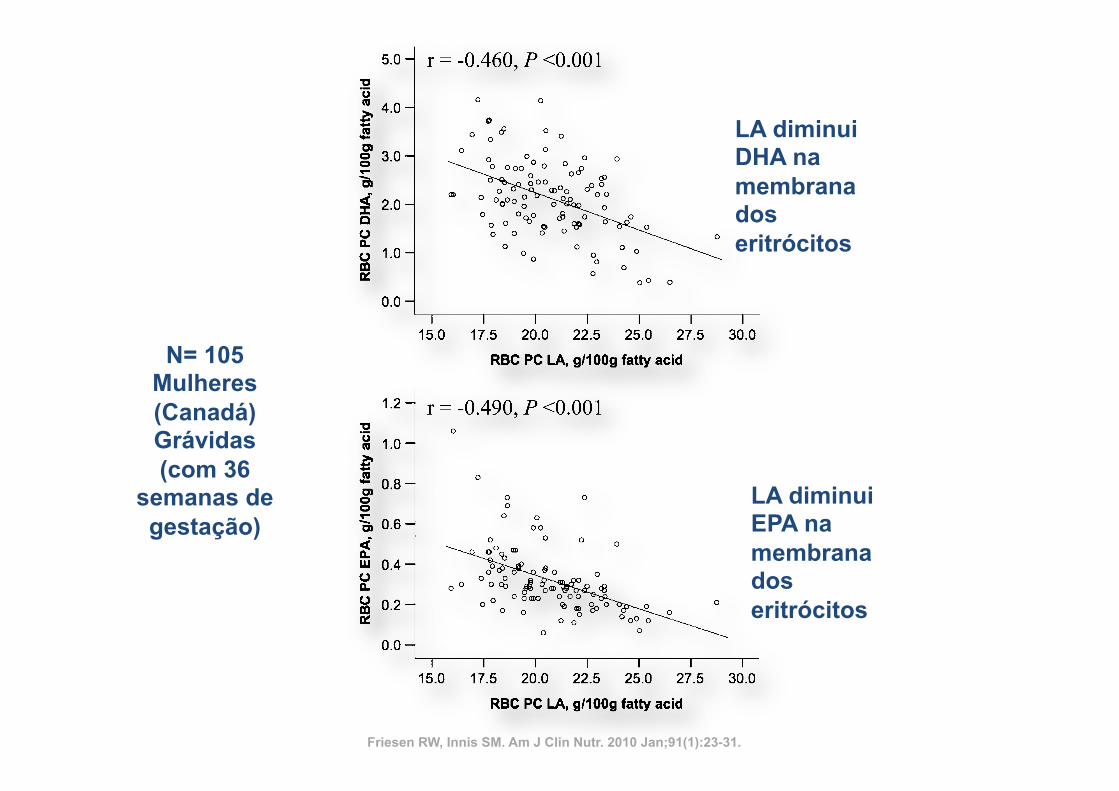
impairment of the conversion of 24:5n23–24:6n23 by com-peting for the active site of D6-desaturase in the endoplasmicreticulum (34, 35), which inhibits the production of DHA(22:6n23); and 3) the impairment of the incorporation of EPA,DPA n23, DHA, and n26 AA into tissue membranes bycompeting for esterification into the sn-2 position of phospho-lipids (36). The competition of LA with n23 and n26 HUFAsfor phospholipid incorporation may account for the significantinverse correlation of LAwith EPA (r =20.46, P, 0.01), DHA(r = 20.49, P , 0.01), and AA (r = 20.60, P , 0.01) shown inerythrocyte phosphatidylcholine of pregnant Canadians as re-ported by Friesen and Innis (36). In the Los Angeles VeteransStudy, a very high–LA diet (15% of energy) reduced AA con-centrations by 40% (P , 0.05) in coronary atheroma phospho-
lipids (37), presumably via the same mechanism. Thus, highdietary intakes of LA may displace AA in tissues, which mayaccount for the potential benefits of LA at very high intakes.However, because LA may also displace EPA and DHA, neteffects may be nonlinear and difficult to predict.
A randomized trial that compared the effects of infant formulaswith high LA (6.7% of energy) compared with low LA (1.7% of
FIGURE 8. Omega-3 tissue highly unsaturated fatty acid (HUFA)predictions over the 20th century. Solid arrows indicate the percentage ofn23 in HUFA (36.8%) and the estimated omega-3 index (8.3) calculatedfrom available nutrient intakes for 1909 traditional foods (1909-T).
TABLE 11Sources of docosapentaenoic acid1
Food category
Percentage contributionPercentagedifference1909 1999
Poultry 10.59 63.65 501Legumes 4.29 3.99 27Beef 3.02 1.84 239Finfish 28.97 15.38 247Shellfish 53.13 13.92 274Game 0 0.26 NAOils 0 0.94 NASpice 0 0.03 NATotal 100 100 —
1 NA, not applicable.
TABLE 12Sources of docosahexaenoic acid1
Food category
Percentage contributionPercentagedifference1909 1999
Poultry 6.64 25.42 283Shellfish 8.12 12.49 54Eggs 14.75 11.78 220Finfish 59.99 43.39 228Beef 10.49 6.84 235Game 0 0.10 NATotal 100 100 —
1 NA, not applicable.
FIGURE 9. Time-series determination of the dependence of thepercentage of n23 in highly unsaturated fatty acids (HUFA) on linoleicacid (LA) (A) compared with on a-linolenic acid (ALA) (B). Slopes ofsuggested regression lines between contrived series plots (dashed lines)and original functions (bold lines) were similar in direction and magnitudefor LA. For ALA, slopes of regression lines were opposite in direction andlower in magnitude than the original prediction plot. Therefore, the tissuepercentage of n23 in HUFAwas dependent on changes in dietary LA ratherthan in ALA.
10 of 13 BLASBALG ET AL
population (38). However, errors in dietary reporting, which ofteninclude underreporting in dietary records but a tendency foroverreporting in FFQs, are well known (54), but these would biasresults to weaker associations between dietary intakes andmeasures of blood lipid fatty acids and are not likely to have led toinflated associations among RBC membrane fatty acids. We didnot consider potential modifying effects of other nutrients orgenetic variables, such as polymorphisms in FADS2 and FADS1(55, 56). Fish, and thus EPA and DHA intakes, are relatively lowin our population, which limited the ability to identify effects ofhigher EPA and DHA intakes on n26 fatty acids. Regardless, thepresent study highlights that DHA, EPA, and ARA incorporationinto membrane lipids is complex. Interactions among fattyacids may include inhibition of DHA and EPA synthesis fromALA, but may also reflect effects of LA in reducing the con-centrations of n23 fatty acids through competition for acylation,
which is shifted to favor higher EPA and DHA by increasingthe dietary intake of preformed EPA and DHA. Finally, ourresults show that DHA intakes are skewed, with elevated RBCEPG concentrations of n26 fatty acids with 22 carbon chainsamong women with low DHA intakes, which suggests thatDHA status may be low among some pregnant women in ourcommunity.
We particularly thank Janette D King for providing laboratory analysis andShalu Duggal for subject enrollment and collection of the dietary and socio-demographic data.
The authors’ responsibilities were as follows—SMI (principal investiga-tor): conceived, designed, and implemented the study; RWF: undertookthe dietary and data analysis as part of the requirements for an MSc degree;and SMI and RWF: wrote the manuscript. Neither of the authors had any po-tential conflicts of interest.
FIGURE 4. Scatter plots of the inverse relation between concentrations of linoleic acid (LA) and docosahexaenoic acid (DHA), eicosapentaenoic acid(EPA), and arachidonic acid (ARA) in red blood cell (RBC) phosphatidylcholine (PC) and ethanolamine phosphoglyceride (EPG). n = 105 Canadian women at36 wk of gestation. The results were analyzed by using Pearson correlation analysis.
DIET AND RED BLOOD CELL n–6 AND n–3 FATTY ACIDS 29
at Lund University Libraries on April 6, 2011
ww
w.ajcn.org
Dow
nloaded from
LA diminui DHA na membrana dos eritrócitos
LA diminui EPA na membrana dos eritrócitos
Friesen RW, Innis SM. Am J Clin Nutr. 2010 Jan;91(1):23-31.
N= 105 Mulheres (Canadá) Grávidas (com 36
semanas de gestação)
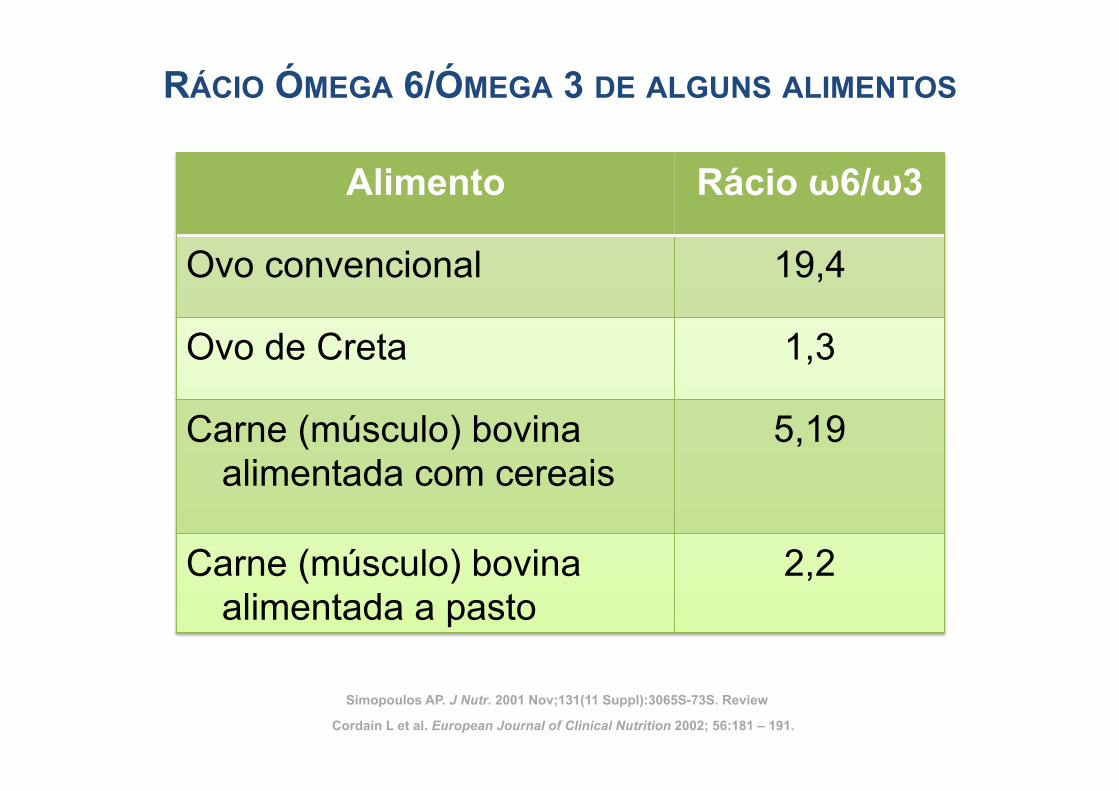
RÁCIO ÓMEGA 6/ÓMEGA 3 DE ALGUNS ALIMENTOS
Alimento Rácio ω6/ω3
Ovo convencional 19,4
Ovo de Creta 1,3
Carne (músculo) bovina alimentada com cereais
5,19
Carne (músculo) bovina alimentada a pasto
2,2
Cordain L et al. European Journal of Clinical Nutrition 2002; 56:181 – 191.
Simopoulos AP. J Nutr. 2001 Nov;131(11 Suppl):3065S-73S. Review
Original Research
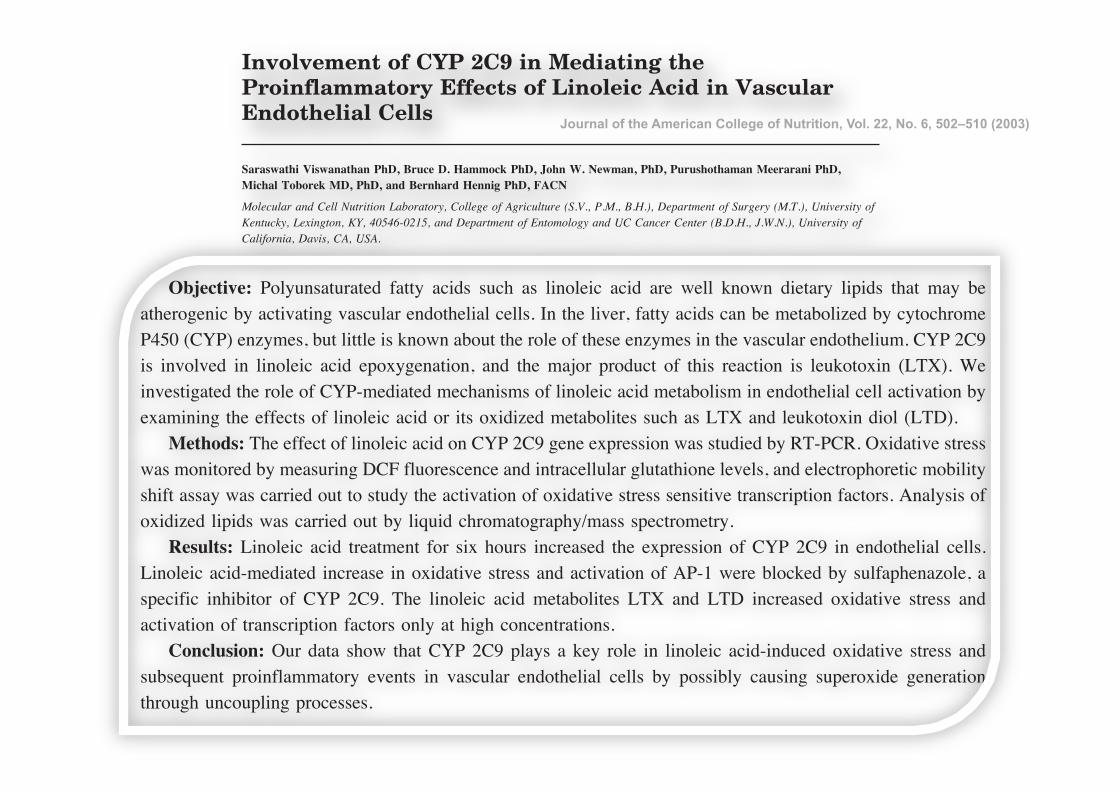
Involvement of CYP 2C9 in Mediating theProinflammatory Effects of Linoleic Acid in VascularEndothelial Cells
Saraswathi Viswanathan PhD, Bruce D. Hammock PhD, John W. Newman, PhD, Purushothaman Meerarani PhD,Michal Toborek MD, PhD, and Bernhard Hennig PhD, FACN
Molecular and Cell Nutrition Laboratory, College of Agriculture (S.V., P.M., B.H.), Department of Surgery (M.T.), University ofKentucky, Lexington, KY, 40546-0215, and Department of Entomology and UC Cancer Center (B.D.H., J.W.N.), University ofCalifornia, Davis, CA, USA.
Key words: linoleic acid, CYP 2C9, leukotoxin, leukotoxin diol, oxidative stress
Objective: Polyunsaturated fatty acids such as linoleic acid are well known dietary lipids that may beatherogenic by activating vascular endothelial cells. In the liver, fatty acids can be metabolized by cytochromeP450 (CYP) enzymes, but little is known about the role of these enzymes in the vascular endothelium. CYP 2C9is involved in linoleic acid epoxygenation, and the major product of this reaction is leukotoxin (LTX). Weinvestigated the role of CYP-mediated mechanisms of linoleic acid metabolism in endothelial cell activation byexamining the effects of linoleic acid or its oxidized metabolites such as LTX and leukotoxin diol (LTD).Methods: The effect of linoleic acid on CYP 2C9 gene expression was studied by RT-PCR. Oxidative stress
was monitored by measuring DCF fluorescence and intracellular glutathione levels, and electrophoretic mobilityshift assay was carried out to study the activation of oxidative stress sensitive transcription factors. Analysis ofoxidized lipids was carried out by liquid chromatography/mass spectrometry.Results: Linoleic acid treatment for six hours increased the expression of CYP 2C9 in endothelial cells.
Linoleic acid-mediated increase in oxidative stress and activation of AP-1 were blocked by sulfaphenazole, aspecific inhibitor of CYP 2C9. The linoleic acid metabolites LTX and LTD increased oxidative stress andactivation of transcription factors only at high concentrations.Conclusion: Our data show that CYP 2C9 plays a key role in linoleic acid-induced oxidative stress and
subsequent proinflammatory events in vascular endothelial cells by possibly causing superoxide generationthrough uncoupling processes.
INTRODUCTION
Atherosclerosis is believed to be a chronic inflammatorydisease, and the earliest event of coronary atherosclerosis ischaracterized by endothelial activation and dysfunction [1].Several factors are implicated in the initiation of endothelialdysfunction of which the formation of reactive oxygen speciesis believed to play a critical role during this process [2,3].Endothelial cells are continuously exposed to circulating
lipids (e.g., dietary fatty acids) and to lipids that have accumulated
in sub-endothelial regions. These biologically active lipids play animportant role in the development of atherosclerosis. Polyunsatu-rated fatty acids and/or their metabolites can have potent biolog-ical effects in various cell types by functioning as signaling mol-ecules. Evidence suggests that linoleic acid, a major dietaryunsaturated fatty acid in the American diet, has proinflammatoryand proatherogenic effects by causing endothelial cell activation[4]. Linoleic acid-induced endothelial activation is considered tobe mediated through oxidative stress [4,5]. However, the precisemechanism involved in linoleic acid-induced oxidative stress and
Address reprint requests to: Bernhard Hennig, PhD, RD, FACN, Molecular and Cell Nutrition Laboratory, College of Agriculture, 213 Garrigus Building, University ofKentucky, Lexington, KY 40546-0215. E-mail: [email protected] as a ACN New Investigator Award lecture by Dr. Saraswathi Viswanathan at the 43rd Annual ACN Meeting in San Antonio, TX.Abbreviations: CYP ! cytochrome P450, ROS ! reactive oxygen species, LTX ! leukotoxin, LTD ! leukotoxin diol, LA ! linoleic acid, H2DCF-DA !Dichlorodihydrofluorescein diacetate, MnTMPyP ! [Mn (III) tetrakis (1-methyl-4-pyridyl) porphyrin pentachloride], AP-1 ! activator protein 1, NF-!B ! nuclear factor !B.
Journal of the American College of Nutrition, Vol. 22, No. 6, 502–510 (2003)Published by the American College of Nutrition
502
Original Research
Involvement of CYP 2C9 in Mediating theProinflammatory Effects of Linoleic Acid in VascularEndothelial Cells
Saraswathi Viswanathan PhD, Bruce D. Hammock PhD, John W. Newman, PhD, Purushothaman Meerarani PhD,Michal Toborek MD, PhD, and Bernhard Hennig PhD, FACN
Molecular and Cell Nutrition Laboratory, College of Agriculture (S.V., P.M., B.H.), Department of Surgery (M.T.), University ofKentucky, Lexington, KY, 40546-0215, and Department of Entomology and UC Cancer Center (B.D.H., J.W.N.), University ofCalifornia, Davis, CA, USA.
Key words: linoleic acid, CYP 2C9, leukotoxin, leukotoxin diol, oxidative stress
Objective: Polyunsaturated fatty acids such as linoleic acid are well known dietary lipids that may beatherogenic by activating vascular endothelial cells. In the liver, fatty acids can be metabolized by cytochromeP450 (CYP) enzymes, but little is known about the role of these enzymes in the vascular endothelium. CYP 2C9is involved in linoleic acid epoxygenation, and the major product of this reaction is leukotoxin (LTX). Weinvestigated the role of CYP-mediated mechanisms of linoleic acid metabolism in endothelial cell activation byexamining the effects of linoleic acid or its oxidized metabolites such as LTX and leukotoxin diol (LTD).Methods: The effect of linoleic acid on CYP 2C9 gene expression was studied by RT-PCR. Oxidative stress
was monitored by measuring DCF fluorescence and intracellular glutathione levels, and electrophoretic mobilityshift assay was carried out to study the activation of oxidative stress sensitive transcription factors. Analysis ofoxidized lipids was carried out by liquid chromatography/mass spectrometry.Results: Linoleic acid treatment for six hours increased the expression of CYP 2C9 in endothelial cells.
Linoleic acid-mediated increase in oxidative stress and activation of AP-1 were blocked by sulfaphenazole, aspecific inhibitor of CYP 2C9. The linoleic acid metabolites LTX and LTD increased oxidative stress andactivation of transcription factors only at high concentrations.Conclusion: Our data show that CYP 2C9 plays a key role in linoleic acid-induced oxidative stress and
subsequent proinflammatory events in vascular endothelial cells by possibly causing superoxide generationthrough uncoupling processes.
INTRODUCTION
Atherosclerosis is believed to be a chronic inflammatorydisease, and the earliest event of coronary atherosclerosis ischaracterized by endothelial activation and dysfunction [1].Several factors are implicated in the initiation of endothelialdysfunction of which the formation of reactive oxygen speciesis believed to play a critical role during this process [2,3].Endothelial cells are continuously exposed to circulating
lipids (e.g., dietary fatty acids) and to lipids that have accumulated
in sub-endothelial regions. These biologically active lipids play animportant role in the development of atherosclerosis. Polyunsatu-rated fatty acids and/or their metabolites can have potent biolog-ical effects in various cell types by functioning as signaling mol-ecules. Evidence suggests that linoleic acid, a major dietaryunsaturated fatty acid in the American diet, has proinflammatoryand proatherogenic effects by causing endothelial cell activation[4]. Linoleic acid-induced endothelial activation is considered tobe mediated through oxidative stress [4,5]. However, the precisemechanism involved in linoleic acid-induced oxidative stress and
Address reprint requests to: Bernhard Hennig, PhD, RD, FACN, Molecular and Cell Nutrition Laboratory, College of Agriculture, 213 Garrigus Building, University ofKentucky, Lexington, KY 40546-0215. E-mail: [email protected] as a ACN New Investigator Award lecture by Dr. Saraswathi Viswanathan at the 43rd Annual ACN Meeting in San Antonio, TX.Abbreviations: CYP ! cytochrome P450, ROS ! reactive oxygen species, LTX ! leukotoxin, LTD ! leukotoxin diol, LA ! linoleic acid, H2DCF-DA !Dichlorodihydrofluorescein diacetate, MnTMPyP ! [Mn (III) tetrakis (1-methyl-4-pyridyl) porphyrin pentachloride], AP-1 ! activator protein 1, NF-!B ! nuclear factor !B.
Journal of the American College of Nutrition, Vol. 22, No. 6, 502–510 (2003)Published by the American College of Nutrition
502
Journal of the American College of Nutrition, Vol. 22, No. 6, 502–510 (2003)
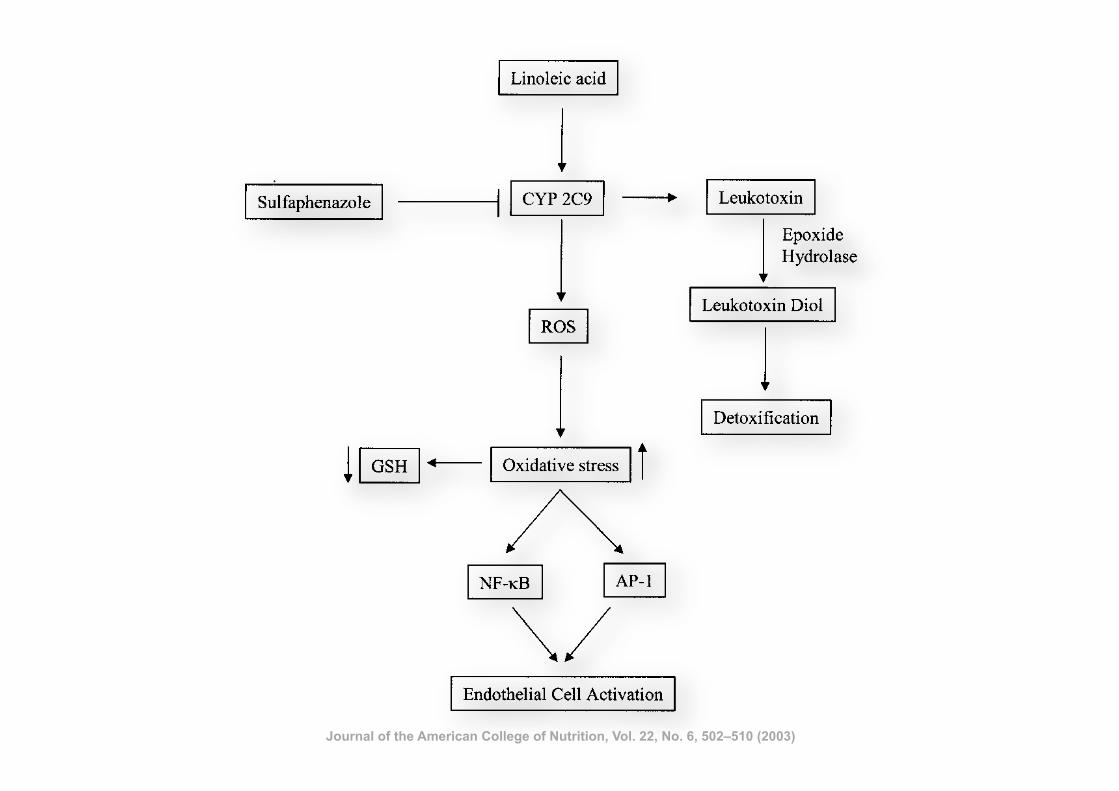
metabolites, from a spectrum of unsaturated fatty acids may bepotential modulators of vascular function. To examine if thelinoleic acid metabolites can contribute to oxidative stress,studies were carried out with epoxide and diol metabolites oflinoleic acid such as LTX and LTD. Although LTX is reportedto be involved in conditions such as acute respiratory distresssyndrome and acute lung injury [16,47], reports also suggestthat LTX causes endothelium dependent pulmonary vasodila-tation in isolated rat lungs and in isolated pulmonary artery ringstructures [12].We used 10–90 !M concentrations of LTX or LTD in the
present study. The epoxide and diol metabolites are produced inexceptionally high amounts in vivo during specific pathologicalevents. For example, Kosaka et al. [15] showed that LTX canreach high concentrations (!100 !M) in the serum of patientswith significant burns. Also, Ozawa et al. [48] reported con-siderable amounts of LTX in bronchoalveolar lavage fluid(diluted specimens) in patients with acute respiratory distresssyndrome. Furthermore, studies suggest that renal proximaltubules can metabolize linoleic acid approximately to 41%LTX and LTD [49]. Therefore, the concentrations of LTX andLTD used in the present study range from physiological topathological levels.It is evident from our data that the epoxide/diol metabolites
can be formed by the endothelial cells. In addition to theepoxide/diol metabolites of linoleic acid, there is also evidencethat these metabolites can be derived from arachidonic acid butat significantly lower concentrations. Especially after exposureto linoleic acid, our data provide evidence that linoleic acid isa major substrate for CYP 2C9 in endothelial cells. However,we cannot exclude the possibility that linoleic acid may alsohave an indirect effect on CYP 2C9 activity possibly viaincreased release of arachidonic acid from the phospholipidpool [50].
In the present study, the deleterious effects of the epoxideand diol metabolites were seen only at very high concentra-tions. For example, neither LTX nor LTD induced oxidativestress up to 30 !M concentration as measured by DCF fluo-rescence. On the other hand, a profound increase in oxidativestress was observed at high concentrations of LTX or LTD. Thefact that both LTX and LTD induced oxidative stress only athigh concentrations suggests the possibility that the metabolitesmay not be as toxic as the parent fatty acid in endothelial cells.Furthermore, these metabolites and especially the diol metab-olites, which are produced endogenously, may help to detoxifyspecific fatty acids and thus be beneficial for the maintenanceof vascular homeostasis [51]. For example, epoxyeicosatrienoicacid (EET), an extensively studied epoxide metabolite of ara-chidonic acid, has been reported to exert an anti-inflammatoryeffect in endothelial cells by inhibiting the activation of NF-"Band by decreasing the cytokine-induced adhesion moleculeexpression [52].In conclusion, our results indicate that linoleic acid can
induce CYP 2C9 expression in vascular endothelial cells (Fig.8). Due to possible uncoupling processes and generation ofROS, CYP 2C9 induction appears to be responsible for in-creased cellular oxidation and activation of redox-responsive
Fig. 8. Proposed model for the mechanism of linoleic acid (LA)-mediated endothelial cell activation. LA treatment results in CYP 2C9activation and production of superoxide radicals as well as depletion ofglutathione in endothelial cells. The increased oxidative stress results inthe activation of oxidative stress sensitive transcription factors such asNF-"B and AP-1, leading to endothelial cell activation. Sulfa-phenazole, a specific inhibitor of CYP 2C9 suppresses the oxidativestress caused by LA treatment. The formation of leukotoxin and leu-kotoxin diol under physiological condition may help in the fatty aciddetoxification process.
Fig. 7. Endothelial cell-derived linoleic acid metabolites. Cells werecultured in the presence of linoleic acid (90 !M; upper trace) for 24hours, and media concentrations of linoleate-derived epoxides and diolswere 3.2 " 0.5 nM and 90 " 15 nM, respectively. These metaboliteswere present at #0.5 and 10 " 5 nM, respectively without supplemen-tal linoleic acid. Traces of epoxy and dihydroxy arachidonates werealso observed in linoleic acid-treated cultures (data not shown). Resultsare from triplicate analyses of 6 mL culture media aliquots analyzed byLC/MS/MS.
Proinflammatory Effects of Linoleic Acid
508 VOL. 22, NO. 6
Journal of the American College of Nutrition, Vol. 22, No. 6, 502–510 (2003)
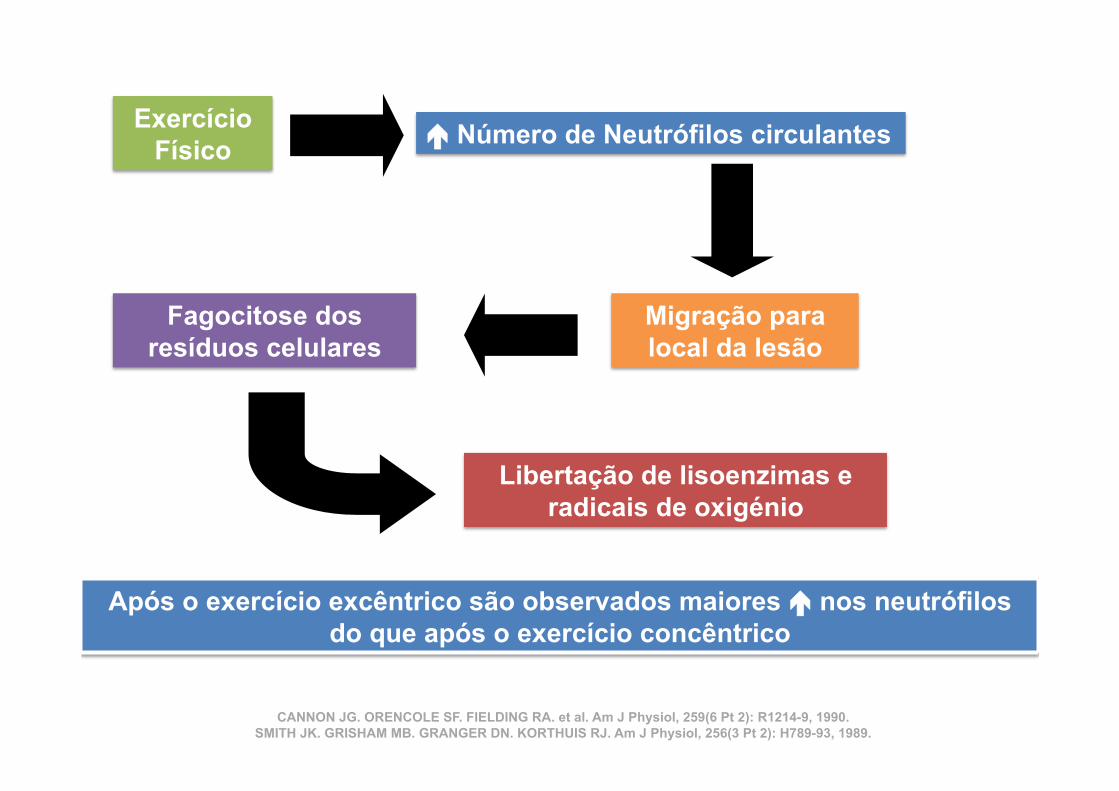
Exercício Físico ã Número de Neutrófilos circulantes
Migração para local da lesão
Fagocitose dos resíduos celulares
Libertação de lisoenzimas e radicais de oxigénio
Após o exercício excêntrico são observados maiores ã nos neutrófilos do que após o exercício concêntrico
CANNON JG. ORENCOLE SF. FIELDING RA. et al. Am J Physiol, 259(6 Pt 2): R1214-9, 1990. SMITH JK. GRISHAM MB. GRANGER DN. KORTHUIS RJ. Am J Physiol, 256(3 Pt 2): H789-93, 1989.
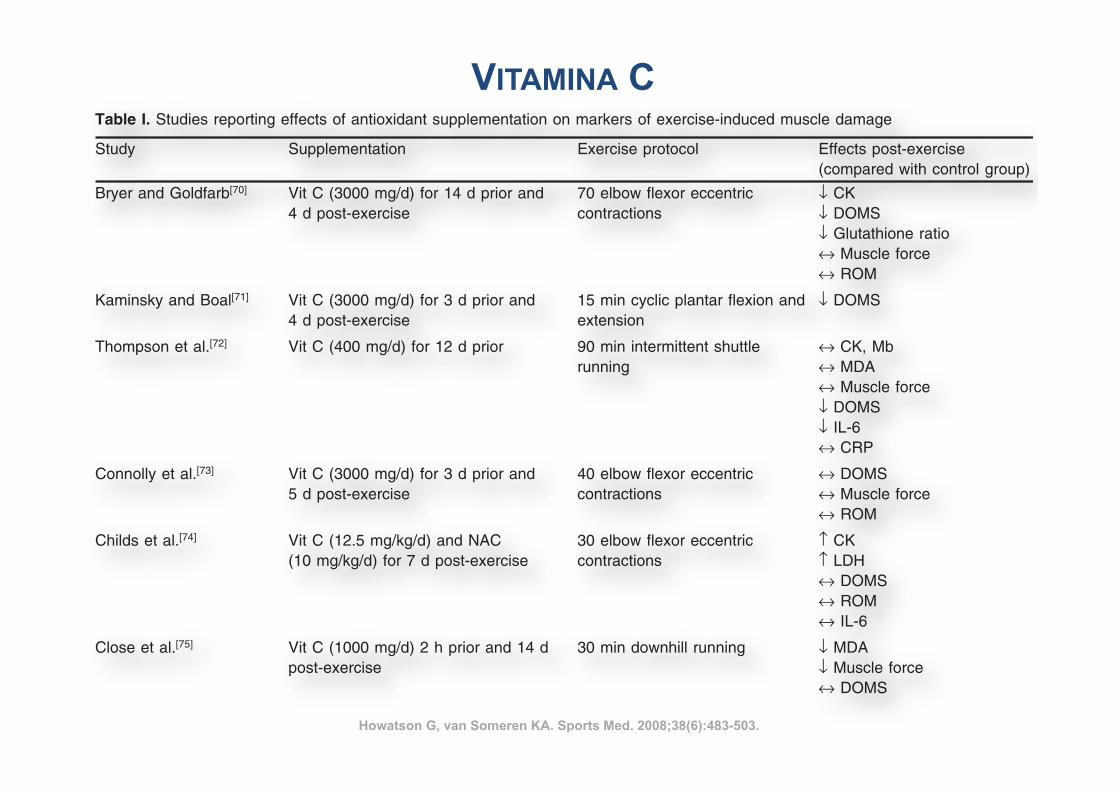
488 Howatson & van Someren
Table I. Studies reporting effects of antioxidant supplementation on markers of exercise-induced muscle damage
Study Supplementation Exercise protocol Effects post-exercise(compared with control group)
Bryer and Goldfarb[70] Vit C (3000 mg/d) for 14 d prior and 70 elbow flexor eccentric ! CK4 d post-exercise contractions ! DOMS
! Glutathione ratio" Muscle force" ROM
Kaminsky and Boal[71] Vit C (3000 mg/d) for 3 d prior and 15 min cyclic plantar flexion and ! DOMS4 d post-exercise extension
Thompson et al.[72] Vit C (400 mg/d) for 12 d prior 90 min intermittent shuttle " CK, Mbrunning " MDA
" Muscle force! DOMS! IL-6" CRP
Connolly et al.[73] Vit C (3000 mg/d) for 3 d prior and 40 elbow flexor eccentric " DOMS5 d post-exercise contractions " Muscle force
" ROM
Childs et al.[74] Vit C (12.5 mg/kg/d) and NAC 30 elbow flexor eccentric # CK(10 mg/kg/d) for 7 d post-exercise contractions # LDH
" DOMS" ROM" IL-6
Close et al.[75] Vit C (1000 mg/d) 2 h prior and 14 d 30 min downhill running ! MDApost-exercise ! Muscle force
" DOMS
Sacheck et al.[76] Vit E (1000 IU/d) for 12 wk prior 45 min downhill running ! CK in younger men! iPF(2$) in older men
McBride et al.[77] Vit E (1200 IU/d) for 14 d prior Whole-body resistance exercise ! CK" MDA" DOMS
Beaton et al.[78] Vit E (1200 IU/d) for 30 d prior exercise 240 knee flexor and extensor " CKeccentric contractions " Muscle force
" Z-band disruption" DOMS
Shafat et al.[79] Vit C (500 mg/d) and vit E (1200 IU/d) 300 knee extensor eccentric ! Decline in torque duringfor 30 d prior and 7 d post-exercise contractions exercise
# Muscle force" DOMS
Goldfarb et al.[80] Vit C (1000 mg/d) and vit E (400 IU/d) 48 elbow flexor eccentric ! MDAfor 14 d prior and 2 d post-exercise contractions ! Plasma protein carbonyls
" Glutathione status
Mastaloudis et al.[81] Vit C (1000 mg/d) and vit E (300 mg/d) 50 km ultramarathon run " CKfor 6 wk prior " LDH
" Muscle force
Petersen et al.[82] Vit C (500 mg/d) and vit E (400 mg/d) 90 min downhill running " IL-6for 14 d prior and 7 d post-exercise " CK
" Lymphocytes (CD4+, CD8+,NK)
Jakeman and Maxwell[83] Vit C (400 mg/d) or vit E (400 mg/d) 60 min box stepping Vit C: ! LFF, " muscle forcefor 21 d prior and 7 d post-exercise Vit E: " LFF, " muscle force
CK = creatine kinase; CRP = C-reactive protein; DOMS = delayed-onset muscle soreness; IL-6 = interleukin-6; iPF(2$) = iso-prostaglandin2$; LDH = lactate dehydrogenase; LFF = low frequency fatigue; Mb = myoglobin; MDA = malondialdehyde; NAC = N-acetyl-cysteine; NK =natural killer cells; ROM = range of motion; vit C = vitamin C (ascorbic acid); vit E = vitamin E (tocopherol); ! indicates decrease;# indicates increase; " indicates no change.
% 2008 Adis Data Information BV. All rights reserved. Sports Med 2008; 38 (6)
VITAMINA C
Howatson G, van Someren KA. Sports Med. 2008;38(6):483-503.
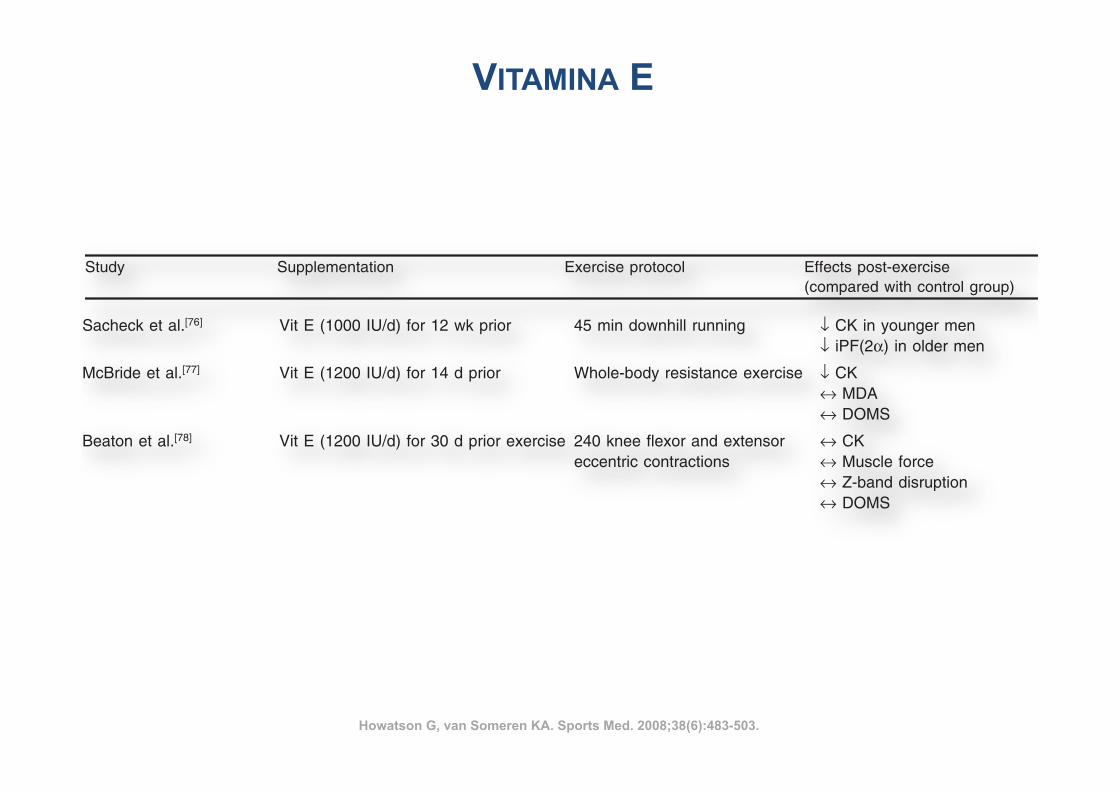
488 Howatson & van Someren
Table I. Studies reporting effects of antioxidant supplementation on markers of exercise-induced muscle damage
Study Supplementation Exercise protocol Effects post-exercise(compared with control group)
Bryer and Goldfarb[70] Vit C (3000 mg/d) for 14 d prior and 70 elbow flexor eccentric ! CK4 d post-exercise contractions ! DOMS
! Glutathione ratio" Muscle force" ROM
Kaminsky and Boal[71] Vit C (3000 mg/d) for 3 d prior and 15 min cyclic plantar flexion and ! DOMS4 d post-exercise extension
Thompson et al.[72] Vit C (400 mg/d) for 12 d prior 90 min intermittent shuttle " CK, Mbrunning " MDA
" Muscle force! DOMS! IL-6" CRP
Connolly et al.[73] Vit C (3000 mg/d) for 3 d prior and 40 elbow flexor eccentric " DOMS5 d post-exercise contractions " Muscle force
" ROM
Childs et al.[74] Vit C (12.5 mg/kg/d) and NAC 30 elbow flexor eccentric # CK(10 mg/kg/d) for 7 d post-exercise contractions # LDH
" DOMS" ROM" IL-6
Close et al.[75] Vit C (1000 mg/d) 2 h prior and 14 d 30 min downhill running ! MDApost-exercise ! Muscle force
" DOMS
Sacheck et al.[76] Vit E (1000 IU/d) for 12 wk prior 45 min downhill running ! CK in younger men! iPF(2$) in older men
McBride et al.[77] Vit E (1200 IU/d) for 14 d prior Whole-body resistance exercise ! CK" MDA" DOMS
Beaton et al.[78] Vit E (1200 IU/d) for 30 d prior exercise 240 knee flexor and extensor " CKeccentric contractions " Muscle force
" Z-band disruption" DOMS
Shafat et al.[79] Vit C (500 mg/d) and vit E (1200 IU/d) 300 knee extensor eccentric ! Decline in torque duringfor 30 d prior and 7 d post-exercise contractions exercise
# Muscle force" DOMS
Goldfarb et al.[80] Vit C (1000 mg/d) and vit E (400 IU/d) 48 elbow flexor eccentric ! MDAfor 14 d prior and 2 d post-exercise contractions ! Plasma protein carbonyls
" Glutathione status
Mastaloudis et al.[81] Vit C (1000 mg/d) and vit E (300 mg/d) 50 km ultramarathon run " CKfor 6 wk prior " LDH
" Muscle force
Petersen et al.[82] Vit C (500 mg/d) and vit E (400 mg/d) 90 min downhill running " IL-6for 14 d prior and 7 d post-exercise " CK
" Lymphocytes (CD4+, CD8+,NK)
Jakeman and Maxwell[83] Vit C (400 mg/d) or vit E (400 mg/d) 60 min box stepping Vit C: ! LFF, " muscle forcefor 21 d prior and 7 d post-exercise Vit E: " LFF, " muscle force
CK = creatine kinase; CRP = C-reactive protein; DOMS = delayed-onset muscle soreness; IL-6 = interleukin-6; iPF(2$) = iso-prostaglandin2$; LDH = lactate dehydrogenase; LFF = low frequency fatigue; Mb = myoglobin; MDA = malondialdehyde; NAC = N-acetyl-cysteine; NK =natural killer cells; ROM = range of motion; vit C = vitamin C (ascorbic acid); vit E = vitamin E (tocopherol); ! indicates decrease;# indicates increase; " indicates no change.
% 2008 Adis Data Information BV. All rights reserved. Sports Med 2008; 38 (6)
VITAMINA E
Howatson G, van Someren KA. Sports Med. 2008;38(6):483-503.
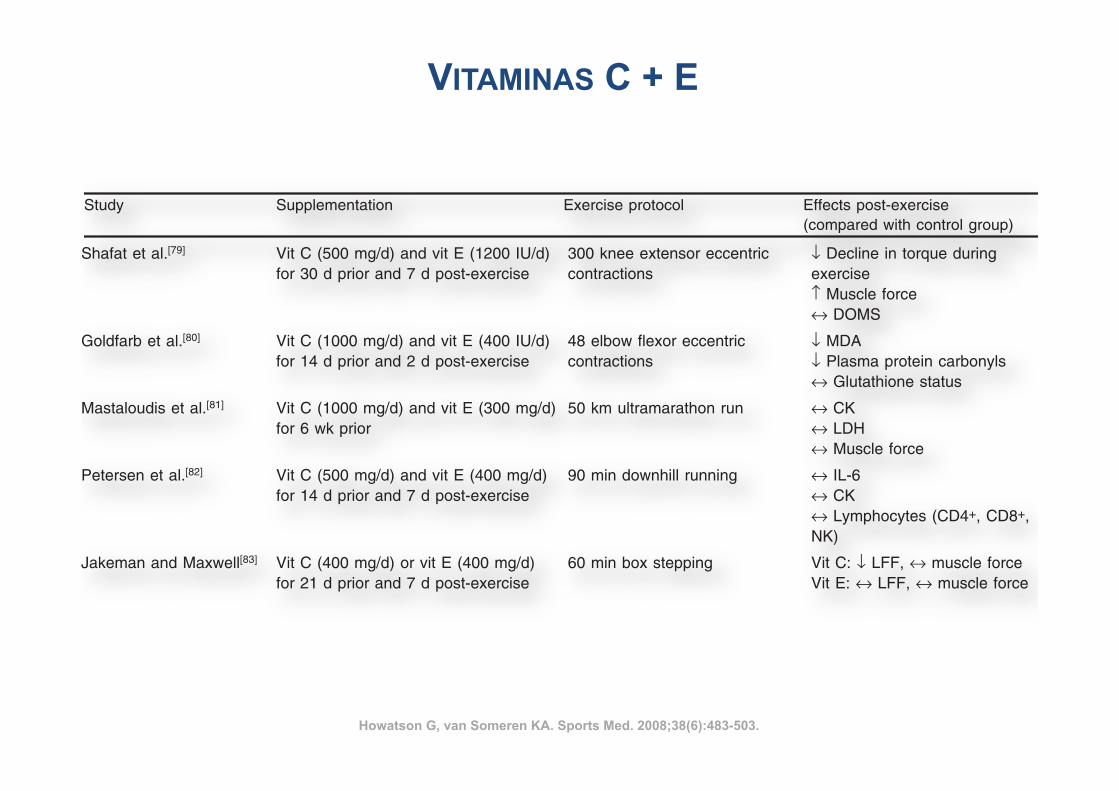
488 Howatson & van Someren
Table I. Studies reporting effects of antioxidant supplementation on markers of exercise-induced muscle damage
Study Supplementation Exercise protocol Effects post-exercise(compared with control group)
Bryer and Goldfarb[70] Vit C (3000 mg/d) for 14 d prior and 70 elbow flexor eccentric ! CK4 d post-exercise contractions ! DOMS
! Glutathione ratio" Muscle force" ROM
Kaminsky and Boal[71] Vit C (3000 mg/d) for 3 d prior and 15 min cyclic plantar flexion and ! DOMS4 d post-exercise extension
Thompson et al.[72] Vit C (400 mg/d) for 12 d prior 90 min intermittent shuttle " CK, Mbrunning " MDA
" Muscle force! DOMS! IL-6" CRP
Connolly et al.[73] Vit C (3000 mg/d) for 3 d prior and 40 elbow flexor eccentric " DOMS5 d post-exercise contractions " Muscle force
" ROM
Childs et al.[74] Vit C (12.5 mg/kg/d) and NAC 30 elbow flexor eccentric # CK(10 mg/kg/d) for 7 d post-exercise contractions # LDH
" DOMS" ROM" IL-6
Close et al.[75] Vit C (1000 mg/d) 2 h prior and 14 d 30 min downhill running ! MDApost-exercise ! Muscle force
" DOMS
Sacheck et al.[76] Vit E (1000 IU/d) for 12 wk prior 45 min downhill running ! CK in younger men! iPF(2$) in older men
McBride et al.[77] Vit E (1200 IU/d) for 14 d prior Whole-body resistance exercise ! CK" MDA" DOMS
Beaton et al.[78] Vit E (1200 IU/d) for 30 d prior exercise 240 knee flexor and extensor " CKeccentric contractions " Muscle force
" Z-band disruption" DOMS
Shafat et al.[79] Vit C (500 mg/d) and vit E (1200 IU/d) 300 knee extensor eccentric ! Decline in torque duringfor 30 d prior and 7 d post-exercise contractions exercise
# Muscle force" DOMS
Goldfarb et al.[80] Vit C (1000 mg/d) and vit E (400 IU/d) 48 elbow flexor eccentric ! MDAfor 14 d prior and 2 d post-exercise contractions ! Plasma protein carbonyls
" Glutathione status
Mastaloudis et al.[81] Vit C (1000 mg/d) and vit E (300 mg/d) 50 km ultramarathon run " CKfor 6 wk prior " LDH
" Muscle force
Petersen et al.[82] Vit C (500 mg/d) and vit E (400 mg/d) 90 min downhill running " IL-6for 14 d prior and 7 d post-exercise " CK
" Lymphocytes (CD4+, CD8+,NK)
Jakeman and Maxwell[83] Vit C (400 mg/d) or vit E (400 mg/d) 60 min box stepping Vit C: ! LFF, " muscle forcefor 21 d prior and 7 d post-exercise Vit E: " LFF, " muscle force
CK = creatine kinase; CRP = C-reactive protein; DOMS = delayed-onset muscle soreness; IL-6 = interleukin-6; iPF(2$) = iso-prostaglandin2$; LDH = lactate dehydrogenase; LFF = low frequency fatigue; Mb = myoglobin; MDA = malondialdehyde; NAC = N-acetyl-cysteine; NK =natural killer cells; ROM = range of motion; vit C = vitamin C (ascorbic acid); vit E = vitamin E (tocopherol); ! indicates decrease;# indicates increase; " indicates no change.
% 2008 Adis Data Information BV. All rights reserved. Sports Med 2008; 38 (6)
488 Howatson & van Someren
Table I. Studies reporting effects of antioxidant supplementation on markers of exercise-induced muscle damage
Study Supplementation Exercise protocol Effects post-exercise(compared with control group)
Bryer and Goldfarb[70] Vit C (3000 mg/d) for 14 d prior and 70 elbow flexor eccentric ! CK4 d post-exercise contractions ! DOMS
! Glutathione ratio" Muscle force" ROM
Kaminsky and Boal[71] Vit C (3000 mg/d) for 3 d prior and 15 min cyclic plantar flexion and ! DOMS4 d post-exercise extension
Thompson et al.[72] Vit C (400 mg/d) for 12 d prior 90 min intermittent shuttle " CK, Mbrunning " MDA
" Muscle force! DOMS! IL-6" CRP
Connolly et al.[73] Vit C (3000 mg/d) for 3 d prior and 40 elbow flexor eccentric " DOMS5 d post-exercise contractions " Muscle force
" ROM
Childs et al.[74] Vit C (12.5 mg/kg/d) and NAC 30 elbow flexor eccentric # CK(10 mg/kg/d) for 7 d post-exercise contractions # LDH
" DOMS" ROM" IL-6
Close et al.[75] Vit C (1000 mg/d) 2 h prior and 14 d 30 min downhill running ! MDApost-exercise ! Muscle force
" DOMS
Sacheck et al.[76] Vit E (1000 IU/d) for 12 wk prior 45 min downhill running ! CK in younger men! iPF(2$) in older men
McBride et al.[77] Vit E (1200 IU/d) for 14 d prior Whole-body resistance exercise ! CK" MDA" DOMS
Beaton et al.[78] Vit E (1200 IU/d) for 30 d prior exercise 240 knee flexor and extensor " CKeccentric contractions " Muscle force
" Z-band disruption" DOMS
Shafat et al.[79] Vit C (500 mg/d) and vit E (1200 IU/d) 300 knee extensor eccentric ! Decline in torque duringfor 30 d prior and 7 d post-exercise contractions exercise
# Muscle force" DOMS
Goldfarb et al.[80] Vit C (1000 mg/d) and vit E (400 IU/d) 48 elbow flexor eccentric ! MDAfor 14 d prior and 2 d post-exercise contractions ! Plasma protein carbonyls
" Glutathione status
Mastaloudis et al.[81] Vit C (1000 mg/d) and vit E (300 mg/d) 50 km ultramarathon run " CKfor 6 wk prior " LDH
" Muscle force
Petersen et al.[82] Vit C (500 mg/d) and vit E (400 mg/d) 90 min downhill running " IL-6for 14 d prior and 7 d post-exercise " CK
" Lymphocytes (CD4+, CD8+,NK)
Jakeman and Maxwell[83] Vit C (400 mg/d) or vit E (400 mg/d) 60 min box stepping Vit C: ! LFF, " muscle forcefor 21 d prior and 7 d post-exercise Vit E: " LFF, " muscle force
CK = creatine kinase; CRP = C-reactive protein; DOMS = delayed-onset muscle soreness; IL-6 = interleukin-6; iPF(2$) = iso-prostaglandin2$; LDH = lactate dehydrogenase; LFF = low frequency fatigue; Mb = myoglobin; MDA = malondialdehyde; NAC = N-acetyl-cysteine; NK =natural killer cells; ROM = range of motion; vit C = vitamin C (ascorbic acid); vit E = vitamin E (tocopherol); ! indicates decrease;# indicates increase; " indicates no change.
% 2008 Adis Data Information BV. All rights reserved. Sports Med 2008; 38 (6)
VITAMINAS C + E
Howatson G, van Someren KA. Sports Med. 2008;38(6):483-503.
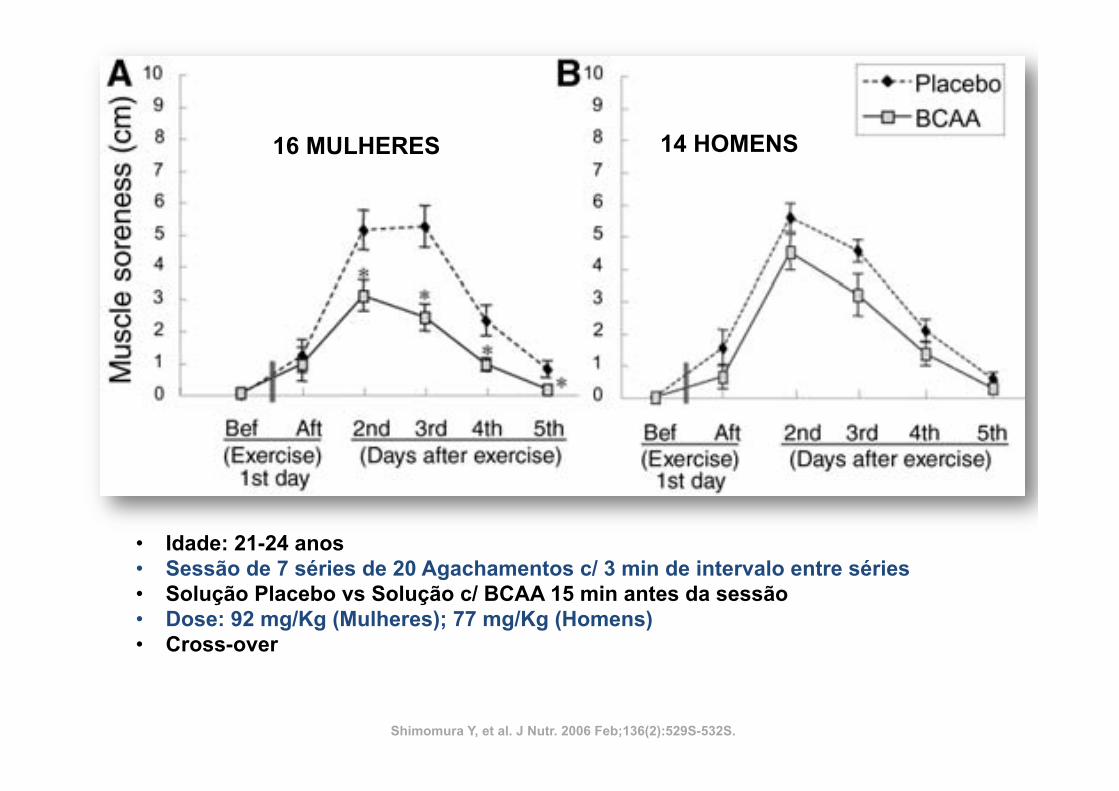
this study were as follows: a BCAA solution (150 mL) con-taining 5 g of a BCAA mixture (Ile:Leu:Val 5 1:2.3:1.2), 1 ggreen tea powder (Instant Green Tea, Ajinomoto General Foods),and 1.2 g non-nutritive sweetener (Pal Sweet, Ajinomoto); anda placebo solution (150 mL) containing the same ingredientsas the BCAA solution, but substituting 5 g dextrin (SanwaCornstarch) for the BCAAs. The BCAA mixture was basedon an amino acid composition reported by the Food andAgricultural Organization of the World Health Organization(27). The two solutions were designed to look and taste similar;the green tea powder was used to mask the bitter taste of theBCAAs. The BCAA intake per body weight was 92 6 2 mg/kgfor females and 77 6 3 mg/kg for males. The exercise testconsisted of 7 sets of 20 squats/set (total 140 squats), with3-min intervals between each set. During each set, squats wereperformed every 2 s. The experiment was conducted with acrossover design, so that each subject was tested with placeboand BCAA solutions, separated by a 12-week interval. Thesubjects were randomly divided into two groups, with halftaking BCAA and half placebo during each trial. Subjects wereblind to the test solution.
On trial days, the subjects in the fasting state reported to thelaboratory at 0830 h and then ingested a jelly-type food (200 ginweightcontaining100kcalfromsugar)(OtsukaPharmaceutical)at 0900 h and, 30 min later, the BCAA or placebo solution.The squat exercise session commenced;15 min after ingestionof the test solution. BCAA (or placebo) ingestion occurredprior to the exercise trial because it has been reported that (1)BCAA supplementation before exercise attenuated muscleprotein breakdown (25), (2) postexercise muscle protein syn-thesis was greater when essential amino acids were consumedbefore exercise, rather than after (28), (3) in a separate prelim-inary study, we found that plasma BCAA concentrations wereelevated within 15 min and peaked 30 min after ingestionwhen the 5 g of BCAA mixture were ingested, and (4) dietaryBCAAs may affect energy metabolism during exercise (29).Muscle soreness before and after exercise and for the following4 d (from the second through the fifth day) was evaluated whilesitting using a visual-analogue scale consisting of a 10-cm linewith ‘‘no pain’’ printed at one end and ‘‘extremely sore’’ at theother (30). Muscle fatigue was evaluated at the same time usinga visual-analogue scale consisting of a 10-cm line with ‘‘nofatigue’’ printed at one end and ‘‘extreme fatigue’’ at the other.The subject was instructed to make a mark on the line indi-cating the degree of muscle soreness and muscle fatigue he/shefelt. Informed, written consent was obtained from all subjectsbefore participating in the study. The study protocol was ap-proved by the human research review committee of the NagoyaUniversity School of Medicine.
Muscle soreness in females was highest on the second andthird days in the placebo trial, indicating that DOMS occurredfollowing the squat exercise trials (Fig. 2A). However, althoughDOMS also occurred after the BCAA trial, peak sorenessoccurred only on the second day and was significantly lowerthan that which occurred following the placebo trial (Fig. 2A).DOMS on days 3–5 in females was also significantly lower inthe BCAA trial than in the placebo (Fig. 2A). In male subjects,DOMS peaked on the second day and tended to be lower in theBCAA than in the placebo trial throughout the test period,although the differences did not attain statistical significance(Fig. 2B). However, the calculated area under the curve formuscle soreness over the 5-d period was lower in the BCAAtrial than in the placebo trial in both sexes (data not shown).The suppression of DOMS by BCAA supplementation ap-peared to be slightly less in male subjects than in femalesubjects. The reason for the sex difference is not clear, though itmay be related to the smaller BCAA dose ingested by malesbecause of their greater body mass: male subjects ingested 7763 mg/kg body weight, whereas females consumed 926 2 mg/kgbody weight. Further study is required to clarify this point.
Muscle fatigue in female and male subjects was highest rightafter exercise and gradually decreased during the following 4 din both the BCAA and placebo trials (data not shown). Thefatigue reported during the 4 d after the exercise trial (from thesecond through fifth days) in both sexes tended to be lower inthe BCAA trial than in the placebo trial.
The results obtained in this preliminary study indicate thatthe ingestion of 5 g of BCAAs before exercise can reduceDOMS and muscle fatigue for several days after exercise. Themechanisms that underlie these BCAA effects have not yetbeen examined. However, one possibility is that BCAA mayattenuate exercise-induced protein breakdown, while leucinemay stimulate muscle protein synthesis. If the finding is sub-stantiated, the results could support the usefulness of BCAA inmuscle recovery from exercise. Further studies are required toelucidate the mechanisms responsible for the effects of BCAAsupplementation.
LITERATURE CITED
1. Harper AE, Miller RH, Block KP. Branched-chain amino acid metabolism.Annu Rev Nutr. 1984;4:409–54.
2. Rennie MJ. Influence of exercise on protein and amino acid metabolism.In: Rowell LB, Shepherd JT, editors. Handbook of physiology, section 12: exercise:regulation and integration of multiple systems. New York: Oxford University Press;1996. p. 995–1035.
3. Riazi R, Wykes LJ, Ball RO, Pencharz PB. The total branched-chainamino acid requirement in young healthy adult men determined by indicator aminoacid oxidation by use of L-[1-13C]phenylalanine. J Nutr. 2003;133:1383–9.
4. Layman DK, Baum JI. Dietary protein impact on glycemic control duringweight loss. J Nutr. 2004;134 (Suppl):S968–73.
5. Ahlborg G, Felig P, Hagenfeldt L, Hendler R, Wahren J. Substrateturnover during prolonged exercise in man. J Clin Invest. 1974;53:1080–90.
6. Wahren J, Felig P, Hagenfeldt L. Effect of protein ingestion on splanchnicand leg metabolism in normal man and in patients with diabetes mellitus. J ClinInvest. 1976;57:987–99.
7. Bolster DR, Jefferson LS, Kimball SR. Regulation of protein synthesisassociated with skeletal muscle hypertrophy by insulin-, amino acid- and exercise-induced signalling. Proc Nutr Soc. 2004;63:351–6.
8. Mordier S, Deval C, Bechet D, Tassa A, Ferrara M. Leucine limitationinduces autophagy and activation of lysosome-dependent proteolysis in C2C12myotubes through a mammalian target of rapamycin-independent signaling path-way. J Biol Chem. 2000;275:29900–6.
9. Shimomura Y, Murakami T, Nakai N, Nagasaki M, Harris RA. Exercisepromotes BCAA catabolism: effects of BCAA supplementation on skeletal muscleduring exercise. J Nutr. 2004;134 (Suppl):S1583–7.
10. Harris RA, Zhang B, Goodwin GW, Kuntz MJ, Shimomura Y, Rougraff P,Dexter P, Zhao Y, Gibson R, Crabb DW. Regulation of the branched-chaina-ketoacid dehydrogenase and elucidation of a molecular basis for maple syrupurine disease. Adv Enzyme Regul. 1990;30:245–63.
FIGURE 2 Effect of the BCAA supplement on DOMS induced bysquat exercise. (A) females; (B) males. Values are means 6 SEM for16 females and 14 males. *P , 0.05 to the corresponding placebotrial (Wilcoxon signed-rank test).
531SBRANCHED-CHAIN AMINO ACIDS AND MUSCLE
by guest on February 24, 2013jn.nutrition.org
Dow
nloaded from
16 MULHERES 14 HOMENS
• Idade: 21-24 anos • Sessão de 7 séries de 20 Agachamentos c/ 3 min de intervalo entre séries • Solução Placebo vs Solução c/ BCAA 15 min antes da sessão • Dose: 92 mg/Kg (Mulheres); 77 mg/Kg (Homens) • Cross-over
Shimomura Y, et al. J Nutr. 2006 Feb;136(2):529S-532S.
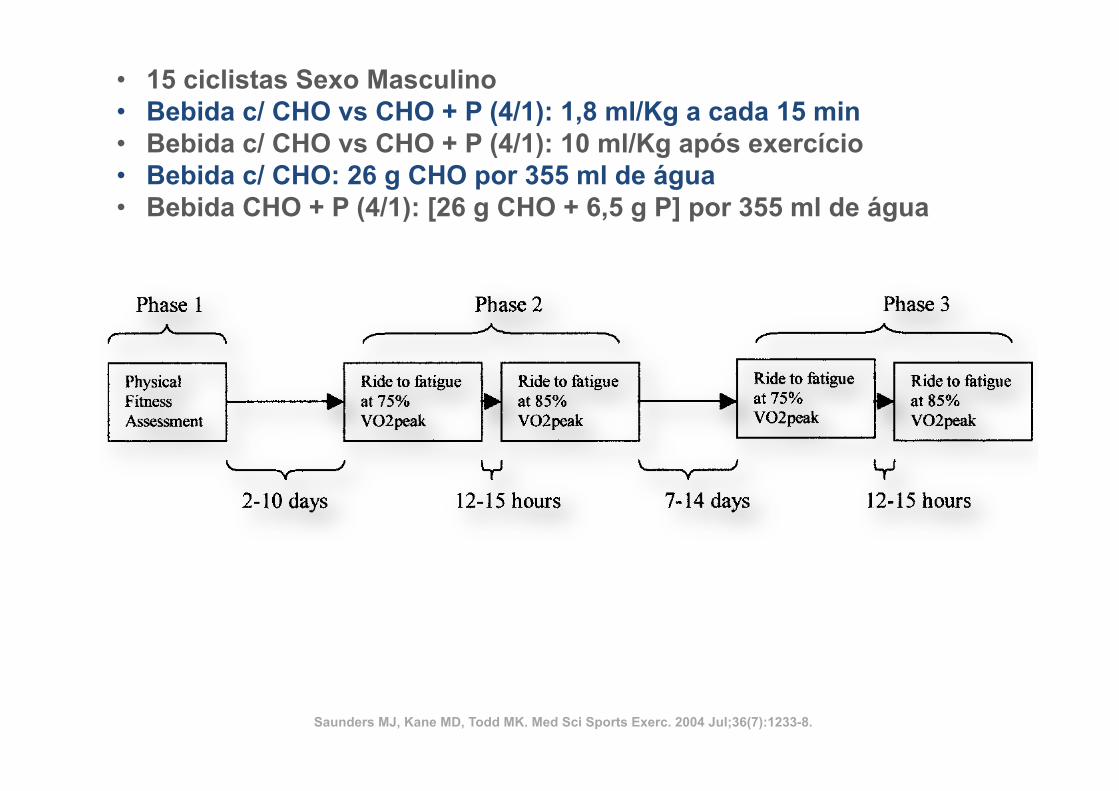
both primary dependent measures with a power of 0.80,based on an estimated effect size of 1.0 SD units (from pilotdata), a two-tailed alpha level of 0.05, and an intraclasscorrelation of 0.80 between repeat measures (13). All sub-jects were trained cyclists who performed at least 3 d ofcycle training per week and possessed a cycle ergometerVO2peak of ! 40 mL·kg!1·min!1. These entrance criteriawere used so that the findings of the study could be appro-priately generalized to competitive athletic populations andto increase the likelihood that all subjects could perform acycle bout of over 1 h at 75% VO2peak (i.e., long enough thatreduced muscle glycogen levels would be a contributingfactor to fatigue).All subjects completed an informed consent document,
Physical Activity Readiness Questionnaire, and a compre-hensive medical questionnaire to determine the presence ofany risk factors associated with coronary artery diseasebefore participating in the study. All subjects were asymp-tomatic and possessed fewer than two risk factors usingACSM guidelines (1). All procedures and protocols wereapproved by the Institutional Review Board of James Mad-ison University.
Testing procedures. Figure 1 illustrates the order andtimeline involved in the testing of each subject.
Phase 1: physical fitness assessment testing.Subjects who passed the initial screening completed anassessment of their cardiorespiratory fitness and body mass.These data were used for demographic purposes and todetermine the exercise intensities used for testing in phases2 and 3 of the study.
Body mass. Body mass was measured using a physi-cian’s scale and was recorded to the nearest tenth of akilogram; subjects were measured in their cycling shortswithout shoes or socks.
Cardiorespiratory fitness (VO2peak). Before testing,subjects performed a 3-min warm-up on an electricallybraked cycle ergometer (Ergoline 800S, SensorMedics,Yorba Linda, CA) at 100 W to prepare for maximal exer-cise. Subjects then performed a graded exercise test on thesame device to determine their peak oxygen uptake(VO2peak). The initial workload for the test was subjectivelydetermined during the warm-up as a wattage at which therider felt he could maintain for a prolonged ride of “easy-moderate intensity.” In pilot subjects, this self-selected watt-age produced an initial workload that was consistently be-low lactate threshold but minimized excessive test durationthat can occur in more rigidly standardized protocols. Self-selected initial workloads varied from 60 to 150 W with amean of 95 W (SD "24 W). Workload was uniformly
increased from this initial level by 20 W each minute duringthe test. Subjects were encouraged to cycle at a self-selectedcadence of #50 revolutions per minute (rpm) until theywere unable to maintain this minimum cadence for a 30-stime period, at which point the test was terminated. Thefollowing measurements were obtained during this test.
Metabolic measures. Metabolic measurements in-cluding VO2, CO2, RER, and ventilation were obtainedcontinuously during this test using a SensorMedics Vmax229 metabolic cart (Yorba Linda, CA). Subjects expired airthrough a two-way rebreathing valve, which was connectedto the metabolic cart. The metabolic cart was calibratedbefore each use using medical-grade gasses of known con-centrations and a 3.0-L calibration syringe.
Heart rate and ratings of perceived exertion. Boththese measures were obtained at the end of each 60-s periodduring the VO2peak test. Heart rate was obtained via a Polarheart-rate monitor (Brooklyn, NY). Subjective ratings ofexertion were obtained using Borg’s 6- to 20-point RPEscale (1).
Phase 2: experimental rides with blinded treat-ment 1 (two sessions). Each subject performed two pro-longed bouts of cycle ergometry to fatigue with a 12- to 15-hrest period between rides. In the first ride, subjects rode at75% of VO2peak at a self-selected cadence of# 50 rpm untilthey were unable to maintain this minimum cadence for30 s. Twelve to 15 h after the initial exhaustive bout, eachsubject returned and repeated the exercise bout under thesame conditions, except at a slightly higher intensity (85%VO2peak). The following measurements were obtained dur-ing both performance rides.
Metabolic measures, heart rate, and ratings ofperceived exertion. Metabolic measures (VO2, CO2,ventilation), heart rate, and ratings of perceived exertion(RPE) were obtained every 30 min of exercise using themethods described above.
Blood glucose, CPK, and lactic acid levels. Bloodsamples were obtained at rest, and every 30 min duringexercise to determine glucose and lactic acid levels. Thesample consisted of approximately 5–10 drops of bloodobtained from the fingertips using finger sticks. Glucose andlactate levels were determined using an automatic glucose/lactate analyzer (YSI 2300 STAT). Samples to be analyzedfor plasma CPK were obtained immediately before and12–15 h after the first prolonged exercise bout. CPK wasdetermined from blood plasma using a Vitro DT60II (John-son and Johnson). Before CPK analysis, the Vitro DT60IIwas calibrated using a reconstituted lyophilized calibrationstandard purchased from the manufacturer. Concentrations
FIGURE 1—Time course of study protocol.
1234 Official Journal of the American College of Sports Medicine http://www.acsm-msse.org
• 15 ciclistas Sexo Masculino • Bebida c/ CHO vs CHO + P (4/1): 1,8 ml/Kg a cada 15 min • Bebida c/ CHO vs CHO + P (4/1): 10 ml/Kg após exercício • Bebida c/ CHO: 26 g CHO por 355 ml de água • Bebida CHO + P (4/1): [26 g CHO + 6,5 g P] por 355 ml de água
Saunders MJ, Kane MD, Todd MK. Med Sci Sports Exerc. 2004 Jul;36(7):1233-8.
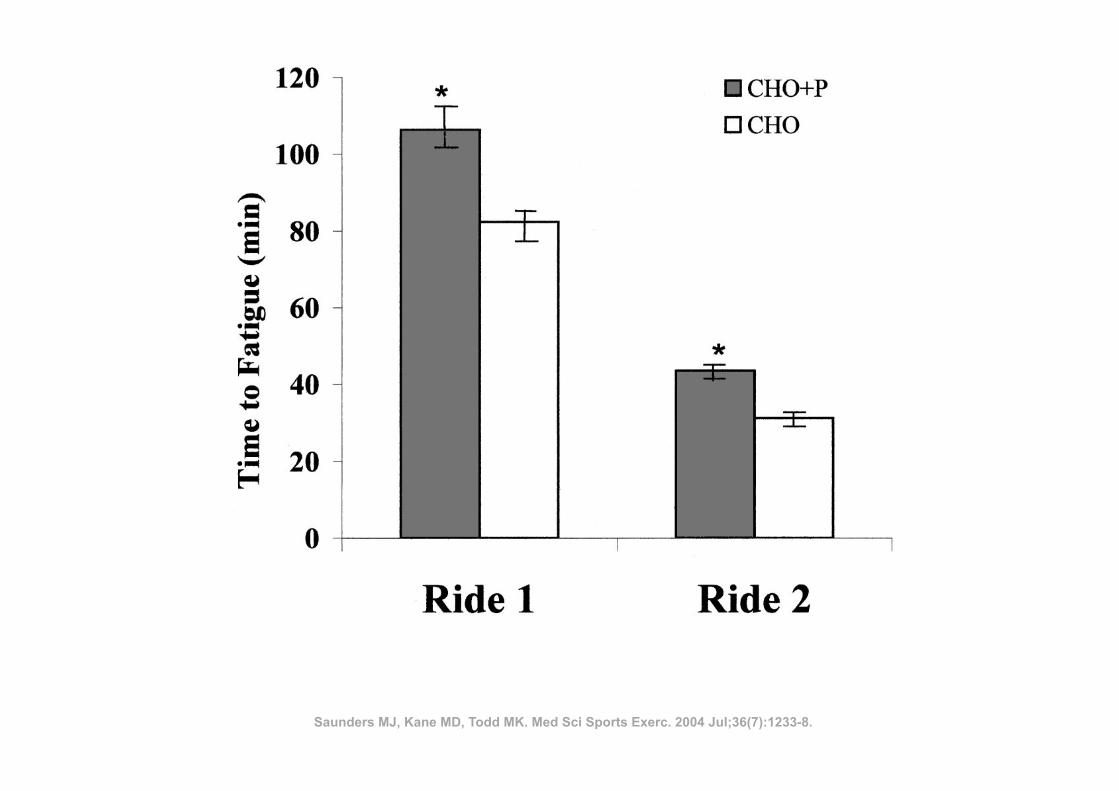
lower (P ! 0.05) after the CHO"P trial (with additionalprotein calories) than the CHO trial (Fig. 3). Because of thesizable differences in within-group variability between thepostexercise trials, a Wilcoxon signed ranks test was used tocompare these CPK levels, which were also statisticallysignificant between treatments.Dependent t-tests were utilized to examine differences in
steady-state levels of blood glucose, lactate, ventilation,VO2, heart rate, and RPE during exercise between the twobeverage conditions. These results are presented in Table 2.Because time to exhaustion varied considerably betweensubjects, these variables were calculated from data gatheredat minute 30 of each ride to maintain consistency. It shouldalso be noted that analyses for the second performance ridecontains only 14 data points, as one of the subjects did notreach 30 min of exercise duration during the high intensity
ride. None of the variables in Table 2 were significantdifferent (P ! 0.05) between the treatments for either ride.
DISCUSSION
The primary objectives of this study were to determinewhether CHO"P beverages produced improvements in per-formance time to fatigue and muscle damage compared withCHO beverages in endurance athletes. The beverages usedfor this comparison were matched for total carbohydratecontent but not total calories. This approach is highly gen-eralizable, because commercially available CHO"P bever-ages have typically added protein to beverages that alreadycontain 6–10% carbohydrate (a typical level for CHO-onlybeverages). Mechanistically, this approach is advantageousbecause the additional protein content of the CHO"P drinkis the only energy substrate difference between the CHO"Pand CHO beverages. By matching the carbohydrate portion,any difference in performance or recovery can be attributedto something other than the absolute carbohydrate content ofthe fluids. A limitation of this approach is that the increasedavailability of total calories from the CHO"P beverage mayhave contributed to differences between trials. To minimizethe effects of caloric or carbohydrate intake between trials,subjects in this study were asked to maintain a consistentdiet before each performance bout. Subjects also provideddietary records for 3 d before each performance ride, whichverified the consistency of dietary macronutrients and totalcaloric content between trials.One of the main purposes of this study was to determine
whether a CHO"P beverage could enhance athletic perfor-mance during prolonged endurance bouts to a greater extentthan a CHO beverage. When utilizing the CHO"P bever-age, subjects maintained an intensity of 75% of theirVO2peak 29% longer (P ! 0.05) than when consuming aCHO beverage. In a comparable study, Ivy et al. (11) com-pared CHO and CHO"P beverages during an exercise boutthat simulated a competitive cycling event. After 180 min ofvarying intensity cycling, athletes in the CHO"P trial sus-tained exercise at 85% VO2peak for 36% longer than duringa CHO trial (26.9 # 4.5 vs 19.7 # 4.6 min). The agreement
FIGURE 2—Time to exhaustion during performance rides. *Signifi-cantly greater (P < 0.05) than CHO ride.
FIGURE 3—Change in CPK levels. *Significantly lower (P < 0.05)than CHO ride.
TABLE 2. Physiological data from performance rides.
Performance Ride CHO ! P CHO
Glucose (mg!dL$1)Ride 1 (75% VO2peak) 90.3 # 15.4 91.5 # 13.5Ride 2 (85% VO2peak) 90.1 # 17.2 93.9 # 14.9
Lactate (mmol!L$1)Ride 1 (75% VO2peak) 2.7 # 1.7 3.1 # 1.1Ride 2 (85% VO2peak) 3.5 # 1.1 3.6 # 0.8
Ventilation (L!min$1)Ride 1 (75% VO2peak) 79.2 # 21.2 81.2 # 18.1Ride 2 (85% VO2peak) 89.3 # 32.1 95.5 # 17.6
VO2 (L!min$1)Ride 1 (75% VO2peak) 2.7 # 0.6 2.7 # 0.6Ride 2 (85% VO2peak) 3.1 # 0.6 3.1 # 0.6
RPERide 1 (75% VO2peak) 14.9 # 2.3 15.6 # 2.0Ride 2 (85% VO2peak) 17.7 # 0.8 18.4 # 0.6
Heart rate (bpm)Ride 1 (75% VO2peak) 166.0 # 14.0 169.4 # 13.5Ride 2 (85% VO2peak) 172.9 # 9.0 175.3 # 6.8
1236 Official Journal of the American College of Sports Medicine http://www.acsm-msse.org
Saunders MJ, Kane MD, Todd MK. Med Sci Sports Exerc. 2004 Jul;36(7):1233-8.
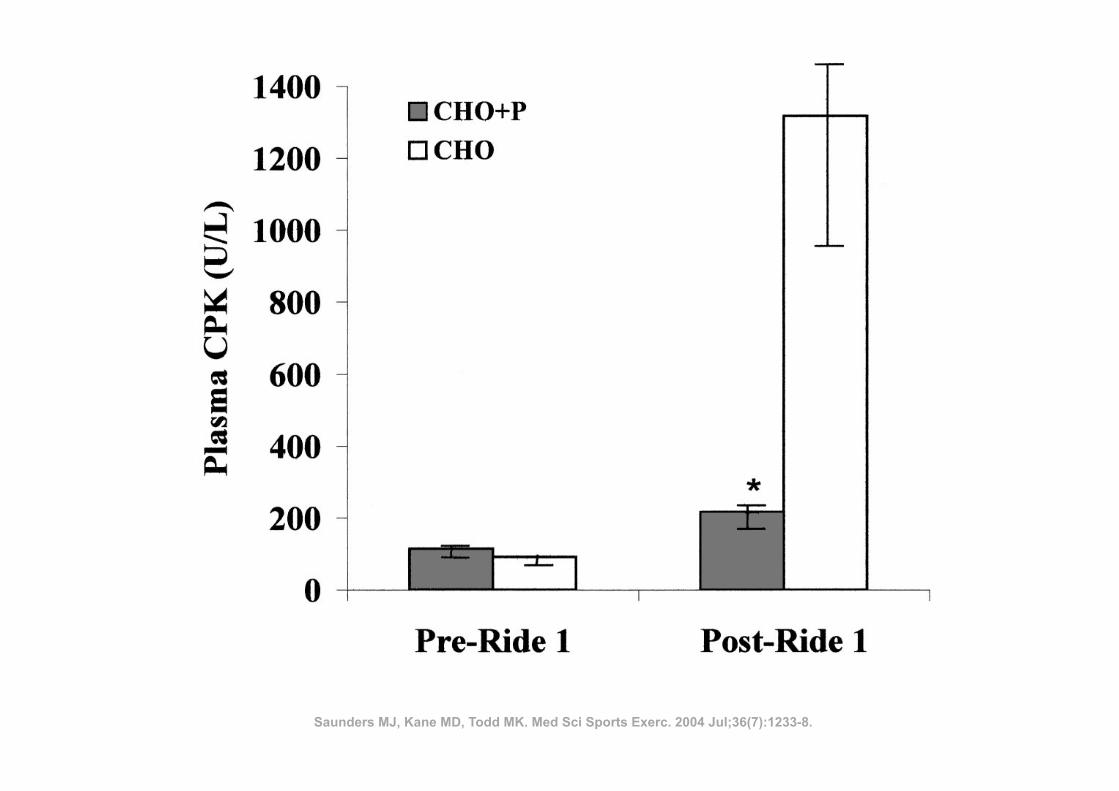
lower (P ! 0.05) after the CHO"P trial (with additionalprotein calories) than the CHO trial (Fig. 3). Because of thesizable differences in within-group variability between thepostexercise trials, a Wilcoxon signed ranks test was used tocompare these CPK levels, which were also statisticallysignificant between treatments.Dependent t-tests were utilized to examine differences in
steady-state levels of blood glucose, lactate, ventilation,VO2, heart rate, and RPE during exercise between the twobeverage conditions. These results are presented in Table 2.Because time to exhaustion varied considerably betweensubjects, these variables were calculated from data gatheredat minute 30 of each ride to maintain consistency. It shouldalso be noted that analyses for the second performance ridecontains only 14 data points, as one of the subjects did notreach 30 min of exercise duration during the high intensity
ride. None of the variables in Table 2 were significantdifferent (P ! 0.05) between the treatments for either ride.
DISCUSSION
The primary objectives of this study were to determinewhether CHO"P beverages produced improvements in per-formance time to fatigue and muscle damage compared withCHO beverages in endurance athletes. The beverages usedfor this comparison were matched for total carbohydratecontent but not total calories. This approach is highly gen-eralizable, because commercially available CHO"P bever-ages have typically added protein to beverages that alreadycontain 6–10% carbohydrate (a typical level for CHO-onlybeverages). Mechanistically, this approach is advantageousbecause the additional protein content of the CHO"P drinkis the only energy substrate difference between the CHO"Pand CHO beverages. By matching the carbohydrate portion,any difference in performance or recovery can be attributedto something other than the absolute carbohydrate content ofthe fluids. A limitation of this approach is that the increasedavailability of total calories from the CHO"P beverage mayhave contributed to differences between trials. To minimizethe effects of caloric or carbohydrate intake between trials,subjects in this study were asked to maintain a consistentdiet before each performance bout. Subjects also provideddietary records for 3 d before each performance ride, whichverified the consistency of dietary macronutrients and totalcaloric content between trials.One of the main purposes of this study was to determine
whether a CHO"P beverage could enhance athletic perfor-mance during prolonged endurance bouts to a greater extentthan a CHO beverage. When utilizing the CHO"P bever-age, subjects maintained an intensity of 75% of theirVO2peak 29% longer (P ! 0.05) than when consuming aCHO beverage. In a comparable study, Ivy et al. (11) com-pared CHO and CHO"P beverages during an exercise boutthat simulated a competitive cycling event. After 180 min ofvarying intensity cycling, athletes in the CHO"P trial sus-tained exercise at 85% VO2peak for 36% longer than duringa CHO trial (26.9 # 4.5 vs 19.7 # 4.6 min). The agreement
FIGURE 2—Time to exhaustion during performance rides. *Signifi-cantly greater (P < 0.05) than CHO ride.
FIGURE 3—Change in CPK levels. *Significantly lower (P < 0.05)than CHO ride.
TABLE 2. Physiological data from performance rides.
Performance Ride CHO ! P CHO
Glucose (mg!dL$1)Ride 1 (75% VO2peak) 90.3 # 15.4 91.5 # 13.5Ride 2 (85% VO2peak) 90.1 # 17.2 93.9 # 14.9
Lactate (mmol!L$1)Ride 1 (75% VO2peak) 2.7 # 1.7 3.1 # 1.1Ride 2 (85% VO2peak) 3.5 # 1.1 3.6 # 0.8
Ventilation (L!min$1)Ride 1 (75% VO2peak) 79.2 # 21.2 81.2 # 18.1Ride 2 (85% VO2peak) 89.3 # 32.1 95.5 # 17.6
VO2 (L!min$1)Ride 1 (75% VO2peak) 2.7 # 0.6 2.7 # 0.6Ride 2 (85% VO2peak) 3.1 # 0.6 3.1 # 0.6
RPERide 1 (75% VO2peak) 14.9 # 2.3 15.6 # 2.0Ride 2 (85% VO2peak) 17.7 # 0.8 18.4 # 0.6
Heart rate (bpm)Ride 1 (75% VO2peak) 166.0 # 14.0 169.4 # 13.5Ride 2 (85% VO2peak) 172.9 # 9.0 175.3 # 6.8
1236 Official Journal of the American College of Sports Medicine http://www.acsm-msse.org
Saunders MJ, Kane MD, Todd MK. Med Sci Sports Exerc. 2004 Jul;36(7):1233-8.
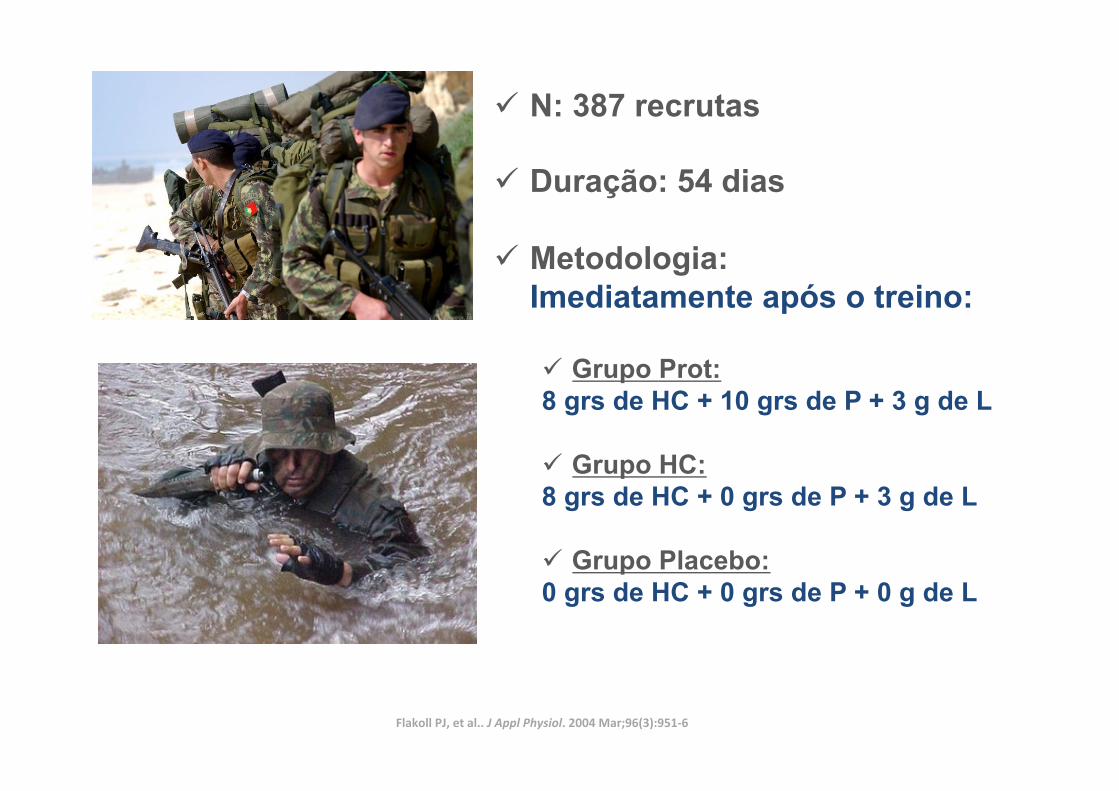
ü N: 387 recrutas
ü Duração: 54 dias
ü Metodologia: Imediatamente após o treino:
ü Grupo Prot: 8 grs de HC + 10 grs de P + 3 g de L
ü Grupo HC: 8 grs de HC + 0 grs de P + 3 g de L
ü Grupo Placebo: 0 grs de HC + 0 grs de P + 0 g de L
Flakoll PJ, et al.. J Appl Physiol. 2004 Mar;96(3):951-‐6
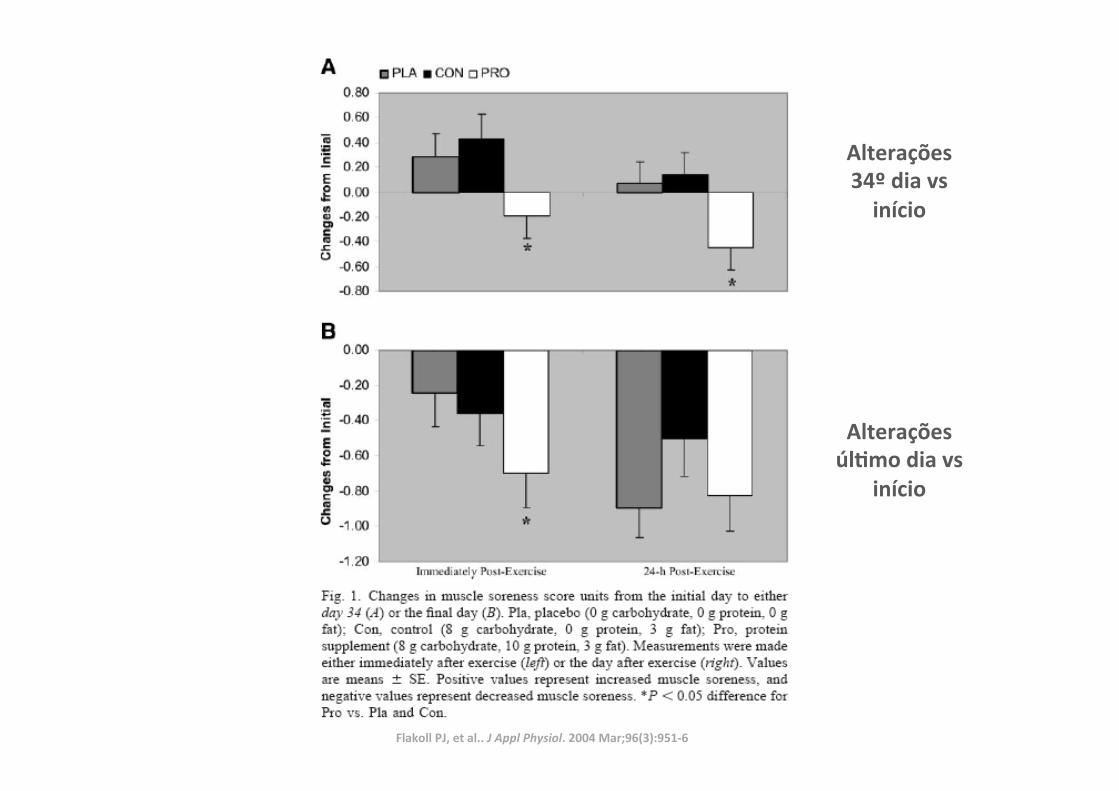
Alterações 34º dia vs início
Alterações úlLmo dia vs
início
Flakoll PJ, et al.. J Appl Physiol. 2004 Mar;96(3):951-‐6
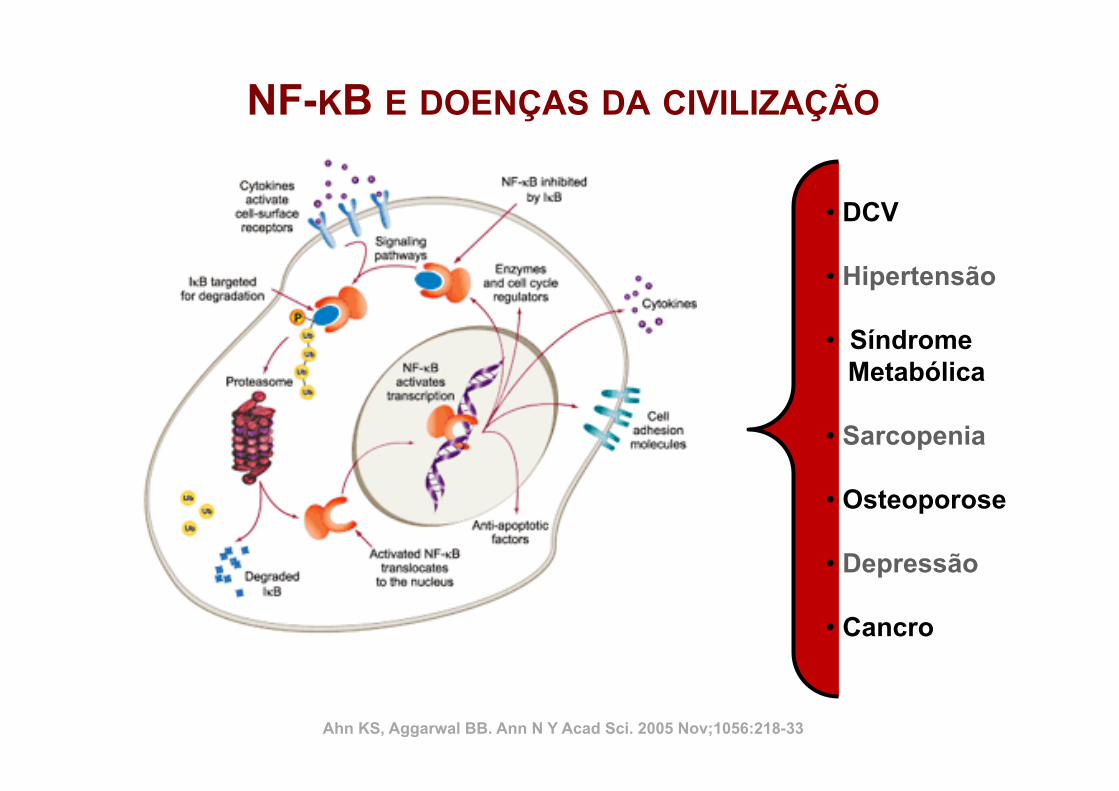
• DCV
• Hipertensão
• Síndrome Metabólica
• Sarcopenia
• Osteoporose
• Depressão
• Cancro
NF-KB E DOENÇAS DA CIVILIZAÇÃO
Ahn KS, Aggarwal BB. Ann N Y Acad Sci. 2005 Nov;1056:218-33
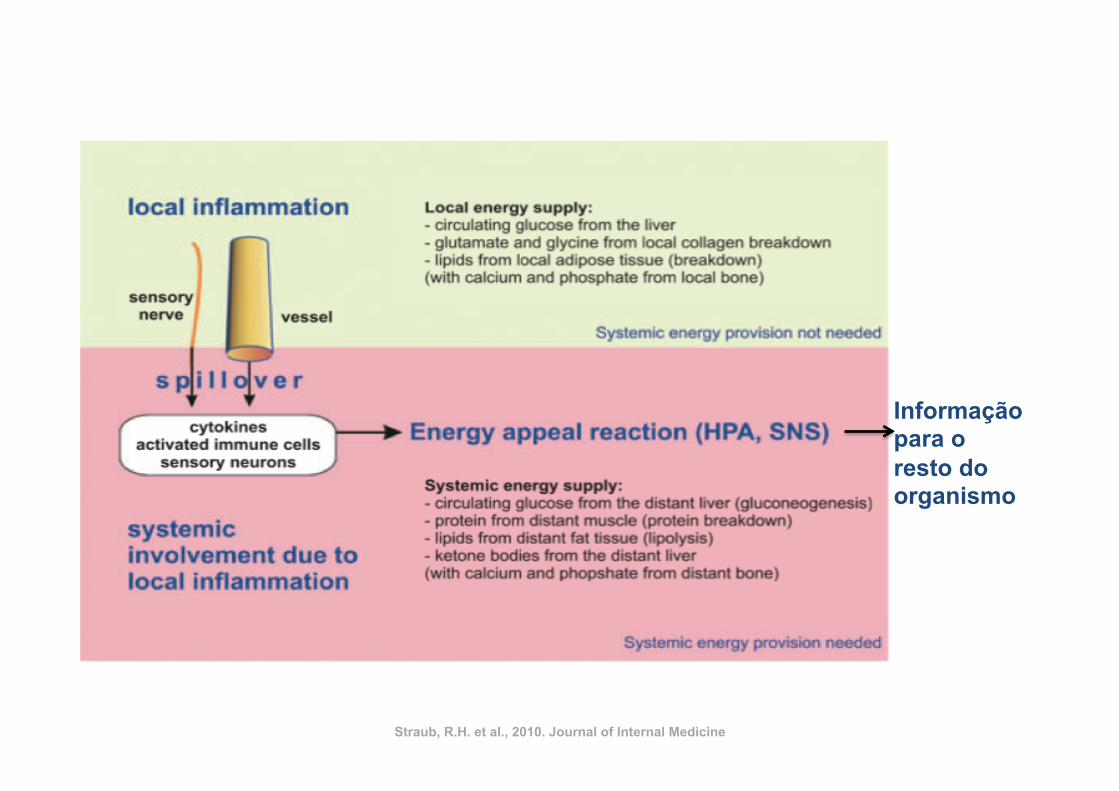
Informação para o resto do organismo
Straub, R.H. et al., 2010. Journal of Internal Medicine
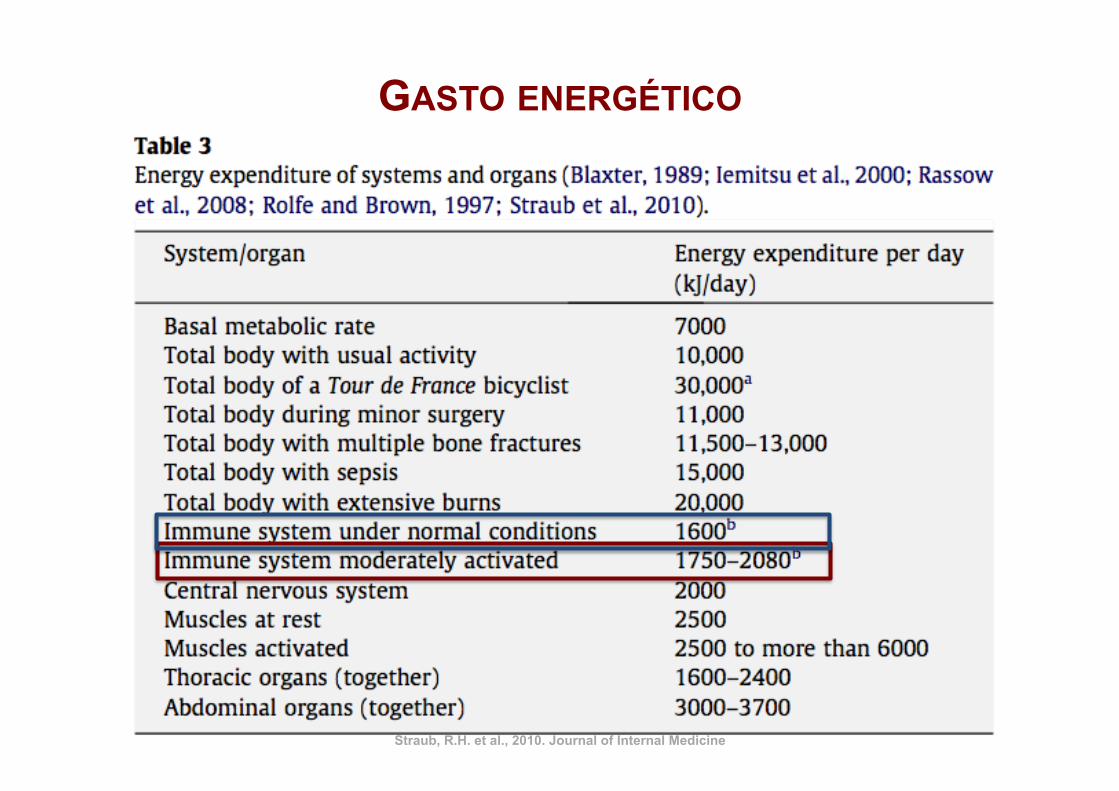
GASTO ENERGÉTICO
Straub, R.H. et al., 2010. Journal of Internal Medicine
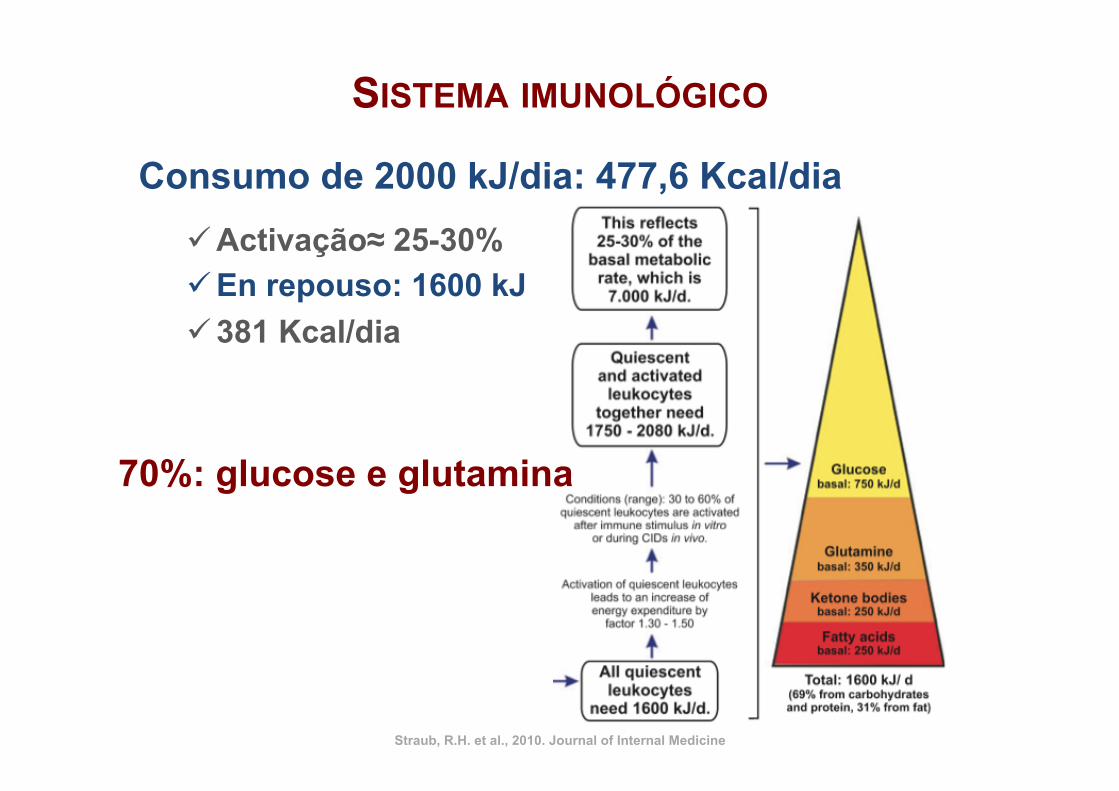
Consumo de 2000 kJ/dia: 477,6 Kcal/dia ü Activação≈ 25-30% ü En repouso: 1600 kJ ü 381 Kcal/dia
Straub, R.H. et al., 2010. Journal of Internal Medicine
SISTEMA IMUNOLÓGICO
70%: glucose e glutamina
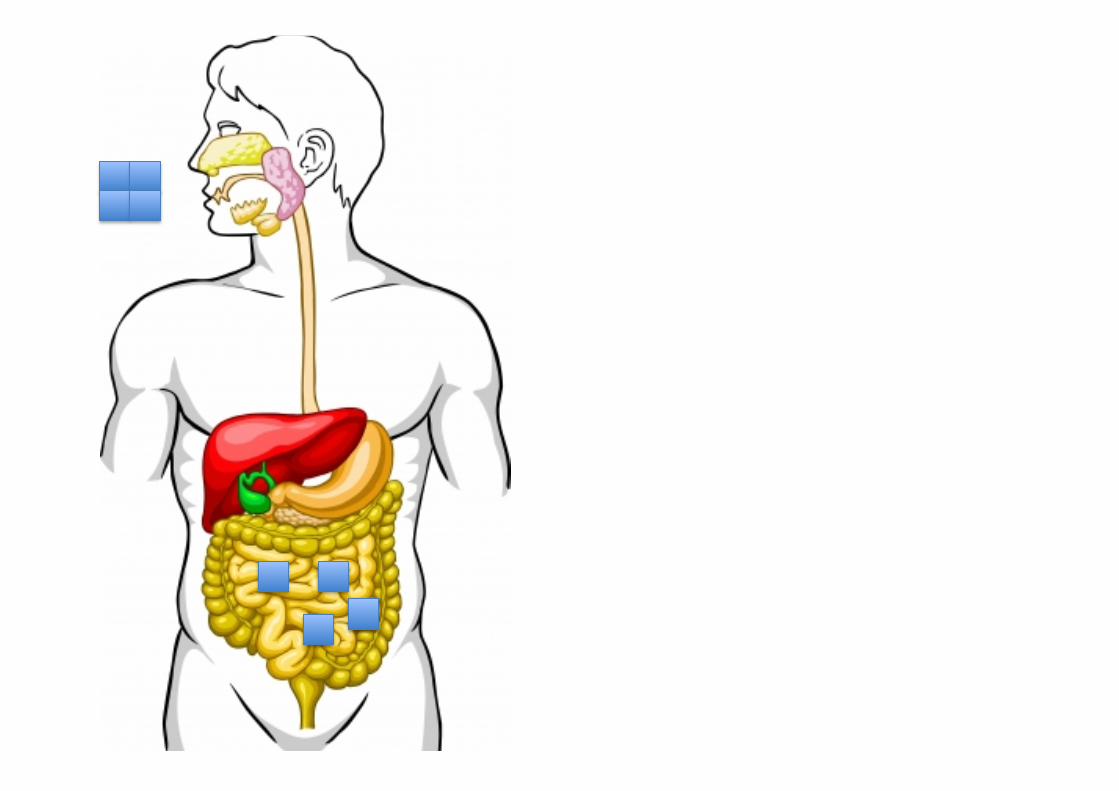
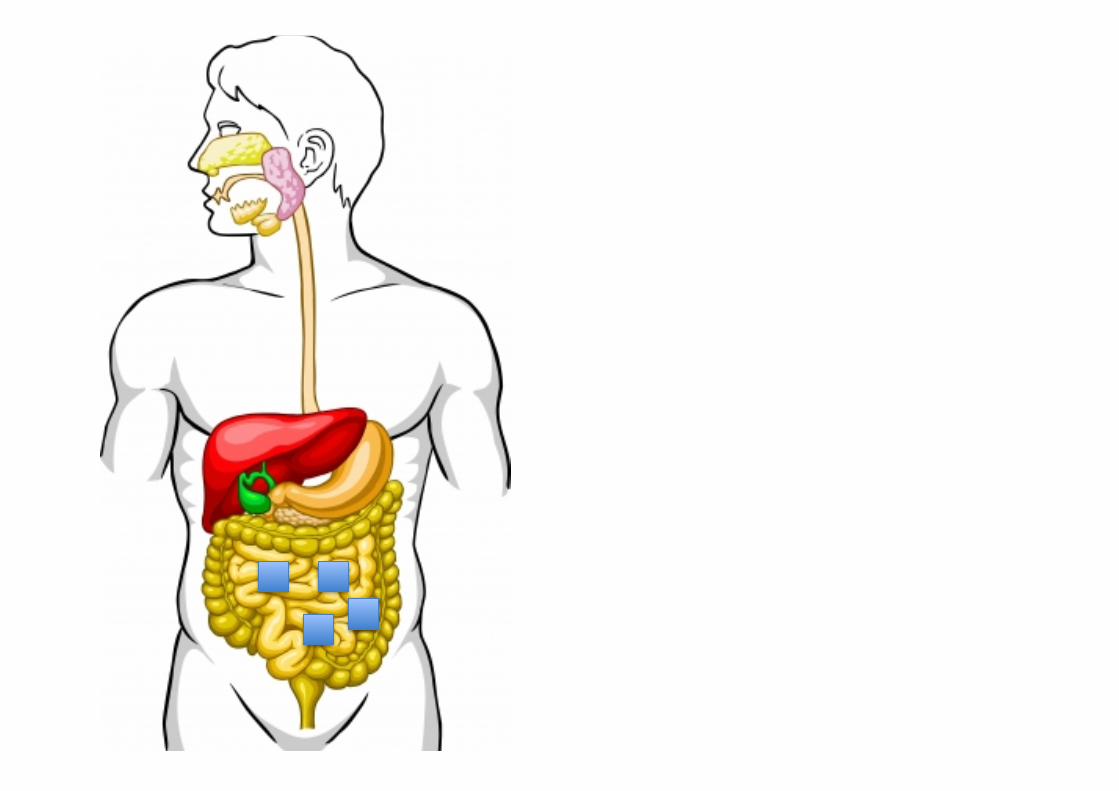
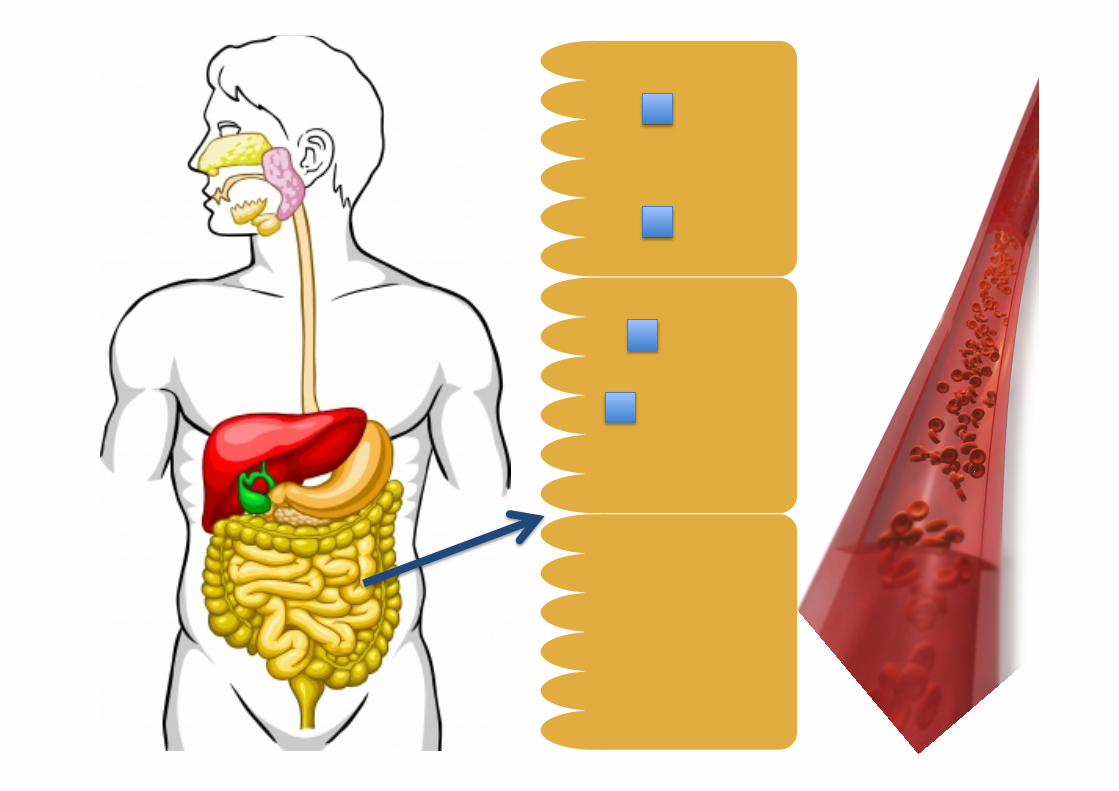
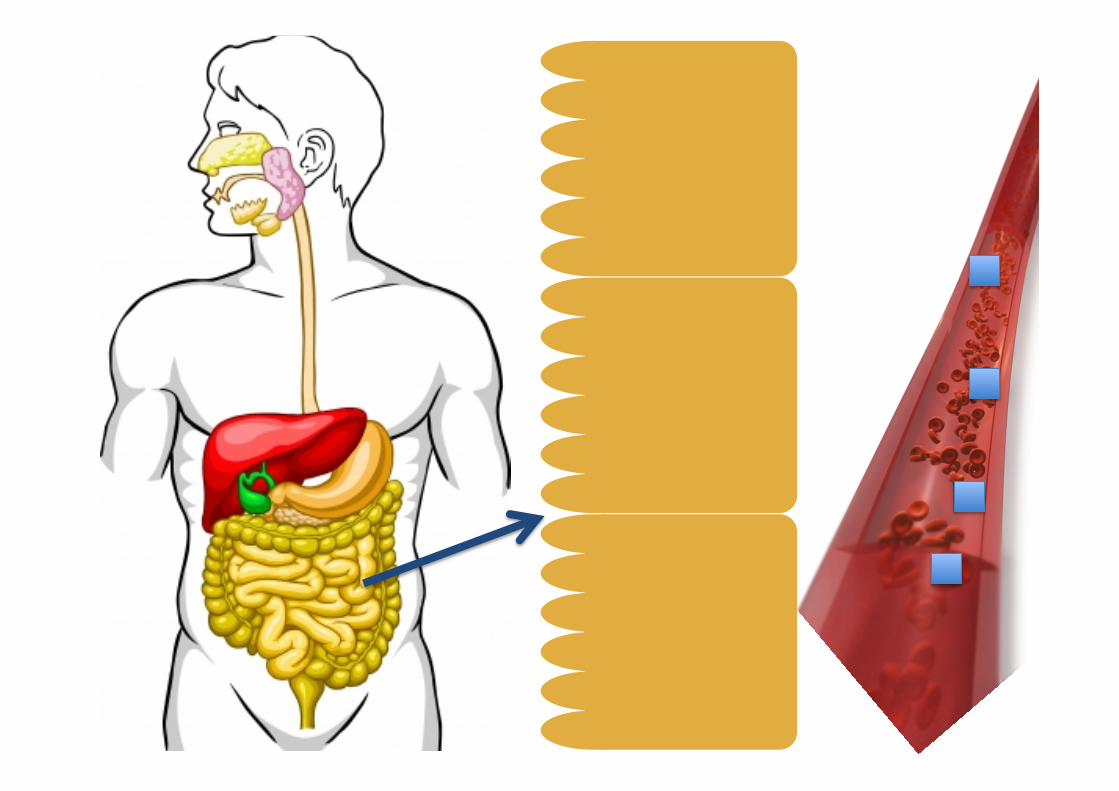
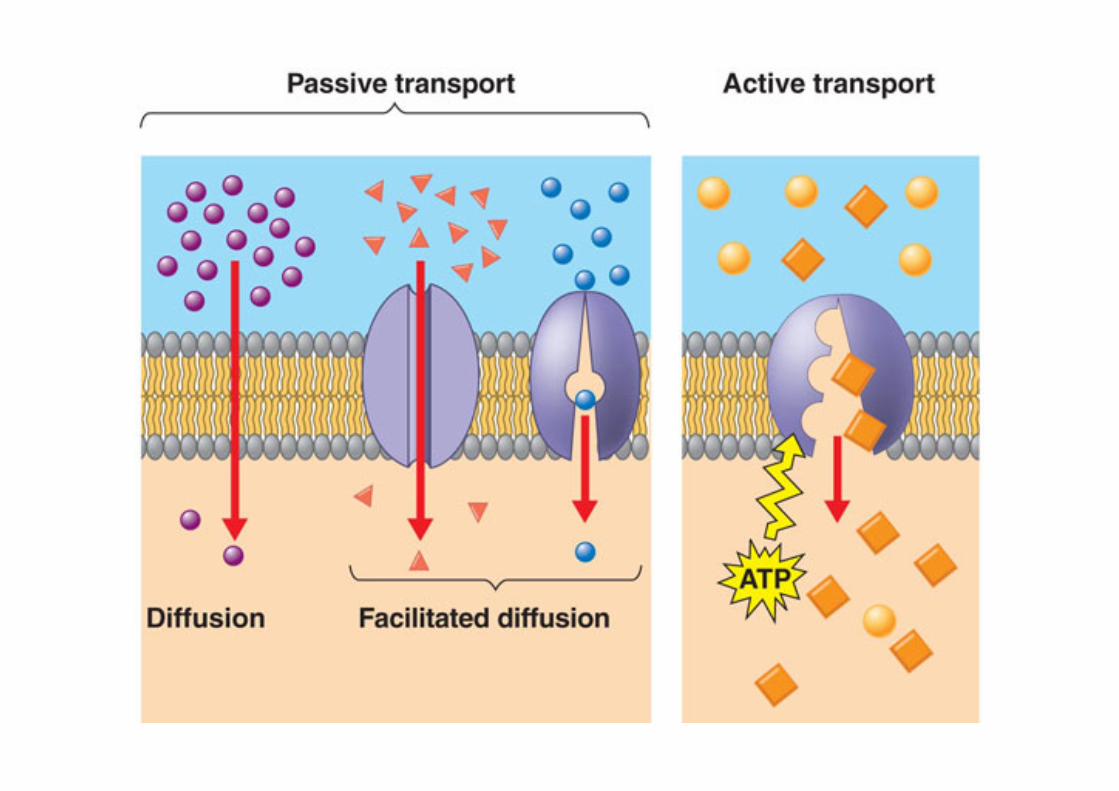
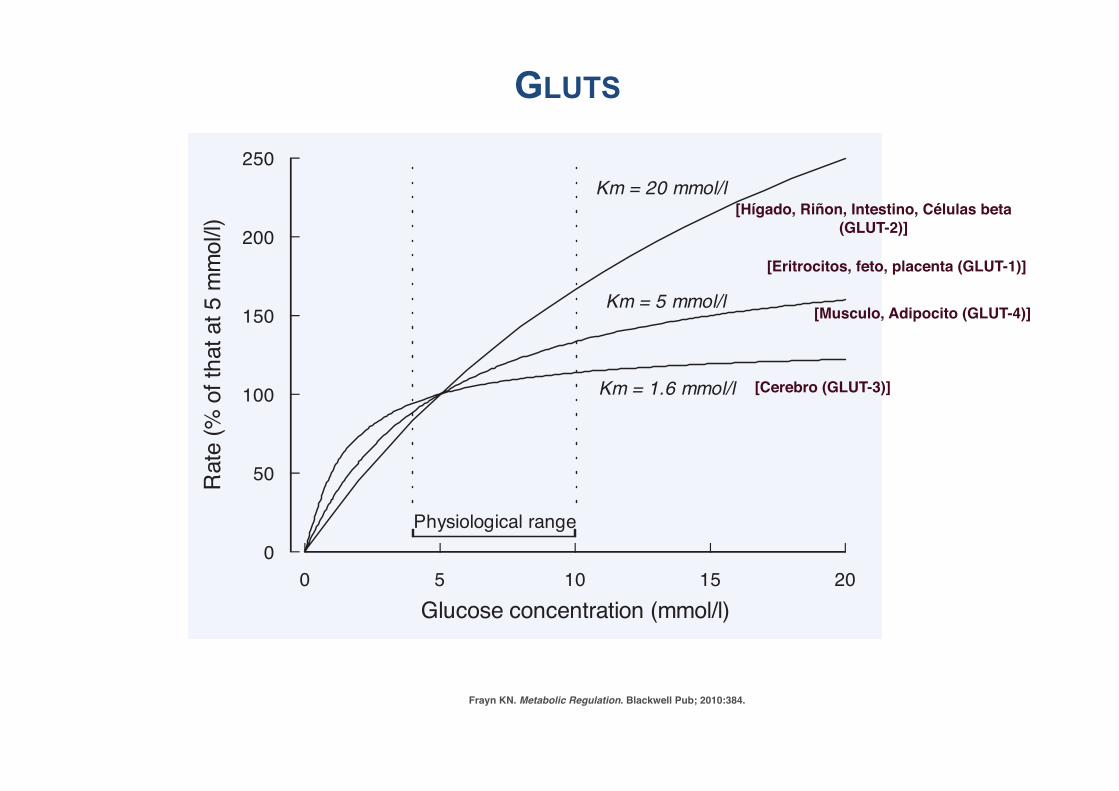
P1: JZPc02 BLBK217-Frayn December 2, 2009 23:35 Printer Name: Yet to Come
Metabolic Regulation Brought About by the Characteristics of Tissues 35
Table 2.2.1 (Continued)
NameTissuedistribution
Approximate Km(for inwardtransport ofglucose or aglucose analog)
Size (no. ofamino acids)
Importantfeatures
SGLT-3 Renal tubules,neurons inintestine andmuscle
SGLT-3 apears to bea glucose-sensitiveion channel ratherthan a glucosetransporter (seeScheepers et al.,Further Readingfor moreinformation).
Based on Gould and Holman (1993); Joost et al. (2002); Thorens (1996); Wallner et al.(2001); Wright (1993). For recent updates see Schurmann and Manolescu et al., FurtherReading.
0 5 10 15 20Glucose concentration (mmol/l)
0
50
100
150
200
250
Rate
(% of
that
at 5 m
mol/l)
Km = 20 mmol/l
Km = 5 mmol/l
Km = 1.6 mmol/l
Physiological range
Figure 2.2.1
The term Km (Michaelis–Menten constant) is often used in this context, bor-rowed from enzyme kinetics. Think of Km as follows. Imagine that at a very highconcentration of substrate (glucose outside the cell), there will be a certain max-imum rate of glucose transport (the “plateau”: you can see this on Figure 2.2.1for the Km = 1.6 mmol/l transporter). The Km is the substrate concentration atwhich half this rate is achieved. With a glucose transporter whose Km for glu-cose entry is 1.6 mmol/l (e.g., GLUT3), the rate of glucose uptake is relativelyindependent of the extracellular glucose concentration over the normal, physio-logical range of plasma glucose concentrations (well above the Km). This would be
Frayn KN. Metabolic Regulation. Blackwell Pub; 2010:384.
[Cerebro (GLUT-3)]
[Musculo, Adipocito (GLUT-4)]
[Hígado, Riñon, Intestino, Células beta (GLUT-2)]
[Eritrocitos, feto, placenta (GLUT-1)]
GLUTS
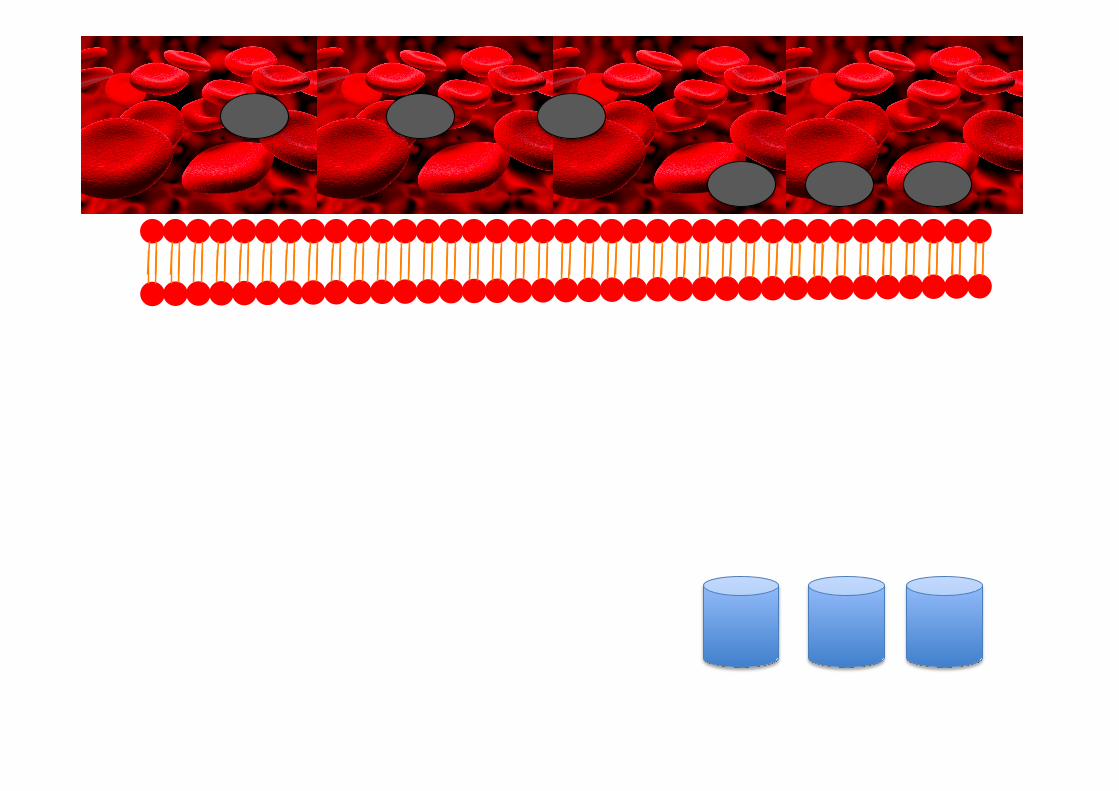
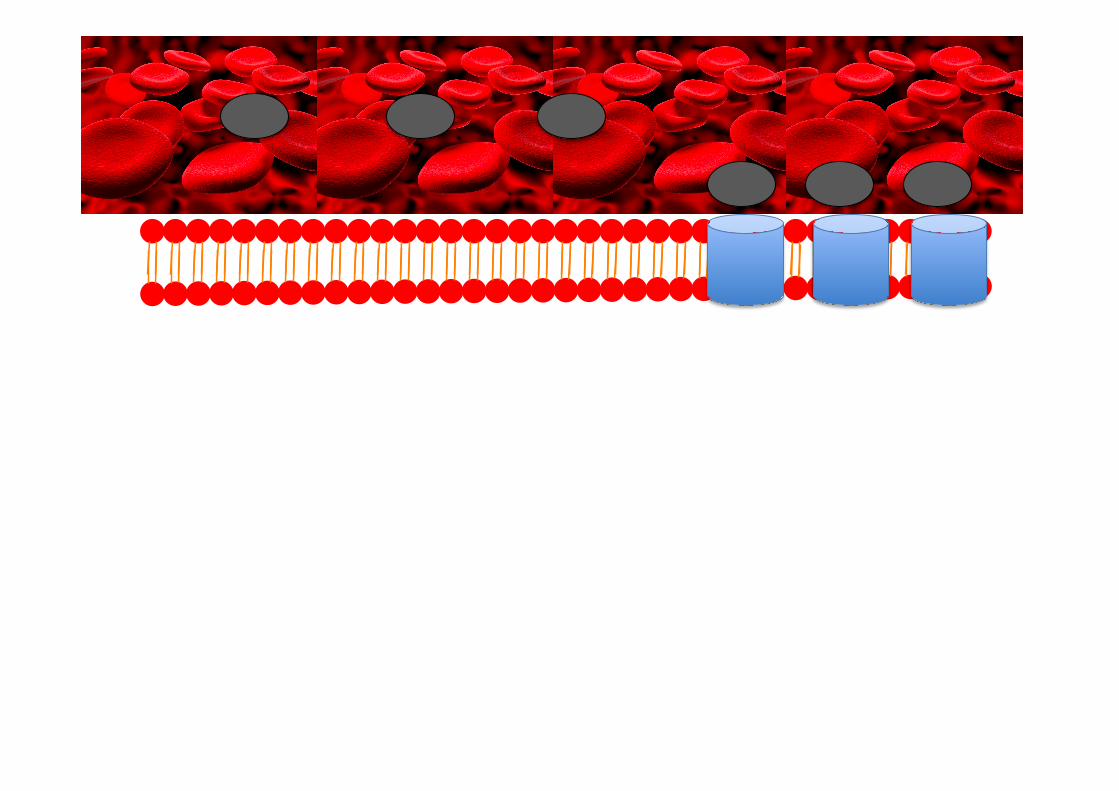
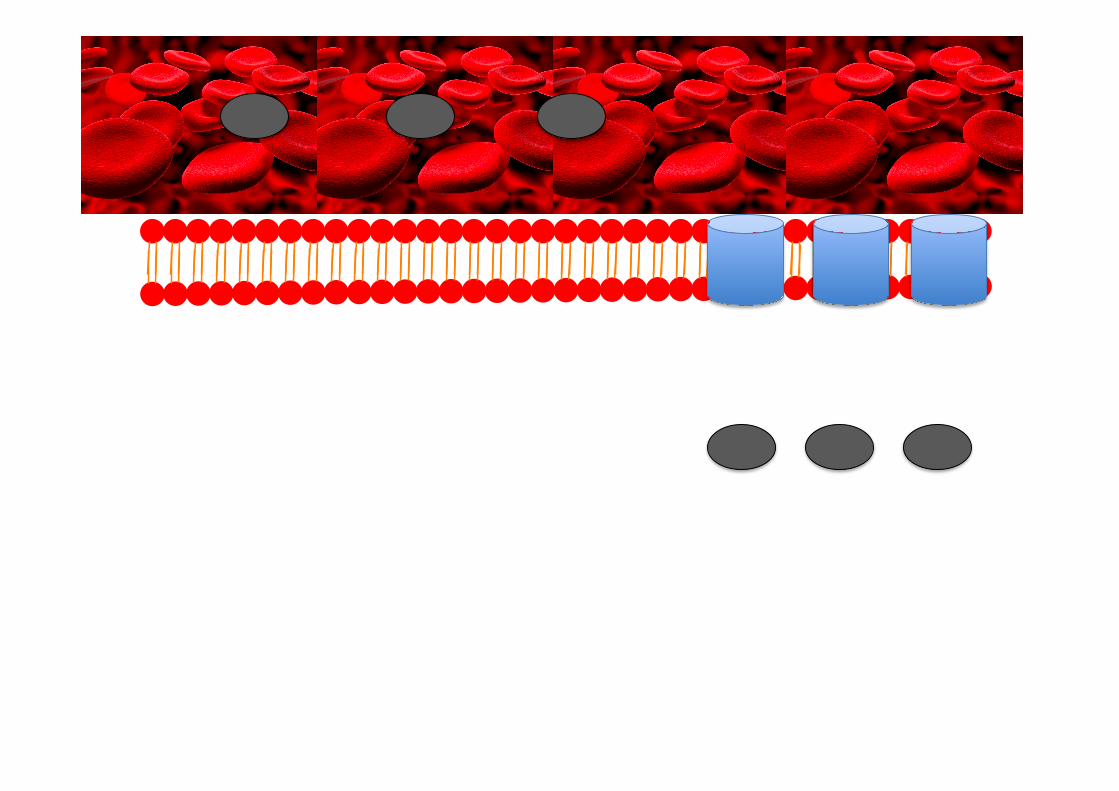
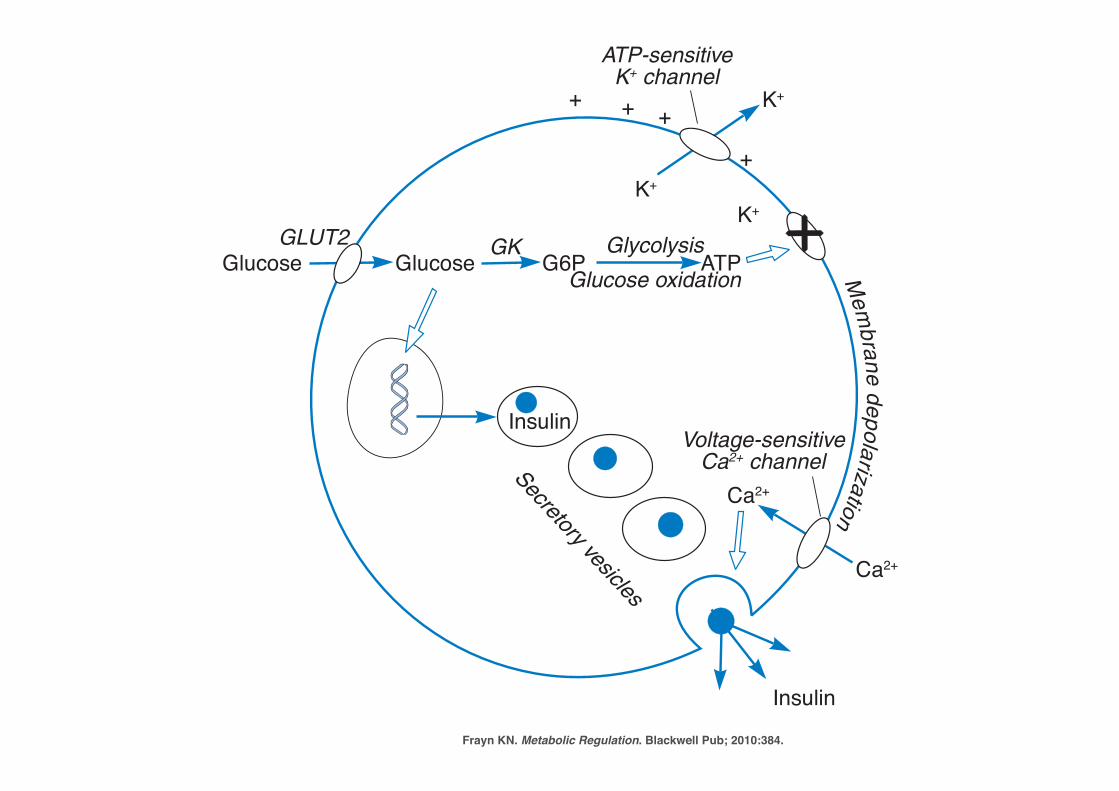
P1: JZPc06 BLBK217-Frayn November 30, 2009 12:50 Printer Name: Yet to Come
150 Important Endocrine Organs and Hormones
Mem
brane depolarizationGlucose Glucose ATPGlycolysis
Glucose oxidation
K+
K+K+
Ca2+
Ca2+
InsulinVoltage-sensitive
Ca2+ channel
ATP-sensitiveK+ channel
Insulin
GLUT2
+
+
+ +
Secretory vesicles
GK G6P
Figure 6.4 Glucose stimulation of insulin secretion in the pancreatic !-cell. Glucoseenters the cell via the transporter GLUT2 (but see below) and is phosphorylated by glucokinase (GK)(hexokinase IV). These steps are similar to glucose utilization in the liver and allow the ! -cell to“sense” the plasma glucose concentration. Generation of ATP from glucose utilization closes ATP-sensitive K+ channels in the cell membrane, stopping the outward flow of K+ ions that normallymaintains the resting membrane potential (see Box 8.1, p. 215, for full description of this). This leadsto membrane depolarization and opening of voltage-sensitive Ca2+ channels. Insulin is present inmultiple secretory vesicles in the cell, as a crystalline complex in the center of the vesicle. An inwardflux of Ca2+ ions causes exocytosis of the insulin-containing secretory vesicles, and hence insulinsecretion. Glucose also stimulates synthesis of new insulin (Section 4.3.1). Although this scenario istrue in rodent islets, there is some question over the presence of GLUT2 in human ! -cells and it maybe that GLUT1 and GLUT3 give the human ! -cell sufficient glucose transport capacity (for discussion,see Schuit (1997)). The ATP-sensitive K+ channel has been much studied. It has two subunits. Oneis the K+ channel itself. This belongs to the family of inwardly-rectifying K+ channels (Kir, family 6no. 2, hence Kir6.2). The other sub-unit modulates the activity of the channel and is the “receptor”for ATP (strictly, the complex Mg2+-ATP). But it is also the target for the drugs used to treat type 2diabetes, the sulfonylureas (see later, Section 11.4.2). They bind, and cause channel closure, just asATP does. Hence, this has become known as the sulfonylurea receptor, SUR. Again, there is afamily of related proteins, and the one expressed in the ! -cell is known as SUR1.
(somewhat) stimulate insulin secretion that is stimulated by glucose: this could beseen as a mechanism for restraining ketone body concentrations, since increased in-sulin secretion will inhibit fatty acid release from adipose tissue and ketogenesis in theliver.
There has been considerable interest recently in the effects of fatty acids on insulinsecretion. Fatty acids are essential for normal glucose-stimulated insulin secretion;
Frayn KN. Metabolic Regulation. Blackwell Pub; 2010:384.
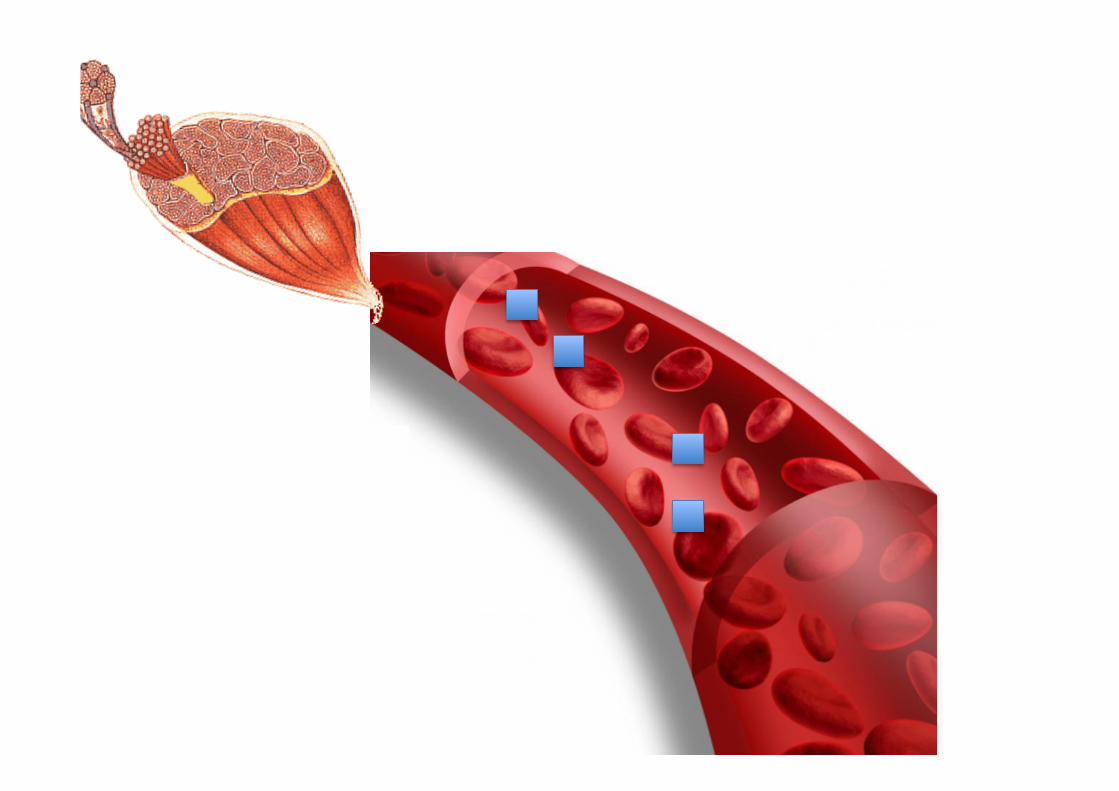
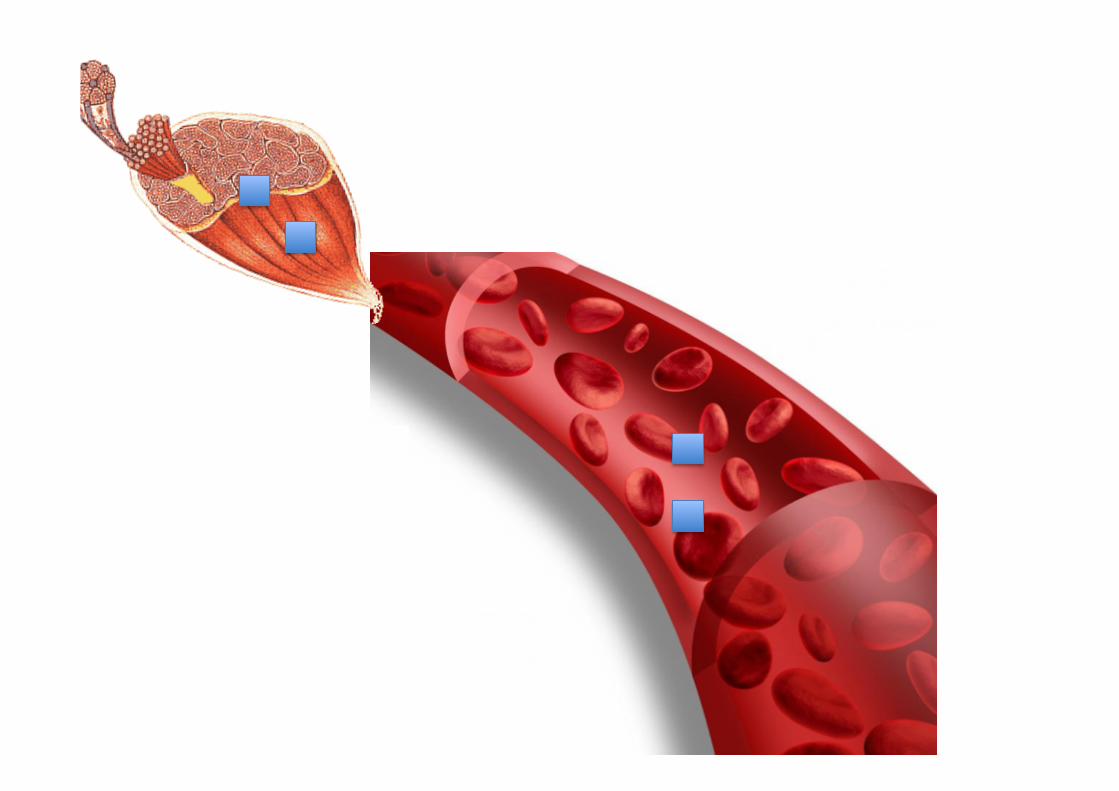
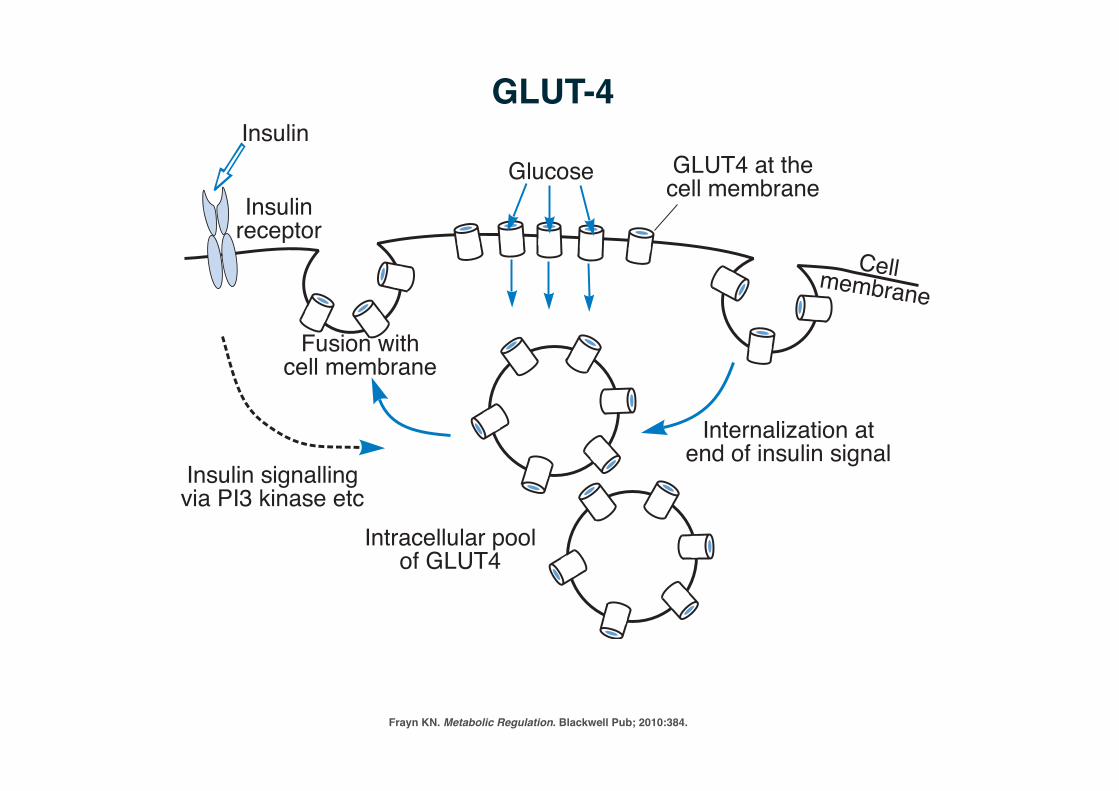
P1: JZPc02 BLBK217-Frayn December 2, 2009 23:35 Printer Name: Yet to Come
Metabolic Regulation Brought About by the Characteristics of Tissues 37
Glucose GLUT4 at thecell membraneInsulin
receptorCellmembrane
Insulin signallingvia PI3 kinase etc
Intracellular poolof GLUT4
Internalization atend of insulin signal
Fusion withcell membrane
Insulin
Figure 2.3 GLUT4 recruitment to the cell membrane. There is an intracellular pool ofGLUT4 in membranous vesicles that can translocate to the cell membrane when insulin binds toits receptor. When the insulin signal is withdrawn, the GLUT4 proteins return to their intracellularpool. Based loosely on Shepherd and Kahn (1999). A similar mechanism may operate for GLUT2translocation in the small intestine, stimulated by the presence of glucose in the intestinal lumen: seeSection 3.3.1
2.2.1.2 Amino AcidsThe concentrations of most amino acids are considerably higher inside cells thanoutside: this is illustrated in Table 2.2 for some amino acids in skeletal muscle. Thisimplies the existence of active transporters to move amino acids into the cells upa concentration gradient. In fact, like glucose in the small intestine, amino acidsare mostly actively transported by sodium-linked carriers. Again, therefore, energy isrequired to pump the sodium ions out and maintain their concentration gradient. Thereare many different amino acid transporters, expressed in a tissue-specific manner.Each has a fairly broad specificity and transports a number of amino acids. They aredescribed further in Table 2.3.
2.2.1.3 Fatty AcidsFatty acids arrive at cells in two ways. They may come in the form of non-esterifiedfatty acids that have been carried through the plasma bound to albumin. Alternatively,they may be liberated from triacylglycerol in the plasma (carried in lipoprotein parti-cles, to be discussed further in Chapter 10) by the enzyme lipoprotein lipase attachedto the endothelial cells that line the capillaries. They cross the endothelial cell liningand enter cells (e.g., liver, skeletal muscle, cardiac muscle, adipose tissue) down a con-centration gradient, which is generated by avid binding to specific fatty acid bindingproteins within the cells. The gradient is maintained because the fatty acids are utilizedfor further metabolism within the cells. The first step in this process is always ester-ification to coenzyme A to form acyl-CoA thioesters. This step is sometimes calledactivation. It requires ATP and releases AMP and pyrophosphate, PPi. It has been
Frayn KN. Metabolic Regulation. Blackwell Pub; 2010:384.
GLUT-4

IR
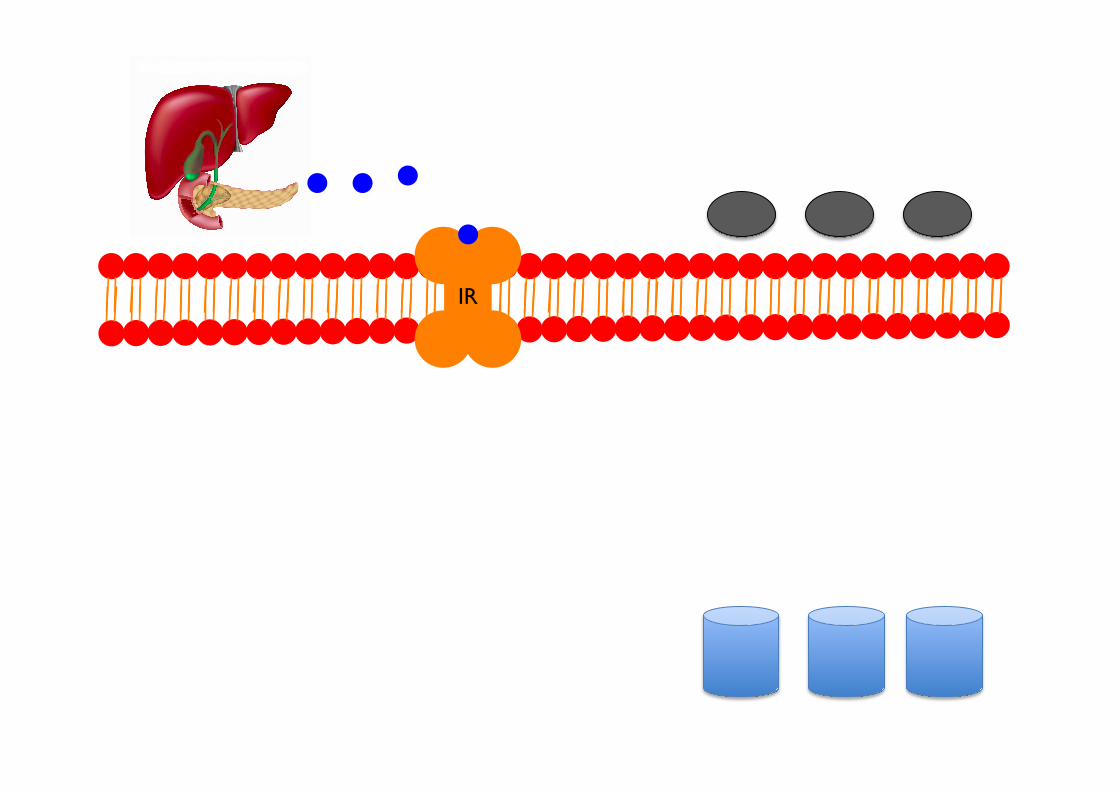
IR
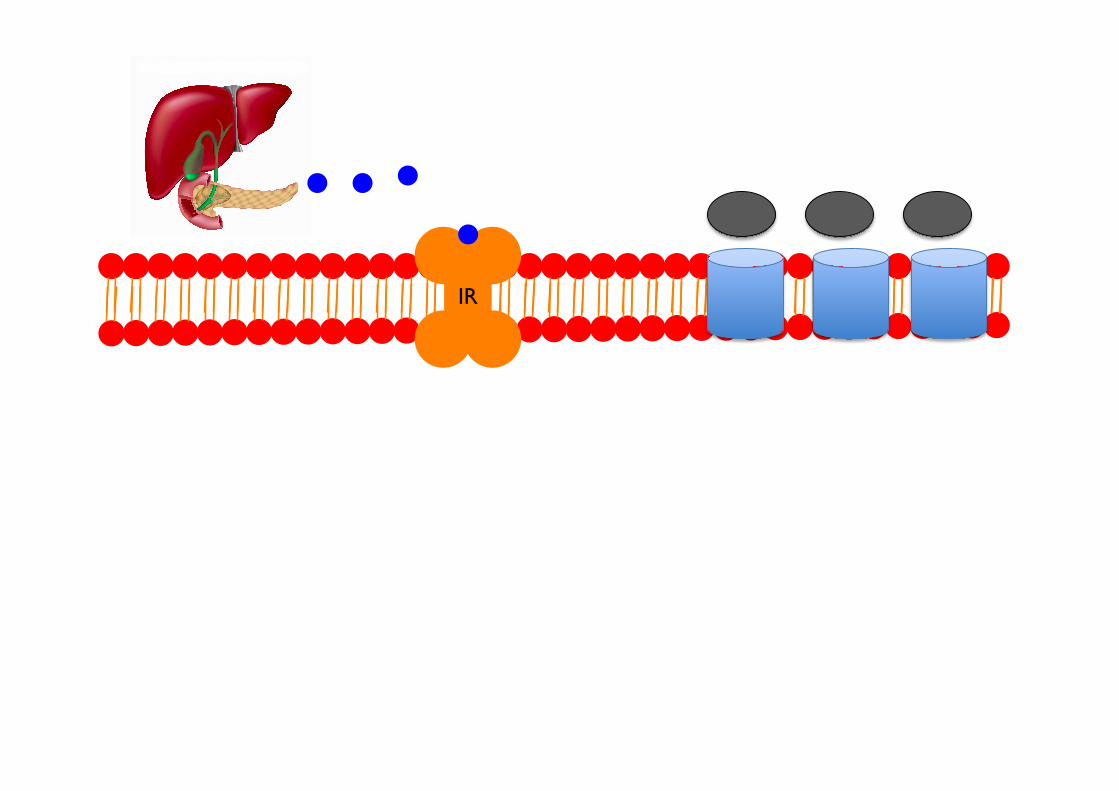
IR
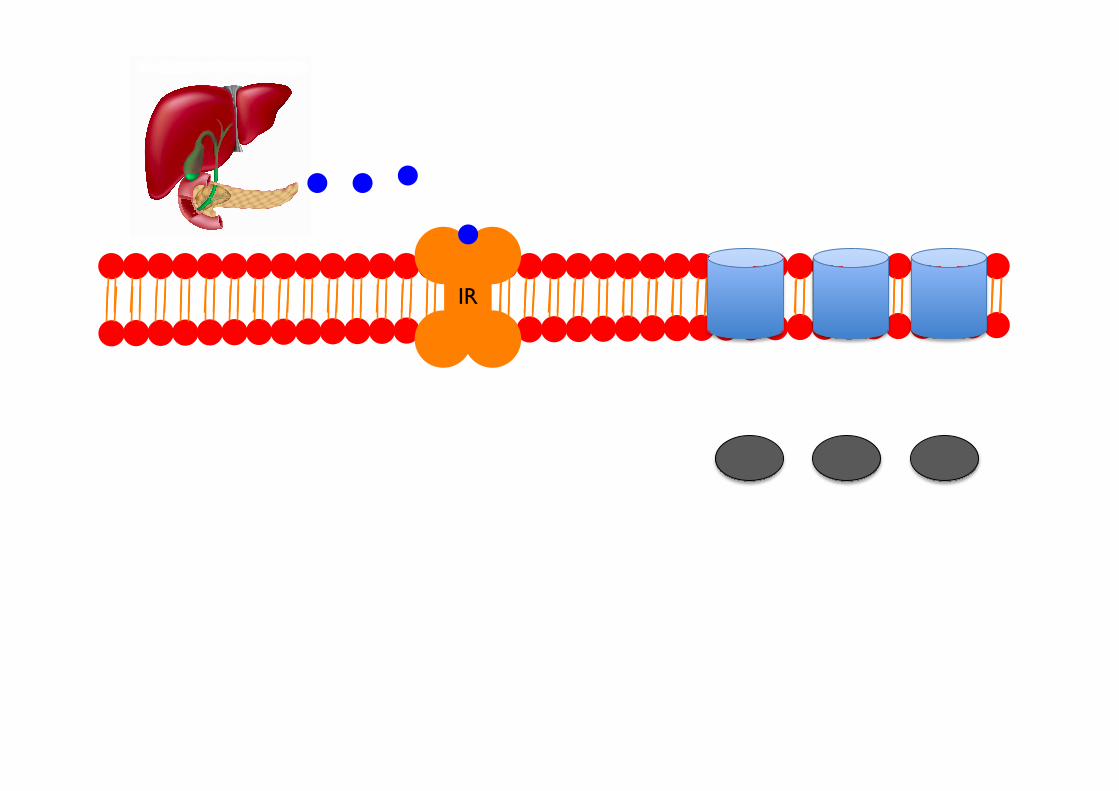
IR
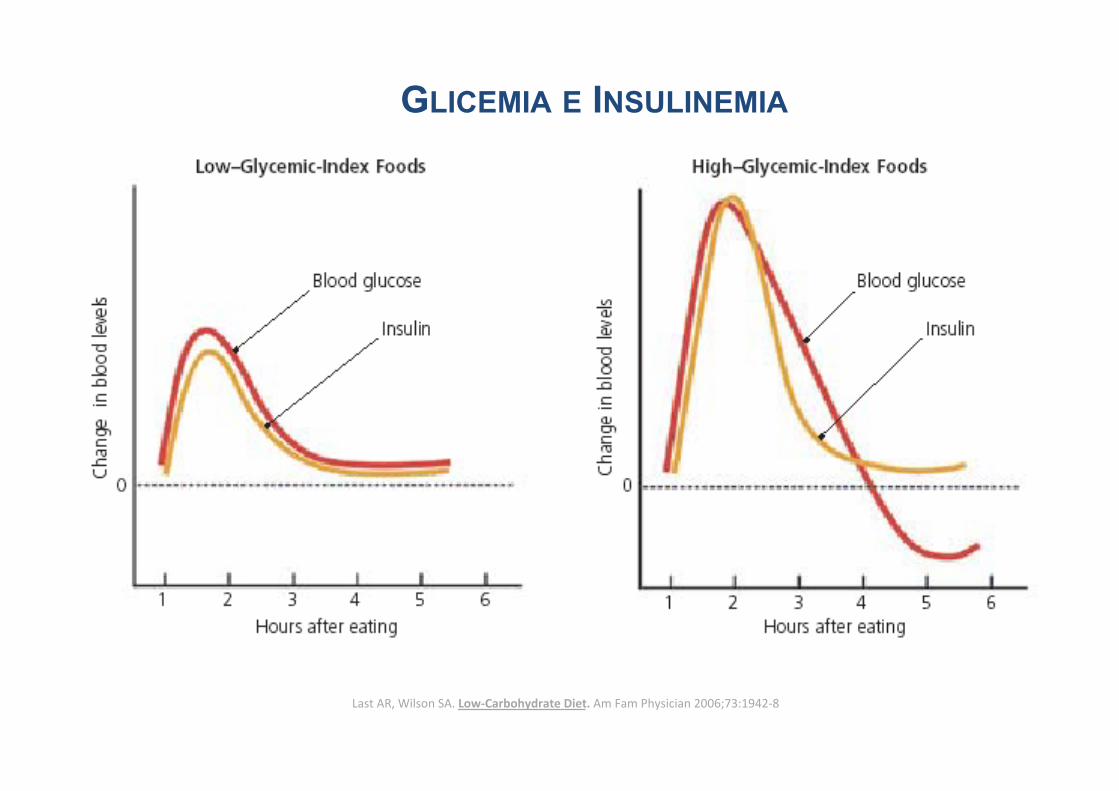
GLICEMIA E INSULINEMIA
Last AR, Wilson SA. Low-‐Carbohydrate Diet. Am Fam Physician 2006;73:1942-‐8
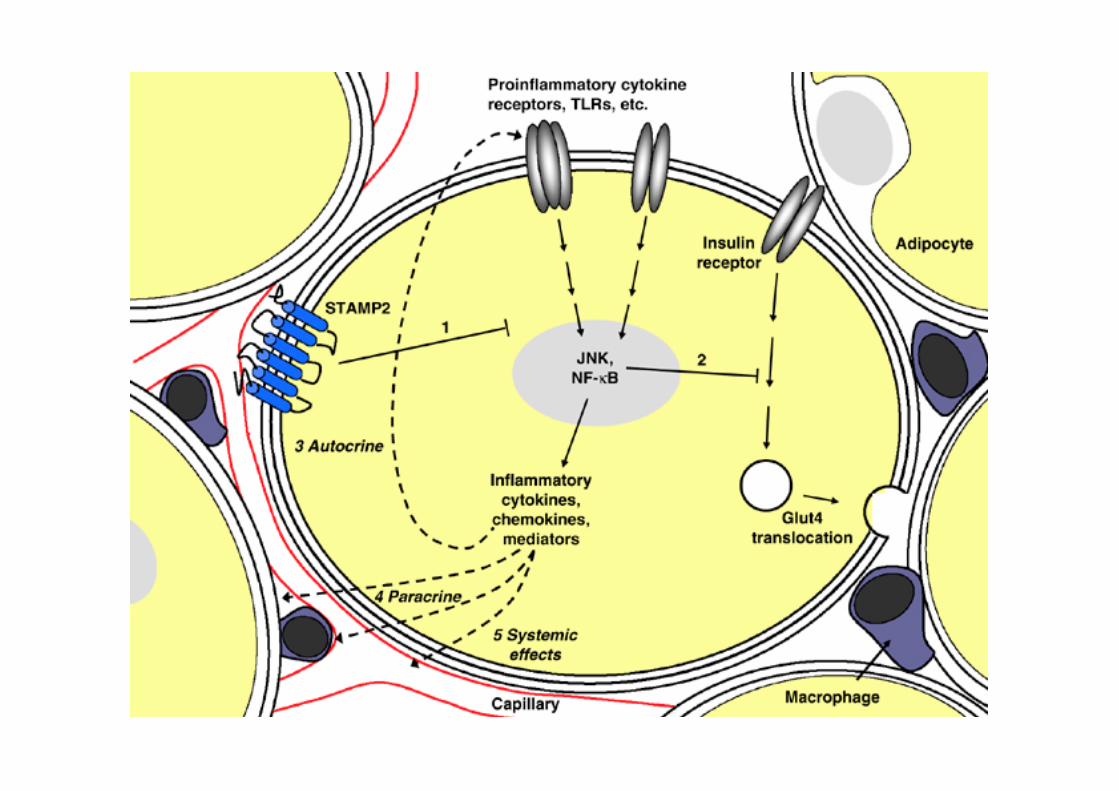
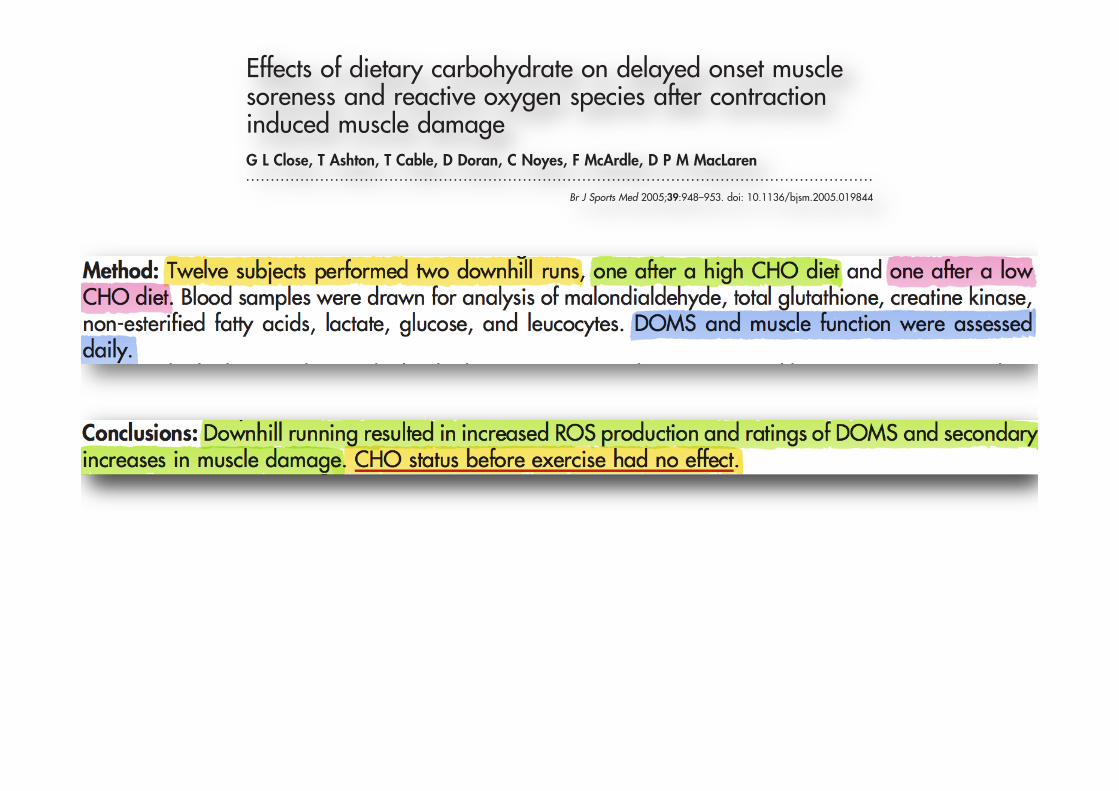
ORIGINAL ARTICLE
Effects of dietary carbohydrate on delayed onset musclesoreness and reactive oxygen species after contractioninduced muscle damageG L Close, T Ashton, T Cable, D Doran, C Noyes, F McArdle, D P M MacLaren. . . . . . . . . . . . . . . . . . . . . . . . . . . . . . . . . . . . . . . . . . . . . . . . . . . . . . . . . . . . . . . . . . . . . . . . . . . . . . . . . . . . . . . . . . . . . . . . . . . . . . . . . . . . . . . . . . . . . . . . . . . . . . .
See end of article forauthors’ affiliations. . . . . . . . . . . . . . . . . . . . . . .
Correspondence to:Dr Close, Clinical Sciences,University of Liverpool,Liverpool L69 3GA, UK;[email protected]
Accepted 17 May 2005. . . . . . . . . . . . . . . . . . . . . . .
Br J Sports Med 2005;39:948–953. doi: 10.1136/bjsm.2005.019844
Background: Delayed onset muscle soreness (DOMS) occurs after unaccustomed exercise and has beensuggested to be attributable to reactive oxygen species (ROS). Previous studies have shown increased ROSafter lengthening contractions, attributable to invading phagocytes. Plasma glucose is a vital fuel forphagocytes, therefore carbohydrate (CHO) status before exercise may influence ROS production andDOMSObjective: To examine the effect of pre-exercise CHO status on DOMS, ROS production, and musclefunction after contraction induced muscle damage.Method: Twelve subjects performed two downhill runs, one after a high CHO diet and one after a lowCHO diet. Blood samples were drawn for analysis of malondialdehyde, total glutathione, creatine kinase,non-esterified fatty acids, lactate, glucose, and leucocytes. DOMS and muscle function were assesseddaily.Results: The high CHO diet resulted in higher respiratory exchange ratio and lactate concentrations thanthe low CHO diet before exercise. The low CHO diet resulted in higher non-esterified fatty acidconcentrations before exercise. DOMS developed after exercise and remained for up to 96 hours, afterboth diets. A biphasic response in creatine kinase occurred after both diets at 24 and 96 hours afterexercise. Malondialdehyde had increased 72 hours after exercise after both diets, and muscle functionwas attenuated up to this time.Conclusions: Downhill running resulted in increased ROS production and ratings of DOMS and secondaryincreases in muscle damage. CHO status before exercise had no effect.
Delayed onset muscle soreness (DOMS) is a symptom ofa type I muscle strain injury that presents as tender oraching muscles, usually felt during palpation or move-
ment and can affect any skeletal muscle.1 It is associated withunaccustomed exercise, particularly if the exercise involveslengthening contractions.2 Although there have been manyproposed mechanisms to account for DOMS, its exactaetiology remains unresolved. The most recent suggestion isthat reactive oxygen species (ROS) may be responsible,although this remains questionable. We have recently shown,using electron spin resonance spectroscopy, that 48–72 hoursafter downhill running there is a significant increase in ROSproduction, which is likely to be from invading phagocytes.3
This finding is similar to those of a previous study whichreported increased ROS using indirect measures 96 hoursafter downhill running.4 The 48–96 hour delay in theproduction of ROS in these studies suggests that the likelysource is invading phagocytes. However, the exact role of thisincreased ROS production in the aetiology of DOMS is notfully established.It is known that plasma glucose is a vital fuel for several
cells of the immune system including phagocytes.5 It hasbeen shown that carbohydrate (CHO) status before exerciseand CHO ingestion during exercise is associated with smallershifts in the number of circulating leucocytes, as well asattenuation of many immune cell functional responses.6–10
Increasing CHO status before exercise through a high CHOdiet is designed to maximise liver and muscle glycogen stores,thereby maintaining blood glucose and ultimately minimis-ing any immunosuppression.5 Conversely, depletion of CHOstores through a low CHO diet should result in decreased liverglycogen and thus reduced availability of blood glucose
during exercise, resulting in a greater stress response and anassociated immunosuppression.The contribution of phagocytes to ROS production after
exercise and the role of ROS in the aetiology of DOMS andloss of muscle function are unclear. Likewise, despite thepopular practice by athletes of altering their CHO statusbefore exercise to maximise performance, the effect of suchdietary manipulations on DOMS, muscle function, and ROSproduction has not been reported. Therefore the main aims ofthis study were to: (1) investigate the effects of alterations inCHO status before exercise on phagocyte derived ROSproduction; (2) clarify the effects of dietary CHO manipula-tion on DOMS and muscle function.
METHODSSubjectsTwelve physically active male subjects of mean (SEM) age23.3 (0.98) years, height 175 (1.56) cm, body mass 76.7(1.73) kg, maximal oxygen uptake (VO2MAX) 4.2 (0.14) litres/min, and body fat 14.6 (1.06)%, who were naıve to downhillrunning, volunteered for the study. All were informedverbally and in writing about the nature of the study,including all potential risks. Written consent was obtainedbefore participation, and ethical approval was granted by theethics committee of Liverpool John Moores University.
Abbreviations: CHO, carbohydrate; CK, creatine kinase; DOMS,delayed onset muscle soreness; MDA, malondialdehyde; NEFA, non-esterified fatty acids; RER, respiratory exchange ratio; ROS, reactiveoxygen species; VO2MAX, maximal oxygen uptake
948
www.bjsportmed.com
group.bmj.com on February 23, 2013 - Published by bjsm.bmj.comDownloaded from
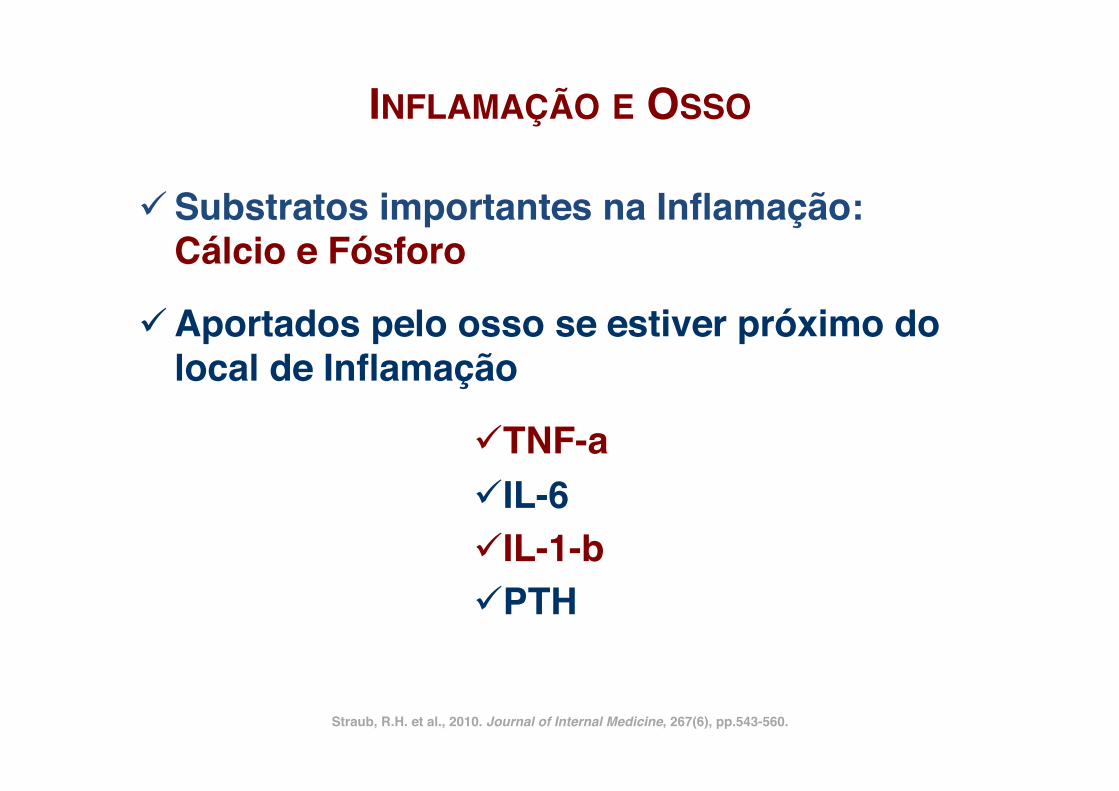
INFLAMAÇÃO E OSSO!
ü Substratos importantes na Inflamação: Cálcio e Fósforo!
ü Aportados pelo osso se estiver próximo do local de Inflamação!
ü TNF-a!ü IL-6!ü IL-1-b!ü PTH!
Straub, R.H. et al., 2010. Journal of Internal Medicine, 267(6), pp.543-560.!
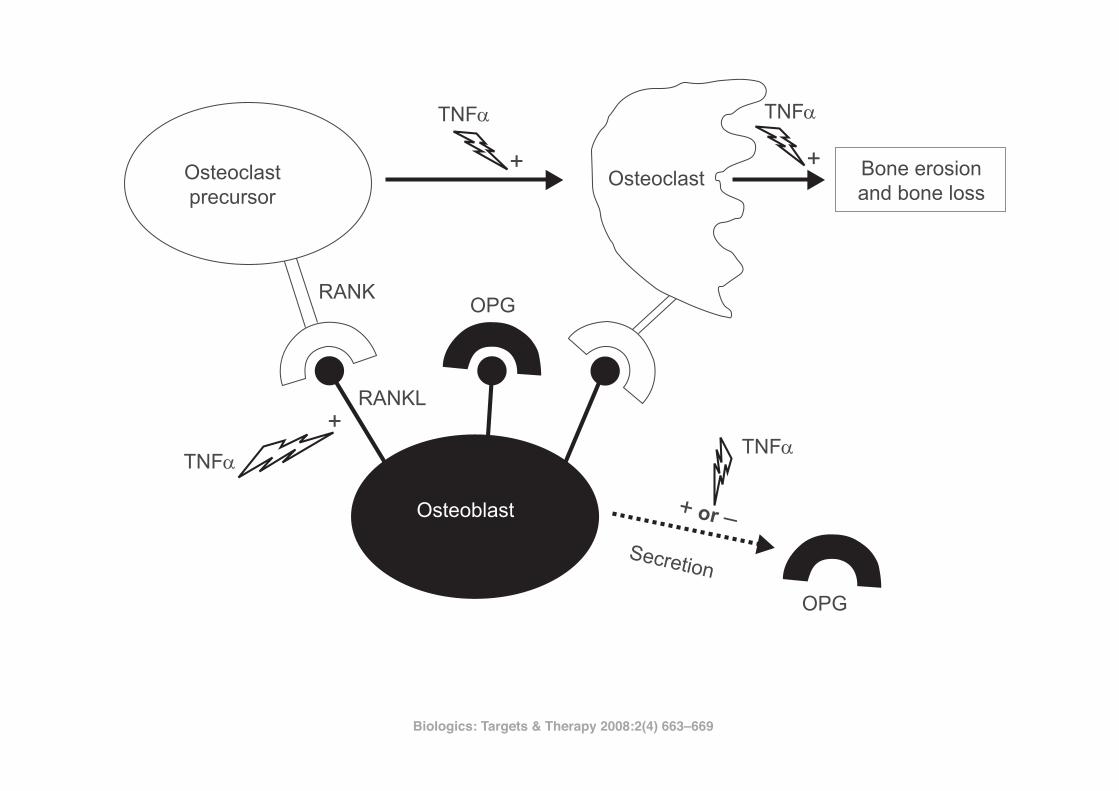
Biologics: Targets & Therapy 2008:2(4)664
Marotte and Miossec
Lipsky et al 2000; Keystone et al 2004; Smolen et al 2005). Furthermore TNF! plays a central role not only in RA, but also in common osteoporosis. In fact, TNF! has been shown to increase bone resorption in systemic osteoporosis related to oestrogen defi ciency (Pacifi ci and Avioli 1993). In addi-tion, transgenic mice expressing soluble TNF! receptor to neutralize TNF!, were protected from oestrogen defi ciency-related bone loss (Ammann et al 1997). Thus, blockade of TNF! not only serves to block infl ammation, but also halts the erosive nature of RA and generalized/localized juxta-articular bone loss. Here, we review recent fi ndings showing that anti-TNF! therapy is also effective on halting systemic bone loss.
In vitro effects of TNF! on osteoblasts and osteoclasts (Figure 1)Over the last two decades, there have been a number of fi nd-ings on the effects of TNF! on osteoblast activity. These include the different down regulatory effects of TNF! on osteoblasts: differentiation, mineralization, and expression of the skeletal bone matrix (Bertolini et al 1986; Nguyen et al 1991; Taichman and Hauschka 1992; Kuroki et al 1994; Nakase et al 1997; Gilbert et al 2000, 2002). Furthermore,
TNF! stimulation also induces apoptosis in osteoblasts (Hill et al 1997; Jilka et al 1998).
Research on the development of bone erosions has rap-idly increased over recent years. First was the detection of osteoclasts at sites of arthritic bone erosion (Ishikawa et al 1984). Second was the discovery of the balance between TNF superfamily molecules: osteoprotegerin (OPG), recep-tor activator of nuclear factor "B ligand (RANKL), receptor activator of nuclear factor "B (RANK), and TNF-related apoptosis inducing ligand (Gravallese et al 2000; Kong et al 1999, 2000; Hofbauer and Heufelder 2001). RANKL is a transmembrane receptor protein and its inhibition by osteoprotogerin (OPG), a decoy receptor, has important implications for infl ammation research as well as for bone physiology (Kong et al 1999; Emery et al 1998).
Osteoblasts express RANKL constitutively on their cell surface. RANKL interacts with its cognate receptor RANK, which is expressed on osteoclast precursors and promotes osteoclast differentiation. Interaction of RANKL with RANK on mature osteoclasts results in their activation and prolonged survival. Importantly, osteoclasts are clearly the principal instruments of this destruction. As shown by studies using osteoclast defi cient animal models of disease, treatment with antiresorptive agents such as OPG, delays bone damage in vivo (Joosten et al 1999; Kong et al 1999;
Osteoclastprecursor
Osteoclast
TNF�
TNF�TNF�
TNF�
Bone erosionand bone loss
RANKOPG
RANKL
Secretion
+ or =
OPG
+
+
+
Osteoblast
Figure 1 Increasing the balance of receptor activator of nuclear factor "B ligand (RANKL)-receptor activator of nuclear factor "B (RANK) induced by tumor necrosis factor
alpha (TNF!).
Abbreviations: OPG, osteoprotegerin; +, stimulation; O, inhibition.
Biologics: Targets & Therapy 2008:2(4) 663–669!

CLINICAL REVIEW
Immune, inflammatory and cardiovascular consequences of sleep restrictionand recovery
Brice Faraut a,b,c, Karim Zouaoui Boudjeltia b, Luc Vanhammed, Myriam Kerkhofs a,b,*
a Sleep Laboratory, CHU de Charleroi, A. Vésale Hospital, Montigny-le-Tilleul, Université Libre de Bruxelles, Belgiumb Laboratory of Experimental Medicine (ULB 222 Unit), CHU de Charleroi, A. Vésale Hospital, Montigny-le-Tilleul, Université Libre de Bruxelles, BelgiumcUniversité Paris Descartes, APHP, Hôtel Dieu, Centre du Sommeil et de la Vigilance, Paris, Franced Laboratory of Molecular Parasitology, Institute for Molecular Biology and Medicine, Université Libre de Bruxelles, Gosselies, Belgium
a r t i c l e i n f o
Article history:Received 2 February 2011Received in revised form4 May 2011Accepted 4 May 2011Available online 10 August 2011
Keywords:Sleep restrictionSleep recoveryImmune cellsInflammatory markerStress systemCardiovascular riskSleep countermeasures
s u m m a r y
In addition to its effects on cognitive function, compelling evidence links sleep loss to alterations in theneuroendocrine, immune and inflammatory systems with potential negative public-health ramifications.The evidence to suggest that shorter sleep is associated with detrimental health outcomes comes fromboth epidemiological and experimental sleep deprivation studies. This review will focus on the post-sleep deprivation and recovery changes in immune and inflammatory functions in well-controlledsleep restriction laboratory studies. The data obtained indicate non-specific activation of leukocytepopulations and a state of low-level systemic inflammation after sleep loss. Furthermore, one night ofrecovery sleep does not allow full recovery of a number of these systemic immune and inflammatorymarkers. We will speculate on the mechanism(s) that link(s) sleep loss to these responses and to theprogression of cardiovascular disease. The immune and inflammatory responses to chronic sleeprestriction suggest that chronic exposure to reduced sleep (<6 h/day) and insufficient time for recoverysleep could have gradual deleterious effects, over years, on cardiovascular pathogenesis with a height-ened risk in women and in night and shift workers. Finally, we will examine countermeasures, e.g.,napping or sleep extension, which could improve the recovery processes, in terms of alertness andimmune and inflammatory parameters, after sleep restriction.
! 2011 Elsevier Ltd. All rights reserved.
Introduction
There is a clear trend emerging of reduced sleep duration atnight leading to a growing sleep debt in the general population inwestern countries. The proportion of adults who sleep less than 6 hper night in the US is now greater than at any other time on recordthis past decade. The 2009 National Sleep Foundation surveyreported that the percentage of the population sleeping less than6 h per night on weekdays has almost doubled over the last tenyears, increasing from 12% in 1998 to 20% in 2009.1
Increasing numbers of people are becoming chronically sleepdeprived because of greaterwork pressure in urban economies, e.g.,extended working hours outside the regular 0800e1700 h workingday, shift work, or increased accessibility to media of all sorts.
What are the consequences of sleep loss and lack of time forrecovery sleep? It was commonly thought that the most importanteffect of night time sleep loss was daytime sleepiness resulting incognitive impairment.2 However, in addition to cognitivedysfunction, compelling evidence links sleep loss to alterations inthe metabolic, endocrine, immune and inflammatory systems withpotential clinical relevance and public-health ramifications.
The evidence to suggest that shorter sleep is associated withdetrimental health outcomes comes from epidemiological studiesand well-controlled sleep deprivation (SD) laboratory studies.Experimental laboratory studies have primarily investigated neu-robehavioral performance, metabolism, neuroendocrine stress,immune and inflammatory systems. The data obtained suggest thatSD triggers impairment and dysregulation of all these physiologicalfunctions.2e6 Some effects are modest and some will argue thatadaptive physiological processes and/or sleep recovery could besufficient to counterbalance these changes. However, chronicexposure to sleep restriction (SR) could have gradual and cumula-tive deleterious health effects over years as indicated by epidemi-ological results.
* Corresponding author. Sleep Laboratory, CHU de Charleroi, A. Vésale Hospital,Université Libre de Bruxelles, Rue de Gozée 706, 6110 Montigny-le-Tilleul, Belgium.Tel.: !32 71 92 1459; fax: !32 71 92 1469.
E-mail address: [email protected] (M. Kerkhofs).
Contents lists available at ScienceDirect
Sleep Medicine Reviews
journal homepage: www.elsevier .com/locate /smrv
1087-0792/$ e see front matter ! 2011 Elsevier Ltd. All rights reserved.doi:10.1016/j.smrv.2011.05.001
Sleep Medicine Reviews 16 (2012) 137e149
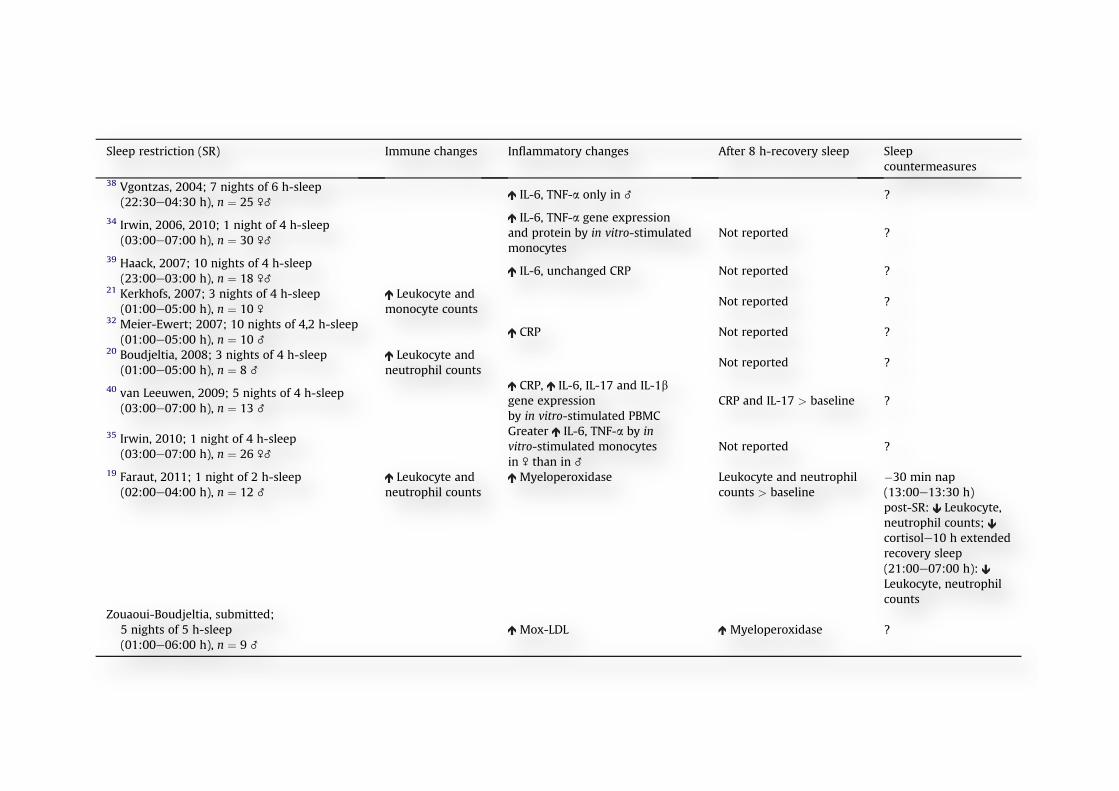
Effects of experimental acute and chronic sleep restriction (seeTable 2)
Sleep curtailment during only part of the night is one of themost common complaints by individuals who experience
psychological or environmental stress and work pressure. In theU.S., 20% of the population sleeps less than 6 h per night onweekdays indicating a situation of chronic partial SR onwork days.1
Moreover, a single night of acute sleep reduction is similar to thesituation of extended work shifts experienced by health workers
Table 2Consequences of sleep restriction on immune and inflammatory changes and effects of recovery and sleep countermeasures. “After 8-h recovery sleep” indicates changes fromsimilar time points measured following the sleep restriction intervention. “Sleep countermeasures” indicates the napping period during the day following the sleep restrictionintervention. Abbreviations: C-reactive protein (CRP), interleukin-1 b (IL-1b); interleukin-6 (IL-6), interleukin-17 (IL-17); myeloperoxidase-modified low-density lipoprotein(Mox-LDL); peripheral blood mononuclear cell (PBMC); tumor necrosis factor-alpha (TNF-a).
Sleep restriction (SR) Immune changes Inflammatory changes After 8 h-recovery sleep Sleepcountermeasures
38 Vgontzas, 2004; 7 nights of 6 h-sleep(22:30e04:30 h), n ! 25 \_
IL-6, TNF-a only in _ ?
34 Irwin, 2006, 2010; 1 night of 4 h-sleep(03:00e07:00 h), n ! 30 \_
IL-6, TNF-a gene expressionand protein by in vitro-stimulatedmonocytes
Not reported ?
39 Haack, 2007; 10 nights of 4 h-sleep(23:00e03:00 h), n ! 18 \_
IL-6, unchanged CRP Not reported ?21 Kerkhofs, 2007; 3 nights of 4 h-sleep
(01:00e05:00 h), n ! 10 \
Leukocyte andmonocyte counts
Not reported ?32 Meier-Ewert; 2007; 10 nights of 4,2 h-sleep
(01:00e05:00 h), n ! 10 _CRP Not reported ?
20 Boudjeltia, 2008; 3 nights of 4 h-sleep(01:00e05:00 h), n ! 8 _
Leukocyte andneutrophil counts
Not reported ?
40 van Leeuwen, 2009; 5 nights of 4 h-sleep(03:00e07:00 h), n ! 13 _
CRP, IL-6, IL-17 and IL-1bgene expressionby in vitro-stimulated PBMC
CRP and IL-17 > baseline ?
35 Irwin, 2010; 1 night of 4 h-sleep(03:00e07:00 h), n ! 26 \_
Greater IL-6, TNF-a by invitro-stimulated monocytesin \ than in _
Not reported ?
19 Faraut, 2011; 1 night of 2 h-sleep(02:00e04:00 h), n ! 12 _
Leukocyte andneutrophil counts
Myeloperoxidase Leukocyte and neutrophilcounts > baseline
"30 min nap(13:00e13:30 h)post-SR: Leukocyte,neutrophil counts;cortisole10 h extendedrecovery sleep(21:00e07:00 h):Leukocyte, neutrophilcounts
Zouaoui-Boudjeltia, submitted;5 nights of 5 h-sleep(01:00e06:00 h), n ! 9 _
Mox-LDL Myeloperoxidase ?
Table 1Consequences of total sleep deprivation on immune and inflammatory changes and effects of recovery and sleep countermeasures. “After 8-h recovery sleep” indicates changesfrom similar time points measured following the total sleep deprivation intervention. “Sleep countermeasures” indicates the napping period after or during the sleepdeprivation interventions. Abbreviations: C-reactive protein (CRP), interleukin-6 (IL-6), interleukin-1 receptor antagonist (IL-1ra), tumor necrosis factor-alpha receptor(TNF-ar).
First author, year of publication,duration of total sleep deprivation (TSD),sample size
Immune changes Inflammatory changes After 8 h-recovery sleep Sleep countermeasures
15 Palmblad, 1976; 77 h TSD,n ! 8 \
Neutrophil phagocytose abilityInterferons by in-vitro-
stimulated lymphocyteNot reported ?
17 Dinges, 1994; 64 h TSD,n ! 10 _
Leukocyte neutrophil, monocytecounts and natural killer activity
Leukocyte, neutrophil andmonocyte counts > baseline
?
13 Born, 1997; 64 h TSD,n ! 20 \_
Lymphocyte and monocytecounts and natural killer cells
Lymphocyte and monocytecounts ! baseline, naturalkiller cells < baseline
?
31 Shearer; 2001; 88 h TSD,n ! 21 _
IL-6, TNF-ar2 # 2 h nap (14:45e16:45 h;02:45e04:45 h) during TSD:IL-6, TNF-ar
30 Frey, 2007; 40 h TSD,n ! 19 \_
IL-6, CRP;IL-1b, IL-1ra
Not reported ?32 Meier-Ewert; 2007; 88 h TSD,
n ! 10 _CRP ?
29 Vgontzas, 2007; 40 h TSD,n ! 41 \_
IL-6 Not reported2 h nap (14:00e16:00 h)post-TSD: IL-6; thencortisol
66 Sauvet; 2010; 40 h TSD,n ! 12 _
IL-6,Norepinephrine
B. Faraut et al. / Sleep Medicine Reviews 16 (2012) 137e149 139
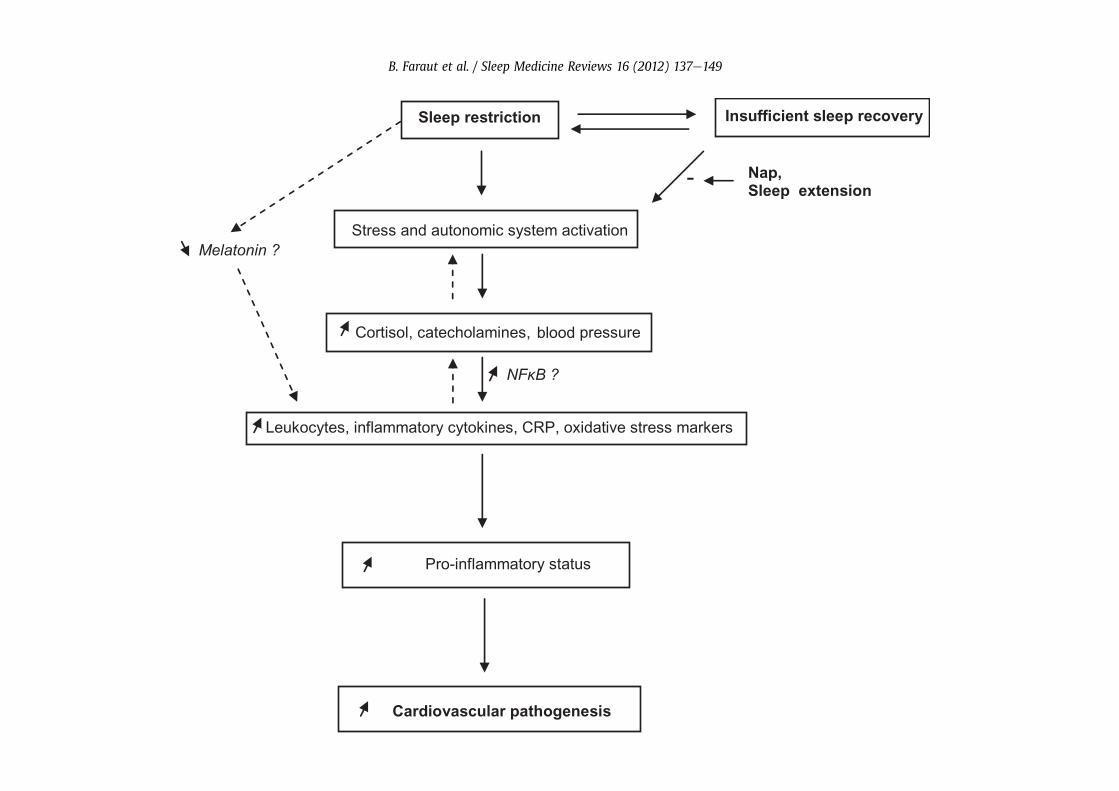
Cortisol and catecholamine action on inflammatory cytokines
Several studies have assessed the effects of cortisol and cate-cholamines on the in vitro production of inflammatory cytokines byhuman monocytes, the main leukocyte subtype that producesinflammatory cytokines. Norepinephrine and epinephrine inhibi-ted, in a concentration-dependent manner, the stimulated IL-6 andTNF-a production by human whole blood and human mono-cytes.53,54 In addition, although in vitro data generally support thehypothesis that cortisol suppresses the production of cytokines,physiological levels of corticosterone (rodent cortisol) have beenshown to cause an increase in TNF and IL-6 in isolated perfused ratlivers.55 In the isolated perfused rat liver, an important source ofcirculating cytokines, norepinephrine also promoted IL-6 secretionfrom the liver.56 Systemic in vivo infusion of epinephrine, at a doseresulting in circulating epinephrine concentrations similar to thoseobserved during stress, increased plasma IL-6 concentrations in therat.57 In human studies, epinephrine administration in healthysubjects reduced the inflammatory cytokine response to endotoxinchallenge as measured by decreased TNF-a, IL-6, IL-8 and IL-1b.58,59,60 Together, the effects of stress hormones on stimulated-cytokine production appear complex and depend on the hormonetested, its concentration and the tissue screened. The involvementof stress hormones in the changes in inflammatory cytokinesobserved after SD needs further investigation.
Nuclear transcription factor-kB and pro-inflammatory geneexpression
The catecholamine, norepinephrine, whose release is enhancedby SD, is an inducer of nuclear factor-kappa B (NF-kB) activity, andboth these actors participate in the loop of inflammation61 that hasbeen shown to be crucial in the regulation of inflammatoryprocesses via direct activation of pro-inflammatory cytokines.62
Under basal conditions, NF-kB is sequestered in the cytoplasm byIkB, an inhibitory molecule that masks the nuclear localizationmotif of the transcription factor. Inflammatory stimulation resultsin the downstream signaling events that lead to the activation ofIkB kinase. Phosphorylation of IkBa releases NF-kB from the cyto-plasm and it is translocated into the nucleus, where it binds totarget promoters. Numerous inflammatory genes contain NF-kB-binding sites and are markedly up-regulated in response to pro-inflammatory signals. Of interest, one night of sleep restricted tothe second part of the night (from 03:00 h to 07:00 h) has beenreported to induce in healthy subjects a rapid increase in activationof the transcription factor NF-kB in PBMC, providing a potentialmolecular mechanism for the effects of sleep loss on pro-inflammatory gene expression.63 Although the small size of thesample tested makes further confirmation necessary, this effectwas mainly observed in women and could contribute to the sexdifferences recently reported in the expression of inflammatory
Fig. 1. Potential pathway(s) by which sleep restriction and insufficient recovery sleep lead to cardiovascular pathologies. Sleep restriction coupled to insufficient recovery sleepenhance the activity of the autonomic and stress systems. Vascular shear stress exacerbated by increased blood pressure leads to inflammation in the vascular wall potentiallyleading to the endothelial production of inflammatory mediators. The stress mediators cortisol/catecholamine can mobilize leukocyte in the blood circulation; among leukocytesubtype neutrophil degranulation can trigger an oxidative burst and the release of oxidative stress markers. Nap and its slow wave sleep (SWS) component can blunt the stressresponse e.g., reduce cortisol release with subsequent decreased leukocyte mobilization. Catecholamine can enhance the expression of nuclear factor-kappa B (NF-kB), an activatorof pro-inflammatory gene expression, e.g., pro-inflammatory cytokines. All these physiopathological altered pathways following SR contribute to a chronic pro-inflammatory statusultimately leading to the development of cardiovascular pathologies. Abbreviations: C-reactive protein (CRP)
B. Faraut et al. / Sleep Medicine Reviews 16 (2012) 137e149142
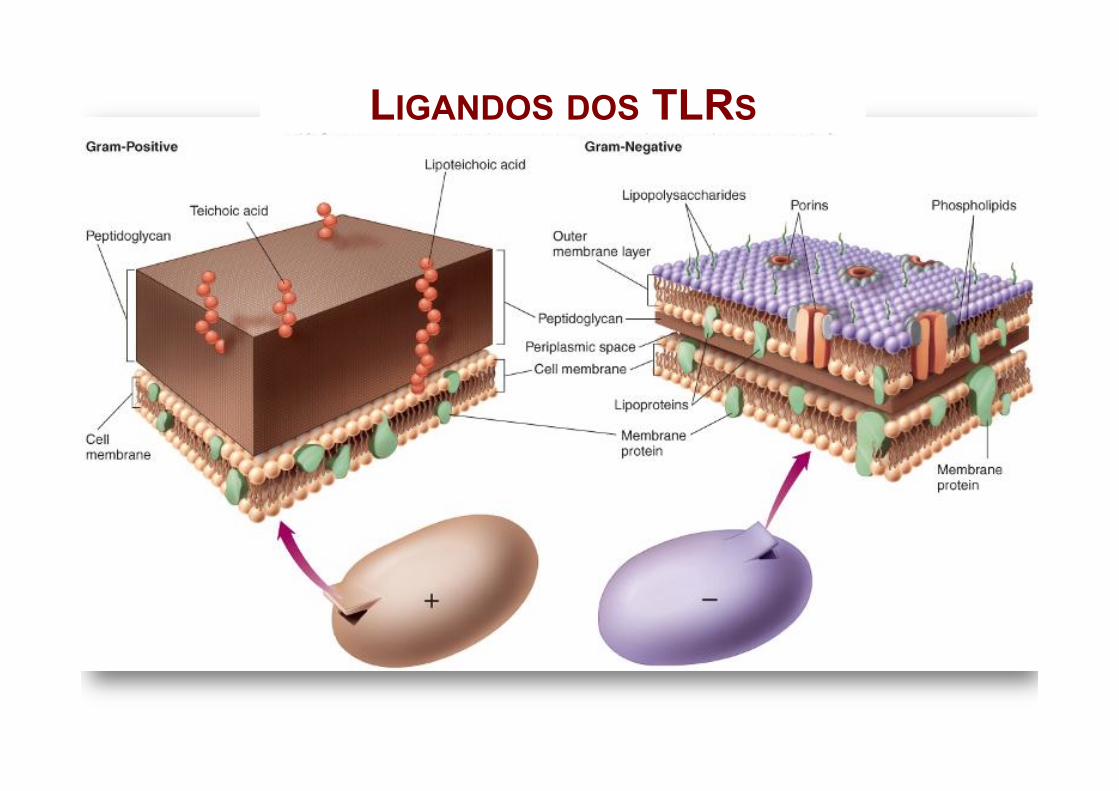
LIGANDOS DOS TLRS
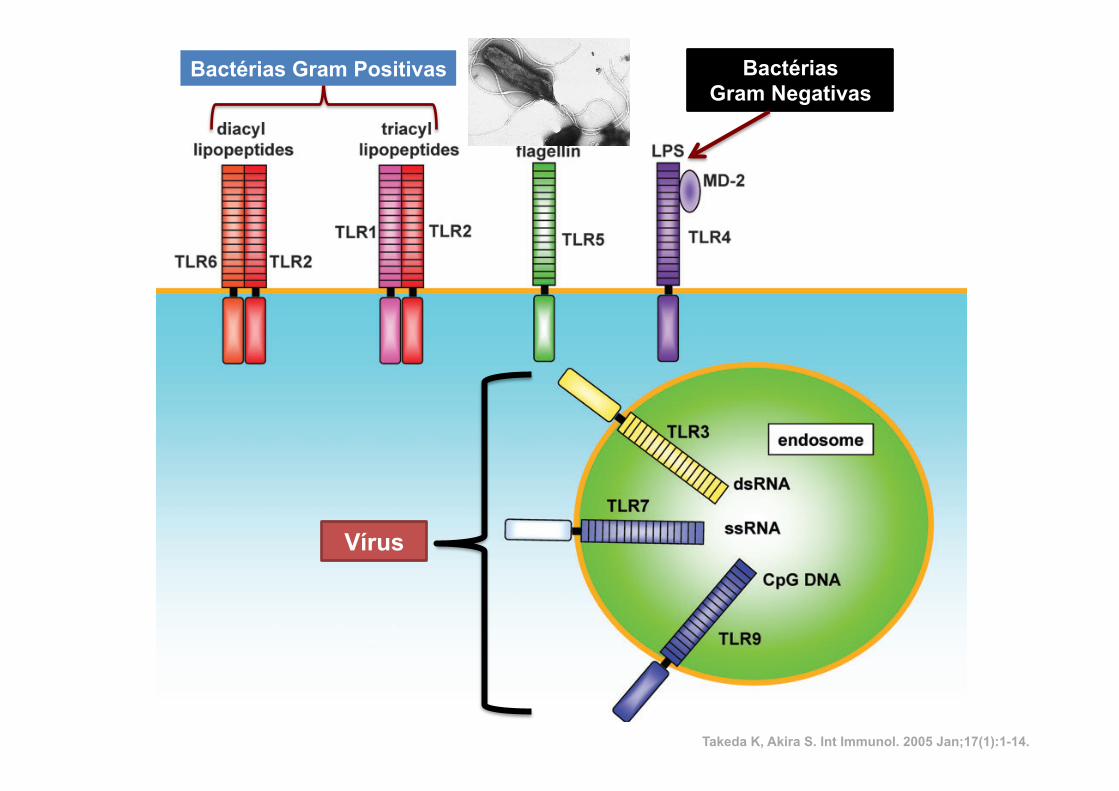
indicating that mouse TLR10 is non-functional (our unpub-lished observation). Similarly, mouse TLR11 is functional, butthere is a stop codon in the human TLR11 gene, which resultsin a lack of production of human TLR11 (5).The cytoplasmic portion of TLRs shows high similarity to that
of the IL-1 receptor family, and is termed a Toll/IL-1 receptor(TIR) domain. Despite this similarity, the extracellular portionsof both types of receptors are structurally unrelated. The IL-1receptors possess an immunoglobulin-like domain, whereasTLRs bear leucine-rich repeats (LRRs) in the extracellulardomain. Functionally, a critical role of TLR4 in the recognitionof the microbial component LPS was initially characterized (3).Subsequently, it has been rapidly established that individualTLRs play important roles in recognizing specificmicrobial com-ponents derived from pathogens including bacteria, fungi,protozoa and viruses (Fig. 1).
TLR1, TLR2 and TLR6
TLR2 recognizes a variety of microbial components. Theseinclude lipoproteins/lipopeptides fromvariouspathogens,pep-tidoglycan and lipoteichoic acid from Gram-positive bacteria,lipoarabinomannan from mycobacteria, glycosylphosphatidy-linositol anchors from Trypanosoma cruzi, a phenol-solublemodulin from Staphylococcus epidermis, zymosan from fungiand glycolipids from Treponema maltophilum (6). In addition,TLR2 reportedly recognizes LPSpreparations from non-entero-bacteria such as Leptospira interrogans, Porphyromonasgingivalis andHelicobacter pyroli (7–9). These LPS structurallydiffer from the typical LPS of Gram-negative bacteria recog-nized by TLR4 in the number of acyl chains in the lipid A
component, which presumably confers differential recognition(10). However, a recent report indicates that LPS preparationfrom P. gingivalis contaminates lipoproteins that activate TLR2,and LPS from P. gingivalis only poorly activates TLR4 (11).Therefore, more careful analysis will be required to concludethat some LPS are recognized by TLR2, but not TLR4.There are two aspects proposed for mechanisms that could
explain why TLR2 recognizes a wide spectrum of microbialcomponents. The first explanation is that TLR2 forms hetero-philic dimers with other TLRs such as TLR1 and TLR6, bothof which are structurally related to TLR2. Macrophages fromTLR6-deficient mice did not show any production of in-flammatory cytokines in response to mycoplasma-deriveddiacyl lipopeptides. However, these cells showed normalproduction of inflammatory cytokines in response to triacyllipopeptides derived fromGram-negative bacteria (12). In con-trast, macrophages from TLR1-deficient mice showed a nor-mal response to mycoplasma-derived diacyl lipopeptides,but an impaired response to triacyl lipopeptides (13). Thus,TLR1 and TLR6 functionally associate with TLR2 anddiscriminate between diacyl or triacyl lipopeptides. Moreover,the involvement of TLR1 in the recognition of the outer surfacelipoprotein of Borrelia burgdorferi has also been shown (14).The second explanation involves recognition of fungal-derivedcomponents by TLR2 (15). In this model, TLR2 has beenshown to functionally collaborate with distinct types of recep-tors such as dectin-1, a lectin family receptor for the fungalcell wall component b-glucan. Thus, TLR2 recognizes a widerange of microbial products through functional cooperationwith several proteins that are either structurally related orunrelated.
Fig. 1. TLRs and their ligands. TLR2 is essential in the recognition of microbial lipopeptides. TLR1 and TLR6 cooperate with TLR2 to discriminatesubtle differences between triacyl and diacyl lipopeptides, respectively. TLR4 is the receptor for LPS. TLR9 is essential in CpG DNA recognition.TLR3 is implicated in the recognition of viral dsRNA, whereas TLR7 and TLR8 are implicated in viral-derived ssRNA recognition. TLR5 recognizesflagellin. Thus, the TLR family members recognize specific patterns of microbial components.
2 Toll-like receptors
by guest on February 15, 2013http://intim
m.oxfordjournals.org/
Dow
nloaded from
Bactérias Gram Positivas Bactérias Gram Negativas
Vírus
Takeda K, Akira S. Int Immunol. 2005 Jan;17(1):1-14.
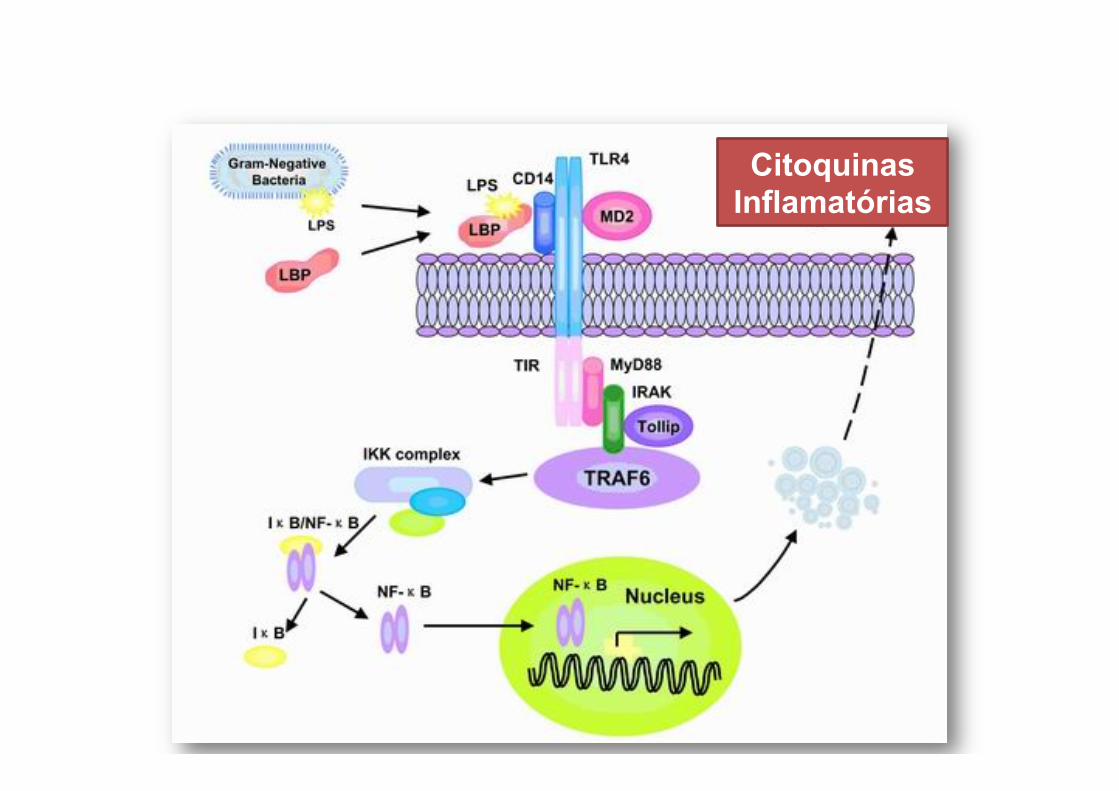
Citoquinas Inflamatórias
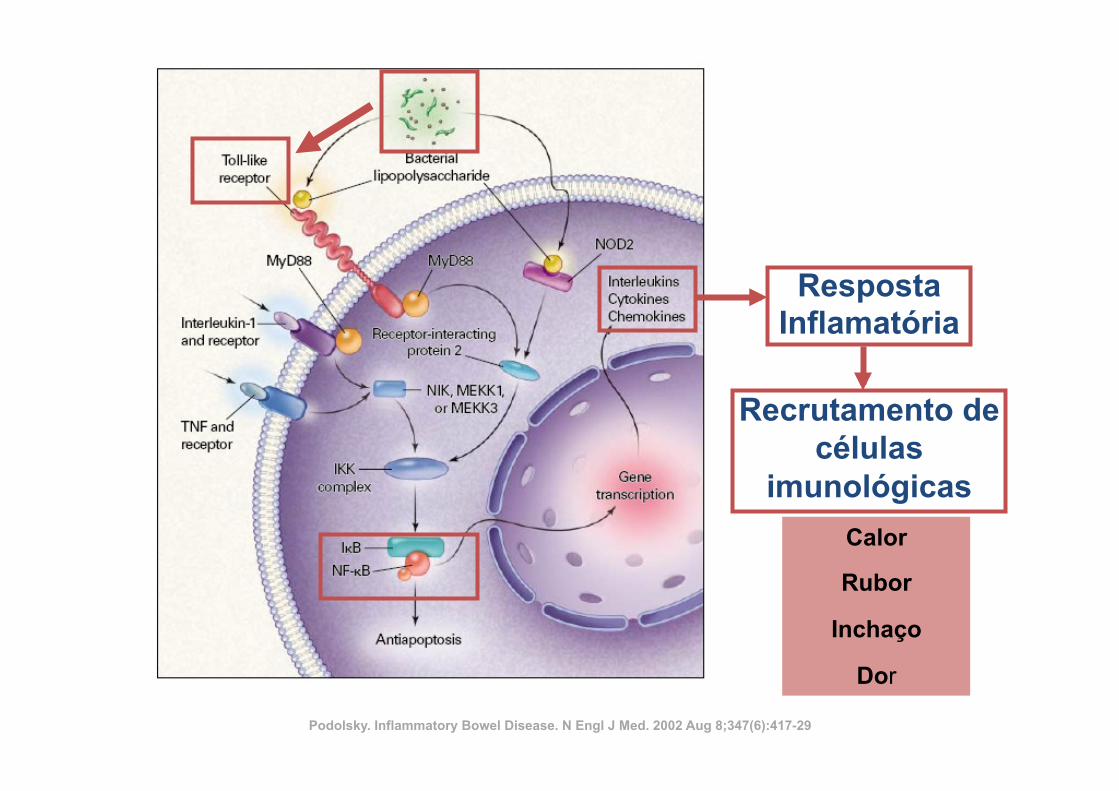
Resposta Inflamatória
Recrutamento de células
imunológicas
“Calor”
“Enrojecimiento”
“Hinchazon”
“dor”
Podolsky. Inflammatory Bowel Disease. N Engl J Med. 2002 Aug 8;347(6):417-29
Calor
Rubor
Inchaço
Dor
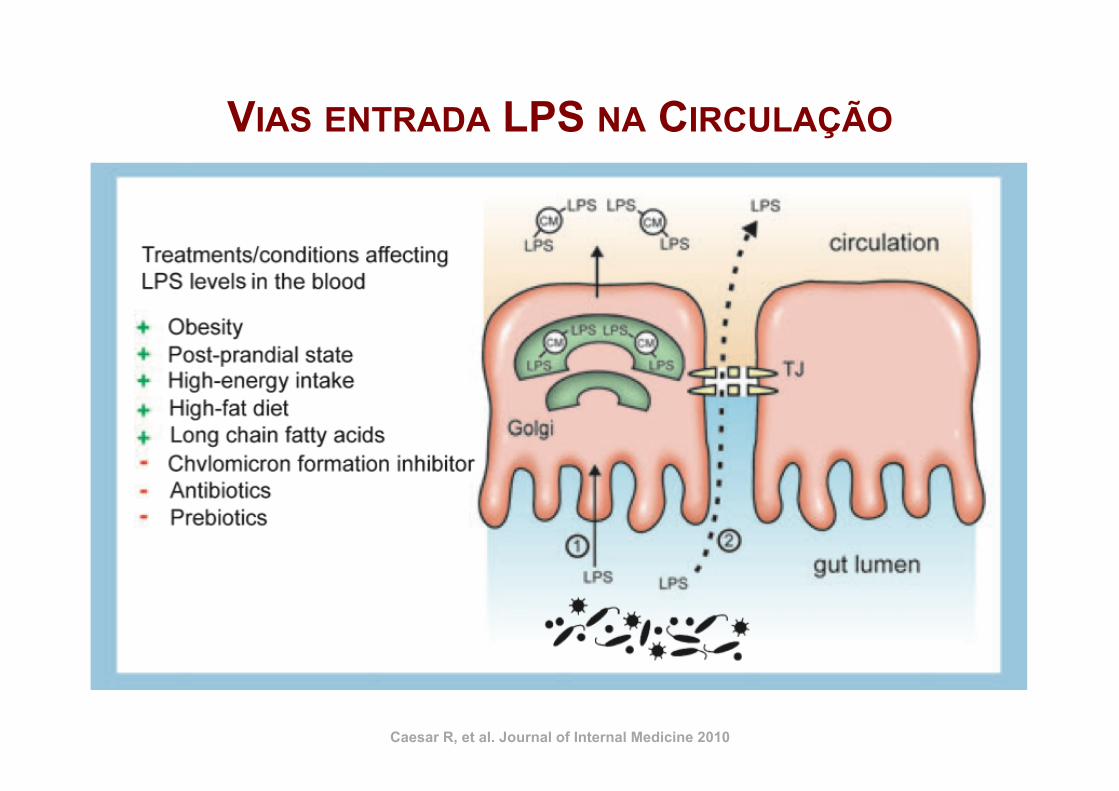
Caesar R, et al. Journal of Internal Medicine 2010
VIAS ENTRADA LPS NA CIRCULAÇÃO
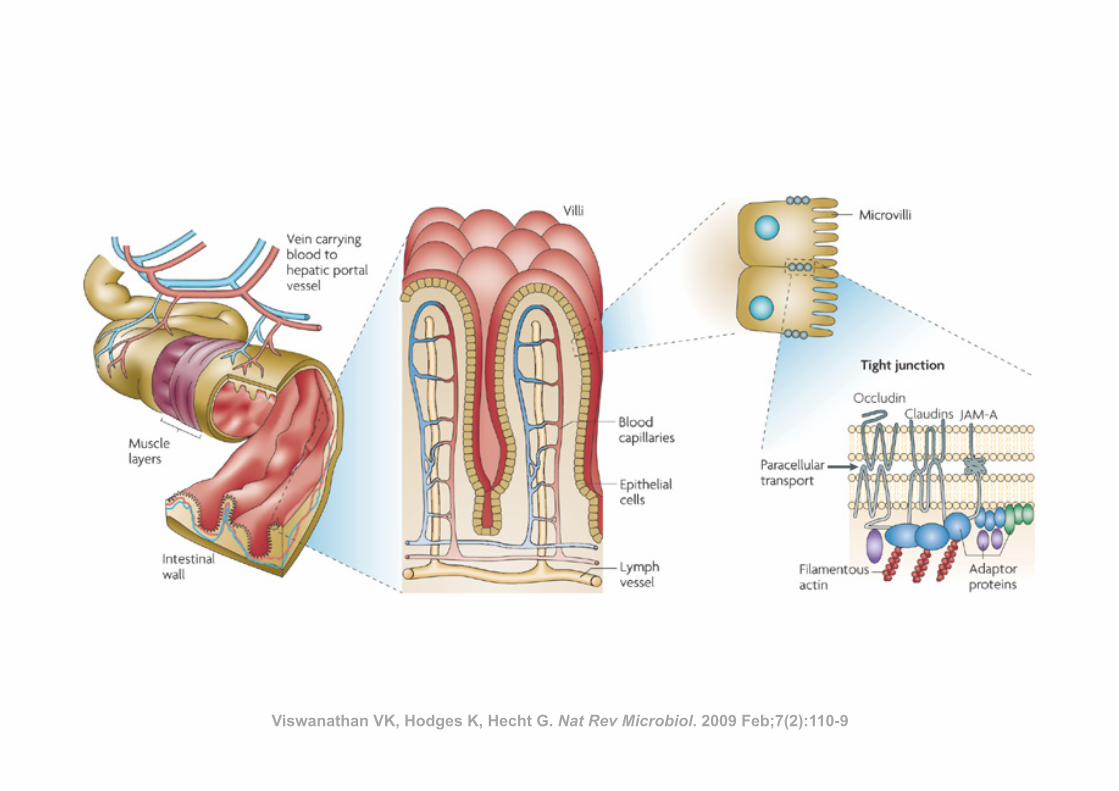
Viswanathan VK, Hodges K, Hecht G. Nat Rev Microbiol. 2009 Feb;7(2):110-9
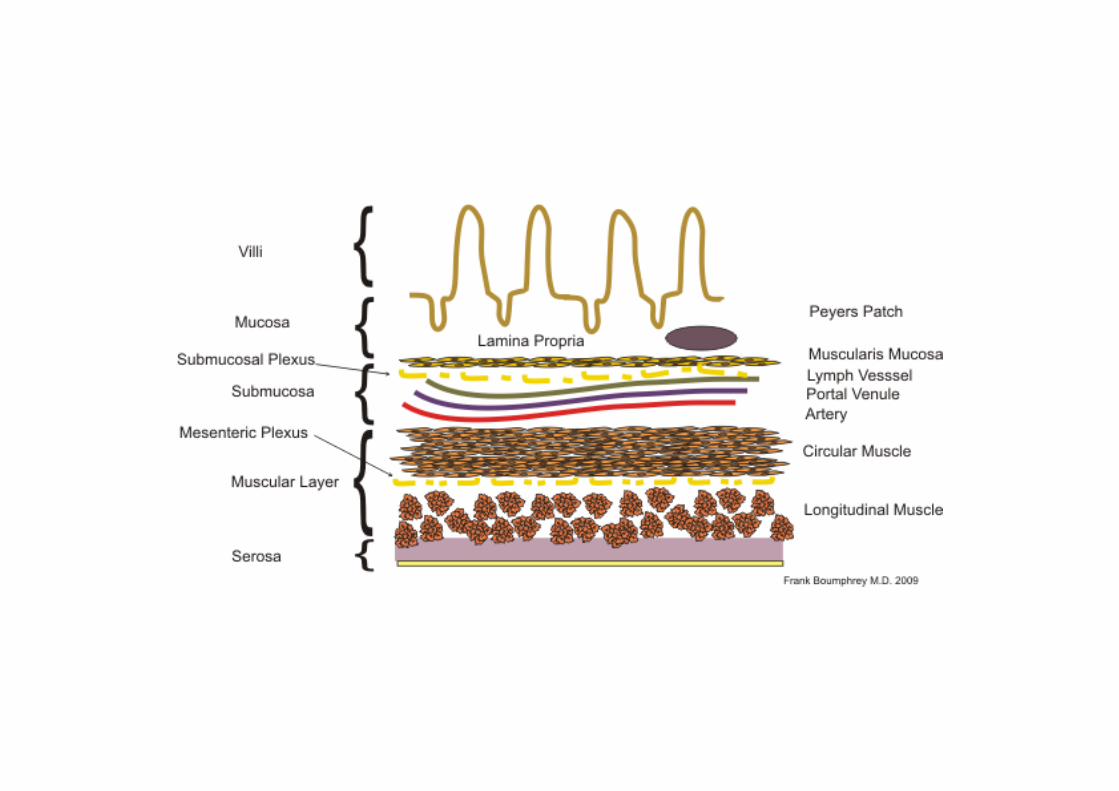
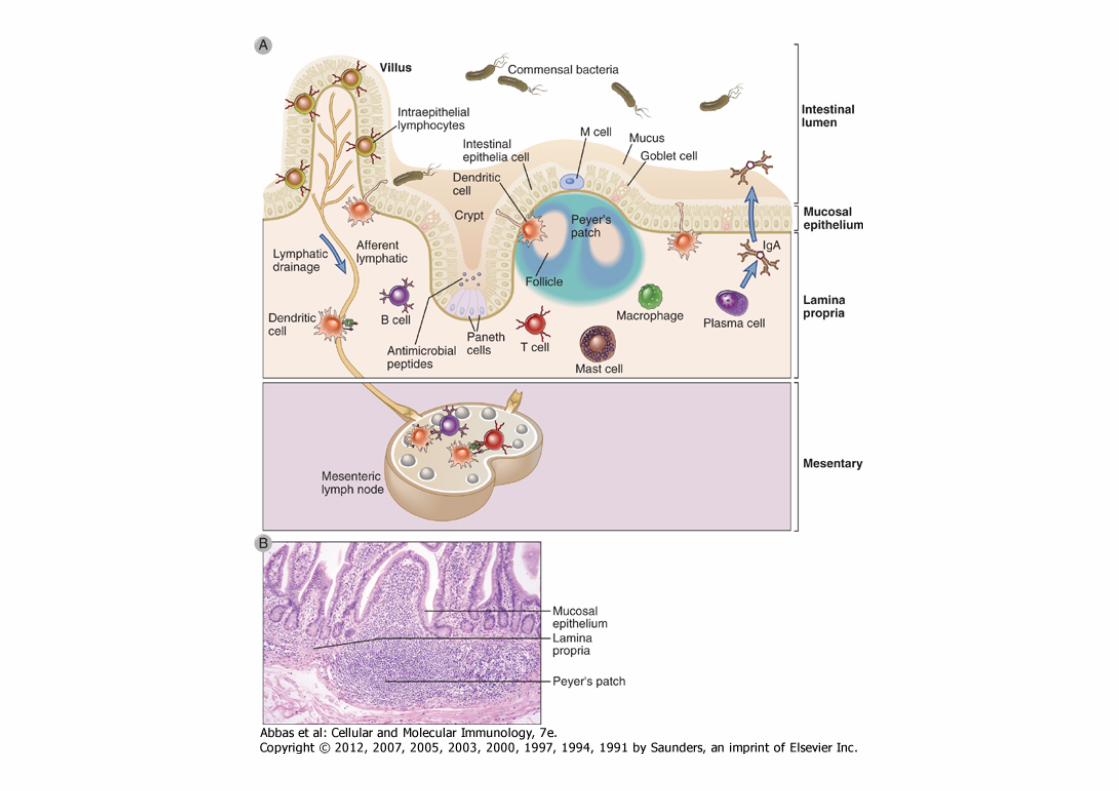
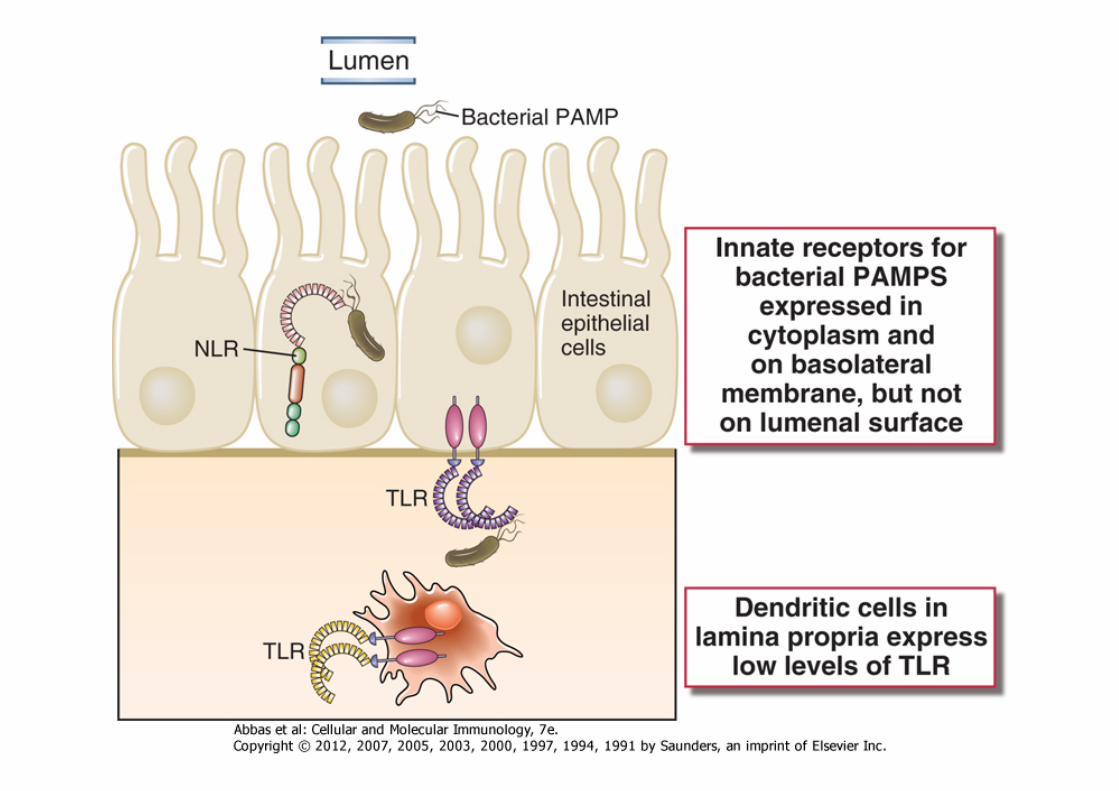

Caesar R, et al. Journal of Internal Medicine 2010
VIAS ENTRADA LPS NA CIRCULAÇÃO
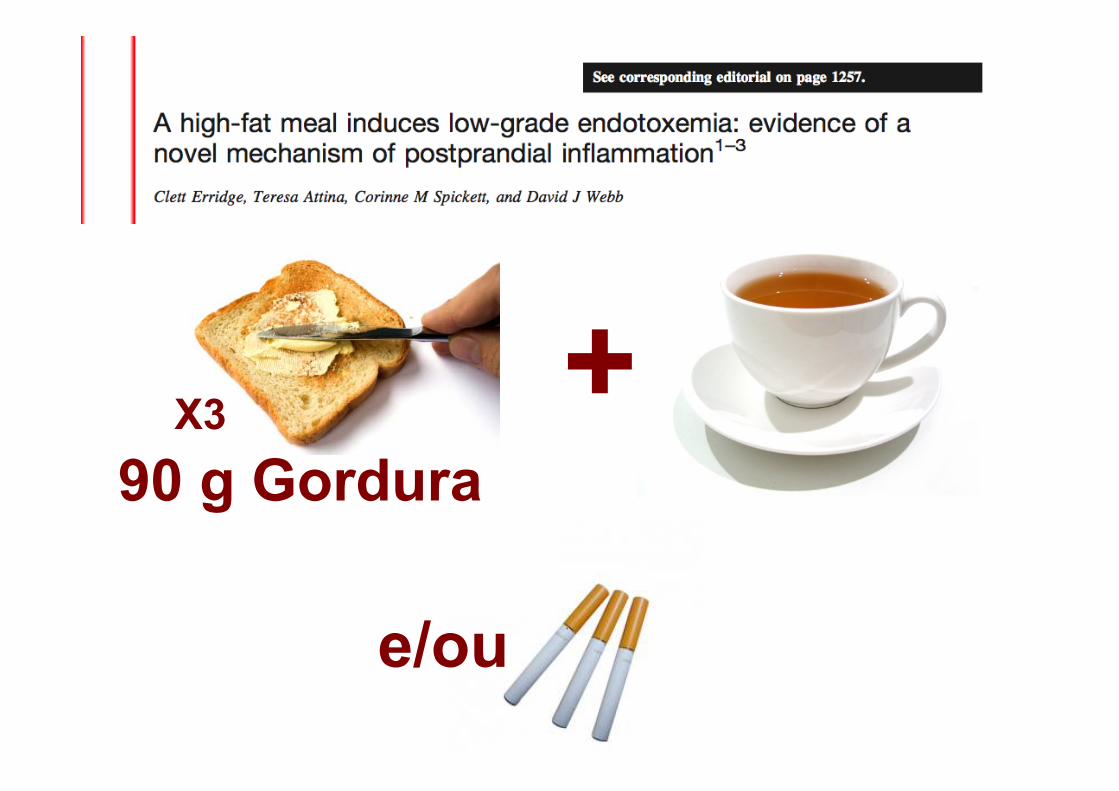
X3 + 90 g Gordura
e/ou
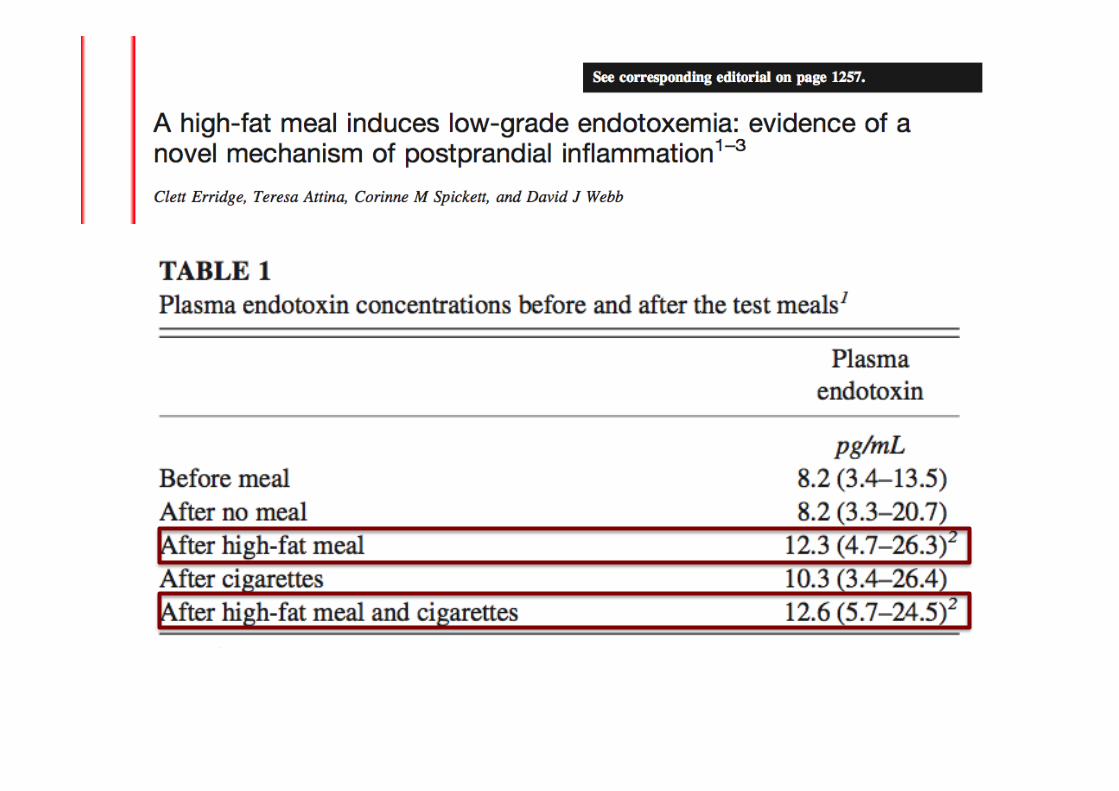
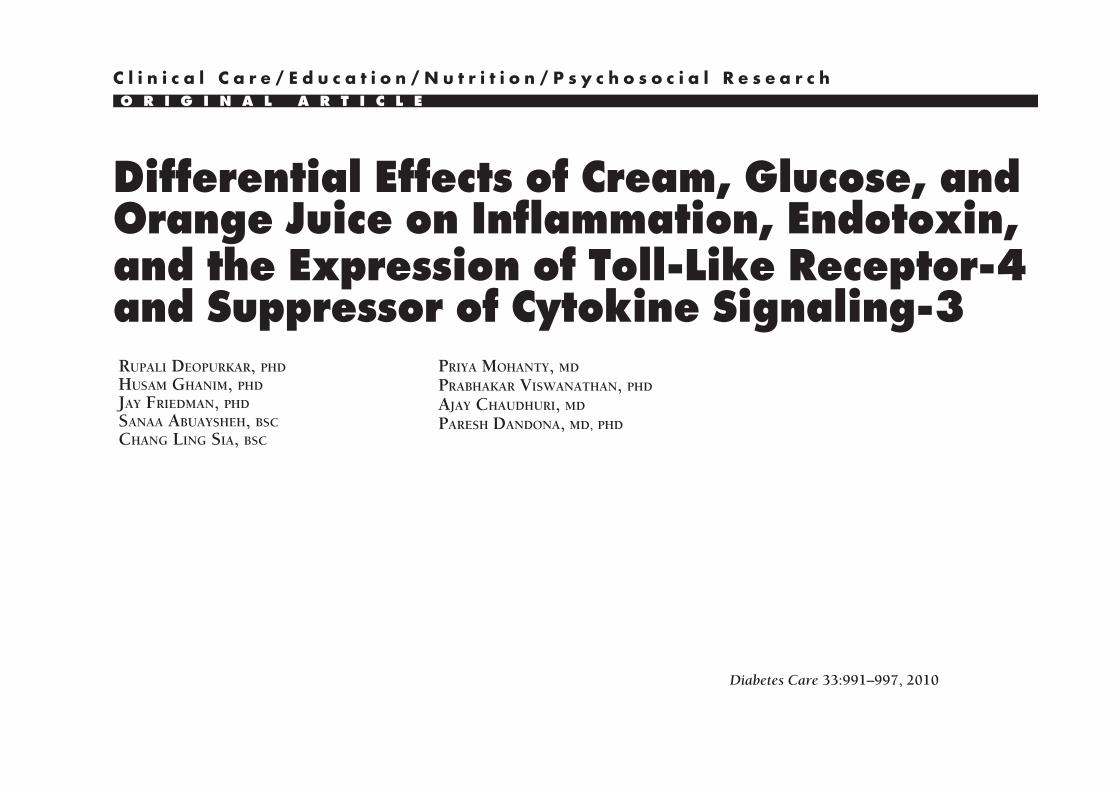
Differential Effects of Cream, Glucose, andOrange Juice on Inflammation, Endotoxin,and the Expression of Toll-Like Receptor-4and Suppressor of Cytokine Signaling-3RUPALI DEOPURKAR, PHD
HUSAM GHANIM, PHD
JAY FRIEDMAN, PHD
SANAA ABUAYSHEH, BSC
CHANG LING SIA, BSC
PRIYA MOHANTY, MD
PRABHAKAR VISWANATHAN, PHD
AJAY CHAUDHURI, MD
PARESH DANDONA, MD, PHD
OBJECTIVE — We have recently shown that a high-fat high-carbohydrate (HFHC) mealinduces an increase in plasma concentrations of endotoxin (lipopolysaccharide [LPS]) and theexpression of Toll-like receptor-4 (TLR-4) and suppresser of cytokine signaling-3 (SOCS3) inmononuclear cells (MNCs) in addition to oxidative stress and cellular inflammation. Saturatedfat and carbohydrates, components of the HFHC meal, known to induce oxidative stress andinflammation, also induce an increase in LPS, TLR-4, and SOCS3.
RESEARCH DESIGN AND METHODS — Fasting normal subjects were given 300-calorie drinks of either glucose, saturated fat as cream, orange juice, or only water to ingest. Bloodsamples were obtained at 0, 1, 3, and 5 h for analysis.
RESULTS — Indexes of inflammation including nuclear factor-!B (NF-!B) binding, and theexpression of SOCS3, tumor necrosis factor-" (TNF-"), and interleukin (IL)-1# in MNCs,increased significantly after glucose and cream intake, but TLR-4 expression and plasma LPSconcentrations increased only after cream intake. The intake of orange juice or water did notinduce any change in any of the indexes measured.
CONCLUSIONS — Although both glucose and cream induce NF-!B binding and an in-crease in the expression of SOCS3, TNF-", and IL-1# in MNCs, only cream caused an increasein LPS concentration and TLR-4 expression. Equicaloric amounts of orange juice or water did notinduce a change in any of these indexes. These changes are relevant to the pathogenesis ofatherosclerosis and insulin resistance.
Diabetes Care 33:991–997, 2010
Our recent work has shown that ahigh-fat high-cholesterol (HFHC)meal induces oxidative and inflam-
matory stress in addition to inducing anincrease in plasma endotoxin (lipopoly-saccharide [LPS]) levels and the expres-sion of Toll-like receptor (TLR)-4, thespecific receptor for LPS (1). In contrast, ahigh-fiber and fruit meal does not induceany of these changes. These data are of
great interest because the content of LPSin these meals is not significantly differ-ent, and, thus, it would appear that theinflammatory nature of the meal may leadto a partial breakdown of the intestinalbarrier that normally protects the bodyfrom invasion of bacteria and the entry ofLPS from the gut. The concept of this im-munological barrier of the gut has devel-oped rapidly over the past few years and is
vital to the protection from bacterial tox-ins and immunological responses to thecommensal and pathogenic intestinalbacteria.
In this context, we wanted to analyzewhich macronutrient was responsible forthe induction of oxidative stress and in-flammation, on the one hand, and the in-crease in LPS concentrations and theexpression of TLR-4 and suppresser of cy-tokine signaling (SOCS)-3 on the other.To elucidate this, we investigated the ef-fect of glucose, the most important carbo-hydrate, cream, a saturated fat, andorange juice, a carbohydrate-containingfood product, which does not induce ei-ther oxidative stress or inflammation.
SOCS3 is a protein that has beenshown to interfere with insulin and leptinsignal transduction (2–5). Our recentwork has shown that SOCS3 expressionin the circulating mononuclear cells(MNCs) of the obese human is markedlyincreased when compared with that innormal subjects (6). In addition, ourwork demonstrated that SOCS3 expres-sion in MNCs is inversely related to thetyrosine phosphorylation of the insulinreceptor and directly related to BMI andinsulin resistance (homeostasis model as-sessment of insulin resistance [HOMA-IR]), consistent with its role in thepathogenesis of insulin resistance. Leptinresistance in human obesity leads to theinability of leptin to cause satiety andweight loss, whereas insulin resistancemakes the obese vulnerable to diabetes.Human obesity is also a state of chronicinflammation characterized by an in-crease in inflammatory mediators inplasma, in adipose tissue, and in circulat-ing mononuclear cells (7,8). BecauseSOCS3 is induced in animal models byproinflammatory stimuli like the cyto-kines, TNF-", IL-6, and IL-1# (3,4,9) andbecause macronutrient intake causes oxi-dative stress (10,11) and inflammation(12,13), it is possible that the intake ofglucose and saturated fat (cream) inducesan increase in the expression of SOCS3 asa part of macronutrient-induced inflam-
! ! ! ! ! ! ! ! ! ! ! ! ! ! ! ! ! ! ! ! ! ! ! ! ! ! ! ! ! ! ! ! ! ! ! ! ! ! ! ! ! ! ! ! ! ! ! ! !
From the Division of Endocrinology, Diabetes, and Metabolism, State University of New York at Buffalo andKaleida Health, Buffalo, New York.
Corresponding author: Paresh Dandona, [email protected] 2 September 2009 and accepted 5 January 2010. Published ahead of print at http://care.
diabetesjournals.org on 12 January 2010. DOI: 10.2337/dc09-1630.R.D., H.G., and J.F. contributed equally to this study.© 2010 by the American Diabetes Association. Readers may use this article as long as the work is properly
cited, the use is educational and not for profit, and the work is not altered. See http://creativecommons.org/licenses/by-nc-nd/3.0/ for details.
The costs of publication of this article were defrayed in part by the payment of page charges. This article must therefore be herebymarked “advertisement” in accordance with 18 U.S.C. Section 1734 solely to indicate this fact.
C l i n i c a l C a r e / E d u c a t i o n / N u t r i t i o n / P s y c h o s o c i a l R e s e a r c hO R I G I N A L A R T I C L E
care.diabetesjournals.org DIABETES CARE, VOLUME 33, NUMBER 5, MAY 2010 991
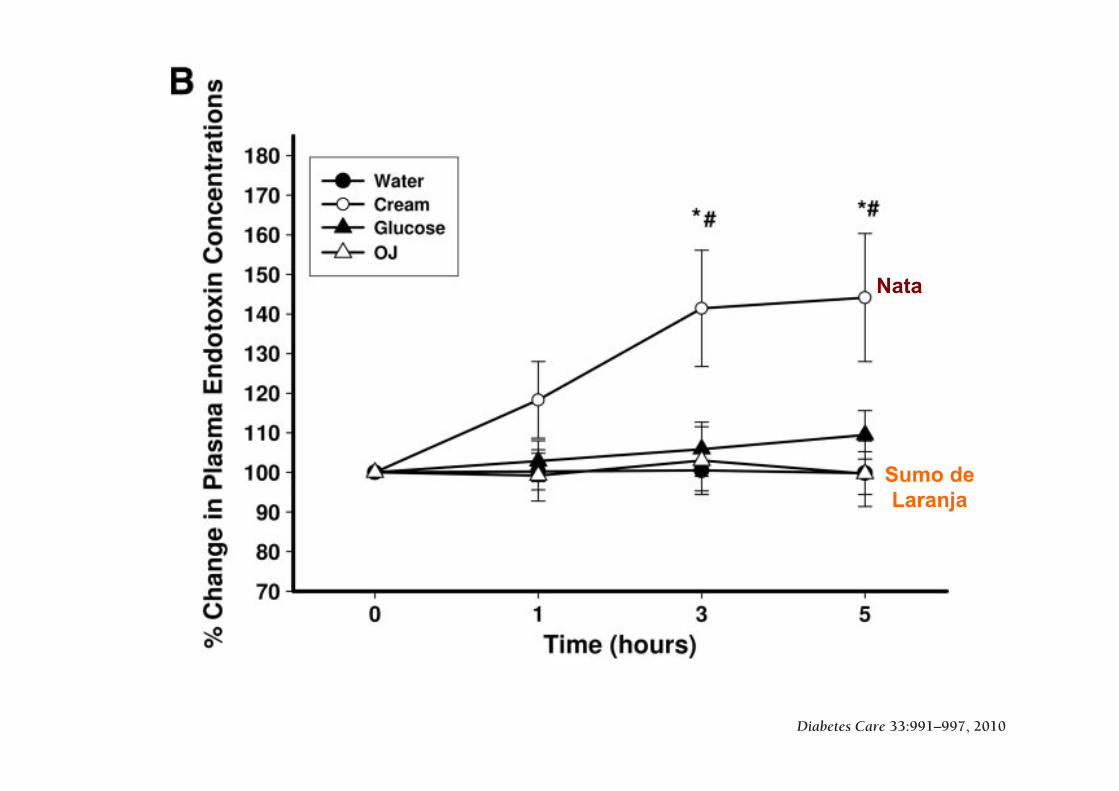
flected in these indexes and the overallmagnitude of the inflammatory process.Previously, Dasu et al. (25) reported thathigh glucose concentrations upregulatedTLR-4 expression and its downstream sig-naling in a monocytic cell line. However,the excursions of glucose concentrationsin normal and even obese subjects do notachieve those concentrations postprandi-ally. Thus, the observations of Dasu et al.are relevant to diabetic individuals. Ourinvestigation deals with postprandialchanges in normal subjects. As far as theeffects of cream intake are concerned, theamount taken is modest, and the increase
in triglycerides is consistent with that inprevious studies. It should, therefore, benoted that although the amounts of creamand glucose taken induced similar in-creases in reactive oxygen species genera-tion and NF-!B binding, glucose was notable to induce an increase in the expres-sion of TLR-4.
In summary, the intake of a modestamount of glucose or cream results in asignificant induction of SOCS3 mRNAand protein in parallel with the inductionof an inflammatory response character-ized by an increase in NF-!B binding inMNCs and the induction of two of the
cytokines, TNF-" and IL-1#, which areknown to induce SOCS3 in experimentalanimals. In addition, the intake of creambut not of glucose also induces an in-crease in the expression of TLR-4 mRNAand protein while also inducing an in-crease in plasma LPS concentrations. BothSOCS3 and TLR-4 are putative mediatorsof insulin resistance. In contrast, orangejuice intake does not induce oxidativestress, inflammation, SOCS3, TLR-4, oran increase in plasma LPS concentrations.
Acknowledgments— The study was sup-ported in part by a grant from the State ofFlorida, Department of Citrus. P.D. was alsosupported by the National Institutes of Health(R01-DK-069805 and R01-DK-075877) andthe American Diabetes Association (708CR13).The data were obtained from our laboratoryand were under our control, and the inter-pretations and conclusions are those of theinvestigators. Furthermore, the Principal In-vestigator (P.D.) takes the full responsibilityfor them.
No potential conflicts of interest relevant tothis article were reported.
References1. Ghanim H, Abuaysheh S, Sia CL, Korze-
niewski K, Chaudhuri A, Fernandez-RealJM, Dandona P. Increase in plasma endo-toxin concentrations and the expressionof Toll-like receptors and suppressor ofcytokine signaling-3 in mononuclear cellsfollowing a high-fat high-carbohydratemeal: implications for insulin resistance.Diabetes Care 2009;32:2281–2287
2. Rui L, Yuan M, Frantz D, Shoelson S,White MF. SOCS-1 and SOCS-3 block in-sulin signaling by ubiquitin-mediateddegradation of IRS1 and IRS2. J BiolChem 2002;277:42394–42398
3. Senn JJ, Klover PJ, Nowak IA, ZimmersTA, Koniaris LG, Furlanetto RW, MooneyRA. Suppressor of cytokine signaling-3(SOCS-3), a potential mediator of inter-leukin-6-dependent insulin resistance inhepatocytes. J Biol Chem 2003;278:13740–13746
4. Emanuelli B, Peraldi P, Filloux C, ChaveyC, Freidinger K, Hilton DJ, HotamisligilGS, Van Obberghen E. SOCS-3 inhibitsinsulin signaling and is up-regulated inresponse to tumor necrosis factor-alpha inthe adipose tissue of obese mice. J BiolChem 2001;276:47944–47949
5. Bjørbaek C, El-Haschimi K, Frantz JD,Flier JS. The role of SOCS-3 in leptin sig-naling and leptin resistance. J Biol Chem1999;274:30059–30065
6. Ghanim H, Aljada A, Daoud N, DeopurkarR, Chaudhuri A, Dandona P. Role of inflam-matory mediators in the suppression ofinsulin receptor phosphorylation in circu-
Figure 3—Change in NF!B binding activity in MNC (A) and plasma endotoxin concentrations(B) in normal subjects after a 300-calorie drink of cream (E), glucose (Œ), orange juice (OJ, ‚),or water (F). Data are means $ SEM. * and !, P % 0.05 with RMANOVA comparing changes inrelation to baseline after cream and glucose challenges; # and $, P % 0.05 with two-wayRMANOVA for comparisons of cream and glucose changes, respectively, to water (n & 12).
Macronutrients, oxidative stress, and inflammation
996 DIABETES CARE, VOLUME 33, NUMBER 5, MAY 2010 care.diabetesjournals.org
Sumo de Laranja
Nata
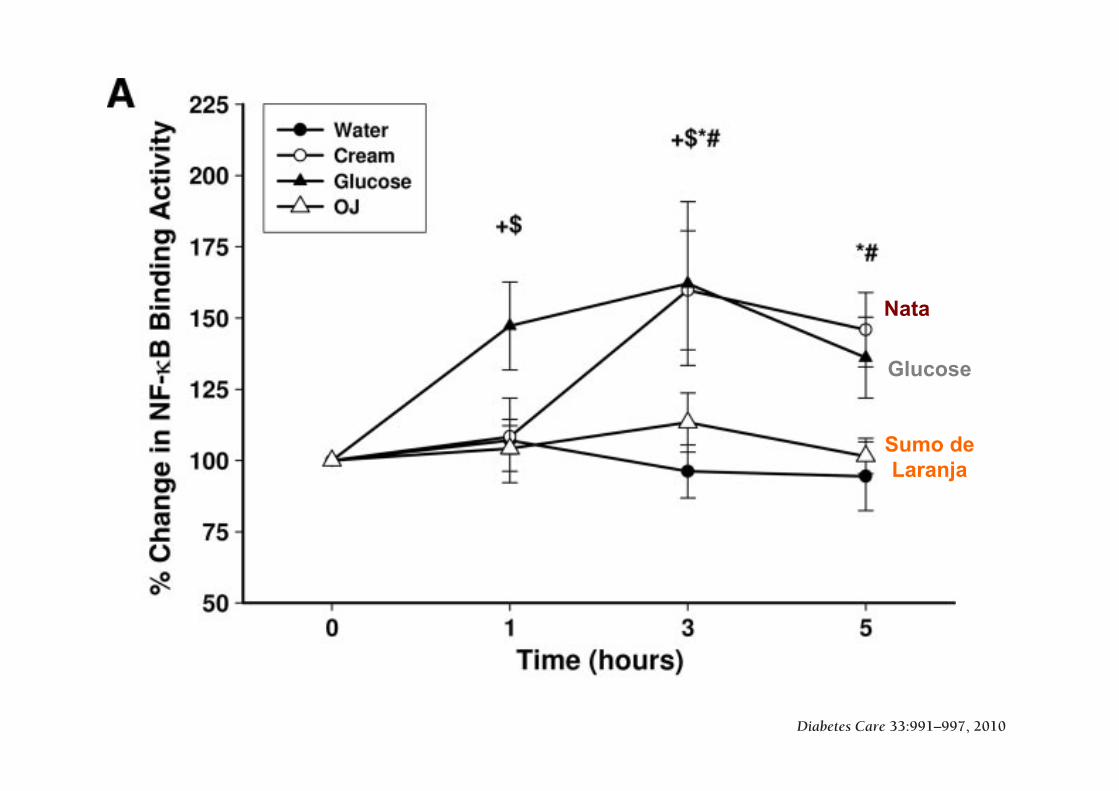
Differential Effects of Cream, Glucose, andOrange Juice on Inflammation, Endotoxin,and the Expression of Toll-Like Receptor-4and Suppressor of Cytokine Signaling-3RUPALI DEOPURKAR, PHD
HUSAM GHANIM, PHD
JAY FRIEDMAN, PHD
SANAA ABUAYSHEH, BSC
CHANG LING SIA, BSC
PRIYA MOHANTY, MD
PRABHAKAR VISWANATHAN, PHD
AJAY CHAUDHURI, MD
PARESH DANDONA, MD, PHD
OBJECTIVE — We have recently shown that a high-fat high-carbohydrate (HFHC) mealinduces an increase in plasma concentrations of endotoxin (lipopolysaccharide [LPS]) and theexpression of Toll-like receptor-4 (TLR-4) and suppresser of cytokine signaling-3 (SOCS3) inmononuclear cells (MNCs) in addition to oxidative stress and cellular inflammation. Saturatedfat and carbohydrates, components of the HFHC meal, known to induce oxidative stress andinflammation, also induce an increase in LPS, TLR-4, and SOCS3.
RESEARCH DESIGN AND METHODS — Fasting normal subjects were given 300-calorie drinks of either glucose, saturated fat as cream, orange juice, or only water to ingest. Bloodsamples were obtained at 0, 1, 3, and 5 h for analysis.
RESULTS — Indexes of inflammation including nuclear factor-!B (NF-!B) binding, and theexpression of SOCS3, tumor necrosis factor-" (TNF-"), and interleukin (IL)-1# in MNCs,increased significantly after glucose and cream intake, but TLR-4 expression and plasma LPSconcentrations increased only after cream intake. The intake of orange juice or water did notinduce any change in any of the indexes measured.
CONCLUSIONS — Although both glucose and cream induce NF-!B binding and an in-crease in the expression of SOCS3, TNF-", and IL-1# in MNCs, only cream caused an increasein LPS concentration and TLR-4 expression. Equicaloric amounts of orange juice or water did notinduce a change in any of these indexes. These changes are relevant to the pathogenesis ofatherosclerosis and insulin resistance.
Diabetes Care 33:991–997, 2010
Our recent work has shown that ahigh-fat high-cholesterol (HFHC)meal induces oxidative and inflam-
matory stress in addition to inducing anincrease in plasma endotoxin (lipopoly-saccharide [LPS]) levels and the expres-sion of Toll-like receptor (TLR)-4, thespecific receptor for LPS (1). In contrast, ahigh-fiber and fruit meal does not induceany of these changes. These data are of
great interest because the content of LPSin these meals is not significantly differ-ent, and, thus, it would appear that theinflammatory nature of the meal may leadto a partial breakdown of the intestinalbarrier that normally protects the bodyfrom invasion of bacteria and the entry ofLPS from the gut. The concept of this im-munological barrier of the gut has devel-oped rapidly over the past few years and is
vital to the protection from bacterial tox-ins and immunological responses to thecommensal and pathogenic intestinalbacteria.
In this context, we wanted to analyzewhich macronutrient was responsible forthe induction of oxidative stress and in-flammation, on the one hand, and the in-crease in LPS concentrations and theexpression of TLR-4 and suppresser of cy-tokine signaling (SOCS)-3 on the other.To elucidate this, we investigated the ef-fect of glucose, the most important carbo-hydrate, cream, a saturated fat, andorange juice, a carbohydrate-containingfood product, which does not induce ei-ther oxidative stress or inflammation.
SOCS3 is a protein that has beenshown to interfere with insulin and leptinsignal transduction (2–5). Our recentwork has shown that SOCS3 expressionin the circulating mononuclear cells(MNCs) of the obese human is markedlyincreased when compared with that innormal subjects (6). In addition, ourwork demonstrated that SOCS3 expres-sion in MNCs is inversely related to thetyrosine phosphorylation of the insulinreceptor and directly related to BMI andinsulin resistance (homeostasis model as-sessment of insulin resistance [HOMA-IR]), consistent with its role in thepathogenesis of insulin resistance. Leptinresistance in human obesity leads to theinability of leptin to cause satiety andweight loss, whereas insulin resistancemakes the obese vulnerable to diabetes.Human obesity is also a state of chronicinflammation characterized by an in-crease in inflammatory mediators inplasma, in adipose tissue, and in circulat-ing mononuclear cells (7,8). BecauseSOCS3 is induced in animal models byproinflammatory stimuli like the cyto-kines, TNF-", IL-6, and IL-1# (3,4,9) andbecause macronutrient intake causes oxi-dative stress (10,11) and inflammation(12,13), it is possible that the intake ofglucose and saturated fat (cream) inducesan increase in the expression of SOCS3 asa part of macronutrient-induced inflam-
! ! ! ! ! ! ! ! ! ! ! ! ! ! ! ! ! ! ! ! ! ! ! ! ! ! ! ! ! ! ! ! ! ! ! ! ! ! ! ! ! ! ! ! ! ! ! ! !
From the Division of Endocrinology, Diabetes, and Metabolism, State University of New York at Buffalo andKaleida Health, Buffalo, New York.
Corresponding author: Paresh Dandona, [email protected] 2 September 2009 and accepted 5 January 2010. Published ahead of print at http://care.
diabetesjournals.org on 12 January 2010. DOI: 10.2337/dc09-1630.R.D., H.G., and J.F. contributed equally to this study.© 2010 by the American Diabetes Association. Readers may use this article as long as the work is properly
cited, the use is educational and not for profit, and the work is not altered. See http://creativecommons.org/licenses/by-nc-nd/3.0/ for details.
The costs of publication of this article were defrayed in part by the payment of page charges. This article must therefore be herebymarked “advertisement” in accordance with 18 U.S.C. Section 1734 solely to indicate this fact.
C l i n i c a l C a r e / E d u c a t i o n / N u t r i t i o n / P s y c h o s o c i a l R e s e a r c hO R I G I N A L A R T I C L E
care.diabetesjournals.org DIABETES CARE, VOLUME 33, NUMBER 5, MAY 2010 991
flected in these indexes and the overallmagnitude of the inflammatory process.Previously, Dasu et al. (25) reported thathigh glucose concentrations upregulatedTLR-4 expression and its downstream sig-naling in a monocytic cell line. However,the excursions of glucose concentrationsin normal and even obese subjects do notachieve those concentrations postprandi-ally. Thus, the observations of Dasu et al.are relevant to diabetic individuals. Ourinvestigation deals with postprandialchanges in normal subjects. As far as theeffects of cream intake are concerned, theamount taken is modest, and the increase
in triglycerides is consistent with that inprevious studies. It should, therefore, benoted that although the amounts of creamand glucose taken induced similar in-creases in reactive oxygen species genera-tion and NF-!B binding, glucose was notable to induce an increase in the expres-sion of TLR-4.
In summary, the intake of a modestamount of glucose or cream results in asignificant induction of SOCS3 mRNAand protein in parallel with the inductionof an inflammatory response character-ized by an increase in NF-!B binding inMNCs and the induction of two of the
cytokines, TNF-" and IL-1#, which areknown to induce SOCS3 in experimentalanimals. In addition, the intake of creambut not of glucose also induces an in-crease in the expression of TLR-4 mRNAand protein while also inducing an in-crease in plasma LPS concentrations. BothSOCS3 and TLR-4 are putative mediatorsof insulin resistance. In contrast, orangejuice intake does not induce oxidativestress, inflammation, SOCS3, TLR-4, oran increase in plasma LPS concentrations.
Acknowledgments— The study was sup-ported in part by a grant from the State ofFlorida, Department of Citrus. P.D. was alsosupported by the National Institutes of Health(R01-DK-069805 and R01-DK-075877) andthe American Diabetes Association (708CR13).The data were obtained from our laboratoryand were under our control, and the inter-pretations and conclusions are those of theinvestigators. Furthermore, the Principal In-vestigator (P.D.) takes the full responsibilityfor them.
No potential conflicts of interest relevant tothis article were reported.
References1. Ghanim H, Abuaysheh S, Sia CL, Korze-
niewski K, Chaudhuri A, Fernandez-RealJM, Dandona P. Increase in plasma endo-toxin concentrations and the expressionof Toll-like receptors and suppressor ofcytokine signaling-3 in mononuclear cellsfollowing a high-fat high-carbohydratemeal: implications for insulin resistance.Diabetes Care 2009;32:2281–2287
2. Rui L, Yuan M, Frantz D, Shoelson S,White MF. SOCS-1 and SOCS-3 block in-sulin signaling by ubiquitin-mediateddegradation of IRS1 and IRS2. J BiolChem 2002;277:42394–42398
3. Senn JJ, Klover PJ, Nowak IA, ZimmersTA, Koniaris LG, Furlanetto RW, MooneyRA. Suppressor of cytokine signaling-3(SOCS-3), a potential mediator of inter-leukin-6-dependent insulin resistance inhepatocytes. J Biol Chem 2003;278:13740–13746
4. Emanuelli B, Peraldi P, Filloux C, ChaveyC, Freidinger K, Hilton DJ, HotamisligilGS, Van Obberghen E. SOCS-3 inhibitsinsulin signaling and is up-regulated inresponse to tumor necrosis factor-alpha inthe adipose tissue of obese mice. J BiolChem 2001;276:47944–47949
5. Bjørbaek C, El-Haschimi K, Frantz JD,Flier JS. The role of SOCS-3 in leptin sig-naling and leptin resistance. J Biol Chem1999;274:30059–30065
6. Ghanim H, Aljada A, Daoud N, DeopurkarR, Chaudhuri A, Dandona P. Role of inflam-matory mediators in the suppression ofinsulin receptor phosphorylation in circu-
Figure 3—Change in NF!B binding activity in MNC (A) and plasma endotoxin concentrations(B) in normal subjects after a 300-calorie drink of cream (E), glucose (Œ), orange juice (OJ, ‚),or water (F). Data are means $ SEM. * and !, P % 0.05 with RMANOVA comparing changes inrelation to baseline after cream and glucose challenges; # and $, P % 0.05 with two-wayRMANOVA for comparisons of cream and glucose changes, respectively, to water (n & 12).
Macronutrients, oxidative stress, and inflammation
996 DIABETES CARE, VOLUME 33, NUMBER 5, MAY 2010 care.diabetesjournals.org
Nata
Sumo de Laranja
Glucose
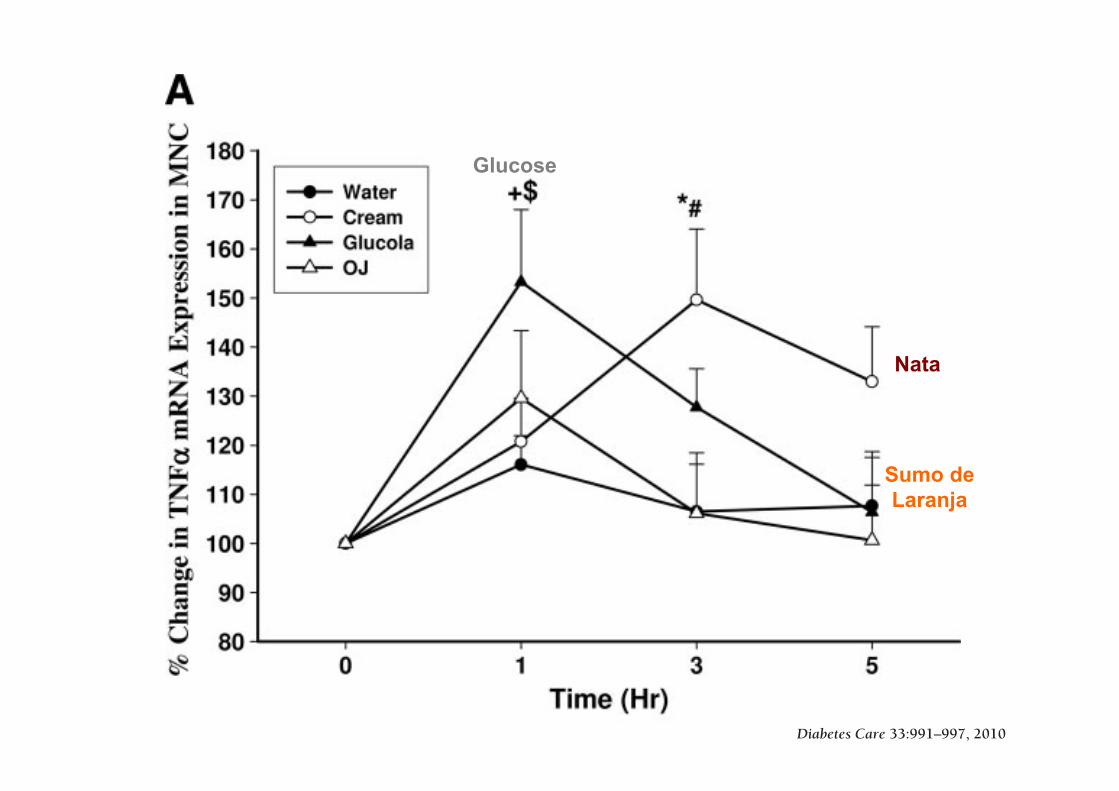
Differential Effects of Cream, Glucose, andOrange Juice on Inflammation, Endotoxin,and the Expression of Toll-Like Receptor-4and Suppressor of Cytokine Signaling-3RUPALI DEOPURKAR, PHD
HUSAM GHANIM, PHD
JAY FRIEDMAN, PHD
SANAA ABUAYSHEH, BSC
CHANG LING SIA, BSC
PRIYA MOHANTY, MD
PRABHAKAR VISWANATHAN, PHD
AJAY CHAUDHURI, MD
PARESH DANDONA, MD, PHD
OBJECTIVE — We have recently shown that a high-fat high-carbohydrate (HFHC) mealinduces an increase in plasma concentrations of endotoxin (lipopolysaccharide [LPS]) and theexpression of Toll-like receptor-4 (TLR-4) and suppresser of cytokine signaling-3 (SOCS3) inmononuclear cells (MNCs) in addition to oxidative stress and cellular inflammation. Saturatedfat and carbohydrates, components of the HFHC meal, known to induce oxidative stress andinflammation, also induce an increase in LPS, TLR-4, and SOCS3.
RESEARCH DESIGN AND METHODS — Fasting normal subjects were given 300-calorie drinks of either glucose, saturated fat as cream, orange juice, or only water to ingest. Bloodsamples were obtained at 0, 1, 3, and 5 h for analysis.
RESULTS — Indexes of inflammation including nuclear factor-!B (NF-!B) binding, and theexpression of SOCS3, tumor necrosis factor-" (TNF-"), and interleukin (IL)-1# in MNCs,increased significantly after glucose and cream intake, but TLR-4 expression and plasma LPSconcentrations increased only after cream intake. The intake of orange juice or water did notinduce any change in any of the indexes measured.
CONCLUSIONS — Although both glucose and cream induce NF-!B binding and an in-crease in the expression of SOCS3, TNF-", and IL-1# in MNCs, only cream caused an increasein LPS concentration and TLR-4 expression. Equicaloric amounts of orange juice or water did notinduce a change in any of these indexes. These changes are relevant to the pathogenesis ofatherosclerosis and insulin resistance.
Diabetes Care 33:991–997, 2010
Our recent work has shown that ahigh-fat high-cholesterol (HFHC)meal induces oxidative and inflam-
matory stress in addition to inducing anincrease in plasma endotoxin (lipopoly-saccharide [LPS]) levels and the expres-sion of Toll-like receptor (TLR)-4, thespecific receptor for LPS (1). In contrast, ahigh-fiber and fruit meal does not induceany of these changes. These data are of
great interest because the content of LPSin these meals is not significantly differ-ent, and, thus, it would appear that theinflammatory nature of the meal may leadto a partial breakdown of the intestinalbarrier that normally protects the bodyfrom invasion of bacteria and the entry ofLPS from the gut. The concept of this im-munological barrier of the gut has devel-oped rapidly over the past few years and is
vital to the protection from bacterial tox-ins and immunological responses to thecommensal and pathogenic intestinalbacteria.
In this context, we wanted to analyzewhich macronutrient was responsible forthe induction of oxidative stress and in-flammation, on the one hand, and the in-crease in LPS concentrations and theexpression of TLR-4 and suppresser of cy-tokine signaling (SOCS)-3 on the other.To elucidate this, we investigated the ef-fect of glucose, the most important carbo-hydrate, cream, a saturated fat, andorange juice, a carbohydrate-containingfood product, which does not induce ei-ther oxidative stress or inflammation.
SOCS3 is a protein that has beenshown to interfere with insulin and leptinsignal transduction (2–5). Our recentwork has shown that SOCS3 expressionin the circulating mononuclear cells(MNCs) of the obese human is markedlyincreased when compared with that innormal subjects (6). In addition, ourwork demonstrated that SOCS3 expres-sion in MNCs is inversely related to thetyrosine phosphorylation of the insulinreceptor and directly related to BMI andinsulin resistance (homeostasis model as-sessment of insulin resistance [HOMA-IR]), consistent with its role in thepathogenesis of insulin resistance. Leptinresistance in human obesity leads to theinability of leptin to cause satiety andweight loss, whereas insulin resistancemakes the obese vulnerable to diabetes.Human obesity is also a state of chronicinflammation characterized by an in-crease in inflammatory mediators inplasma, in adipose tissue, and in circulat-ing mononuclear cells (7,8). BecauseSOCS3 is induced in animal models byproinflammatory stimuli like the cyto-kines, TNF-", IL-6, and IL-1# (3,4,9) andbecause macronutrient intake causes oxi-dative stress (10,11) and inflammation(12,13), it is possible that the intake ofglucose and saturated fat (cream) inducesan increase in the expression of SOCS3 asa part of macronutrient-induced inflam-
! ! ! ! ! ! ! ! ! ! ! ! ! ! ! ! ! ! ! ! ! ! ! ! ! ! ! ! ! ! ! ! ! ! ! ! ! ! ! ! ! ! ! ! ! ! ! ! !
From the Division of Endocrinology, Diabetes, and Metabolism, State University of New York at Buffalo andKaleida Health, Buffalo, New York.
Corresponding author: Paresh Dandona, [email protected] 2 September 2009 and accepted 5 January 2010. Published ahead of print at http://care.
diabetesjournals.org on 12 January 2010. DOI: 10.2337/dc09-1630.R.D., H.G., and J.F. contributed equally to this study.© 2010 by the American Diabetes Association. Readers may use this article as long as the work is properly
cited, the use is educational and not for profit, and the work is not altered. See http://creativecommons.org/licenses/by-nc-nd/3.0/ for details.
The costs of publication of this article were defrayed in part by the payment of page charges. This article must therefore be herebymarked “advertisement” in accordance with 18 U.S.C. Section 1734 solely to indicate this fact.
C l i n i c a l C a r e / E d u c a t i o n / N u t r i t i o n / P s y c h o s o c i a l R e s e a r c hO R I G I N A L A R T I C L E
care.diabetesjournals.org DIABETES CARE, VOLUME 33, NUMBER 5, MAY 2010 991
with the increase in NF-!B binding.However, it was surprising that IL-6 wasnot induced by either glucose or cream.SOCS3, as its name suggests, was ini-tially discovered as a molecule that in-terferes with cytokine signaling. It hassince been shown to also interfere withboth insulin and leptin signal transduc-tion (4,21).
The induction of SOCS3 by creamand glucose intake in combination withthe fact that its expression is increased inobese individuals suggests the possibilitythat chronic excessive fat and carbohy-drate intake may result in a chronic in-
crease in SOCS3 expression. It is also ofinterest that the intake of such macronu-trients may result in resistance to leptin,one of the major signals that promotessatiety and thus potentially reduces foodintake. Similarly, it is intriguing that theintake of a macronutrient should causethe induction of a molecule (SOCS3) thatwould interfere with the signal transduc-tion of insulin, a hormone, which causesthe assimilation of nutrients after a meal,including the distribution and storage offat, carbohydrates, and proteins. Becausethe intake of a modest amount of proin-flammatory macronutrients led to the in-
duction of SOCS3, which inducesconcomitant insulin and leptin resistance,our observation raises the issue about thesearch for foods that are not likely to in-duce SOCS3 or inflammation.
Although SOCS1 and SOCS7 genesare also induced by inflammatory cyto-kines and have been reported to modulateinsulin signaling in vitro and in experi-mental animal models (2,22), there are nodata about their relevance to human insu-lin resistance. Indeed, their expressiondid not change after glucose and creamintake.
SOCS3 may interfere with insulin sig-nal transduction at various levels. First, itcan bind to the "-subunit of the insulinreceptor (IR-"), reduce tyrosine phos-phorylation of IR-", and prevent thedocking of insulin receptor substrate(IRS)-1 to the receptor (23). Second, itmay bind to IRS-1, and by so doing, itmay facilitate its ubiquitination and pro-teasomal degradation (2). By binding toIRS-1, it may also prevent the binding ofIRS-1 to the p85 subunit of phosphatidyl-inositol 3-kinase and thus prevent insulinsignaling. We have recently shown thatSOCS3 expression is increased in obeseindividuals and is inversely related to thetyrosine phosphorylation of the IR-" andthat it is directly related to insulin resis-tance (HOMA-IR), BMI, and other in-dexes of inflammation (6). Our currentobservations are consistent with its poten-tial role as a mediator of insulin resistancein the obese.
SOCS3 also interferes with leptin sig-nal transduction by reducing the phos-phorylation of the leptin receptor andJanus kinase (24) attached to the leptinreceptor. This results in a reduction ofphosphorylation of signal transducer andactivator of transcription (STAT) and thusthe dimerization of STAT. This in turnprevents the nuclear translocation ofSTAT. Thus, the necessary gene transcrip-tion in response to the leptin signal can-not occur (5). The increase in SOCS3expression and the presence of leptin re-sistance in the obese and their potentialreversal with macronutrient restrictionhave important implications.
It is of interest that although the in-take of cream induced an increase in theexpression of TLR-4 and in plasma LPSconcentrations, glucose had no effect. Be-cause TLR-4 is the specific receptor forLPS, the concomitant increase in both is arecipe for an amplified inflammatory sig-nal. It would be of interest to examine theeffects of repeated intake of cream as re-
Figure 2—Change in TNF-! (A) and IL-1" (B) mRNA expression in MNCs from normal subjectsafter a 300-calorie drink of cream (E), glucose (Œ), orange juice (OJ, ‚), or water (F). Data aremeans # SEM. * and !, P $ 0.05 with RMANOVA comparing changes in relation to baselineafter cream and glucose challenges; # and $, P $ 0.05 with two-way RMANOVA for comparisonsof cream and glucose changes, respectively, to water (n % 12).
Deopurkar and Associates
care.diabetesjournals.org DIABETES CARE, VOLUME 33, NUMBER 5, MAY 2010 995
Nata
Sumo de Laranja
Glucose
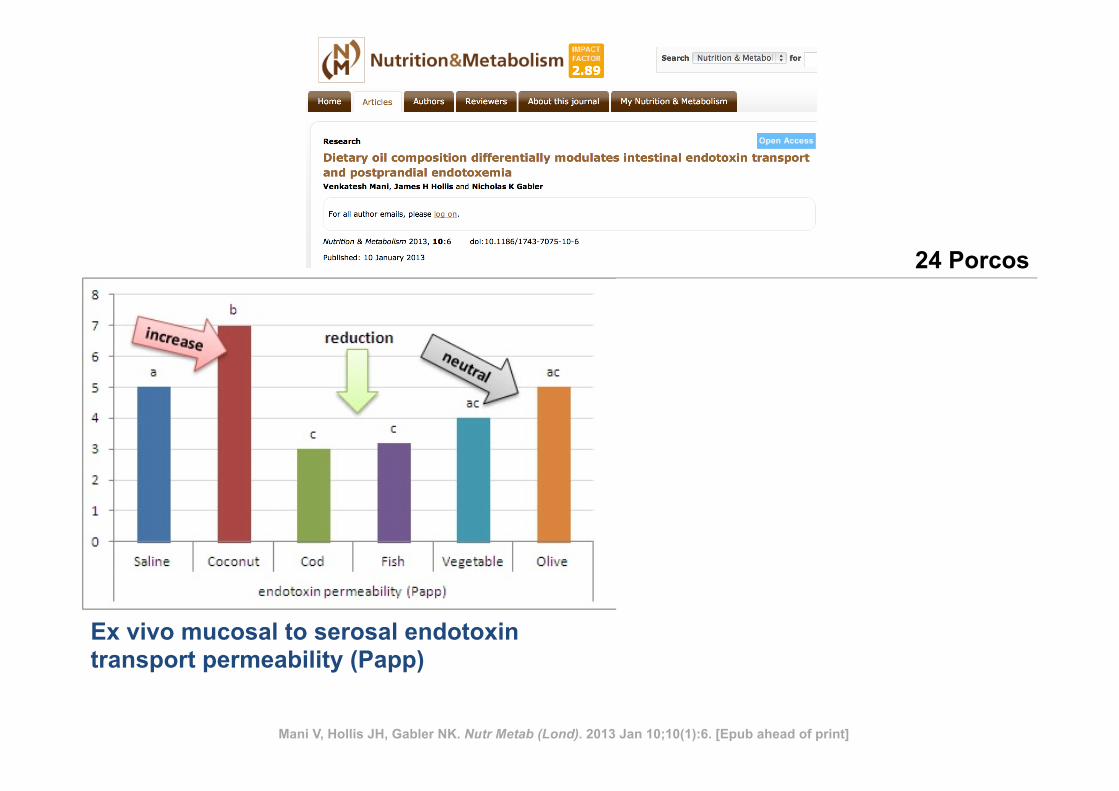
Mani V, Hollis JH, Gabler NK. Nutr Metab (Lond). 2013 Jan 10;10(1):6. [Epub ahead of print]
Ex vivo mucosal to serosal endotoxin transport permeability (Papp)
24 Porcos
LPS no plasma
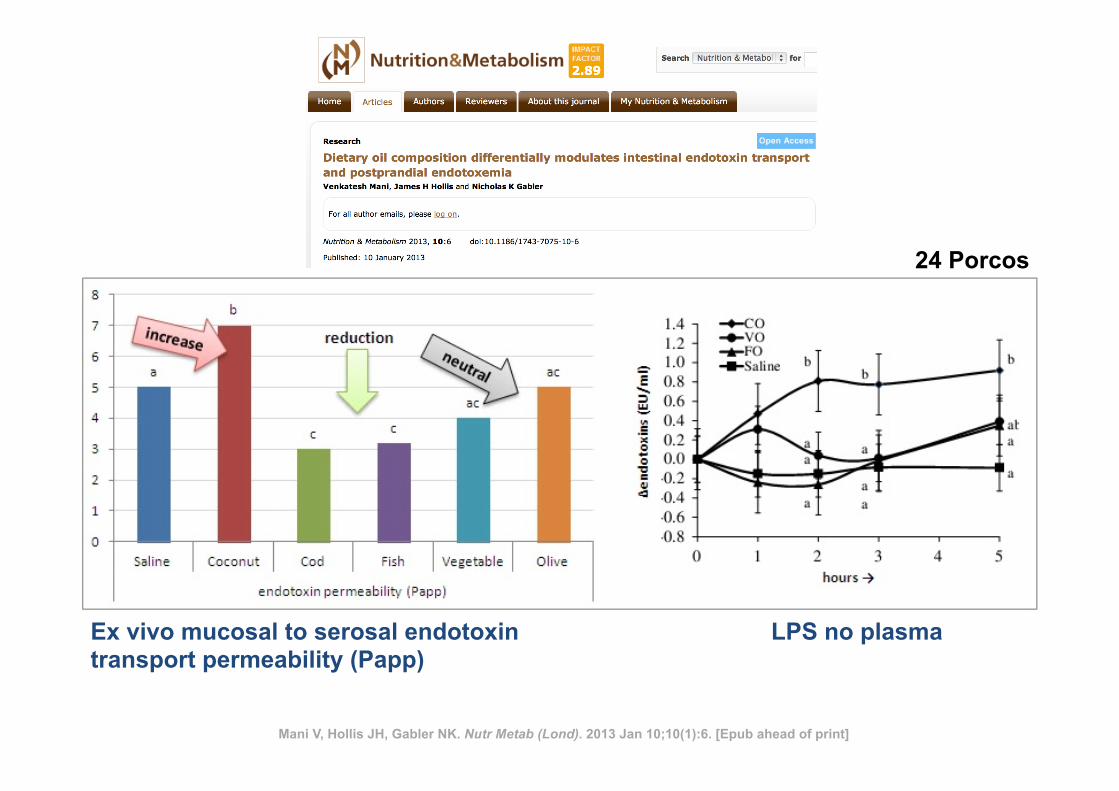
Mani V, Hollis JH, Gabler NK. Nutr Metab (Lond). 2013 Jan 10;10(1):6. [Epub ahead of print]
Ex vivo mucosal to serosal endotoxin transport permeability (Papp)
24 Porcos
LPS no plasma
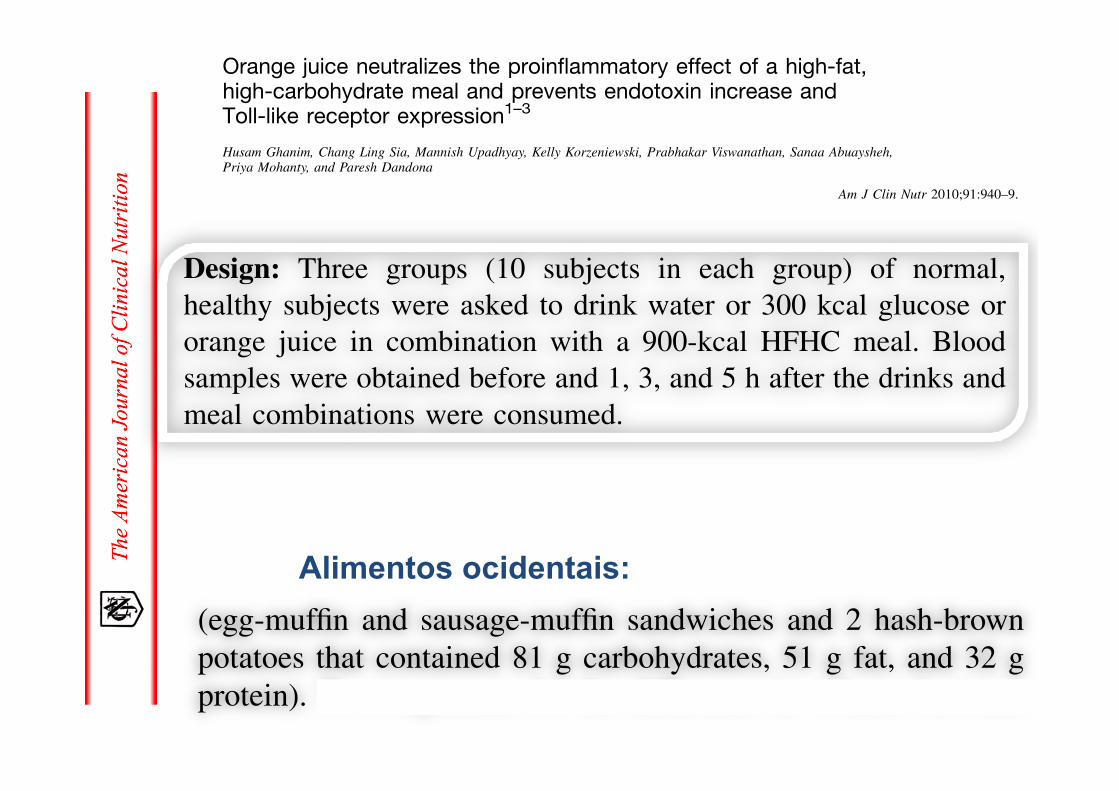
Orange juice neutralizes the proinflammatory effect of a high-fat,high-carbohydrate meal and prevents endotoxin increase andToll-like receptor expression1–3
Husam Ghanim, Chang Ling Sia, Mannish Upadhyay, Kelly Korzeniewski, Prabhakar Viswanathan, Sanaa Abuaysheh,Priya Mohanty, and Paresh Dandona
ABSTRACTBackground: The intake of glucose or a high-fat, high-carbohydrate(HFHC) meal, but not orange juice, induces an increase in inflam-mation and oxidative stress in circulating mononuclear cells (MNCs)of normal-weight subjects.Objective: We investigated the effect of orange juice on HFHCmeal–induced inflammation and oxidative stress and the expressionof plasma endotoxin and Toll-like receptors (TLRs).Design: Three groups (10 subjects in each group) of normal,healthy subjects were asked to drink water or 300 kcal glucose ororange juice in combination with a 900-kcal HFHC meal. Bloodsamples were obtained before and 1, 3, and 5 h after the drinks andmeal combinations were consumed.Results: Protein expression of the NADPH oxidase subunit p47phox,phosphorylated and total p38 mitogen-activated protein kinase, andsuppressor of cytokine signaling-3; TLR2 and TLR4 messengerRNA (mRNA) and protein expression; mRNA expression of matrixmetalloproteinase (MMP)-9 in MNCs; and plasma concentrations ofendotoxin and MMP-9 increased significantly after glucose or waterwere consumed with the meal but not when orange juice was con-sumed with the meal. The generation of reactive oxygen species bypolymorphonuclear cells was significantly lower when orange juicewas added to the meal than when water or glucose was added to themeal.Conclusions: The combination of glucose or water and the HFHCmeal induced oxidative and inflammatory stress and an increase inTLR expression and plasma endotoxin concentrations. In contrast,orange juice intake with the HFHC meal prevented meal-inducedoxidative and inflammatory stress, including the increase in endo-toxin and TLR expression. These observations may help explain themechanisms underlying postprandial oxidative stress and inflamma-tion, pathogenesis of insulin resistance, and atherosclerosis. AmJ Clin Nutr 2010;91:940–9.
INTRODUCTION
We previously showed that the intake of 75 g (300 kcal)glucose induced an acute increase in reactive oxygen species(ROS) generation and inflammation as reflected in an increase innuclear transcription factor jB (NF-jB) binding, a decrease inthe expression of inhibitory jB-a, and an increase in inhibitoryjB kinases in peripheral blood mononuclear cells (MNCs) (1,2). An increase in NF-jB binding is associated with an increasein tumor necrosis factor-a (TNF-a) expression, activator protein-1
binding, early growth response factor-1 expression and binding,plasma matrix metalloproteinase (MMP)-2 and -9, and tissuefactor after glucose intake (3). In terms of oxidative and in-flammatory stress, a similar response follows the intake ofa high-fat, high-carbohydrate (HFHC) meal (4). In contrast, theintake of orange juice containing sucrose, glucose, and fructose(total sugar content: 75 g = 300 kcal) does not cause an increasein ROS generation or NF-jB binding (5). In addition, hesperetinand naringenin, 2 major flavonoids that are contained in orangejuice, but not ascorbic acid, are able to suppress ROS generationby MNCs in vitro by.50% (5). Toll-like receptor (TLR) 2 is thespecific receptor for lipopeptides and peptidoglycans fromgram-positive bacteria, and TLR4 is the specific receptor forlipopolysaccharide (LPS) or endotoxin from gram-negativebacteria (6, 7). TLR4 was also shown to play an important rolein the pathogenesis of atherosclerosis (8–11), diet-inducedobesity, and the related insulin resistance (12, 13), whereasTLR2 was shown to be involved in ischemia-reperfusion–induced myocardial injury (14). In a recent study (15) weshowed that there was a significant increase in plasma concen-trations of endotoxin and an increase in TLR4 and TLR2 ex-pression in MNCs after the intake of an HFHC meal. Thisincrease of endotoxemia induced by a fatty meal was alsoconfirmed in previous reports in human and rodents (16–18).This increase could contribute to and prolong the inflammatoryresponse that follows the intake of such a meal. Whether thisincrease of endotoxemia is due to the lipid solubility of endo-toxin and its absorption into the circulation with the fat con-tained in the meal or is secondary to other factors such as theinflammation of the intestinal epithelium is not clear. If it issecondary to other factors, the potential antiinflammatory effect
1 From the Division of Endocrinology, Diabetes, and Metabolism, StateUniversity of New York at Buffalo, Buffalo, NY (HG and PD); KaleidaHealth, Buffalo, NY (CLS, MU, KK, PV, SA, and PM); and Kyung HeeUniversity, Seoul, Korea (PD).
2 Supported by a grant from the Florida Department of Citrus (to PD),grant R01DK069805-02 (to PD) from the National Institutes of Health, andgrant 08-CR-13 (to PD) from the American Diabetes Association.
3 Address correspondence to P Dandona, Diabetes-Endocrinology Centerof Western NY, State University of New York at Buffalo, 3 Gates Circle,Buffalo, NY 14209. E-mail: [email protected].
Received August 27, 2009. Accepted for publication January 19, 2010.First published online March 3, 2010; doi: 10.3945/ajcn.2009.28584.
940 Am J Clin Nutr 2010;91:940–9. Printed in USA. ! 2010 American Society for Nutrition
at Lund University Libraries on August 20, 2010
ww
w.ajcn.org
Dow
nloaded from
Orange juice neutralizes the proinflammatory effect of a high-fat,high-carbohydrate meal and prevents endotoxin increase andToll-like receptor expression1–3
Husam Ghanim, Chang Ling Sia, Mannish Upadhyay, Kelly Korzeniewski, Prabhakar Viswanathan, Sanaa Abuaysheh,Priya Mohanty, and Paresh Dandona
ABSTRACTBackground: The intake of glucose or a high-fat, high-carbohydrate(HFHC) meal, but not orange juice, induces an increase in inflam-mation and oxidative stress in circulating mononuclear cells (MNCs)of normal-weight subjects.Objective: We investigated the effect of orange juice on HFHCmeal–induced inflammation and oxidative stress and the expressionof plasma endotoxin and Toll-like receptors (TLRs).Design: Three groups (10 subjects in each group) of normal,healthy subjects were asked to drink water or 300 kcal glucose ororange juice in combination with a 900-kcal HFHC meal. Bloodsamples were obtained before and 1, 3, and 5 h after the drinks andmeal combinations were consumed.Results: Protein expression of the NADPH oxidase subunit p47phox,phosphorylated and total p38 mitogen-activated protein kinase, andsuppressor of cytokine signaling-3; TLR2 and TLR4 messengerRNA (mRNA) and protein expression; mRNA expression of matrixmetalloproteinase (MMP)-9 in MNCs; and plasma concentrations ofendotoxin and MMP-9 increased significantly after glucose or waterwere consumed with the meal but not when orange juice was con-sumed with the meal. The generation of reactive oxygen species bypolymorphonuclear cells was significantly lower when orange juicewas added to the meal than when water or glucose was added to themeal.Conclusions: The combination of glucose or water and the HFHCmeal induced oxidative and inflammatory stress and an increase inTLR expression and plasma endotoxin concentrations. In contrast,orange juice intake with the HFHC meal prevented meal-inducedoxidative and inflammatory stress, including the increase in endo-toxin and TLR expression. These observations may help explain themechanisms underlying postprandial oxidative stress and inflamma-tion, pathogenesis of insulin resistance, and atherosclerosis. AmJ Clin Nutr 2010;91:940–9.
INTRODUCTION
We previously showed that the intake of 75 g (300 kcal)glucose induced an acute increase in reactive oxygen species(ROS) generation and inflammation as reflected in an increase innuclear transcription factor jB (NF-jB) binding, a decrease inthe expression of inhibitory jB-a, and an increase in inhibitoryjB kinases in peripheral blood mononuclear cells (MNCs) (1,2). An increase in NF-jB binding is associated with an increasein tumor necrosis factor-a (TNF-a) expression, activator protein-1
binding, early growth response factor-1 expression and binding,plasma matrix metalloproteinase (MMP)-2 and -9, and tissuefactor after glucose intake (3). In terms of oxidative and in-flammatory stress, a similar response follows the intake ofa high-fat, high-carbohydrate (HFHC) meal (4). In contrast, theintake of orange juice containing sucrose, glucose, and fructose(total sugar content: 75 g = 300 kcal) does not cause an increasein ROS generation or NF-jB binding (5). In addition, hesperetinand naringenin, 2 major flavonoids that are contained in orangejuice, but not ascorbic acid, are able to suppress ROS generationby MNCs in vitro by.50% (5). Toll-like receptor (TLR) 2 is thespecific receptor for lipopeptides and peptidoglycans fromgram-positive bacteria, and TLR4 is the specific receptor forlipopolysaccharide (LPS) or endotoxin from gram-negativebacteria (6, 7). TLR4 was also shown to play an important rolein the pathogenesis of atherosclerosis (8–11), diet-inducedobesity, and the related insulin resistance (12, 13), whereasTLR2 was shown to be involved in ischemia-reperfusion–induced myocardial injury (14). In a recent study (15) weshowed that there was a significant increase in plasma concen-trations of endotoxin and an increase in TLR4 and TLR2 ex-pression in MNCs after the intake of an HFHC meal. Thisincrease of endotoxemia induced by a fatty meal was alsoconfirmed in previous reports in human and rodents (16–18).This increase could contribute to and prolong the inflammatoryresponse that follows the intake of such a meal. Whether thisincrease of endotoxemia is due to the lipid solubility of endo-toxin and its absorption into the circulation with the fat con-tained in the meal or is secondary to other factors such as theinflammation of the intestinal epithelium is not clear. If it issecondary to other factors, the potential antiinflammatory effect
1 From the Division of Endocrinology, Diabetes, and Metabolism, StateUniversity of New York at Buffalo, Buffalo, NY (HG and PD); KaleidaHealth, Buffalo, NY (CLS, MU, KK, PV, SA, and PM); and Kyung HeeUniversity, Seoul, Korea (PD).
2 Supported by a grant from the Florida Department of Citrus (to PD),grant R01DK069805-02 (to PD) from the National Institutes of Health, andgrant 08-CR-13 (to PD) from the American Diabetes Association.
3 Address correspondence to P Dandona, Diabetes-Endocrinology Centerof Western NY, State University of New York at Buffalo, 3 Gates Circle,Buffalo, NY 14209. E-mail: [email protected].
Received August 27, 2009. Accepted for publication January 19, 2010.First published online March 3, 2010; doi: 10.3945/ajcn.2009.28584.
940 Am J Clin Nutr 2010;91:940–9. Printed in USA. ! 2010 American Society for Nutrition
at Lund University Libraries on August 20, 2010 www.ajcn.org
Downloaded from
of orange juice intake could lower postprandial endotoxinincrease.
In our recent study (15) we also showed that an HFHC mealinduced an increase in the expression of the suppressor ofcytokine signaling (SOCS)-3, a key protein responsible for in-terference with insulin signal transduction by causing the deg-radation of insulin receptor substrate-1. SOCS-3 is induced byproinflammatory cytokines TNF-a and interleukin (IL)-1b andIL-6. Proinflammatory meals may contribute to the pathogenesisof insulin resistance.
Because orange juice does not cause oxidative and in-flammatory stress, and flavonoids in orange juice suppress ROSgeneration (5), we hypothesized that 1) orange juice is able tolower the increase in ROS generation and the inflammatory re-sponse in MNCs and plasma after a HFHC meal, and 2) theconcentration of plasma endotoxin and TLR4 and SOCS-3 ex-pression in MNCs, which increase after an HFHC meal, arereduced by the simultaneous intake of orange juice. Such a studyis important because chronic oxidative stress and inflammationare the 2 basic mechanisms underlying atherosclerosis (19, 20).Obesity and diabetes are states of chronic oxidative and in-flammatory stress and are major risk factors for atherosclerosis(21, 22). MNCs constitute the major cellular group (monocytesand T and B lymphocytes) that participate in intramural ath-erosclerotic inflammation and are known to be in a proin-flammatory state in obese individuals who carry a high risk ofatherogenesis and have a chronically elevated food intake (23).Furthermore, inflammatory factors contribute to interferencewith insulin signal transduction and insulin resistance.
SUBJECTS AND METHODS
Three groups of 10 healthy, normal-weight men and women(body mass index [in kg/m2]: 20–25; age range: 20–40 y) wererecruited for this study. All subjects presented for the in-vestigation after an overnight fast to the Clinical ResearchCenter, State University of New York at Buffalo. Subjects in the3 groups ingested a 300-kcal drink of 75 g glucose (Glucola;Fisher Scientific, Pittsburgh, PA), orange juice (“Not FromConcentrate” Florida Orange Juice; Florida Department of Cit-rus, Lakeland, FL), or water along with a 900-kcal HFHC meal(egg-muffin and sausage-muffin sandwiches and 2 hash-brownpotatoes that contained 81 g carbohydrates, 51 g fat, and 32 gprotein). To compensate for the difference in volume betweenthe drinks, subjects were asked to drink an extra 350 mL waterwith the glucose drink. All subjects were given 10–15 min tofinish their drinks and meals. Blood samples were collectedbefore and 1, 3, and 5 h after the intake of the food and drinks.The experimental protocol was approved by the Human Re-search Committee of the State University of New York at Buf-falo, and each subject signed an informed consent. Recruitmentfor this study began in October 2006.
In a previous study (5), we used orange juice obtained froma local supermarket and used portions of the juice from 0.5- or1-gal packages for multiple experiments. To minimize any po-tential for instability of orange-juice constituents (24–26), weused packages of recently produced “Not from Concentrate”Florida orange juice in the current study. Each package, onceopened, was discarded after a single experiment.
MNC isolation
Blood samples were collected in tubes containing sodium-EDTA as an anticoagulant. A total of 3–5 mL anticoagulatedblood sample was carefully layered over 3.5 mL Lympholytemedium (Cedarlane Laboratories, Hornby, Canada) and centri-fuged to separate the cells. A top band consisted of MNCs, anda bottom band consisted of polymorphonuclear cells (PMNs).The cells were carefully collected. This method provided yieldsof .95% pure PMN and MNC suspensions.
ROS-generation measurement by chemiluminescence
A total of 500 lL PMNs or MNCs (2 · 105 cells) were de-livered into a Chronolog Lumi-Aggregometer cuvette (Chro-nolog, Havertown, PA). Luminol was added and followed by 1.0lL of 10 mmol/L formylmethionyl leucinyl phenylalanine. Inthis assay system, the release of superoxide radical, as measuredby chemiluminescence, was shown to be linearly correlated withthat measured by the ferricytochrome C method (27). The in-terassay CVof this assay was 8%. We further established that thebiological variation in ROS generation in normal subjects was’6% for readings obtained 1–2 wk apart.
Western blotting
MNC total cell lysates were prepared and electrophoresis, andimmunoblotting was carried as previously described (4). Poly-clonal or monoclonal antibodies against the NADPH oxidasesubunit p47phox (BD Biosciences, San Jose, CA), TLR2 (Im-genex, San Diego, CA), TLR4, SOCS-3 (Abcam Inc, Cam-bridge, MA), p38 mitogen-activated protein (MAP) kinase,phosphorylated tyrosine 182 of p38, and actin (Santa CruzBiotechnology, Santa Cruz, CA) were used, and the membraneswere developed with SuperSignal Chemiluminescence reagent(Pierce Chemical, Rockford, IL). Densitometry was performedwith Molecular Analyst software (Biorad, Hercules, CA), and allvalues were corrected for loading with actin.
Total RNA isolation and real-time reverse transcriptasepolymerase chain reaction
Total RNA isolation and reverse transcriptase polymerasechain reaction were performed as previously described (23, 28).The expression of MMP-9, TLR2, and TLR4 messenger RNA(mRNA) was measured. The specificity and size of the poly-merase chain reaction products were tested by confirming themelting temperature at the end of the amplifications and byrunning it on a 2% agarose gel. All values were normalized to theexpression of 3 housekeeping genes (b-actin, ubiquitin C, andcyclophilin A).
Measurement of plasma concentrations of endotoxin andserum MMP-9
Plasma and food endotoxin concentrations were measured bya commercially available kit [Cambrex Limulus AmebocyteLysate (LAL) kit; Lonza Inc, Walkersville, MD]. The assay isa quantitative, endpoint assay for the detection of gram-negativebacterial endotoxin. LPS from the sample reacts enzymaticallywith a proenzme in the LAL reagent that leads to its activation
ORANGE JUICE PREVENTS MEAL-INDUCED INFLAMMATION AND OXIDATIVE STRESS 941
at Lund University Libraries on August 20, 2010
ww
w.ajcn.org
Dow
nloaded from
Alimentos ocidentais:
Orange juice neutralizes the proinflammatory effect of a high-fat,high-carbohydrate meal and prevents endotoxin increase andToll-like receptor expression1–3
Husam Ghanim, Chang Ling Sia, Mannish Upadhyay, Kelly Korzeniewski, Prabhakar Viswanathan, Sanaa Abuaysheh,Priya Mohanty, and Paresh Dandona
ABSTRACTBackground: The intake of glucose or a high-fat, high-carbohydrate(HFHC) meal, but not orange juice, induces an increase in inflam-mation and oxidative stress in circulating mononuclear cells (MNCs)of normal-weight subjects.Objective: We investigated the effect of orange juice on HFHCmeal–induced inflammation and oxidative stress and the expressionof plasma endotoxin and Toll-like receptors (TLRs).Design: Three groups (10 subjects in each group) of normal,healthy subjects were asked to drink water or 300 kcal glucose ororange juice in combination with a 900-kcal HFHC meal. Bloodsamples were obtained before and 1, 3, and 5 h after the drinks andmeal combinations were consumed.Results: Protein expression of the NADPH oxidase subunit p47phox,phosphorylated and total p38 mitogen-activated protein kinase, andsuppressor of cytokine signaling-3; TLR2 and TLR4 messengerRNA (mRNA) and protein expression; mRNA expression of matrixmetalloproteinase (MMP)-9 in MNCs; and plasma concentrations ofendotoxin and MMP-9 increased significantly after glucose or waterwere consumed with the meal but not when orange juice was con-sumed with the meal. The generation of reactive oxygen species bypolymorphonuclear cells was significantly lower when orange juicewas added to the meal than when water or glucose was added to themeal.Conclusions: The combination of glucose or water and the HFHCmeal induced oxidative and inflammatory stress and an increase inTLR expression and plasma endotoxin concentrations. In contrast,orange juice intake with the HFHC meal prevented meal-inducedoxidative and inflammatory stress, including the increase in endo-toxin and TLR expression. These observations may help explain themechanisms underlying postprandial oxidative stress and inflamma-tion, pathogenesis of insulin resistance, and atherosclerosis. AmJ Clin Nutr 2010;91:940–9.
INTRODUCTION
We previously showed that the intake of 75 g (300 kcal)glucose induced an acute increase in reactive oxygen species(ROS) generation and inflammation as reflected in an increase innuclear transcription factor jB (NF-jB) binding, a decrease inthe expression of inhibitory jB-a, and an increase in inhibitoryjB kinases in peripheral blood mononuclear cells (MNCs) (1,2). An increase in NF-jB binding is associated with an increasein tumor necrosis factor-a (TNF-a) expression, activator protein-1
binding, early growth response factor-1 expression and binding,plasma matrix metalloproteinase (MMP)-2 and -9, and tissuefactor after glucose intake (3). In terms of oxidative and in-flammatory stress, a similar response follows the intake ofa high-fat, high-carbohydrate (HFHC) meal (4). In contrast, theintake of orange juice containing sucrose, glucose, and fructose(total sugar content: 75 g = 300 kcal) does not cause an increasein ROS generation or NF-jB binding (5). In addition, hesperetinand naringenin, 2 major flavonoids that are contained in orangejuice, but not ascorbic acid, are able to suppress ROS generationby MNCs in vitro by.50% (5). Toll-like receptor (TLR) 2 is thespecific receptor for lipopeptides and peptidoglycans fromgram-positive bacteria, and TLR4 is the specific receptor forlipopolysaccharide (LPS) or endotoxin from gram-negativebacteria (6, 7). TLR4 was also shown to play an important rolein the pathogenesis of atherosclerosis (8–11), diet-inducedobesity, and the related insulin resistance (12, 13), whereasTLR2 was shown to be involved in ischemia-reperfusion–induced myocardial injury (14). In a recent study (15) weshowed that there was a significant increase in plasma concen-trations of endotoxin and an increase in TLR4 and TLR2 ex-pression in MNCs after the intake of an HFHC meal. Thisincrease of endotoxemia induced by a fatty meal was alsoconfirmed in previous reports in human and rodents (16–18).This increase could contribute to and prolong the inflammatoryresponse that follows the intake of such a meal. Whether thisincrease of endotoxemia is due to the lipid solubility of endo-toxin and its absorption into the circulation with the fat con-tained in the meal or is secondary to other factors such as theinflammation of the intestinal epithelium is not clear. If it issecondary to other factors, the potential antiinflammatory effect
1 From the Division of Endocrinology, Diabetes, and Metabolism, StateUniversity of New York at Buffalo, Buffalo, NY (HG and PD); KaleidaHealth, Buffalo, NY (CLS, MU, KK, PV, SA, and PM); and Kyung HeeUniversity, Seoul, Korea (PD).
2 Supported by a grant from the Florida Department of Citrus (to PD),grant R01DK069805-02 (to PD) from the National Institutes of Health, andgrant 08-CR-13 (to PD) from the American Diabetes Association.
3 Address correspondence to P Dandona, Diabetes-Endocrinology Centerof Western NY, State University of New York at Buffalo, 3 Gates Circle,Buffalo, NY 14209. E-mail: [email protected].
Received August 27, 2009. Accepted for publication January 19, 2010.First published online March 3, 2010; doi: 10.3945/ajcn.2009.28584.
940 Am J Clin Nutr 2010;91:940–9. Printed in USA. ! 2010 American Society for Nutrition
at Lund University Libraries on August 20, 2010 www.ajcn.org
Downloaded from
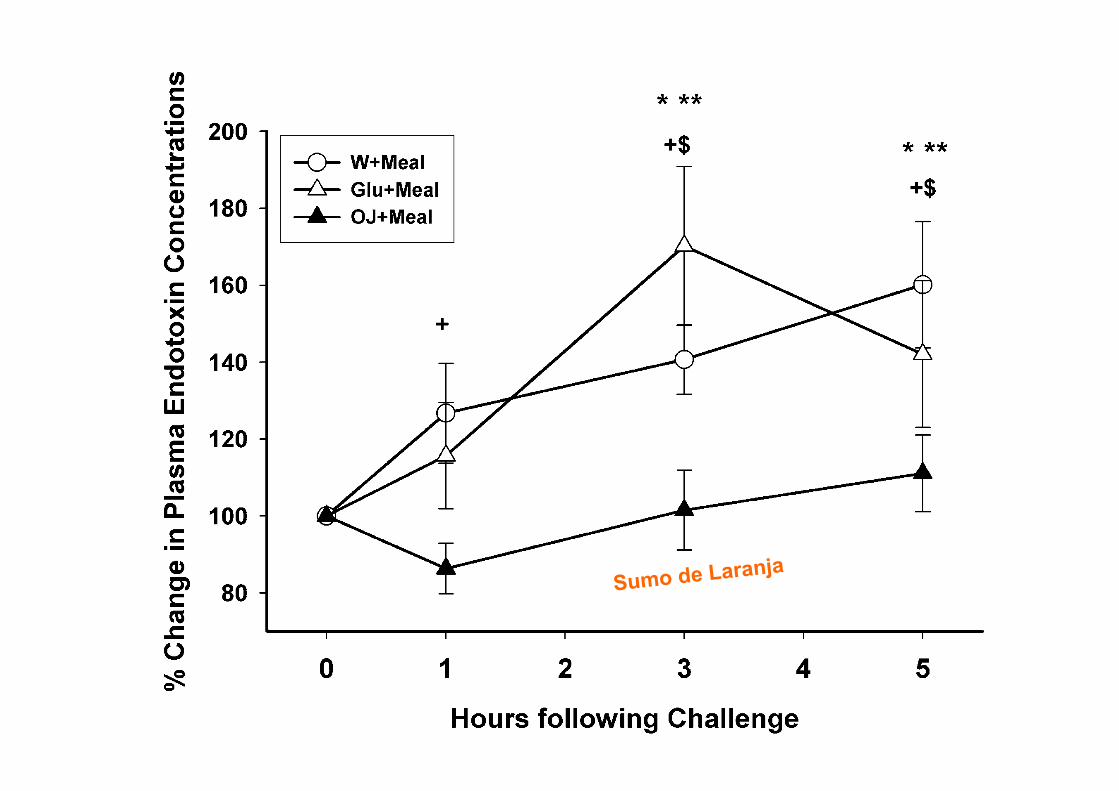
The induction of oxidative stress and inflammation after theexcessive intake of HFHC meals is potentially atherogenic andis known to impair endothelial function. Postprandial hyper-triglyceridemia and hyperglycemia impairs the flow-mediatedvasodilation of the brachial artery and is associated with in-creased ROS generation and inflammation (39, 40). IncreasedROS generation can reduce the bioavailability of nitric oxide assuperoxide combines with nitric oxide to form peroxynitrite,which might have a proconstrictor effect on blood vessels alongwith a platelet proaggregatory effect because nitric oxide exerts
a vasodilatory effect on blood vessels and an antiaggregatoryeffect on platelets (41). Hyperglycemia was also shown to at-tenuate the vasodilatory effect of insulin in the coronary circu-lation in patients with type 1diabetes (42). The monocyte and theTand B lymphocytes contained in theMNC fraction are known to
FIGURE 6. Western blotting representative gel and densitometry for thechange in Toll-like receptor (TLR) 2 protein (A and B) and TLR4 protein (Aand C) in mononuclear cells (MNC) after intake of a 900-kcal high-fat, high-carbohydrate meal and a 300-kcal drink of orange juice (OJ+meal), glucose(Glu+meal), or water (W+meal) in normal subjects. Values in B and C aremeans 6 SEs. *,**P , 0.05 [repeated measures ANOVA (RMANOVA)]compared with baseline values after W+meal, Glu+meal, or OJ+meal,respectively; +,$P , 0.05 (2-factor RMANOVA) for comparison betweenW+meal or Glu+meal and OJ+meal treatments, respectively. P forinteraction (treatment · time) = 0.041 for TLR2 protein with differencesbetween the groups at 1 h; P for interaction (treatment · time) = 0.044 forTLR4 protein with differences between the groups at 3 and 5 h. n = 10 each.
FIGURE 7. Change in suppressor of cytokine signaling (SOCS)-3 (A andB) protein in mononuclear cells (MNC) after intake of a 900-kcal high-fat, high-carbohydrate meal and a 300-kcal drink of orange juice(OJ+meal), glucose (Glu+meal), or water (W+meal) in normal subjects.Values in B are means 6 SEs. *,**P , 0.05 [repeated measures ANOVA(RMANOVA)] compared with baseline values after W+meal, Glu+meal,or OJ+meal, respectively. P for interaction (treatment · time) = 0.364. n =10 each.
FIGURE 8. Mean (6SE) change in plasma endotoxin concentrationsafter intake of a 900-kcal high-fat, high-carbohydrate meal and a 300-kcaldrink of orange juice (OJ+meal), glucose (Glu+meal), or water (W+meal) innormal subjects. *,**P , 0.05 [repeated measures ANOVA (RMANOVA)]compared with baseline values after W+meal, Glu+meal, or OJ+meal,respectively; +,$P , 0.05 (2-factor RMANOVA) for comparisons betweenW+meal or Glu+meal and OJ+meal treatments, respectively. P for interaction(treatment · time) = 0.134. n = 10 each.
ORANGE JUICE PREVENTS MEAL-INDUCED INFLAMMATION AND OXIDATIVE STRESS 947
at Lund University Libraries on August 20, 2010
ww
w.ajcn.org
Dow
nloaded from
Sumo de Laranja
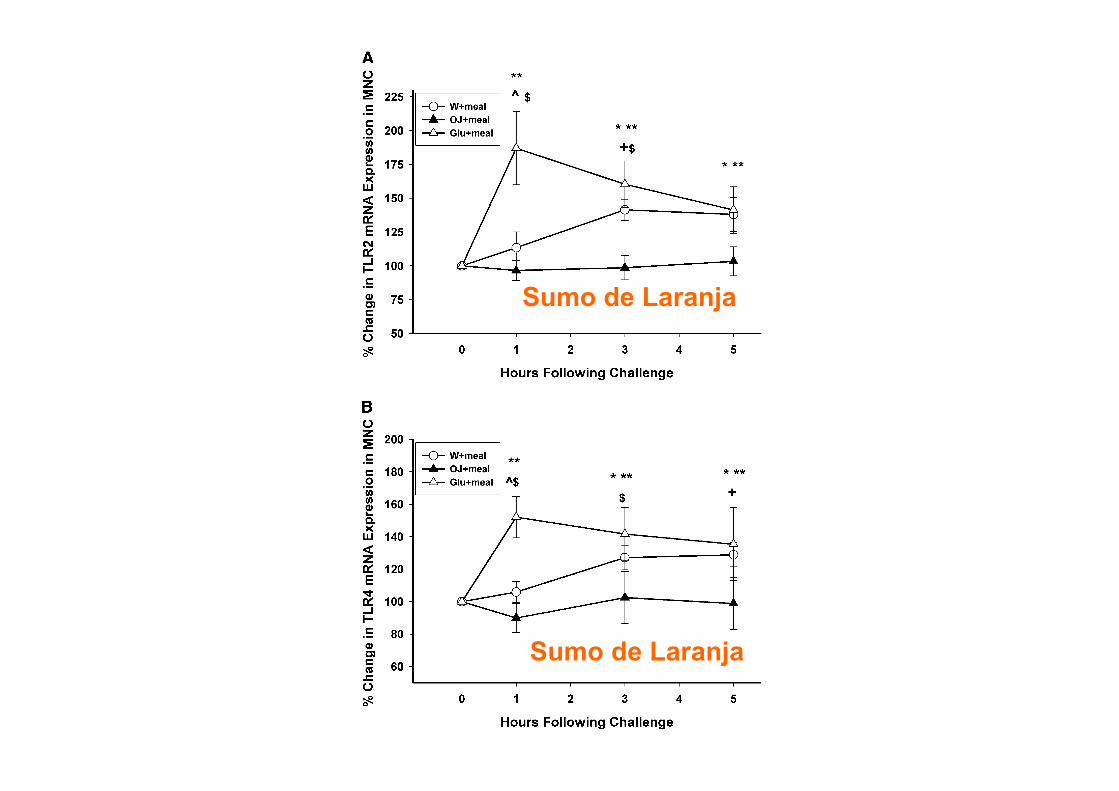
antiinflammatory effects of these flavonoids in the human invivo are required.
We were surprised to find no increase in glucose concen-trations at 1 h after the orange juice intake. Indeed, even whenorange juice was taken with the fast-food meal, there was nochange in glucose concentrations. Although we do not have anydata on blood glucose concentrations between 0 and 60 min, andit is possible that there may have been a peak of glucose duringthis period, it is also quite clear that there was no evidence ofa significant change in blood glucose concentrations after orangejuice intake at 60 min. In contrast, blood glucose concentrationswere still elevated in the groups drinking either glucose or waterwith the meal. We tested the possibility that orange juice mightinterfere with our glucose assay. Our data show that addingorange juice to water, a glucose standard, or plasma did notinterfere with glucose measurement (data not shown). We pre-
viously reported a higher insulin-to-glucose ratio after orangejuice intake compared with that after glucose intake (5). How-ever, in that report, there was a greater increase in glucoseconcentrations after orange juice intake. This difference isprobably the result of the use of recently pasteurized, well-refrigerated orange juice in the current study in contrast to orangejuice from a large can of reconstituted juice from a supermarketthat was used repeatedly. Clearly, more experiments need to bedone to address glucose-insulin relations after orange juice intakeand the possible mechanisms underlying this preliminary ob-servation. It is possible that incretin mechanisms are involved inthe genesis of this phenomenon.
FIGURE 4. Mean (6SE) change in matrix metalloproteinase (MMP)-9messenger RNA (mRNA) expression in mononuclear cells (MNC) (A) andplasma concentration (B) after intake of a 900-kcal high-fat, high-carbohydrate meal and a 300-kcal drink of orange juice (OJ+meal),glucose (Glu+meal), or water (W+meal) in normal subjects. *,**P , 0.05[repeated measures ANOVA (RMANOVA)] compared with baseline valuesafter W+meal, Glu+meal, or OJ+meal, respectively; ^P , 0.05 (2-factorRMANOVA) for comparisons between W+meal and Glu+meal; +,$P , 0.05(2-factor RMANOVA) for comparison between W+meal or Glu+meal andOJ+meal treatments, respectively. P for interaction (treatment · time) =0.032 for MMP-9 mRNA with differences between the groups at 1 and3 h; P for interaction (treatment · time) = 0.028 for plasma MMP-9 withdifferences between the groups at 3 h. n = 10 each.
FIGURE 5. Mean (6SE) change in Toll-like receptor (TLR) 2 expression(A) and TLR4 messenger RNA (mRNA) expression (B) in mononuclearcells (MNC) after intake of a 900-kcal high-fat, high-carbohydrate mealand a 300-kcal drink of orange juice (OJ+meal), glucose (Glu+meal), orwater (W+meal) in normal subjects. *,**P , 0.05 [repeated measuresANOVA (RMANOVA)] compared with baseline values after W+meal, Glu+meal, or OJ+meal, respectively; ^P , 0.05 (2-factor RMANOVA) forcomparisons between W+meal and Glu+meal; +,$P , 0.05 (2-factorRMANOVA) for comparison between W+meal or Glu+meal and OJ+mealtreatments, respectively. P for interaction (treatment · time) = 0.034 forTLR2 mRNA with differences between the groups at 1 and 3 h; P forinteraction (treatment · time) = 0.027 for TLR4 mRNA with differencesbetween the groups at 1, 3, and 5 h. n = 10 each.
946 GHANIM ET AL
at Lund University Libraries on August 20, 2010
ww
w.ajcn.org
Dow
nloaded from
Sumo de Laranja
Sumo de Laranja
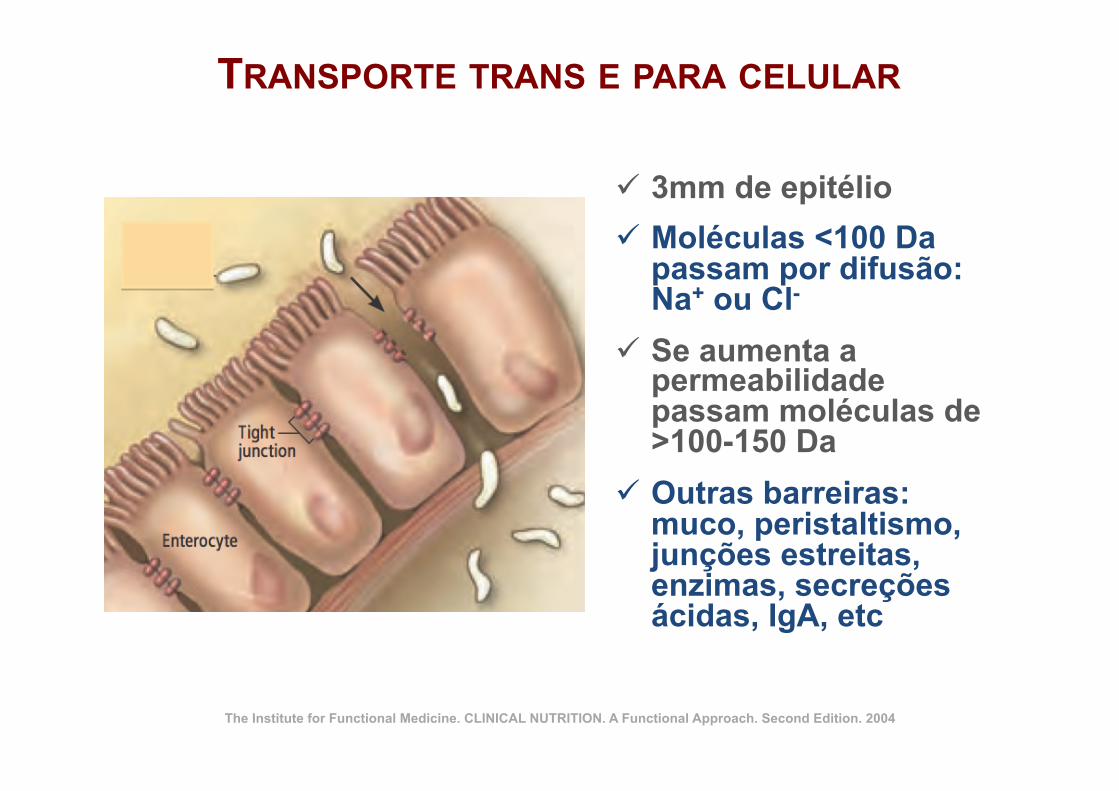
TRANSPORTE TRANS E PARA CELULAR
ü 3mm de epitélio ü Moléculas <100 Da
passam por difusão: Na+ ou Cl-
ü Se aumenta a permeabilidade passam moléculas de >100-150 Da
ü Outras barreiras: muco, peristaltismo, junções estreitas, enzimas, secreções ácidas, IgA, etc
The Institute for Functional Medicine. CLINICAL NUTRITION. A Functional Approach. Second Edition. 2004
CAUSAS DA HIPERPERMEABILIDADE INTESTINAL!
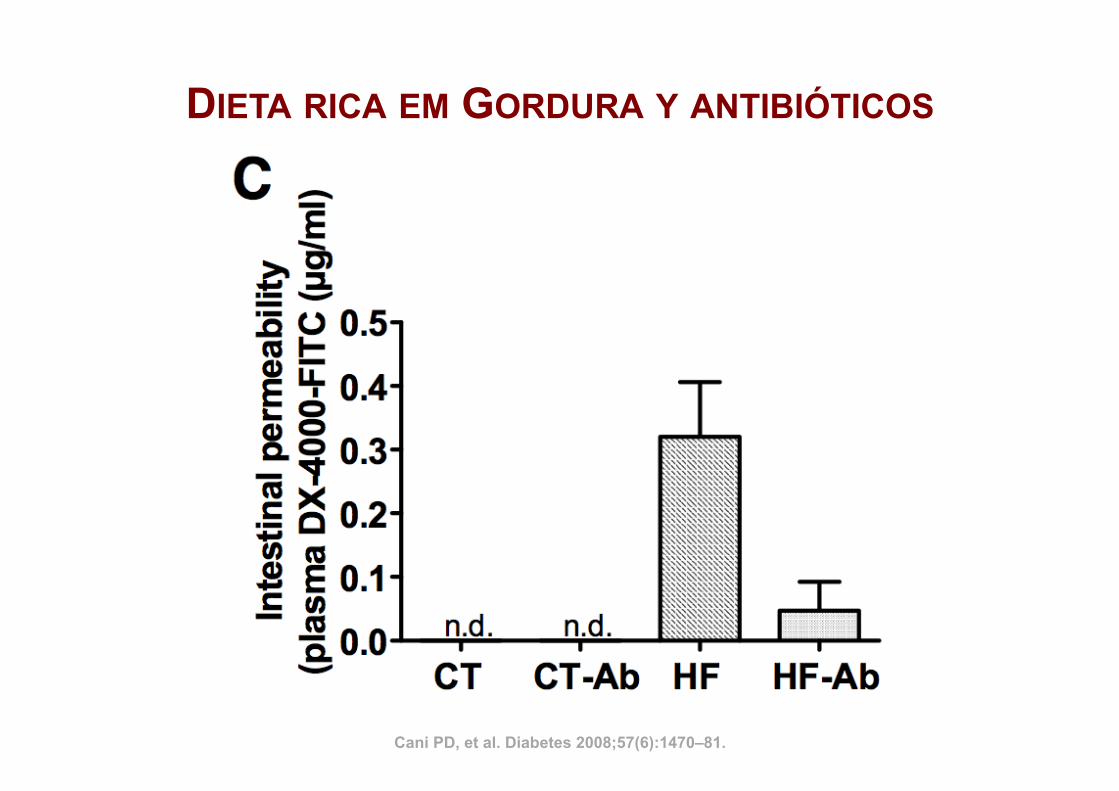
Cani PD, et al. Diabetes 2008;57(6):1470–81.
DIETA RICA EM GORDURA Y ANTIBIÓTICOS
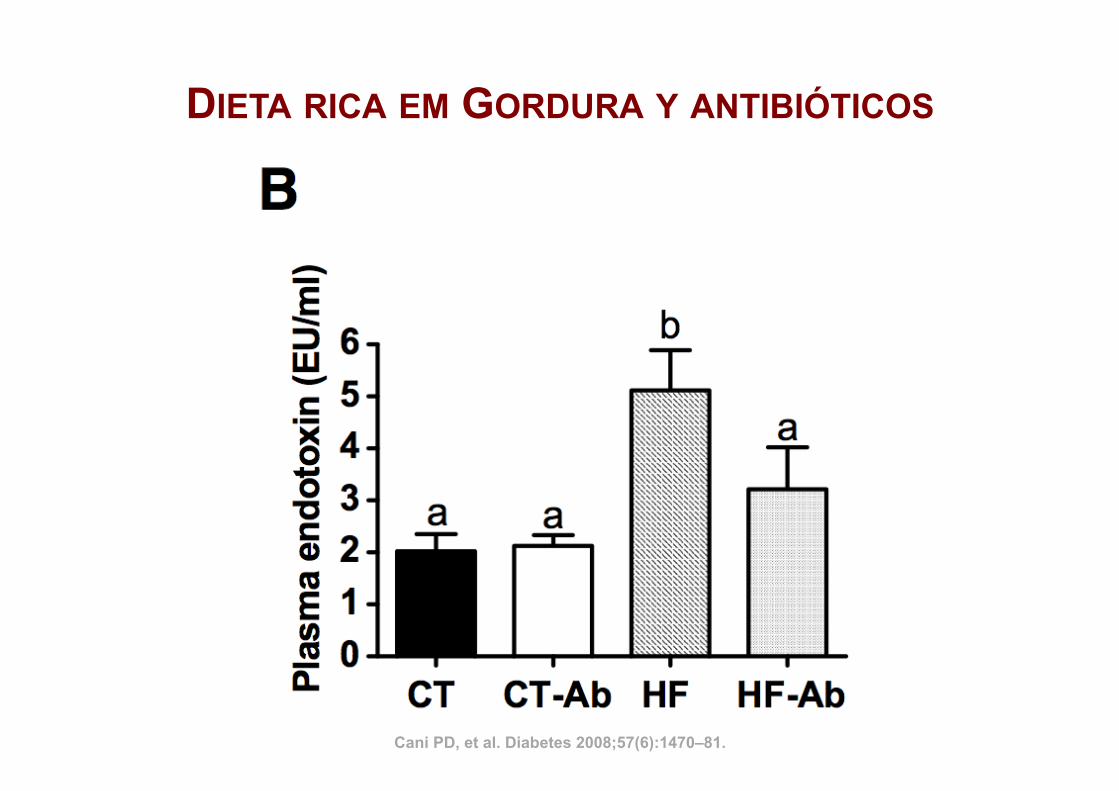
DIETA RICA EM GORDURA Y ANTIBIÓTICOS
Cani PD, et al. Diabetes 2008;57(6):1470–81.
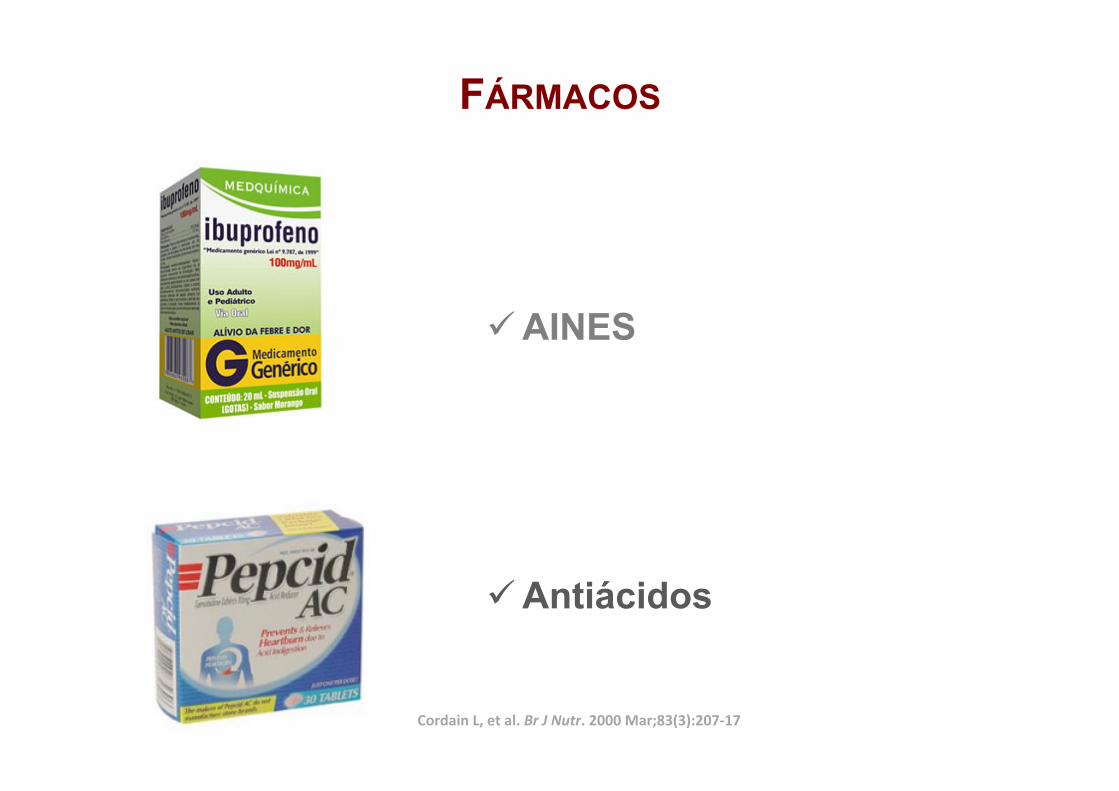
FÁRMACOS
ü AINES
ü Antiácidos
Cordain L, et al. Br J Nutr. 2000 Mar;83(3):207-‐17
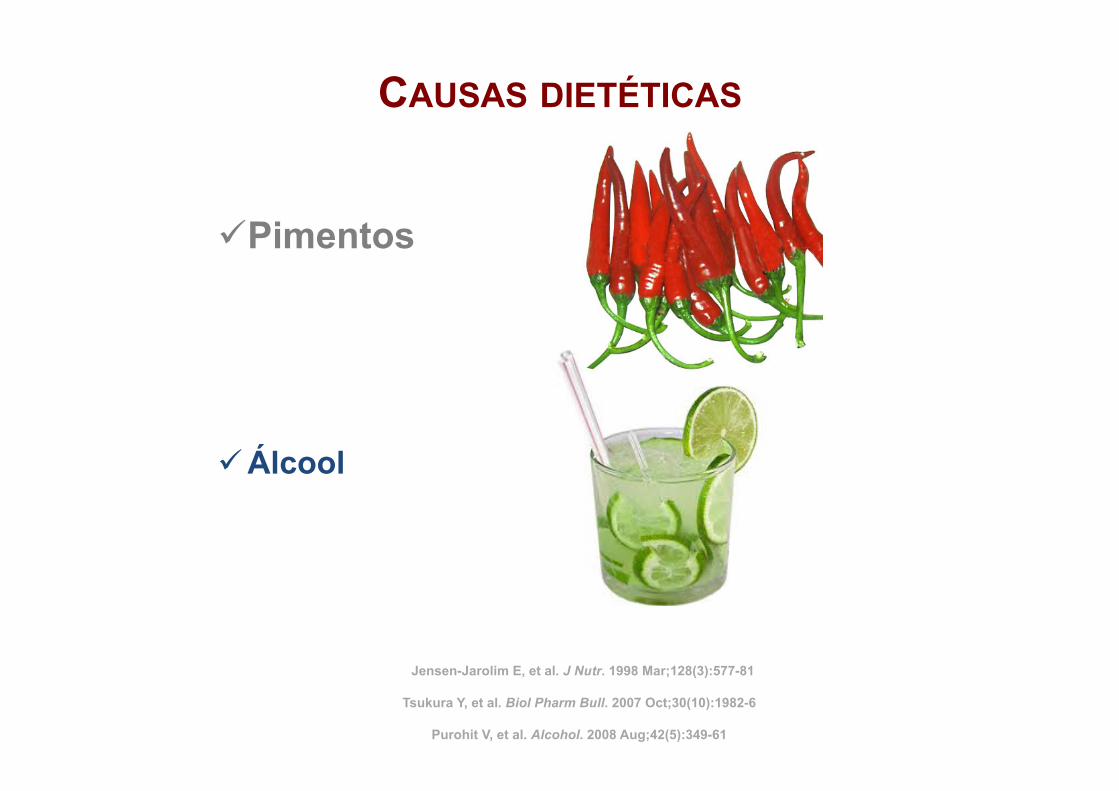
ü Pimentos
ü Álcool
CAUSAS DIETÉTICAS
Jensen-Jarolim E, et al. J Nutr. 1998 Mar;128(3):577-81
Tsukura Y, et al. Biol Pharm Bull. 2007 Oct;30(10):1982-6
Purohit V, et al. Alcohol. 2008 Aug;42(5):349-61
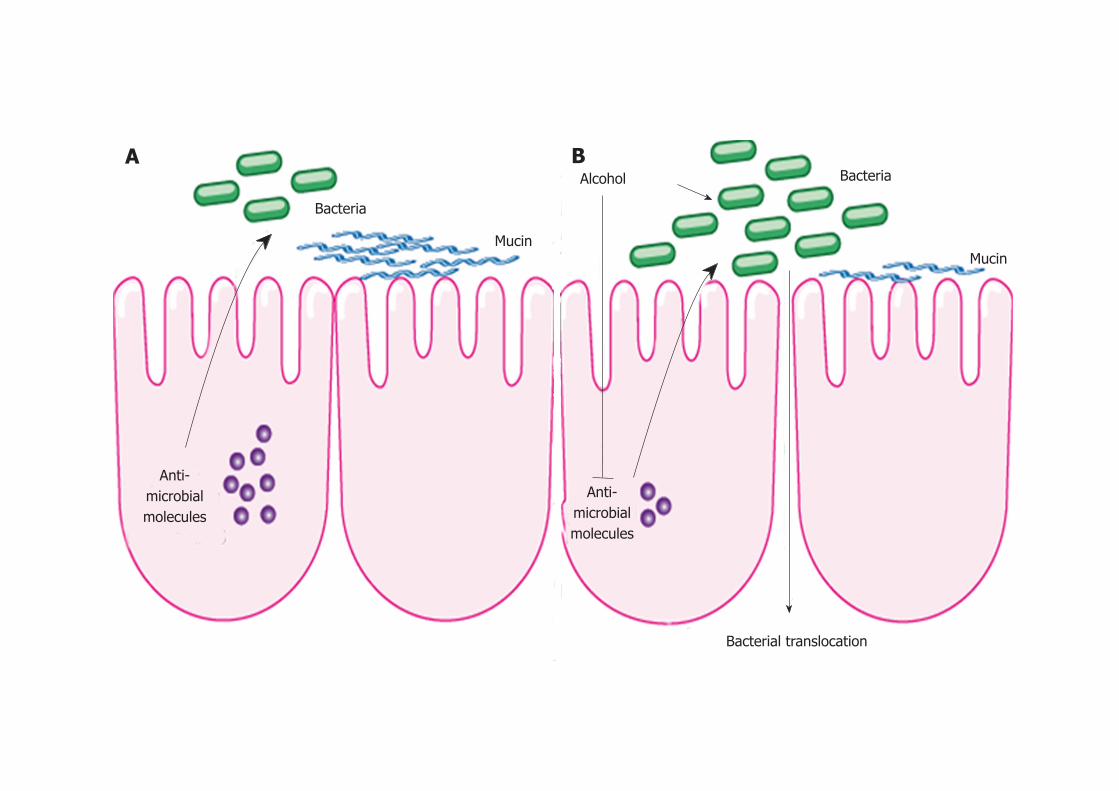
April 27, 2012|Volume 4|Issue 4|WJH|www.wjgnet.com 114
the treatment with prebiotics partially restored Reg3g protein levels, while mitigating bacterial overgrowth and attenuating the severity of alcoholic steatohepatitis[76]76]].
Although changes in the enteric microbial composi-tion has not been studied in patients with alcohol abuse, intestinal dysbiosis as a consequence of chronic alcohol consumption is speculated to be a possible precursor to bacterial translocation and a contributing factor to the initiation and progression of liver disease. It is likely that changes to the microbiota modulate mucosal barrier function and antimicrobial regulators within the host in-testinal epithelium.
ARE ANTIBIOTICS, PROBIOTICS, PREBIOTICS OR SYNBIOTICS USEFUL IN ALCOHOLIC LIVER DISEASE?The beneficial effect of antibiotics on alcohol-induced liver disease in animal models has been discussed above. In patients, antibiotics have mostly been used to de-contaminate the intestine for the treatment of hepatic encephalopathy in end-stage liver disease. Antibiotic treatment for up to 6 mo has also been associated with improvement in liver function and Child-Pugh classifica-tion of patients with alcoholic cirrhosis[71]71]]. Antibiotic-induced changes in the composition of the gastrointesti-nal microflora can influence the susceptibility of the host to specific enteric pathogens, including the induction of antibiotic resistance to other microorganisms. Antibiotics disturb the normal mechanisms of microbial community
regulation, compromising the mucosal innate immune defense mechanism, which can result in pathogen coloni-zation and antibiotic resistance[85].
Probiotics are dietary supplements of live microbes consumed by the host that benefit the health, and in-cludes the microorganisms Lactobacillus and Bifidobacteri-um[86]. These microbes are thought to enhance production of anti-inflammatory cytokines, stimulate the secretion of antibacterial proteins, and alter the intestinal micro-flora, ultimately reducing production and translocation of endotoxin[87]. Pretreatment of animals with Lactobacillus decreases plasma LPS and reduces the severity of liver in-jury. As discussed above, Lactobacillus was depleted after 3 wk of intragastric alcohol administration in mice[75]75]]. Feed-ing a gram-positive probiotic lactobacillus strain (species GG) with concomitant displacement of gram-negative bacteria also protected rats from ethanol-induced liver injury with a decrease in systemic endotoxin levels[80,81]80,81],81]81]]. Thus, a possible mechanism for preventing ALD is reversing the enteric dysbiosis associated with alcohol abuse.
There have been multiple studies examining the ben-efits of probiotics in patients with ALD. Treatment of 20 patients with alcoholic liver cirrhosis with a probiotic mixture containing Streptococcus thermophilus, Bifidobacterium breve, Bifidobacterium longum, Bifidobacterium infantis, Lactoba-cillus acidophilus, Lactobacillus plantarum, Lactobacillus casei and Lactobacillus bulgaricus (VSL#3) for up to 4 mo, results in decreased plasma markers for oxidative stress and mark-edly reduced liver enzymes[88]. A randomized prospective trial demonstrated that probiotic treatment (Bifidobacterium
Bacteria
Mucin
Alcohol Bacteria
Mucin
Anti-microbial molecules
Bacterial translocation
Anti-microbial molecules
Figure 1 Intestinal changes following alcohol administration. A: In health, antimicrobial molecules as part of the innate immune response are secreted by intes-tinal epithelial cells and kill enteric bacteria. B: Alcohol suppresses the expression of these molecules resulting in intestinal bacterial overgrowth and dysbiosis. This might contribute to bacterial translocation observed after alcohol. Alcohol might also exert a direct effect on the intestinal microflora.
A B
Yan AW et al . Microbiome in alcoholic liver disease
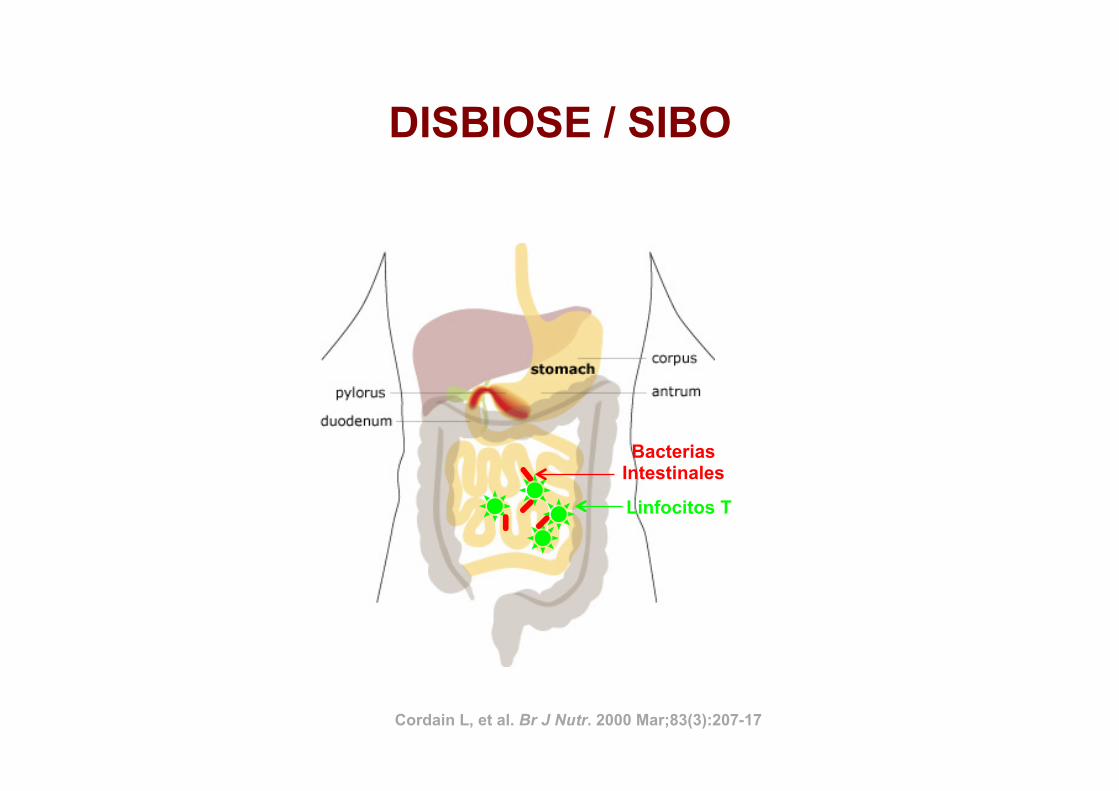
DISBIOSE / SIBO
Linfocitos T
Bacterias Intestinales
Cordain L, et al. Br J Nutr. 2000 Mar;83(3):207-17
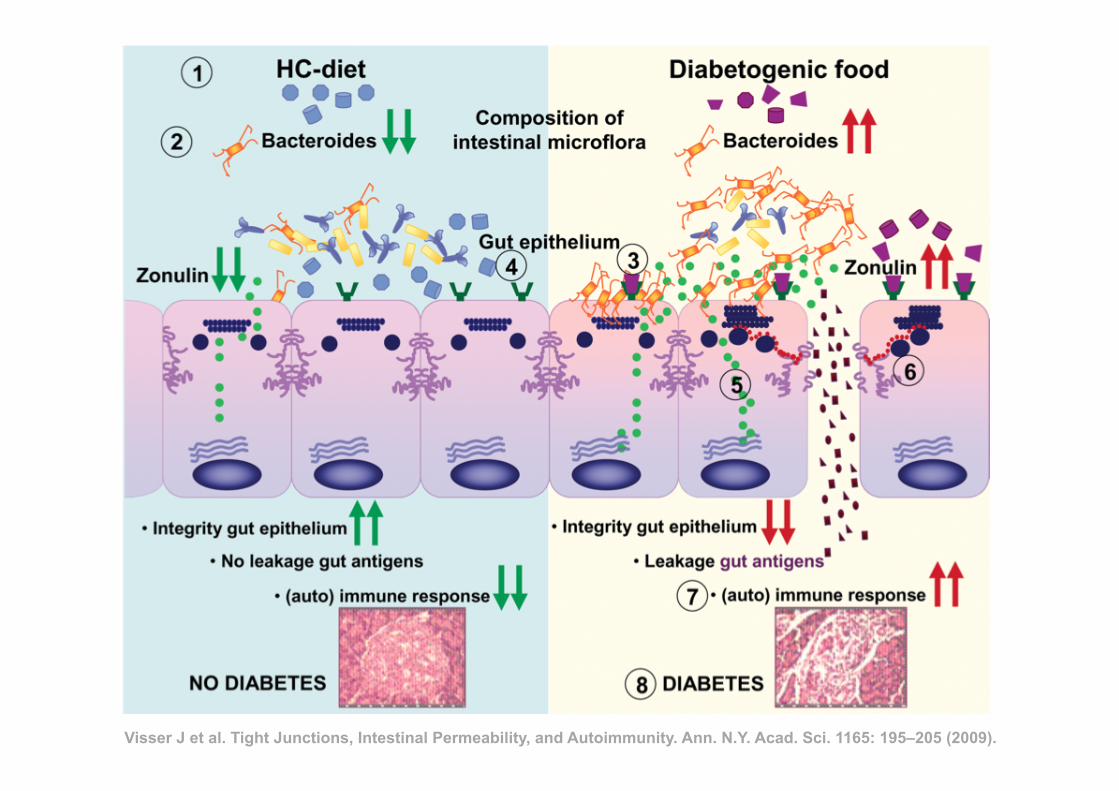
Visser J et al. Tight Junctions, Intestinal Permeability, and Autoimmunity. Ann. N.Y. Acad. Sci. 1165: 195–205 (2009).
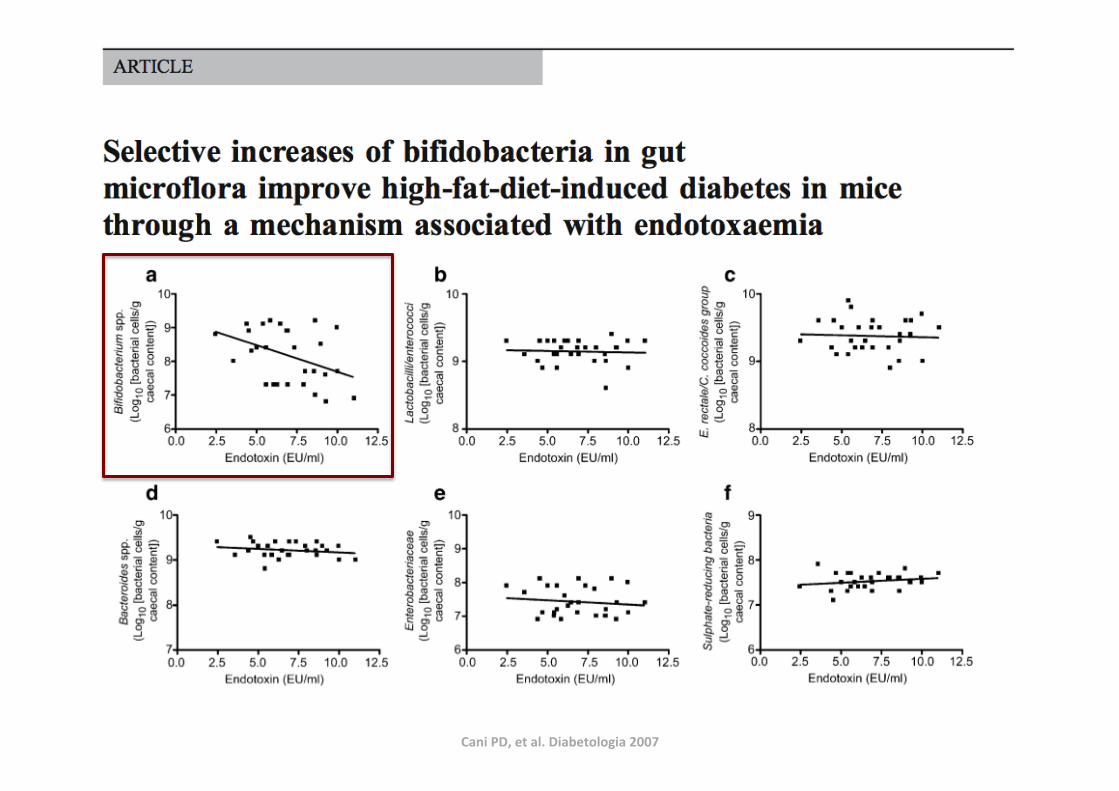
Cani PD, et al. Diabetologia 2007
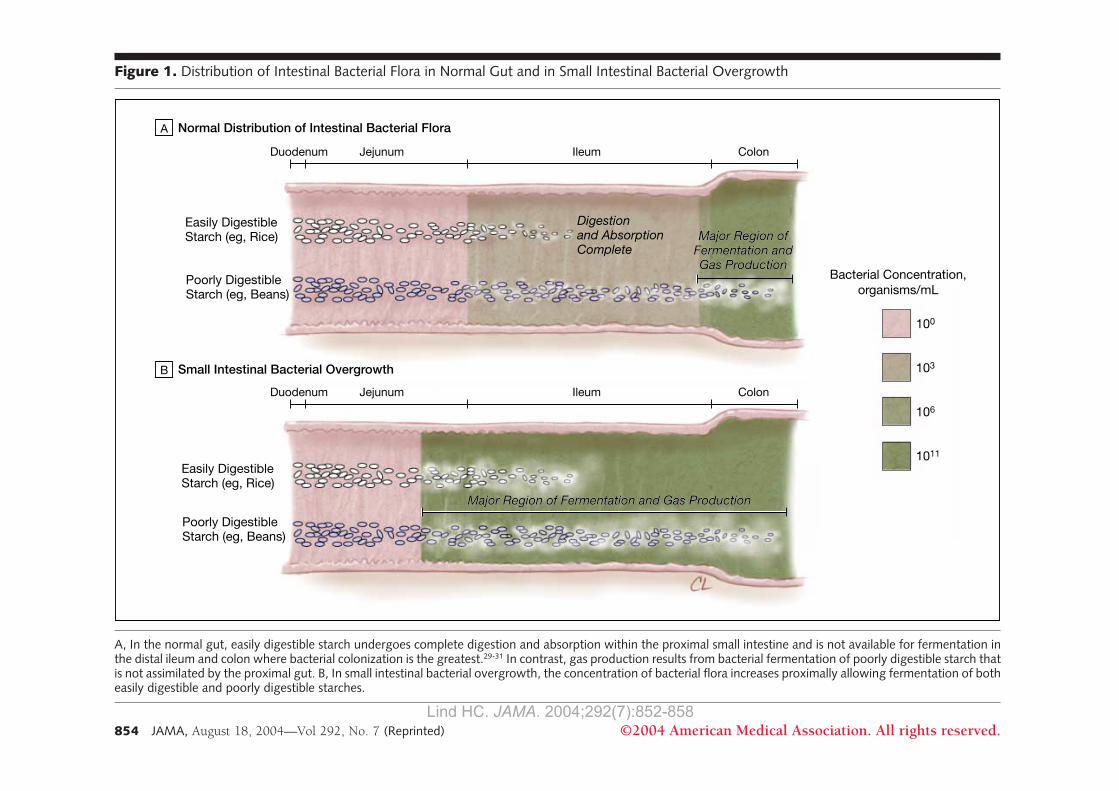
(SE) normalization of global symp-toms within 1 week of randomizationwas 11.0% (3.7%) for placebo-treatedpatients, 36.7% (6.1%) for antibiotic-treated patients who did not achievebacterial eradication, and 75.0%(6.4%) for antibiotic-treated patientswho also achieved bacterial eradica-tion (P!.001, 1-way analysis ofvariance). This graded response isconsistent with an antibiotic-sensitivepathophysiology of IBS. A similarstudy consistency was demonstratedby a double-blind, placebo-controlledstudy that showed metronidazole tobe superior to placebo in relievingsymptoms in IBS patients,36 whileanother recent report by Nucera etal37 showed that 75% of 200 IBSpatients have an abnormal lactulose-glucose breath test result consistentwith the presence of SIBO.
The Type of Gas May Contributeto ConstipationIf SIBO provides a unifying frame-work for understanding IBS patients,how does this account for the possibil-ity of both constipation and diarrhea?The type of gas produced by gut bac-teria may be an important factor. In 2studies by Pimentel et al,35,38 excretionof methane alone was only found inconstipation-predominant IBS pa-tients. Methane as a gas slows intesti-nal transit39 and reduces postprandialplasma level of serotonin,40 the media-tor of the peristaltic reflex.41 Methaneexcretion has been found in 65% of chil-dren with encopresis compared with15% of the control patients.42 A role forgut bacteria as one of the factors in con-stipation is further suggested by theobservation in 8 patients with chronicidiopathic constipation that stool fre-
quency and consistency improved af-ter a 14-day course of antibiotics.43
Abnormal Small Intestinal MotilityMay Explain SIBO in IBSBetween meals, the interdigestive mo-tility of the upper gastrointestinal tractis characterized by a cyclical pattern ofactivity known as the major migratingcomplex (MMC).44 The MMC in-cludes a period of powerful, lumen-obliterating contractions that propa-gates from the stomach or duodenumdistally to the terminal ileum (phase IIIof MMC or the intestinal housekeeperwave).44 When compared with record-ings from healthy controls, the fre-quency of these intestinal house-keeper waves was significantly reducedin IBS patients,45 which may also ex-plain the abnormal gas retention thatis observed in IBS patients.18 The im-
Figure 1. Distribution of Intestinal Bacterial Flora in Normal Gut and in Small Intestinal Bacterial Overgrowth
Major Region ofFermentation andGas Production
Easily DigestibleStarch (eg, Rice)
Digestionand AbsorptionComplete
Major Region ofFermentation andGas Production
Normal Distribution of Intestinal Bacterial FloraA
Small Intestinal Bacterial OvergrowthB
Poorly DigestibleStarch (eg, Beans)
Easily DigestibleStarch (eg, Rice)
Poorly DigestibleStarch (eg, Beans)
100
Bacterial Concentration,organisms/mL
103
106
1011
Duodenum IleumJejunum Colon
Duodenum IleumJejunum Colon
Major Region of Fermentation and Gas ProductionMajor Region of Fermentation and Gas Production
A, In the normal gut, easily digestible starch undergoes complete digestion and absorption within the proximal small intestine and is not available for fermentation inthe distal ileum and colon where bacterial colonization is the greatest.29-31 In contrast, gas production results from bacterial fermentation of poorly digestible starch thatis not assimilated by the proximal gut. B, In small intestinal bacterial overgrowth, the concentration of bacterial flora increases proximally allowing fermentation of botheasily digestible and poorly digestible starches.
SMALL INTESTINAL BACTERIAL OVERGROWTH
854 JAMA, August 18, 2004—Vol 292, No. 7 (Reprinted) ©2004 American Medical Association. All rights reserved.
at Capes Consortia on June 29, 2009 www.jama.comDownloaded from
Lind HC. JAMA. 2004;292(7):852-858
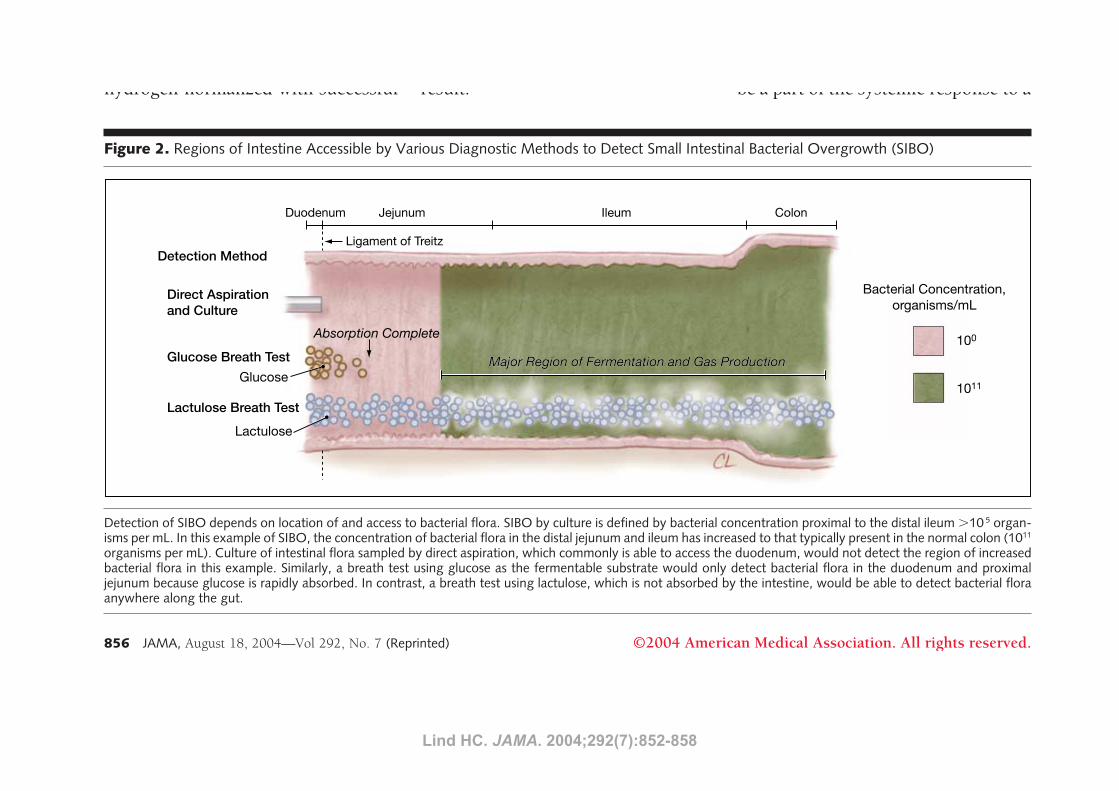
4 (12%) of 33 IBS patients had morethan 100000 colony-forming units ofbacteria of colonic origin in the duo-denum. While the prevalence is con-siderably lower than that detected bylactulose breath testing,34,35,37 this studyprovided direct confirmation of the ex-pansion of colonic bacteria proxi-mally all the way to the duodenum insome IBS patients. Using glucose in-stead of lactulose as the substrate for abreath test is similarly limited,80 sinceglucose is rapidly absorbed with the fer-mentable substrate removed from thelumen of the upper small intestine. Incontrast, since lactulose is poorly di-gestible, this fermentable substrate doesremain available in the lumen for fer-mentation by gut bacteria anywherealong the gut (FIGURE 2).
Interpreting a Premature Riseof Breath HydrogenA premature rise of breath hydrogen isa feature of both bacterial overgrowthand excessively rapid transit. How-ever, 2 observations point away fromrapid transit as the primary explana-tion for the findings by Pimentel etal.34,35 First, the time-to-rise of breathhydrogen normalized with successful
eradication of SIBO by antibiotics in theIBS patients.35 Second, the abnormal gasprofiles of the constipation-predomi-nant IBS (slow transit) patient over-lapped with that of the diarrhea-predominant IBS patients (fast transit).
Role of Sugar Intolerance in IBSThere has been recent interest in fruc-tose intolerance as a possible explana-tion for unexplained gastrointestinalsymptoms.20 Interestingly, there is asimilar pattern of malabsorption in IBSpatients across a number of tested fer-mentable substrates.81 For many pa-tients, the association between sugar in-tolerance and IBS may be related tobacterial overgrowth rather than truesugar intolerance. Nucera et al37 founda high rate of disappearance of malab-sorption to lactose (86.6%), fructose(97.5%), and sorbitol (90.9%) onceSIBO was eradicated. Similarly, Pimen-tel et al reported that while the num-ber of IBS patients with true lactose in-tolerance was low (16%), a much highernumber (58%) had an abnormal lac-tose breath test result and there was asignificant correlation between lactu-lose (SIBO) and lactose breath testresult.38
Activated Immunity May ExplainAltered Brain-Gut Interaction andAutonomic Dysfunction in IBSAbnormalities of autonomic nervoussystem function, including disturbedsleep,82 have been described in pa-tients with IBS.25 Using SIBO as a frame-work for understanding IBS, these neu-ral changes can be understood on thebasis of 2-way triggered communica-tions between the immune system andthe autonomic nervous system.83 An ex-ample of this interaction is the defen-sive sympathetic response to stressinvolving immune activation of norad-renergic neurons.84 Using a variety ofbrain imaging techniques, IBS pa-tients have been observed to exhibit adifferent pattern of brain response tovisceral stimuli than healthy controlsubjects.24 Since inflammation in ani-mal models leads to multiple changesin the brain, including activation of neu-rons as documented by Fos expres-sion,84,85 alteration of hypothalamic-pituitary-adrenal axis includingelevation of corticotropin-releasingfactor (CRF) concentration,86 andchange in neurotransmitter levels,87
such altered brain-gut interactions maybe a part of the systemic response to a
Figure 2. Regions of Intestine Accessible by Various Diagnostic Methods to Detect Small Intestinal Bacterial Overgrowth (SIBO)
Detection Method
Direct Aspirationand Culture
Glucose Breath TestGlucose
Lactulose
Lactulose Breath Test
Absorption Complete
Ligament of Treitz
100
Bacterial Concentration,organisms/mL
1011
Duodenum IleumJejunum Colon
Major Region of Fermentation and Gas ProductionMajor Region of Fermentation and Gas Production
Detection of SIBO depends on location of and access to bacterial flora. SIBO by culture is defined by bacterial concentration proximal to the distal ileum !10 5 organ-isms per mL. In this example of SIBO, the concentration of bacterial flora in the distal jejunum and ileum has increased to that typically present in the normal colon (1011
organisms per mL). Culture of intestinal flora sampled by direct aspiration, which commonly is able to access the duodenum, would not detect the region of increasedbacterial flora in this example. Similarly, a breath test using glucose as the fermentable substrate would only detect bacterial flora in the duodenum and proximaljejunum because glucose is rapidly absorbed. In contrast, a breath test using lactulose, which is not absorbed by the intestine, would be able to detect bacterial floraanywhere along the gut.
SMALL INTESTINAL BACTERIAL OVERGROWTH
856 JAMA, August 18, 2004—Vol 292, No. 7 (Reprinted) ©2004 American Medical Association. All rights reserved.
at Capes Consortia on June 29, 2009 www.jama.comDownloaded from Lind HC. JAMA. 2004;292(7):852-858
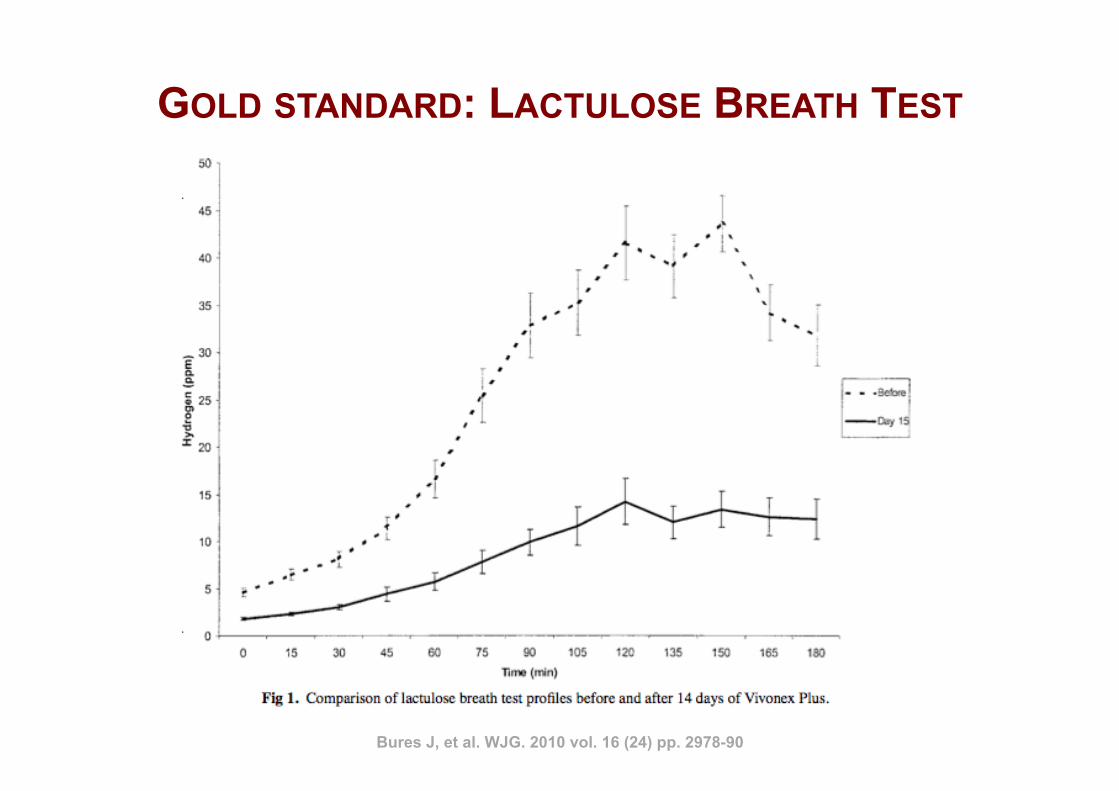
GOLD STANDARD: LACTULOSE BREATH TEST
Bures J, et al. WJG. 2010 vol. 16 (24) pp. 2978-90
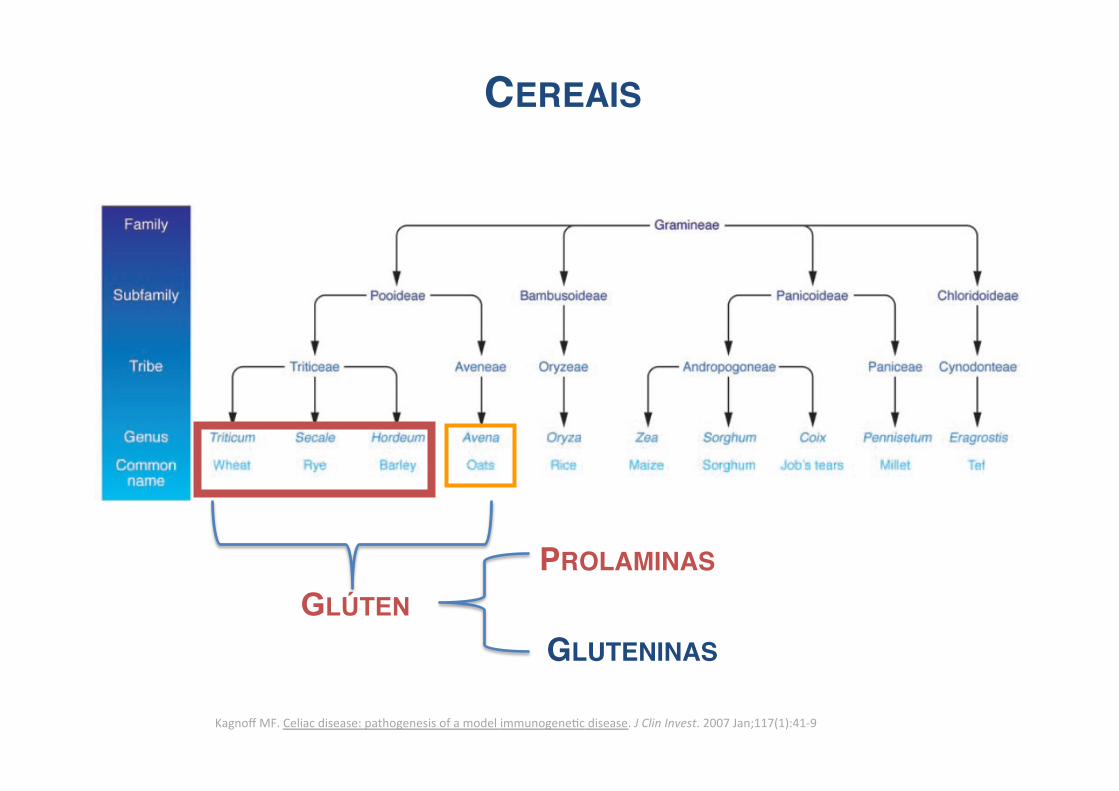
GLÚTEN
Kagnoff MF. Celiac disease: pathogenesis of a model immunogeneNc disease. J Clin Invest. 2007 Jan;117(1):41-‐9
CEREAIS!
PROLAMINAS!
GLUTENINAS!
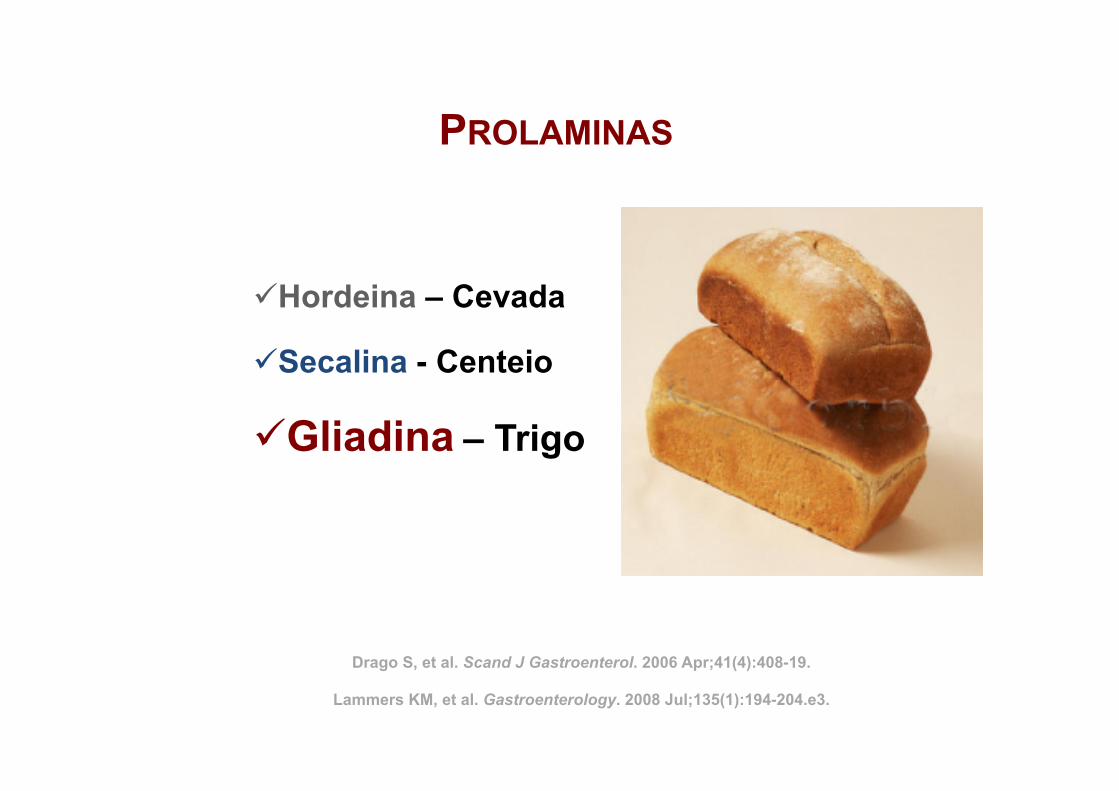
ü Hordeina – Cevada
ü Secalina - Centeio
ü Gliadina – Trigo
PROLAMINAS
Drago S, et al. Scand J Gastroenterol. 2006 Apr;41(4):408-19.
Lammers KM, et al. Gastroenterology. 2008 Jul;135(1):194-204.e3.
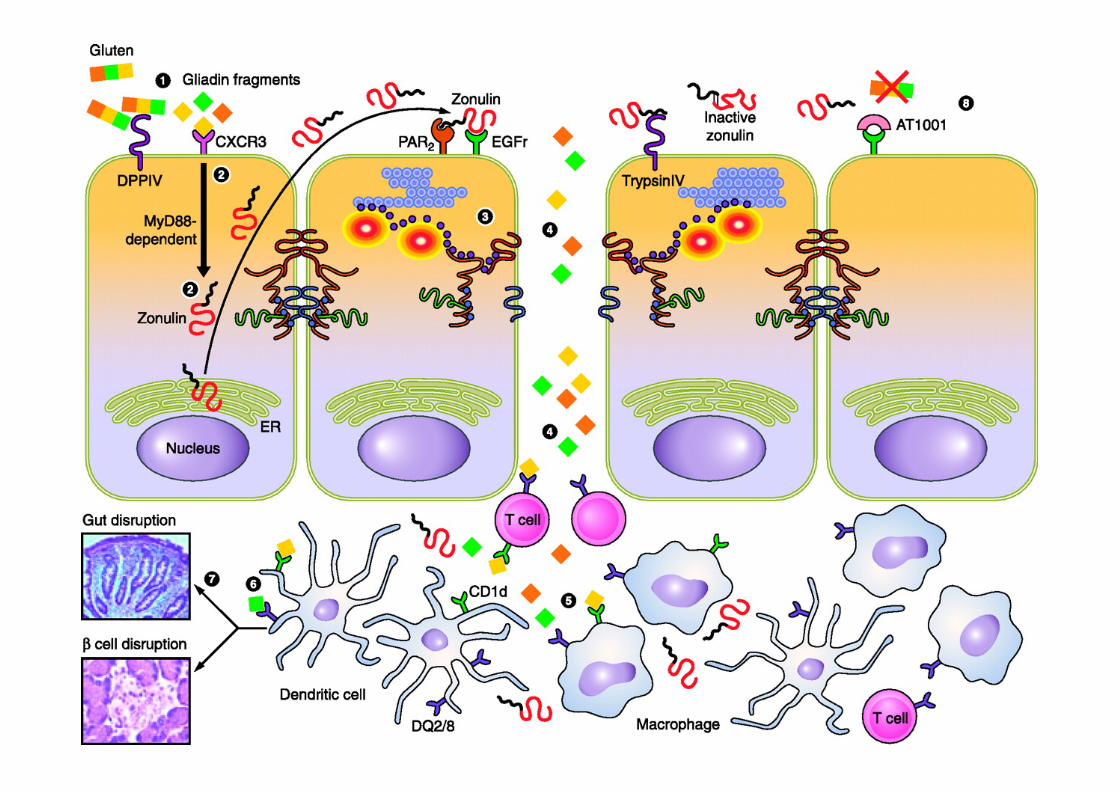
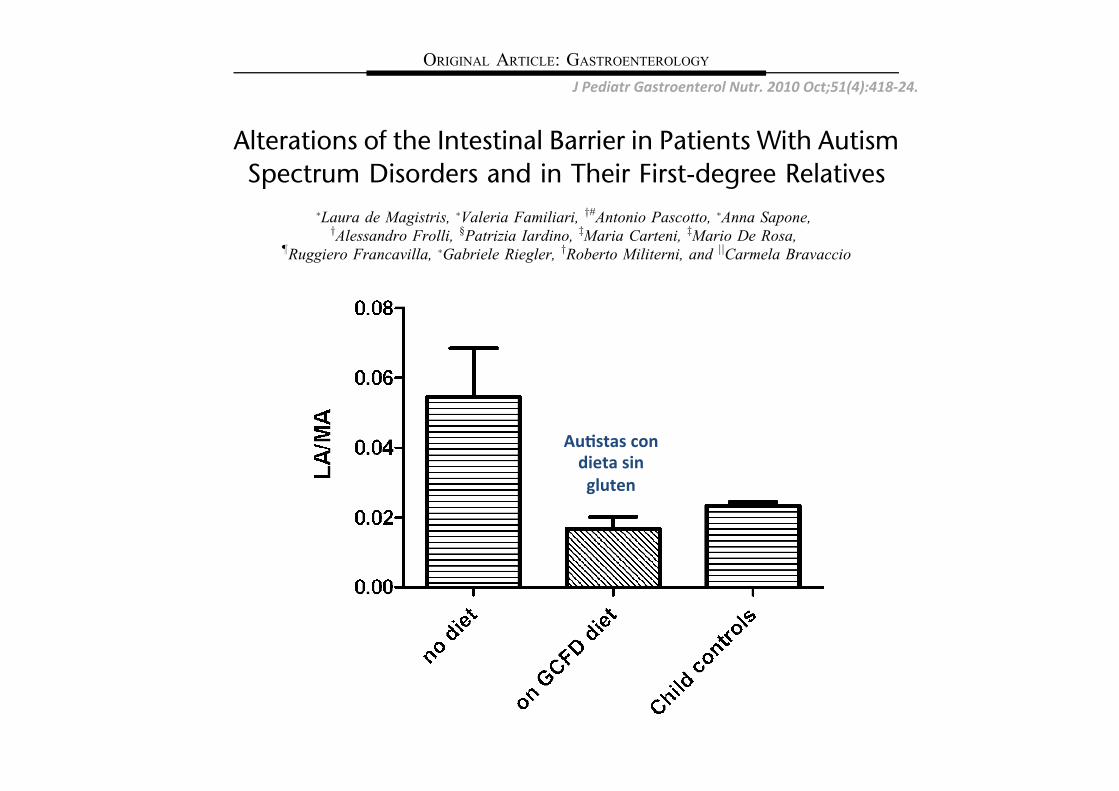
Copyright 2010 by ESPGHAN and NASPGHAN. Unauthorized reproduction of this article is prohibited.
Alterations of the Intestinal Barrier in Patients With AutismSpectrum Disorders and in Their First-degree Relatives
!Laura de Magistris, !Valeria Familiari, y#Antonio Pascotto, !Anna Sapone,yAlessandro Frolli, §Patrizia Iardino, zMaria Carteni, zMario De Rosa,
!Ruggiero Francavilla, !Gabriele Riegler, yRoberto Militerni, and jjCarmela Bravaccio
ABSTRACT
Objectives: Intestinal permeability (IPT) was investigated in patients withautism as well as in their first-degree relatives to investigate leaky guthypothesis. Faecal calprotectin (FC) was also measured in patients withautism, either with or without gastrointestinal symptoms, and in their first-degree relatives.Patients and Methods: IPT results, assessed by means of the lactulose/mannitol test, were compared with adult and child controls and with FCvalues.Results: A high percentage of abnormal IPT values were found amongpatients with autism (36.7%) and their relatives (21.2%) compared withnormal subjects (4.8%). Patients with autism on a reported gluten-casein–free diet had significantly lower IPT values compared with those who wereon an unrestricted diet and controls. Gastrointestinal symptoms were presentin 46.7% of children with autism: constipation (45.5%), diarrhoea (34.1%),and others (alternating diarrhoea/constipation, abdominal pain, etc: 15.9%).FC was elevated in 24.4% of patients with autism and in 11.6% of theirrelatives; it was not, however, correlated with abnormal IPT values.Conclusions: The results obtained support the leaky gut hypothesis andindicate that measuring IPT could help to identify a subgroup of patientswith autism who could benefit from a gluten-free diet. The IPT alterationsfound in first-degree relatives suggest the presence of an intestinal (tight-junction linked) hereditary factor in the families of subjects with autism.
Key Words: autism, calprotectin, first-degree relatives, gastrointestinal
symptoms, intestinal permeability
(JPGN 2010;51: 418–424)
I t was hypothesised that primary gastrointestinal (GI) pathologiesand intestinal barrier defects could play an important role in the
triggering and clinical expression of some childhood developmentaldisorders, including autism (1–4). Autism is a complex spectrum ofclinically heterogeneous neurodevelopmental disorders now com-monly known as autism spectrum disorders (ASD). This disabilityhas a variable phenotype, each probably involving different aetio-pathogenetic aspects. A variety of GI dysfunctions and symptomshave been reported frequently in children with ASD. A recentconsensus conference report (5) states that more studies are requiredto establish the prevalence of GI abnormalities (eg, the existence ofspecific GI disturbances such as abnormal GI permeability) insubjects with ASD. GI symptoms (6,7) have been reported inchildren with ASD and in adults with other psychiatric diseases,such as schizophrenia (8,9).
Ileocolonic lymphoid nodular hyperplasia and mild acute andchronic inflammation of the colon-rectum, small bowel, andstomach have been reported in children with ASD. Although someof the reported findings are still controversial (3,10–12), it isgenerally assumed that it is a common finding (13). Increasedintestinal permeability (IPT) has also been reported (14) as repre-senting a possible link in the chain of the so-called leaky guthypothesis (4).
Although the possible mechanisms are unknown, it has longbeen suggested that some intestinal lesions that increase IPT toexogenous peptides of dietary origin may lead to the disruption ofneuroregulatory mechanisms and normal brain development (enter-ocolonic encephalopathy) (15). Previously, Wakefield et al (10)found that ileocolonic (ileum more predominant) lymphoid nodularhyperplasia was highly prevalent among children with ASD com-pared with controls; however, this endoscopic finding was notaccompanied by inflammation histologically.
The question then arises as to whether it is possible toidentify subgroups—that is, either gut inflammation or abnormalIPT, or both of them, in children with ASD as the first steps towardsthe design of efficacious therapeutical interventions. IPT, asmeasured by the urinary excretion of metabolically inert sugarsafter oral dosing, is a surrogate marker of mucosal integrity (16) andof gut barrier function. It has recently proved to be involved in theaetiopathogenesis of both intestinal and extraintestinal autoimmunediseases (eg, Crohn disease, coeliac disease, type 1 diabetes melli-tus) (17–20). It was reported that approximately half of a smallcohort of children with ASD without GI symptoms had abnormallyhigh IPT (14), whereas, more recently, no alterations of IPT havebeen published (21). The precise role or frequency of increasedparacellular permeability in children with ASD, as well as itscorrelation with the various clinical and behavioural aspects ofASD, remain unclear (5).
Received November 11, 2009; accepted March 9, 2010.From the !Department Magrassi-Lanzara, Gastroenterology, theyDepartment of Psychiatry, Neuropsychiatry, Dermatovenereology,the zDepartment of Experimental Medicine, the §Department of Labora-tory Medicine, Second University of Naples, the jjDepartment of Pae-diatrics, Federico II University of Naples, the !Clinica Pediatrica ‘‘BTrambusti,’’ University of Bari, and the #Fondazione Istituto Antoniano,Naples, Italy.
Address correspondence and reprint requests to Laura de Magistris, PhD,Second University of Naples, Department Magrassi-Lanzara, Gastro-enterology, Piazza Miraglia 1-80132 Napoli, Italy (e-mail: [email protected]).
This research was supported in part with a grant from the DepartmentMagrassi-Lanzara, Second University of Naples, Italy.
The present research was presented in poster form at Digestive DiseaseWeek 2007 and 2008.
The authors report no conflicts of interest.Copyright # 2010 by European Society for Pediatric Gastroenterology,
Hepatology, and Nutrition and North American Society for PediatricGastroenterology, Hepatology, and Nutrition
DOI: 10.1097/MPG.0b013e3181dcc4a5
ORIGINAL ARTICLE: GASTROENTEROLOGY
418 JPGN " Volume 51, Number 4, October 2010
J Pediatr Gastroenterol Nutr. 2010 Oct;51(4):418-‐24.
Copyright 2010 by ESPGHAN and NASPGHAN. Unauthorized reproduction of this article is prohibited.
Rating Scale questionnaires showed no significant correlations(F! 1.708; F! 0.595; F! 1.464).
The values of FC were abnormal in 22 of 90 (24.6%; range102.5–387.4 mg/g) of patients with ASD and 17 of 146 (11.7%;range 108.7–375.7 mg/g) of relatives; that is, these subjects showedFC values higher than normal (ie, FC >100 mg/g). In Table 3 themeans of the pathological values in the 2 groups are given to showhow their entity could account for a condition of mild inflammation(30). The upper limit of the normality range (ie, FC >100 mg/g) iscommonly used in the diagnostic procedure and is in agreementwith our personal diagnostic laboratory experience. Because ofbudget restrictions, FC was investigated only in those controls(adult or child) who showed abnormal IPT values; none of themhad FC values above the normal range.
There was no correlation between the IPT and FC values; thelinear correlation analysis gave the results r! 0.09 (ASD) andr! 0.23 (relatives) (Spearman test).
Serological parameters to exclude coeliac disease arereported in Table 4. The investigated patients with ASD werenegative for tTG, EMA, and AGA IgA, whereas 2 of them showedhigh AGA IgG values. These 2 high values (both>100 U/mL) wereassociated with high FC values (200 and 248 mg/g) and normal IPT(0.012 and 0.008). Familial and personal anamneses were both freefrom any indication of food intolerances.
First-degree relatives who showed abnormal IPT were firstscreened for the presence of HLA DQ2/DQ8 alleles, which gavepositive results in 10 of 31 (32.3%) cases; 3 had DQ8 and 7 hadDQ2. FC was abnormal in only 2 of them. Although no otherserological signs of coeliac disease were found (Table 4), thesubjects were invited to undergo an upper GI endoscopy.
From a familial point of view, when a relative had abnormalIPT, a child with ASD also showed this condition in 15 of 31 cases(48.4%). In 5 cases (5/85 families, 5.6%), we found 3 or moremembers of the same family with abnormal IPT. The clinicalconcordance for ASD between the investigated twins was 100%;that is, all of the investigated couples of twins were both affected.Conversely, the concordance of IPT values was 75%.
DISCUSSIONIn the present study, evidence is provided that supports the
view that a genetically determined abnormal IPT is present in ASD(4,14), hence defining a subgroup among patients with ASD, whichcould tentatively be named ‘‘barrier function deficit.’’ We do notknow yet how and whether this aspect is related to the developmentof ASD; a considerable amount of work is still required.
As a matter of fact, IPT was abnormal in a large percentage ofsubjects with ASD; subjects with ASD were reported to benefitfrom a gluten-free diet (1); gluten itself augments IPT (31–35). Wecan hypothesise that subjects with ASD are gluten sensitive, as wellas other recently described conditions (36–38), and hence theirintestinal barrier function will ameliorate with a gluten-free diet.The well-recognised intestinal mucosal effects of gliadin—themajor component of gluten—would justify a treatment with glu-ten-free diet in ASD.
A recovered barrier function would eventually prevent diges-tion products of natural food from entering the blood through theleaky mucosa and inducing antigenic responses as well as reducingthe interference with the central nervous system. Some recentstudies have found a close relation between dietary change andthe onset of symptoms in patients with ASD (6,39–42). It was
FIGURE 2. Small intestine barrier function is more deregu-lated in the children with autism spectrum disorders withregular eating habits than in those who are on a gluten-casein–free diet (GCFD) (P!0.034, Mann-Whitney test).Intestinal permeability, expressed as LA/MA values(mean" SD), in the 2 groups and child controls is reported.The differences between the 2 groups (GCFD and free diet) vscontrols are both significant (P!0.039 and P!0.014,respectively; Student t test).
TABLE 2. IPT values of patients with ASD (N U 90)
Abnormal IPT (33 patients) Normal IPT (57 patients)
Sex: M/F ratio 29/4 52/5Genetic HLA predisposition: DQ2 and/or DQ8 yes/no (%) 8/25 (32.0) 15/38 (39.5)Mean age" SD at recruitment 6.3" 3.7 8.9" 6.0Presence of referred GI symptoms (%) 15/33 (45.5) 27/57 (47.4)
Some specific characteristics are compared to show that the 2 subgroups were almost overlapping. ASD! autism spectrum disorders; GI! gastrointestinal;HLA! human leucocyte antigen; IPT! intestinal permeability; SD! standard deviation.
TABLE 3. FC in patients with ASD and their first-degreerelatives
Pathological FC
% Abnormal/total subjects mg/g
Patients withASD (N! 90)
24.6% (22/90,of which 2 on GCFD)
159.7" 74.0
Relatives (N! 146) 11.7% (17/146) 230.7" 254.0
Mean"SD of pathological values only (ie, >100 mg/g) are given in thesecond column. ASD! autism spectrum disorders; FC! fecal calprotectin;GCFD! gluten-casein–free diet.
JPGN # Volume 51, Number 4, October 2010 Alterations of the Intestinal Barrier in Patients With ASD
www.jpgn.org 421
AuLstas con dieta sin gluten
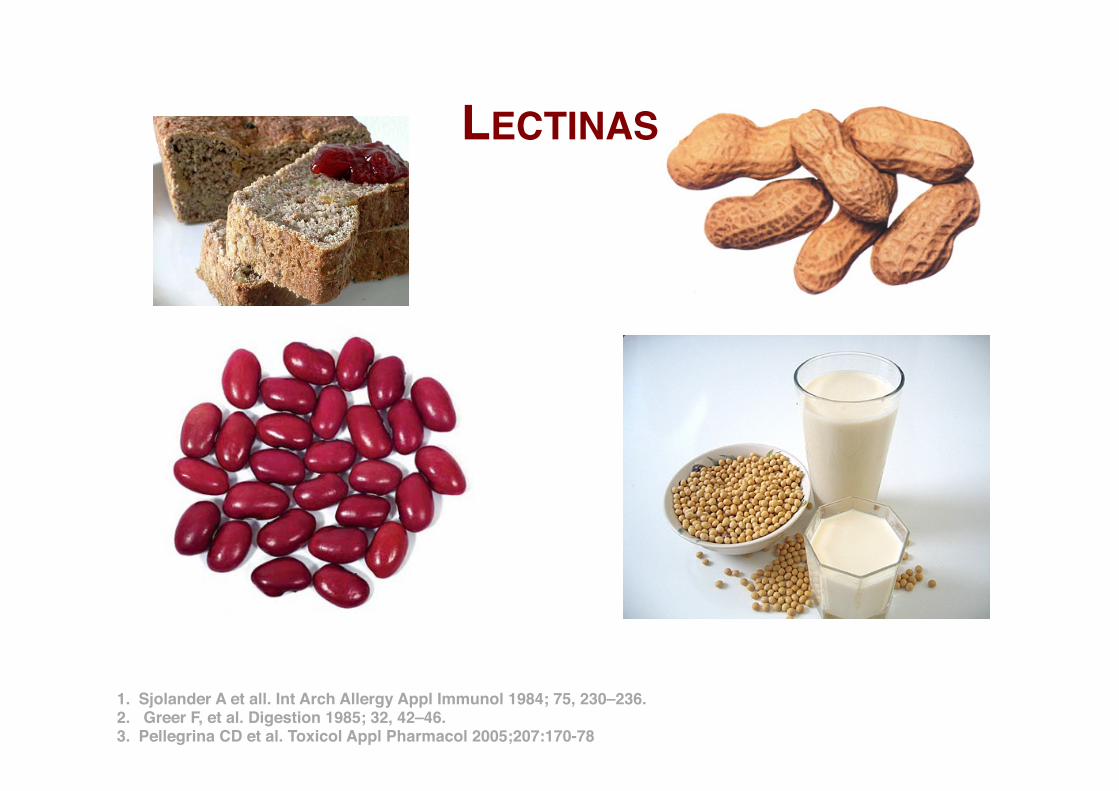
LECTINAS!
1. Sjolander A et all. Int Arch Allergy Appl Immunol 1984; 75, 230–236.!!2. Greer F, et al. Digestion 1985; 32, 42–46.!3. Pellegrina CD et al. Toxicol Appl Pharmacol 2005;207:170-78!
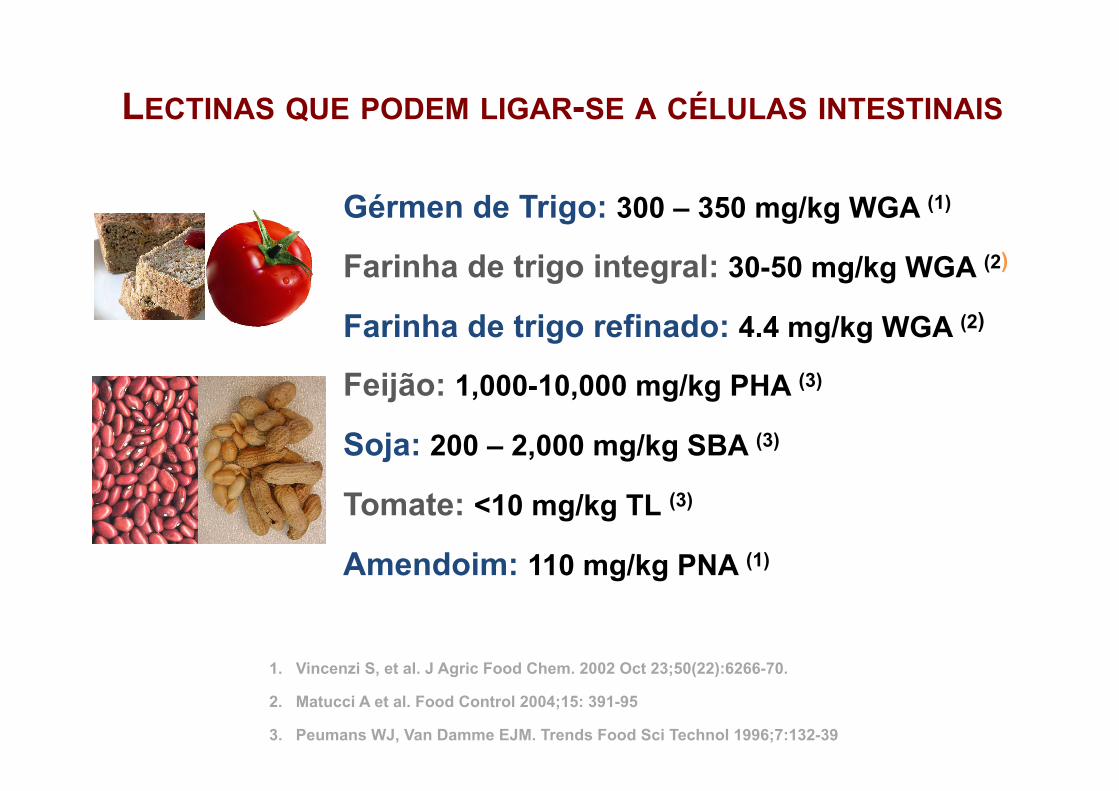
LECTINAS QUE PODEM LIGAR-SE A CÉLULAS INTESTINAIS
Gérmen de Trigo: 300 – 350 mg/kg WGA (1)
Farinha de trigo integral: 30-50 mg/kg WGA (2)
Farinha de trigo refinado: 4.4 mg/kg WGA (2)
Feijão: 1,000-10,000 mg/kg PHA (3)
Soja: 200 – 2,000 mg/kg SBA (3)
Tomate: <10 mg/kg TL (3)
Amendoim: 110 mg/kg PNA (1)
1. Vincenzi S, et al. J Agric Food Chem. 2002 Oct 23;50(22):6266-70. 2. Matucci A et al. Food Control 2004;15: 391-95 3. Peumans WJ, Van Damme EJM. Trends Food Sci Technol 1996;7:132-39
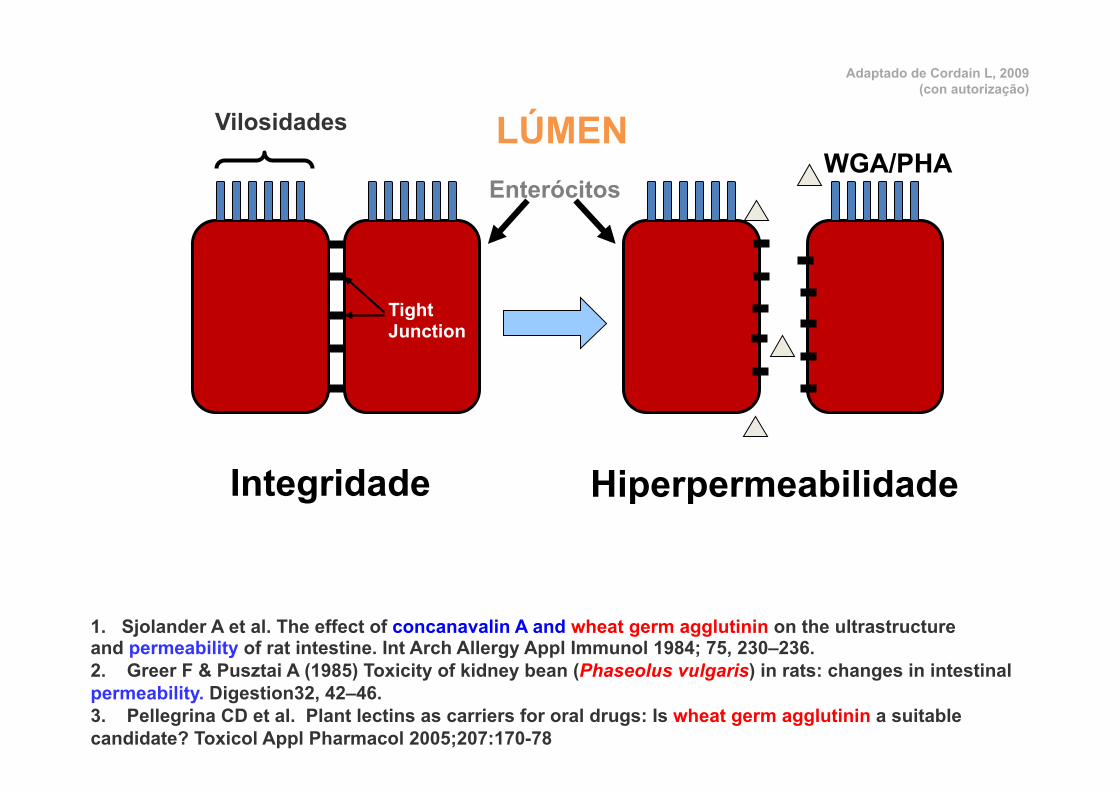
Enterócitos
Vilosidades
Integridade Hiperpermeabilidade
WGA/PHA
Tight Junction
LÚMEN
Adaptado de Cordain L, 2009 (con autorização)
1. Sjolander A et al. The effect of concanavalin A and wheat germ agglutinin on the ultrastructure and permeability of rat intestine. Int Arch Allergy Appl Immunol 1984; 75, 230–236. 2. Greer F & Pusztai A (1985) Toxicity of kidney bean (Phaseolus vulgaris) in rats: changes in intestinal permeability. Digestion32, 42–46. 3. Pellegrina CD et al. Plant lectins as carriers for oral drugs: Is wheat germ agglutinin a suitable candidate? Toxicol Appl Pharmacol 2005;207:170-78
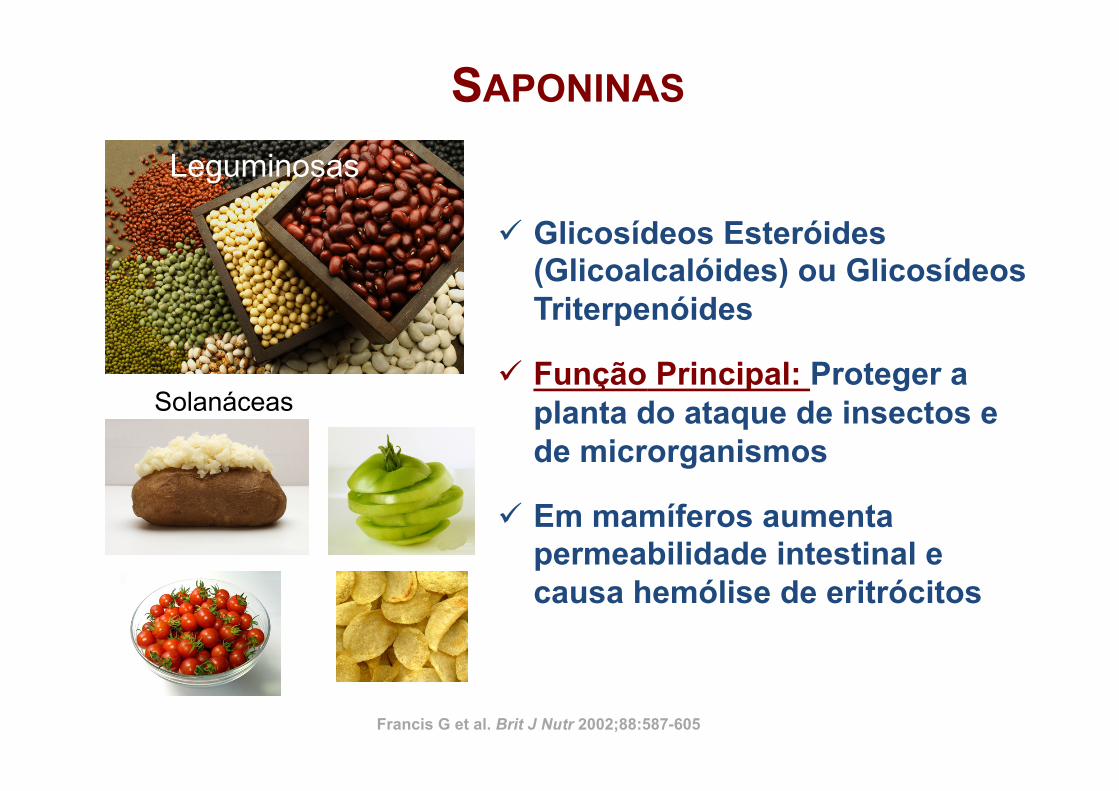
ü Glicosídeos Esteróides (Glicoalcalóides) ou Glicosídeos Triterpenóides
ü Função Principal: Proteger a planta do ataque de insectos e de microrganismos
ü Em mamíferos aumenta permeabilidade intestinal e causa hemólise de eritrócitos
Leguminosas
Solanáceas
SAPONINAS
Francis G et al. Brit J Nutr 2002;88:587-605
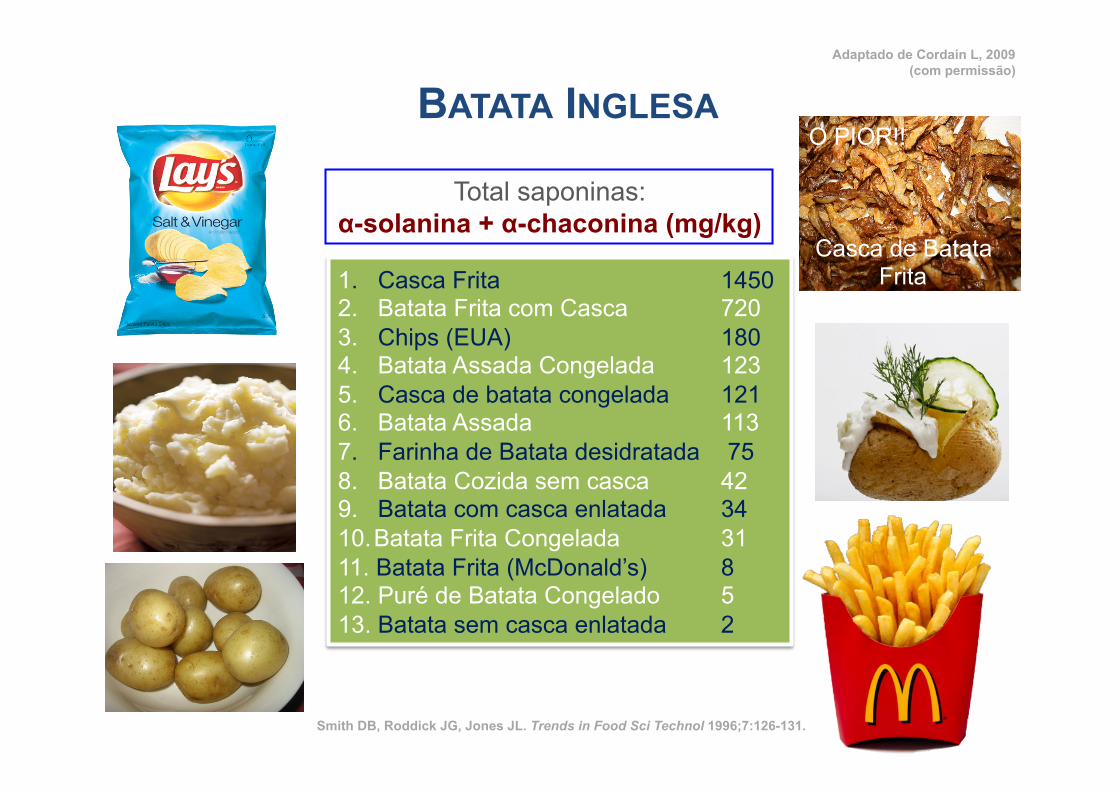
Total saponinas: α-solanina + α-chaconina (mg/kg)
BATATA INGLESA
1. Casca Frita 1450 2. Batata Frita com Casca 720 3. Chips (EUA) 180 4. Batata Assada Congelada 123 5. Casca de batata congelada 121 6. Batata Assada 113 7. Farinha de Batata desidratada 75 8. Batata Cozida sem casca 42 9. Batata com casca enlatada 34 10. Batata Frita Congelada 31 11. Batata Frita (McDonald’s) 8 12. Puré de Batata Congelado 5 13. Batata sem casca enlatada 2
Casca de Batata Frita
O PIOR!!
Smith DB, Roddick JG, Jones JL. Trends in Food Sci Technol 1996;7:126-131.
Adaptado de Cordain L, 2009 (com permissão)
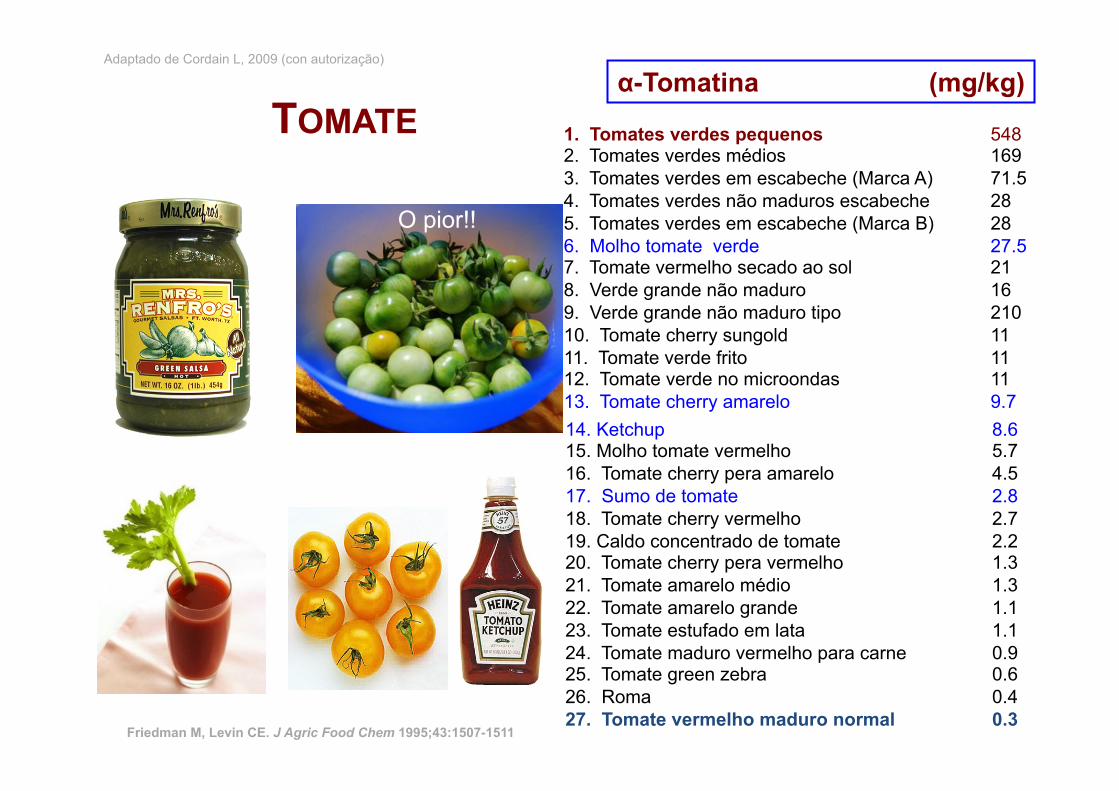
1. Tomates verdes pequenos 548 2. Tomates verdes médios 169 3. Tomates verdes em escabeche (Marca A) 71.5 4. Tomates verdes não maduros escabeche 28 5. Tomates verdes em escabeche (Marca B) 28 6. Molho tomate verde 27.5 7. Tomate vermelho secado ao sol 21 8. Verde grande não maduro 16 9. Verde grande não maduro tipo 210 10. Tomate cherry sungold 11 11. Tomate verde frito 11 12. Tomate verde no microondas 11 13. Tomate cherry amarelo 9.7 14. Ketchup 8.6 15. Molho tomate vermelho 5.7 16. Tomate cherry pera amarelo 4.5 17. Sumo de tomate 2.8 18. Tomate cherry vermelho 2.7 19. Caldo concentrado de tomate 2.2 20. Tomate cherry pera vermelho 1.3 21. Tomate amarelo médio 1.3 22. Tomate amarelo grande 1.1 23. Tomate estufado em lata 1.1 24. Tomate maduro vermelho para carne 0.9 25. Tomate green zebra 0.6 26. Roma 0.4 27. Tomate vermelho maduro normal 0.3
O pior!!
Adaptado de Cordain L, 2009 (con autorização)
TOMATE
Friedman M, Levin CE. J Agric Food Chem 1995;43:1507-1511
α-Tomatina (mg/kg)
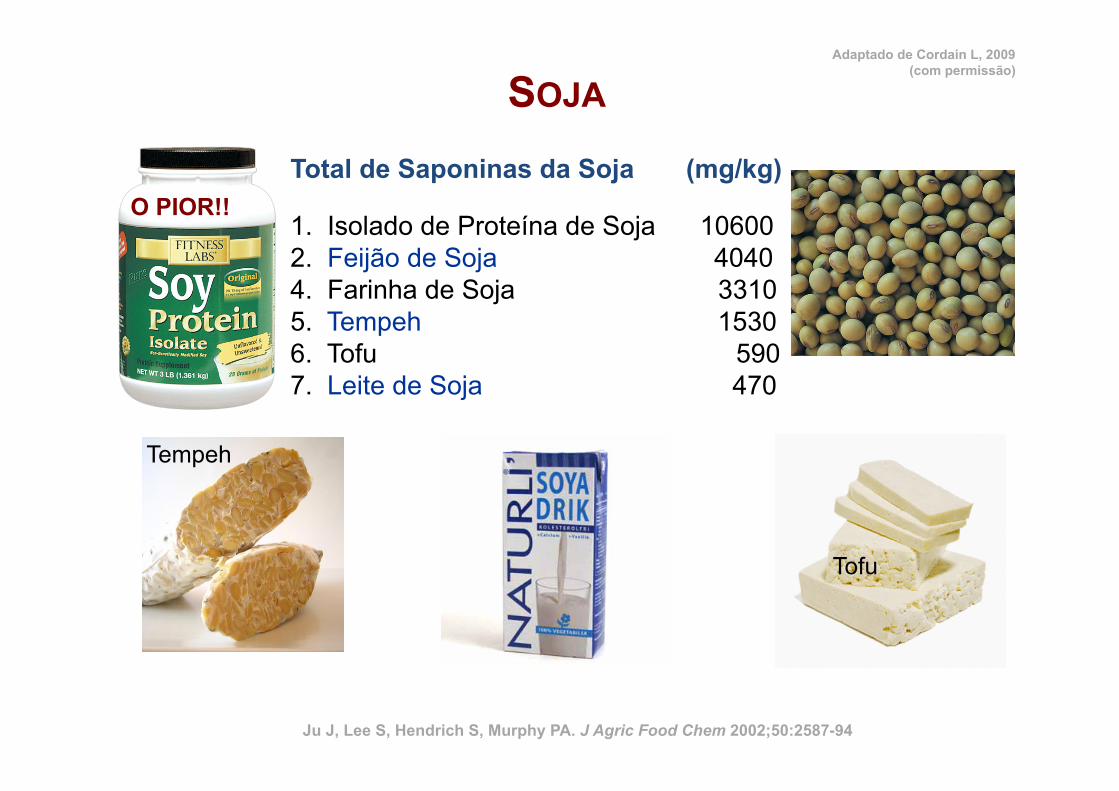
Total de Saponinas da Soja (mg/kg)
SOJA
1. Isolado de Proteína de Soja 10600 2. Feijão de Soja 4040 4. Farinha de Soja 3310 5. Tempeh 1530 6. Tofu 590 7. Leite de Soja 470
Tofu
O PIOR!!
Tempeh
Ju J, Lee S, Hendrich S, Murphy PA. J Agric Food Chem 2002;50:2587-94
Adaptado de Cordain L, 2009 (com permissão)
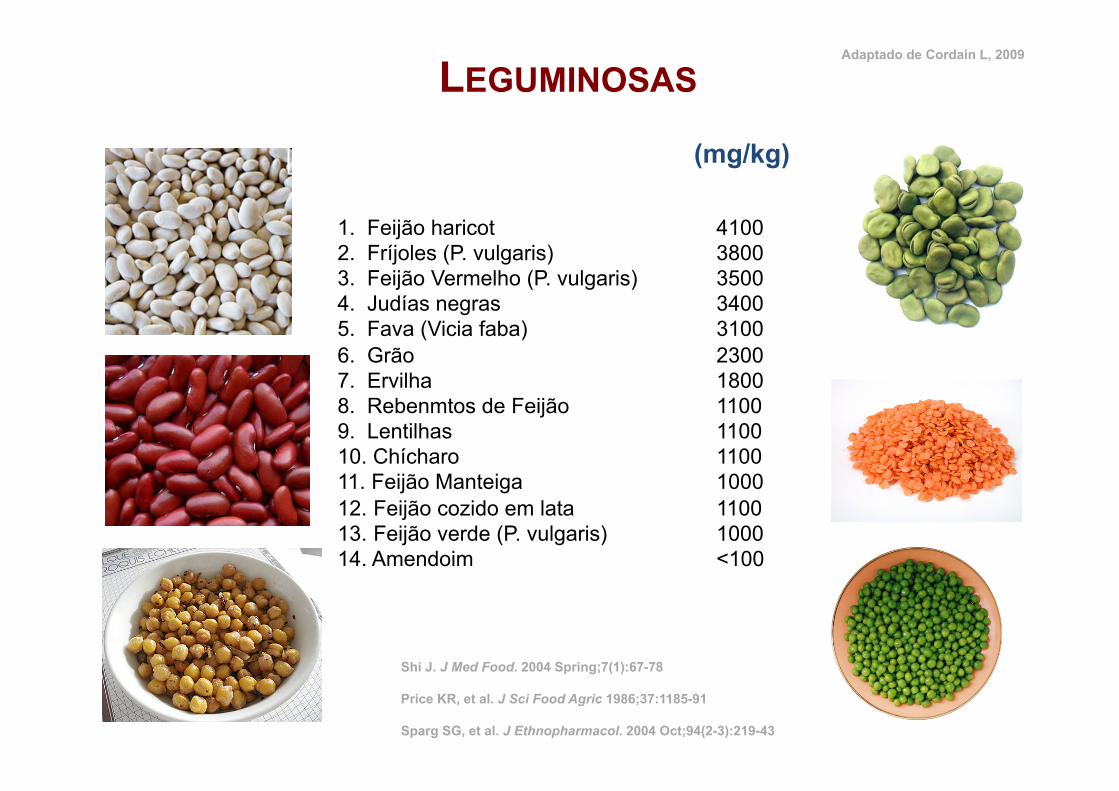
1. Feijão haricot 4100 2. Fríjoles (P. vulgaris) 3800 3. Feijão Vermelho (P. vulgaris) 3500 4. Judías negras 3400 5. Fava (Vicia faba) 3100 6. Grão 2300 7. Ervilha 1800 8. Rebenmtos de Feijão 1100 9. Lentilhas 1100 10. Chícharo 1100 11. Feijão Manteiga 1000 12. Feijão cozido em lata 1100 13. Feijão verde (P. vulgaris) 1000 14. Amendoim <100
(mg/kg)
Shi J. J Med Food. 2004 Spring;7(1):67-78 Price KR, et al. J Sci Food Agric 1986;37:1185-91 Sparg SG, et al. J Ethnopharmacol. 2004 Oct;94(2-3):219-43
Adaptado de Cordain L, 2009
LEGUMINOSAS
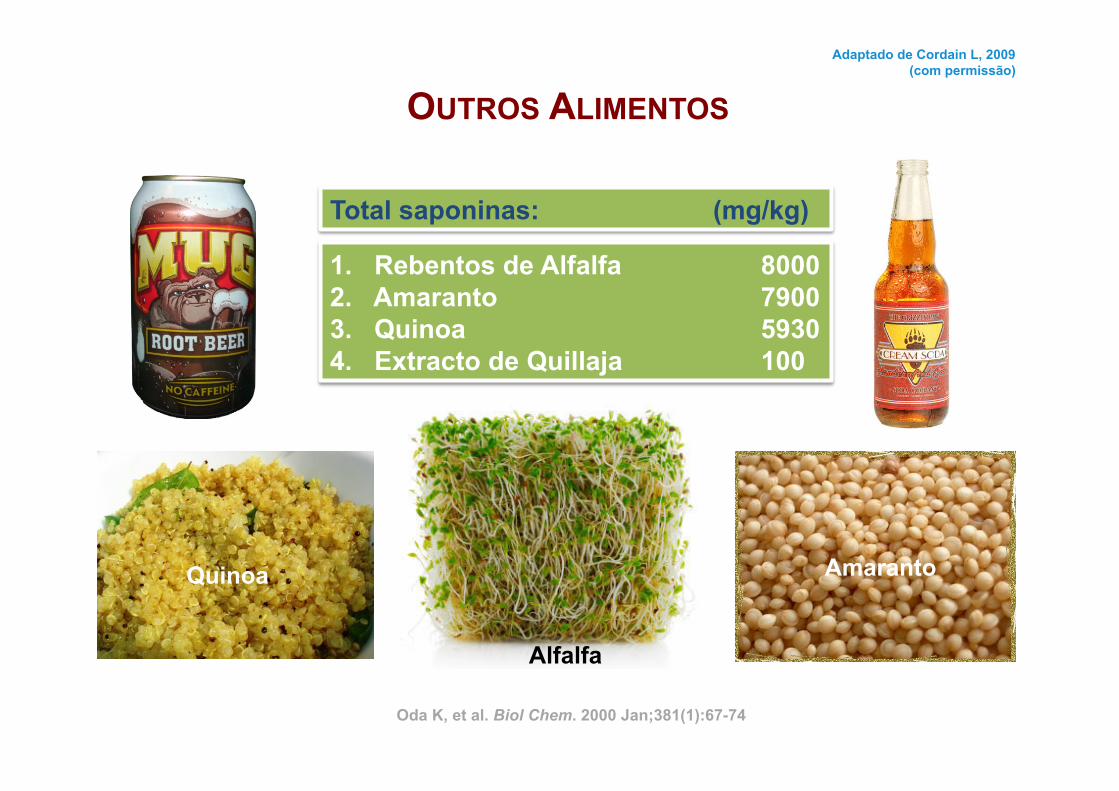
Total saponinas: (mg/kg)
OUTROS ALIMENTOS
1. Rebentos de Alfalfa 8000 2. Amaranto 7900 3. Quinoa 5930 4. Extracto de Quillaja 100
Amaranto
Alfalfa
Quinoa
Oda K, et al. Biol Chem. 2000 Jan;381(1):67-74
Adaptado de Cordain L, 2009 (com permissão)
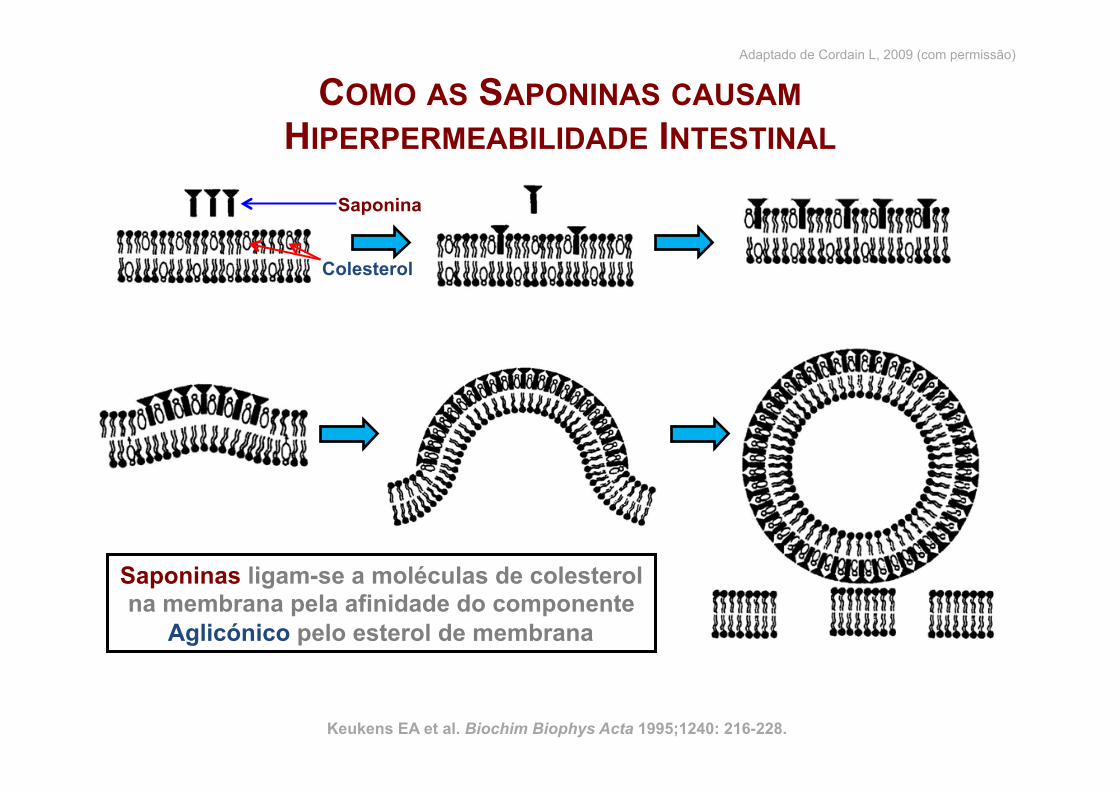
COMO AS SAPONINAS CAUSAM HIPERPERMEABILIDADE INTESTINAL
Saponina
Colesterol
Keukens EA et al. Biochim Biophys Acta 1995;1240: 216-228.
Saponinas ligam-se a moléculas de colesterol na membrana pela afinidade do componente
Aglicónico pelo esterol de membrana
Adaptado de Cordain L, 2009 (com permissão)
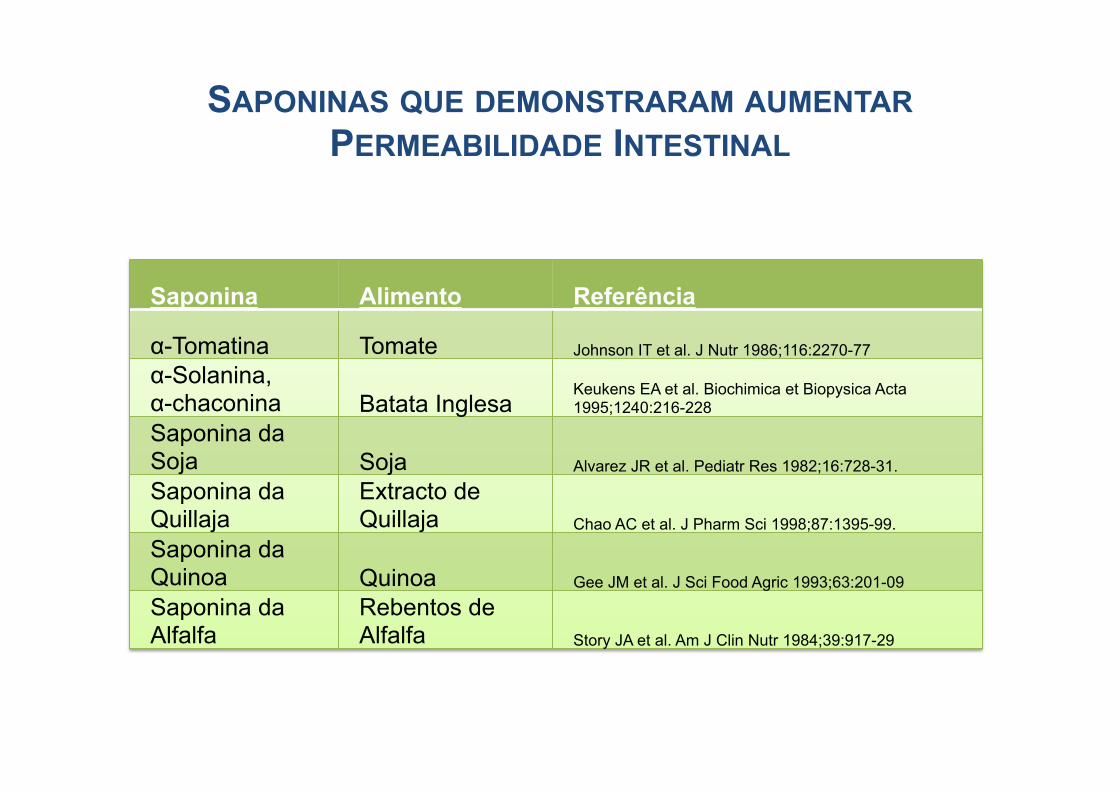
SAPONINAS QUE DEMONSTRARAM AUMENTAR PERMEABILIDADE INTESTINAL
To
Saponina Alimento Referência
α-Tomatina Tomate Johnson IT et al. J Nutr 1986;116:2270-77 α-Solanina, α-chaconina Batata Inglesa
Keukens EA et al. Biochimica et Biopysica Acta 1995;1240:216-228
Saponina da Soja Soja Alvarez JR et al. Pediatr Res 1982;16:728-31. Saponina da Quillaja
Extracto de Quillaja Chao AC et al. J Pharm Sci 1998;87:1395-99.
Saponina da Quinoa Quinoa Gee JM et al. J Sci Food Agric 1993;63:201-09 Saponina da Alfalfa
Rebentos de Alfalfa Story JA et al. Am J Clin Nutr 1984;39:917-29
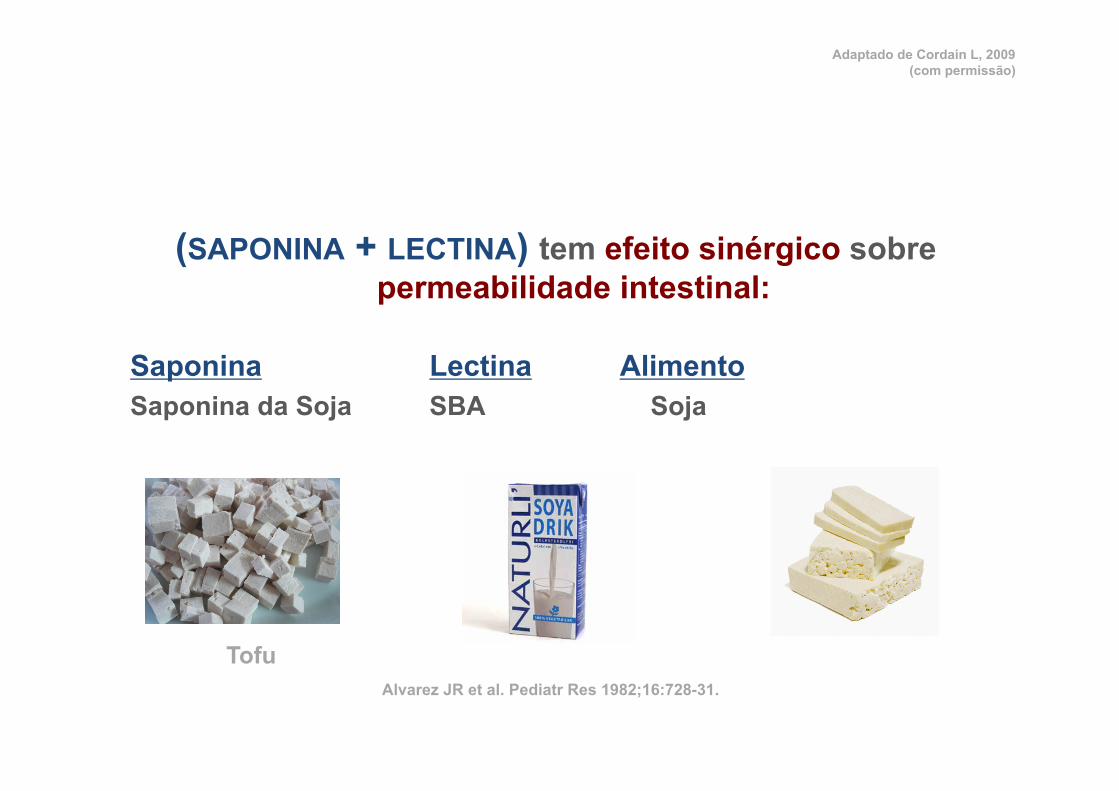
(SAPONINA + LECTINA) tem efeito sinérgico sobre permeabilidade intestinal:
Saponina Lectina Alimento Saponina da Soja SBA Soja
Tofu Alvarez JR et al. Pediatr Res 1982;16:728-31.
Adaptado de Cordain L, 2009 (com permissão)
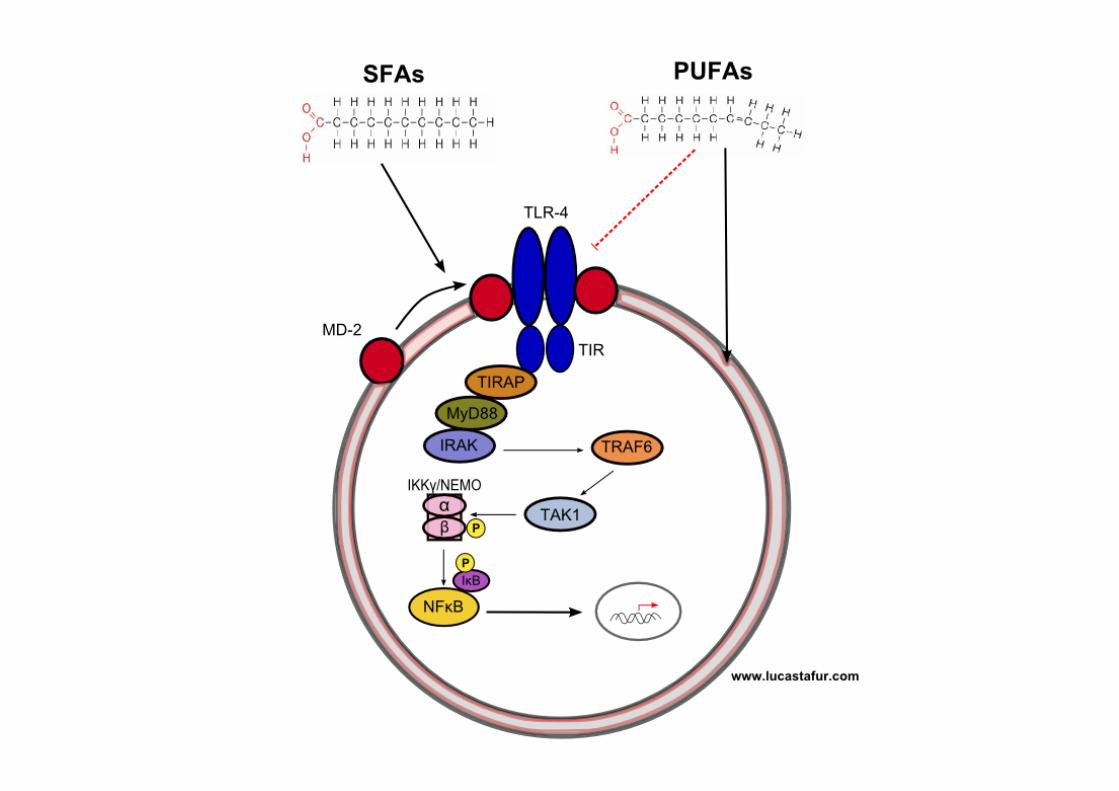
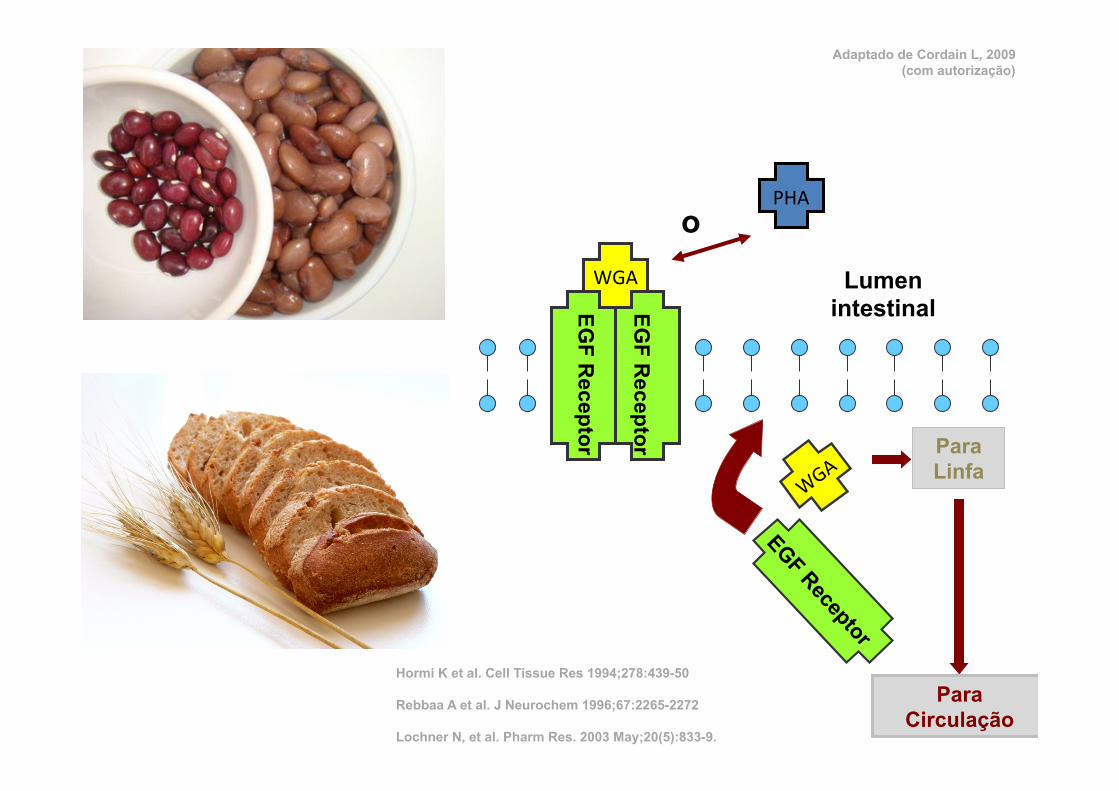
WGA Lumen intestinal
PHA
Para Linfa
Para Circulação
EGF R
eceptor
EGF R
eceptor
Hormi K et al. Cell Tissue Res 1994;278:439-50 Rebbaa A et al. J Neurochem 1996;67:2265-2272 Lochner N, et al. Pharm Res. 2003 May;20(5):833-9.
o
Adaptado de Cordain L, 2009 (com autorização)
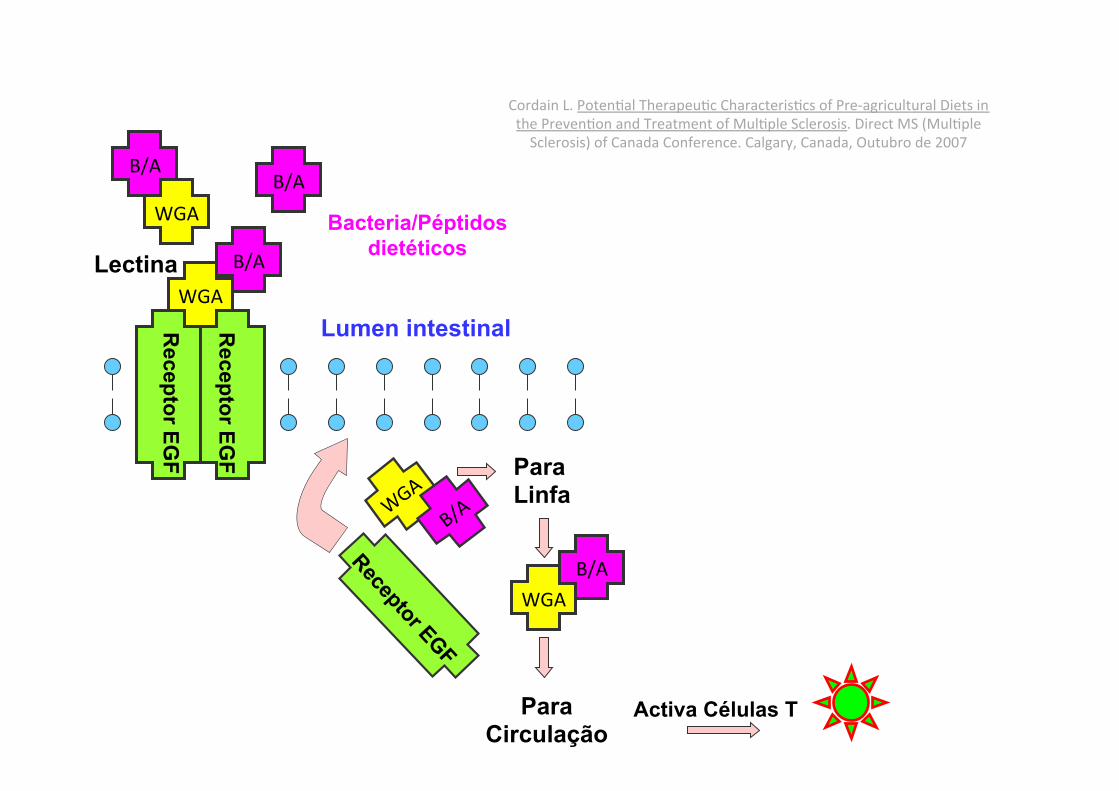
WGA Lumen intestinal
WGA
Para Linfa
Para Circulação
Receptor EG
F
Receptor EG
F
B/A B/A
B/A
B/A
Bacteria/Péptidos dietéticos
Lectina
Activa Células T
WGA
Cordain L. PotenNal TherapeuNc CharacterisNcs of Pre-‐agricultural Diets in the PrevenNon and Treatment of MulNple Sclerosis. Direct MS (MulNple Sclerosis) of Canada Conference. Calgary, Canada, Outubro de 2007
Brief communication
Stimulants of Toll-like receptor (TLR)-2 and TLR-4 are abundant in certainminimally-processed vegetables
Clett Erridge !
Department of Cardiovascular Sciences, Glenfield General Hospital, University of Leicester, Leicester LE3 9QP, UK
a r t i c l e i n f o
Article history:Received 27 October 2010Accepted 25 February 2011Available online 3 March 2011
Keywords:Toll-like receptorsMinimally processed vegetablesInsulin resistanceAtherosclerosisInflammation
a b s t r a c t
Stimulants of the innate immune receptors Toll-like receptor (TLR)-2 and TLR4 have been shown to pro-mote insulin resistance and atherosclerosis in animal models of these diseases. As minimally processedvegetables (MPV) can contain a relatively large bacterial load compared to other foodstuffs, we aimed toquantify the abundance of stimulants of TLR2 and TLR4 in MPV using a transfection-based bioassay cal-ibrated with Escherichia coli LPS and the synthetic lipopeptide Pam3CSK4. Of 5 classes of MPV and 3 clas-ses of related vegetable products considered to be likely to contain a high microbial load, diced onion andbean sprouts contained the highest levels of stimulants of TLR2 (up to 18.5 lg Pam3CSK4-equivalents perg) and TLR4 (up to 11.4 lg LPS-equivalents per g). By contrast, the majority of fresh whole vegetablesexamined reproducibly contained minimal or undetectable levels of TLR2- or TLR4-stimulants. The accu-mulation of TLR-stimulants in MPVs correlated well with growth of enterobacterial spoilage organisms.In conclusion, the modern trend towards eating minimally processed vegetables rather than whole foodsis likely to be associated with increased oral exposure to stimulants of TLR2 and TLR4.
! 2011 Elsevier Ltd. All rights reserved.
1. Introduction
Inflammatory signalling pathways have been shown to be in-volved in the development of insulin resistance and atherosclerosisin animal models of these diseases (Bjorkbacka et al., 2004; Arkanet al., 2005). A major family of innate immune sensors involved inthe induction of inflammatory signalling in response to bacterialproducts, the Toll-like receptors (TLRs), has been shown to play akey role in the promotion of these conditions. In particular, stimu-lation of TLR2- or TLR4-signalling promotes both atherosclerosisand insulin resistance in mice (Ehses et al., 2010; Mullick et al.,2005; Tsukumo et al., 2007; Westerterp et al., 2007). However, itremains unclear to what extent, and by which means, humansmay be exposed to ligands of TLR2 or TLR4.
We showed recently that a variety of common foodstuffs cancontain relatively high levels of stimulants of TLR2 or TLR4, andthat these stimulants were likely to be bacterial lipopeptides andlipopolysaccharides (LPS), respectively (Erridge, 2010). While thehighest levels of TLR-stimulants were found in processed meatand dairy products, the fresh fruits and vegetables examined in
the previous study tended to contain only very low or undetectablelevels of these agents (Erridge, 2010). Since minimally processedvegetables (MPVs), which are defined as being fresh but otherwisephysically altered from their original state, and certain other vege-table products such as bean sprouts and cress, can contain a rela-tively high bacterial load relative to unprocessed vegetables(Abadias et al., 2008; Tournas, 2005), we here examined the poten-tial of extracts of MPVs and related products to stimulate TLR2 andTLR4 signalling using a recently developed quantitative bioassay.
2. Materials and methods
2.1. Cells, bacteria and reagents
Human embryonic kidney (HEK)-293 cells (ECACC Cat no: 85120602) were cul-tured in DMEM/10% FCS (Sigma). E. coli R1 LPS, a kind gift of Professor Ian Poxton(University of Edinburgh), was repurified to remove TLR2-stimulating lipopeptidecontaminants as described previously (Hirschfeld et al., 2000). The synthetic bacte-rial lipopeptide analogue Pam3CSK4 and TLR-constructs were from Invivogen. Bac-terial strains examined were: Erwinia chrysanthemi EC16, Pectobacteriumatrosepticum (previously referred to as Erwinia carotovora subsp atroseptica)ECG12 and SCRI1043, Xanthomonas campestris 8004, Pseudomonas fluorescensSBW25 and WCS365.
2.2. Preparation of food extracts
Five independent samples from each of 5 classes of MPV (grated carrot, dicedonion, sliced apple, mixed leaf salad and baby spinach, each packaged under a mod-ified atmosphere) and 3 classes of other vegetable product considered to be likely to
0278-6915/$ - see front matter ! 2011 Elsevier Ltd. All rights reserved.doi:10.1016/j.fct.2011.02.018
Abbreviations: APC, aerobic mesophile plate count; LPS, lipopolysaccharide;MPV, minimally processed vegetable; NF-jB, nuclear factor kappa-B; SFE, sterile-filtered food extract; TLR, Toll-like receptor.! Tel.: +44 0116 256 3048; fax: +44 0116 287 5792.
E-mail address: [email protected]
Food and Chemical Toxicology 49 (2011) 1464–1467
Contents lists available at ScienceDirect
Food and Chemical Toxicology
journal homepage: www.elsevier .com/locate/ foodchemtox
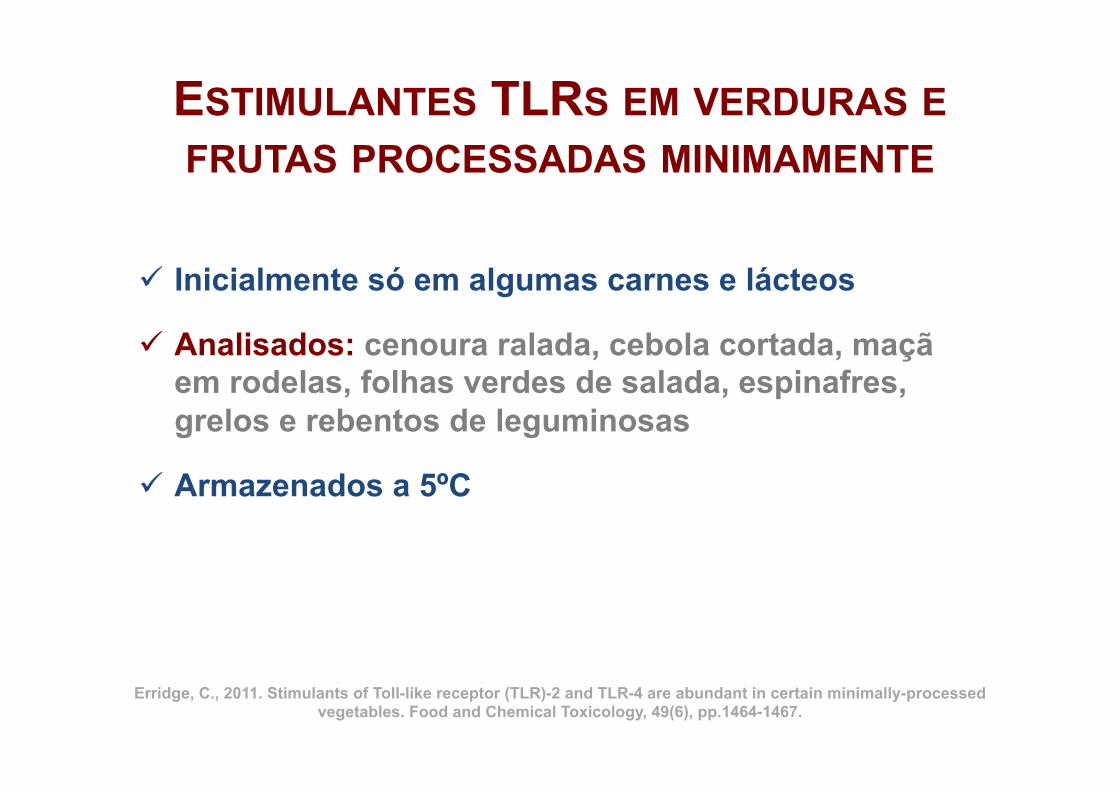
ESTIMULANTES TLRS EM VERDURAS E FRUTAS PROCESSADAS MINIMAMENTE
ü Inicialmente só em algumas carnes e lácteos
ü Analisados: cenoura ralada, cebola cortada, maçã em rodelas, folhas verdes de salada, espinafres, grelos e rebentos de leguminosas
ü Armazenados a 5ºC
Erridge, C., 2011. Stimulants of Toll-like receptor (TLR)-2 and TLR-4 are abundant in certain minimally-processed vegetables. Food and Chemical Toxicology, 49(6), pp.1464-1467.
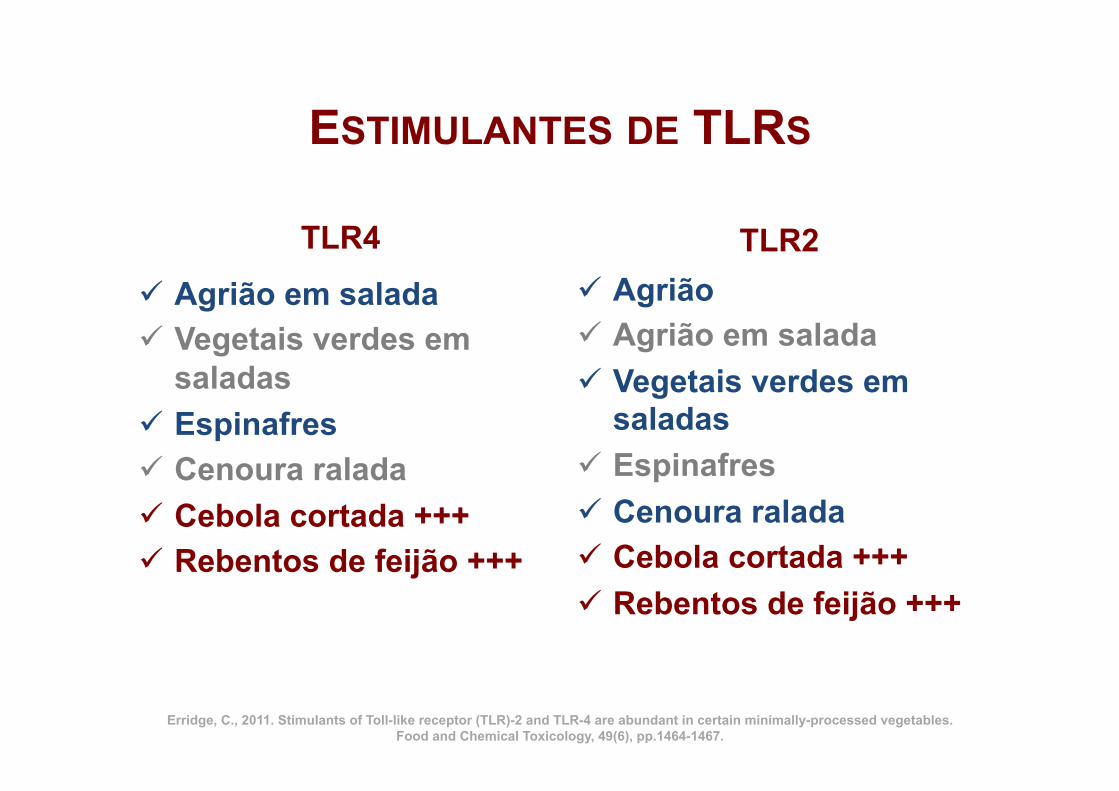
ESTIMULANTES DE TLRS
TLR4
ü Agrião em salada ü Vegetais verdes em
saladas ü Espinafres ü Cenoura ralada ü Cebola cortada +++ ü Rebentos de feijão +++
TLR2 ü Agrião ü Agrião em salada ü Vegetais verdes em
saladas ü Espinafres ü Cenoura ralada ü Cebola cortada +++ ü Rebentos de feijão +++
Erridge, C., 2011. Stimulants of Toll-like receptor (TLR)-2 and TLR-4 are abundant in certain minimally-processed vegetables. Food and Chemical Toxicology, 49(6), pp.1464-1467.
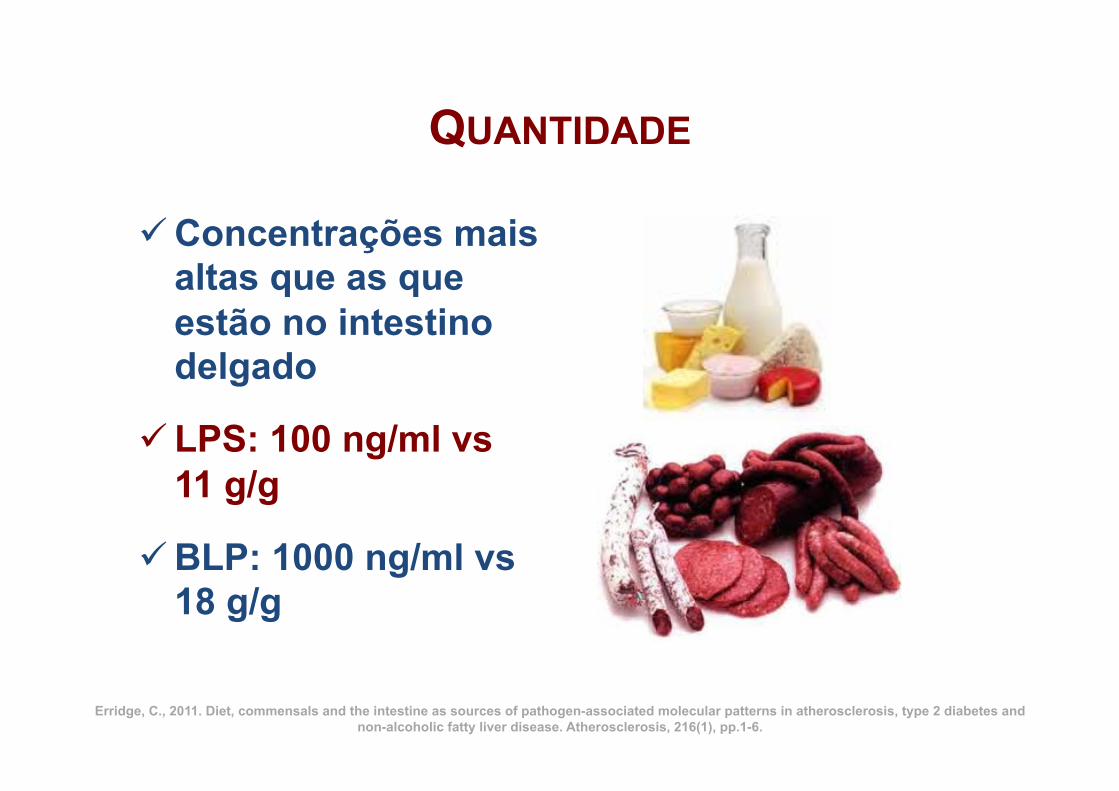
QUANTIDADE
ü Concentrações mais altas que as que estão no intestino delgado
ü LPS: 100 ng/ml vs 11 g/g
ü BLP: 1000 ng/ml vs 18 g/g
Erridge, C., 2011. Diet, commensals and the intestine as sources of pathogen-associated molecular patterns in atherosclerosis, type 2 diabetes and non-alcoholic fatty liver disease. Atherosclerosis, 216(1), pp.1-6.

MESMO QUANDO SÃO FERVIDOS DURANTE 10 MIN
MAS NÃO EM VERDURAS NÃO PROCESSADAS E DESCASCADAS
ü Cenoura
ü Cebola
ü Batata
ü Brócolo
ü Pimento
ü Abóbora
ü Grão
Erridge, C., 2011. Stimulants of Toll-like receptor (TLR)-2 and TLR-4 are abundant in certain minimally-processed vegetables. Food and Chemical Toxicology, 49(6), pp.1464-1467.
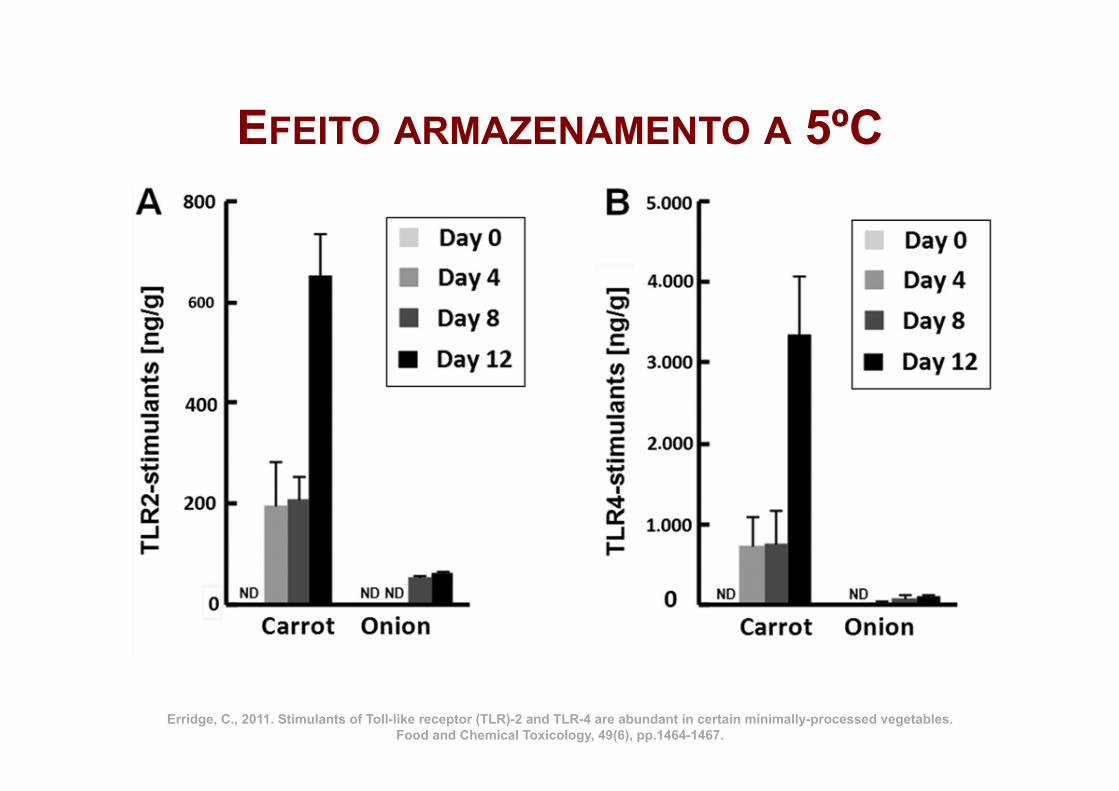
EFEITO ARMAZENAMENTO A 5ºC
Erridge, C., 2011. Stimulants of Toll-like receptor (TLR)-2 and TLR-4 are abundant in certain minimally-processed vegetables. Food and Chemical Toxicology, 49(6), pp.1464-1467.
18 lg/g lipopeptide-equivalents and 11 lg/g LPS-equivalents,respectively. These results are surprising, as unprocessed fruitand vegetables were shown previously to contain very low orundetectable levels of TLR-stimulants (Erridge, 2010). Moreover,the levels of TLR-stimulants in several of the vegetable products
examined in the present study are considerably higher than thosefound in many other food products (Erridge, 2010).
It seems likely that two explanations may account for theseunexpected findings. First, it is established that certain vegetableproducts, such as bean sprouts and cress, tend to contain a
Fig. 1. TLR-stimulant and bacteria content of chopped vegetables stored at 5 !C. Freshly chopped carrot and onion was assessed for content of TLR2-stimulants (A), TLR4-stimulants (B), aerobic mesophile count (C) and enterobacteria (D), on the day of preparation (day 0) and on days 4, 8 and 12 after storage at 5 !C exposed to air. ND, notdetectable. ⁄P < 0.01 vs bacterial counts at day 0.
Fig. 2. TLR-stimulants expressed by common vegetable spoilage bacteria. Overnight cultures of 6 common vegetable spoilage organisms were washed twice in PBS, heat-killed at 100 !C for 10 min, diluted to 107 bacteria/ml in tissue culture medium and applied to HEK-293 cells transfected with TLR2, TLR4 or TLR5. Mean NF-jB-dependentreporter (pELAM) activation of triplicate cultures after 18 h is presented ±SD. ⁄P < 0.01 vs cells cultured in medium alone.
1466 C. Erridge / Food and Chemical Toxicology 49 (2011) 1464–1467
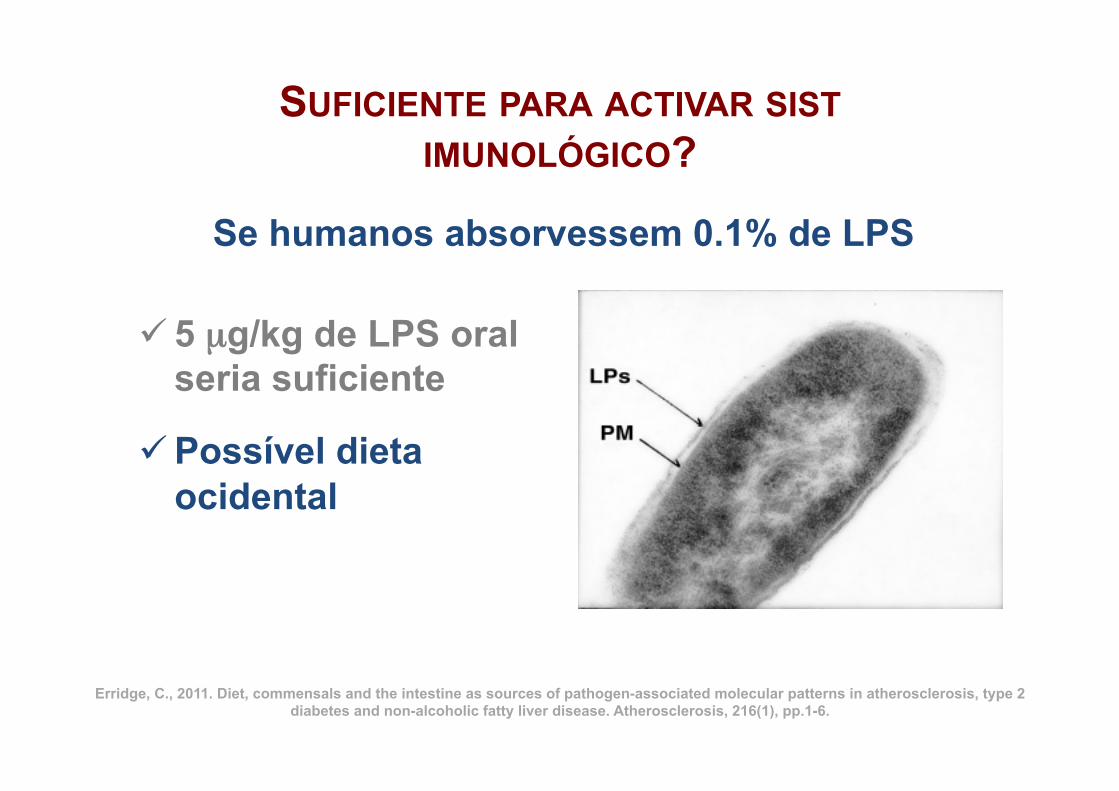
SUFICIENTE PARA ACTIVAR SIST IMUNOLÓGICO?
ü 5 µg/kg de LPS oral seria suficiente
ü Possível dieta ocidental
Erridge, C., 2011. Diet, commensals and the intestine as sources of pathogen-associated molecular patterns in atherosclerosis, type 2 diabetes and non-alcoholic fatty liver disease. Atherosclerosis, 216(1), pp.1-6.
Se humanos absorvessem 0.1% de LPS
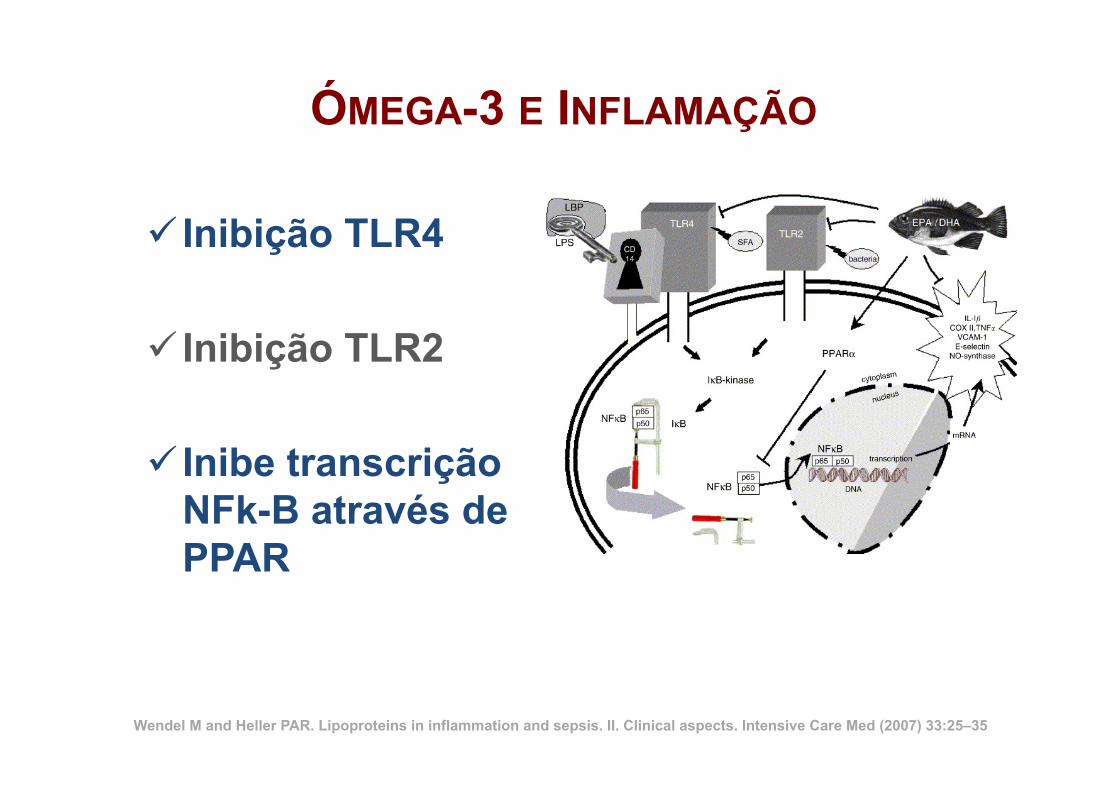
ÓMEGA-3 E INFLAMAÇÃO
ü Inibição TLR4
ü Inibição TLR2
ü Inibe transcrição NFk-B através de PPAR
Wendel M and Heller PAR. Lipoproteins in inflammation and sepsis. II. Clinical aspects. Intensive Care Med (2007) 33:25–35
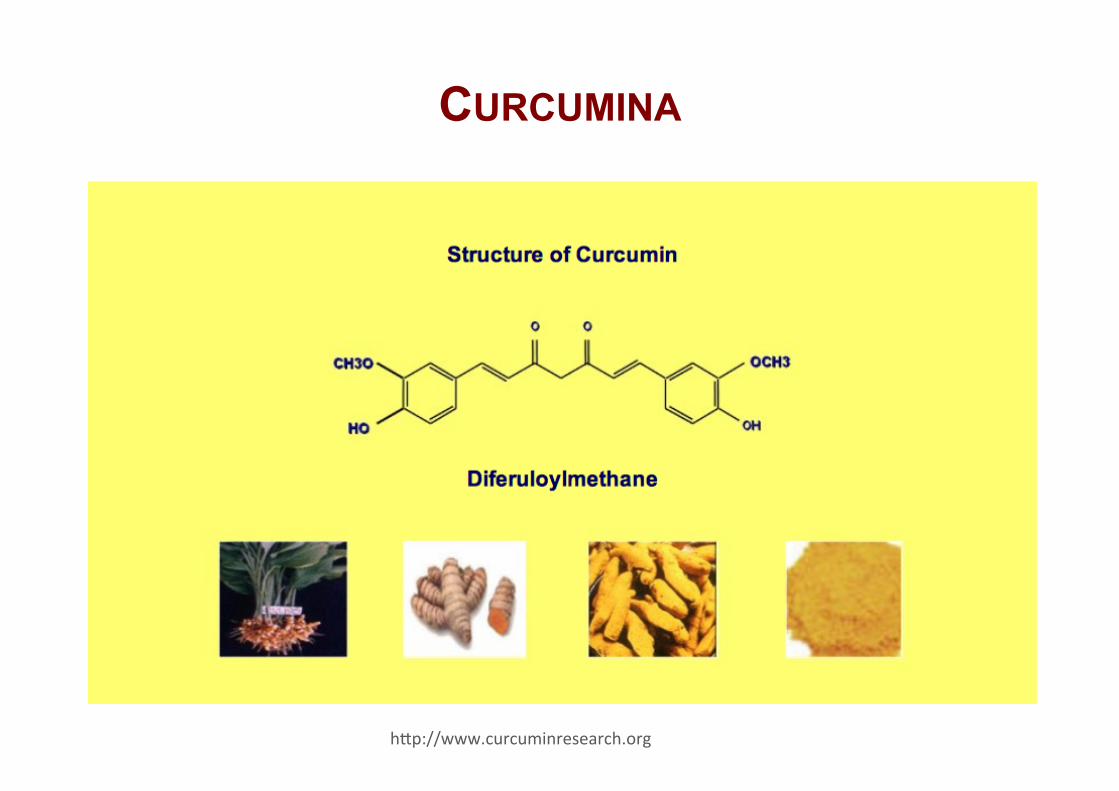
CURCUMINA
hZp://www.curcuminresearch.org
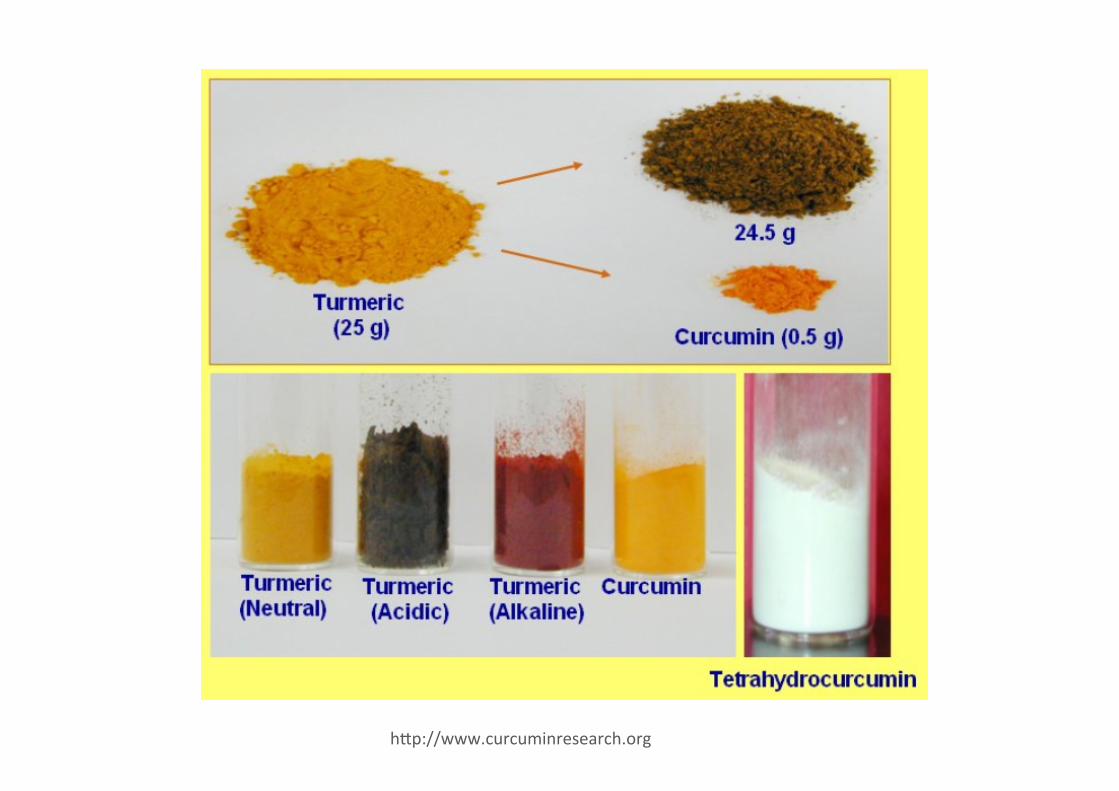
hZp://www.curcuminresearch.org
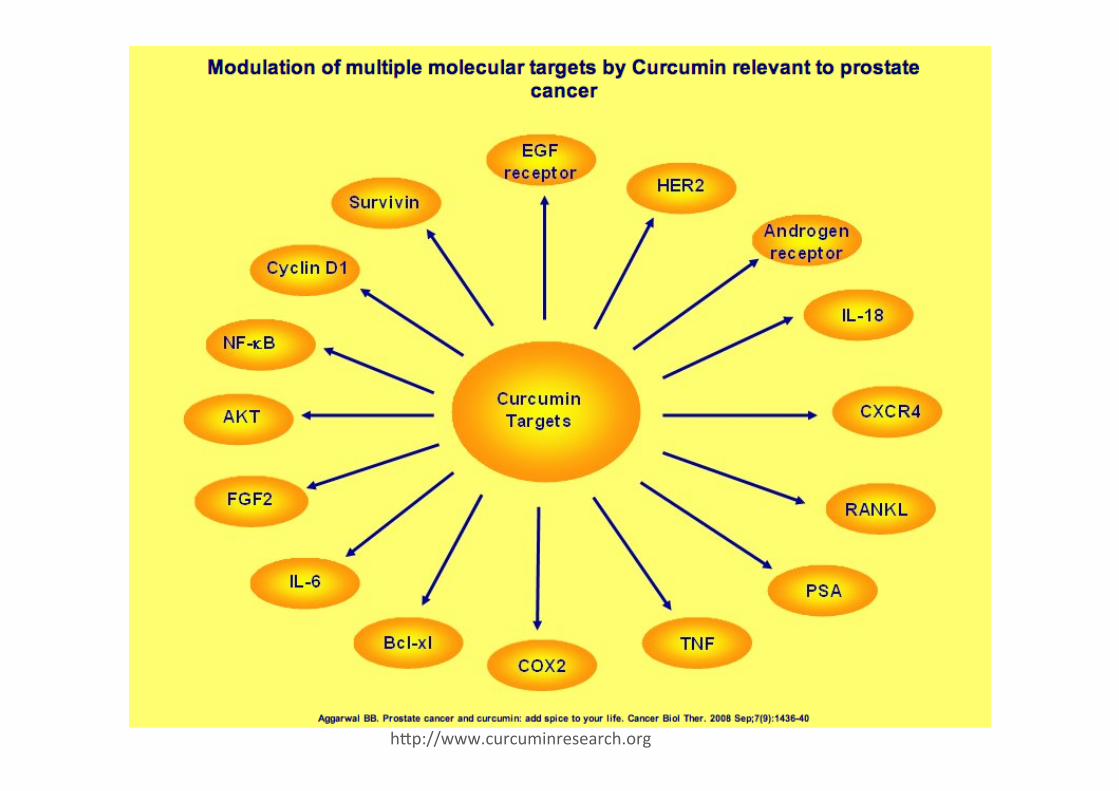
hZp://www.curcuminresearch.org