
1
Human and Canine Giardia Infection in the United States: 2003-2009 1
2
Ahmed S. Mohameda; Michael Levineb; Joseph W. Camp Jr.a; Elisabeth Lundc Jonathan S. 3
Yoderd; Larry T. Glickmane; George E. Moorea* 4
5
aDepartment of Comparative Pathobiology, Purdue University, West Lafayette, IN, USA 6
bDepartment of Statistics, Purdue University, West Lafayette, IN, USA 7
cBanfield Pet HospitalTM, Portland, OR, USA 8
dDivision of Foodborne, Waterborne, and Environmental Diseases, National Center for 9
Emerging and Zoonotic Infectious Diseases, Centers for Disease Control and Prevention (CDC), 10
Atlanta, GA, USA. 11
eDepartment of Emergency Medicine, University of North Carolina, Chapel Hill, NC, USA. 12
13
The findings and conclusions in this report are those of the authors and do not necessarily 14
represent the official position of the Centers for Disease Control and Prevention. 15
16
Corresponding author: 17
Dr. George E. Moore 18
725 Harrison Street 19
West Lafayette, IN 47907-2027 20
Email: [email protected] 21
Phone: 765-496-3393 22
Fax: 765-496-2627 23

2
24
Running title: Giardia Infection in Human and Canine 25
26
Keywords: dogs, Giardia spp., infectious disease, protozoa, temporal, surveillance, zoonosis 27

3
Abstract 28
Giardia protozoa have been suspected of zoonotic transmission, including transmission from companion 29
animals such as pet dogs to humans. Patterns of infection have been previously described for dogs and 30
humans, but such investigations have used different time periods and locations for these two species. Our 31
objective was to describe and compare the overall trend and seasonality of Giardia species infection 32
among dogs and humans in the United States from 2003 through 2009 using public health surveillance 33
data and medical records of pet dogs visiting a large nationwide private veterinary hospital. Canine data 34
were obtained from all dogs visiting Banfield hospitals in the United States with fecal test results for 35
Giardia species, from January 2003 through December 2009. Incidence data of human cases from the 36
same time period was obtained from the CDC. Descriptive time plots, seasonal trend decomposition 37
(STL), and seasonal autoregressive moving-average (SARIMA) model were used to assess the temporal 38
characteristics of Giardia infection in the two species. Canine incidence showed a gradual decline from 39
2003 to 2009 with a non-significant irregular seasonal component. By contrast, human incidence showed 40
a stable trend with a significant regular seasonal cycle, peaking in August and September. Different 41
temporal patterns in human and canine Giardia cases observed in this study suggest that the 42
epidemiological disease processes underlying both series might be different, and Giardia 43
transmission from dogs to humans and from humans to dogs might be uncommon. 44
45
4
1. Introduction 46
Giardia protozoal parasites infect many species of domestic and wild animals as well as humans. 47
Zoonotic transmission of some Giardia species/genotypes has been demonstrated 48
experimentally, but its occurrence and clinical significance under natural conditions is unclear 49
(Plutzer et al., 2010). Assemblages A and B which were considered to be human-specific have 50
been isolated from a wide range of domestic, wild, and marine animals (Thompson et al., 2000), 51
and these zoonotic assemblages have been shown to occur more commonly in dogs from the 52
western United States compared to dog-specific assemblages (C and D) (Covacin et al., 2011). 53
However, the relative importance of zoonotic transmission of Giardia spp. remains to be 54
determined (Hunter and Thompson, 2005). 55
56
Human giardiasis in the United States is a nationally reportable disease in most states (Yoder et 57
al., 2010). Approximately 20,000 human giardiasis cases were reported annually to the Centers 58
for Disease Control and Prevention (CDC) from 2002 to 2009 (Yoder and Beach, 2007; Yoder 59
et al., 2010), but CDC estimates the actual number of cases to be closer to 1.2 million cases per 60
year due to underreporting and underdiagnosis (Scallan et al., 2011). Documented human 61
giardiasis has been associated with a history of travel, outdoor recreational activities, and 62
drinking contaminated water (Eisenstein et al., 2008). 63
64
Cases of human giardiasis in the United States generally increase in late summer and early fall 65
(Katz et al., 2006; Nakada et al., 2012; Yoder et al., 2010). The peak incidence of human 66
giardiasis occurs during the spring in Europe and summer in Canada and the UK (Lal et al., 67
2012). The seasonality of canine giardiasis has been the subject of conflicting findings. For 68
5
example, no seasonal pattern of canine giardiasis in the US was found in one study (Nolan and 69
Smith, 1995), whereas a more recent study reported a highest prevalence in the month of 70
November (Mohamed et al., 2013). The peak incidence of canine giardiasis has been reported to 71
occur in the winter in Italy (Bianciardi et al., 2004), the summer in Spain (Díaz et al., 1996), and 72
in the fall in Argentina (Fontanarrosa et al., 2006). 73
74
Time-series analysis is a method for describing the occurrence of common events over time 75
while accounting for the serial correlation (autocorrelation) between observations. Few studies 76
have used a time-series approach to describe the temporal pattern of Giardia (Naumova et al., 77
2000; Nolan and Smith, 1995). No studies however have compared the temporal patterns of 78
Giardia infections across animal species. Similarities in temporal patterns could potentially 79
indicate common source etiologies or cross-species transmission. 80
81
The objective of this study therefore was to describe temporal pattern of giardiasis among dogs 82
and humans in the United States using medical records of dogs visiting private veterinary 83
hospitals and reports of human giardiasis by state health departments to the CDC for the period 84
from January 2003 through December 2009. 85
86
2. Materials and methods 87
2.1. Data: 88
Canine: Fecal test information was obtained from Banfield, The Pet Hospital, Portland, OR. 89
Fecal testing was performed as part of routine diagnostic or preventive veterinary care of 90
symptomatic and asymptomatic pet dogs during visits to Banfield veterinary hospitals. Fecal 91
6
flotation without centrifugation using 1.18 SG ZnSO4 was performed to detect Giardia cysts in 92
the stool and the results reported as positive or negative; no attempt was made to identify specific 93
Giardia assemblages. All fecal tests were conducted by trained hospital staff following using a 94
standard protocol. The medical records from all Banfield hospitals nationwide are downloaded 95
weekly and stored in central electronic data warehouse using proprietary software (PetWare, 96
Banfield, The Pet Hospital, Portland, OR). Each record includes a unique patient and hospital 97
identifier. Demographic data for each dog including hospital visit date and the results of fecal 98
flotation tests from January 1, 2003, through December 31, 2009, were downloaded from the 99
central database. Only results from the first fecal test for each dog were used in the analysis. 100
Data related to clinical signs if present and specific treatments were not available 101
102
The main dataset for canine data was organized into a subset containing all positive fecal test 103
results indexed by the test date and a second full set containing all fecal tests (positive + 104
negative) indexed by the test date. A total count of the number of observations in the subset and 105
the full set was calculated for each month of the seven years, and a monthly incidence (𝑀𝑃𝑑,𝑖) 106
per 100 dogs was calculated as the number of positive fecal tests (in the subset) for each month i 107
(𝑁𝑃𝑇𝑖) divided by the total number of tests (in the full set) for the same month (𝑇𝑁𝑇𝑖): 108
𝑀𝑃𝑑,𝑖 = (𝑁𝑃𝑇𝑖
𝑇𝑁𝑇𝑖 ) ∗ 100 109
110
The number of human Giardia cases reported to CDC’s National Notifiable Disease Surveillance 111
System from each state by month (𝑇𝑁𝑅𝐶𝑖) from January 2003 through December 2009 was 112
obtained from CDC. An estimate of the total population for each state included in the study for 113
each of the seven years was obtained from the federal census website (US Census Bureau, 2009). 114
7
The total population (𝑇𝑃𝑖 ) for each state was used as the denominator to calculate a monthly 115
incidence of Giardia (MPh,i) per 100,000 people: 116
𝑀𝑃ℎ,𝑖 = (𝑇𝑁𝑅𝐶𝑖
𝑇𝑃𝑖 ) ∗ 100,000 117
118
2.2. Analysis: 119
Monthly incidence rates of canine and human Giardia infection were graphed. The seasonal-120
trend decomposition procedure based on loess (STL) method (Cleveland et al., 1990; Barnett and 121
Dobson, 2010) was then used to decompose the time series in order to visualize patterns. This 122
procedure is based on decomposing the full time-series into trend, seasonal, and remainder 123
components using a sequence of applications of the local linear regression method (loess) 124
smoother. Additionally monthly data, e.g. all January data, was plotted as a cycle-subseries of 125
the seasonal component. 126
127
Model fitting: A mixed Box-Jenkins approach was used to construct appropriate models to 128
describe time-series of Giardia infections in humans and dogs. A script, auto.arima in the 129
package Forecast in R (Hyndman and Khandakar, 2008), was used to produce an initial model 130
which was then refined using a seasonal autoregressive integrated moving average (SARIMA) 131
package (Shumway et al., 2011). SARIMA is an extension of the autoregressive integrated 132
moving average (ARIMA) models and is used to model time series with component(s) that 133
repeat regularly every “S” period of time (seasonal). Accordingly, SARIMA includes seasonal 134
and non-seasonal components; candidate models are first selected on the basis of the exploratory 135
analysis that takes into consideration the time plot structure, properties of the model residuals’ 136
autocorrelation (ACF) and partial autocorrelation (PACF) plots for each series. In the final step, 137

8
diagnostics of the residuals and Akaike information criterion (AIC) values were used to select 138
the final model that best fit the data and appeared to satisfy statistical assumptions. In the initial 139
automatic script, integration order, autoregressive (AR), and moving-average (MA) coefficients 140
were selected based on minimizing AIC for the seasonal and non-seasonal components of the 141
model. All statistical analyses were conducted using R (R Development Core Team, 2012) and a 142
p-value <0.05 was considered statistically significant. 143
144
3. Results: 145
A total of 135,802 cases of human giardiasis were reported to the CDC during the period from 146
2003 through 2009 from all states except IN, KY, NK, MS, and TX where notification was not 147
required during this period. The total annual number of reported human cases remained 148
relatively stable (20,751 in 2004 to 18,478 in 2009) whereas the total number of cases reported 149
from month to month fluctuated with noticeable increases during late summer and early fall. 150
Reported human cases were generally lowest in February (1,216) and highest in August (2,383) 151
during the study period. 152
153
Using the first fecal test available in the medical record for each dog, the total number of canine 154
fecal tests included in the study was 2,468,359. These tests were obtained from 777 Banfield 155
veterinary hospitals in 43 states. The number of canine fecal samples tested annually for Giardia 156
increased from 288,803 in 2003 to 483,016 in in 2009, concurrent with increasing number of 157
hospitals. Meanwhile, the percentage of dogs testing positive for Giardia infection annually 158
declined during the study period ranging from 0.61% (1,760/288,803) in 2003 to 0.27% 159
(1,326/483,016) in 2009. There was slight monthly variation in percentage of tests positive from 160
9
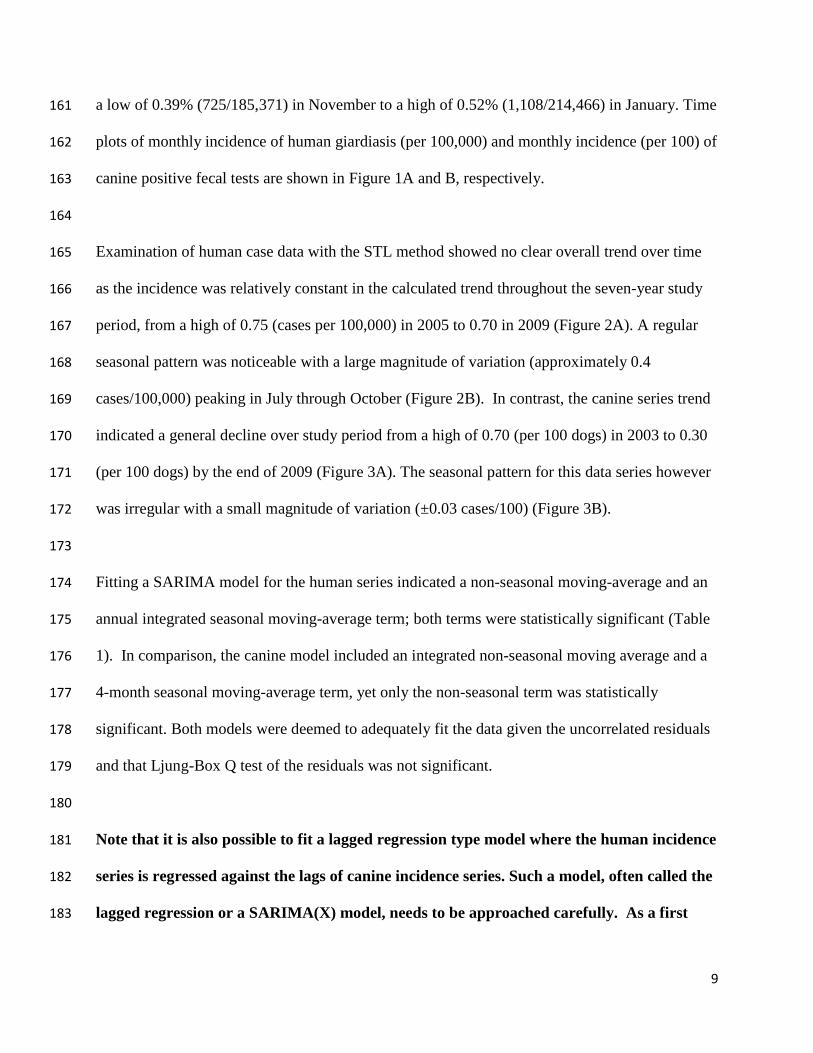
a low of 0.39% (725/185,371) in November to a high of 0.52% (1,108/214,466) in January. Time 161
plots of monthly incidence of human giardiasis (per 100,000) and monthly incidence (per 100) of 162
canine positive fecal tests are shown in Figure 1A and B, respectively. 163
164
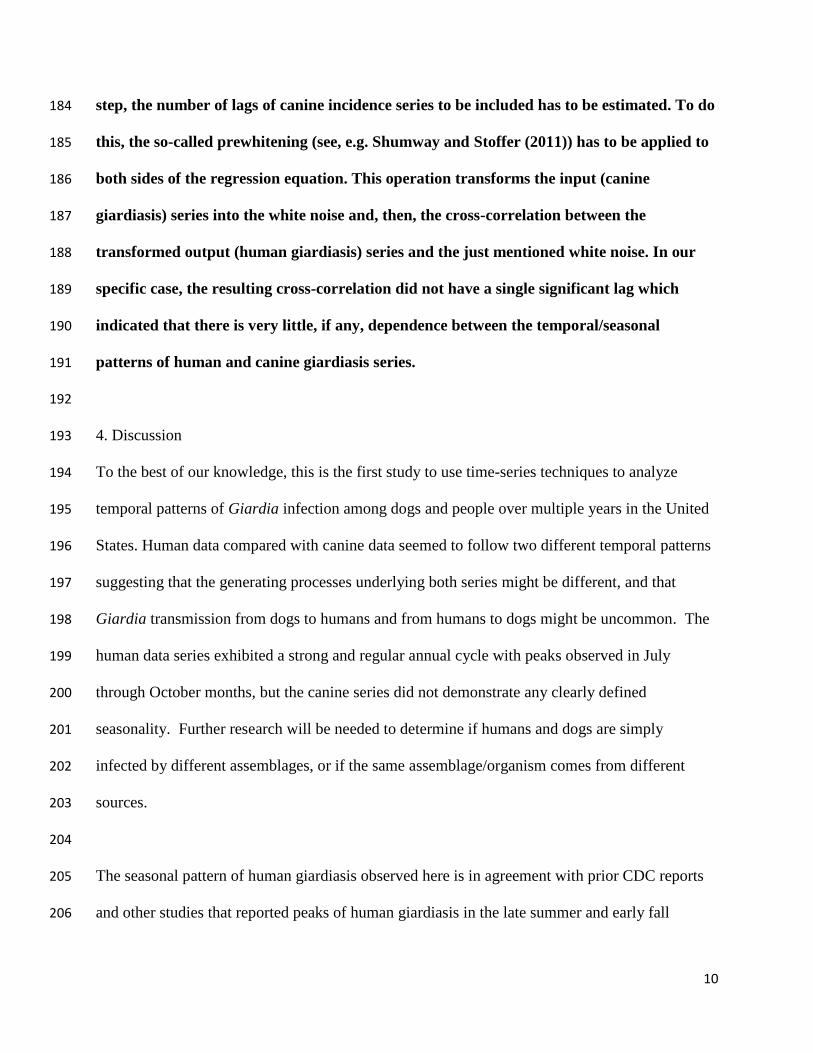
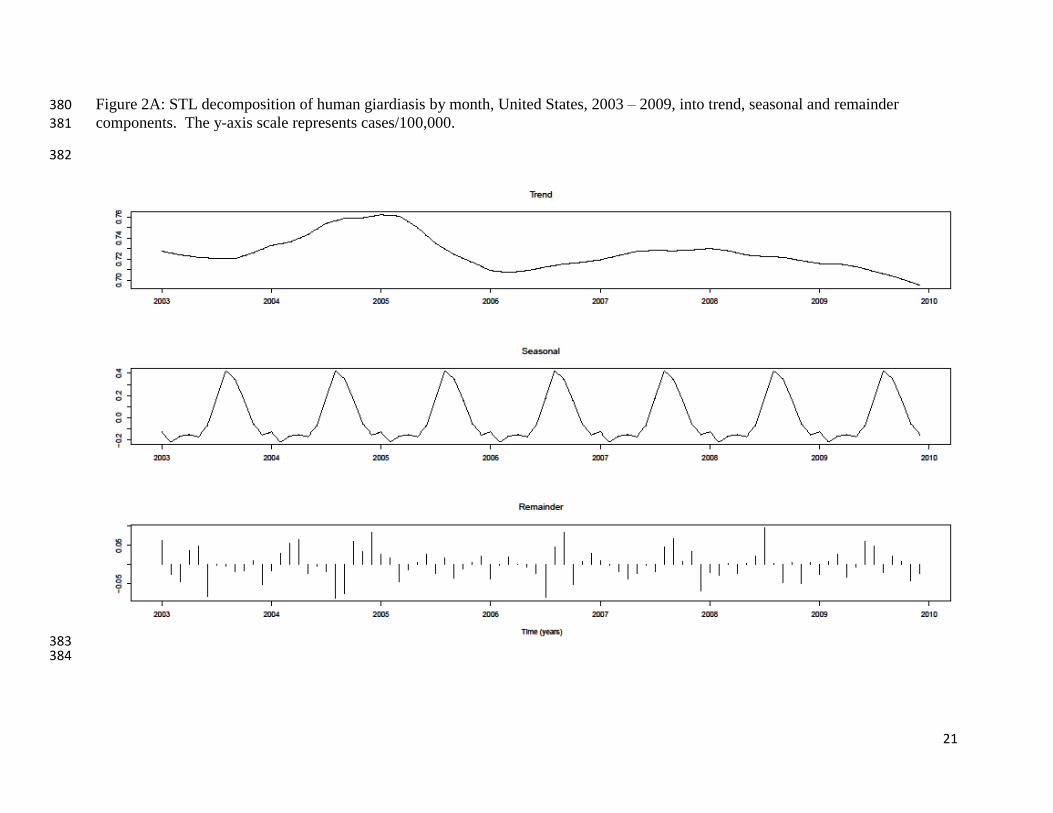
Examination of human case data with the STL method showed no clear overall trend over time 165
as the incidence was relatively constant in the calculated trend throughout the seven-year study 166
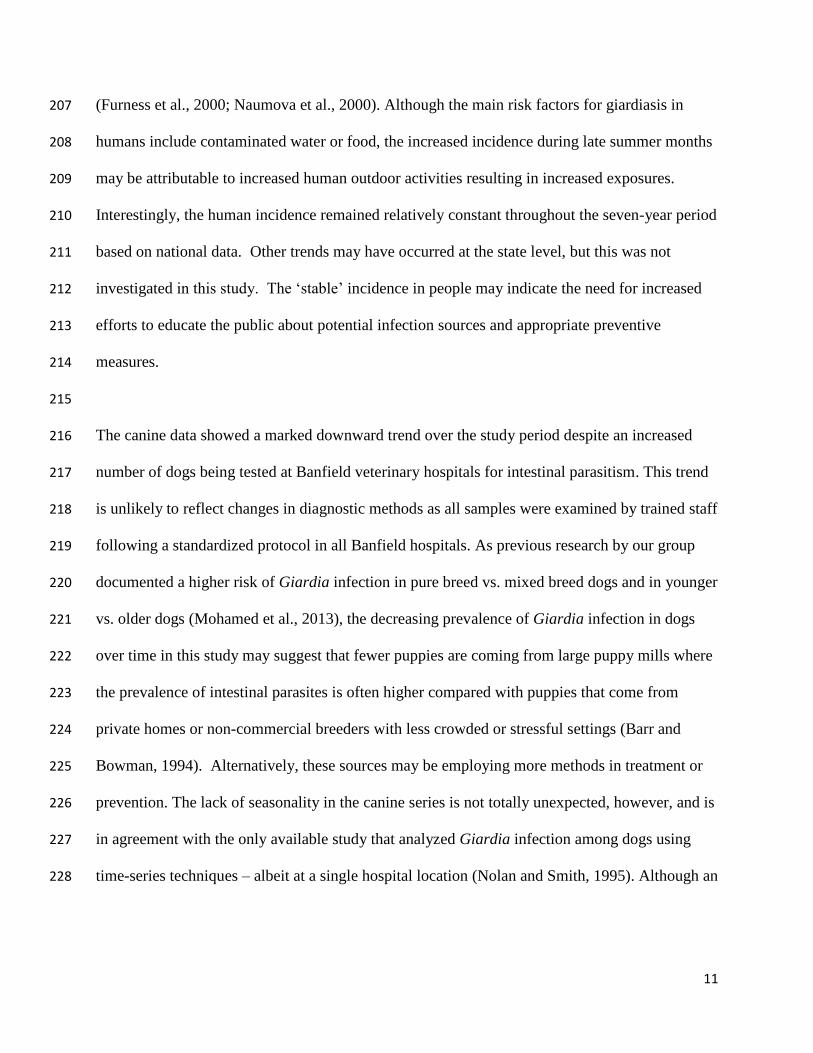
period, from a high of 0.75 (cases per 100,000) in 2005 to 0.70 in 2009 (Figure 2A). A regular 167
seasonal pattern was noticeable with a large magnitude of variation (approximately 0.4 168
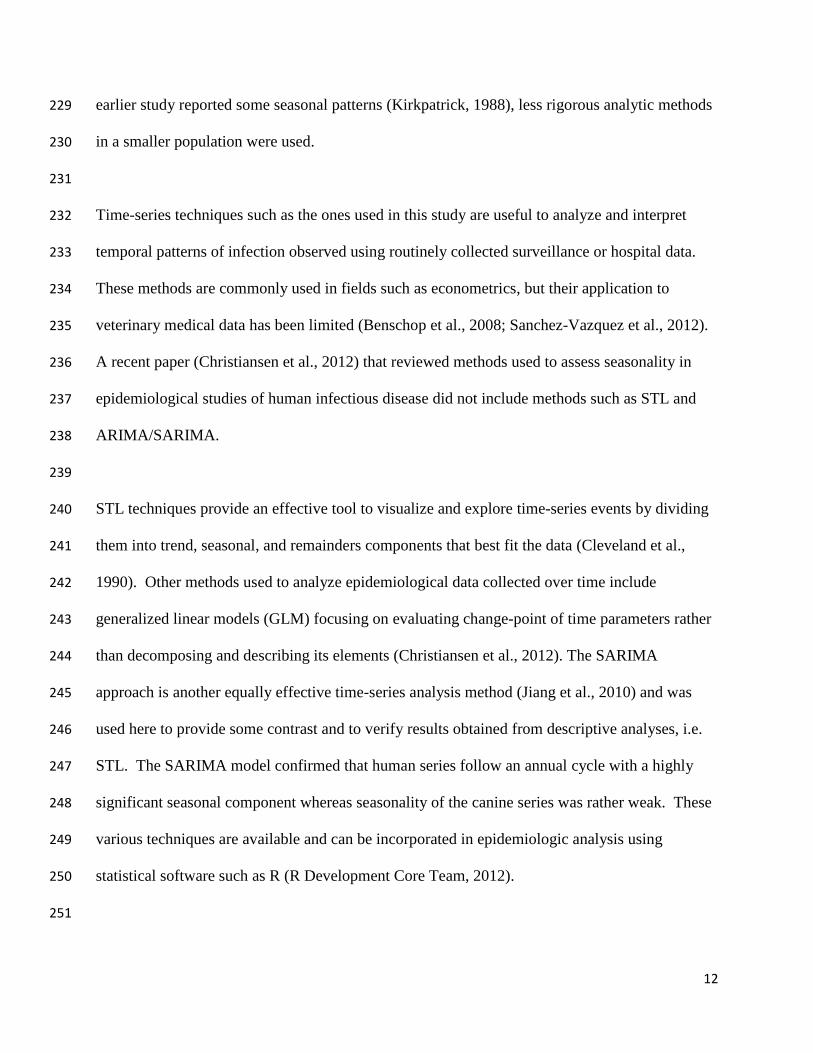
cases/100,000) peaking in July through October (Figure 2B). In contrast, the canine series trend 169
indicated a general decline over study period from a high of 0.70 (per 100 dogs) in 2003 to 0.30 170
(per 100 dogs) by the end of 2009 (Figure 3A). The seasonal pattern for this data series however 171
was irregular with a small magnitude of variation (±0.03 cases/100) (Figure 3B). 172
173
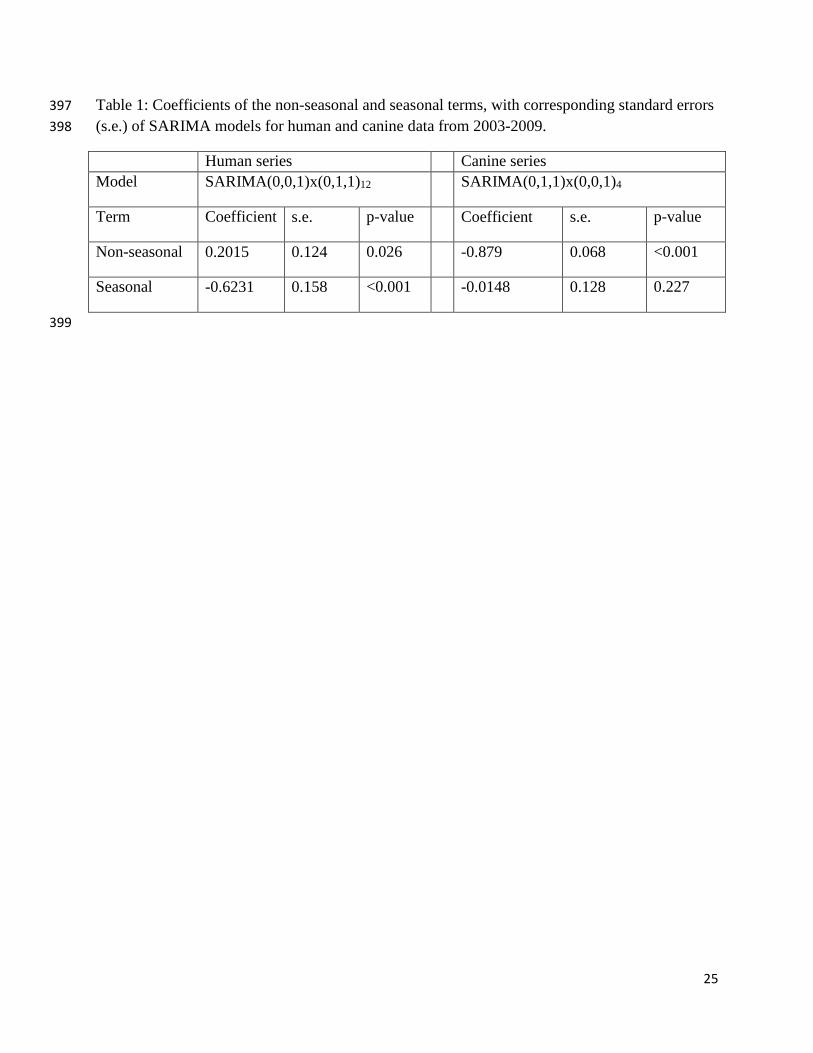
Fitting a SARIMA model for the human series indicated a non-seasonal moving-average and an 174
annual integrated seasonal moving-average term; both terms were statistically significant (Table 175
1). In comparison, the canine model included an integrated non-seasonal moving average and a 176
4-month seasonal moving-average term, yet only the non-seasonal term was statistically 177
significant. Both models were deemed to adequately fit the data given the uncorrelated residuals 178
and that Ljung-Box Q test of the residuals was not significant. 179
180
Note that it is also possible to fit a lagged regression type model where the human incidence 181
series is regressed against the lags of canine incidence series. Such a model, often called the 182
lagged regression or a SARIMA(X) model, needs to be approached carefully. As a first 183
10
step, the number of lags of canine incidence series to be included has to be estimated. To do 184
this, the so-called prewhitening (see, e.g. Shumway and Stoffer (2011)) has to be applied to 185
both sides of the regression equation. This operation transforms the input (canine 186
giardiasis) series into the white noise and, then, the cross-correlation between the 187
transformed output (human giardiasis) series and the just mentioned white noise. In our 188
specific case, the resulting cross-correlation did not have a single significant lag which 189
indicated that there is very little, if any, dependence between the temporal/seasonal 190
patterns of human and canine giardiasis series. 191
192
4. Discussion 193
To the best of our knowledge, this is the first study to use time-series techniques to analyze 194
temporal patterns of Giardia infection among dogs and people over multiple years in the United 195
States. Human data compared with canine data seemed to follow two different temporal patterns 196
suggesting that the generating processes underlying both series might be different, and that 197
Giardia transmission from dogs to humans and from humans to dogs might be uncommon. The 198
human data series exhibited a strong and regular annual cycle with peaks observed in July 199
through October months, but the canine series did not demonstrate any clearly defined 200
seasonality. Further research will be needed to determine if humans and dogs are simply 201
infected by different assemblages, or if the same assemblage/organism comes from different 202
sources. 203
204
The seasonal pattern of human giardiasis observed here is in agreement with prior CDC reports 205
and other studies that reported peaks of human giardiasis in the late summer and early fall 206
11
(Furness et al., 2000; Naumova et al., 2000). Although the main risk factors for giardiasis in 207
humans include contaminated water or food, the increased incidence during late summer months 208
may be attributable to increased human outdoor activities resulting in increased exposures. 209
Interestingly, the human incidence remained relatively constant throughout the seven-year period 210
based on national data. Other trends may have occurred at the state level, but this was not 211
investigated in this study. The ‘stable’ incidence in people may indicate the need for increased 212
efforts to educate the public about potential infection sources and appropriate preventive 213
measures. 214
215
The canine data showed a marked downward trend over the study period despite an increased 216
number of dogs being tested at Banfield veterinary hospitals for intestinal parasitism. This trend 217
is unlikely to reflect changes in diagnostic methods as all samples were examined by trained staff 218
following a standardized protocol in all Banfield hospitals. As previous research by our group 219
documented a higher risk of Giardia infection in pure breed vs. mixed breed dogs and in younger 220
vs. older dogs (Mohamed et al., 2013), the decreasing prevalence of Giardia infection in dogs 221
over time in this study may suggest that fewer puppies are coming from large puppy mills where 222
the prevalence of intestinal parasites is often higher compared with puppies that come from 223
private homes or non-commercial breeders with less crowded or stressful settings (Barr and 224
Bowman, 1994). Alternatively, these sources may be employing more methods in treatment or 225
prevention. The lack of seasonality in the canine series is not totally unexpected, however, and is 226
in agreement with the only available study that analyzed Giardia infection among dogs using 227
time-series techniques – albeit at a single hospital location (Nolan and Smith, 1995). Although an 228
12
earlier study reported some seasonal patterns (Kirkpatrick, 1988), less rigorous analytic methods 229
in a smaller population were used. 230
231
Time-series techniques such as the ones used in this study are useful to analyze and interpret 232
temporal patterns of infection observed using routinely collected surveillance or hospital data. 233
These methods are commonly used in fields such as econometrics, but their application to 234
veterinary medical data has been limited (Benschop et al., 2008; Sanchez-Vazquez et al., 2012). 235
A recent paper (Christiansen et al., 2012) that reviewed methods used to assess seasonality in 236
epidemiological studies of human infectious disease did not include methods such as STL and 237
ARIMA/SARIMA. 238
239
STL techniques provide an effective tool to visualize and explore time-series events by dividing 240
them into trend, seasonal, and remainders components that best fit the data (Cleveland et al., 241
1990). Other methods used to analyze epidemiological data collected over time include 242
generalized linear models (GLM) focusing on evaluating change-point of time parameters rather 243
than decomposing and describing its elements (Christiansen et al., 2012). The SARIMA 244
approach is another equally effective time-series analysis method (Jiang et al., 2010) and was 245
used here to provide some contrast and to verify results obtained from descriptive analyses, i.e. 246
STL. The SARIMA model confirmed that human series follow an annual cycle with a highly 247
significant seasonal component whereas seasonality of the canine series was rather weak. These 248
various techniques are available and can be incorporated in epidemiologic analysis using 249
statistical software such as R (R Development Core Team, 2012). 250
251

13
It is important to point out that both data sets have some shortfalls that could limit the scope of 252
interpreting the observed results. The human data was based on passive surveillance of Giardia 253
infection which is believed to be highly underreported (Nakada et al., 2012). The canine data by 254
comparison, despite the exceptionally large sample size, was based on the routinely performed 255
fecal flotation testing which is less sensitive compared to other diagnostic techniques such as 256
centrifugal flotation and ELISA (Zajac et al., 2002; Dryden et al., 2006). Additionally, the fecal 257
Giardia test results from dogs did not distinguish whether the dog being tested was 258
asymptomatic and the test was part of a routine wellness exam, or whether it was showing 259
clinical signs associated with an intestinal illness. In contrast, a higher proportion of the human 260
fecal tests were probably performed on individuals who were clinically symptomatic at the time. 261
Due to its retrospective nature, this study was limited in its capability to assess zoonotic risk or 262
source of infection in either species. Ideally, these would be evaluated by performing fecal tests 263
on dogs and humans in the same household at the same time. 264
265
5. Conclusion: 266
Time-series analysis of Giardia infection among humans and dogs in the United States for the 267
period from 2003 through 2009 showed that the temporal characteristics of the two data series 268
were different. The human data series exhibited a strong annual seasonal cycle, peaking in 269
August and September, and overall maintained a relatively constant incidence level during the 270
study period. The canine series over the same seven-year period had weak and irregular seasonal 271
fluctuation with an overall declining incidence trend. These findings suggest that underlying 272
transmission processes generating both series are likely to be different, raising additional 273
14
questions regarding the significance and extent of the risk of zoonotic transmission of Giardia 274
infection between dogs and people. 275
276
277
278
279
Conflict of interest statement: The authors declare no conflict of interest. 280

15
References: 281
Barnett, A.G., Dobson, A.J., 2010. Decomposing Time Series. In: Barnett, A.G., Dobson, A.J., 282 SpringerLink (Online service) (Eds.), Analysing Seasonal Health Data. Springer-Verlag Berlin 283 Heidelberg, Berlin, Heidelberg, 93. 284
Barr, S., Bowman, D., 1994. Giardiasis in dogs and cats. Comp. Cont. Educ. Pract. 16, 603 - 610. 285
Benschop, J., Stevenson, M.A., Dahl, J., Morris, R.S., French, N.P., 2008. Temporal and 286 longitudinal analysis of Danish Swine Salmonellosis Control Programme data: implications for 287 surveillance. Epidemiol. Infect. 136, 1511–1520. 288
Bianciardi, P., Papini, R., Giuliani, G., 2004. Prevalence of Giardia antigen in stool samples 289
from dogs and cats. Rev. Med. Vet. 8-9, 417-421. 290
Christiansen, C.F., Pedersen, L., Sørensen, H.T., Rothman, K.J., 2012. Methods to assess 291
seasonal effects in epidemiological studies of infectious diseases—exemplified by application to 292 the occurrence of meningococcal disease. Clin. Microbiol. Infec. 18, 963-969. 293
Cleveland, R.B., Cleveland, W.S., McRae, J.E., Thacker, E.L., 1990. STL: a seasonal-trend 294
decomposition procedure based on loess. J. Offic. Stat. 6, 3-73. 295
Covacin, C., Aucoin, D.P., Elliot, A., Thompson, R.C., 2011. Genotypic characterisation of 296
Giardia from domestic dogs in the USA. Vet. Parasitol. 177, 28-32. 297
Díaz, V., Campos, M., Lozano, J., Mañas, I., González, J., 1996. Aspects of animal giardiosis in 298
Granada province (southern Spain). Vet. Parasitol. 64, 171-176. 299
Dryden, M.W., Payne, P.A., Smith, V., 2006. Accurate diagnosis of Giardia spp and proper fecal 300
examination procedures. Vet. Ther. 7, 4-14. 301
Eisenstein, L., Bodager, D., Ginzl, D., 2008. Outbreak of giardiasis and cryptosporidiosis 302 associated with a neighborhood interactive water fountain--Florida, 2006. J. Environ. Health 71, 303 18-22. 304
Fontanarrosa, M.F., Vezzani, D., Basabe, J., Eiras, D.F., 2006. An epidemiological study of 305 gastrointestinal parasites of dogs from Southern Greater Buenos Aires (Argentina): age, gender, 306 breed, mixed infections, and seasonal and spatial patterns. Vet. Parasitol. 136, 283-295. 307
Furness, B.W., Beach, M.J., Roberts, J.M., 2000. Giardiasis surveillance—United States, 1992-308 1997. MMWR CDC Surveill. Summ. 49, 1-13. 309
Hunter, P.R., Thompson, R.C.A., 2005. The zoonotic transmission of Giardia and 310 Cryptosporidium. Int. J. Parasitol. 35, 1181-1190. 311
Hyndman, R.J., Khandakar, Y., 2008. Automatic time series forecasting: the forecast package for 312 R. J. Stat. Softw. 27, 1-22. 313

16
Jiang, B., Liang, S., Wang, J., Xiao, Z., 2010. Modeling MODIS LAI time series using three 314 statistical methods. Remote Sens. Environ. 114, 1432-1444. 315
Katz, D.E., Heisey-Grove, D., Beach, M., Dicker, R.C., Matyas, B.T., 2006. Prolonged outbreak 316 of giardiasis with two modes of transmission. Epidemiol. Infect. 13, 935-941. 317
Kirkpatrick, C.E., 1988. Epizootiology of endoparasitic infections in pet dogs and cats presented 318 to a veterinary teaching hospital. Vet. Parasitol. 30, 113-124. 319
Lal, A., Hales, S., French, N., Baker, M.G., 2012. Seasonality in human zoonotic enteric 320 diseases: a systematic review. PLoS ONE 7, e31883. 321
Mohamed, A.S., Glickman, L.T., Camp Jr, J.W., Lund, E., Moore, G.E., 2013. Prevalence and 322
risk factors for Giardia spp. infection in a large national sample of pet dogs visiting veterinary 323
hospitals in the United States (2003–2009). Vet. Parasitol. 324
http://dx.doi.org/10.1016/j.vetpar.2012.12.049. 325
Nakada, M., Iriguchi, C., Karato, S.-i., 2012. The viscosity structure of the D" layer of the Earth's 326 mantle inferred from the analysis of Chandler wobble and tidal deformation. Phys. Earth Planet. 327
In. 208, 11-24. 328
Naumova, E.N., Chen, J.T., Griffiths, J.K., Matyas, B.T., Estes-Smargiassi, S.A., Morris, R.D., 329
2000. Use of passive Surveillance data to study temporal and spatial variation in the incidence of 330 giardiasis and cryptosporidiosis. Public Health Rep. 115, 436-447. 331
Nolan, T.J., Smith, G., 1995. Time series analysis of the prevalence of endoparasitic infections in 332 cats and dogs presented to a veterinary teaching hospital. Vet. Parasitol. 59, 87-96. 333
Plutzer, J., Ongerth, J., Karanis, P., 2010. Giardia taxonomy, phylogeny and epidemiology: facts 334
and open questions. Int. J. Hyg. Environ. Health. 213, 321-333. 335
R Development Core Team, 2012. R: A Language and Environment for Statistical Computing. 336
R Foundation for Statistical Computing, Vienna, Austria, URL:http://www.R-project.org. 337
Sanchez-Vazquez, M.J., Nielen, M., Gunn, G.J., Lewis, F.I., 2012. Using seasonal-trend 338 decomposition based on loess (STL) to explore temporal patterns of pneumonic lesions in 339
finishing pigs slaughtered in England, 2005–2011. Prev. Vet. Med. 104, 65-73. 340
Scallan, E., Hoekstra, R.M., Angulo, F.J., Tauxe, R.V., Widdowson, M.-A., Roy, S.L., Jones, 341 J.L., Griffin, P.M., 2011. Foodborne illness acquired in the United States—major pathogens. 342 Emerg. Infect. Dis. 17, 7-15. 343
Shumway, R.H., Stoffer, D.S., 2011. ARIMA Models. Time Series Analysis and Its 344 Applications. Springer New York, 83-171. 345
Thompson, R.C.A., Hopkins, R.M., Homan, W.L., 2000. Nomenclature and genetic groupings of 346 Giardia infecting mammals. Parasitol. Today 16, 210-213. 347

17
US Census Bureau, 2009. Population Estimates. US Census Bureau, 348 http://www.census.gov/popest/data/historical/2000s/vintage_2009/index.html. 349
Yoder, J.S., Beach, M.J., Centers for Disease Control and Prevention (CDC), 2007. Giardiasis 350 Surveillance - United States, 2003-2005. MMWR Surveill. Summ. 56, 11-18. 351
Yoder, J.S., Harral, C., Beach, M.J., Centers for Disease Control and Prevention (CDC), 2010. 352 Giardiasis Surveillance - United States, 2006-2008. MMWR Surveill. Summ. 59, 15-25. 353
Zajac, A.M., Johnson, J., King, S.E., 2002. Evaluation of the importance of centrifugation as a 354
component of zinc sulfate fecal flotation examinations. J. Am. Anim. Hosp. Assoc. 38, 221-224. 355
356

18
Table Legends 357
Table 1: Coefficients of the non-seasonal and seasonal terms, with corresponding standard errors 358
(s.e.) of SARIMA models for human and canine data from 2003-2009. 359

19
Figure captions 360
Figure 1: Time plots of human giardiasis (A) reported to CDC and percent of positive fecal 361
canine tests (B) at Banfield Pet Hospital, by month, United States 2003 -- 2009. 362
363
Figure 2A: STL decomposition of human giardiasis by month, United States, 2003 – 2009, into 364
trend, seasonal and remainder components. The y-axis scale represents cases/100,000. 365
366
Figure 2B: Plots of average monthly incidence of human giardiasis cases/100,000 (y-axis) from 367
the surveillance raw data (top) and STL seasonal component (bottom), United States, 2003 - 368
2009. 369
370
Figure 3A: STL decomposition of canine giardiasis at Banfield hospitals, 2003-2009, into trend, 371
seasonal and remainder components. The y-axis scale represents positive fecal tests/100 dogs. 372
373
Figure 3B: Plots of average monthly prevalence of positive fecal tests (y-axis) among dogs from 374
the raw data (top) and STL seasonal component (bottom). 375
376

20
Figure 1: Time plots of human giardiasis (A) reported to CDC and percent of positive fecal 377
canine tests (B) at Banfield Pet Hospital, by month, United States 2003 -- 2009. 378
379
A
Pre
vale
nce (
per
10
0,0
00)
2003 2004 2005 2006 2007 2008 2009 2010
0.5
0.7
0.9
1.1
B
Years
Pre
vale
nce (
%)
2003 2004 2005 2006 2007 2008 2009 2010
0.3
0.5
0.7
0.9
21
Figure 2A: STL decomposition of human giardiasis by month, United States, 2003 – 2009, into trend, seasonal and remainder 380
components. The y-axis scale represents cases/100,000. 381
382
383 384

22
Figure 2B: Plots of average monthly incidence of human giardiasis cases/100,000 (y-axis) from 385 the surveillance raw data (top) and STL seasonal component (bottom), United States, 2003 - 386
2009. 387
388
data
J F M A M J J A S O N D
0.5
0.7
0.9
1.1
season
al
J F M A M J J A S O N D
-0.2
0.0
0.1
0.2
0.3
0.4

23
Figure 3A: STL decomposition of canine giardiasis at Banfield hospitals, 2003-2009, into trend, seasonal and remainder components. 389
The y-axis scale represents positive fecal tests/100 dogs. 390
391 392

24
Figure 3B: Plots of average monthly prevalence of positive fecal tests (y-axis) among dogs from 393
the raw data (top) and STL seasonal component (bottom). 394
395
396
data
J F M A M J J A S O N D
0.3
0.5
0.7
0.9
season
al
J F M A M J J A S O N D
-0.0
4-0
.02
0.0
00
.02
25
Table 1: Coefficients of the non-seasonal and seasonal terms, with corresponding standard errors 397
(s.e.) of SARIMA models for human and canine data from 2003-2009. 398
Human series Canine series
Model SARIMA(0,0,1)x(0,1,1)12 SARIMA(0,1,1)x(0,0,1)4
Term Coefficient s.e. p-value Coefficient s.e. p-value
Non-seasonal 0.2015 0.124 0.026 -0.879 0.068 <0.001
Seasonal -0.6231 0.158 <0.001 -0.0148 0.128 0.227
399


