Full Terms & Conditions of access and use can be found athttp://www.tandfonline.com/action/journalInformation?journalCode=fapb20
Download by: [University of Malaya] Date: 25 September 2016, At: 20:11
Asia Pacific Business Review
ISSN: 1360-2381 (Print) 1743-792X (Online) Journal homepage: http://www.tandfonline.com/loi/fapb20
Institutional support, technological capabilitiesand domestic linkages in the semiconductorindustry in Singapore
Rajah Rasiah & Yap Xiao Shan
To cite this article: Rajah Rasiah & Yap Xiao Shan (2016) Institutional support, technologicalcapabilities and domestic linkages in the semiconductor industry in Singapore, Asia PacificBusiness Review, 22:1, 180-192, DOI: 10.1080/13602381.2014.990213
To link to this article: http://dx.doi.org/10.1080/13602381.2014.990213
Published online: 16 Dec 2014.
Submit your article to this journal
Article views: 99
View related articles
View Crossmark data
Institutional support, technological capabilities and domestic linkagesin the semiconductor industry in Singapore
Rajah Rasiah* and Yap Xiao Shan
Department of Development Studies, University of Malaya, Kuala Lumpur, Malaysia
(Received 24 February 2013; accepted 12 August 2014)
This article examines the relationships between host-site institutional support and firm-level technological upgrading, and between technological upgrading and domesticproduction linkages in the semiconductor industry in Singapore. An evolutionaryperspective was used to measure technological capabilities using knowledge embodiedin machinery, organization, processes and products. The results show that host-siteinstitutional support is important for technological upgrading, and technologicalcapabilities are positively correlated with domestic linkages. Also, domestic linkagesrather than regional linkages were correlated with technological upgrading, which is aconsequence of Singapore’s sophisticated infrastructure compared to its neighbours inSouth-east Asia.
Keywords: domestic production linkages; institutional support; semiconductors;Singapore; technological capabilities
Introduction
Semiconductor firms were among the early multinational corporations (MNCs) to relocate
production in Singapore in the late 1960s. National Semiconductor and later Fairchild
relocated assembly activities in Singapore in 1969. By the mid-1970s, Texas Instruments,
Fairchild, Motorola, National Semiconductor, Signetics, Radio Company of America,
Intel, American Microsystems and Mostek had started massive production activities in
Singapore. Whereas Fairchild and Motorola have since been sold to Schlumberger and
Freescale, national firms such as Carter Semiconductor and Avago entered semiconductor
production. Meanwhile, the Taiwanese firms of United Microelectronics Company
(UMC), Taiwan Semiconductor Manufacturing Corporation (TSMC) and Advanced
Semiconductor Equipment have entered production to raise Singapore as a major exporter
of semiconductor devices in the world.
The Economic Development Board (EDB) has been at the forefront promoting the
relocation of foreign MNCs from the late 1960s, and since the 1980s instrumental in
pursuing a leveraging strategy to stimulate technological upgrading into high value-added
activities such as chip design, wafer fabrication and R&D support activities. The country’s
sovereign wealth fund, i.e. Temasek Holdings, has also supported acquisition of
semiconductor firms, such as Carter Semiconductor.
In light of the questions posed in the first article we seek to test the hypotheses: one,
institutions in support for high-tech activities are positively correlated with firm-level
technological capabilities and, two, technological capabilities support positively domestic
production linkages. The focus on domestic as opposed to regional production linkages is
q 2014 Taylor & Francis
*Corresponding author. Email: [email protected]
Asia Pacific Business Review, 2016
Vol. 22, No. 1, 180–192, http://dx.doi.org/10.1080/13602381.2014.990213
targeted at analysing Singapore’s advanced institutional support activities. The rest of the
article is organized as follows. Section 2 discusses the importance of the semiconductor
industry to the Singapore’s economy. Section 3 reviews past literature on technological
upgrading in the semiconductor industry in Singapore. Section 4 presented the
methodology and data used in testing the two hypotheses. Section 5 evaluates the
importance of institutional support and regional production links on technological
capabilities. Section 6 concludes.
Why the semiconductors industry in Singapore?
When National Semiconductor and Fairchild relocated operations in 1969, they were
among pioneering foreign MNCs that initiated modern manufacturing in Singapore. Being
a high-tech industry, semiconductor operations have continued to remain important as
Singapore grew rapidly to become a developed country where only high value-added
operations could be sustained in an economy where wages are high. Given the importance
of integrated circuits in driving technological upgrading in other industries, the industry
has also received massive government support.
Importance to the national economy
As shown in Table 1, the contribution of the electronics industry in Singapore’s economy
has been substantial. Although the employment share fell from 115,000 in 1990 to 102,000
in 2000 and 82,000 in 2010, value added in 1990 prices rose from US$7.4 billion in 1990
to US$14.9 billion in 2000 and US$15.1 billion in 2010. Value added grew at 7.3% per
annum on average in 1990–2000 but slowed down considerably to 0.13% in 2000–2010.
The slowdown in the second period is a consequence of the global financial crisis of
2008–2009 when electronics exports collapsed.
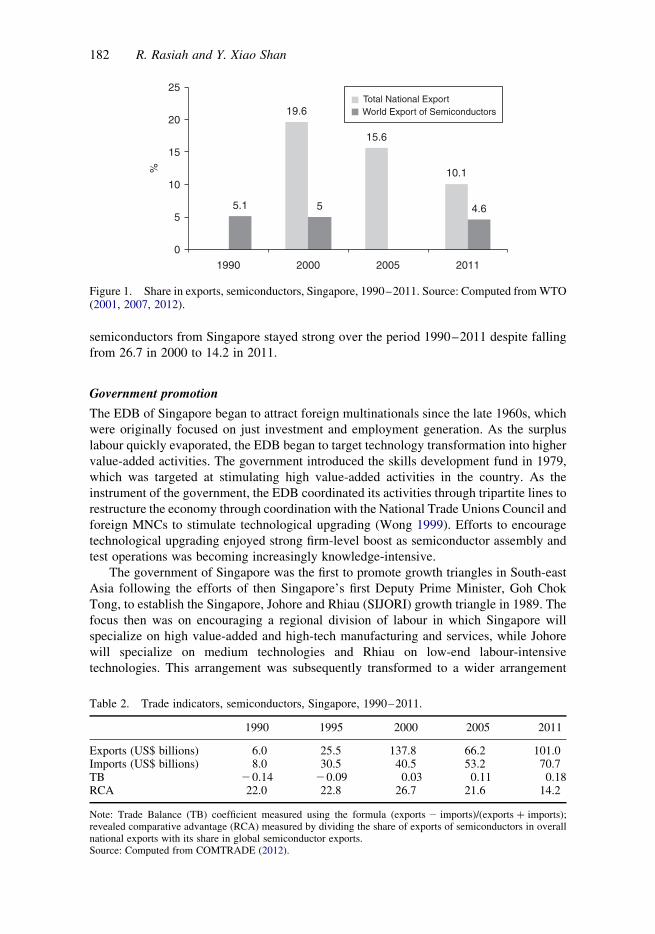
The significance of semiconductors to Singapore’s economy can also be observed in
the share of electronics component exports. Singapore accounted for 5.1% of world export
of electronics components in 1990, a share that has fell slightly to 4.6% in 2011 (see
Figure 1). The share of electronics components in the overall exports from Singapore fell
from 19.6% in 2000 to 10.1% in 2011.1
Whereas semiconductor imports have continued to grow strongly over the period
1990–2011, exports fell in the period 2000–2005 (see Table 2). The fall in exports is
largely a consequence of restructuring within the industry as less technology-intensive
production was relocated out. The expansion in wafer fabrication helped raise exports
again in 2011. Hence, the trade balance coefficient rose consistently from 2 0.14 in 1990
to 0.03 in 2000 and 0.18 in 2011. The revealed comparative advantage (RCA) for
Table 1. Share of employment and value added in manufacturing, electronics, Singapore, 1990–2010.
Year Employment Value added (US$ millions in 1990 prices)
Share in manufacturing (%)
Employment Value added
1990 115,166 7357.9 32.8 79.12000 102,149 14,898.6 33.2 71.92010 81,950 15,097.1 19.8 41.2
Source: Huff (1994) and Singapore Department of Statistics (2012).
Asia Pacific Business Review 181
semiconductors from Singapore stayed strong over the period 1990–2011 despite falling
from 26.7 in 2000 to 14.2 in 2011.
Government promotion
The EDB of Singapore began to attract foreign multinationals since the late 1960s, which
were originally focused on just investment and employment generation. As the surplus
labour quickly evaporated, the EDB began to target technology transformation into higher
value-added activities. The government introduced the skills development fund in 1979,
which was targeted at stimulating high value-added activities in the country. As the
instrument of the government, the EDB coordinated its activities through tripartite lines to
restructure the economy through coordination with the National Trade Unions Council and
foreign MNCs to stimulate technological upgrading (Wong 1999). Efforts to encourage
technological upgrading enjoyed strong firm-level boost as semiconductor assembly and
test operations was becoming increasingly knowledge-intensive.
The government of Singapore was the first to promote growth triangles in South-east
Asia following the efforts of then Singapore’s first Deputy Prime Minister, Goh Chok
Tong, to establish the Singapore, Johore and Rhiau (SIJORI) growth triangle in 1989. The
focus then was on encouraging a regional division of labour in which Singapore will
specialize on high value-added and high-tech manufacturing and services, while Johore
will specialize on medium technologies and Rhiau on low-end labour-intensive
technologies. This arrangement was subsequently transformed to a wider arrangement
19.6
15.6
10.1
5.1 5 4.6
0
5
10
15
20
25
1990 2000 2005 2011
%
Total National ExportWorld Export of Semiconductors
Figure 1. Share in exports, semiconductors, Singapore, 1990–2011. Source: Computed fromWTO(2001, 2007, 2012).
Table 2. Trade indicators, semiconductors, Singapore, 1990–2011.
1990 1995 2000 2005 2011
Exports (US$ billions) 6.0 25.5 137.8 66.2 101.0Imports (US$ billions) 8.0 30.5 40.5 53.2 70.7TB 20.14 20.09 0.03 0.11 0.18RCA 22.0 22.8 26.7 21.6 14.2
Note: Trade Balance (TB) coefficient measured using the formula (exports 2 imports)/(exports þ imports);revealed comparative advantage (RCA) measured by dividing the share of exports of semiconductors in overallnational exports with its share in global semiconductor exports.Source: Computed from COMTRADE (2012).
182 R. Rasiah and Y. Xiao Shan

when the Indonesia–Malaysia and Singapore Growth Triangle (IMS-GT) was established
in 1994 (Majid 2010). It subsequently led to the development of the Batam, Bintan,
Karimun Free Trade Zone (FTZ) in the Rhiau Islands with strong support from Temasek
Holdings, which is sovereign wealth fund from Singapore. The implications of this
arrangement are that electronics firms enjoying special incentives in the FTZ in Rhiau only
export low-end products to Singapore. Similarly, the firms enjoying contract services with
electronics firms in Singapore also export low-end inputs to Singapore.2 Hence, regional
linkages will have no bearing for stimulating technological upgrading in Singapore.
The government strengthened its host sites’ institutions further by offering R&D
grants, equity in high-tech firms and R&D laboratories from the 1990s (Mathews 1999).
Hence, domestic linkages, especially through the acquisition of fabricated wafers from
firms, such as UMC and TSMC, or sales to Advanced Semiconductor Engineering helped
spur further technological upgrading in Singapore. Such purchases and sales obviously
show higher technological intensities and value-added activities than imports from
Indonesia and Malaysia.3 Apart from foreign MNCs, national firms, such as Avago and
Carter Semiconductor began to take advantage of incentives and grants from the
government, as well as wafer fabrication activities by foreign MNCs in Singapore to
expand into high-tech operations in the semiconductor industry. Indeed, Singapore had
upgraded so much that trade with its neighbours of China, Malaysia, Philippines and
Indonesia took a technical division of labour that placed Singapore with higher value-
added against lower value-added stages in China, Malaysia, Philippines and Indonesia.
Theoretical considerations
The two key relationships we seek to examine are the influence of host-site institutional
support facilities on technological capabilities (TC) and the influence of regional trade
linkages (RL) on technological capabilities. In doing so, we have avoided examining the
much researched link between exports and technological capabilities. While the former is
little tested in the developing regions, the latter is important because of the growing
importance of East Asia in global economic growth. The concepts of TC and RL have been
defined in Rasiah, Kimura, and Oum (2014).
Host-site institutional support and technological capabilities
The importance of host-site institutional support to stimulate the upgrading of
technological capabilities was first discussed by industrial policy exponents (Smith
1776; Hamilton 1791; List 1909). North (1991) referred to institutions as the ‘rules of the
game’ and organizations and entrepreneurs as ‘the players’. Williamson (1985) associated
institutions with ‘governing structures’ that mould economic activity, like a nation’s
financial ‘institutions’, or the way firms tend to be organized and managed.
Host-site institutions and meso organizations associated with generating and
stimulating knowledge flows are critical to attract the relocation of high-tech firms or
for existing firms to upgrade technological capabilities. In the developed countries of the
USA, Germany and Japan, and the recently developed countries of South Korea, Taiwan
and Singapore, the government is a major financier of public goods, including knowledge
generation through the provision of R&D grants (OECD 2013).
Where foreign multinationals have stimulated technology transfer to national firms,
they are unlikely to relocate frontier R&D activities at host sites unless it involves the
exploration or development of rare host-site resources, or when the host site is endowed
Asia Pacific Business Review 183
with strong research-based universities. Also, there is evidence of multinationals
undertaking R&D in pharmaceuticals in the developing economies owing to the
availability of rare flora and human capital (Rasiah 2006), and offshoring of electronics
R&D to benefit from strong high-tech support institutions in Taiwan (Ernst and Kim
2002). Motives of multinationals matter in such relocation decisions (see Cantwell and
Mudambi 2005). Also, in the integrated circuits industry, there is only evidence of MNCs’
frontier R&D activities being relocated at host sites endowed with strong research
universities, e.g. Samsung Semiconductor and Taiwan Semiconductor Manufacturing
Company in the USA (Gartner 2013).
Although employees in firms gain significant knowledge through training and learning
by doing in firms (Marshall 1890; Penrose 1959), universities and R&D laboratories are
important nodes of knowledge that firms access through hiring graduates, contract training
projects and R&D activities. Especially in high-tech industries firms rely extensively on
hiring competent engineers and scientists to carry out R&D and commercialization
activities (Nelson 1993).
While it is important that host-site organizations participate in generating knowledge,
it is also critical that they are cohesively integrated with firms (Mytelka 2000). Nelson
(2008), Lundvall (1992) and Edquist (2004) addressed the importance of interdependent
and interactive links between firms and organizations. Connectivity and coordination are
critical for knowledge flows – beyond simply codified information that markets can
coordinate. The focus is really on technological capabilities that are evolved in firms
through linkages with high-tech organizations such as training institutes, standards
organizations and R&D laboratories. Thus, we hypothesize that firm-level TC is correlated
with host-site high-tech institutional (HI).
Domestic linkages and technological capabilities
The rapid expansion of East Asia has attracted a number of theories on regional trade
linkages. Regional trade and investment linkages in East Asia can be first traced to
Akamatsu (1962). Subsequently, Krugman’s (1991) work on the new geography that
discusses economic integration and its effects on growth synergies has become important.
Unlike typical developing economies integrating regionally in the presence of
technological sophisticated economies, firms in Singapore had already upgraded their
technological capabilities significantly over four decades. Hence, the Akamatsu (1962)
framework would mean that firms in Singapore (which is a first-tier wedge country behind
Japan) would rely little from trade with firms in the less developed economies of East Asia,
such as Malaysia, Indonesia and China (Rasiah, Kimura, and Oum, 2014). It is for these
reasons we chose domestic linkages as sales and purchases to suppliers and buyers in
Singapore will apply higher pressure to raise firm-level technological capabilities.
Singapore as a large metropolitan city-state supports Krugman’s (1991) new
geography argument that explains economic growth on the basis of geographical
proximity as economies become increasingly more integrated. The city-state has
developed extensively its high-tech infrastructure to stimulate the upgrading of firm-level
technological capabilities.
While firms have evolved strongly in Japan, South Korea and Taiwan, Singapore’s
high-tech infrastructure and sophisticated buyer–supplier networks have ensured that
domestic demand-supply buyer–seller influences on firm-level technological upgrading
have become important. Because most semiconductor trade in East Asia is conducted with
China, Indonesia, Philippines andMalaysia, which are all characterized by technologically
184 R. Rasiah and Y. Xiao Shan

inferior firms than Singapore, we examine the influence of domestic linkages on firm-level
technological capabilities.4
Review of past works on Singapore
Work on technology development in the semiconductor industry in Singapore is somewhat
sketchy and is primarily located within the broader electronics industry. Mathews and Cho
(2000) are an exception as they provide the dominant role of the government in pursuing a
leveraging strategy to stimulate upgrading in the industry, while Hobday (1995) offered
evidence of growing incidence of innovation by semiconductor MNCs in Singapore.
Hence, Hobday (1995) observed considerable incremental innovations taking place in
foreign MNCs in Singapore. This initiative received a boost when Hewlett Packard chose
to relocate back-end wafer fabrication activities in Singapore in 1985. The government
then assumed a leveraging strategy to coordinate further upgrading in the country (see
Mathews 1999; Mathews and Cho 2000). The government’s twin strategy of taking equity
and providing buildings and R&D labs, and enhancement of the infrastructure with
cutting-edge environment-friendly mechanisms to support wafer fabrication activities
attracted a massive relocation of wafer fabrication plants. In addition to working directly
with the MNCs, the EDB also coordinates upgrading initiatives through strong interaction
with the Association of Electronics Industries of Singapore (AEIS) and the Singapore
Manufacturers’ Federation (Santiago 2007, 14).
Singapore managed to offer cutting-edge waste treatment, uniform band-power, grants
for high-tech activities – chip design, wafer fabrication, supportive R&D and even high-
tech assembly and test services – has attract level 5 knowledge activities if one uses
Rasiah’s (2010) 1–6 classification of knowledge-based activities in the semiconductor
industry. Levels 5 and 6 knowledge activities in Rasiah’s typology refer to firms
undertaking R&D in-house, while level 6 is devoted to frontier R&D in which the firm
shapes the technology frontier by launching the products first. Consistent with Amsden
and Tschang’s (2003) classification of MNC activities in Singapore, the R&D activities
undertaken in the country are not new to the universe. The supporting services that have
help make the semiconductor industry in Singapore an integrated include the production of
silicon wafers, photo-masks and a highly pure hydrogen peroxide (Santiago 2007, 14).
The aggressive promotional and leveraging efforts of EDB transformed the
semiconductor industry to attract almost all the stages of the value chain. There were
10 national and 24 foreign semiconductor firms in Singapore in 2011 (Gartner 2011a,
2011b). The breakdown of the national firms included Avago attempting to undertake
frontier R&D, though it is still behind Korean and Taiwanese firms in R&D activities.5
The remaining national firms were engaged in chip design (1), supportive R&D activities
(1), wafer fabrication (3) and assembly and test activities (4). No foreign firm was engaged
in frontier R&D activities in Singapore, while among foreign MNCs, 7 firms were engaged
in chip design, 1 in supportive R&D, 4 in wafer fabrication and 12 in assembly and test
activities. Some firms had more than one wafer fabrication plants.
Methodology and data
Taking the cue from the introduction to this special issue (Rasiah, Kimura, and Onum,
2014), the exercise focuses on answering the questions of whether host-site institutional
support matters to explain technological upgrading, and whether technological capabilities
are important in firms’ participation in domestic production linkages. As review in the
Asia Pacific Business Review 185
previous section shows, no works have examined robustly these relationships on the
semiconductor industry in Singapore.
Hence, the analytic framework focuses directly on the statistical relationship between
high-tech institutional support and technological capability, and technological capability
and domestic production linkages. The dependent variables examined in this article are
technological capability and domestic production linkages. In the first, the focus is on
examining the influence of host-site institutional support on technological capabilities,
while, in the second, the focus is on the influence of technological capabilities on domestic
production linkages.
Specification of variables
The variables for examining the statistical relationships are specified in this section.
Dependent variables
Technological capability (TC) was estimated using the following six proxies:
TC2 f ðCIQT;AC; PD;RD;TE; PATÞ;where CIQT refers to cutting-edge inventory and quality control techniques (CIQT) of
statistical process control (SPC), quality control circles (QCC), any one of the international
standards organization (ISO) series, total preventive maintenance (TPM), integrated
materials resource planning (MRP2) and total quality management (TQM). A score of 1
was added for presence of each of these techniques; AC refers to the presence of adaptive
capabilities (AC) on processes, layouts, machinery and products. A score of 1 was added
for the presence of each of them; PD refers to the presence of product development (PD)
which is counted as 1 if it exists and 0 otherwise; RD refers to R&D expenditure as a share
of sales; TE refers to training expenditure as a share of payroll; PAT refers to the number of
patents taken in the USA. The normalization formula (Xi 2 Xmin)/(Xmax 2 Xmin) was used
to convert each of the six proxies to the range of 0–1 before they are added; Xi, Xmin and
Xmax refer to the observed, minimum and maximum values, respectively.
Domestic production linkages (DL) was estimated using the following formula:
DL ¼ DS=TSþ DP=TP;
where RS/TS refers to percentage share of intermediate sales in total sales to firms in East
and South-east Asia; RP/TP percentage share of intermediate purchases in total purchases
from East and South-east Asia.
Explanatory variables
HI support was estimated using the following formula:
HI2 f ðRDG;RU;RDSEÞ;where RDG refers to R&D grants enjoyed by the firm from the host government (yes ¼ 1;
no ¼ 0); RU refers to firms’ Likert scale (1–5) rating of presence of research universities;
RDSE refers to firms’ Likert scale (1–5) rating of presence of strong supply of R&D
scientists and engineers. TC is also used as the explanatory variable when examining RL
as the dependent variable.
186 R. Rasiah and Y. Xiao Shan

Control variables
Size was dropped from the list of control variables used because of colinearity problems
with HI and DL. Foreign ownership (FO), and age (A) were used as the control variables,
and were measured as follows:
FO ¼ FE=TE;
where FE/TE refers to percentage share of foreign equity in total equity.
A ¼ age of the firm:
All figures used were from year 2011 unless otherwise stated.
Specification of OLS regressions
We found the ordinary least squares (OLS) regressions robust enough as the constant was
not significant suggesting that the model did not suffer from endogeneity problems. The
OLS model used to analyse the existence of a statistical relationship between TC and HI,
and between DL and TC is presented in models (1) and (2). FO and A are the control
variables used in Equation (1). We did not use size as a control variable because of
colinearity problems with HI.
TC ¼ aþ b1HIþ b2FOþ b3Aþ m: ð1Þ
The second OLS regression was targeted at examining the relationship between TC
and DL. Again, FO and A were used as the control variables.
TC ¼ aþ b1DLþ b2Aþ b3FOþ m; ð2Þ
where DL is the explanatory variable, and FO and A are the control variables.
Data
A stratified random sampling procedure based on ownership was adopted to gather data
from the semiconductor industry in Singapore. The data collection instrument used comes
from a refined version of questionnaires used in previous studies by Rasiah (2010).
Although data on employment, sales, exports, R&D expenditure and training expenditure
were drawn for the years 2000, 2006 and 2011, the analysis is confined to 2011 as the data
on most technological, human capital and institutional support proxies were limited to
only 2011.
The survey questionnaire was sent to all semiconductor firms in Singapore. The
response rate was 57%, which was 11 foreign and 4 national firms of the population of 22
and 7 foreign and national firms in 2012, respectively (Table 3). We managed to obtain
responses from all the 9 foreign and 16 national supporting firms strongly production
linked but in complementary activities in machinery and equipment and plastic materials.
These firms were identified from the 15 semiconductor firms that participated in the
survey. Hence, the empirical analysis is based on a semiconductor cluster totalling 40
firms.
Asia Pacific Business Review 187
Findings
Weanalyse in this section the empirical evidence collected from theSingapore semiconductor
cluster sample. The first part focuses on technological deepening, export-intensity and
domestic purchases and sales in total sales and purchases. The second examines the
descriptive statistics using the Levene’s two-tailed t-test with a focus on means. The third
evaluates the results of the simultaneous equations on the relationship between host-site
institutional support and domestic linkages, and firm-level technological upgrading.
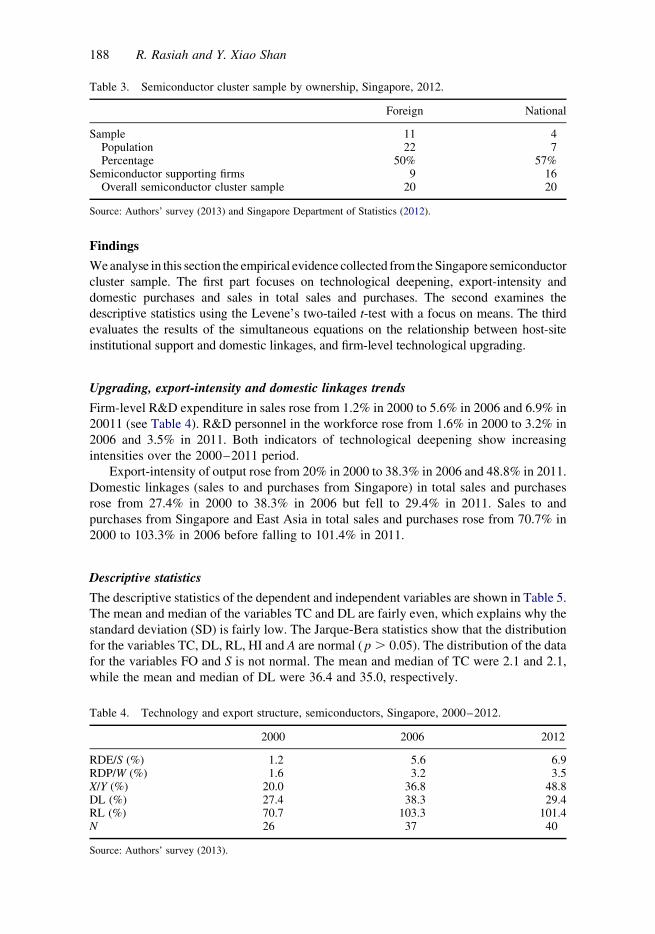
Upgrading, export-intensity and domestic linkages trends
Firm-level R&D expenditure in sales rose from 1.2% in 2000 to 5.6% in 2006 and 6.9% in
20011 (see Table 4). R&D personnel in the workforce rose from 1.6% in 2000 to 3.2% in
2006 and 3.5% in 2011. Both indicators of technological deepening show increasing
intensities over the 2000–2011 period.
Export-intensity of output rose from 20% in 2000 to 38.3% in 2006 and 48.8% in 2011.
Domestic linkages (sales to and purchases from Singapore) in total sales and purchases
rose from 27.4% in 2000 to 38.3% in 2006 but fell to 29.4% in 2011. Sales to and
purchases from Singapore and East Asia in total sales and purchases rose from 70.7% in
2000 to 103.3% in 2006 before falling to 101.4% in 2011.
Descriptive statistics
The descriptive statistics of the dependent and independent variables are shown in Table 5.
The mean and median of the variables TC and DL are fairly even, which explains why the
standard deviation (SD) is fairly low. The Jarque-Bera statistics show that the distribution
for the variables TC, DL, RL, HI and A are normal ( p . 0.05). The distribution of the data
for the variables FO and S is not normal. The mean and median of TC were 2.1 and 2.1,
while the mean and median of DL were 36.4 and 35.0, respectively.
Table 3. Semiconductor cluster sample by ownership, Singapore, 2012.
Foreign National
Sample 11 4Population 22 7Percentage 50% 57%
Semiconductor supporting firms 9 16Overall semiconductor cluster sample 20 20
Source: Authors’ survey (2013) and Singapore Department of Statistics (2012).
Table 4. Technology and export structure, semiconductors, Singapore, 2000–2012.
2000 2006 2012
RDE/S (%) 1.2 5.6 6.9RDP/W (%) 1.6 3.2 3.5X/Y (%) 20.0 36.8 48.8DL (%) 27.4 38.3 29.4RL (%) 70.7 103.3 101.4N 26 37 40
Source: Authors’ survey (2013).
188 R. Rasiah and Y. Xiao Shan

Given the maximum possible score of 15 for HI, the mean (9.9) and medians (10.0) are
high and the highest score achieved is 14, while the lowest is 3. The firms in the sample
show mean and median ages of 16.8 and 14 years with a minimum age of 3 years and a
maximum age of 41 years in 2011, respectively. The mean (1101.5) and median (550.0)
employment sizes were considerably different, which is because of the wide dispersion
(SD: 1475.0) firm size with the largest firm employing 7500 employees, while the smallest
firm employing 9 employees. HC had a mean and median of 58.8 and 53.5 with maximum
and minimum percentages of 100 and 21, respectively.
Statistical relationships
The statistical analysis establishing the relationship between TC and DL, and HI and TC is
undertaken in this section, respectively. We present technological deepening over the
period 2000–2011 in the first subsection, the descriptive statistics in the second subsection
and subsequently the two-stage regression results in the next subsection.
The model fit (F-stat.) for the two equations was run to examine the relationship
between TC and HI, and DL and TC were significant, and, hence, the results are
interpreted in this section.
Technological capabilities
The OLS regression results show that the model fit was significant at the 5% level (see
Table 6). Among the independent variables, only HI was significant. The insignificant
constant shows that the results do not suffer from endogeneity problems. FO is not
significant suggesting that there is no obvious statistical difference in the technological
capabilities of foreign and domestic firms in the semiconductor firms in Singapore. The
results show that host-site institutional support has a bearing on firm-level technological
capabilities of semiconductor firms in Singapore.
Domestic linkages
The relationship between domestic linkages and technological capabilities was also
significant (see Table 7). The OLS regression results show that DL is positively correlated
Table 5. Descriptive statistics of selected variables, semiconductor firms, Singapore, 2012.
TC DL HI A FO S HC
Mean 2.095 36.402 9.875 16.800 0.500 1101.450 58.825Median 2.087 35.000 10.000 14.000 0.500 550.000 53.500Maximum 6.379 89.999 14.000 41.000 1.000 7500.000 100.000Minimum 1.000 0.000 3.000 3.000 0.000 9.000 21.000SD 0.591 19.831 1.682 10.008 0.506 1474.977 21.631Skewness 1.040 0.611 21.437 0.492 0.000 2.677 0.512Kurtosis 3.104 3.629 4.802 2.216 1.000 10.944 2.295Jarque-Bera 4.281 2.993 5.034 2.637 6.667 152.962 2.579P-value 0.061 0.224 0.056 0.268 0.036 0.000 0.275
Sum 83.806 1383.264 266.000 672.000 20.000 44,058.000 2353.000Sum SD 13.623 14,551.73 81.100 3906.400 10.000 84,846,742 18,247.780N 40 40 40 40 40 40 40
Source: Computed from authors’ survey (2013).
Asia Pacific Business Review 189

with TC at 1% significance level. The influence of DL on TC appears stronger than the
influence of host-site high-tech institutional support on TC underlining the importance of
domestic linkages in stimulating upgrading of firm-level technological capabilities in
semiconductor firms. FO was not significant suggesting that there was not obvious
difference in domestic sales and purchases by ownership among semiconductor firms in
Singapore. The results did not suffer from endogeneity problems as the constant was not
significant.
Taken together, the results show that TC is correlated with both institutional support
and domestic linkages. The supply of R&D engineers and scientists, R&D grants and
support from universities and R&D labs has been viewed by firms as important in
stimulating technological upgrading. Firm-level technological upgrading has also been
important to drive strong domestic linkages to purchasers and buyers.
Conclusions
The semiconductor industry has obviously been a major industry in the economy of
Singapore since its birth in 1969. In addition to contributing significantly to employment,
value added and exports, the industry has also been a major platform in which rapid
technological upgrading has enabled Singapore to enjoy high per capita incomes. The
incentive system in Singapore has attracted significant participation by foreign MNCs and
national firms in the high value-added activities of chip design, wafer fabrication and R&D
Table 6. OLS regression, semiconductors, Singapore, 2012.
Coeff. T-stat. P-value
C 0.298 0.933 0.357HI 0.060 0.039 0.047**A 0.117 0.188 0.121FO 0.002 0.016 0.988N 40R2 0.144R2 0.073F-stat. 3.026 0.051*
Note: Dependent variable, TC; explanatory variable, HI.*Statistical significance at 10%; ****Statistical significance at 5%.Source: Authors’ survey (2013).
Table 7. OLS regressions, semiconductors, Singapore, 2012.
Coeff. T-stat. P-value
C 7.064 0.496 0.623DL 31.774 3.560 0.001*A 21.332 20.292 0.772FO 2.109 0.374 0.711N 40R2 0.280R2 0.217F-stat. 4.418 0.009*
Note: Dependent variable, TC; explanatory variable, DL.*Statistical significance at 1%.Source: Authors’ survey (2013).
190 R. Rasiah and Y. Xiao Shan

support. The aggressive leveraging strategy adopted by the EDB and equity taken by the
government have been the focal point of technological upgrading in the country.
The statistical analysis showed that TC is correlated with institutional support and
domestic linkages. The supply of R&D engineers and scientists (including from abroad),
R&D grants and support from universities and R&D labs has been viewed by firms as
important in supporting technological upgrading. In addition, firm-level technological
upgrading has also been important in stimulating domestic linkages with purchasers and
buyers. Technological upgrading in the country is more associated with domestic buyer
and supplier firms, than with export and import markets in East Asia, which appears to be
consequence of greater demand for high-tech inputs in Singapore than in the import and
export markets of Malaysia, China, Indonesia and Philippines. The government efforts to
strengthen institutional support to stimulate technological upgrading in Singapore began
from 1979, and strong buyer–supplier networks have emerged following the relocation of
high-tech supplier firms.
Acknowledgements
We wish to acknowledge financial support from Economic Research Institute for ASEAN and EastAsia (ERIA) for supporting financially the survey reported in this article. We wish to also thankincisive comments from two referees.
Disclosure statement
The usual disclaimer applies.
Notes
1. We only considered domestic exports excluding in the process re-exports.2. Interview by the authors with Johore state officials on 15 December 2012 in Johor Bharu.3. We obtained this evidence from a questionnaire administered to both semiconductor firms and
their suppliers and purchasers in 2012.4. Econometric tests between regional linkages and technological capability were not significant.5. Interviews by authors in 2012.
Notes on contributors
Rajah Rasiah is Professor of Economics and Technology Management at University of Malaya. He iscurrently on sabbatical at Harvard University.
Yap Xiao Shan is completing her doctorate at University of Malaya. She shared the best PhD studentpaper prize at the 10th GLOBELICS conference in 2012 in Hangzhou.
References
Akamatsu, K. 1962. “A Historical Pattern of Economic Growth in Developing Countries.” TheDeveloping Economies 1: 3–25. doi:10.1111/j.1746-1049.1962.tb01020.x.
Amsden, A., and F. T. Tschang. 2003. “A New Approach to Assessing the TechnologicalComplexity of Different Categories of R&D (with Example from Singapore).” Research Policy32 (4): 553–572.
Cantwell, J., and R. Mudambi. 2005. “MNE Competence-Creating Subsidiary Mandates.” StrategicManagement Journal 26 (12): 1109–1128.
COMTRADE. 2012. “United Nations Commodity Trade Statistics Database.” Accessed January 2,2013. http://comtrade.un.org/db/
Edquist, C. 2004. “Reflections on the Systems of Innovation Approach.” Science and Public Policy31 (6): 485–489.
Asia Pacific Business Review 191
Ernst, D., and L. Kim. 2002. “Global Production Networks, Knowledge Diffusion and LocalCapability Formation.” Research Policy 31: 1417–1429.
Gartner. 2011a. “OSAT Facilities: Worldwide, Fourth Quarter 2011.” Requested Data, GartnerResearch.
Gartner. 2011b. “Fab Database: Worldwide, Fourth Quarter 2011.” Requested Data, GartnerResearch.
Gartner. 2013. Fab Database Worldwide: 2013 Update. Stamford, CT: Gartner Database.Hamilton, A. 1791. “Report on Manufactures.” Accessed October 2, 2014. http://www.
banccentraldecatalunya.ch/wordpress/wp-content/uploads/2014/Biblioteca_Banca_Central/2014Maig/ReportOnManufactures_1791.pdf
Hobday, M. 1995. Innovation in East Asia: The Challenge to Japan. London: Edward Elgar.Huff, W. G. 1994. Economic Growth of Singapore Trade & Development in the Twentieth Century.
Cambridge: Cambridge University Press.Krugman, P. 1991. Geography and Trade. Cambridge: MIT Press.List, F. 1909. The National System of Political Economy. London: Longmans, Green.Lundvall, B.-A., ed. 1992. National Systems of Innovation: Towards a Theory of Innovation and
Interactive Learning. London: Pinter.Majid, R. 2010. “Regional Economic Cooperation and Integration through Growth Triangles: The
Case of IMS-GT.” In International Seminar, Economic Regional Development, Law andGovernance in Malaysia and Indonesia, June 7–9, 1–14. PekanBaru: Universitas Islam RiauIndonesia.
Marshall, A. 1890. Principles of Economics. London: Macmillan.Mathews, J. A. 1999. “A Silicon Island of the East: Creating a Semiconductor Industry in
Singapore.” California Management Review 41 (2): 55–78.Mathews, J. A., and D. S. Cho. 2000. Tiger Technology: The Creation of a Semiconductor Industry in
East Asia. Cambridge: Cambridge University Press.Mytelka, L. 2000. “Local Systems of Innovation in a Globalized World Economy.” Industry and
Innovation 7 (1): 15–32.Nelson, R. R., ed. 1993. National Innovation Systems. New York, NY: Oxford University Press.Nelson, R. R. 2008. “What Enables Rapid Economic Progress: What are the Needed Institutions.”
Research Policy 37 (1): 1–11.North, D. C. 1991. “Institutions.” The Journal of Economic Perspectives 5 (1): 97–112.OECD. 2013. OECD Economic Outlook. Paris: Organization for Economic Cooperation and
Development.Penrose, E. T. 1959. The Theory of the Growth of the Firm. London: Blackwell.Rasiah, R. 2006. “Technological Intensities and Economic Performance: A Study of Foreign and
Local Manufacturing Firms in South Africa.” International Journal of Technology Management36 (1–3): 166–189.
Rasiah, R. 2010. “Are Electronics Firms in Malaysia Catching Up in the Technology Ladder?”Journal of Asia Pacific Economy 15 (3): 301–319.
Rasiah, R., F. Kimura, and S. Onum. 2014. “Host-site Institutions, Production Networks andTechnological Capabilities.”Asia Pacific Business Review. doi:10.1080/13602381.2014.990208.
Santiago, E. B. 2007. “Development of ASEAN Framework for Trade Negotiations: ElectronicsIndustry.” Accessed December 2, 2014. http://pdf.usaid.gov/pdf_docs/PNADJ685.pdf
Singapore Department of Statistics. 2012. Employment and Value Added of Electronics Industry(Requested Data). Singapore: Singapore Department of Statistics.
Smith, A. 1776. An Inquiry into the Nature and Causes of the Wealth of the Nations. New York:Modern Library.
Williamson, O. E. 1985. The Economic Institutions of Capitalism: Firms, Markets, RelationalContracting. New York: Free Press.
Wong, P. K. 1999. “National Innovation Systems for Rapid Technological Catch-Up: An AnalyticalFramework and a Comparative Analysis of Korea, Taiwan and Singapore.” Paper presented atthe Conference on National Innovation Systems, Industrial Dynamics and Innovation Policy,Rebild, Denmark, June 9–12.
WTO (World Trade Organization). 2001. International Trade Statistics. Geneva: World TradeOrganization.
WTO. 2007. International Trade Statistics. Geneva: World Trade Organization.WTO. 2012. International Trade Statistics. Geneva: World Trade Organization.
192 R. Rasiah and Y. Xiao Shan


