
Individual Bioequivalence:Background and Concepts
Mei-Ling Chen, Ph.D.Associate Director
Office of Pharmaceutical Science
Advisory Committee for Pharmaceutical Science
November 28-29, 2001Rockville, MD
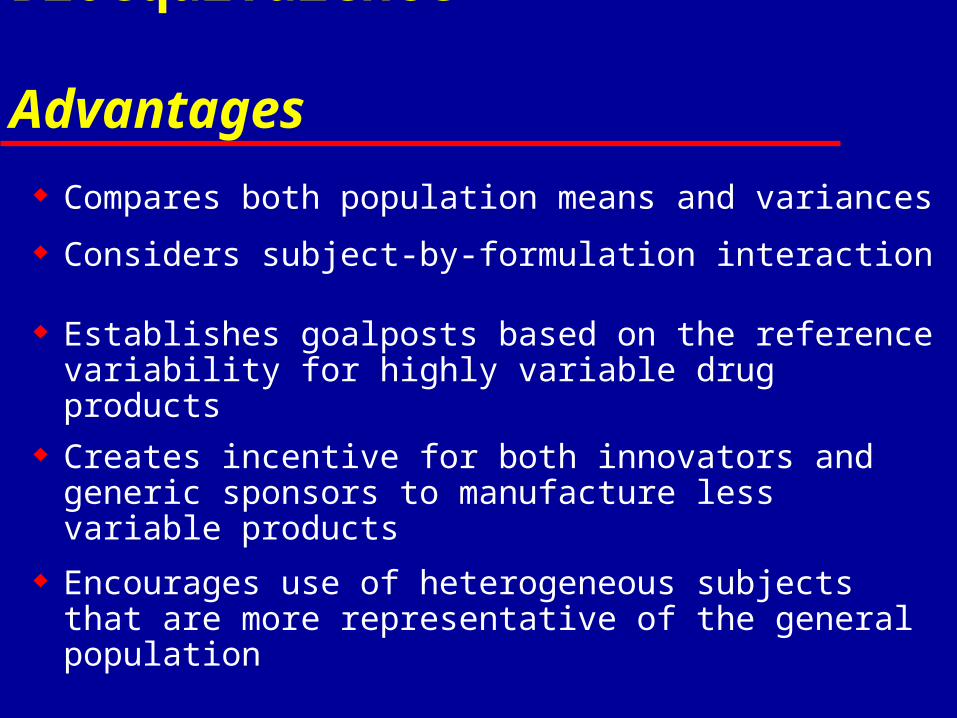
Individual Bioequivalence Advantages
Compares both population means and variances
Considers subject-by-formulation interaction
Establishes goalposts based on the reference variability for highly variable drug products
Creates incentive for both innovators and generic sponsors to manufacture less variable products
Encourages use of heterogeneous subjects that are more representative of the general population

Individual Bioequivalence Assessment Distance Concept
Individual Difference Ratio (IDR)
Difference between T and R IDR = -------------------------------------
Difference between R and R’
Both T and R are administered to the same individual
Goal: IDR not substantially greater than 1

Individual Bioequivalence (Average Difference)2 + Variance Terms ------------------------------------------------------ BE Limit
Reference Variance
T - R)2 + D2 + (WT
2 - WR2)
------------------------------------------- I WR
2
Variance Terms
- Subject-by-formulation interaction ( D2
)- Within-subject variances (WT
2, WR2)

Subject-by-Formulation Interaction The S x F interaction is a measure of the extent to which the individual
mean differences, Tj - Rj, between the T and R products are likely to differ.
D2 = variance of (µTj - µRj)
= (BT - BR)2 + 2 (1- ) BT BR
µTj, µRj : individual-specific means
BT, BR : between-subject standard deviations
: correlation coefficient between µTj & µRj
D2 : S x F interaction variance component
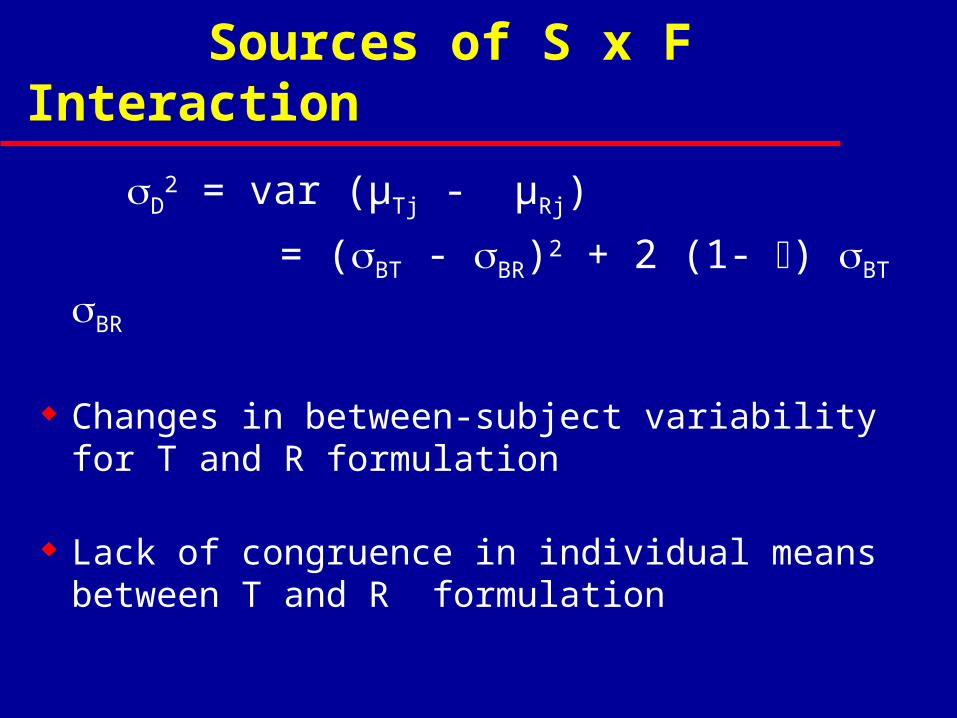
Sources of S x F Interaction
D2 = var (µTj - µRj)
= (BT - BR)2 + 2 (1- ) BT BR
Changes in between-subject variability for T and R formulation
Lack of congruence in individual means between T and R formulation

Verapamil Immediate Release Age-based SxF Interaction
MEASURE Subject Test/Reference Ratio Generic 1/Reference Generic 2/Reference
AUC0-12 Elderly 1.43 1.04AUC0-12 Young 0.998 0.995
AUC0-24 Elderly 1.46 1.06AUC0-24 Young 1.00 0.97
Cmax Elderly 1.77 1.04Cmax Young 0.93 1.05
*SxF interaction occurred to Generic 1, but not Generic 2.
Reference: Carter BL et al., Pharmacotherapy, 13, 1993

Calcium Channel Blocker Gender-based S x F Interaction
Mean Cmax (%CV) Mean AUC (%CV)Males
Product T 129 ng/ml 3102 ng x hr/mlProduct R 147 2953Overall % CV 32.1 34.5
T/R Ratio 0.92 1.11
FemalesProduct T 129 ng/ml 2785 ngxhr/mlProduct R 201 3549
Overall % CV 19.8 14.4
T/R Ratio 0.62 0.77

Interpretation of S x F Interaction
Approach 1
Percentage of individuals whose average T/R ratios lie outside the range of 80-125%
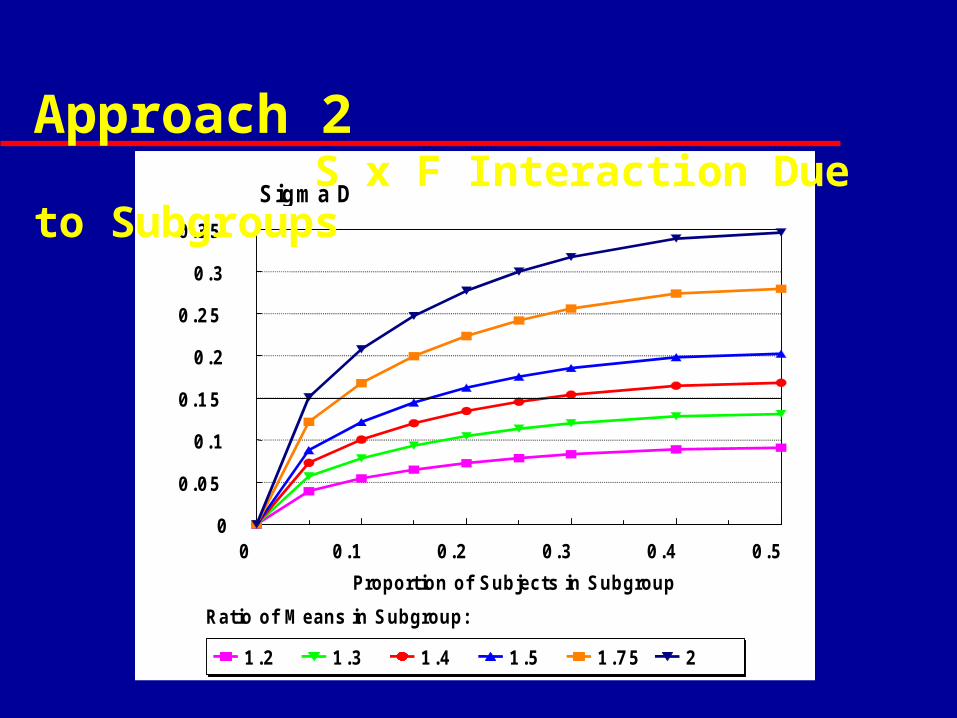
Approach 2
Presence of a subgroup(s) with a different average T/R ratio(s) from the remaining subjects of the population

Approach 1
0102030405060
%
0.1 0.15 0.2 0.25 0.3 0.35 0.4
Sigma D Value
Proportion of Individuals With T/R Ratio Outside 80-125% (Assuming T/R mean ratio is 1.0)
0
0.05
0.1
0.15
0.2
0.25
0.3
0.35
0 0.1 0.2 0.3 0.4 0.5
Proportion of Subjects in Subgroup
1.2 1.3 1.4 1.5 1.75 2
Sigm a D
Ratio of Means in Subgroup:
Approach 2 S x F Interaction Due to Subgroups

Individual Bioequivalence Criterion
(T - R)2 + D2 + (WT
2 - WR2)
------------------------------------------- I WR
2
Reference Scaling
Away from the “one-size-fits-all” approach
Goalposts adjusted for highly variable drug products

Mixed-Scaling Approach
Reference-Scaled (if WR > W0 )
(T - R)2 + D2 + (WT
2 - WR2)
------------------------------------------- I WR
2
Constant-Scaled (if WR W0 )
(T - R)2 + D2 + (WT
2 - WR2)
------------------------------------------- I W0
2
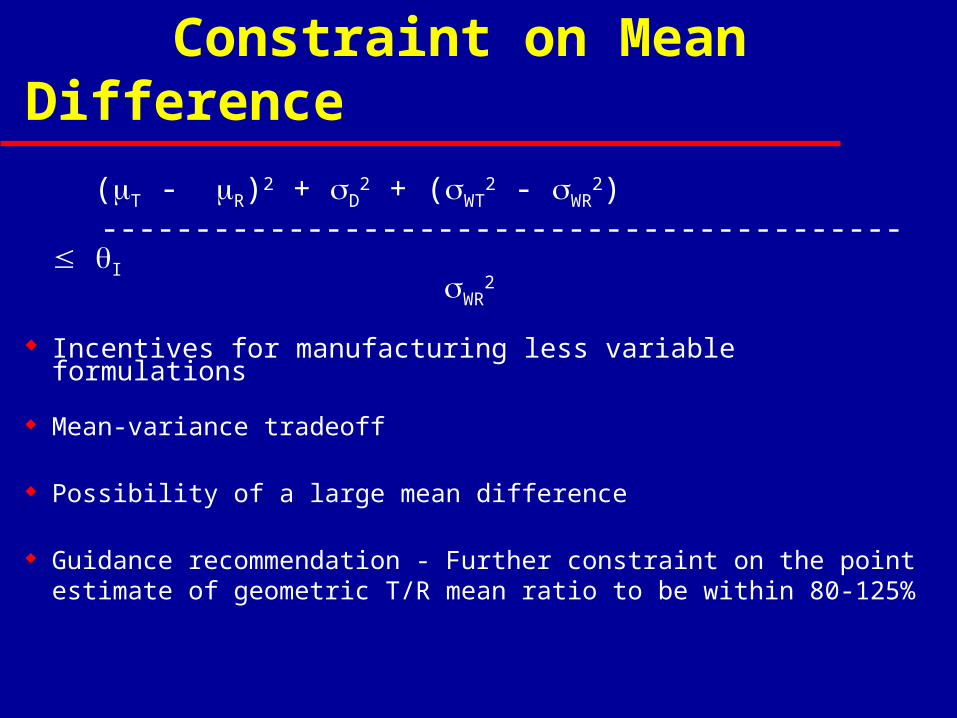
Constraint on Mean Difference
(T - R)2 + D2 + (WT
2 - WR2)
------------------------------------------- I WR
2
Incentives for manufacturing less variable formulations
Mean-variance tradeoff
Possibility of a large mean difference
Guidance recommendation - Further constraint on the point estimate of geometric T/R mean ratio to be within 80-125%

Replicate Design Studies:NDA’s and FDA Database
Mei-Ling Chen, Ph.D.Associate Director
Office of Pharmaceutical Science
Advisory Committee for Pharmaceutical Science
November 28-29, 2001Rockville, MD

27
28
9
13
Old Data - FDA Old Data - Industry
New Data - NDAs New Data - ANDAs
Replicate Design Data NDAs and ANDAs

Old Database
Industry Data
0
10
20
30
40
50
% D
ata
Sets
AUCinf 18 25
Cmax 39 29
SxF > 0.15T/R WS SD
>1.20
FDA Data
0
10
20
30
40
50
% D
ata
Sets
AUCinf 19 33
Cmax 33 30
SxF > 0.15T/R WS SD
>1.20
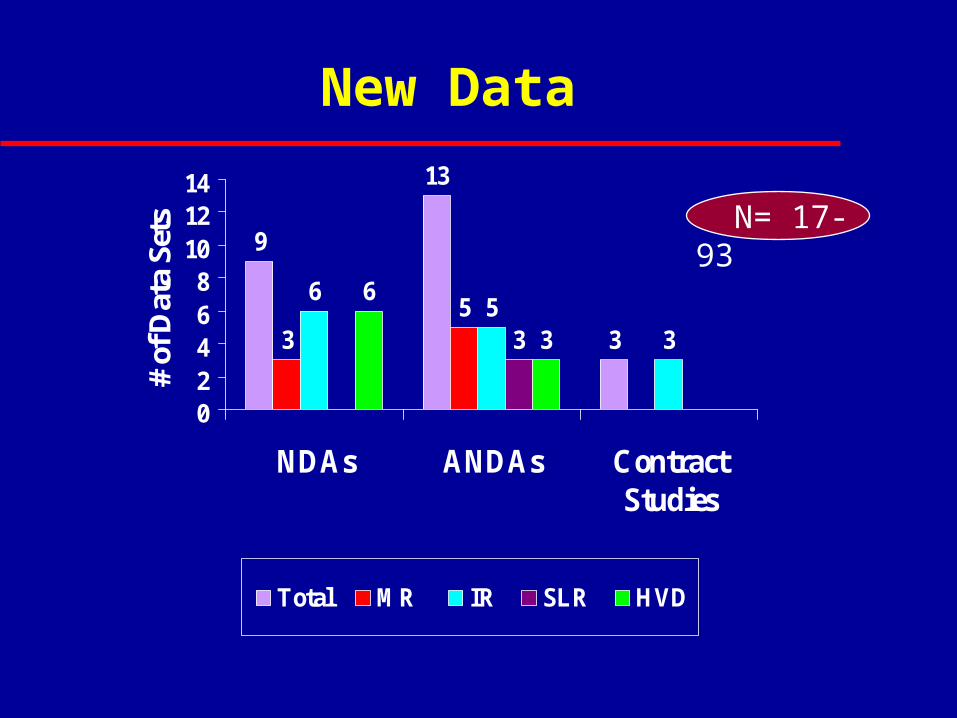
9
13
335
65
33
6
3
02468
101214
NDAs ANDAs ContractStudies
# of
Dat
a Se
ts
Total MR IR SLR HVD
N= 17- 93
New Data
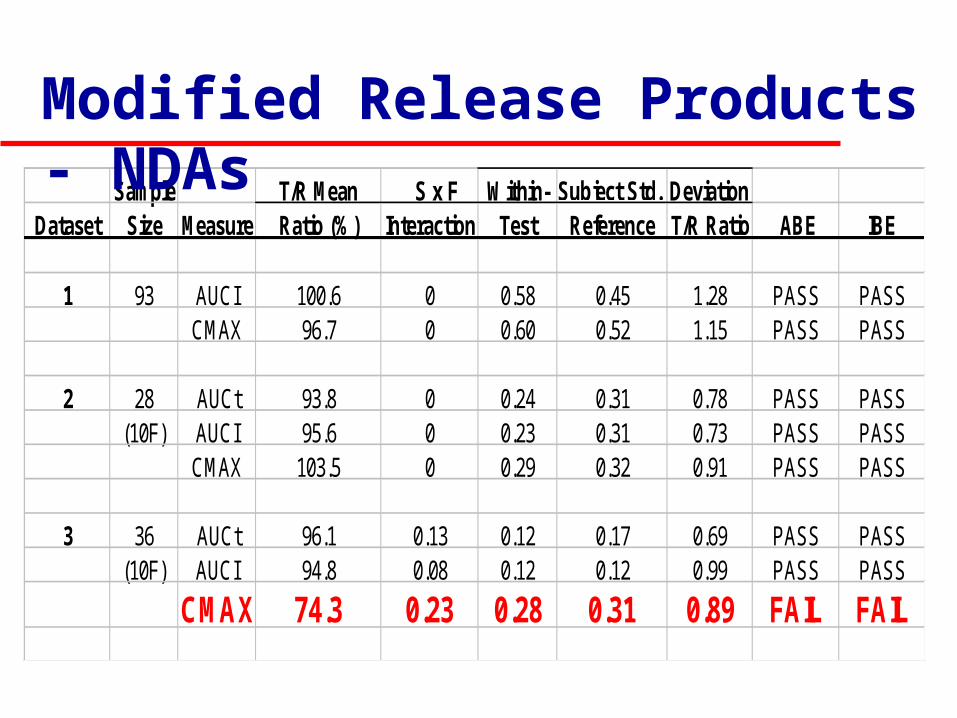
Sample T/R Mean S x F Within- Subject Std. Deviation
Dataset Size Measure Ratio (%) Interaction Test Reference T/R Ratio ABE IBE
1 93 AUCI 100.6 0 0.58 0.45 1.28 PASS PASSCMAX 96.7 0 0.60 0.52 1.15 PASS PASS
2 28 AUCt 93.8 0 0.24 0.31 0.78 PASS PASS(10F) AUCI 95.6 0 0.23 0.31 0.73 PASS PASS
CMAX 103.5 0 0.29 0.32 0.91 PASS PASS
3 36 AUCt 96.1 0.13 0.12 0.17 0.69 PASS PASS(10F) AUCI 94.8 0.08 0.12 0.12 0.99 PASS PASS
CMAX 74.3 0.23 0.28 0.31 0.89 FAIL FAIL
Modified Release Products - NDAs

Sample T/R Mean SxF Within- Subject Std. Deviation Dataset Size Measure Ratio (%) Interaction Test Reference T/R Ratio ABE IBE
1 40 AUCt 99.0 0 0.06 0.11 0.58 PASS PASSAUCI 99.1 0 0.06 0.11 0.55 PASS PASSCMAX 93.9 0.03 0.28 0.37 0.75 PASS PASS
2 40 AUCt 107.7 0.44 0.07 0.23 0.30 PASS FAILAUCI 107.6 0.42 0.07 0.21 0.35 PASS FAILCMAX 100.3 0.23 0.39 0.47 0.82 PASS PASS
3 34 AUCt 96.1 0.14 0.41 0.34 1.20 PASS PASS
(14F) AUCI 93.0 0.30 0.35 0.40 0.86 FAIL PASSCMAX 93.8 0.06 0.31 0.33 0.92 PASS PASS
Immediate Release Products - NDAs

Cmax
0
2500
5000
7500
10000
12500
Test . 7580 11700 .
Ref. 357 . . 1260
Period 1 Period 2 Period 3 Period 4
AUCinf
0
5000
10000
15000
20000
25000
Test . 23819 24710 .
Ref. 727 . . 3680
Period 1 Period 2 Period 3 Period 4
IR - Data Set #2
Subject #9

FDA Contract Studies
Replicated-Crossover Design
Conducted at the University of Tennessee
Ranitidine
Metoprolol
Methylphenidate

Interplay of Drugs and Excipients
R
Excipient 1Sorbitol
Low permeability Osmotic pressure
GI transit time
DrugsRanitidine Metoprolol(Low P) (High P)
Excipient 2Sucrose
High permeability
Bioavailability? SxF Interaction?
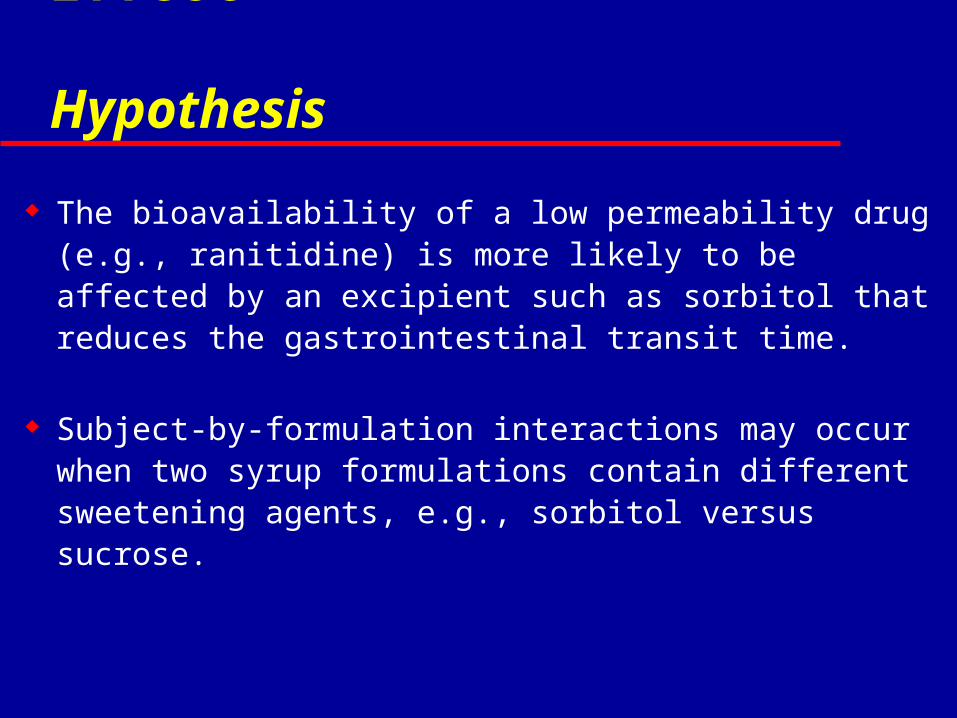
Excipient Effect Hypothesis
The bioavailability of a low permeability drug (e.g., ranitidine) is more likely to be affected by an excipient such as sorbitol that reduces the gastrointestinal transit time.
Subject-by-formulation interactions may occur when two syrup formulations contain different sweetening agents, e.g., sorbitol versus sucrose.
Hussain AS, et al., AAPS Annual Meeting, 2000.
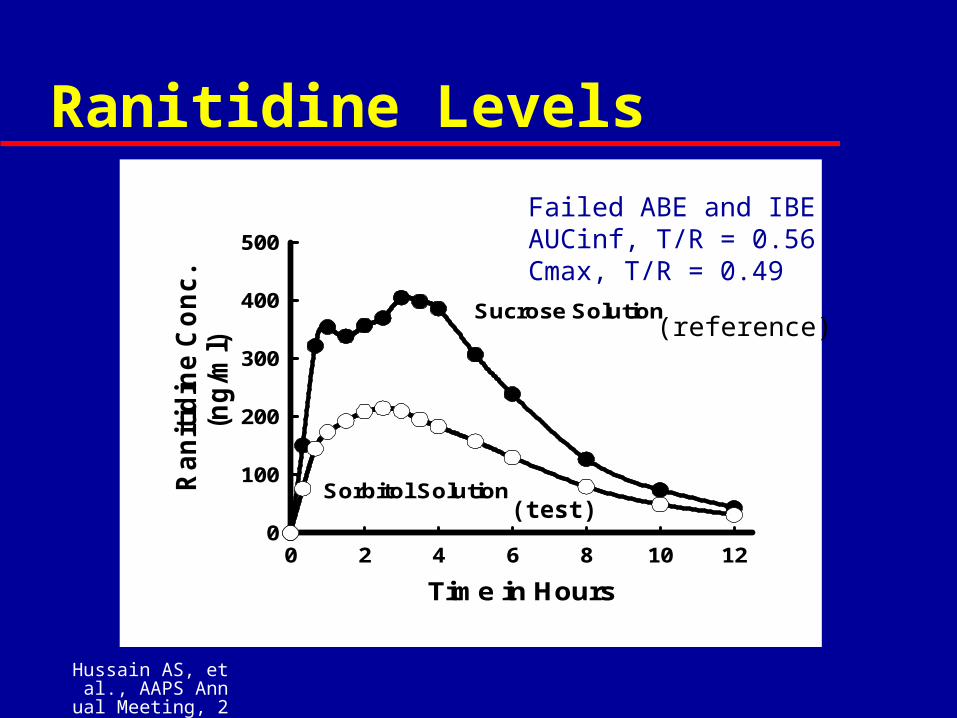
Ranitidine Levels
Time in Hours
0 2 4 6 8 10 12
Ra
nit
idin
e C
on
c.
(ng
/ml)
0
100
200
300
400
500
Sucrose Solution
Sorbitol Solution
Failed ABE and IBE AUCinf, T/R = 0.56 Cmax, T/R = 0.49
(reference)
(test)
Hussain AS, et al., AAPS Annual Meeting, 2001.
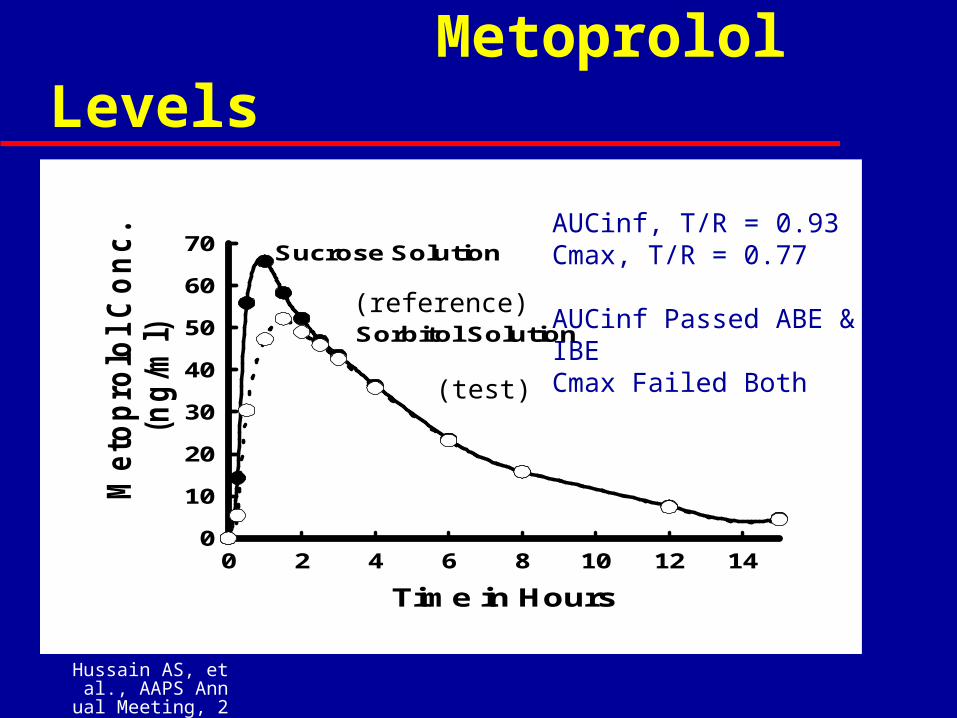
Metoprolol Levels
Time in Hours
0 2 4 6 8 10 12 14
Me
top
rolo
l C
on
c.
(ng
/ml)
0
10
20
30
40
50
60
70 Sucrose Solution
Sorbitol Solution
(reference)
AUCinf, T/R = 0.93 Cmax, T/R = 0.77 AUCinf Passed ABE & IBE Cmax Failed Both
(test)

Hussain AS, AAPS Annual Meeting, 2000.
Ranitidine in Sucrose vs. Sorbitol Solution
Subject-by-Formulation Interaction
AU
CI
0
1000
2000
3000
4000
5000
0
1000
2000
3000
4000
5000
Sucrose Sorbitol
Reduction of between-subject variability from sucrose to sorbitol resulted in an SxF interaction (D = 0.15)
BR= 0.24 BT= 0.13

Methylphenidate
MEASURE MEAN SxF INTRASUBJECT STD. DEV.a ABE IBE T/R Ratio Test Ref. T/R Ratio
(%)
Cmax 109.6 0.14 0.259 0.175 1.480 Pass Fail
AUC0-t 106.8 0 0.224 0.191 1.171 Pass Pass
AUC0- 108.1 0 0.228 0.184 1.234 Pass Pass
aAll analyses were conducted using ln-transformed data, and thestandard deviation approximated the coefficient of variation (% CV)on the original scale.
Ref: Meyer MC. et al., Pharmaceutical Research. 17:381-384, 2000


