
For Private Circulation Only. FOR IMPORTANT INFORMATION ABOUT KOTAK SECURITIES’ RATING SYSTEM AND OTHER DISCLOSURES. REFER TO THE END OF THIS MATERIAL.
Contents
Daily Alerts
Change in Reco
Ashok Leyland: Upgrade to BUY
Slowdown concerns overdone: Expect 13% volume CAGR in MHCV
industry over FY2018-20E
Expect increase in revenue mix from relatively less cyclical segments over
the medium term
Expect the company to deliver 21% EPS CAGR over FY2018-21E
Company alerts
Reliance Industries: AGM takeaways—a vision and more disruptions
Chairman reinforces his vision of strategic transformation to a technology
platform company
Targeting more subscribers by reducing cost of JioPhone to Rs501 and
rollout of JioGigaFiber
Updates on energy and petchem business
Recent weaknesses in refining and petchem margins warrant a caution
S H Kelkar and Company: Gradual progress
Key takeaways from the meeting
Sector alerts
Consumer Products: 1QFY19E preview: multi-year high growth comps off a low base
Revenues: low base + rural pickup = a 21-quarter high aggregate growth
Margins: GST benefits (optical + structural) + benign competitive intensity =
further expansion
Net income: growth in line with EBITDA growth
INDIA DAILY July 6, 2018 India 5-Jul 1-day 1-mo 3-mo
Sensex 35,575 (0.2) 1.1 5.8
Nifty 10,750 (0.2) 0.6 4.0
Global/Regional indices
Dow Jones 24,357 0.8 (3.1) 1.8
Nasdaq Composite 7,586 1.1 (1.3) 9.7
FTSE 7,603 0.4 (1.4) 5.8
Nikkei 21,740 0.9 (3.9) 0.8
Hang Seng 28,254 0.3 (9.6) (5.3)
KOSPI 2,262 0.2 (7.8) (6.8)
Value traded – India
Cash (NSE+BSE) 281 306 333
Derivatives (NSE) 15,181 6,159 12,77
4
Deri. open interest 3,637 3,509 3,774
Forex/money market
Change, basis points
5-Jul 1-day 1-mo 3-mo
Rs/US$ 68.8 2 192 388
10yr govt bond, % 8.1 (2) 2 52
Net investment (US$ mn)
4-Jul MTD CYTD
FIIs 157 36 (585)
MFs 342 - 10,439
Top movers
Change, %
Best performers 5-Jul 1-day 1-mo 3-mo
TCS IN Equity 1,880 0.8 9.0 27.5
HUVR IN Equity 1,688 0.7 7.4 22.8
KMB IN Equity 1,365 (0.0) 3.7 22.0
NEST IN Equity 9,957 1.0 2.0 19.3
MM IN Equity 912 1.4 (0.2) 18.2
Worst performers
HDIL IN Equity 20 (1.5) (4.6) (52.5)
RCOM IN Equity 14 (1.1) (15.6) (44.6)
UT IN Equity 4 1.2 1.2 (36.8)
IDBI IN Equity 48 (7.1) (16.1) (34.2)
TTMT IN Equity 262 (2.1) (11.5) (28.2)

For Private Circulation Only. FOR IMPORTANT INFORMATION ABOUT KOTAK SECURITIES’ RATING SYSTEM AND OTHER DISCLOSURES, REFER TO THE END OF THIS MATERIAL.
Slowdown concerns overdone: Expect 13% volume CAGR in MHCV industry over FY2018-20E
We note that higher tonnage segments continue to outpace industry volume growth over the
last few quarters; tonnage volumes for the industry grew by 70%/30% yoy as compared to
volume growth of 54%/25% in 3QF18 and 4QFY18 respectively. Even in the first two months
of FY2019, tonnage growth was 155% yoy while industry volumes were up 140% yoy (see
Exhibit 1). Strong growth in higher tonnage segments reflects a healthy demand environment
and positive freight growth outlook by fleet operators.
We believe that (1) the MHCV industry will grow at 13% CAGR over FY2018-20E (9%/16% yoy
in FY2019/20E) and (2) Ashok Leyland will maintain market share (despite aggression by Tata
Motors) driven by innovative product launches and expansion of network in East and North
India. Apart from freight growth, industry growth will be driven by (1) continued pick-up in
road construction and mining activity, (2) overloading ban in certain key states such as Uttar
Pradesh, Rajasthan, AP, etc. (we don’t believe that the government will legalize 20%
overloading, which has been highlighted in recent media reports) and (3) pre-buying ahead of
implementation of BS-VI emission norms from April 1, 2020.
Expect increase in revenue mix from relatively less cyclical segments over the medium term
We expect revenue mix from relatively less cyclical segments (exports, spares and defense) to
increase to 19% by FY2021E from 15% in FY2018, which augurs well for the company’s
profitability. This will be driven by new order wins in the defense segment and the company’s
efforts to increase spare part revenues. Additionally, given the new model launch pipeline
across segments, the company has the potential to gain market share in the LCV segment from
8% currently.
Expect the company to deliver 21% EPS CAGR over FY2018-21E
We expect the company to deliver 21% EPS CAGR over FY2018-21E led by (1) 14% revenue
CAGR and (2) 90 bps EBITDA margin expansion. Our TP of `160 (unchanged) is based on 17X
March 2020E EPS + `8/share value of Ashok Leyland’s stake in Hinduja Leyland Finance.
Ashok Leyland (AL) Automobiles
Upgrade to BUY. We upgrade Ashok Leyland to BUY (from ADD) as we believe that
risk reward is favorable after a 19% correction in the stock price over the last three
months. We believe that concerns on slowdown in the MHCV industry are unwarranted;
tonnage growth continues to outpace volume growth, which reflects healthy demand
environment and positive freight growth outlook. We expect MHCV industry volumes
to grow at 13% CAGR over FY2018-20E led by (1) freight growth, (2) pick-up in road
construction and mining activity and (3) regulatory factors (overloading ban,
implementation of BS-VI emission norms, etc.). Maintain target price at `160.
BUY
JULY 06, 2018
CHANGE IN RECO.
Coverage view: Neutral
Price (`): 125
Target price (`): 160
BSE-30: 35,575
Hitesh Goel
Nishit Jalan
Ashok Leyland
Stock data Forecasts/Valuations 2018 2019E 2020E
52-week range (Rs) (high,low) EPS (Rs) 5.4 6.2 8.9
Market Cap. (Rs bn) EPS growth (%) 8.0 15.3 43.2
Shareholding pattern (%) P/E (X) 23.2 20.2 14.1
Promoters 51.3 Sales (Rs bn) 262.5 305.9 369.7
FIIs 37.2 Net profits (Rs bn) 15.7 18.2 26.0
MFs 6.5 EBITDA (Rs bn) 27.4 31.6 42.5
Price performance (%) 1M 3M 12M EV/EBITDA (X) 13.4 10.3 7.5
Absolute (14.5) (15.0) 23.0 ROE (%) 23.7 23.4 28.4
Rel. to BSE-30 (16.1) (19.7) 8.1 Div. Yield (%) 1.9 1.5 2.1
Company data and valuation summary
168-99
366.9

Ashok Leyland Automobiles
KOTAK INSTITUTIONAL EQUITIES RESEARCH 3
Exhibit 1: Tonnage growth in MHCV industry continues to outpace volume growth MHCV domestic volume and tonnage on quarterly basis, March fiscal year-ends, 2016-19 (units, %)
Source: SIAM, Kotak Institutional Equities
Exhibit 2: We expect Ashok Leyland’s market share to remain flat over the next three years in MHCV industry MHCV domestic volumes and market share by OEMs, March fiscal year-ends, 2010-21E (units, %)
Source: Company, Kotak Institutional Equities
1QFY15 2QFY15 3QFY15 4QFY15 1QFY16 2QFY16 3QFY16 4QFY16 1QFY17 2QFY17 3QFY17 4QFY17 1QFY18 2QFY18 3QFY18 4QFY18 April-May 2018
7.5-12 Ton
Volumes (units) 8,177 9,075 9,704 10,554 8,798 10,643 11,512 13,277 10,451 10,866 10,473 12,445 7,612 13,917 15,336 20,191 9,301
Average tonnage carried (tons) 9 9 9 9 9 9 9 9 9 9 9 9 9 9 9 9 9
Tonnage volumes (tons) 73,593 81,675 87,336 94,986 79,182 95,787 103,608 119,493 94,059 97,794 94,257 112,005 68,508 125,253 138,024 181,719 83,709
12-16 Ton
Volumes (units) 7,270 7,371 8,342 9,802 9,348 11,600 9,738 13,675 10,850 10,829 10,286 13,157 5,898 9,066 9,268 10,944 5,340
Average tonnage carried (tons) 13 13 13 13 13 13 13 13 13 13 13 13 13 13 13 13 13
Tonnage volumes (tons) 94,510 95,823 108,446 127,426 121,524 150,800 126,594 177,775 141,050 140,777 133,718 171,041 76,674 117,858 120,484 142,272 69,420
16-25 Ton
Volumes (units) 11,356 11,428 13,352 13,601 11,851 14,593 13,053 18,511 14,178 14,082 14,581 19,808 7,342 11,752 17,227 18,377 10,751
Average tonnage carried (tons) 18 18 18 18 18 18 18 18 18 18 18 18 18 18 18 18 18
Tonnage volumes (tons) 204,408 205,704 240,336 244,818 213,318 262,674 234,954 333,198 255,204 253,476 262,458 356,544 132,156 211,536 310,086 330,786 193,518
25-35 Ton
Volumes (units) 10,211 12,860 12,251 17,730 13,181 19,399 16,239 22,235 13,861 11,990 13,673 26,503 11,409 20,592 25,179 32,522 15,839
Average tonnage carried (tons) 27 27 27 27 27 27 27 27 27 27 27 27 27 27 27 27 27
Tonnage volumes (tons) 275,697 347,220 330,777 478,710 355,887 523,773 438,453 600,345 374,247 323,730 369,171 715,581 308,043 555,984 679,833 878,094 427,653
> 35 Ton
Volumes (units) 3,515 4,900 5,521 8,883 7,154 9,851 10,422 13,408 9,809 6,865 7,609 12,885 7,611 16,026 20,144 24,251 10,992
Average tonnage carried (tons) 30 30 30 30 30 30 30 30 30 30 30 30 30 30 30 30 30
Tonnage volumes (tons) 105,450 147,000 165,630 266,490 214,620 295,530 312,660 402,240 294,270 205,950 228,270 386,550 228,330 480,780 604,320 727,530 329,760
Total Domestic truck volumes (units) 40,529 45,634 49,170 60,570 50,332 66,086 60,964 81,106 59,149 54,632 56,622 84,798 39,872 71,353 87,154 106,285 52,223
YoY chg (%) 32.4 24.2 44.8 24.0 33.9 17.5 (17.3) (7.1) 4.6 (32.6) 30.6 53.9 25.3 139.9
Total tonnage (tons) 753,658 877,422 932,525 1,212,430 984,531 1,328,564 1,216,269 1,633,051 1,158,830 1,021,727 1,087,874 1,741,721 813,711 1,491,411 1,852,747 2,260,401 1,104,060
YoY chg (%) 45.7 30.6 51.4 30.4 34.7 17.7 (23.1) (10.6) 6.7 (29.8) 46.0 70.3 29.8 154.6
2010 2011 2012 2013 2014 2015 2016 2017 2018 2019E 2020E 2021E
Volumes
Tata Motors 154,123 192,127 207,014 143,381 110,187 127,011 156,961 148,901 168,013 184,814 216,233 205,421
Ashok Leyland 57,096 83,104 81,091 70,552 51,827 66,442 98,809 102,313 116,534 127,810 148,158 140,246
Eicher 21,230 30,185 37,406 35,051 24,391 24,971 31,363 34,584 39,188 42,323 47,402 45,032
Swaraj Mazda 5,778 7,810 7,961 7,719 5,496 5,914 6,167 7,258 4,648 4,880 5,124 5,381
M&M — 843 3,820 3,806 3,243 4,397 6,983 8,188 10,785 11,324 12,683 12,049
Others 5,858 8,660 11,414 7,750 5,483 4,005 2,090 1,219 1,055 1,108 1,241 1,179
Total 244,085 322,729 348,706 268,259 200,627 232,740 302,373 302,463 340,223 372,259 430,841 409,307
Yoy growth (%)
Tata Motors 35.8 24.7 7.7 (30.7) (23.2) 15.3 23.6 (5.1) 12.8 10.0 17.0 (5.0)
Ashok Leyland 21.2 45.6 (2.4) (13.0) (26.5) 28.2 48.7 3.5 13.9 9.7 15.9 (5.3)
Eicher 61.5 42.2 23.9 (6.3) (30.4) 2.4 25.6 10.3 13.3 8.0 12.0 (5.0)
Swaraj Mazda 46.8 35.2 1.9 (3.0) (28.8) 7.6 4.3 17.7 (36.0) 5.0 5.0 5.0
M&M 353.1 (0.4) (14.8) 35.6 58.8 17.3 31.7 5.0 12.0 (5.0)
Others 34.6 47.8 31.8 (32.1) (29.3) (27.0) (47.8) (41.7) (13.5) 5.0 12.0 (5.0)
Total 34.1 32.2 8.0 (23.1) (25.2) 16.0 29.9 0.0 12.5 9.4 15.7 (5.0)
Market share
Tata Motors 63.1 59.5 59.4 53.4 54.9 54.6 51.9 49.2 49.4 49.6 50.2 50.2
Ashok Leyland 23.4 25.8 23.3 26.3 25.8 28.5 32.7 33.8 34.3 34.3 34.4 34.3
Eicher 8.7 9.4 10.7 13.1 12.2 10.7 10.4 11.4 11.5 11.4 11.0 11.0
Swaraj Mazda 2.4 2.4 2.3 2.9 2.7 2.5 2.0 2.4 1.4 1.3 1.2 1.3
M&M — 0.3 1.1 1.4 1.6 1.9 2.3 2.7 3.2 3.0 2.9 2.9
Others 2.4 2.7 3.3 2.9 2.7 1.7 0.7 0.4 0.3 0.3 0.3 0.3
Total 100 100 100 100 100 100 100 100 100 100 100 100

Automobiles Ashok Leyland
4 KOTAK INSTITUTIONAL EQUITIES RESEARCH
Exhibit 3: We estimate 9% yoy volume CAGR over FY2018-21E for Ashok Leyland Ashok Leyland volume assumptions, March fiscal year-ends, 2012-21E (units)
Source: Company, Kotak Institutional Equities estimates
2012 2013 2014 2015 2016 2017 2018 2019E 2020E 2021E
Buses 20,638 18,643 14,951 13,151 19,586 17,725 13,708 14,805 15,989 17,268
Trucks 61,252 51,909 36,876 53,291 79,223 84,588 102,826 113,005 132,169 122,977
LCV 398 360 — — — — — — — —
Dost 7,383 34,794 27,283 25,117 28,512 30,951 42,063 50,476 60,571 60,571
Domestic volumes 89,671 105,706 79,110 91,559 127,321 133,264 158,597 178,285 208,729 200,816
Buses 5,207 4,857 4,377 7,571 6,135 4,877 6,512 8,140 10,175 10,684
Trucks 6,944 3,594 4,100 3,670 4,811 6,102 8,386 10,483 13,103 14,413
LCV 774 425 75 1,330 2,091 823 1,285 1,606 2,008 2,209
Export volumes 12,925 8,876 8,552 12,571 13,037 11,802 16,183 20,229 25,286 27,306
Buses 25,845 23,500 19,328 20,722 25,721 22,602 20,220 22,945 26,164 27,952
Trucks 68,196 55,503 40,976 56,961 84,034 90,690 111,212 123,487 145,272 137,391
LCV 1,172 785 75 1,330 2,091 823 1,285 1,606 2,008 2,209
Dost 7,383 34,794 27,283 25,117 28,512 30,951 42,063 50,476 60,571 60,571
Total volumes 102,596 114,582 87,662 104,130 140,358 145,066 174,780 198,514 234,015 228,122
Growth (% yoy)
Buses 1.0 (9.7) (19.8) (12.0) 48.9 (9.5) (22.7) 8.0 8.0 8.0
Trucks (2.5) (15.3) (29.0) 44.5 48.7 6.8 21.6 9.9 17.0 (7.0)
LCV (43.2) (9.5) — — — — — — — —
Dost — — (21.6) (7.9) 13.5 8.6 35.9 20.0 20.0 —
Domestic volumes 6.8 17.9 (25.2) 15.7 39.1 4.7 19.0 12.4 17.1 (3.8)
Buses 8.3 (6.7) (9.9) 73.0 (19.0) (20.5) 33.5 25.0 25.0 5.0
Trucks 31.4 (48.2) 14.1 (10.5) 31.1 26.8 37.4 25.0 25.0 10.0
LCV 372.0 (45.1) (82.4) 1,673.3 57.2 (60.6) 56.1 25.0 25.0 10.0
Export volumes 26.0 (31.3) (3.7) 47.0 3.7 (9.5) 37.1 25.0 25.0 8.0
Buses 2.4 (9.1) (17.8) 7.2 24.1 (12.1) (10.5) 13.5 14.0 6.8
Trucks 0.1 (18.6) (26.2) 39.0 47.5 7.9 22.6 11.0 17.6 (5.4)
LCV 35.5 (33.0) (90.4) 1,673.3 57.2 (60.6) 56.1 25.0 25.0 10.0
Dost — — (21.6) (7.9) 13.5 8.6 35.9 20.0 20.0 —
Total volumes 8.9 11.7 (23.5) 18.8 34.8 3.4 20.5 13.6 17.9 (2.5)

Ashok Leyland Automobiles
KOTAK INSTITUTIONAL EQUITIES RESEARCH 5
Exhibit 4: We estimate Ashok Leyland to deliver 21% EPS CAGR over FY2018-21E Profit and loss, balance sheet and cash flow statement, March fiscal year-ends, 2012-21E (` mn)
Source: Company, Kotak Institutional Equities estimates
2012 2013 2014 2015 2016 2017 2018 2019E 2020E 2021E
Profit model
Volumes 102,596 114,582 87,662 104,130 140,358 145,066 174,780 198,514 234,015 228,122
Net sales 128,318 124,812 99,434 135,622 189,373 201,401 262,479 305,899 369,723 393,501
EBITDA 12,561 8,765 1,666 10,266 22,546 22,026 27,391 31,642 42,480 44,392
Other income 266 291 492 982 1,176 1,363 1,898 795 2,219 3,522
Interest (2,415) (3,436) (4,356) (3,673) (2,476) (1,554) (1,312) — — —
Depreciation (3,528) (3,808) (3,770) (4,163) (4,879) (5,179) (5,546) (6,131) (7,031) (7,931)
Prior period items/ extraordinary items 16 2,896 5,057 1,009 (8,102) (3,354) (122) — — —
Profit before tax 6,900 4,707 (912) 4,422 8,266 13,301 22,308 26,306 37,668 39,983
Current tax (775) — — (39) (4,220) (3,137) (6,773) (8,155) (11,677) (12,395)
Deferred tax (465) (370) 1,206 (1,035) (149) 2,067 91 — — —
Net profit 5,660 4,337 294 3,348 4,045 10,164 15,535 18,151 25,991 27,588
Adjusted profit 5,644 1,442 (4,763) 2,584 9,938 14,579 15,748 18,151 25,991 27,588
Earnings per share (Rs) 1.9 0.5 (1.6) 0.9 3.4 5.0 5.4 6.2 8.9 9.4
Balance sheet
Equity 42,123 44,551 44,479 51,187 54,071 61,261 71,648 83,243 99,846 117,469
Deferred tax liability 4,904 5,274 4,068 5,103 3,291 1,269 2,984 2,984 2,984 2,984
Total Borrowings 30,979 43,554 46,903 33,497 24,150 21,448 10,023 — — —
Current liabilities 41,152 37,588 32,630 43,328 46,225 56,422 81,205 92,749 108,522 118,716
Total liabilities 119,157 130,967 128,080 133,115 127,737 140,400 165,860 178,976 211,352 239,169
Net fixed assets 54,617 59,708 58,414 53,757 48,678 51,767 51,871 55,741 58,710 60,779
Investments 15,345 23,376 27,897 26,488 19,804 28,789 58,026 28,789 41,789 57,789
Cash 326 139 117 7,513 15,627 9,120 10,044 41,159 49,912 56,669
Other current assets 47,962 46,861 39,612 42,080 29,280 38,992 29,363 36,733 44,386 47,377
Miscellaneous expenditure 908 882 2,040 3,277 14,347 11,734 16,555 16,555 16,555 16,555
Total assets 119,157 130,967 128,080 133,115 127,737 140,400 165,860 178,976 211,352 239,169
Free cash flow
Operating cash flow (including working capital changes) 11,473 7,283 5,564 13,759 16,830 21,548 54,183 27,661 38,923 39,199
Capital expenditure (6,906) (6,438) (2,071) (2,059) (1,659) (3,660) (5,321) (10,000) (10,000) (10,000)
Investments (3,031) (5,136) 391 2,158 3,700 (10,702) (28,803) 29,238 (13,000) (16,000)
Free cash flow 1,535 (4,291) 3,884 13,858 18,870 15,958 50,611 17,661 28,923 29,199
Ratios
Gross margin (%) 26.8 26.9 23.5 26.5 30.3 30.6 29.1 28.2 28.4 27.6
EBITDA margin (%) 9.8 7.0 1.7 7.6 11.9 10.9 10.4 10.3 11.5 11.3
PAT margin (%) 4.4 3.5 0.3 2.5 2.1 6.1 6.0 5.9 7.0 7.0
Debt/equity (X) 0.7 0.9 1.0 0.6 0.6 0.4 0.2 — — —
Net debt/equity (X) 0.3 0.9 1.0 0.5 0.2 0.2 (0.0) (0.6) (0.6) (0.5)
Book Value , excluding revaluation reserve (Rs/share) 11.3 12.3 11.9 14.6 14.7 17.4 19.8 23.8 29.5 35.5
BVPS, excl. revaluation reserve 17.7 12.6 0.8 8.6 9.1 26.1 28.7 28.4 33.3 29.0
RoACE (%) 10.4 8.3 4.1 6.5 7.4 19.6 23.6 26.4 33.3 29.0

For Private Circulation Only. FOR IMPORTANT INFORMATION ABOUT KOTAK SECURITIES’ RATING SYSTEM AND OTHER DISCLOSURES, REFER TO THE END OF THIS MATERIAL.
Chairman reinforces his vision of strategic transformation to a technology platform company
RIL’s chairman reinforced his vision of a strategic transition to a technology platform company
with three key verticals of (1) mobile connectivity, (2) fiber connectivity and (3) new commerce
platform for the retail business. RIL also indicated its optimism on three new technology-backed
platform business opportunities in crucial sectors of agriculture, education and healthcare. This
transformation will be well supported by Jio’s strength of network capacity, which has been
doubled over the past 12 months with current utilization remaining below 20%.
Targeting more subscribers by reducing cost of JioPhone to `501 and rollout of JioGigaFiber
Jio has already achieved a subscriber-base of more than 215 mn customers to date including
over 25 mn JioPhone users. The company intends to expand it substantially by—(1) offering
customers an option to exchange existing feature phones for a new JioPhone under ‘Monsoon
Hungama’ offer for `501 (déjà vu—July 2003?), with a target to reach 100 mn users in a short
period of time and (2) launch of fiber-based broadband service, ‘JioGigaFiber’, along with a set-
top box for TV from August 15 across 1,100 cities, with a target to connect 50 mn households.
RIL is also planning to introduce three most popular apps, YouTube, WhatsApp and Facebook
for JioPhone users and launch a premium JioPhone2 with better screen and keyboard at
`2,999, both from August 15.
Updates on energy and petchem business
RIL indicated that new PX units and ROGC are operating substantially higher than their design
capacity. DTA gasification complex has stabilized in less than 120 days as compared to 9-12
months required by global peers for such a project. The company plans to further enhance the
level of integration by adding new chemical chains and capacity to produce new materials and
high-value composites. RIL, along with BP, is pursuing integrated gas field development in KG
D-6 block with a target to commence production by CY2020 and ramp up to peak levels of 30-35
mcm/d by CY2022. RIL also indicated merging Reliance Holdings USA with standalone entity.
Recent weaknesses in refining and petchem margins warrant a caution
We highlight that recent weaknesses in regional refining and petchem margins warrant a
caution, even as we expect them to normalize seeking comfort from global supply-demand
balance. Singapore complex margins have declined sharply to US$4/bbl in the recent week led
by sustained weakness in cracks across products. Asian petchem margins have also moderated
over the past few months across key polymers amid sharp increase in crude/naphtha prices.
Reliance Industries (RIL) Energy
AGM takeaways—a vision and more disruptions. RIL’s chairman focused on the
consumer business of Jio and retail in his AGM speech, while reinforcing his vision of
strategic transition to a technology platform company with an objective of scaling up
consumer profits at parity level to energy and petrochemicals business over the next
decade. Effective reduction in price of JioPhone to `501 under exchange, rollout of
JioGigaFiber and launch of new commerce platform (retail) could be the next big
disruptions. Maintain REDUCE on full valuations.
REDUCE
JULY 06, 2018
UPDATE
Coverage view: Attractive
Price (`): 990
Target price (`): 930
BSE-30: 35,575
Tarun Lakhotia
Rohit Chordia
Akshay Bhor
Reliance Industries
Stock data Forecasts/Valuations 2018 2019E 2020E
52-week range (Rs) (high,low) EPS (Rs) 59.1 67.9 77.4
Market Cap. (Rs bn) EPS growth (%) 16.9 14.9 13.9
Shareholding pattern (%) P/E (X) 16.3 14.2 12.5
Promoters 46.2 Sales (Rs bn) 3,916.8 4869.6 5,285.4
FIIs 26.5 Net profits (Rs bn) 349.9 402.2 458.1
MFs 2.7 EBITDA (Rs bn) 641.8 812.9 953.8
Price performance (%) 1M 3M 12M EV/EBITDA (X) 12.6 10.1 8.5
Absolute 1.8 6.2 33.7 ROE (%) 11.6 11.9 12.1
Rel. to BSE-30 (0.1) 0.3 17.4 Div. Yield (%) 0.6 0.7 0.7
Company data and valuation summary
1,036-712
5,707.9

Reliance Industries Energy
KOTAK INSTITUTIONAL EQUITIES RESEARCH 7
Exhibit 1: Singapore complex refining margins decline to US$4/bbl in the recent week Weekly Singapore refining margins (US$/bbl)
Source: Reuters, Kotak Institutional Equities
Exhibit 2: Margin for key polymers have moderated in the recent months Asia chemical margins, calendar year-ends (US$/ton)
Source: Platts, Kotak Institutional Equities
Reuters Singapore refining margins, March fiscal year-ends (US$/bbl)
2012 2013 2014 2015 2016 2017 2018 2019
1Q 8.2 6.7 6.6 5.8 8.1 5.1 6.4 6.1
2Q 8.9 9.1 5.2 4.8 6.2 5.1 8.3
3Q 6.4 6.6 5.4 6.3 8.0 6.7 7.3
4Q 7.5 8.5 6.2 8.6 7.8 6.4 7.0
Average 7.8 7.7 5.9 6.3 7.5 5.8 7.2 6.1
0
2
4
6
8
10
12
Apr-14 Oct-14 Apr-15 Oct-15 Apr-16 Oct-16 Apr-17 Oct-17 Apr-18
Reuters Singapore refining margins(US$/bbl)
Quarterly average Monthly average
Annual average margins qoq mom Recent
2015 2016 2017 2018YTD 3Q17 4Q17 1Q18 2Q18 (%) Mar Apr May June (%) Jun 8 Jun 15 Jun 22 Jun 29
Ethylene chain
Ethylene – naphtha 575 671 655 677 657 693 714 641 (10.3) 746 722 543 657 21.1 646 667 697 660
HDPE – 1.015 x ethylene 117 25 (42) (87) (46) (115) (86) (89) 4.3 (125) (167) 9 (110) NA (94) (110) (110) (145)
LLDPE – 1.015 x ethylene 104 39 (30) (124) (21) (109) (120) (129) 7.7 (151) (180) (47) (160) 239.8 (139) (175) (175) (190)
LDPE – 1.015 x ethylene 148 93 55 (93) 35 (50) (88) (99) 12.4 (124) (142) (19) (135) 591.2 (114) (150) (150) (165)
HDPE – naphtha 709 712 630 609 628 597 648 571 (12.0) 641 574 570 567 (0.5) 571 577 607 535
LLDPE – naphtha 695 725 642 573 653 603 614 531 (13.5) 615 562 514 517 0.6 526 512 542 490
LDPE – naphtha 739 780 727 603 708 662 646 561 (13.1) 642 599 542 542 0.1 551 537 567 515
Propylene chain
Propylene – naphtha 298 315 384 433 415 346 453 413 (8.9) 448 422 397 419 5.7 426 417 437 395
PP – 1.01 x propylene 265 228 158 161 159 196 162 160 (1.6) 167 163 152 164 8.2 164 169 174 174
PP – naphtha 571 550 550 604 583 551 625 583 (6.8) 625 595 559 594 6.3 601 597 622 580
Styrene chain
Benzene – naphtha 194 240 327 255 292 265 311 199 (36.1) 285 227 188 182 (3.3) 201 186 182 153
Styrene – 0.81 x benzene 197 203 216 280 259 197 259 300 15.8 233 252 314 335 6.8 349 350 318 292
– 0.29 x ethylene
Polystyrene – 0.98 styrene 177 169 159 190 169 183 180 201 11.3 237 202 197 202 2.6 185 185 244 233
PS – naphtha 726 780 855 907 877 828 930 885 (4.8) 948 882 860 912 6.0 921 917 947 880
Vinyl chain
EDC – (0.3 x ethylene) (39) (62) (92) (134) (123) (199) (172) (97) (43.7) (154) (140) (77) (73) (5.1) (94) (101) (101) (61)
PVC – 1.025 (0.235 x ethylene 320 339 402 407 456 421 442 371 (16.0) 436 399 379 337 (11.2) 352 361 361 325
+ 0.864 x EDC)
PVC – naphtha 333 427 407 328 449 315 364 293 (19.7) 392 339 254 284 11.9 276 287 317 280
Polyester/intermediates
PSF – 0.85 x PTA – 0.34 x MEG 362 297 382 273 378 336 295 252 (14.5) 315 273 235 247 5.4 — — 267 —
PFY – 0.85 x PTA – 0.34 x MEG 700 486 576 590 608 616 620 560 (9.6) 640 598 545 537 (1.3) — — 557 —
PTA – 0.67 x PX 96 97 109 161 122 117 141 181 28.5 160 163 169 212 25.6 210 210 218 219
PX – naphtha 330 373 340 341 338 294 361 321 (11.0) 361 333 320 311 (2.6) 321 315 312 297
MEG – naphtha 284 262 357 372 414 339 406 339 (16.5) 348 406 319 291 (8.7) 295 300 288 276
MEG – 0.6 x ethylene 136 19 162 211 207 151 211 212 0.7 131 218 262 157 (40.2) 167 161 119 144
PSF – naphtha 684 644 745 675 773 666 705 646 (8.4) 722 684 608 645 6.1 — — 672 —
PFY – naphtha 1,022 833 939 992 1,003 946 1,030 954 (7.4) 1,047 1,009 918 935 1.9 — — 962 —

Energy Reliance Industries
8 KOTAK INSTITUTIONAL EQUITIES RESEARCH
Key assumptions behind earnings model
Refining margins. We model FY2019-21 refining margins at US$12/bbl, US$12.5/bbl
and US$12.5/bbl, reflecting robust underlying fundamentals due to improving global
refining operating rates from a favorable demand-supply balance. Our refining
assumption includes incremental contribution of US$0.3-0.5/bbl from fuel marketing
business, as being accounted by the company.
Exhibit 3: Major assumptions for RIL's refining segment, March fiscal year-ends, 2014-
21E (US$/bbl)
Source: Company, Kotak Institutional Equities estimates
Chemical margins. We expect petchem sales volumes to increase to 18.9 mn tons by
FY2021 from 16.4 mn tons in FY2018, led by full ramp-up of expansion projects. We
estimate blended petchem EBITDA to increase to around US$236/ton in FY2019-20 from
US$221/ton in FY2018 led by (1) expected strength in polyesters cycle and (2) further
integration benefits from RIL’s new projects; we assume margins to moderate
subsequently to US$228/ton in FY2021.
Exhibit 4: Major assumptions for RIL's petchem segment, March fiscal year-ends, 2014-21E (US$/ton)
Source: Company, Kotak Institutional Equities estimates
Jio. We have assumed paid subscriber base to increase to a substantial 380 mn by
FY2021E with an ARPU of `130/month. Our assumptions result in `632 bn of revenues
and `361 bn of EBITDA with 57% margins.
2014 2015 2016 2017 2018 2019E 2020E 2021E
Exchange rate (Rs/US$) 60.5 61.1 65.5 67.1 64.5 67.6 68.0 69.0
Crude throughput (mn tons)
SEZ refinery 37.7 37.2 37.1 37.3 36.9 37.3 37.3 37.3
DTA refinery 30.3 30.9 32.4 32.8 32.8 32.8 32.8 32.8
Total crude throughput 68.0 68.0 69.5 70.1 69.8 70.0 70.0 70.0
Blended refining margins (US$/bbl) 8.1 8.6 10.8 11.0 11.7 12.0 12.5 12.5
2014 2015 2016 2017 2018 2019E 2020E 2021E
Exchange rate (Rs/US$) 60.5 61.1 65.5 67.1 64.5 67.6 68.0 69.0
Production volumes (mn tons)
Polymers 4.5 4.3 4.6 4.5 4.9 5.5 5.8 5.8
PE 1.0 1.0 1.0 1.1 1.4 1.9 2.1 2.1
PP 2.8 2.7 2.8 2.7 2.8 2.9 2.9 2.9
PVC 0.7 0.6 0.8 0.7 0.7 0.7 0.7 0.7
Polyesters 1.6 1.8 2.2 2.3 2.4 2.6 2.7 2.8
PFY 0.7 0.9 0.8 0.7 0.8 0.9 1.0 1.1
PSF 0.6 0.6 0.6 0.7 0.6 0.7 0.7 0.7
PET 0.3 0.4 0.8 0.8 1.0 1.0 1.0 1.0
Fiber intermediates 4.7 4.9 6.4 6.9 9.0 9.8 10.1 10.3
PX 2.0 2.2 2.3 2.3 3.7 4.1 4.3 4.5
PTA 2.0 2.1 3.4 3.9 4.1 4.3 4.4 4.4
MEG 0.7 0.6 0.7 0.7 1.2 1.4 1.4 1.4
Total volumes 10.8 11.0 13.2 13.6 16.4 17.9 18.6 18.9
Petchem EBITDA per ton (US$/ton) 148 141 129 153 221 236 236 228

Reliance Industries Energy
KOTAK INSTITUTIONAL EQUITIES RESEARCH 9
Exhibit 5: Reasonable assumptions for Jio Financial model of R-Jio, March fiscal year-ends, 2018-26E (` bn)
Source: Kotak Institutional Equities estimates
Exhibit 6: Segment break-up of consolidated EBITDA, March fiscal year-ends, 2014-21E (` bn)
Source: Company, Kotak Institutional Equities estimates
2018 2019E 2020E 2021E 2022E 2023E 2024E 2025E 2026E
Assumptions
Subscriber base at end-period (mn) 187 286 346 380 403 424 451 478 508
Subscriber market share (%) 17 26 30 32 33 34 36 37 39
ARPU (Rs/month) 150 120 124 130 140 150 153 158 162
EBITDA margins (%) 33 41 49 57 59 60 60 61 62
Profit model
Revenues 202 348 500 632 759 870 952 1,047 1,149
Interconnect (43) (39) (36) — — — — — —
LF/SUC (18) (33) (50) (69) (82) (94) (102) (113) (123)
Network operating costs (49) (95) (110) (124) (131) (138) (145) (152) (160)
Employee costs (10) (18) (26) (34) (42) (50) (55) (59) (64)
SG&A and other costs (15) (21) (33) (45) (56) (70) (79) (86) (93)
EBITDA 67 142 245 361 448 518 570 638 710
Other income 0 1 1 1 1 1 1 1 1
Finance cost (20) (44) (63) (92) (119) (118) (103) (85) (63)
Depreciation and amortization (36) (56) (72) (84) (94) (101) (110) (119) (129)
Profit before taxes 11 44 111 185 237 301 359 435 520
Current tax (2) (13) (37) (62) (80) (101) (121) (147) (176)
Deferred tax (2) (2) (2) (2) (3) (3) (3) (3) (4)
Net income/(loss) 7 29 73 121 155 197 235 284 340
Contribution to RIL's EPS (Rs) 1 5 12 20 26 33 40 48 57
Balance sheet
Net-worth 1,029 1,058 1,131 1,252 1,407 1,604 1,838 2,123 2,462
Effective net debt 1,400 1,768 1,801 1,949 1,835 1,671 1,467 1,212 902
Invested capital 2,278 2,746 2,941 3,312 3,464 3,601 3,744 3,896 4,059
Cash flow
Operating cash flow (20) 41 100 177 240 299 346 405 471
Working capital (29) 12 12 11 10 9 7 8 8
Capital expenditure (358) (511) (286) (326) (292) (185) (189) (199) (210)
Free cash flow (407) (458) (173) (138) (41) 124 163 214 269
Returns (%)
RoAE 0.8 2.7 6.7 10.2 11.7 13.1 13.6 14.4 14.8
RoACE 0.9 2.2 3.9 5.9 7.2 8.4 9.2 10.2 11.3
CRoCI 2.5 4.1 6.3 8.0 9.4 10.4 11.0 11.8 12.6
Adjusted CRoCI 2.5 4.1 6.3 8.0 9.4 10.4 11.0 11.8 12.6
2014 2015 2016 2017 2018 2019E 2020E 2021E
EBITDA
Petrochemicals 107 111 137 165 259 285 299 297
Refining and marketing 178 191 268 286 290 306 321 324
Oil and gas 67 76 69 13 17 28 24 38
Organized retail 4 8 9 12 25 40 52 63
Digital services — — — (1) 67 142 245 361
Others (7) (12) (65) (12) (16) 13 13 14
Total 348 374 417 462 642 813 954 1,097

Energy Reliance Industries
10 KOTAK INSTITUTIONAL EQUITIES RESEARCH
Exhibit 7: RIL's earnings have high leverage to refining margins Sensitivity of RIL's consolidated EPS to key variables, March fiscal year-ends, 2019-21E
Source: Kotak Institutional Equities estimates
Exhibit 8: Our SoTP valuation of Reliance is `930 per share Sum-of-the-parts valuation of Reliance Industries, FY2020E basis (`)
Source: Kotak Institutional Equities estimates
Fiscal 2019E Fiscal 2020E Fiscal 2021E
Downside Base case Upside Downside Base case Upside Downside Base case Upside
Exchange rate
Exchange rate (Rs/US$) 66.6 67.6 68.6 67.0 68.0 69.0 68.0 69.0 70.0
Net profits (Rs bn) 392.5 402.2 411.8 449.9 458.1 466.4 502.5 510.9 519.2
EPS (Rs) 66.3 67.9 69.5 76.0 77.4 78.8 84.8 86.3 87.7
% upside/(downside) (2.4) 2.4 (1.8) 1.8 (1.6) 1.6
Blended refining margins
Margins (US$/bbl) 11.0 12.0 13.0 11.5 12.5 13.5 11.5 12.5 13.5
Net profits (Rs bn) 374.7 402.2 429.6 435.3 458.1 481.0 487.7 510.9 534.0
EPS (Rs) 63.3 67.9 72.5 73.5 77.4 81.2 82.4 86.3 90.2
% upside/(downside) (6.8) 6.8 (5.0) 5.0 (4.5) 4.5
EBITDA EV/EBITDA EV Valuation
(Rs bn) (X) (Rs bn) (Rs/share)
Petrochemicals 299 6.5 1,942 328
Refining and marketing 321 6.5 2,083 352
Domestic E&P (a) 37 7.0 258 44
US shale 12 7.0 84 14
Retailing 52 20.0 1,039 175
Digital services (b) 2,638 445
Total enterprise value 8,045 1,358
Consolidated net debt 2,538 429
Implied equity value 5,507 930
Reliance Industries Energy
KOTAK INSTITUTIONAL EQUITIES RESEARCH 11
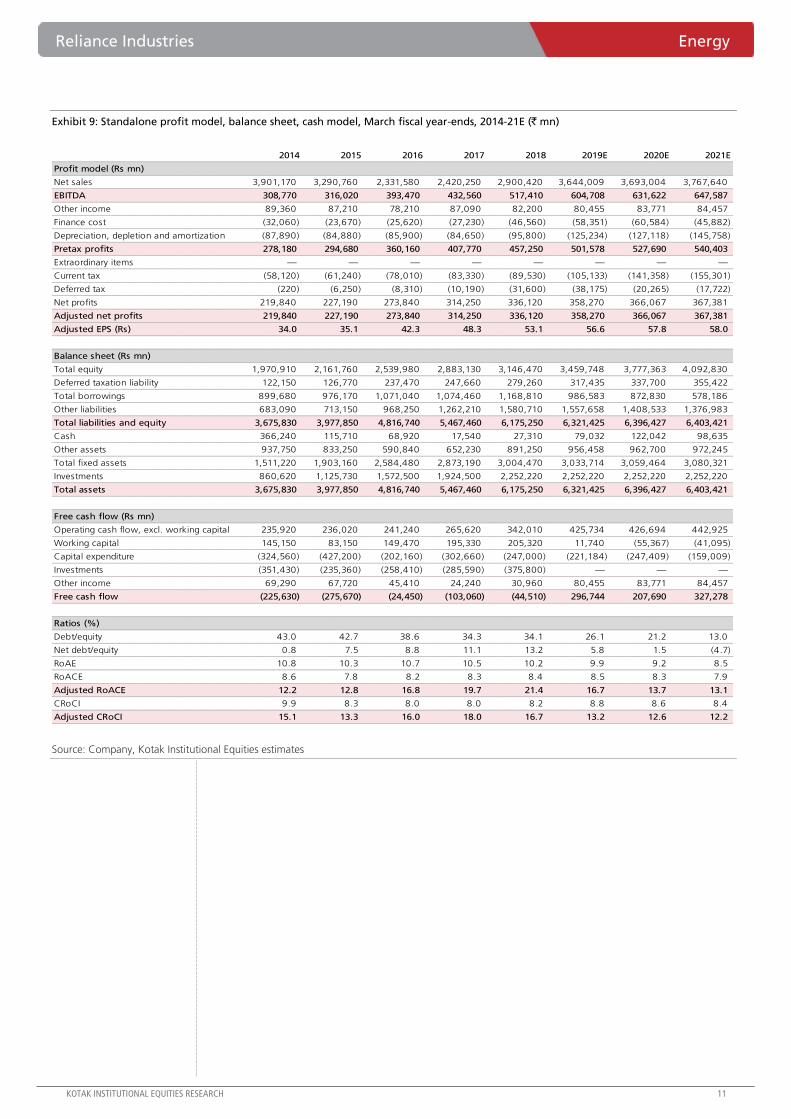
Exhibit 9: Standalone profit model, balance sheet, cash model, March fiscal year-ends, 2014-21E (` mn)
Source: Company, Kotak Institutional Equities estimates
2014 2015 2016 2017 2018 2019E 2020E 2021E
Profit model (Rs mn)
Net sales 3,901,170 3,290,760 2,331,580 2,420,250 2,900,420 3,644,009 3,693,004 3,767,640
EBITDA 308,770 316,020 393,470 432,560 517,410 604,708 631,622 647,587
Other income 89,360 87,210 78,210 87,090 82,200 80,455 83,771 84,457
Finance cost (32,060) (23,670) (25,620) (27,230) (46,560) (58,351) (60,584) (45,882)
Depreciation, depletion and amortization (87,890) (84,880) (85,900) (84,650) (95,800) (125,234) (127,118) (145,758)
Pretax profits 278,180 294,680 360,160 407,770 457,250 501,578 527,690 540,403
Extraordinary items — — — — — — — —
Current tax (58,120) (61,240) (78,010) (83,330) (89,530) (105,133) (141,358) (155,301)
Deferred tax (220) (6,250) (8,310) (10,190) (31,600) (38,175) (20,265) (17,722)
Net profits 219,840 227,190 273,840 314,250 336,120 358,270 366,067 367,381
Adjusted net profits 219,840 227,190 273,840 314,250 336,120 358,270 366,067 367,381
Adjusted EPS (Rs) 34.0 35.1 42.3 48.3 53.1 56.6 57.8 58.0
Balance sheet (Rs mn)
Total equity 1,970,910 2,161,760 2,539,980 2,883,130 3,146,470 3,459,748 3,777,363 4,092,830
Deferred taxation liability 122,150 126,770 237,470 247,660 279,260 317,435 337,700 355,422
Total borrowings 899,680 976,170 1,071,040 1,074,460 1,168,810 986,583 872,830 578,186
Other liabilities 683,090 713,150 968,250 1,262,210 1,580,710 1,557,658 1,408,533 1,376,983
Total liabilities and equity 3,675,830 3,977,850 4,816,740 5,467,460 6,175,250 6,321,425 6,396,427 6,403,421
Cash 366,240 115,710 68,920 17,540 27,310 79,032 122,042 98,635
Other assets 937,750 833,250 590,840 652,230 891,250 956,458 962,700 972,245
Total fixed assets 1,511,220 1,903,160 2,584,480 2,873,190 3,004,470 3,033,714 3,059,464 3,080,321
Investments 860,620 1,125,730 1,572,500 1,924,500 2,252,220 2,252,220 2,252,220 2,252,220
Total assets 3,675,830 3,977,850 4,816,740 5,467,460 6,175,250 6,321,425 6,396,427 6,403,421
Free cash flow (Rs mn)
Operating cash flow, excl. working capital 235,920 236,020 241,240 265,620 342,010 425,734 426,694 442,925
Working capital 145,150 83,150 149,470 195,330 205,320 11,740 (55,367) (41,095)
Capital expenditure (324,560) (427,200) (202,160) (302,660) (247,000) (221,184) (247,409) (159,009)
Investments (351,430) (235,360) (258,410) (285,590) (375,800) — — —
Other income 69,290 67,720 45,410 24,240 30,960 80,455 83,771 84,457
Free cash flow (225,630) (275,670) (24,450) (103,060) (44,510) 296,744 207,690 327,278
Ratios (%)
Debt/equity 43.0 42.7 38.6 34.3 34.1 26.1 21.2 13.0
Net debt/equity 0.8 7.5 8.8 11.1 13.2 5.8 1.5 (4.7)
RoAE 10.8 10.3 10.7 10.5 10.2 9.9 9.2 8.5
RoACE 8.6 7.8 8.2 8.3 8.4 8.5 8.3 7.9
Adjusted RoACE 12.2 12.8 16.8 19.7 21.4 16.7 13.7 13.1
CRoCI 9.9 8.3 8.0 8.0 8.2 8.8 8.6 8.4
Adjusted CRoCI 15.1 13.3 16.0 18.0 16.7 13.2 12.6 12.2

Energy Reliance Industries
12 KOTAK INSTITUTIONAL EQUITIES RESEARCH
Exhibit 10: Consolidated profit model, balance sheet, cash model, March fiscal year-ends, 2014-21E (` bn)
Source: Company, Kotak Institutional Equities estimates
2014 2015 2016 2017 2018 2019E 2020E 2021E
Profit model (Rs bn)
Net sales 4,345 3,754 2,740 3,054 3,917 4,870 5,285 5,698
EBITDA 348 374 417 462 642 813 954 1,097
Other income 89 85 75 94 89 88 91 92
Finance cost (38) (33) (37) (38) (81) (118) (140) (156)
Depreciation, depletion and amortization (112) (115) (116) (116) (167) (215) (235) (268)
Pretax profits 287 310 339 401 483 568 670 765
Minority interest/share of associates 0 0 2 (0) 1 1 1 1
Extraordinary items — — 46 — 11 — — —
Effective tax (62) (75) (89) (102) (133) (166) (213) (255)
Net profits 225 236 299 299 361 402 458 511
Adjusted net profits 225 236 253 299 350 402 458 511
Adjusted EPS (Rs) 38 40 43 51 59 68 77 86
Balance sheet (Rs bn)
Total equity 1,987 2,185 2,316 2,637 2,935 3,292 3,702 4,161
Deferred tax liability 119 130 205 212 245 281 301 320
Minority interest 10 30 34 29 35 35 34 33
Total borrowings 1,388 1,609 1,807 1,966 2,188 2,485 2,575 2,447
Other liabilities 785 1,091 1,629 2,224 2,709 2,765 2,581 2,597
Total liabilities and equity 4,288 5,045 5,990 7,068 8,113 8,858 9,192 9,558
Cash 380 125 110 30 43 90 146 129
Loans and advances 280 307 29 37 50 50 50 50
Other assets 687 663 917 1,032 1,341 1,452 1,497 1,543
Total fixed assets 2,329 3,185 4,094 5,185 5,851 6,438 6,670 7,007
Investments 613 765 840 784 829 829 829 829
Total assets 4,288 5,045 5,990 7,068 8,113 8,858 9,192 9,558
Free cash flow (Rs bn)
Operating cash flow, excl. working capital 266 264 211 212 353 498 567 669
Working capital 110 18 78 155 185 6 (58) (44)
Capital expenditure (601) (634) (469) (781) (740) (796) (586) (555)
Other income 67 66 37 15 23 88 91 92
Free cash flow (157) (285) (143) (400) (178) (205) 15 162
Ratios (%)
Debt/equity 69.8 73.6 78.0 74.6 74.5 75.5 69.5 58.8
Net debt/equity 25.9 51.6 71.8 84.8 80.0 77.1 64.8 55.4
RoAE 11.2 10.7 10.5 11.2 11.6 11.9 12.1 12.0
RoACE 7.9 7.0 7.0 7.2 8.1 8.5 8.7 9.1
Adjusted RoACE 11.3 11.3 12.3 13.1 12.0 8.8 8.1 8.6
CRoCI 9.7 7.7 6.6 6.2 7.4 8.2 8.7 9.0
Adjusted CRoCI 15.9 13.5 11.8 12.2 10.2 8.8 9.3 9.7
For Private Circulation Only. FOR IMPORTANT INFORMATION ABOUT KOTAK SECURITIES’ RATING SYSTEM AND OTHER DISCLOSURES, REFER TO THE END OF THIS MATERIAL.
Key takeaways from the meeting
We met Kedar Vaze (CEO), B Ramakrishnan (Director Strategy) and Ratul Bhaduri (CFO) at
SHKL. Below are our key takeaways:
Improving demand outlook for both segments. SHKL is witnessing pickup in volume
growth across both fragrances (88% of revenues) and flavors (12% of revenues). Flavors is
growing faster led by strong demand from savory snacks and sweets. Pick up in underlying
growth will likely be visible in the June-2018 quarterly results. Reported revenue growth may
be a tad lower as the company has discontinued pass-through sales that contributed about
`100-120 mn/quarter (earlier SHKL procured and supplied a particular RM to select clients at
a negligible margin). The EBITDA impact of this would be marginal.
RM supply situation and profitability outlook. Disruption in the supply of a few key raw
materials (mainly due to a fire at BASF’s manufacturing facility in Germany) pushed up RM
prices resulting in a 520 bps yoy decline in the company’s gross margin to 39.1% in the
March 2018 quarter. The management indicated that the supply situation has improved on
the margin; there is still shortage but SHKL is able to procure rationed quantity of RM. SHKL
has increased prices of a few products to pass on RM cost inflation. Given these factors, the
company expects normalization in profitability in the next 2-3 quarters.
Strategy: 3 geos X 3 capabilities— SHKL’s management briefly articulated its strategy. It is
focused on three geographies— India, Indonesia and Italy (sees opportunity locally as well as
in other European markets). On capabilities front, the company has capabilities to cater to
(1) fabric care (largest volume category). The acquisition of Tanishka products helped SHKL
acquire encapsulation technology used in this space, (2) fine fragrances (most profitable
category). The acquisition of CFF helped the company ramp up its technical prowess for this
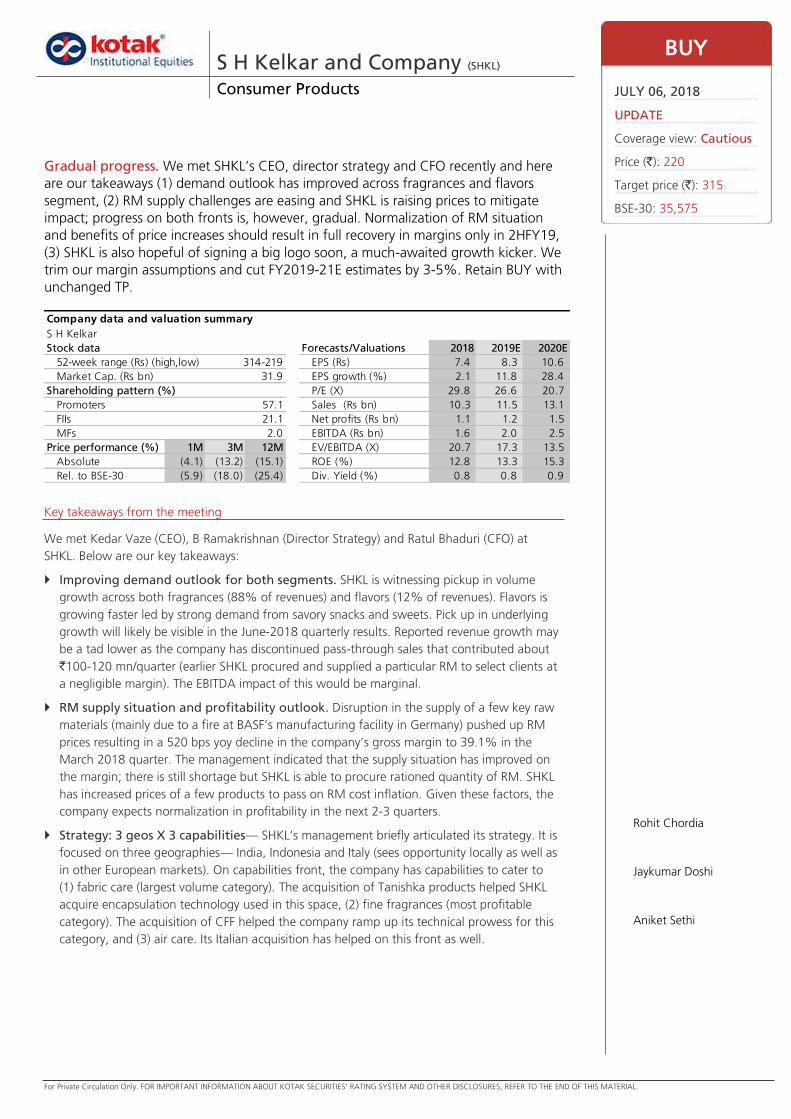
category, and (3) air care. Its Italian acquisition has helped on this front as well.
S H Kelkar and Company (SHKL) Consumer Products
Gradual progress. We met SHKL’s CEO, director strategy and CFO recently and here
are our takeaways (1) demand outlook has improved across fragrances and flavors
segment, (2) RM supply challenges are easing and SHKL is raising prices to mitigate
impact; progress on both fronts is, however, gradual. Normalization of RM situation
and benefits of price increases should result in full recovery in margins only in 2HFY19,
(3) SHKL is also hopeful of signing a big logo soon, a much-awaited growth kicker. We
trim our margin assumptions and cut FY2019-21E estimates by 3-5%. Retain BUY with
unchanged TP.
BUY
JULY 06, 2018
UPDATE
Coverage view: Cautious
Price (`): 220
Target price (`): 315
BSE-30: 35,575
Rohit Chordia
Jaykumar Doshi
Aniket Sethi
S H Kelkar
Stock data Forecasts/Valuations 2018 2019E 2020E
52-week range (Rs) (high,low) EPS (Rs) 7.4 8.3 10.6
Market Cap. (Rs bn) EPS growth (%) 2.1 11.8 28.4
Shareholding pattern (%) P/E (X) 29.8 26.6 20.7
Promoters 57.1 Sales (Rs bn) 10.3 11.5 13.1
FIIs 21.1 Net profits (Rs bn) 1.1 1.2 1.5
MFs 2.0 EBITDA (Rs bn) 1.6 2.0 2.5
Price performance (%) 1M 3M 12M EV/EBITDA (X) 20.7 17.3 13.5
Absolute (4.1) (13.2) (15.1) ROE (%) 12.8 13.3 15.3
Rel. to BSE-30 (5.9) (18.0) (25.4) Div. Yield (%) 0.8 0.8 0.9
Company data and valuation summary
314-219
31.9

Consumer Products S H Kelkar and Company
14 KOTAK INSTITUTIONAL EQUITIES RESEARCH
Rationale for recent acquisitions— SHKL recently acquired 66.7% stake in China-
based Anhui Ruibang Aroma, manufacturer of aroma ingredient Tonalid (musk fragrance
products). SHKL has about 70% share in global Tonalid market. With this acquisition, its
market share will rise to 85-90%. The key rationale for this acquisition was to further
consolidate the Tonalid market in order to improve profitability and dominate the profit
pool. Earlier this year, SHKL acquired an Italian player, Creative Flavours & Fragrances
(CFF). The management indicated that this acquisition helped (a) it acquire capabilities in
fine fragrances and air care and (b) expand its footprint in Milan which is an important
market by itself and a critical base to cater to European nations.
Even as there is merit in these acquisitions, we believe successful integration, talent
retention and extraction of synergies is always an uphill task in overseas acquisitions. We
will wait and see the progress of these tuck-in acquisitions.
Big logo wins. Big logo wins are critical for sustained outperformance of industry growth
rates. We note that the wait for a big logo win is on since its IPO in October 2015. The
management indicated that it is hopeful of signing a big logo soon, bringing an end to
the long wait.
Talent acquisition. SH Kelkar has hired Sampath Kumar as Head of Innovation for
flavors. Prior to this, he worked as a senior flavorist with Takasago, Givaudan, Symrise
and IFF. The company already has a strong existing team of 13-14 perfumers for its
fragrances business.
IFF recently announced the acquisition of Frutarom for US$7.1 bn. This transaction
will make the combined entity the second largest fragrances and flavors player globally.
SHKL’s management indicated that it does not see any impact of this consolidation on its
business. If at all, acquisition of Frutarom, may reduce competitive intensity (often driven
by Frutarom).
We cut FY2019-21E earnings estimate by 3-5%
We have trimmed our GM assumption for 1HFY19 to factor in slower-than-earlier-estimated
recovery in margins. We have also incorporated the impact of discontinuation of pass-
through sales (research service income) and lowered quarterly revenue expectations by
about `100-120 mn (EBITDA impact of this development is marginal as SHKL procured some
RM on behalf of its customers and supplied to them at negligible margin).
Exhibit 1: Key changes to estimates (as per Ind-AS), FY2019-21E
Source: Kotak Institutional Equities estimates
2019E 2020E 2021E 2019E 2020E 2021E 2019E 2020E 2021E
Net revenues (Rs mn) 11,473 13,125 15,264 11,691 13,366 15,447 (1.9) (1.8) (1.2)
EBITDA (Rs mn) 1,953 2,470 2,922 2,058 2,560 3,007 (5.1) (3.5) (2.9)
EBITDA margin (%) 17.0 18.8 19.1 17.6 19.2 19.5
Net income (Rs mn) 1,197 1,537 1,884 1,265 1,593 1,938 (5.4) (3.5) (2.8)
EPS (Rs/share) 8.3 10.6 13.0 8.8 11.0 13.4 (5.4) (3.5) (2.8)
EarlierRevised Change (%)

S H Kelkar and Company Consumer Products
KOTAK INSTITUTIONAL EQUITIES RESEARCH 15
Exhibit 2: SHK: Consolidated profit & loss, balance sheet and cash flow (as per Ind AS), March fiscal year-ends, 2015-21E
Source: Kotak Institutional Equities estimates
2015 2016 2017 2018 2019E 2020E 2021E
Profit model (Rs mn)
Net operating revenues 8,355 9,249 9,805 10,251 11,473 13,125 15,264
EBITDA 1,178 1,498 1,658 1,622 1,953 2,470 2,922
Other income 246 105 116 216 36 35 32
Interest expense (185) (202) (52) (40) (20) — —
Depreciation (293) (297) (194) (238) (265) (298) (327)
Pretax profits 945 1,103 1,528 1,560 1,704 2,208 2,627
Tax (241) (372) (480) (506) (564) (730) (870)
Minority Interest/share of profit from associates — — — 16 57 60 127
Recurring PAT 704 731 1,048 1,070 1,197 1,537 1,884
Extraordinary items — — — (129) — — —
Reported net income 704 731 1,048 942 1,197 1,537 1,884
Wtd average no. of shares - FD (mn) 132 138 145 145 145 145 145
Fully diluted EPS (Rs) 5.3 5.3 7.2 7.4 8.3 10.6 13.0
Balance sheet (Rs mn)
Total shareholder's equity 5,005 7,161 8,118 8,571 9,463 10,652 12,057
Preference share capital/ CCPS 92 — — — — — —
Total borrowings 2,417 846 734 1,933 1,933 1,633 1,433
Deferred tax liability (50) 10 33 82 82 82 82
Minority interest — — — — — — —
Total liabilities and equity 7,464 8,016 8,884 10,586 11,478 12,367 13,571
Net fixed assets incl CWIP 2,842 2,454 3,038 3,978 4,273 4,394 4,537
Investments — 354 497 1,108 1,108 1,108 2,108
Cash 759 822 555 239 29 100 (767)
Net current assets 3,864 4,386 4,795 5,262 6,068 6,765 7,694
Total assets 7,464 8,016 8,884 10,586 11,478 12,367 13,571
Free cash flow (Rs mn)
Operating cash flow (excl working capital) 993 1,126 1,260 1,326 1,476 1,835 2,221
Working capital (375) (275) (248) (467) (806) (697) (929)
Capital expenditure (218) (238) (1,008) (1,178) (560) (419) (471)
Free cash flow 400 613 4 (319) 110 720 822
Key ratios (%)
Sales growth 9.7 10.6 5.9 4.5 12.0 14.4 16.3
EBITDA growth (14.1) 27.2 10.7 (2.2) 20.4 26.5 18.3
PAT growth (11.0) 3.8 43.5 2.1 11.8 28.4 22.6
EBITDA margin 14.1 16.2 16.9 15.8 17.1 18.9 19.2
Gross margin 44.9 44.5 45.4 45.1 45.6 46.9 47.0
IGAAP Ind-AS

For Private Circulation Only. FOR IMPORTANT INFORMATION ABOUT KOTAK SECURITIES’ RATING SYSTEM AND OTHER DISCLOSURES, REFER TO THE END OF THIS MATERIAL.
Revenues: low base + rural pickup = a 21-quarter high aggregate growth print
We forecast a 13.5% yoy revenue growth in aggregate for our consumer universe. We expect
the staples (+14% yoy) pack to grow marginally ahead of the discretionary pack (+13% yoy).
We note that some of the discretionary names TTAN had a particularly strong 1QFY18 and the
same weighs on the marginally-below-staples growth for the discretionary pack.
Rural pickup and low base are likely to reflect in strong volume growth prints across companies
and categories with the few notable exceptions being (a) Colgate – not regaining share from
Patanjali yet, (b) Marico’s Saffola franchise; interventions to drive volume growth yet to deliver,
and (c) Bajaj Corp. We expect strong volume growth comps for Britannia (market acceleration +
share gains), HUVR (continues to fire on all cylinders), APNT (rural pickup), JUBI (success of
EDV-99) and Pidilite.
Pricing contribution to growth, like-on-like, is likely to remain on the lower side as companies
have (a) not had a reason to raise prices; rising RM is yet to reflect in consumption prices in
most cases, and (b) been careful on price hikes in the backdrop of anti-profiteering noise.
Now that we are past the first anniversary of GST implementation, we gather that companies
are looking to raise prices to pass on RM inflation. This should provide additional pricing kicker
to growth going forward.
Margins: GST benefits (optical + structural) + benign competitive intensity = further expansion
We forecast an aggregate 140 bps yoy expansion in EBITDA margin for our coverage universe,
210 bps for the aggregate staples pack and 90 bps for the discretionary pack. Of the 140 bps
EBITDA margin expansion, roughly 50 bps (110 bps for staples, flattish for discretionary) comes
from gross margin expansion and the balance 90 bps from operating leverage and GST-related
input tax credit benefits. We bake in strong margin expansion for most large names – Dabur
(+340 bps), GSK-CH (+320 bps), GCPL (+286 bps), JYL (+255 bps), Nestle (+442 bps), UNSP
(+339 bps), and UBBL (+449 bps). Our margin expansion estimate for HUVR is a modest +211 bps
while we expect JUBI to report a healthy +405 bps margin expansion. Marico is the only names
for which we forecast a margin decline (112 bps on account of continued high copra inflation).
We expect aggregate A&P intensity to be flattish yoy.
Net income: growth in line with EBITDA growth
We expect a 24-quarter high 22.7% growth in recurring PAT for our coverage universe with the
staples pack likely to see a PAT growth as high as 30% while the discretionary pack clocks
17%. Several companies (APNT, Dabur, GSK-CH, GCPL, HUVR, JYL, JUBI, NEST, PAG, TGBL,
TTAN, UNSP, UBBL) are likely to report 25%+ PAT growth for the quarter as low-base, benign
competition and GST tailwinds all contribute. Aggregate ETR is likely to be flattish at around
32.4%. ITC and BJCOR are likely to be the only two names to report single-digit PAT growth
(we forecast 6.6% yoy PAT growth for ITC and 9.3% for BJCOR).
Consumer Products India
1QFY19E preview: multi-year high growth comps off a low base. We forecast
aggregate (coverage universe) revenue, EBITDA and PAT growth of 13.5%, 21.8% and
22.7%, respectively for 1QFY19E. These are all multi-year high numbers. To be sure,
these come off a low 1QFY18 (pre-GST) base. That said – (a) there is an improvement in
underlying demand trends and (b) the margin outlook remains positive as competitive
intensity continues to be generally benign.
CAUTIOUS
JULY 06, 2018
UPDATE
BSE-30: 35,575
Rohit Chordia
Jaykumar Doshi
Aniket Sethi

Consumer Products India
KOTAK INSTITUTIONAL EQUITIES RESEARCH 17
Exhibit 1: KIE consumer universe valuation summary
Source: Company, Kotak Institutional Equities estimates
TP 4-Jul-18 EPS Sales
Company Rating (Rs) Price (Rs) (Rs bn) (US$ m) 2018 2019E 2020E 2018 2019E 2020E 2018 2019E 2020E
Consumer Products
Asian Paints REDUCE 1,100 1,290 (15) 1,237 18,194 20.5 24.4 27.9 2.9 18.7 14.7 62.8 52.9 46.2 16.7 15.4
Bajaj Corp ADD 520 409 27 60 887 14.1 16.8 18.6 (10.5) 18.7 10.5 28.9 24.3 22.0 14.5 14.0
Britannia Industries ADD 6,000 6,300 (5) 756 11,117 83.7 104.1 126.5 13.5 24.4 21.5 75.3 60.5 49.8 22.9 15.4
Coffee day Enterprises REDUCE 340 259 31 53 786 3.4 8.6 13.7 53.0 149.7 59.4 75.6 30.3 19.0 99.5 12.0
Colgate-Palmolive (India) ADD 1,300 1,166 11 317 4,665 23.8 27.3 31.9 15.2 14.6 16.9 49.0 42.8 36.6 15.8 12.0
Dabur India REDUCE 350 380 (8) 669 9,837 7.8 9.0 10.1 7.2 16.1 11.7 48.9 42.1 37.7 13.9 13.0
GlaxoSmithKline Consumer ADD 6,750 6,427 5 270 3,975 166.5 188.6 211.1 6.6 13.3 11.9 38.6 34.1 30.4 12.6 10.8
Godrej Consumer Products REDUCE 1,020 1,264 (19) 861 12,662 21.4 25.1 28.5 11.6 17.6 13.3 59.2 50.3 44.4 15.5 11.9
Hindustan Unilever REDUCE 1,430 1,676 (15) 3,627 53,341 24.5 28.1 31.8 24.8 14.9 13.0 68.5 59.6 52.8 13.9 12.2
ITC ADD 315 264 19 3,232 47,525 9.0 9.7 10.8 8.2 8.0 11.6 29.5 27.3 24.5 9.8 8.1
Jubilant Foodworks BUY 1,500 1,429 5 188 2,772 14.6 23.9 33.2 191.7 64.1 39.2 98.2 59.8 43.0 51.1 17.0
Jyothy Laboratories ADD 220 241 (9) 88 1,290 4.4 5.5 6.5 35.1 25.4 17.2 54.8 43.7 37.3 21.2 13.4
Manpasand Beverages SELL 132 172 nm 20 289 8.7 11.5 16.6 36.9 32.5 44.0 19.8 14.9 10.4 38.1 36.6
Marico ADD 345 343 1 443 6,510 6.3 7.3 8.3 2.0 15.9 13.7 54.4 46.9 41.2 14.8 14.2
Nestle India ADD 9,500 9,863 (4) 951 13,985 127.1 168.3 190.8 21.1 32.5 13.4 77.6 58.6 51.7 22.5 11.9
Page Industries SELL 18,200 28,028 (35) 313 4,597 311.1 392.4 482.1 30.3 26.1 22.9 90.1 71.4 58.1 24.5 19.8
Pidilite Industries REDUCE 1,050 1,068 548 8,055 18.0 21.7 26.1 7.5 20.4 20.4 59.2 49.2 40.9 20.4 16.4
S H Kelkar BUY 315 222 42 32 473 7.4 8.8 11.0 2.1 18.2 25.9 30.0 25.4 20.2 22.0 14.2
Tata Global Beverages REDUCE 285 278 2 176 2,583 7.3 9.5 11.3 20.7 29.4 19.1 37.9 29.3 24.6 24.2 6.6
Titan Co. SELL 800 887 (10) 787 11,575 12.5 16.2 19.5 45.3 29.3 20.6 70.7 54.7 45.4 24.8 20.8
United Breweries SELL 1,000 1,178 (15) 312 4,582 14.9 19.4 23.9 71.6 29.7 23.4 78.9 60.8 49.3 26.5 13.7
United Spirits SELL 560 667 (16) 485 7,132 7.6 10.7 13.6 39.1 40.5 27.4 87.7 62.4 49.0 33.8 9.9
Varun Beverages ADD 750 767 (2) 140 2,056 11.5 16.8 21.8 378.1 45.5 29.8 66.5 45.7 35.2 37.4 20.8
KIE universe 15,564 228,887 13.0 16.6 15.0 51.4 44.1 38.3 14.8 12.9
KIE universe (ex-ITC) 12,193 179,306 15.8 21.5 16.7 63.2 52.0 44.5 18.6 14.1
1-mo 3-mo 6-mo 1-yr 2018E 2019E 2020E 2018E 2019E 2020E 2018E 2019E 2020E 2019E 2020E
Asian Paints 0 14 10 16 38.4 33.0 28.7 7.3 6.3 5.4 0.6 1.1 1.7 0.8 1.0
Bajaj Corp (11) (11) (16) 5 22.8 19.6 16.7 6.9 6.0 5.3 2.9 3.5 4.5 3.2 3.4
Britannia Industries 9 25 36 68 49.8 39.1 32.1 7.5 6.5 5.6 0.8 1.2 1.5 0.6 0.7
Coffee day (9) (14) (6) 4 13.0 11.4 9.6 2.1 1.9 1.7 2.7 2.3 1.7 — —
Colgate-Palmolive (India) (5) 8 8 5 28.1 24.6 21.1 7.5 6.7 5.9 1.8 2.4 2.6 1.4 1.6
Dabur India (1) 13 7 29 41.8 36.2 31.7 8.6 7.6 6.7 1.5 1.9 2.2 1.0 1.2
GlaxoSmithKline Consumer (2) 6 0 19 26.5 22.8 19.6 5.4 4.9 4.3 2.4 2.3 2.6 1.4 1.6
Godrej Consumer Products 11 16 28 28 42.9 36.5 31.9 9.1 8.0 7.1 2.5 2.0 2.2 0.7 0.8
Hindustan Unilever 7 23 24 54 49.0 41.4 36.3 10.3 9.1 8.2 1.4 1.6 1.8 1.3 1.4
ITC (2) 2 1 (22) 20.5 18.7 16.6 7.7 7.2 6.6 2.6 2.8 3.2 2.3 2.7
Jubilant Foodworks 12 24 55 179 41.9 29.7 22.9 6.1 5.3 4.5 0.0 1.3 1.9 0.1 0.2
Jyothy Laboratories 17 26 27 36 33.9 28.0 24.3 5.2 4.5 3.9 0.9 2.0 2.5 0.4 0.6
Manpasand Beverages (10) (54) (64) (56) 8.4 5.8 4.4 1.6 1.2 0.9 (8.2) 0.8 7.2 0.4 0.9
Marico 6 5 6 6 38.6 32.4 28.2 6.9 6.0 5.3 1.0 2.1 2.5 1.4 1.6
Nestle India 0 18 25 44 42.4 32.9 29.0 9.2 8.1 7.2 1.8 2.2 2.4 1.2 1.3
Page Industries 13 24 14 61 57.4 45.4 37.3 12.2 10.1 8.4 1.1 1.0 1.3 0.6 0.7
Pidilite Industries (5) 12 18 30 40.0 33.3 27.4 8.8 7.5 6.4 0.8 1.1 1.7 0.7 0.8
S H Kelkar (3) (12) (23) (15) 20.9 16.6 13.2 3.3 2.9 2.5 (0.9) (0.0) 2.3 0.8 0.9
Tata Global Beverages 9 3 (11) 85 20.0 16.9 14.5 2.5 2.3 2.1 1.4 2.7 2.9 1.1 1.3
Titan Co. 0 (2) (1) 66 47.5 36.2 29.0 4.8 3.9 3.3 (0.6) 0.6 1.0 0.5 0.6
United Breweries 1 22 9 46 34.8 29.0 25.1 5.6 4.8 4.2 0.6 1.3 1.7 0.2 0.3
United Spirits 1 6 (10) 32 50.2 37.0 30.7 6.3 5.6 5.0 2.5 1.4 1.6 - 0.3
Varun Beverages 2 20 12 47 20.1 16.2 13.9 4.2 3.2 2.8 (3.0) 0.7 1.7 - -
KIE FMCG universe 3 12 11 20 34.0 29.0 25.1 7.5 6.6 5.8 1.5 1.8 2.2 0.9 1.1
KIE universe (ex-ITC) 3 14 13 39 40.9 33.7 28.9 7.5 6.5 5.7 1.2 1.6 1.9 0.8 1.0
Sensex 2 8 5 14
Dividend yield (%)
CAGR - (2018-20E), %
Mkt cap. EPS Growth, % PER (X)
EV/Sales (X) FCF yield (%)Price performance (%)
Upside /
(downside)
(%)
EPS (Rs)
EV/EBITDA (X)

India Consumer Products
18 KOTAK INSTITUTIONAL EQUITIES RESEARCH
Aggregate sectoral trends (in charts)
Exhibit 2: Overall revenue growth to accelerate to highest levels in 21 quarters KIE consumer universe revenue growth trends, yoy (%)
Source: Company, Kotak Institutional Equities
Exhibit 3: Staples revenue growth to rise to 14% yoy KIE consumer staples universe revenue growth trends, yoy (%)
Source: Company, Kotak Institutional Equities
Exhibit 4: Discretionary to grow at a marginally lower pace KIE consumer discretionary universe revenue growth trends, yoy (%)
Source: Company, Kotak Institutional Equities
8.5
7.0
8.8
6.1 5.6 5.6
1.1
7.7
3.8
8.3 9.4
7.7
13.5
-
2
4
6
8
10
12
14
16
1Q
FY16
2Q
FY16
3Q
FY16
4Q
FY16
1Q
FY17
2Q
FY17
3Q
FY17
4Q
FY17
1Q
FY18
2Q
FY18
3Q
FY18
4Q
FY18
1Q
FY19E
7.8
5.5
3.5
5.1 3.9 3.4
(0.6)
4.7
1.8
5.2
11.2
9.1
14.0
(2)
-
2
4
6
8
10
12
14
16
1Q
FY16
2Q
FY16
3Q
FY16
4Q
FY16
1Q
FY17
2Q
FY17
3Q
FY17
4Q
FY17
1Q
FY18
2Q
FY18
3Q
FY18
4Q
FY18
1Q
FY19E
9.8 10.0
16.7
7.5 8.2
8.8
3.3
11.9
5.8
11.5
7.6
6.3
13.0
-
2
4
6
8
10
12
14
16
18
1Q
FY16
2Q
FY16
3Q
FY16
4Q
FY16
1Q
FY17
2Q
FY17
3Q
FY17
4Q
FY17
1Q
FY18
2Q
FY18
3Q
FY18
4Q
FY18
1Q
FY19E

Consumer Products India
KOTAK INSTITUTIONAL EQUITIES RESEARCH 19
Exhibit 5: Overall EBITDA to grow at 20%+ aided by GST-led savings and higher operating leverage KIE consumer universe EBITDA growth trends, yoy (%)
Source: Company, Kotak Institutional Equities
Exhibit 6: Staples EBITDA growth to see sharp increase KIE consumer staples universe EBITDA growth trends, yoy (%)
Source: Company, Kotak Institutional Equities
Exhibit 7: Discretionary also could see some further uptick KIE consumer discretionary universe EBITDA growth trends, yoy (%)
Source: Company, Kotak Institutional Equities
21.4
18.0 18.4
11.3
13.5
6.1
(2.6)
10.8
1.6
14.0
18.3
17.4
21.8
(5)
-
5
10
15
20
25
1Q
FY16
2Q
FY16
3Q
FY16
4Q
FY16
1Q
FY17
2Q
FY17
3Q
FY17
4Q
FY17
1Q
FY18
2Q
FY18
3Q
FY18
4Q
FY18
1Q
FY19E
20.6
15.3 14.2 12.3
10.8
7.3
(3.7)
9.6
0.4
13.3
24.4
19.7
28.2
(10)
(5)
-
5
10
15
20
25
30
1Q
FY16
2Q
FY16
3Q
FY16
4Q
FY16
1Q
FY17
2Q
FY17
3Q
FY17
4Q
FY17
1Q
FY18
2Q
FY18
3Q
FY18
4Q
FY18
1Q
FY19E
22.9 23.5 26.0
9.1
18.2
3.9 (0.8)
13.4
2.5
14.5 14.0
15.5
16.9
(5)
-
5
10
15
20
25
30
1Q
FY16
2Q
FY16
3Q
FY16
4Q
FY16
1Q
FY17
2Q
FY17
3Q
FY17
4Q
FY17
1Q
FY18
2Q
FY18
3Q
FY18
4Q
FY18
1Q
FY19E

India Consumer Products
20 KOTAK INSTITUTIONAL EQUITIES RESEARCH
Exhibit 8: Overall PAT to grow at 23% levels KIE consumer universe PAT growth trends, yoy (%)
Source: Company, Kotak Institutional Equities
Exhibit 9: Staples PAT likely to grow at ~30% yoy KIE consumer staples universe PAT growth trends, yoy (%)
Source: Company, Kotak Institutional Equities
Exhibit 10: Discretionary could also grow at higher teen levels KIE consumer discretionary universe PAT growth trends, yoy (%)
Source: Company, Kotak Institutional Equities
18.7 18.3 19.5
8.8
13.3
8.7
(4.1)
7.4
2.5
13.2
19.6
21.2
22.7
(10)
(5)
-
5
10
15
20
25
1Q
FY16
2Q
FY16
3Q
FY16
4Q
FY16
1Q
FY17
2Q
FY17
3Q
FY17
4Q
FY17
1Q
FY18
2Q
FY18
3Q
FY18
4Q
FY18
1Q
FY19E
16.4 14.9 14.3
10.8 8.9 9.0
(5.5)
7.2
1.3
11.7
27.7
22.8 30.2
(10)
(5)
-
5
10
15
20
25
30
35
1Q
FY16
2Q
FY16
3Q
FY16
4Q
FY16
1Q
FY17
2Q
FY17
3Q
FY17
4Q
FY17
1Q
FY18
2Q
FY18
3Q
FY18
4Q
FY18
1Q
FY19E
24.6
28.6 31.0
4.0
22.6
8.1
(1.3)
7.8 3.5
14.5 14.1
19.9 16.9
(5)
-
5
10
15
20
25
30
35
1Q
FY16
2Q
FY16
3Q
FY16
4Q
FY16
1Q
FY17
2Q
FY17
3Q
FY17
4Q
FY17
1Q
FY18
2Q
FY18
3Q
FY18
4Q
FY18
1Q
FY19E

Consumer Products India
KOTAK INSTITUTIONAL EQUITIES RESEARCH 21
Exhibit 11: Aggregate EBITDA margin expansion driven by combination of
favorable factors KIE consumer universe EBITDA margin change yoy (bps)
Source: Company, Kotak Institutional Equities
Exhibit 12: Favorable RM environment (except oil) to help GMs KIE consumer universe gross margin change yoy (bps)
Source: Company, Kotak Institutional Equities
Exhibit 13: Aggregate A&SP spends should see a modest rise KIE consumer universe A&SP change yoy (bps)
Source: Company, Kotak Institutional Equities
176
150
127
71
125
8
(60)
47
(35)
107 158 176 142
(100)
(50)
-
50
100
150
200
1Q
FY
16
2Q
FY
16
3Q
FY
16
4Q
FY
16
1Q
FY
17
2Q
FY
17
3Q
FY
17
4Q
FY
17
1Q
FY
18
2Q
FY
18
3Q
FY
18
4Q
FY
18
1Q
FY
19E
259
205
173 191 144
(9)
(87)
(147)(75) (128)
108 151
53
(200)
(150)
(100)
(50)
-
50
100
150
200
250
300
1Q
FY
16
2Q
FY
16
3Q
FY
16
4Q
FY
16
1Q
FY
17
2Q
FY
17
3Q
FY
17
4Q
FY
17
1Q
FY
18
2Q
FY
18
3Q
FY
18
4Q
FY
18
1Q
FY
19E
66 75
64 60
(50)(30) (34)
(27)(48)
7
50 19
5
(100)
-
1001Q
FY
16
2Q
FY
16
3Q
FY
16
4Q
FY
16
1Q
FY
17
2Q
FY
17
3Q
FY
17
4Q
FY
17
1Q
FY
18
2Q
FY
18
3Q
FY
18
4Q
FY
18
1Q
FY
19E

India Consumer Products
22 KOTAK INSTITUTIONAL EQUITIES RESEARCH
Company-wise estimates for 1QFY19 (in charts)
Exhibit 14: JYL, UBBL, PIDI, Marico, Page to post strong revenue growth; ITC and TGBL to post relatively subdued growth KIE consumer universe company-wise revenue growth estimate for 1QFY19, yoy (%)
Source: Company, Kotak Institutional Equities estimates
Exhibit 15: Volume growth looks optically higher due to weak base (impacted by GST-led destocking) KIE consumer universe company-wise revenue growth trends, yoy (%)
Source: Company, Kotak Institutional Equities estimates
24 23
20 20 19 19 18 17
16 16 15 15 14 14 13 9
8 6 6
-
5
10
15
20
25
30
Jyoth
y La
bs
UB
Jubila
nt
Foods
Pidili
te
Marico
Page
Tita
n
Dab
ur
Asi
an P
ain
ts
Baj
aj C
orp
.
Brita
nnia
HU
L
UN
SP
GC
PL
Nes
tle
GSK
Consu
mer
Colg
ate
ITC
TGBL
1QFY17 2QFY17 3QFY17 4QFY17 1QFY18 2QFY18 3QFY18 4QFY18 1QFY19 1QFY19 - 2yr CAGR
Staples
Bajaj Corp. - Almond Drop Hair Oil 2.2 1.6 (4.2) (7.1) (6.6) 6.5 4.5 6.0 7.0 (0.0)
Britannia Industries - Domestic 8.0 8.0 2.0 2.0 2.0 6.0 13.0 13.0 13.0 7.4
Colgate - Overall 6.0 4.0 (11.0) (3.0) (5.0) (0.9) 12.0 5.0 4.0 (0.6)
Dabur - Domestic 4.1 4.5 (5.2) 2.4 (4.4) 7.2 13.0 6.0 15.0 4.9
GSK Consumer — (3.0) (17.0) (0.7) (3.0) 2.4 17.0 5.0 8.0 2.4
GCPL - Soaps 10.0 (5.0) (8.0) 5.0 (8.0) 15.0 15.0 8.0 8.0 (0.3)
HUL (FMCG business) 4.0 (1.0) (4.0) 4.0 — 4.0 11.0 8.0 14.0 6.8
Marico - Domestic 8.0 3.4 (4.0) 10.0 (9.0) 8.0 9.4 6.0 10.0 0.0
Marico - Parachute 7.0 (6.0) (1.0) 15.0 (9.0) 12.0 15.0 1.0 11.0 0.5
Marico - Saffola 11.0 8.0 6.0 6.0 (9.0) 3.0 — 1.0 8.0 (0.9)
Marico - Value-added hair oils 9.0 11.0 (12.0) 10.0 (8.0) 12.0 8.0 10.0 14.0 2.4
Discretionary
Asian Paints (Domestic paints) 12.0 12.0 3.0 10.0 2.0 9.0 6.0 8.0 14.0 7.8
ITC - Cigarettes 3.0 4.0 (1.0) — 2.0 (7.0) (5.0) (4.0) (2.5) (0.3)
Jubilant Foodworks - SSG (3.2) 4.2 (3.3) (7.5) 6.5 5.5 17.8 24.0 19.0 12.6
Page (overall) 21.3 10.7 8.7 10.8 13.4 11.1 11.3 15.2 9.8 11.6
Pidilite - Domestic consumer business 9.0 7.8 (1.5) 8.2 — 15.0 23.0 15.0 20.0 9.5
Titan - Jewelry (tonnage) 6.0 (32.0) 4.0 37.0 49.0 49.0 6.0 13.7 9.0 27.4
United Breweries (overall) 6.0 (1.0) (8.0) (9.4) — 11.0 10.4 12.3 16.0 7.7
United Spirits (overall) — 0.9 (5.0) (8.2) (18.9) (15.9) (13.9) (9.0) 8.2 (6.3)
Note:
(1) Asian Paints, Britannia Industries and ITC are KIE estimates.

Consumer Products India
KOTAK INSTITUTIONAL EQUITIES RESEARCH 23
Exhibit 16: Strong EBITDA growth across companies led by UNSP, JUBI, JYL, UBBL and Dabur KIE consumer universe company-wise EBITDA growth estimate for 1QFY19, yoy (%)
Source: Company, Kotak Institutional Equities estimates
Exhibit 17: PAT growth robust across most companies KIE consumer universe company-wise recurring PAT growth estimate for 1QFY19, yoy (%)
Source: Company, Kotak Institutional Equities estimates
72
61
53
45 41
40 35 34 33 30 28 27 26 25 20 18 17
12 7
-
10
20
30
40
50
60
70
80
UN
SP
Jubila
nt
Foods
Jyoth
y La
bs
UB
Dab
ur
Nes
tle
Tita
n
GC
PL
TGBL
GSK
Consu
mer
Page
Brita
nnia
HU
L
Asi
an P
ain
ts
Pidili
te
Baj
aj C
orp
.
Colg
ate
Marico ITC
123
66 58
43 41 38 35 33 32 31 27 27 25 18 17 15
9 7 -
20
40
60
80
100
120
140
UN
SP
TGBL
UB
Nes
tle
Jyoth
y La
bs
GC
PL
Dab
ur
Tita
n
GSK
Consu
mer
Page
Asi
an P
ain
ts
HU
L
Brita
nnia
Colg
ate
Marico
Pidili
te
Baj
aj C
orp
.
ITC

India Consumer Products
24 KOTAK INSTITUTIONAL EQUITIES RESEARCH
Exhibit 18: EBITDA margin to expand across most companies led by UNSP, Nestle, JUBI and TGBL KIE consumer universe company-wise EBITDA margin change estimate for 1QFY19, yoy (bps)
Source: Company, Kotak Institutional Equities estimates
Exhibit 19: Favorable RM environment except oil commodities along with higher pricing contribution to help companies KIE consumer universe company-wise GM change estimate for 1QFY19, yoy (bps)
Source: Company, Kotak Institutional Equities estimates
449 442
405 370 339 339 317 286
255 211 194 155 148 146 135
61 33 3 -
(112)
(200)
(100)
-
100
200
300
400
500
UN
SP
Nes
tle
Jubila
nt
Foods
TGBL
Dab
ur
UB
GSK
Consu
mer
GC
PL
Jyoth
y La
bs
HU
L
Colg
ate
Page
Tita
n
Brita
nnia
Asi
an P
ain
ts
Baj
aj C
orp
.
ITC
Pidili
te
PCJ
Marico
282
271 245 239 236
162 160 133 113 86 82 25
9 7 5 -
(36)
(206) (210)(245)
(300)
(200)
(100)
-
100
200
300
400
GC
PL
Nes
tle
UN
SP
Colg
ate
TGBL
GSK
Consu
mer
Baj
aj C
orp
.
Dab
ur
HU
L
UB
Tita
n
Page
ITC
Asi
an P
ain
ts
Pidili
te
PCJ
Brita
nnia
Marico
Jyoth
y La
bs
Jubila
nt
Foods

Consumer Products India
KOTAK INSTITUTIONAL EQUITIES RESEARCH 25
Exhibit 20: Stable to deflationary trends in agri commodities; oil commodities seeing cost inflation Quarterly movement in inputs/commodities
Source: Bloomberg, Kotak Institutional Equities
Inflationary = +3%
Deflationary = -3%
No Commodity Unit 1QFY19 qoq yoy vs FY18 qoq yoy vs FY18 Companies impacted
Agri Commodities
1 Tea - India Avg. Rs/Kg 130 17 (0) 1 17 (0) 1 HUL, TGBL
2 Tea - World Avg. USD/MT 2,953 1 (6) (5) 5 (3) (1) HUL, TGBL
3 Tea - Mombassa/Kenya USD/Kg 3 (9) (10) (10) (6) (7) (7) HUL, TGBL
4 Coffee Arabica - Intl. US cents/Pound 141 (1) (6) (4) 3 (3) (1) HUL, Nestle, TGBL
5 Coffee Robusta - Intl. US cents/Pound 91 (2) (12) (8) 2 (9) (5) HUL, Nestle, TGBL
6 Sugar - domestic Rs/Quintal 3,136 (10) (20) (18) (10) (20) (18) HUL, Nestle, GSKCHL, ITC, Dabur, Britannia
7 Wheat Rs/Quintal 1,753 (2) 1 (1) (2) 1 (1) ITC, Nestle, GSKCHL, Britannia
8 Barley Rs/Quintal 1,480 1 (2) 0 1 (2) 0 GSKCHL
9 Maize (corn) USD/MT 178 9 13 15 13 17 19 Colgate, HUL, Dabur (Sorbitol)
10 Liquid Milk - domestic Rs/Ltr 34 2 (24) (9) 2 (24) (9) Nestle, GSKCHL, Jubilant Foodworks, Britannia
11 Milk Powder - domestic Rs/Kg 253 (0) (12) (5) (0) (12) (5) Nestle, GSKCHL, Britannia
12 Cocoa Bean USD/MT 1,955 (20) (11) (15) (17) (8) (11) Nestle
Oil Commodities
13 Crude Oil - Brent USD/Barrel 74 11 48 29 16 54 34 HUL, GCPL, Jyothy Labs, Asian Paints, Pidilite
14 Palm oil Rs/MT 64,852 9 25 19 14 30 24 HUL, GCPL, Jyothy Labs
15 PFAD USD/MT 525 (15) (16) (16) (11) (13) (12) HUL, GCPL, Jyothy Labs
16 Light liquid paraffin (LLP) Rs/Ltr 47 (2) 11 8 (2) 11 8 Marico, Dabur, Bajaj Corp
17 Copra Rs/Quintal 13,211 (4) 45 14 (4) 45 14 Marico, Dabur
18 Coconut oil Rs/Quintal 18,215 (2) 43 15 (2) 43 15 Marico, Dabur
19 Rice Bran oil Rs/10Kg 647 8 16 12 8 16 12 Marico
20 Kardi oil/ Safflower oil Rs/MT 1,316 (7) 27 4 (7) 27 4 Marico
21 Sunflower oil Rs/MT 71,107 4 21 12 4 21 12 Marico
22 Groundnut oil Rs/MT 83,144 (6) (17) (9) (6) (17) (9) Marico, Dabur
23 Linseed oil Rs/MT 79,372 (3) (1) 1 (3) (1) 1 Marico, Dabur, Bajaj Corp, Asian Paints
24 Castor oil Rs/MT 84,877 (4) (14) (11) (4) (14) (11) Marico, Dabur, Bajaj Corp, Asian Paints
25 Mentha oil Rs/Kg 1,549 (1) 50 13 (1) 50 13 Emami, Colgate, HUL, Dabur
Chemicals/Paints/Other Commodities
26 Caustic soda Rs/ 50Kg 2,376 (4) 1 3 (4) 1 3 HUL, GCPL, Jyothy Labs
27 Soda ash Rs/ 50Kg 1,234 (1) (3) (0) (1) (3) (0) HUL, GCPL, Jyothy Labs
28 LAB Rs/Kg 108 3 10 9 3 10 9 HUL, Jyothy Labs
39 HDPE - domestic Rs/Kg 121 7 19 17 7 19 17 All companies
30 PAN Rs/Kg 80 14 (11) 7 14 (11) 7 Asian Paints
31 PENTA Rs/Kg 115 — — — — — — Asian Paints
32 Tio2 Anatese Rs/Kg 182 (2) 8 2 (2) 8 2 Asian Paints
33 Tio2 Rutile Rs/Kg 215 2 — 2 2 — 2 Asian Paints
34 Tio2 Dupont Rs/Kg 258 6 (5) 3 6 (5) 3 Asian Paints
35 Turpentine oil Rs/Ltr 96 20 22 26 20 22 26 Asian Paints
36 Formaldehyde Rs/Kg 26 7 16 12 7 16 12 Asian Paints
37 Acrylic acid Rs/Kg 125 5 18 13 5 18 13 Asian Paints
38 Vinyl Acetate - China USD/MT 1,300 4 45 23 9 50 28
39 Styrene - domestic Rs/Kg 98 (6) (5) (6) (6) (5) (6) Asian Paints
40 Gold Rs/10gm 30,901 2 7 5 2 7 5 Titan, Jewellery companies
41 Diamond price index USD/Carrat 120 1 2 2 6 6 6 Titan, Jewellery companies
% chg - currency Adj.% chg - local currency

India Consumer Products
26 KOTAK INSTITUTIONAL EQUITIES RESEARCH
Exhibit 21: INR has appreciated against a lot of currencies; this is likely to drag reported growth for IBD for consumer companies Movement of rupee versus relevant international currencies for KIE consumer universe
Source: Bloomberg, Kotak Institutional Equities
Currency 30st Jun 2018 31st Mar 2017 qoq (%) 1QFY19 Avg 1QFY18 Avg yoy (%) Companies impacted
Euro 80.0 80.3 (0) 79.9 71.0 13 Dabur, TGBL
USD 68.5 65.1 5 67.0 64.5 4 All Companies
GBP 90.4 91.2 (1) 91.1 82.5 10 GCPL, TGBL
Canada 52.1 50.5 3 51.9 48.0 8 TGBL
Australia 50.7 50.0 1 50.7 48.4 5 TGBL
SL 0.4 0.4 3 0.4 0.4 0 GCPL, Marico, Dabur, Asian Paints
Bangladesh 0.8 0.8 4 0.8 0.8 (1) GCPL, Marico, Dabur, Asian Paints, Pidilite
Nepal 0.6 0.6 - 0.6 0.6 (0) Dabur, Asian Paints
Indonesia 0.5 0.5 2 0.5 0.5 (1) GCPL
Malaysia 17.0 16.9 1 16.9 14.9 14 Marico (Revenue), GCPL/HUL (Palm oil imports)
Vietnam 0.3 0.3 4 0.3 0.3 3 Marico
South Africa 5.0 5.5 (9) 5.3 4.9 9 GCPL, Marico, TGBL
Nigeria 0.2 0.2 5 0.2 0.2 (9) GCPL, Dabur
Kenya 0.7 0.6 5 0.7 0.6 7 GCPL, TGBL
Turkey 14.9 16.5 (10) 15.4 18.0 (15) Dabur
Egypt 3.8 3.7 4 3.8 3.6 6 Marico, Dabur, Pidilite
Middle East (AED) 18.6 17.7 5 18.2 17.6 4 GCPL, Marico, Dabur, Asian Paints, Pidilite
Argentina 2.4 3.2 (27) 2.9 4.1 (30) GCPL
Uruguay 2.2 2.3 (5) 2.2 2.3 (2) GCPL
Chile 1.0 1.1 (3) 1.1 1.0 11 GCPL
Poland 18.3 19.0 (4) 18.7 16.8 11 TGBL
Czech 3.1 3.2 (3) 3.1 2.7 17 TGBL
Russia 1.1 1.1 (5) 1.1 1.1 (4) TGBL
Period end Average rate

Consumer Products India
KOTAK INSTITUTIONAL EQUITIES RESEARCH 27
Exhibit 22: Results preview for KIE consumer universe for the quarter ending June 2018 (Rs mn)
Source: Company, Kotak Institutional Equities estimates
Company Jun-17 Mar-18 Jun-18E yoy (%) qoq (%) Comments
Asian Paints (consolidated)
Revenues 38,152 44,836 44,366 16.3 (1.0)
Gross margin (%) 42.8 43.2 42.9 6 bps -35 bps
EBITDA 6,654 8,399 8,334 25.3 (0.8)
EBITDA margin (%) 17.4 18.7 18.8 134 bps 5 bps
Net income 4,249 4,810 5,394 26.9 12.1
EPS (Rs/share) 4.4 5.0 5.6 26.9 12.1
Bajaj Corp.
Revenues 1,974 2,216 2,291 16.0 3.4
Gross margin (%) 65.2 67.3 66.8 159 bps -53 bps
EBITDA 606 718 718 18.3 (0.1)
EBITDA margin (%) 30.7 32.4 31.3 60 bps -109 bps
Net income 550 554 601 9.3 8.5
EPS (Rs/share) 3.7 3.8 4.1 9.3 8.5
Britannia Industries (consolidated)
Revenues 22,637 25,375 26,022 15.0 2.5
Gross margin (%) 38.7 38.5 38.4 -37 bps -12 bps
EBITDA 3,285 3,971 4,157 26.6 4.7
EBITDA margin (%) 14.5 15.6 16.0 146 bps 32 bps
Net income 2,160 2,636 2,698 24.9 2.4
EPS (Rs/share) 18.0 22.0 22.5 24.9 2.3
Colgate
Revenues 9,781 10,917 10,562 8.0 (3.2)
Gross margin (%) 63.4 65.7 65.8 239 bps 9 bps
EBITDA 2,218 3,075 2,601 17.2 (15.4)
EBITDA margin (%) 22.7 28.2 24.6 194 bps -355 bps
Net income 1,286 1,788 1,512 17.6 (15.4)
EPS (Rs/share) 4.7 6.6 5.6 17.6 (15.4)
Coffee Day Global (CDGL) - coffee business only
Revenues 4,404 4,712 5,031 14.2 6.8
Gross margin (%) 51.4 53.8 52.0 63 bps -177 bps
EBITDA 648 743 830 28.1 11.7
EBITDA margin (%) 14.7 15.8 16.5 178 bps 73 bps
Net income 103 82 195 89.1 136.6
EPS (Rs/share) 0.6 0.5 1.1 89.1 136.6
Dabur (consolidated)
Revenues 17,845 20,236 20,909 17.2 3.3
Gross margin (%) 48.8 50.5 50.1 133 bps -39 bps
EBITDA 3,034 4,758 4,264 40.6 (10.4)
EBITDA margin (%) 17.0 23.5 20.4 339 bps -313 bps
Net income 2,737 3,962 3,687 34.7 (6.9)
EPS (Rs/share) 1.6 2.2 2.1 34.7 (6.9)
GSK Consumer
Revenues 9,853 11,796 10,749 9.1 (8.9)
Gross margin (%) 65.2 68.3 66.9 162 bps -147 bps
EBITDA 1,664 2,500 2,155 29.6 (13.8)
EBITDA margin (%) 16.9 21.2 20.1 316 bps -115 bps
Net income 1,322 2,118 1,747 32.2 (17.5)
EPS (Rs/share) 31.4 50.4 41.5 32.2 (17.5)
GCPL (consolidated)
Revenues 21,773 25,289 24,786 13.8 (2.0)
Gross margin (%) 53.5 59.0 56.3 281 bps -270 bps
EBITDA 3,494 5,969 4,687 34.1 (21.5)
EBITDA margin (%) 16.0 23.6 18.9 286 bps -470 bps
Net income 2,327 4,234 3,216 38.2 (24.0)
EPS (Rs/share) 3.4 6.2 4.7 38.2 (24.0)
We estimate 14% volume growth in the domestic decoratives business aided partly by the
low base (2%) of the pre-GST June 2017 quarter.
EBITDA margin expansion reflects operating leverage; we estimate flattish gross margins
despite the recent RM inflation as we factor in the mitigating effects of price increases and
strategic sourcing.
We expect 7% yoy growth in ADHO volumes partly aided by market share gains; it
translates into flattish 2-year CAGR, in line with recent trends. We also expect some price-
led growth; the company has taken price hikes recently. Sharp jump in other operating
income (VAT refunds) yoy is a 300 bps tailwind to yoy revenue growth.
Weak rupee and inflation in LLP price would put some sequential pressure on GM. We
model 100 bps decline in EBITDA margin led by qoq drop in GM and higher A&P costs
pertaining to product refresh (NOMARKS cream).
Our topline growth estimate of 8% yoy bakes in 4% volume and a similar realization
growth. Our volume growth assumption translates into largely flattish 2-yr CAGR.
We expect 200 bps yoy expansion in EBITDA margin led by GST-related tailwinds and
operating efficiencies.
We model around 18% like-for-like growth in domestic revenues on the back of 15%
volume growth – base quarter was impacted by GST-led destocking.
GST tailwinds along with GM expansion should drive a 339 bps yoy expansion in EBITDA
margins.
We estimate 16.5% revenue growth for the standalone business and 11% for the
subsidiaries (aggregate); we bake in 15%, 13%, and 17% yoy growth for the HI, soaps,
and hair color segments respectively.
We expect the strong margin expansion trend to continue on the back of strategic low-cost
RM stock and sharp focus on costs.
We model 13% growth in biscuit volumes and 3.5% increase in realizations (price/mix).
Subsidiary performance is likely to remain a drag on consolidated performance.
We exepct EBITDA margin to expand 145 bps yoy largely aided by operating leverage (off a
low base). RM trends are favorable; however, we believe a bulk of the benefits have been
passed on to the consumer/trade and accordingly build in flattish GM.
Our revenue growth estimate bakes in (a) 25 net café additions qoq, (b) 6% growth in retail
ASPD, and (c) around 20% yoy growth in vending machine count.
We expect modest GM expansion on a yoy basis driven by improved product mix; higher
EBITDA margin expansion reflects expected operating leverage benefits.
Our revenue growth forecast bakes in 9% growth in domestic revenues, 20% in exports,
and 5% in auxiliary income. Domestic revenue growth is a combination of 8% volumes and
1% realization growth.
We estimate 316 bps yoy expansion in EBITDA margin on low base (base quarter volumes
and margins were impacted due to transition to GST).

India Consumer Products
28 KOTAK INSTITUTIONAL EQUITIES RESEARCH
Exhibit 22 (continued): Results preview for KIE consumer universe for the quarter ending June 2018 (Rs mn)
Source: Company, Kotak Institutional Equities estimates
Company Jun-17 Mar-18 Jun-18E yoy (%) qoq (%) Comments
HUL (standalone)
Revenues 85,290 90,970 97,848 14.7 7.6
Gross margin (%) 52.1 52.6 53.3 113 bps 67 bps
EBITDA 18,660 20,480 23,469 25.8 14.6
EBITDA margin (%) 21.9 22.5 24.0 210 bps 147 bps
Net income 12,920 14,090 16,397 26.9 16.4
EPS (Rs/share) 6.0 6.5 7.6 26.9 16.4
ITC (standalone)
Revenues 98,765 104,792 104,750 6.1 (0.0)
Gross margin (%) 61.2 61.8 61.2 8 bps -58 bps
EBITDA 36,682 40,365 39,248 7.0 (2.8)
EBITDA margin (%) 37.1 38.5 37.5 32 bps -106 bps
Net income 25,605 29,327 27,296 6.6 (6.9)
EPS (Rs/share) 2.1 2.4 2.2 6.6 (6.9)
Jubilant Foodworks
Revenues 6,787 7,797 8,141 19.9 4.4
Gross margin (%) 76.4 74.3 73.9 -246 bps -40 bps
EBITDA 795 1,277 1,283 61.4 0.5
EBITDA margin (%) 11.7 16.4 15.8 404 bps -62 bps
Net income 238 681 640 168.3 (6.0)
EPS (Rs/share) 3.6 10.3 9.7 168.2 (6.0)
Jyothy Laboratories (consolidated)
Revenues 3,672 5,161 4,571 24.5 (11.4)
Gross margin (%) 52.6 50.5 50.5 -210 bps -2 bps
EBITDA 416 877 634 52.5 (27.8)
EBITDA margin (%) 11.3 17.0 13.9 254 bps -314 bps
Net income 260 520 368 41.2 (29.2)
EPS (Rs/share) 1.4 2.9 2.0 41.2 (29.2)
Marico (consolidated)
Revenues 16,815 14,801 20,024 19.1 35.3
Gross margin (%) 47.8 46.6 45.7 -206 bps -94 bps
EBITDA 3,243 2,523 3,637 12.2 44.2
EBITDA margin (%) 19.3 17.0 18.2 -113 bps 111 bps
Net income 2,320 1,806 2,710 16.8 50.1
EPS (Rs/share) 1.8 1.4 2.1 16.8 50.1
Nestle
Revenues 23,865 27,368 26,944 12.9 (1.6)
Gross margin (%) 54.8 58.8 57.5 271 bps -130 bps
EBITDA 4,430 6,915 6,192 39.8 (10.5)
EBITDA margin (%) 18.6 25.3 23.0 441 bps -229 bps
Net income 2,634 4,240 3,772 43.2 (11.0)
EPS (Rs/share) 27.3 44.0 39.1 43.2 (11.0)
Page Industries
Revenues 6,962 6,084 8,277 18.9 36.0
Gross margin (%) 54.2 62.6 54.5 25 bps -814 bps
EBITDA 1,365 1,468 1,751 28.3 19.2
EBITDA margin (%) 19.6 24.1 21.2 154 bps -298 bps
Net income 853 942 1,114 30.6 18.2
EPS (Rs/share) 76.5 84.5 99.9 30.6 18.2
We expect another modest earnings print for ITC as yoy decline in cigarette volumes
continues. We bake in 2.5% yoy decline with further deterioration in mix.
We expect acceleration in growth in the FMCG and Hotels business, partly aided by low
base in both the segments.
We model 19% SSG (aided by favourable base and Everyday Value 99 (EDV 99) offer) and
20% topline growth; we have modeled 8 store additions (net) on yoy basis, Domino's +
DD combined.
We expect EBITDA margin to expand 404 bps yoy despite 245 bps contraction in GM, aided
by leverage, cost saving initiatives and GST-related tailwinds. We expect marginal drop in
margins on sequential basis on account of EDV 99 and higher A&SP during IPL.
We model 19.5% growth in the standalone business, led by 10% volume growth (off a low
base) in the domestic consumer business. We model double-digit volume growth for
Parachute and VAHO; expect Saffola performance to be weak despite favorable base.
Gross margins likely to remain under pressure on account of sustained copra inflation.
EBITDA margin decline likely to be lower on account of operating leverage.
We expect the sector bellwether to report another solid quarter with 20% comparable
topline growth driven by 14% UVG.
We estimate a modest 210 bps expansion in EBITDA margin yoy, driven equally by mix-led
GM expansion and operating leverage. We do expect A&P intensity to stay high.
We expect 30% comparable growth in underlying revenues driven by 20% volume growth.
This is largely on the back of a weak base which was impacted by GST-destocking.
Estimated EBITDA margin expansion of 254 bps yoy is largely on the back of cost
rationalization efforts along with operating leverage benefits.
We model 13% growth in net domestic revenues aided by robust growth in both Maggi and
non-Maggi portfolio.
We model 440 bps expansion in EBITDA margin driven by GST tailwinds and operating
leverage benefits.
We expect 19% revenue growth aided by 10% volume growth and 9% price/mix-led
growth.
We model broadly flat GM and 150 bps expansion in EBITDA margin aided by operating
leverage.

Consumer Products India
KOTAK INSTITUTIONAL EQUITIES RESEARCH 29
Exhibit 22 (continued): Results preview for KIE consumer universe for the quarter ending June 2018 (Rs mn)
Source: Company, Kotak Institutional Equities estimates
Company Jun-17 Mar-18 Jun-18E yoy (%) qoq (%) Comments
Pidilite Industries (consolidated)
Revenues 15,203 14,853 18,178 19.6 22.4
Gross margin (%) 51.5 52.1 51.5 4 bps -57 bps
EBITDA 3,210 2,739 3,843 19.7 40.3
EBITDA margin (%) 21.1 18.4 21.1 2 bps 269 bps
Net income 2,265 1,976 2,596 14.6 31.3
EPS (Rs/share) 4.4 3.9 5.1 15.7 32.6
S H Kelkar and Company (consolidated)
Revenues 2,350 2,851 2,675 13.8 (6.2)
Gross margin (%) 48.0 39.1 42.6 -543 bps 350 bps
EBITDA 427 271 346 (19.0) 27.8
EBITDA margin (%) 18.2 9.5 12.9 -525 bps 343 bps
Net income 268 213 204 (23.8) (4.4)
Recurring EPS (Rs/share) 1.9 1.7 1.4 (23.8) (15.4)
Tata Global Beverages (consolidated)
Revenues 17,044 16,884 18,067 6.0 7.0
Gross margin (%) 46.6 44.3 49.0 236 bps 466 bps
EBITDA 2,442 1,457 3,257 33.4 123.5
EBITDA margin (%) 14.3 8.6 18.0 370 bps 939 bps
Net income 1,193 611 1,978 65.7 223.7
EPS (Rs/share) 1.9 1.0 3.1 65.7 223.7
Titan Industries
Revenues 39,099 39,168 46,080 17.9 17.6
Gross margin (%) 23.8 29.0 24.7 81 bps -435 bps
EBITDA 3,888 4,554 5,264 35.4 15.6
EBITDA margin (%) 9.9 11.6 11.4 147 bps -21 bps
Net income 2,772 3,362 3,689 33.1 9.7
EPS (Rs/share) 3.1 3.8 4.2 33.1 9.7
United Breweries
Revenues 16,742 14,693 20,574 22.9 40.0
Gross margin (%) 52.7 52.8 53.5 86 bps 69 bps
EBITDA 3,184 2,082 4,609 44.8 121.3
EBITDA margin (%) 19.0 14.2 22.4 338 bps 822 bps
Net income 1,619 909 2,550 57.5 180.6
EPS (Rs/share) 6.1 3.4 9.6 57.5 180.6
United Spirits (standalone)
Revenues 17,818 21,737 20,338 14.1 (6.4)
Gross margin (%) 46.0 48.8 48.5 245 bps -32 bps
EBITDA 1,574 2,741 2,710 72.2 (1.1)
EBITDA margin (%) 8.8 12.6 13.3 449 bps 71 bps
Net income 637 1,867 1,421 123.0 (23.9)
EPS (Rs/share) 4.4 12.8 9.8 123.0 (23.9)
Varun Beverages (consolidated)
Revenues 16,334 10,948 20,792 27.3 89.9
Gross margin (%) 52.1 55.1 51.0 -107 bps -410 bps
EBITDA 4,805 1,727 6,030 25.5 249.2
EBITDA margin (%) 29.4 15.8 29.0 -42 bps 1322 bps
Net income 2,456 186 3,270 33.1 1,654.9
EPS (Rs/share) 13.5 1.0 17.9 33.1 1,654.9
We model 18%, 7.5% and 10% yoy growth in jewelry, watches and eyewear revenues,
respectively.
We expect jewelry EBIT margins to expand 150 bps yoy, driven by SSG-led leverage and
ongoing A&P rationalization.
We model 14% net revenue growth led by 9.3% growth in underlying volumes off a low
base. On a reported basis, we expect a lower volume growth of 8.2% yoy on account of
low-end franchising impact.
We model 245 bps yoy expansion in gross margin on account of RM softness. At an
EBITDA level, we expect the expansion to be higher at 449 bps yoy driven by leverage
benefits and cost rationalization measures.
We estimate 13.8% growth in consolidated revenues aided by low base and the general
uptick in aggregate FMCG demand. Service revenue decline will be a drag.
RM challenges will continue to put pressure on margins; we expect 540 bps yoy decline in
GM. That said, the supply situation is easing gradually and our GM forecast builds 350 bps
improvement on qoq basis.
We model 6% growth in consolidated revenues aided by about 8% growth in domestic tea
business partially negated by subdued growth in the international business.
We model 370 bps yoy expansion in EBITDA margin aided by robust margin expansion in
the domestic tea business and cost saving initiatives. Higher PAT growth aided by lower
ETR.
We expect 23% yoy growth in revenues aided by 16% growth in volume. Price hikes in key
states should also help top-line growth.
We model a sharp 338 bps yoy expansion in operating margins aided by operating leverage
and cost savings initiatives.
We expect 27% net revenue growth driven by 22% volume growth (low base and kicker
from consolidation of acquired territories; organic volume growth would be about 10% at
consolidated level ans 12% for India business) and 4% price-led growth.
We model 42 bps yoy drop in EBITDA margin largely due to lower profitability of acquired
territories and distribution rights for Tropicana and Quaker oat drinks.
We model 20% yoy growth in underlying volume as well as similar revenue growth for the
consumer bazaar (CBP) business partly aided by low base. Reported standalone revenue
growth would be lower around 19% on account of GST-related accounting changes
(comparable at about 21%).
We model flat EBITDA margin (yoy basis) for the quarter as impact of RM inflation and
rupee depreciation on standalone performance (VAM, a key RM, is up substantially) will be
offset by improving profitability of subsidiaries.

30 KOTAK INSTITUTIONAL EQUITIES RESEARCH
KO
TA
K IN
STIT
UTIO
NA
L EQ
UIT
IES R
ESEA
RC
H
30
Ind
ia D
aily
Su
mm
ary
- July
6, 2
01
8
June 2018: Results calendar
Source: NSE, Kotak Institutional Equities
Mon Tue Wed Thu Fri Sat Sun
2-Jul 3-Jul 4-Jul 5-Jul 6-Jul 7-Jul 8-Jul
9-Jul 10-Jul 11-Jul 12-Jul 13-Jul 14-Jul 15-Jul
Dish TV India IndusInd Bank Karnataka Bank Bajaj Corp.
Tata Consultancy Services Infosys
16-Jul 17-Jul 18-Jul 19-Jul 20-Jul 21-Jul 22-Jul
Hindustan Unilever Ashok Leyland Bandhan Bank Bajaj Finance Bajaj Auto HDFC Bank
ICICI Lombard Mahindra CIE Automotive Bajaj Finserv Bajaj Holdings & Investment
Mindtree Kotak Mahindra Bank Bata India
UltraTech Cement RBL Bank HDFC Standard Life
Kansai Nerolac Paints
Wipro
23-Jul 24-Jul 25-Jul 26-Jul 27-Jul 28-Jul 29-Jul
L&T Infotech GlaxoSmithkline Pharma Crompton Greaves Consumer Bharat Financial Inclusion Coromandel International
Hexaw are Technologies GRUH Finance Cholamandalam Investment MMFSL
Info Edge (India) Hero MotoCorp Colgate-Palmolive (India)
Dr Reddys Laboratories
WABCO India
30-Jul 31-Jul 1-Aug 2-Aug 3-Aug 4-Aug 5-Aug
Godrej Consumer Products Dabur India Aditya Birla Fashion Marico P I Industries
HDFC Torrent Pow er
IDFC
IDFC Bank
Shree Cement
6-Aug 7-Aug 8-Aug 9-Aug 10-Aug 11-Aug 12-Aug
PNB Housing Dr Lal Pathlabs
Timken India
13-Aug 14-Aug 15-Aug 16-Aug 17-Aug 18-Aug 19-Aug

KOTAK INSTITUTIONAL EQUITIES RESEARCH 31
Ind
ia D
aily
Su
mm
ary
- July
6, 2
01
8
31
K
OTA
K IN
STIT
UTIO
NA
L EQ
UIT
IES R
ESEA
RC
H
Kotak Institutional Equities: Valuation summary of KIE Universe stocks
Source: Company, Bloomberg, Kotak Institutional Equities estimates
Target O/S ADVT
Price (Rs) price Upside Mkt cap. shares EPS (Rs) EPS growth (%) P/E (X) EV/EBITDA (X) 3mo
Company Rating 05-Jul-18 (Rs) (%) (Rs bn) (US$ bn) (mn) 2018 2019E 2020E 2018 2019E 2020E 2018 2019E 2020E 2018 2019E 2020E 2018 2019E 2020E 2018 2019E 2020E 2018 2019E 2020E (US$ mn)
Automobiles
Amara Raja Batteries REDUCE 773 780 0.8 132 1.9 171 28 33 39 (1.6) 21.2 15.5 28.0 23.1 20.0 14.9 12.3 10.5 4.5 3.9 3.3 17.0 18.0 18.0 0.5 0.6 0.7 5.9
Apollo Tyres BUY 252 340 34.9 144 2.1 541 13 20 25 (38.0) 48.6 24.7 18.8 12.7 10.2 10.4 7.4 6.2 1.4 1.3 1.2 8.5 11.1 12.5 1.3 1.2 1.2 10.8
Ashok Leyland BUY 125 160 28.0 367 5.3 2,926 5.4 6.2 8.9 8.0 15.3 43.2 23.2 20.2 14.1 13.4 10.3 7.5 5.1 4.4 3.7 23.7 23.4 28.4 1.9 1.5 2.1 35.4
Bajaj Auto SELL 2,967 2,800 (5.6) 859 12.5 289 140 160 176 6.0 14.0 10.0 21.2 18.6 16.9 14.7 13.2 11.6 4.5 4.0 3.6 22.9 22.8 22.3 2.0 2.2 2.4 18.9
Balkrishna Industries BUY 1,149 1,260 9.6 222 3.2 193 37 51 63 4.8 35.4 24.6 30.7 22.7 18.2 16.3 12.4 9.9 5.4 4.5 3.7 19.0 21.6 22.1 0.3 0.4 0.4 8.8
Bharat Forge SELL 615 650 5.7 286 4.2 466 16 22 27 10.1 38.0 19.4 38.0 27.5 23.1 18.3 15.5 13.1 6.2 5.3 4.5 17.2 20.7 21.1 0.7 0.8 0.9 10.6
CEAT ADD 1,269 1,600 26.0 51 0.7 40 65 101 113 (29.5) 55.4 12.6 19.6 12.6 11.2 9.6 8.1 6.9 2.0 1.7 1.5 10.4 14.6 14.4 0.9 0.8 0.8 14.0
Eicher Motors SELL 27,888 26,000 (6.8) 760 11.1 27 792 995 1,200 29.3 25.5 20.6 35.2 28.0 23.2 25.4 20.4 16.6 14.1 10.2 7.6 46.4 42.3 37.5 0.1 0.1 0.1 17.2
Escorts BUY 865 1,170 35.2 74 1.5 89 39 56 69 71.3 43.6 23.6 22.3 15.5 12.6 12.7 9.4 7.4 3.0 2.6 2.2 13.5 16.8 17.7 0.5 1.0 1.2 17.3
Exide Industries SELL 261 225 (13.7) 222 3.2 850 8 10 11 0.6 23.7 11.1 31.8 25.7 23.1 17.8 14.9 13.2 4.1 3.7 3.4 13.5 15.2 15.3 0.9 1.2 1.3 8.1
Hero Motocorp SELL 3,506 3,500 (0.2) 700 10.2 200 185 206 227 9.5 11.1 10.1 18.9 17.0 15.5 11.8 10.6 9.4 5.9 5.2 4.6 33.8 32.6 31.6 2.4 2.9 3.2 17.3
Mahindra CIE Automotive ADD 261 275 5.2 99 1.4 378 10 13 15 107.0 35.8 12.9 27.2 20.1 17.8 13.3 10.1 8.8 2.7 2.4 2.1 10.4 12.5 12.4 — — — 2.9
Mahindra & Mahindra BUY 912 1,015 11.3 1,134 16.5 1,138 38 44 50 22.0 15.6 14.8 24.0 20.8 18.1 15.8 13.5 11.6 3.4 3.0 2.7 15.1 15.4 15.7 0.8 1.0 1.1 32.2
Maruti Suzuki ADD 9,347 9,700 3.8 2,824 41.1 302 256 330 395 5.1 29.2 19.6 36.6 28.3 23.7 20.5 16.0 12.9 6.8 5.8 4.9 19.8 22.0 22.6 0.7 0.9 1.1 61.1
Motherson Sumi Systems SELL 294 265 (9.8) 619 9.0 2,105 8 11 14 6.1 37.7 21.7 35.9 26.1 21.5 13.6 10.4 8.7 6.3 5.4 4.5 19.0 22.1 22.9 0.8 0.9 1.1 13.3
MRF REDUCE 75,477 76,000 0.7 320 4.7 4 2,669 3,896 4,447 (23.9) 46.0 14.1 28.3 19.4 17.0 12.8 9.5 8.1 3.3 2.8 2.4 12.3 15.7 15.4 0.1 0.1 0.1 7.6
Schaeffler India BUY 5,405 6,000 11.0 90 1.3 17 143 171 207 22.0 19.4 21.1 37.7 31.6 26.1 22.2 19.1 15.5 5.3 4.7 4.1 15.0 15.8 16.9 0.3 0.6 0.8 0.7
SKF REDUCE 1,712 1,700 (0.7) 88 1.3 51 58 70 81 24.6 20.8 16.4 29.7 24.6 21.1 18.4 15.8 13.2 4.8 4.2 3.6 16.1 17.0 17.2 0.7 0.8 1.0 0.4
Tata Motors BUY 262 445 70.1 888 12.1 3,396 20 24 38 (28.0) 18.0 63.0 13.1 11.1 6.8 3.9 3.5 2.9 0.9 0.9 0.8 8.8 8.0 11.9 — — — 62.8
Timken SELL 747 660 (11.7) 51 0.7 68 14 19 25 (5.3) 42.3 27.5 55.2 38.8 30.4 30.8 21.5 17.1 7.2 6.2 5.2 13.9 17.1 18.5 0.1 0.1 0.1 0.4
TVS Motor SELL 571 410 (28.1) 271 3.9 475 14 17 21 18.7 23.0 22.0 40.9 33.2 27.2 24.9 19.5 16.2 9.4 8.0 6.7 25.1 26.0 26.7 0.6 0.9 1.1 11.6
WABCO India SELL 6,956 6,350 (8.7) 132 1.9 19 144 169 223 27.8 17.4 32.2 48.4 41.2 31.2 31.4 26.8 20.3 8.6 7.2 6.0 19.5 19.1 21.0 0.1 0.1 0.2 0.5
Automobiles Neutral 10,333 150 (0.9) 23.2 25.5 26.5 21.5 17.1 11.7 9.8 8.0 3.8 3.3 2.9 14.2 15.5 16.9 0.8 1.0 1.1 357.5
Banks
Axis Bank ADD 511 600 17.4 1,312 19.1 2,567 1 20 39 (92.6) 1,735.5 100.1 475.7 25.9 13.0 — — — 2.5 2.2 1.9 0.5 7.7 13.8 1.0 0.6 1.2 64.7
Bank of Baroda NR 113 — — 300 4.4 2,652 (9) 20 23 (253.2) 323.2 10.5 (12.3) 5.5 5.0 — — — 1.3 1.0 0.7 (5.8) 12.6 12.3 — — — 29.6
Bank of India ADD 85 120 40.5 149 2.2 1,744 (35) (6) 16 (134.7) 82.2 366.7 (2.5) (13.9) 5.2 — — — 1.3 1.6 1.0 (21.3) (3.6) 9.5 — (1.4) 3.8 12.4
Canara Bank ADD 244 300 23.1 179 2.6 733 (58) (2) 60 (406.6) 97.3 4,031.4 (4.2) (158.6) 4.0 — — — 1.5 1.5 0.9 (11.9) (0.3) 11.8 — — — 30.7
City Union Bank ADD 187 190 1.8 124 1.8 665 9 10 12 6.4 16.2 13.0 21.0 18.0 16.0 — — — 3.2 2.8 2.4 15.3 15.5 15.5 0.2 1.0 1.1 1.9
DCB Bank ADD 169 210 24.4 52 0.8 308 8 11 13 13.8 32.2 20.5 21.2 16.0 13.3 — — — 2.1 1.9 1.7 10.9 12.0 12.9 — 0.6 0.7 5.8
Equitas Holdings BUY 136 190 40.0 46 0.7 340 0.9 4.4 8.3 (80.4) 374.7 88.2 146.7 30.9 16.4 — — — 2.1 2.0 1.8 1.4 6.4 11.0 — — — 4.5
Federal Bank BUY 82 130 58.2 162 2.4 1,972 4.5 5.8 7.8 (7.5) 29.5 34.9 18.4 14.2 10.5 — — — 1.4 1.3 1.2 8.0 9.0 11.2 1.2 1.4 1.9 17.7
HDFC Bank REDUCE 2,124 1,900 (10.5) 5,531 80.4 2,595 67 77 93 18.7 14.7 20.0 31.5 27.5 22.9 — — — 5.3 4.0 3.5 17.9 16.6 16.2 0.6 0.7 0.8 74.6
ICICI Bank BUY 272 400 47.3 1,746 25.4 6,429 11 15 25 (31.1) 46.5 64.1 25.8 17.6 10.7 — — — 2.1 1.8 1.6 6.6 9.1 13.7 0.6 1.1 1.9 91.8
IDFC Bank NR 38 — — 131 1.9 3,404 2.5 1.6 3.3 (16.0) (38.5) 109.8 15.2 24.7 11.8 — — — 0.9 0.8 0.8 5.7 3.4 6.9 1.3 0.8 1.7 9.0
IndusInd Bank REDUCE 1,964 1,800 (8.4) 1,180 17.2 600 60 73 88 25.3 20.7 21.6 32.7 27.1 22.3 — — — 5.1 4.2 3.6 17.1 18.1 17.1 — 0.4 0.5 29.2
J&K Bank BUY 50 105 108.7 28 0.4 557 4 8 11 111.6 116.7 44.4 13.8 6.4 4.4 — — — 0.6 0.5 0.5 3.4 6.9 9.4 — 3.1 4.5 0.4
Karur Vysya Bank ADD 99 120 21.2 72 1.1 727 5 4 14 (52.2) (22.8) 274.8 20.8 27.0 7.2 — — — 1.4 1.4 1.2 6.1 4.2 14.7 0.6 0.9 3.5 1.8
Punjab National Bank ADD 76 90 19.1 209 3.0 2,761 (44) (39) 9 (814.7) 13.4 124.1 (1.7) (2.0) 8.1 — — — 4.5 (3.4) (12.9) (32.4) (31.3) 8.2 — (11.1) 2.7 32.1
RBL Bank SELL 564 450 (20.3) 238 3.5 420 15 20 25 27.3 32.9 21.8 37.3 28.1 23.0 — — — 3.6 3.3 3.0 11.5 12.0 13.2 0.4 0.5 0.7 9.8
State Bank of India BUY 256 370 44.3 2,289 33.3 8,925 (7) 18 37 (155.8) NM 106.1 NM 14.2 6.9 — — — 2.0 1.6 1.2 (3.2) 7.1 13.2 - 0.1 0.2 77.9
Ujjivan Financial Services REDUCE 375 420 11.9 45 0.7 121 1 22 29 (96.5) 3,564.0 30.0 622.1 17.0 13.1 — — — 2.7 2.3 2.0 0.4 14.2 16.1 0.0 0.6 0.8 7.5
Union Bank ADD 79 130 63.6 93 1.3 1,169 (45) 1 24 (655.5) 101.4 3,896.2 (1.8) 129.8 3.2 — — — 1.3 1.2 0.7 (23.6) 0.3 11.8 — 0.1 4.6 10.3
YES Bank SELL 349 325 (6.8) 804 11.7 2,303 18 19 21 25.7 4.6 11.0 19.0 18.2 16.4 — — — 3.2 2.9 2.5 17.7 16.0 15.7 0.7 0.9 1.0 61.9
Banks Attractive 14,689 214 (101.2) 9,987.5 103.0 (2,418.0) 24.5 12.0 1.9 1.7 1.5 (0.1) 6.9 12.6 0.5 0.4 1.0 573.8
Dividend yield (%)P/B (X) RoE (%)

32 KOTAK INSTITUTIONAL EQUITIES RESEARCH
K
OTA
K IN
STIT
UTIO
NA
L EQ
UIT
IES R
ESEA
RC
H
32
Ind
ia D
aily
Su
mm
ary
- July
6, 2
01
8
Kotak Institutional Equities: Valuation summary of KIE Universe stocks
Source: Company, Bloomberg, Kotak Institutional Equities estimates
Target O/S ADVT
Price (Rs) price Upside Mkt cap. shares EPS (Rs) EPS growth (%) P/E (X) EV/EBITDA (X) 3mo
Company Rating 05-Jul-18 (Rs) (%) (Rs bn) (US$ bn) (mn) 2018 2019E 2020E 2018 2019E 2020E 2018 2019E 2020E 2018 2019E 2020E 2018 2019E 2020E 2018 2019E 2020E 2018 2019E 2020E (US$ mn)
NBFCs
Bajaj Finance REDUCE 2,330 1,850 (20.6) 1,347 19.6 575 46 63 82 38.5 34.9 30.0 50.1 37.2 28.6 — — — 8.1 6.8 5.6 20.5 19.9 21.5 0.2 0.3 0.3 42.0
Bajaj Finserv ADD 6,069 5,900 (2.8) 966 14.0 159 174 206 266 13.5 18.7 28.8 34.9 29.4 22.8 — — — 4.8 3.9 3.3 15.3 14.5 15.6 0.2 0.2 0.2 14.0
Bharat Financial Inclusion NA 1,185 — — 165 2.4 139 33 43 54 55.5 31.1 27.2 36.3 27.7 21.8 — — — 5.5 4.5 3.6 16.7 17.9 18.5 — — — 10.6
Cholamandalam REDUCE 1,492 1,510 1.2 233 3.4 156 62 76 92 35.5 22.3 20.8 24.0 19.6 16.2 — — — 4.8 4.0 3.3 20.6 21.0 21.2 0.4 0.6 0.7 7.1
HDFC ADD 1,931 2,075 7.5 3,251 47.3 1,676 75 58 67 52.1 (23.1) 15.2 25.6 33.3 28.9 — — — 5.1 4.4 4.0 23.9 14.3 14.5 1.0 1.1 1.2 70.5
HDFC Standard Life Insurance SELL 462 405 (12.3) 929 13.5 2,007 6 6 7 24.4 14.8 10.9 83.5 72.7 65.6 — — — 21.6 19.3 17.2 27.3 28.0 27.7 0.3 0.3 0.4 14.1
ICICI Lombard SELL 703 600 (14.7) 319 4.6 454 19 26 30 22.0 36.4 17.0 37.1 27.2 23.2 — — — 7.0 5.9 5.0 20.8 23.7 23.5 0.6 0.9 1.1 1.9
ICICI Prudential Life BUY 367 500 36.2 527 7.7 1,436 11 12 13 (3.7) 3.8 7.6 32.5 31.3 29.1 — — — 8.0 6.7 5.6 25.0 23.2 20.9 1.5 0.5 0.6 12.0
IIFL Holdings SELL 662 625 (5.6) 211 3.1 319 29 34 41 32.4 17.3 21.4 23.2 19.8 16.3 — — — 4.2 3.6 3.1 19.0 19.3 20.0 0.9 1.1 1.3 1.6
L&T Finance Holdings REDUCE 146 185 26.3 292 4.2 1,996 7 10 12 23.7 34.6 24.1 20.0 14.8 11.9 — — — 2.3 2.1 1.8 14.2 14.7 16.1 1.2 1.4 1.4 10.1
LIC Housing Finance ADD 476 605 27.2 240 3.5 505 44 50 58 3.2 13.8 17.5 10.9 9.6 8.2 — — — 1.8 1.5 1.3 14.5 14.3 14.4 1.4 1.6 1.9 12.4
Magma Fincorp BUY 163 200 22.4 44 0.6 237 10 12 15 1,014.5 24.6 25.8 16.8 13.5 10.7 — — — 1.7 1.6 1.4 10.2 12.9 14.1 0.5 1.1 1.4 3.1
Mahindra & Mahindra Financial REDUCE 459 475 3.5 284 4.1 614 15 22 26 105.0 53.5 16.6 31.6 20.6 17.7 — — — 3.3 2.9 2.6 11.3 14.0 14.8 0.9 1.3 1.6 11.7
Max Financial Services BUY 420 650 54.9 113 1.6 268 5 6 6 (20.4) 36.9 1.8 91.5 66.9 65.7 — — — — — — 6.5 8.3 8.0 — 0.5 0.5 4.8
Muthoot Finance ADD 409 480 17.3 164 2.4 400 43 38 40 45.6 (10.8) 4.0 9.5 10.7 10.3 — — — 2.1 1.8 1.6 24.1 18.4 16.9 2.4 2.2 2.2 4.5
PNB Housing Finance REDUCE 1,133 1,375 21.4 190 2.8 167 50 61 77 57.8 23.0 25.3 22.8 18.5 14.8 — — — 3.0 2.7 2.4 14.0 15.2 16.8 0.8 0.3 0.3 9.9
SBI Life Insurance ADD 665 815 22.5 665 9.7 1,000 12 15 18 20.8 26.0 22.9 57.7 45.8 37.2 — — — 10.3 8.7 7.3 19.4 20.6 21.3 0.3 0.3 0.4 5.6
Shriram City Union Finance ADD 1,962 2,325 18.5 129 1.9 66 101 140 174 19.6 39.4 23.8 19.5 14.0 11.3 — — — 2.5 2.2 1.9 12.5 15.5 16.7 0.9 0.9 1.1 1.0
Shriram Transport ADD 1,152 1,400 21.5 261 3.8 227 69 105 125 24.7 52.1 18.7 16.7 11.0 9.2 — — — 2.2 1.9 1.7 13.1 17.6 18.0 1.0 1.3 1.5 24.0
NBFCs Neutral 10,331 150 38.0 7.0 19.3 30.0 28.1 23.5 5.1 4.3 3.8 16.8 15.4 16.1 0.7 0.7 0.8 573.8
Cement
ACC SELL 1,390 1,205 (13.3) 261 3.8 188 49 54 66 32.7 10.6 23.0 28.5 25.8 21.0 15.1 14.0 11.3 2.8 2.6 2.4 10.1 10.5 11.9 1.2 1.2 1.2 10.5
Ambuja Cements REDUCE 207 215 3.6 412 6.0 1,986 8 7 9 29.7 (1.3) 27.0 27.6 28.0 22.0 9.1 9.0 7.3 2.0 1.9 1.8 7.4 7.0 8.6 1.7 1.7 1.7 9.0
Dalmia Bharat ADD 2,344 2,900 23.7 209 3.0 89 60 98 128 55.4 62.6 30.3 38.8 23.9 18.3 12.2 9.3 7.5 3.4 3.0 2.6 9.7 13.4 15.2 0.1 0.1 0.1 5.2
Grasim Industries BUY 969 1,275 31.6 637 9.3 657 47 52 69 (30.1) 9.1 32.8 20.4 18.7 14.1 11.8 7.3 6.7 1.1 1.1 1.0 7.0 5.8 7.2 0.6 0.6 0.6 13.7
India Cements REDUCE 109 135 23.6 34 0.5 308 3 5 9 (42.5) 56.2 84.4 33.4 21.4 11.6 9.4 8.1 6.4 0.6 0.6 0.6 2.0 3.0 5.3 0.9 0.9 0.9 6.6
J K Cement REDUCE 856 1,000 16.8 60 0.9 70 43 51 83 25.1 17.0 65.0 19.8 16.9 10.3 10.3 10.9 8.8 3.0 2.6 2.2 16.2 16.7 23.2 0.9 0.9 0.9 0.6
JK Lakshmi Cement ADD 317 425 33.9 37 0.5 118 4 18 33 (35.7) 311.2 79.6 71.0 17.3 9.6 13.3 8.0 5.7 2.6 2.3 1.9 3.7 14.1 21.5 0.6 0.6 0.6 0.5
Orient Cement ADD 116 165 42.8 24 0.3 205 2 8 12 237.8 250.7 64.8 53.5 15.3 9.3 11.8 7.5 5.5 2.3 2.1 1.8 4.4 14.3 20.6 0.6 1.3 1.7 0.2
Shree Cement SELL 16,434 12,700 (22.7) 573 8.3 35 397 486 662 3.4 22.3 36.2 41.4 33.8 24.8 22.2 16.8 13.1 6.4 5.5 4.6 16.7 17.6 20.2 0.3 0.3 0.3 4.6
UltraTech Cement SELL 3,936 3,000 (23.8) 1,081 15.7 275 89 119 153 (7.0) 33.1 28.9 44.0 33.1 25.7 20.4 16.0 13.4 4.2 3.8 3.3 9.9 12.0 13.7 0.3 0.3 0.3 17.1
Cement Cautious 3,327 48 6.1 21.2 33.4 32.0 26.4 19.8 14.3 10.4 8.8 2.4 2.2 2.0 7.5 8.5 10.3 0.6 0.6 0.6 67.8
Dividend yield (%)P/B (X) RoE (%)

KOTAK INSTITUTIONAL EQUITIES RESEARCH 33
In
dia
Da
ily S
um
ma
ry - Ju
ly 6
, 201
8
33
K
OTA
K IN
STIT
UTIO
NA
L EQ
UIT
IES R
ESEA
RC
H
Kotak Institutional Equities: Valuation summary of KIE Universe stocks
Source: Company, Bloomberg, Kotak Institutional Equities estimates
Target O/S ADVT
Price (Rs) price Upside Mkt cap. shares EPS (Rs) EPS growth (%) P/E (X) EV/EBITDA (X) 3mo
Company Rating 05-Jul-18 (Rs) (%) (Rs bn) (US$ bn) (mn) 2018 2019E 2020E 2018 2019E 2020E 2018 2019E 2020E 2018 2019E 2020E 2018 2019E 2020E 2018 2019E 2020E 2018 2019E 2020E (US$ mn)
Consumer products
Asian Paints REDUCE 1,321 1,100 (16.8) 1,267 18.4 959 21 24 28 2.9 18.7 14.7 64.4 54.2 47.3 39.3 33.8 29.4 15.1 13.3 11.9 24.6 26.1 26.6 0.7 0.8 1.0 16.6
Bajaj Corp. ADD 414 520 25.7 61 0.9 148 14 17 19 (10.5) 18.7 10.5 29.3 24.6 22.3 23.1 19.8 16.9 12.4 12.0 11.4 42.3 49.4 52.4 2.9 3.1 3.4 0.4
Britannia Industries ADD 6,307 6,000 (4.9) 757 11.0 120 84 104 126 13.5 24.4 21.5 75.4 60.6 49.9 49.9 39.1 32.2 22.2 17.6 14.3 32.9 32.4 31.6 0.4 0.6 0.7 9.1
Coffee Day Enterprises REDUCE 259 340 31.5 55 0.8 211 3 8 13 49.1 149.7 59.4 77.3 31.0 19.4 13.2 — — 2.3 2.1 1.9 3.1 7.2 10.4 — — — 1.2
Colgate-Palmolive (India) ADD 1,149 1,300 13.1 313 4.5 272 24 27 32 15.2 14.6 16.9 48.3 42.2 36.1 27.7 24.3 20.8 20.5 20.7 17.5 46.2 48.8 52.6 2.1 1.4 1.7 7.7
Dabur India REDUCE 377 350 (7.1) 666 9.7 1,762 8 9 10 7.2 16.1 11.7 48.5 41.8 37.4 41.0 35.5 31.1 11.6 11.7 10.2 25.9 27.9 29.1 2.0 1.0 1.2 8.3
GlaxoSmithKline Consumer ADD 6,407 6,750 5.4 269 3.9 42 166 189 211 6.6 13.3 11.9 38.5 34.0 30.3 26.4 22.7 19.5 7.7 7.0 6.4 21.2 21.7 22.2 1.2 1.4 1.6 2.2
Godrej Consumer Products REDUCE 1,248 1,020 (18.2) 850 12.4 681 21 25 28 11.5 17.6 13.3 58.4 49.7 43.8 41.4 35.2 30.7 13.6 11.8 10.2 25.2 25.4 24.9 0.6 0.7 0.8 8.8
Hindustan Unilever REDUCE 1,688 1,430 (15.3) 3,654 53.1 2,160 25 28 32 25.0 14.9 13.0 68.8 59.9 53.0 49.4 41.7 36.6 51.5 46.2 40.4 78.1 81.4 81.3 1.2 1.2 1.4 27.5
ITC ADD 273 315 15.6 3,325 48.4 12,275 9 10 11 7.8 7.8 12.4 30.6 28.3 25.2 19.9 18.2 16.1 6.5 6.1 5.8 19.4 20.3 22.2 1.9 2.1 2.5 40.3
Jubilant Foodworks BUY 1,417 1,500 5.9 187 2.7 132 15 24 33 191.7 64.1 39.2 97.3 59.3 42.6 41.6 28.8 21.6 19.3 14.1 10.8 21.7 27.5 28.8 0.1 0.1 0.2 38.2
Jyothy Laboratories ADD 238 220 (7.4) 86 1.3 364 4 6 6 35.1 25.4 17.2 53.9 43.0 36.7 33.0 27.3 23.6 7.5 6.5 5.7 14.3 16.3 16.6 0.2 0.4 0.6 1.5
Manpasand Beverages SELL 163 132— — 19 0.3 114 9 11 13 37.6 21.3 26.5 18.7 15.4 12.2 9.7 6.5 5.2 1.5 1.4 1.2 8.3 9.3 10.7 0.3 0.3 0.3 3.3
Marico ADD 346 345 (0.2) 446 6.5 1,291 6 7 8 7.4 16.7 13.7 55.2 47.3 41.5 38.9 32.7 28.5 17.5 16.2 15.0 33.2 35.7 37.5 1.2 1.4 1.6 8.1
Nestle India ADD 9,957 9,500 (4.6) 960 14.0 96 127 168 191 21.1 32.5 13.4 78.4 59.2 52.2 43.1 33.5 29.5 28.1 25.8 23.7 36.6 45.5 47.3 0.9 1.1 1.3 8.9
Page Industries SELL 28,007 18,200 (35.0) 312 4.5 11 311 392 482 32.5 26.1 22.9 90.0 71.4 58.1 57.3 45.3 37.3 36.9 28.8 23.0 45.9 45.3 44.0 0.5 0.6 0.7 7.6
Pidilite Industries REDUCE 1,063 1,050 (1.2) 540 7.8 508 18 22 26 7.5 20.4 20.4 58.9 48.9 40.6 39.4 32.7 27.0 15.1 12.7 10.6 26.0 28.2 28.5 0.6 0.7 0.8 14.0
S H Kelkar and Company BUY 220 315 42.9 32 0.5 145 7 8 11 2.1 11.8 28.4 29.8 26.6 20.7 20.7 17.3 13.5 3.7 3.4 3.0 12.8 13.3 15.3 0.8 0.8 0.9 0.3
Tata Global Beverages REDUCE 271 285 5.1 171 2.5 631 7 10 11 20.7 29.4 19.1 36.9 28.5 24.0 19.5 16.4 14.1 2.4 2.3 2.2 7.0 8.3 9.4 0.9 1.1 1.3 13.8
Titan Company SELL 838 800 (4.5) 744 10.8 888 13 16 20 43.3 26.7 20.6 65.5 51.7 42.9 44.9 34.2 27.4 14.6 12.3 10.3 24.3 25.8 26.2 0.4 0.5 0.7 36.3
United Breweries SELL 1,144 1,000 (12.6) 302 4.4 264 15 19 24 71.6 29.7 23.4 76.6 59.1 47.9 33.8 28.1 24.3 11.3 9.7 8.2 15.7 17.6 18.6 0.2 0.3 0.3 9.6
United Spirits SELL 629 560 (11.0) 457 6.6 727 8 11 14 39.1 40.5 27.4 82.7 58.9 46.2 47.5 35.0 28.9 18.3 12.4 9.2 24.9 25.1 22.8 — — 0.3 19.2
Varun Beverages ADD 753 750 (0.4) 137 2.0 183 12 17 22 377.8 45.4 29.8 65.4 44.9 34.6 19.9 16.0 13.7 7.8 6.7 5.7 12.1 16.0 17.7 — — 0.1 1.2
Consumer products Cautious 15,612 227 15.0 16.4 15.2 51.6 44.3 38.4 33.6 28.5 24.6 12.6 11.4 10.2 24.5 25.8 26.6 1.1 1.2 1.4 284.2
Energy
BPCL REDUCE 372 390 5.0 806 11.7 1,967 40 39 41 (1.5) (3.6) 5.3 9.2 9.6 9.1 7.5 7.0 6.5 2.1 1.9 1.7 24.8 21.1 20.0 5.7 4.2 4.4 38.2
Castrol India ADD 161 215 33.9 159 2.3 989 7 8 9 3.3 13.6 10.9 23.4 20.6 18.5 14.6 12.9 11.6 15.6 14.7 14.4 67.9 73.6 78.6 3.0 3.7 4.4 4.1
GAIL (India) BUY 346 410 18.5 780 11.3 2,255 20 25 27 21.8 23.2 8.3 16.9 13.8 12.7 10.6 8.8 8.2 1.9 1.8 1.6 11.7 13.5 13.5 2.1 2.5 2.6 20.4
GSPL SELL 177 170 (4.0) 100 1.5 564 12 11 11 34.5 (7.0) (4.6) 14.9 16.1 16.8 7.5 6.3 6.2 2.0 1.8 1.6 14.0 11.7 10.2 1.0 0.9 0.9 1.5
HPCL REDUCE 256 320 24.8 391 5.7 1,524 42 32 33 (3.2) (23.4) 3.4 6.1 8.0 7.8 5.5 7.2 7.4 1.6 1.5 1.3 28.7 19.3 18.2 6.6 5.1 5.2 31.8
Indraprastha Gas SELL 255 240 (5.8) 178 2.6 700 10 12 13 19.0 16.5 12.0 24.7 21.2 18.9 15.5 13.4 11.8 5.1 4.4 3.8 22.4 22.2 21.5 0.8 1.0 1.2 10.3
IOCL REDUCE 155 160 3.2 1,505 21.9 9,479 21 17 18 (24.8) (17.9) 7.4 7.6 9.2 8.6 4.4 5.1 4.7 1.3 1.2 1.2 18.5 14.0 14.0 7.4 4.3 4.7 27.9
Mahanagar Gas ADD 812 850 4.7 80 1.2 99 48 52 54 21.5 6.5 5.3 16.8 15.8 15.0 10.2 9.1 8.5 3.8 3.4 3.0 24.3 22.8 21.4 2.3 2.5 2.7 8.5
ONGC ADD 156 200 27.9 2,007 29.2 12,833 17 21 21 3.1 19.6 (1.3) 9.0 7.5 7.6 4.9 3.8 3.7 0.9 0.8 0.8 9.9 11.5 10.7 4.2 4.5 4.5 17.5
Oil India SELL 206 220 7.0 233 3.4 1,135 25 24 24 22.6 (1.3) (0.7) 8.3 8.4 8.5 6.5 5.9 5.9 0.8 0.8 0.8 9.8 9.7 9.2 5.0 5.3 5.3 3.6
Petronet LNG BUY 219 280 27.7 329 4.8 1,500 14 16 18 22.1 17.3 13.2 15.8 13.5 11.9 10.5 9.0 7.6 3.4 3.0 2.6 23.3 23.4 23.3 2.1 2.6 3.4 11.5
Reliance Industries REDUCE 965 930 (3.6) 5,708 83.0 5,922 59 68 77 16.9 14.9 13.9 16.3 14.2 12.5 12.6 10.1 8.5 1.9 1.7 1.5 11.6 11.9 12.1 0.6 0.7 0.7 101.3
Energy Attractive 12,277 179 1.0 5.8 7.3 11.9 11.3 10.5 7.9 7.0 6.4 1.6 1.4 1.3 13.3 12.8 12.6 2.8 2.4 2.5 276.7
Dividend yield (%)P/B (X) RoE (%)

34 KOTAK INSTITUTIONAL EQUITIES RESEARCH
K
OTA
K IN
STIT
UTIO
NA
L EQ
UIT
IES R
ESEA
RC
H
34
Ind
ia D
aily
Su
mm
ary
- July
6, 2
01
8
Kotak Institutional Equities: Valuation summary of KIE Universe stocks
Source: Company, Bloomberg, Kotak Institutional Equities estimates
Target O/S ADVT
Price (Rs) price Upside shares 3mo
Company Rating 05-Jul-18 (Rs) (%) (Rs bn) (US$ bn) (mn) 2018 2019E 2020E 2018 2019E 2020E 2018 2019E 2020E 2018 2019E 2020E 2018 2019E 2020E 2018 2019E 2020E 2018 2019E 2020E (US$ mn)
Industrials
ABB SELL 1,182 1,100 (7.0) 251 3.6 212 20 26 34 12.1 31.2 31.7 59.7 45.5 34.5 32.8 28.0 21.2 6.9 6.4 5.6 12.2 14.6 17.3 0.3 0.8 0.8 1.6
BHEL SELL 68 81 19.5 249 3.6 3,671 2.2 2.6 5.4 62.7 19.4 106.9 30.8 25.8 12.5 7.1 6.4 3.2 0.8 0.8 0.8 2.5 3.0 6.1 2.7 3.2 6.6 8.9
Carborundum Universal SELL 319 310 (2.8) 60 0.9 189 11 14 17 22.8 25.4 20.2 28.0 22.3 18.5 15.1 11.2 9.6 3.9 3.5 3.1 14.6 16.4 17.6 0.7 1.3 1.6 0.3
CG Power and Industrial BUY 58 65 11.7 36 0.5 627 0.8 3.1 4.3 (72.2) 275.7 40.5 71.3 19.0 13.5 10.6 8.0 6.5 1.3 1.4 1.4 1.5 7.3 10.4 — — — 5.9
Crompton Greaves Consumer SELL 229 210 (8.4) 144 2.1 627 5.2 6.2 7.5 13.3 20.0 20.9 44.4 37.0 30.6 27.3 23.0 19.5 18.2 12.6 9.7 49.5 40.5 35.9 0.7 0.9 1.1 3.0
Cummins India REDUCE 656 680 3.6 182 2.6 277 24 28 32 (7.8) 16.1 13.9 27.1 23.3 20.5 23.8 20.5 16.9 4.6 4.3 4.0 17.4 18.9 20.1 2.3 2.2 2.6 4.6
Havells India SELL 546 460 (15.7) 341 5.0 625 11 14 17 16.6 26.2 19.6 49.3 39.0 32.6 31.3 24.8 20.3 9.1 8.1 7.0 19.8 21.9 23.0 0.6 0.9 1.1 10.1
Kalpataru Power Transmission BUY 398 530 33.3 61 0.9 153 19 24 34 36.5 24.3 39.8 20.5 16.5 11.8 8.6 7.1 5.7 2.3 2.0 1.8 11.7 13.1 16.1 0.6 0.6 0.6 0.6
KEC International BUY 332 430 29.4 85 1.2 257 18 22 29 51.1 22.0 34.4 18.6 15.2 11.3 10.0 8.3 6.6 4.3 3.5 2.8 25.7 25.2 27.1 0.7 0.9 1.2 3.4
L&T BUY 1,254 1,560 24.4 1,758 25.6 1,401 52 62 76 22.4 19.4 23.0 24.3 20.3 16.5 20.3 16.7 14.8 3.5 3.2 2.9 15.0 16.5 18.2 1.3 1.8 2.2 41.1
Siemens SELL 972 975 0.3 346 5.0 356 24 30 37 22.5 23.0 23.2 40.2 32.6 26.5 22.7 18.1 14.5 4.2 4.0 3.7 10.9 12.6 14.5 1.0 1.3 1.5 3.5
Thermax REDUCE 1,028 1,065 3.6 123 1.8 113 21 30 42 (3.6) 44.2 42.8 49.9 34.6 24.2 30.4 21.5 15.3 4.3 3.9 3.5 8.8 11.8 15.3 0.6 0.8 0.9 0.9
Voltas SELL 517 525 1.5 171 2.5 331 17 19 22 12.6 8.3 15.6 29.9 27.6 23.9 24.8 21.1 17.5 4.4 3.9 3.5 15.9 15.0 15.5 0.8 0.8 1.0 14.5
Industrials Neutral 3,807 55 19.8 21.6 28.9 29.6 24.4 18.9 19.6 16.2 13.4 3.2 3.0 2.8 10.8 12.3 14.6 1.2 1.5 2.0 98.4
Infrastructure
Adani Ports and SEZ BUY 362 470 29.9 749 10.9 2,071 20 20 23 6.1 (0.2) 14.7 18.1 18.1 15.8 13.0 12.5 11.0 3.6 3.0 2.6 21.5 18.1 17.9 0.6 0.7 0.9 26.2
Ashoka Buildcon BUY 233 310 33.3 44 0.6 188 13 13 13 34.6 0.5 5.2 18.4 18.3 17.4 14.8 12.5 11.1 2.3 2.0 1.8 13.0 11.4 10.7 0.7 1.1 0.7 1.0
Container Corp. SELL 636 635 (0.1) 310 4.5 487 18 21 26 7.3 20.0 21.4 36.0 30.0 24.7 23.7 18.5 14.6 3.3 3.1 2.8 9.4 10.6 11.9 2.7 1.4 1.7 8.7
Dilip Buildcon BUY 655 1,220 86.2 90 1.3 137 46 54 69 76.5 16.1 28.0 14.1 12.1 9.5 8.2 5.9 4.9 3.6 2.8 2.1 29.5 25.9 25.4 — — — 8.5
Gateway Distriparks BUY 170 250 46.9 19 0.3 109 8 8 9 12.1 (1.2) 17.5 22.2 22.5 19.2 21.2 10.5 8.8 1.8 3.6 3.2 8.2 10.8 17.6 4.1 — 1.8 0.8
Gujarat Pipavav Port BUY 109 170 55.7 53 0.8 483 4.1 5.9 7.2 (20.6) 43.7 22.5 26.6 18.5 15.1 13.0 10.8 8.5 2.6 2.6 2.5 9.8 14.0 16.8 3.1 4.4 5.4 0.8
IRB Infrastructure BUY 209 330 58.0 73 1.1 351 23 31 33 10.8 36.8 7.1 9.3 6.8 6.3 7.1 6.7 7.2 1.3 1.1 1.0 14.5 17.6 16.3 1.1 1.5 1.9 11.5
Mahindra Logistics BUY 594 540 (9.2) 42 0.6 71 10 14 18 16.2 42.8 31.2 60.6 42.4 32.3 35.0 23.5 17.8 10.1 8.4 6.9 18.2 21.6 23.5 — — — 0.8
Sadbhav Engineering BUY 276 440 59.2 47 0.7 172 13 18 18 17.4 38.4 2.2 21.5 15.5 15.2 15.0 11.9 9.3 2.5 2.2 2.0 12.5 15.2 13.7 — — — 0.8
Infrastructure Attractive 1,427 21 10.9 10.5 15.5 19.7 17.8 15.4 12.6 11.2 9.8 3.1 2.7 2.4 15.8 15.4 15.5 1.1 0.9 1.2 59.0
Internet
Info Edge BUY 1,230 1,390 13.0 150 2.2 122 23 26 32 33.3 13.9 25.9 54.7 48.0 38.1 45.2 35.6 27.1 7.1 5.7 5.2 13.4 13.2 14.3 0.4 0.6 0.7 1.5
Just Dial BUY 566 550 (2.9) 38 0.6 67 21 25 28 21.7 16.7 12.9 26.7 22.8 20.2 15.8 13.2 11.0 3.9 3.4 3.0 15.2 15.9 15.6 — 0.4 0.5 45.1
Internet Cautious 188 3 28.0 14.8 21.4 45.1 39.3 32.4 34.7 28.2 22.3 6.1 5.0 4.5 13.5 12.8 13.9 0.4 0.6 0.6 46.6
Media
DB Corp. REDUCE 256 295 15.2 47 0.7 184 18 20 24 (14.1) 13.2 18.8 14.5 12.8 10.8 7.7 6.8 5.7 2.8 2.7 2.6 19.9 21.5 24.5 5.1 6.2 7.8 0.5
DishTV ADD 72 84 16.2 133 1.9 1,925 (0.4) 1.7 3.0 (143.0) 482.0 76.2 NM 42.9 24.4 11.8 6.4 5.2 2.1 2.0 1.8 (2.3) 4.7 7.8 — — — 10.1
Jagran Prakashan REDUCE 135 168 24.5 42 0.6 311 10 12 14 (6.0) 21.7 15.3 13.5 11.1 9.6 6.1 5.5 4.8 2.0 2.1 2.0 14.8 18.1 20.9 2.2 3.7 6.7 0.8
PVR REDUCE 1,377 1,425 3.5 64 0.9 47 27 38 50 25.5 39.8 33.2 51.3 36.7 27.5 17.2 14.2 11.7 6.0 5.2 4.5 12.3 15.2 17.5 0.1 0.3 0.4 6.1
Sun TV Network REDUCE 771 925 20.0 304 4.4 394 29 35 39 10.2 20.7 10.9 26.8 22.2 20.0 17.9 15.0 13.1 6.6 5.9 5.3 26.3 28.1 27.9 1.3 2.3 2.6 22.3
Zee Entertainment Enterprises ADD 552 625 13.3 530 7.7 960 15 17 20 7.8 13.8 16.8 36.7 32.3 27.6 23.9 20.6 17.3 7.0 6.2 5.4 20.3 20.3 20.9 0.5 0.8 1.0 14.5
Media Attractive 1,120 16 (1.5) 30.3 20.1 34.4 26.4 22.0 16.6 12.8 10.9 4.7 4.4 3.9 13.7 16.5 17.9 0.9 1.4 1.8 54.3
Dividend yield (%)P/B (X) RoE (%)Mkt cap. EPS (Rs) EPS growth (%) P/E (X) EV/EBITDA (X)

KOTAK INSTITUTIONAL EQUITIES RESEARCH 35
In
dia
Da
ily S
um
ma
ry - Ju
ly 6
, 201
8
35
K
OTA
K IN
STIT
UTIO
NA
L EQ
UIT
IES R
ESEA
RC
H
Kotak Institutional Equities: Valuation summary of KIE Universe stocks
Source: Company, Bloomberg, Kotak Institutional Equities estimates
Target O/S ADVT
Price (Rs) price Upside shares 3mo
Company Rating 05-Jul-18 (Rs) (%) (Rs bn) (US$ bn) (mn) 2018 2019E 2020E 2018 2019E 2020E 2018 2019E 2020E 2018 2019E 2020E 2018 2019E 2020E 2018 2019E 2020E 2018 2019E 2020E (US$ mn)
Metals & Mining
Coal India ADD 270 326 20.6 1,678 24.4 6,207 11 27 28 (24.2) 138.2 3.0 23.9 10.0 9.7 17.8 6.4 6.0 6.9 6.4 6.6 26.7 66.1 66.4 6.1 7.4 9.2 13.2
Hindalco Industries BUY 220 315 43.0 495 7.2 2,229 22 27 31 155.4 23.5 14.3 10.1 8.2 7.1 6.4 5.4 4.7 0.9 0.8 0.7 9.7 10.4 10.8 0.5 0.5 0.5 41.2
Hindustan Zinc REDUCE 274 325 18.6 1,158 16.8 4,225 22 24 28 9.3 13.6 13.8 12.7 11.2 9.9 7.8 6.4 5.2 3.2 2.7 2.3 27.2 26.4 25.6 2.9 2.9 3.0 9.1
Jindal Steel and Power REDUCE 212 255 20.4 205 3.0 968 (8) 8 18 59.3 194.2 129.1 (25.0) 26.5 11.6 9.7 6.9 5.9 0.7 0.7 0.6 (2.7) 2.6 5.7 — — — 28.4
JSW Steel ADD 310 345 11.1 750 10.9 2,417 27 27 25 83.9 (0.7) (5.7) 11.6 11.7 12.4 7.6 7.1 7.6 2.6 2.2 1.9 24.8 20.4 16.5 1.1 1.1 1.1 19.3
National Aluminium Co. ADD 60 85 42.3 115 1.7 1,933 4 7 7 12.7 63.0 11.1 14.5 8.9 8.0 5.8 3.9 3.5 1.1 1.1 1.1 7.7 12.4 13.6 9.5 9.2 9.2 13.3
NMDC REDUCE 103 125 21.4 326 4.7 3,164 12 10 10 43.3 (16.5) 3.6 8.8 10.5 10.2 4.8 6.4 6.1 1.3 1.3 1.2 15.8 12.5 12.4 5.3 5.3 5.3 4.0
Tata Steel ADD 553 700 26.5 634 9.2 1,205 67 69 82 62.6 3.1 18.4 8.2 8 6.7 6.2 6.1 6.2 1.1 1.0 0.9 17.2 13.1 13.9 1.7 1.8 1.8 68.5
Vedanta BUY 221 415 87.5 823 12.0 3,717 22 37 43 9.6 71.9 16.9 10.2 6.0 5.1 5.6 4.2 3.5 1.3 1.2 1.0 12.9 20.6 21.4 3.6 5.0 5.9 58.5
Metals & Mining Attractive 6,184 90 32.3 41.4 11.3 13.1 9.2 8.3 7.4 5.8 5.3 1.9 1.7 1.5 14.3 18.0 18.4 3.5 4.0 4.7 255.6
Pharmaceutical
Apollo Hospitals ADD 1,048 1,090 4.0 146 2.1 139 8 19 26 (46.9) 124.3 38.0 124.2 55.4 40.1 22.3 19.1 16.1 4.5 4.2 3.9 3.4 7.9 10.2 0.2 0.5 0.6 6.5
Aurobindo Pharma ADD 616 640 3.9 361 5.2 584 42 43 46 6.0 2.3 7.9 14.7 14.4 13.4 10.3 9.9 8.9 3.1 2.6 2.2 23.2 19.5 16.6 0.7 0.8 1.0 20.9
Biocon SELL 628 300 (52.2) 377 5.5 601 6 8 15 (39.2) 27.1 84.9 101.3 79.7 43.1 45.4 33.4 22.0 6.7 6.3 5.6 6.9 8.1 13.7 0.3 0.4 0.8 23.6
Cipla BUY 627 650 3.7 504 7.3 805 18 26 34 40.2 48.7 30.8 35.8 24.1 18.4 18.6 13.6 10.8 3.5 3.1 2.7 10.2 13.6 15.9 0.6 0.9 1.1 23.9
Dr Lal Pathlabs REDUCE 920 865 (6.0) 77 1.1 83 20 25 29 7.0 20.8 18.5 45.0 37.2 31.4 27.3 22.9 19.2 9.7 8.1 6.8 23.5 23.7 23.4 0.5 0.5 0.6 1.3
Dr Reddy's Laboratories REDUCE 2,299 2,250 (2.1) 381 5.5 166 59 100 134 (18.5) 69.8 33.3 38.9 22.9 17.2 18.0 11.4 8.5 3.0 2.7 2.4 7.8 12.5 13.9 1.0 0.7 0.9 29.8
HCG REDUCE 284 305 7.2 25 0.4 85 2 3 5 (40.0) 120.9 57.3 181.9 82.3 52.3 23.9 18.6 15.9 4.7 4.4 4.1 2.8 5.5 8.1 — — — 0.2
Laurus Labs ADD 482 540 12.0 51 0.7 106 16 22 34 (11.9) 37.3 54.4 30.4 22.2 14.3 14.7 12.0 8.8 3.4 3.0 2.5 11.9 14.4 18.8 — — — 0.9
Lupin REDUCE 923 800 (13.3) 417 6.1 450 38 35 45 (32.9) (7.7) 28.6 24.2 26.2 20.4 14.8 13.2 10.8 3.0 2.8 2.5 12.6 11.1 12.9 0.5 0.6 0.7 31.4
Narayana Hrudayalaya ADD 236 275 16.6 48 0.7 204 3 4 7 (38.1) 52.2 76.9 93.8 61.6 34.8 26.0 19.6 14.4 4.7 4.3 3.9 5.1 7.3 11.7 — — — 0.4
Sun Pharmaceuticals REDUCE 567 500 (11.8) 1,360 19.8 2,406 15 17 24 (47.5) 12.0 42.0 37.4 33.4 23.5 22.1 18.1 13.3 3.6 3.3 2.9 9.8 10.2 13.1 0.4 0.6 0.9 51.2
Torrent Pharmaceuticals NR 1,420 — — 240 3.5 169 40 46 61 (27.4) 15.1 32.9 35.4 30.8 23.2 19.9 14.2 11.8 5.2 4.6 4.0 15.1 14.9 17.2 1.1 0.7 1.0 5.2
Pharmaceuticals Neutral 3,988 58 (27.6) 18.9 32.6 33.9 28.5 21.5 18.8 15.1 11.9 3.7 3.3 2.9 10.9 11.7 13.7 0.5 0.6 0.9 195.4
Real Estate
Brigade Enterprises BUY 205 340 66.0 28 0.4 136 11 9 9 (17.7) (15.1) (1.6) 18.5 21.8 22.1 11.1 11.3 11.1 1.2 1.2 1.1 7.6 5.5 5.2 1.2 1.2 1.2 0.4
DLF RS 181 — — 323 4.7 1,784 19.6 6.5 3.9 403.9 (66.9) (39.6) 9.2 27.9 46.2 27.8 12.1 12.0 0.9 0.9 0.9 11.7 3.2 1.9 1.1 1.1 1.1 18.0
Godrej Properties SELL 706 400 (43.3) 162 2.4 216 11.6 16.8 19.2 21.9 43.9 14.9 60.6 42.1 36.7 151.7 108.0 76.7 6.8 5.8 5.0 11.8 14.9 14.7 — — — 2.7
Oberoi Realty REDUCE 458 520 13.6 166 2.4 340 13 66 46 14.0 418.8 (30.8) 36.0 6.9 10.0 27.0 9.9 13.0 2.6 1.9 1.6 7.3 31.2 17.3 0.4 0.4 0.4 3.4
Prestige Estates Projects ADD 275 315 14.7 103 1.5 375 13 10 10 24.3 (24.2) 8.4 21.9 28.9 26.6 15.0 15.6 15.6 2.2 2.1 1.9 10.3 7.3 7.5 0.5 0.5 0.5 1.0
Sobha REDUCE 477 510 6.9 45 0.7 95 22 20 23 30.9 (7.5) 14.8 21.8 23.6 20.6 13.2 13.4 12.6 1.6 1.6 1.5 7.6 6.8 7.4 1.5 1.5 1.5 1.9
Sunteck Realty REDUCE 369 330 (10.6) 54 0.8 140 15 18 20 4.8 20.2 6.9 24.2 20.1 18.8 15.6 17.2 16.0 2.0 1.8 1.7 9.7 9.4 9.2 0.3 0.3 0.3 1.8
Real Estate Neutral 882 13 140.1 (10.1) (21.7) 16.9 18.8 24.0 23.6 14.3 14.8 1.6 1.5 1.4 9.3 7.8 5.8 0.7 0.7 0.7 29.2
Dividend yield (%)Mkt cap. EPS (Rs) EPS growth (%) P/E (X) EV/EBITDA (X) P/B (X) RoE (%)

36 KOTAK INSTITUTIONAL EQUITIES RESEARCH
K
OTA
K IN
STIT
UTIO
NA
L EQ
UIT
IES R
ESEA
RC
H
36
Ind
ia D
aily
Su
mm
ary
- July
6, 2
01
8
Kotak Institutional Equities: Valuation summary of KIE Universe stocks
Source: Company, Bloomberg, Kotak Institutional Equities estimates
Target O/S ADVT
Price (Rs) price Upside shares 3mo
Company Rating 05-Jul-18 (Rs) (%) (Rs bn) (US$ bn) (mn) 2018 2019E 2020E 2018 2019E 2020E 2018 2019E 2020E 2018 2019E 2020E 2018 2019E 2020E 2018 2019E 2020E 2018 2019E 2020E (US$ mn)
Technology
HCL Technologies REDUCE 931 1,010 8.5 1,296 18.8 1,409 62 68 71 5.3 9.0 5.0 14.9 13.7 13.1 10.5 8.8 8.1 3.6 3.0 2.7 24.8 23.8 21.9 0.9 3.1 3.3 32.4
Hexaware Technologies SELL 446 420 (5.8) 132 1.9 304 16 20 22 19.8 20.5 12.5 27.2 22.5 20.0 19.4 16.3 13.9 6.8 5.9 5.0 26.6 27.8 27.0 0.9 1.8 1.8 11.9
Infosys ADD 1,284 1,350 5.1 2,804 40.8 2,175 65 70 76 3.0 8.1 9.5 19.9 18.4 16.8 13.7 12.5 11.3 4.3 4.1 3.7 21.8 22.7 23.1 2.2 3.4 3.0 78.1
L&T Infotech ADD 1,648 1,650 0.1 284 4.1 175 64 73 84 13.9 14.5 15.7 25.9 22.6 19.6 22.6 16.9 14.1 7.5 6.2 5.2 31.8 30.0 29.0 1.0 1.5 1.6 4.4
Mindtree ADD 999 1,015 1.6 164 2.4 165 35 43 52 37.8 23.2 23.2 28.9 23.5 19.0 21.0 14.7 11.9 6.0 5.1 4.4 21.4 23.6 24.9 1.1 1.3 1.6 30.5
Mphasis SELL 1,087 760 (30.1) 210 3.1 193 44 52 56 14.4 18.3 8.2 24.8 21.0 19.4 17.9 14.4 12.9 3.8 3.5 3.2 14.6 17.4 17.1 1.8 1.8 1.8 11.5
TCS REDUCE 1,880 1,650 (12.2) 7,199 104.7 3,829 67 78 84 1.1 15.0 8.8 27.9 24.2 22.3 20.7 17.6 16.0 8.3 7.7 7.1 29.4 32.7 33.1 1.3 2.7 2.9 108.3
Tech Mahindra ADD 647 775 19.8 571 8.3 891 43 45 53 33.1 6.6 15.8 15.2 14.2 12.3 11.1 8.6 7.0 3.1 2.6 2.3 21.5 19.9 19.7 2.2 1.4 1.6 35.0
Wipro REDUCE 264 295 11.7 1,195 17.4 4,507 17 19 21 (3.1) 11.1 13.7 15.6 14.0 12.3 9.8 8.3 7.2 2.5 2.1 2.0 16.0 16.3 16.6 0.4 0.6 3.8 11.6
Technology Cautious 13,855 201 1.6 9.9 9.8 21.6 19.7 17.9 15.7 13.4 12.1 5.1 4.6 4.2 23.7 23.5 23.5 1.4 2.6 2.9 323.6
Telecom
Bharti Airtel ADD 363 470 29.3 1,453 21.1 3,997 5 (4) 0 (42.9) (187.4) 104.6 76.8 (87.8) 1,923.3 8.1 9.2 7.4 2.1 2.2 2.2 2.8 (2.4) 0.1 1.5 0.3 0.0 36.7
Bharti Infratel REDUCE 303 285 (6.1) 561 8.2 1,850 14 13 11 (7.4) (8.7) (9.0) 22.1 24.2 26.5 8.0 8.8 9.3 3.3 3.5 3.5 15.7 14.0 13.1 4.8 3.3 3.0 15.1
IDEA REDUCE 55 75 37.6 238 3.5 4,359 (10) (15) (14) (656.8) (54.9) 6.4 (5.7) (3.7) (3.9) 12.3 22.5 16.7 0.9 1.1 1.6 (16.0) (26.9) (34.0) — — — 16.9
Tata Communications ADD 596 725 21.7 170 2.5 285 2 4 8 (84.3) 121.9 117.7 362 163.0 74.9 10.8 9.7 8.5 34.0 27.4 19.8 4.5 18.6 30.7 1.1 1.1 1.3 4.6
Telecom Cautious 2,421 35 (94.7) (1,906.6) 36.2 769.8 (42.6) (66.7) 8.8 10.4 8.6 2.1 2.3 2.5 0.3 (5.5) (3.7) 2.0 0.9 0.7 73.3
Utilities
CESC ADD 910 1,180 29.6 121 1.8 133 87 102 118 67.1 16.8 15.5 10.4 8.9 7.7 7.6 5.6 4.9 0.8 0.8 0.7 7.9 8.8 9.4 1.4 1.1 1.2 6.1
JSW Energy REDUCE 68 80 18.1 111 1.6 1,640 3.1 5.9 8.2 (19.2) 92.2 38.7 22.1 11.5 8.3 7.0 5.5 4.5 1.0 1.0 0.9 4.7 8.5 11.0 3.0 3.0 3.0 2.0
NHPC ADD 23 30 30.2 236 3.4 10,260 2.4 3.1 3.2 (17.3) 26.9 1.8 9.4 7.4 7.3 8.9 7.0 6.8 0.8 0.8 0.7 8.5 10.4 10.2 6.1 7.5 7.6 2.1
NTPC BUY 152 190 24.9 1,255 18.2 8,245 11 15 16 (7.6) 30.9 4.4 13.4 10.2 9.8 10.9 8.5 7.9 1.2 1.1 1.1 9.5 11.6 11.3 3.7 2.9 3.1 13.4
Power Grid BUY 182 250 37.6 950 13.8 5,232 16 19 21 9.6 19.3 13.6 11.5 9.7 8.5 8.3 7.1 6.5 1.7 1.6 1.4 15.8 17.1 17.5 2.9 3.4 3.9 30.4
Reliance Power SELL 31 43 40.1 86 1.3 2,805 3.5 5.1 5.2 (16.4) 45.6 2.7 8.8 6.1 5.9 7.7 6.6 6.4 0.4 0.4 0.3 4.5 6.1 5.9 — — — 4.4
Tata Power ADD 71 97 36.1 193 2.8 2,705 5.3 7.8 8.7 (9.6) 46.1 11.2 13.3 9.1 8.2 10.2 9.4 8.6 1.3 1.1 1.0 10.7 12.9 12.7 — — — 5.9
Utilities Attractive 2,952 43 (2.4) 28.6 9.0 12.2 9.5 8.7 9.2 7.6 7.0 1.2 1.1 1.0 9.7 11.5 11.6 3.2 3.1 3.3 64.2
P/B (X) RoE (%) Dividend yield (%)Mkt cap. EPS (Rs) EPS growth (%) P/E (X) EV/EBITDA (X)

KOTAK INSTITUTIONAL EQUITIES RESEARCH 37
In
dia
Da
ily S
um
ma
ry - Ju
ly 6
, 201
8
37
K
OTA
K IN
STIT
UTIO
NA
L EQ
UIT
IES R
ESEA
RC
H
Kotak Institutional Equities: Valuation summary of KIE Universe stocks
Source: Company, Bloomberg, Kotak Institutional Equities estimates
Target O/S ADVT
Price (Rs) price Upside shares 3mo
Company Rating 05-Jul-18 (Rs) (%) (Rs bn) (US$ bn) (mn) 2018 2019E 2020E 2018 2019E 2020E 2018 2019E 2020E 2018 2019E 2020E 2018 2019E 2020E 2018 2019E 2020E 2018 2019E 2020E (US$ mn)
Others
Astral Poly Technik SELL 972 625 (35.7) 116 1.7 120 15 19 23 20.8 28.0 23.0 66.3 51.8 42.1 37.3 28.9 23.5 11.4 9.5 7.8 18.8 20.0 20.3 0.1 0.1 0.1 1.2
Avenue Supermarts SELL 1,546 860 (44.4) 965 14.0 624 13 16 20 47.9 28.6 26.4 123.0 95.7 75.7 72.1 55.2 43.3 20.8 17.1 13.9 18.5 19.6 20.3 — — — —
Bayer Cropscience REDUCE 4,543 4,000 (12.0) 179 2.6 34 86 105 124 4.4 22.7 17.5 52.9 43.1 36.7 42.8 33.4 26.8 8.8 7.6 6.6 15.4 18.8 19.2 0.4 0.5 0.5 0.5
Dhanuka Agritech REDUCE 550 690 25.5 27 0.4 49 26 28 32 7.7 8.9 15.4 21.4 19.6 17.0 15.7 13.5 11.3 4.3 3.7 3.2 21.9 20.1 20.0 1.0 1.1 1.3 0.1
Godrej Agrovet ADD 609 650 6.7 117 1.7 189 12 16 20 6.9 39.8 24.6 52.9 37.8 30.4 27.2 21.0 17.0 6.8 5.9 5.0 14.7 16.9 17.9 0.3 0.4 0.5 2.4
Godrej Industries RS 606 — — 204 3.0 336 15 16 20 6.8 8.9 24.2 41.6 38.2 30.7 37.0 31.3 34.1 5.6 5.0 4.4 14.4 13.9 15.1 0.3 0.3 0.3 5.0
InterGlobe Aviation BUY 1,076 1,430 32.9 414 6.0 383 59 71 98 27.2 21.8 37.5 18.4 15.1 11.0 10.4 8.5 5.8 5.8 4.3 3.2 41.3 33.0 33.8 0.6 0.7 0.9 26.7
Kaveri Seed SELL 552 470 (14.9) 36 0.5 66 32 31 33 18.4 (3.7) 6.1 17.3 17.9 16.9 14.6 15.0 13.5 4.7 4.0 3.5 23.6 24.0 21.9 1.1 1.4 1.8 5.0
PI Industries BUY 800 900 12.5 110 1.6 138 27 33 41 (20.0) 25.0 23.2 30.1 24.1 19.5 22.2 17.5 13.9 5.7 4.8 3.9 20.7 21.7 22.1 0.4 0.5 0.6 1.7
Rallis India ADD 185 235 26.8 36 0.5 195 9 11 13 (1.5) 26.4 19.7 21.5 17.0 14.2 13.7 11.2 9.5 3.0 2.7 2.4 14.6 16.9 18.1 1.8 2.0 2.2 0.8
SIS REDUCE 1,145 1,250 9.1 84 1.2 73 23 36 43 44.0 58.5 20.6 50.8 32.0 26.6 27.2 20.7 17.0 8.1 6.8 5.7 20.2 23.4 23.3 0.3 0.5 0.6 0.6
SRF BUY 1,628 2,110 29.6 93 1.4 57 80 92 123 (10.4) 14.4 33.6 20.2 17.7 13.3 12.5 9.9 8.0 2.6 2.3 2.0 13.7 14.0 16.4 0.7 0.8 0.9 9.9
Tata Chemicals ADD 693 760 9.6 177 2.6 255 51 46 52 6.5 (11.2) 13.6 13.5 15.2 13.4 7.4 6.4 5.3 1.6 1.5 1.4 13.8 10.0 10.5 3.2 2.2 2.5 9.0
TeamLease Services SELL 2,939 1,750 (40.5) 50 0.7 17 43 59 75 28.0 37.4 27.2 68.2 49.6 39.0 71.1 50.4 39.0 11.4 9.3 7.5 18.2 20.6 21.2 — — — 2.4
UPL ADD 623 850 36.4 317 4.6 507 43 73 82 20.9 71.2 11.9 14.5 8.5 7.6 10.1 8.8 7.4 3.4 2.9 2.4 26.4 23.6 22.4 1.3 1.5 1.7 13.8
Vardhman Textiles ADD 1,209 1,400 15.8 69 1.0 56 103 130 140 (8.0) 26.4 7.4 11.7 9.3 8.6 9.9 7.3 6.6 1.4 1.3 1.1 12.7 14.3 13.8 1.2 1.7 2.5 1.0
Whirlpool SELL 1,500 1,240 (17.4) 190 2.8 127 28 37 45 13.0 33.9 22.5 54.3 40.5 33.1 32.0 24.6 19.8 10.6 8.8 7.3 21.4 23.7 24.1 0.3 0.4 0.6 1.0
Others 3,186 46 15.0 15.9 22.8 31.2 26.9 21.9 20.1 16.6 13.5 5.7 4.8 4.1 18.1 17.8 18.6 0.6 0.6 0.7 81.2
KIE universe 106,578 1,549 (6.2) 29.7 25.0 26.4 20.4 16.3 12.3 10.4 9.2 2.9 2.6 2.4 11.0 12.9 14.6 1.3 1.5 1.8
KIE universe (ex-energy) 94,301 1,371 (8.4) 38.0 29.7 31.4 22.8 17.5 13.9 11.6 10.1 3.3 2.9 2.7 10.4 12.9 15.2 1.2 1.4 1.7
Notes:
(a) We have used adjusted book values for banking companies.
(b) 2018 means calendar year 2017, similarly for 2019 and 2020 for these particular companies.
(c) Exchange rate (Rs/US$)= 68.78
Mkt cap. EPS (Rs) EPS growth (%) P/E (X) EV/EBITDA (X) P/B (X) RoE (%) Dividend yield (%)
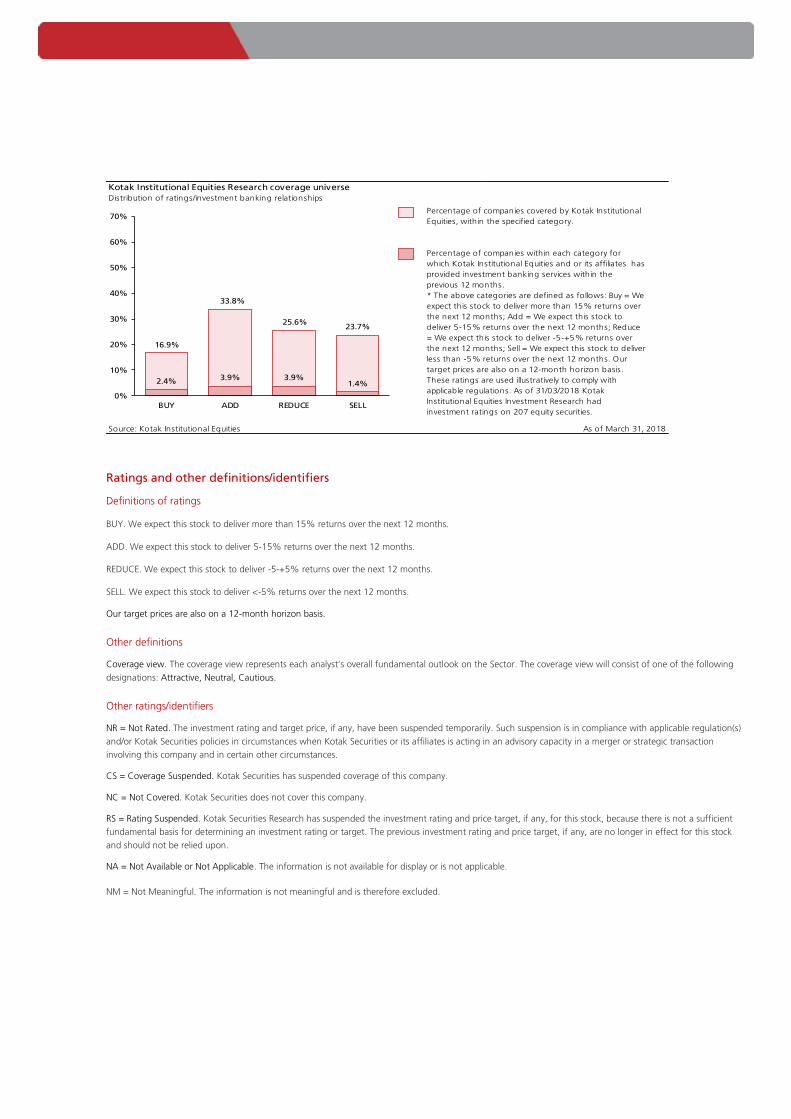
Ind
ia D
aily
Su
mm
ary
-Ju
ly 6
, 201
8
Ratings and other definitions/identifiers
Definitions of ratings
BUY. We expect this stock to deliver more than 15% returns over the next 12 months.
ADD. We expect this stock to deliver 5-15% returns over the next 12 months.
REDUCE. We expect this stock to deliver -5-+5% returns over the next 12 months.
SELL. We expect this stock to deliver <-5% returns over the next 12 months.
Our target prices are also on a 12-month horizon basis.
Other definitions
Coverage view. The coverage view represents each analyst’s overall fundamental outlook on the Sector. The coverage view will consist of one of the following
designations: Attractive, Neutral, Cautious.
Other ratings/identifiers
NR = Not Rated. The investment rating and target price, if any, have been suspended temporarily. Such suspension is in compliance with applicable regulation(s)
and/or Kotak Securities policies in circumstances when Kotak Securities or its affiliates is acting in an advisory capacity in a merger or strategic transaction
involving this company and in certain other circumstances.
CS = Coverage Suspended. Kotak Securities has suspended coverage of this company.
NC = Not Covered. Kotak Securities does not cover this company.
RS = Rating Suspended. Kotak Securities Research has suspended the investment rating and price target, if any, for this stock, because there is not a sufficient
fundamental basis for determining an investment rating or target. The previous investment rating and price target, if any, are no longer in effect for this stock
and should not be relied upon.
NA = Not Available or Not Applicable. The information is not available for display or is not applicable.
NM = Not Meaningful. The information is not meaningful and is therefore excluded.
Kotak Institutional Equities Research coverage universe
Distribution of ratings/investment banking relationships
Source: Kotak Institutional Equities As of March 31, 2018
Percentage of companies covered by Kotak Institutional
Equities, within the specified category.
* The above categories are defined as follows: Buy = We
expect this stock to deliver more than 15% returns over
the next 12 months; Add = We expect this stock to
deliver 5-15% returns over the next 12 months; Reduce
= We expect this stock to deliver -5-+5% returns over
the next 12 months; Sell = We expect this stock to deliver
less than -5% returns over the next 12 months. Our
target prices are also on a 12-month horizon basis.
These ratings are used illustratively to comply with
applicable regulations. As of 31/03/2018 Kotak
Institutional Equities Investment Research had
investment ratings on 207 equity securities.
Percentage of companies within each category for
which Kotak Institutional Equities and or its affiliates has
provided investment banking services within the
previous 12 months.
16.9%
33.8%
25.6%23.7%
2.4% 3.9% 3.9%1.4%
0%
10%
20%
30%
40%
50%
60%
70%
BUY ADD REDUCE SELL

Corporate Office Overseas Affiliates
Kotak Securities Ltd.
27 BKC, Plot No. C-27, “G Block”
Bandra Kurla Complex, Bandra (E)
Mumbai 400 051, India
Tel: +91-22-43360000
Kotak Mahindra (UK) Ltd
8th Floor, Portsoken House
155-157 Minories
London EC3N 1LS
Tel: +44-20-7977-6900
Kotak Mahindra Inc
369 Lexington Avenue
28th Floor, New York
NY 10017, USA
Tel:+1 212 600 8856
Copyright 2018 Kotak Institutional Equities (Kotak Securities Limited). All rights reserved.
1. Note that the research analysts contributing to this report may not be registered/qualified as research analysts with FINRA; and
2. Such research analysts may not be associated persons of Kotak Mahindra Inc and therefore, may not be subject to NASD Rule 2711 restrictions on communications with a subject company, public appearances and trading securities held by a research analyst account.
3. Any U.S. recipients of the research who wish to effect transactions in any security covered by the report should do so with or through Kotak Mahindra Inc and (ii) any transactions in the securities covered by the research by U.S. recipients must be effected only through Kotak Mahindra Inc at [email protected].
This report is distributed in Singapore by Kotak Mahindra (UK) Limited (Singapore Branch) to institutional investors, accredited investors or expert investors only as defined under the Securities and Futures Act. Recipients of this analysis / report are to contact Kotak Mahindra (UK) Limited (Singapore Branch) (16 Raffles Quay, #35-02/03, Hong Leong Building, Singapore 048581) in respect of any matters arising from, or in connection with, this analysis / report. Kotak Mahindra (UK) Limited (Singapore Branch) is regulated by the Monetary Authority of Singapore. Kotak Securities Limited and its affiliates are a full-service, integrated investment banking, investment management, brokerage and financing group. We along with our affiliates are leading underwriter of securities and participants in virtually all securities trading markets in India. We and our affiliates have investment banking and other business relationships with a significant percentage of the companies covered by our Investment Research Department. Our research professionals provide important input into our investment banking and other business selection processes. Investors should assume that Kotak Securities Limited and/or its affiliates are seeking or will seek investment banking or other business from the company or companies that are the subject of this material and that the research professionals who were involved in preparing this material may participate in the solicitation of such business. Our research professionals are paid in part based on the profitability of Kotak Securities Limited, which include earnings from investment banking and other business. Kotak Securities Limited generally prohibits its analysts, persons reporting to analysts, and members of their households from maintaining a financial interest in the securities or derivatives of any companies that the analysts cover. Additionally, Kotak Securities Limited generally prohibits its analysts and persons reporting to analysts from serving as an officer, director, or advisory board member of any companies that the analysts cover. Our salespeople, traders, and other professionals may provide oral or written market commentary or trading strategies to our clients that reflect opinions that are contrary to the opinions expressed herein, and our proprietary trading and investing businesses may make investment decisions that are inconsistent with the recommendations expressed herein. Kotak Securities Limited has two independent equity research groups: Institutional Equities and Private Client Group. This report has been prepared by the Institutional Equities Research Group of Kotak Securities Limited. The views and opinions expressed in this document may or may not match or may be contrary with the views, estimates, rating, target price of the Private Client Group. In reviewing these materials, you should be aware that any or all of the foregoing, among other things, may give rise to real or potential conflicts of interest. Additionally, other important information regarding our relationships with the company or companies that are the subject of this material is provided herein. This material should not be construed as an offer to sell or the solicitation of an offer to buy any security in any jurisdiction where such an offer or solicitation would be illegal. We are not soliciting any action based on this material. It is for the general information of clients of Kotak Securities Limited. It does not constitute a personal recommendation or take into account the particular investment objectives, financial situations, or needs of individual clients. Before acting on any advice or recommendation in this material, clients should consider whether it is suitable for their particular circumstances and, if necessary, seek professional advice. The price and value of the investments referred to in this material and the income from them may go down as well as up, and investors may realize losses on any investments. Past performance is not a guide for future performance, future returns are not guaranteed and a loss of original capital may occur. Kotak Securities Limited does not provide tax advise to its clients, and all investors are strongly advised to consult with their tax advisers regarding any potential investment. Certain transactions -including those involving futures, options, and other derivatives as well as non-investment-grade securities - give rise to substantial risk and are not suitable for all investors. The material is based on information that we consider reliable, but we do not represent that it is accurate or complete, and it should not be relied on as such. Opinions expressed are our current opinions as of the date appearing on this material only. We endeavor to update on a reasonable basis the information discussed in this material, but regulatory, compliance, or other reasons may prevent us from doing so. We and our affiliates, officers, directors, and employees, including persons involved in the preparation or issuance of this material, may from time to time have "long" or "short" positions in, act as principal in, and buy or sell the securities or derivatives thereof of companies mentioned herein. Kotak Securities Limited and its non US affiliates may, to the extent permissible under applicable laws, have acted on or used this research to the extent that it relates to non US issuers, prior to or immediately following its publication. Foreign currency denominated securities are subject to fluctuations in exchange rates that could have an adverse effect on the value or price of or income derived from the investment. In addition, investors in securities such as ADRs, the value of which are influenced by foreign currencies affectively assume currency risk. In addition options involve risks and are not suitable for all investors. Please ensure that you have read and understood the current derivatives risk disclosure document before entering into any derivative transactions. Kotak Securities Limited established in 1994, is a subsidiary of Kotak Mahindra Bank Limited. Kotak Securities is one of India's largest brokerage and distribution house. Kotak Securities Limited is a corporate trading and clearing member of BSE Limited (BSE), National Stock Exchange of India Limited (NSE), MSEI a. Our businesses include stock broking, services rendered in connection with distribution of primary market issues and financial products like mutual funds and fixed deposits, depository services and Portfolio Management. Kotak Securities Limited is also a depository participant with National Securities Depository Limited (NSDL) and Central Depository Services (India) Limited (CDSL). Kotak Securities Limited is also registered with Insurance Regulatory and Development Authority as Corporate Agent for Kotak Mahindra Old Mutual Life Insurance Limited and is also a Mutual Fund Advisor registered with Association of Mutual Funds in India (AMFI). Kotak Securities Limited is registered as a Research Analyst under SEBI (Research Analyst) Regulations, 2014. We hereby declare that our activities were neither suspended nor we have defaulted with any stock exchange authority with whom we are registered in last five years. However SEBI, Exchanges and Depositories have conducted the routine inspection and based on their observations have issued advise letters or levied minor penalty on KSL for certain operational deviations. We have not been debarred from doing business by any Stock Exchange / SEBI or any other authorities; nor has our certificate of registration been cancelled by SEBI at any point of time. We offer our research services to primarily institutional investors and their employees, directors, fund managers, advisors who are registered with us Details of Associates are available on our website i.e. www.kotak.com Research Analyst has served as an officer, director or employee of subject company(ies): No We or our associates may have received compensation from the subject company(ies) in the past 12 months. We or our associates have managed or co-managed public offering of securities for the subject company(ies) in the past 12 months. YES We or our associates may have received compensation for investment banking or merchant banking or brokerage services from the subject company(ies) in the past 12 months. We or our associates may have received any compensation for products or services other than investment banking or merchant banking or brokerage services from the subject company(ies) in the past 12 months. We or our associates may have received compensation or other benefits from the subject company(ies) or third party in connection with the research report. Our associates may have financial interest in the subject company(ies). Research Analyst or his/her relative's financial interest in the subject company(ies): No Kotak Securities Limited has financial interest in the subject company(ies) at the end of the month immediately preceding the date of publication of Research Report: YES Our associates may have actual/beneficial ownership of 1% or more securities of the subject company(ies) at the end of the month immediately preceding the date of publication of Research Report. Research Analyst or his/her relatives has actual/beneficial ownership of 1% or more securities of the subject company(ies) at the end of the month immediately preceding the date of publication of Research Report: No Kotak Securities Limited has actual/beneficial ownership of 1% or more securities of the subject company(ies) at the end of the month immediately preceding the date of publication of Research Report: No Subject company(ies) may have been client during twelve months preceding the date of distribution of the research report. A graph of daily closing prices of securities is available at www.nseindia.com and http://economictimes.indiatimes.com/markets/stocks/stock-quotes. (Choose a company from the list on the browser and select the"three years" icon in the price chart). Kotak Securities Limited. Registered Office: 27 BKC, C 27, G Block, Bandra Kurla Complex, Bandra (E), Mumbai 400051. CIN: U99999MH1994PLC134051, Telephone No.: +22 43360000, Fax No.: +22 67132430. Website: www.kotak.com / www.kotaksecurities.com. Correspondence Address: Infinity IT Park, Bldg. No 21, Opp. Film City Road, A K Vaidya Marg, Malad (East), Mumbai 400097. Telephone No: 42856825. SEBI Registration No: NSE INB/INF/INE 230808130, BSE INB 010808153/INF 011133230, MSE INE 260808130/INB 260808135/INF 260808135, AMFI ARN 0164, PMS INP000000258 and Research Analyst INH000000586. NSDL/CDSL: IN-DP-NSDL-23-97. Compliance Officer Details: Mr. Manoj Agarwal. Call: 022 - 4285 8484, or Email: [email protected]. Investments in securities market are subject to market risks, read all the related documents carefully before investing. In case you require any clarification or have any concern, kindly write to us at below email ids: Level 1: For Trading related queries, contact our customer service at ‘[email protected]’ and for demat account related queries contact us at [email protected] or call us on:
Toll free numbers 18002099191 / 1800222299 and 18002099292 Level 2: If you do not receive a satisfactory response at Level 1 within 3 working days, you may write to us at [email protected] or call us on 022-42858445 and if you feel you are
still unheard, write to our customer service HOD at [email protected] or call us on 022-42858208. Level 3: If you still have not received a satisfactory response at Level 2 within 3 working days, you may contact our Compliance Officer (Name: Mr. Manoj Agarwal) at
[email protected] or call on 91- (022) 4285 8484.
Level 4: If you have not received a satisfactory response at Level 3 within 7 working days, you may also approach CEO (Mr. Kamlesh Rao) at [email protected] or call on 91-(022) 4285 8301.
First Cut notes published on this site are for information purposes only. They represent early notations and responses by analysts to recent events. Data in the notes may not have been verified by us and investors should not act upon any data or views in these notes. Most First Cut notes, but not necessarily all, will be followed by final research reports on the subject. There could be variance between the First cut note and the final research note on any subject, in which case the contents of the final research note would prevail. We accept no liability for the contents of the First Cut Notes.
For further disclosure please view https://kie.kotak.com/kinsite/index.php


