
IMPROVING THE EVIDENCE BASE ON
THE COSTS OF DISASTERS –
TOWARDS AN OECD FRAMEWORK FOR ACCOUNTING RISK
MANAGEMENT EXPENDITURES AND LOSSES OF DISASTERS
OECD High Level Risk Forum
Public Governance and Territorial Development Directorate
Catherine Gamper November 21 2014, OECD Headquarters, Paris

0
50
100
150
200
250
300
350
1980 1982 1984 1986 1988 1990 1992 1994 1996 1998 2000 2002 2004 2006 2008 2010 2012
Ann
ual e
cono
mic
loss
es in
US
D b
illio
n
• Past decade: USD 1.5 trillion in economic damages from man-made disasters (industrial accidents, terrorist attacks) and natural disasters (primarily storms and floods)
• Increase in economic damages believed to outpace national DRR investments…
• … though this claim cannot be supported by data as there is hardly any available, especially on an internationally comparative level
• The development of standardised and comparable accounting frameworks for DRM expenditure and disaster losses can:
– Support the evaluation of economic benefits of DRR investments
– Faciliate cross-ountry comparisons
– Systematic indicators on global DRR objectives could be built (to inform post
2015 SDG‘s, HFA2 etc.)
Why we need to better account for costs
of disasters
Source: EM-DAT: The OFDA/CRED International Disaster Database, Université catholique de Louvain, Brussels, Belgium, www.emdat.be (accessed 14 November 2013).
Economic losses due to disasters in OECD and BRIC countries, 1980-2012 (USD Billion)
1. Review national and international efforts recording ex-post disaster losses:
– Analyse their comparability
– Analyse strengths and weaknesses
→ provide basis for developing better methods, setting new international standard and providing repository for such information
2. Assess ongoing national efforts and propose draft framework for assessing public (and potentially private) spending for DRM:
– To better understand countries‘ expenditures ex-ante and ex-post of disasters
– Help policy makers understand whether their spending efforts lead to future reductions in disaster losses
→ goal is to be sufficiently comprehensive so as to account for most such expenditure items, while be broad enough to capture similar expenditures across countries
Project Objectives
1. Review of international and national data collection efforts and methods on recording disaster losses
2. Review of international and national efforts to collect information on public (and private) expenditure on disaster risk management
3. A draft framework to collect DRM expenditure information including public and potentially private, across hazard and sectors
4. Going forward:
– test the framework in 2-4 OECD member countries
– refine framework
– mainstream it and establish OECD database in the long-term
Expected Outputs
• Expenditure related costs somewhat easier to derive compared to losses
• Losses are challenging to asses as they can be:
– Short, medium, or long-term
– Direct or indirect
– Not only felt locally, but trigger through economic sectors and countries globally
• Identifying expenditure information across different departments and sectors equally challenging:
– There are no central repositories for DRM expenditure information
– Multiple agencies and levels of government have DRM expenditures, each their own way of describing this in budgets and national accounts
– Even more complex if expenditure for DRM is “embedded”
– Requires much effort and judgment to identify spending categories across sectors and levels of government
Costs of expenditures vs. losses
Australia
Bangladesh
Bolivia Chile
Costa Rica
Egypt
Estonia
Ethiopia
Fiji Finland
France Germany
Greece
Haiti
Honduras India
Indonesia Iran
Italy
Jamaica
Japan
Kenya Madagascar Malawi
Mexico
Mozambique
Nepal
Netherlands
New Zealand
Norway
Pakistan
Philippines
Poland
Portugal
Slovenia
Thailand Turkey
United Kingdom United States
Venezuela
Yemen
0.5
1
1.5
2
2.5
3
3.5
2.7 3.2 3.7 4.2 4.7
Ave
rag
e D
ea
th T
oll
per
Dis
as
ter
19
80
-20
13
(lo
g)
Real GDP per Capita, Year 2010 (log)
Significant decrease in fatality rates from disasters with increasing income 1980-2013
OECD Non-OECD
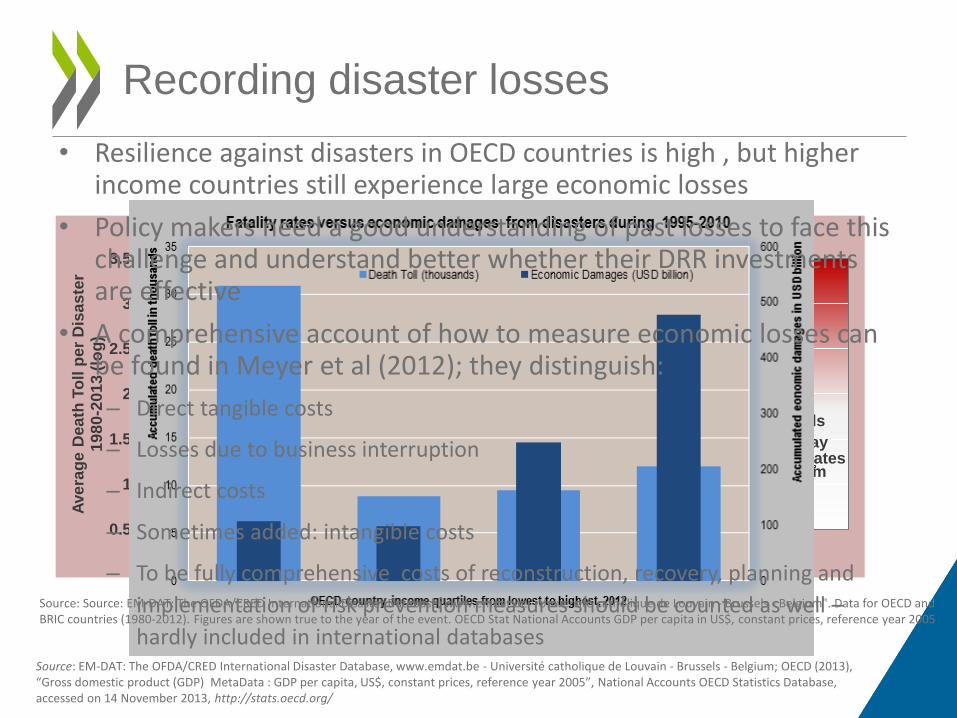
• Resilience against disasters in OECD countries is high , but higher income countries still experience large economic losses
• Policy makers need a good understanding of past losses to face this challenge and understand better whether their DRR investments are effective
• A comprehensive account of how to measure economic losses can be found in Meyer et al (2012); they distinguish:
– Direct tangible costs
– Losses due to business interruption
– Indirect costs
– Sometimes added: intangible costs
– To be fully comprehensive costs of reconstruction, recovery, planning and
implementation of risk prevention measures should be counted as well –
hardly included in international databases
Recording disaster losses
Source: Source: EM-DAT: The OFDA/CRED International Disaster Database, www.emdat.be - Université catholique de Louvain - Brussels - Belgium". Data for OECD and BRIC countries (1980-2012). Figures are shown true to the year of the event. OECD Stat National Accounts GDP per capita in US$, constant prices, reference year 2005
Source: EM-DAT: The OFDA/CRED International Disaster Database, www.emdat.be - Université catholique de Louvain - Brussels - Belgium; OECD (2013), “Gross domestic product (GDP) MetaData : GDP per capita, US$, constant prices, reference year 2005”, National Accounts OECD Statistics Database, accessed on 14 November 2013, http://stats.oecd.org/
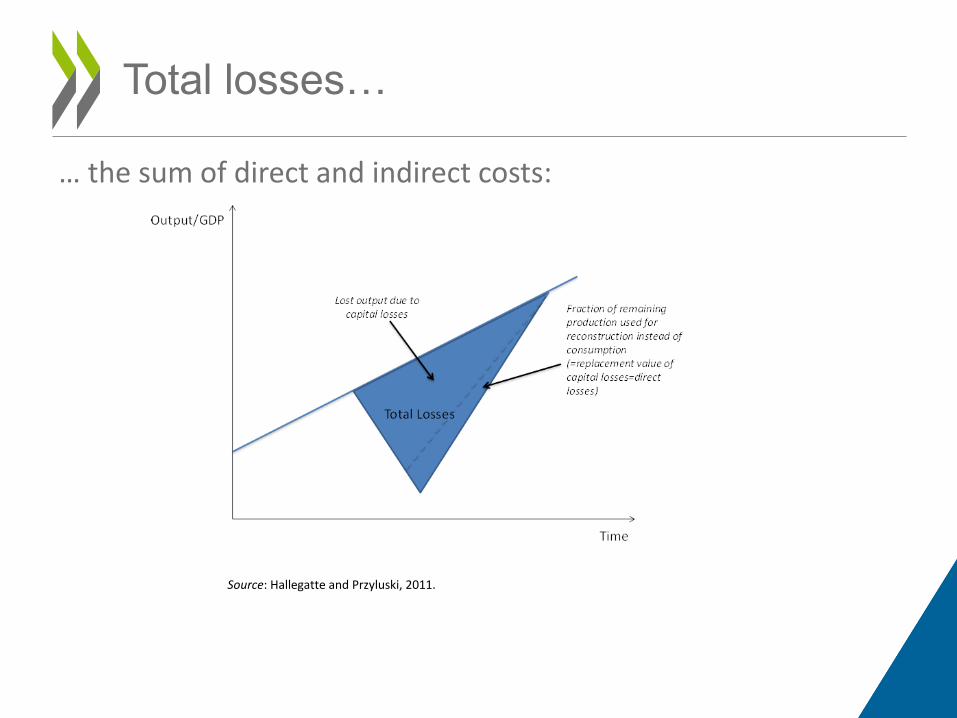
Total losses…
… the sum of direct and indirect costs:
Source: Hallegatte and Przyluski, 2011.
• None contain all cost categories, but efforts underway to improve existing methods (notably EU, CRED):
• A number of international databases exist, but they differ: – In the hazards they include
– In the geographical coverage
– In the variables collected
– In the way economic losses are calculated
• Most common databases used are: – EM-DAT
– DesInventar
– Swiss Re‘s SiGMA and Munich Re‘s NatcatSERVICE
Currently available INTERNATIONAL
data on disaster losses
International loss data bases:
commonalities and differences
Year Event EM-DAT Des-Inventar
NOAA earthquake database or
Storm Events database
Dartmouth Flood
Observatory
US Sheldus
Swiss Re explorer
Munich ReError!
Reference
source not
found.
2005 Hurricane
Katrina
1 833 Does not
apply
24Error! Reference
source not found.
1 053 875 1 836 1 322
2010 Chile
Earthquake
562 675 521 Does not apply Does not
apply
562 520
2010 Haiti
Earthquake
222 570 222 521 316 000 Does not apply Does not
apply
222 570 222 570
2011 Great East
Japan
Earthquake
19 846 Does not
apply
No estimate Does not apply Does not
apply
18 520 15 880
2012 Hurricane
Sandy
54 Does not
apply
68Error! Reference
source not found.
65 No
estimate
237 210Error!
Reference source
not found.
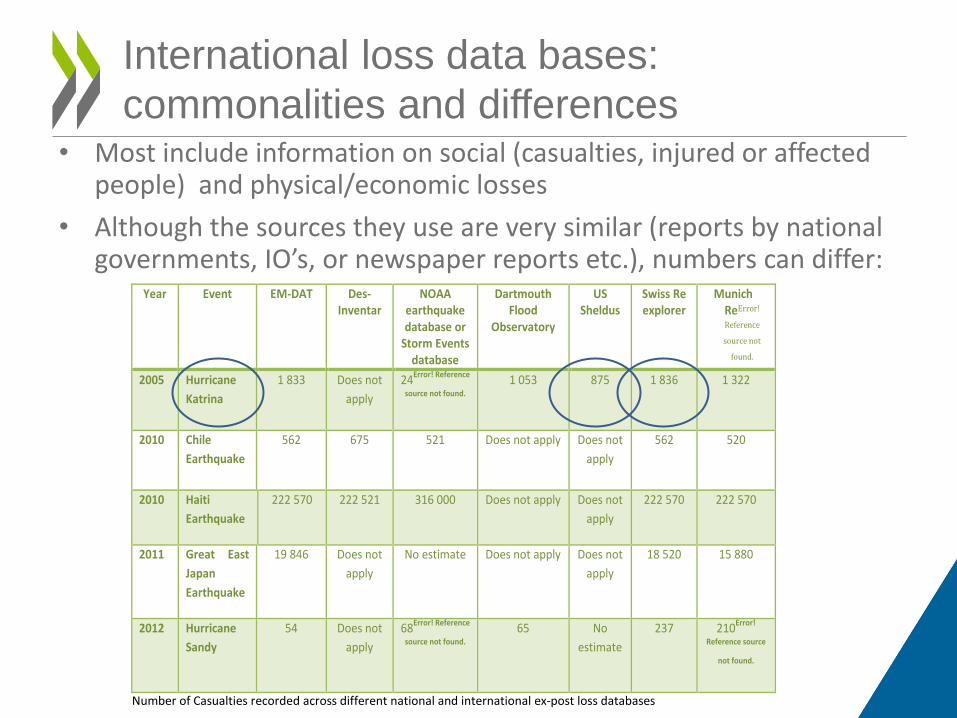
• Most include information on social (casualties, injured or affected people) and physical/economic losses
• Although the sources they use are very similar (reports by national governments, IO’s, or newspaper reports etc.), numbers can differ:
Number of Casualties recorded across different national and international ex-post loss databases
Economic losses (in USD billion) recorded in:
International databases Other national or hazard-specific databases
Name of
database/Event
EM-DAT
sigma NatCatService National Oceanic
and Atmospheric
Administration
(NOAA)
Dartmouth
Flood
Observatory
US Sheldus
Chile
Earthquake,
2010
30 33.28 (out of
which insured:
8.88)
30(out of which
Insured: 8)
30 Does not
apply
Does not apply
Hurricane
Sandy, 2012
50 73.78 (out of
which
insured:36.89)
65 (out of which
insured:30 )
Property damage:
24.91
No estimate No estimate
Hurricane
Katrina, 2005
125 173.44 (out of
which
insured:80.37)
125 (out of which
Insured: 62.2)
Property
damage:42.53;
crop damage: 1.93
60 Property
damage:74.27;
crop
damage:2.12
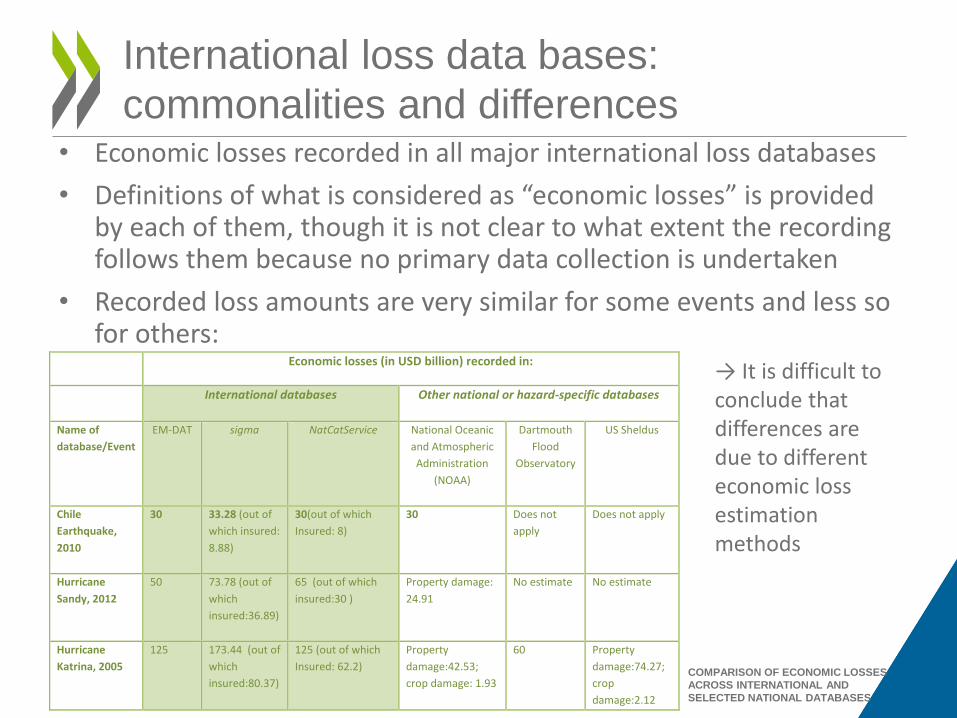
International loss data bases:
commonalities and differences • Economic losses recorded in all major international loss databases
• Definitions of what is considered as “economic losses” is provided by each of them, though it is not clear to what extent the recording follows them because no primary data collection is undertaken
• Recorded loss amounts are very similar for some events and less so for others:
→ It is difficult to conclude that differences are due to different economic loss estimation methods
COMPARISON OF ECONOMIC LOSSES
ACROSS INTERNATIONAL AND
SELECTED NATIONAL DATABASES
National loss data bases
• Not consistently available across OECD members (OECD DAF survey for details); sample countries used for this work:
– Japan, Australia, Canada, Italy, Slovenia, United States
• Variables included relatively similar (casualties, insurance costs, property losses, damages to crops or livestock)
• Economic loss estimations only recorded by half
• Recordings are more consistent in national compared to international databases (systematic questionnaires used etc.)
• Differences in governance:
– E.g. Slovenia organised centrally
– E.g. Italy different institutions for different hazard – no single multi-hazard loss database
• Some countries have exhaustive loss recordings for specific hazards, e.g. Japan for floods
– Process similar to Slovenia
– Distinguishes public and private losses
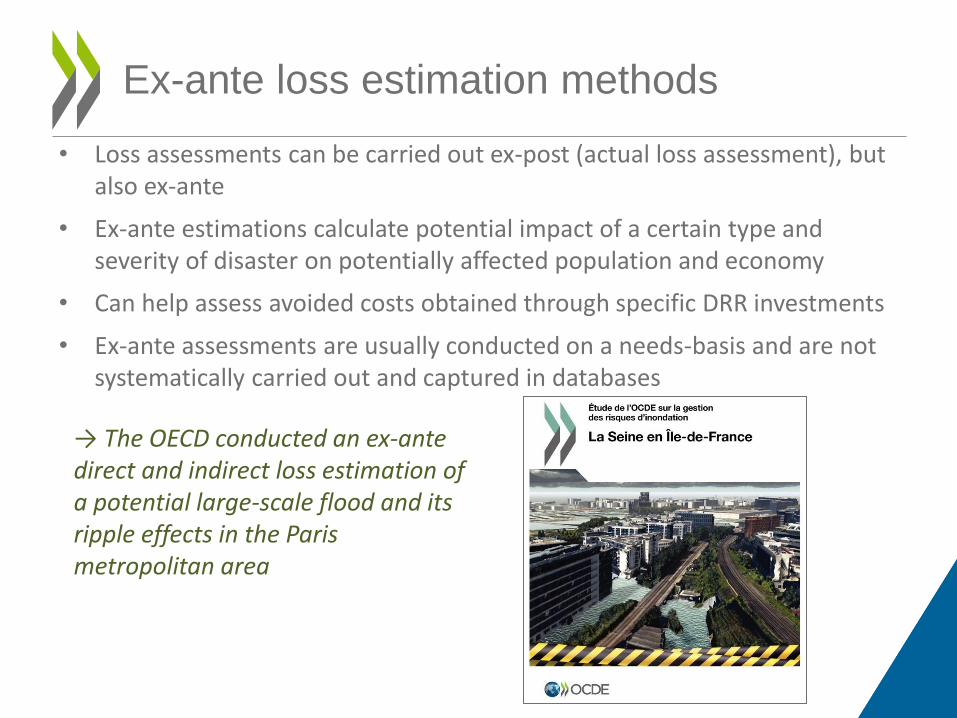
Ex-ante loss estimation methods
• Loss assessments can be carried out ex-post (actual loss assessment), but also ex-ante
• Ex-ante estimations calculate potential impact of a certain type and severity of disaster on potentially affected population and economy
• Can help assess avoided costs obtained through specific DRR investments
• Ex-ante assessments are usually conducted on a needs-basis and are not systematically carried out and captured in databases
→ The OECD conducted an ex-ante direct and indirect loss estimation of a potential large-scale flood and its ripple effects in the Paris metropolitan area
Assessing public (and private)
expenditure for DRM
Challenges to collect such information within and across countries: Budgeting processes differ across and within countries depending on
political, fiscal or federal system
Budgeting processes can be transparent and open and traceable for anyone interested, or decided behind closed doors
Little academic guidance available to carry out PE reviews
Sectoral PE reviews relatively easy to obtain, but establishing this for the same sector across countries more challenging
Assessing public (and private)
expenditure for DRM
With regard to risk management some additional challenges: In most countries no central unit responsible for co-ordinating risk
reduction activities
Risk-related activities entail cross-sectoral expenditure items usually not thematically reported in public accounts - may form part of public spending in infrastructure, environment, planning sectors etc.
Each sector may have its way of distinguishing hazards and types investment (e.g. prevention, preparedness, rehabilitation).
Expenditure may be “embedded”, i.e. expenditure for a project may only partly pertain to risk reduction.
Assessing public (and private)
expenditure for DRM → Challenge lies in first identifying disaster-related expenditure items in each
sector and categorise them broadly;
→ Based on this, comparable categories across sectors can be established to
aggregate specific expenditure categories across sectors, which can in turn
build the basis for a comparative framework across countries.
→ Retrieving private DRM spending also a challenge: information sits within
businesses and households – difficult to obtain systematically and over time
→ Outcome will be an approximation: establishing broad categories, based
on appropriate levels of aggregation and meaningful classifications of DRR
expenditures
Assessing public (and private) expenditure for DRM –
what is the state of the art in OECD countries?
Reviews that exist are result of specific project to retrieve DRM expenditure information from national accounts and sectoral budgets
Usually one-off efforts (although some include historical data)
Some focus on distinguishing expenditure along the DRM cycle (e.g. preparedness vs. response spending), others gather information on specific hazards
A harmonised approach is needed – OECD could be useful vehicle for inciting such data collection and building an international data repository
With this work OECD does not seek to change how public accounts provide DRM expenditure information, the objective is to find a way to obtain such information from governments in a comparative way on a continuous basis
Towards an OECD framework for
assessing public expenditure for risk
management
Towards an OECD framework for assessing public
expenditure for risk management
Based on the review of existing national efforts to obtain DRM expenditure data it is suggested:
To proceed along similar lines of developing a questionnaire and conduct expert interviews in complement (as opposed to relying on public accounts for this)
To obtain expenditure information by :
phase of DRM cycle so as to establish ex-ante versus ex-post DRM expenditure,
by level of government and hazard type
Towards an OECD framework for assessing public
expenditure for risk management
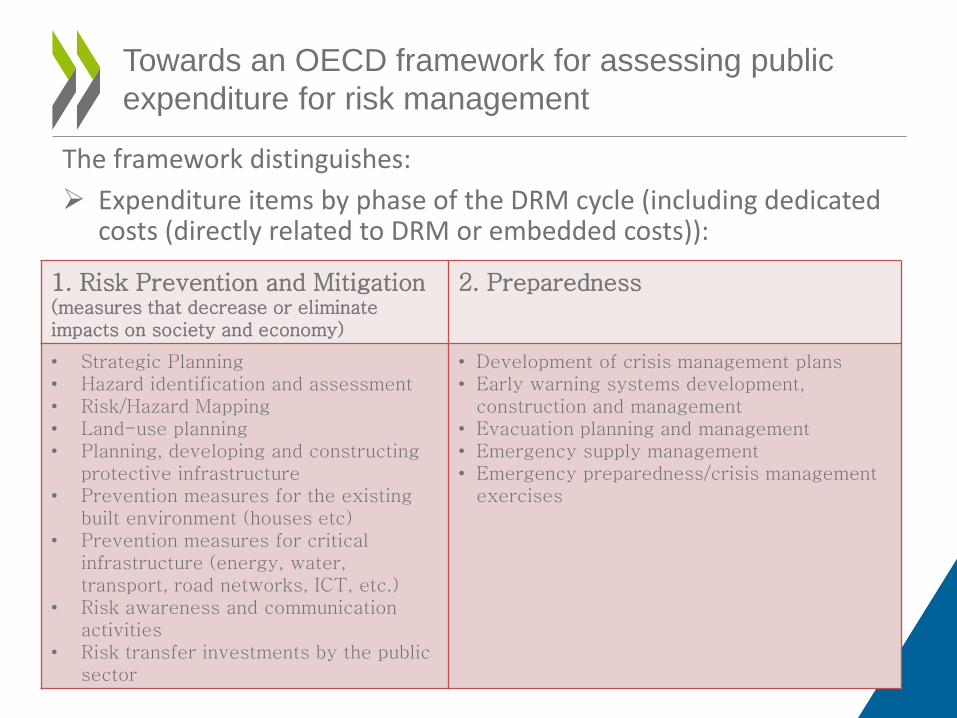
1. Risk Prevention and Mitigation (measures that decrease or eliminate impacts on society and economy)
2. Preparedness
• Strategic Planning • Hazard identification and assessment • Risk/Hazard Mapping • Land-use planning • Planning, developing and constructing
protective infrastructure • Prevention measures for the existing
built environment (houses etc) • Prevention measures for critical
infrastructure (energy, water, transport, road networks, ICT, etc.)
• Risk awareness and communication activities
• Risk transfer investments by the public sector
• Development of crisis management plans • Early warning systems development,
construction and management • Evacuation planning and management • Emergency supply management • Emergency preparedness/crisis management
exercises
The framework distinguishes:
Expenditure items by phase of the DRM cycle (including dedicated costs (directly related to DRM or embedded costs)):
Towards an OECD framework for assessing public
expenditure for risk management
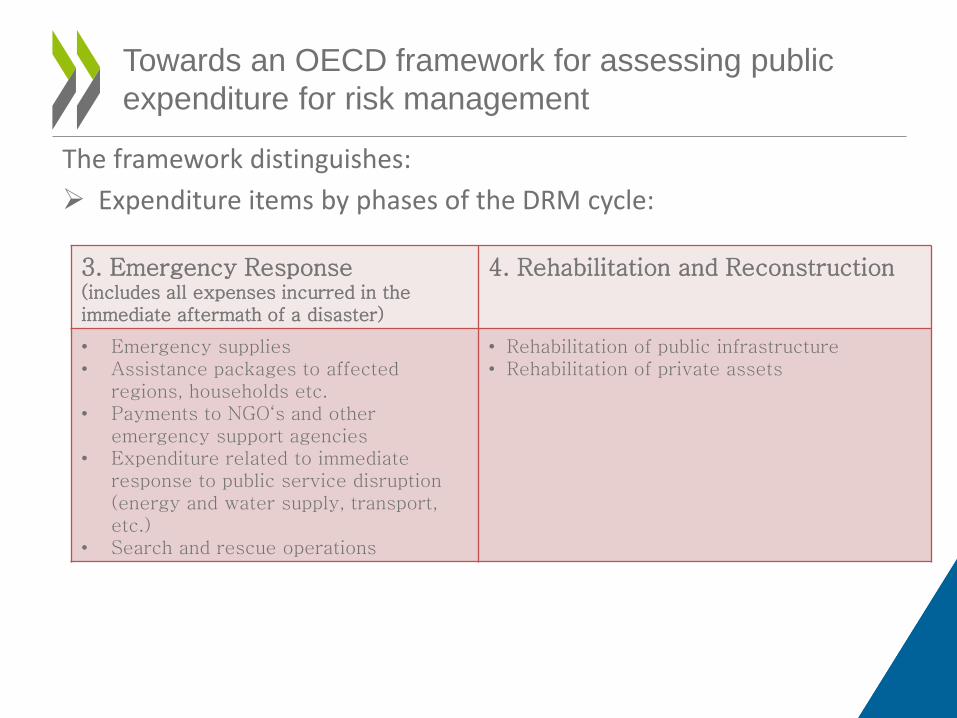
3. Emergency Response (includes all expenses incurred in the immediate aftermath of a disaster)
4. Rehabilitation and Reconstruction
• Emergency supplies • Assistance packages to affected
regions, households etc. • Payments to NGO‘s and other
emergency support agencies • Expenditure related to immediate
response to public service disruption (energy and water supply, transport, etc.)
• Search and rescue operations
• Rehabilitation of public infrastructure • Rehabilitation of private assets
The framework distinguishes:
Expenditure items by phases of the DRM cycle:
Towards an OECD framework for assessing public
expenditure for risk management
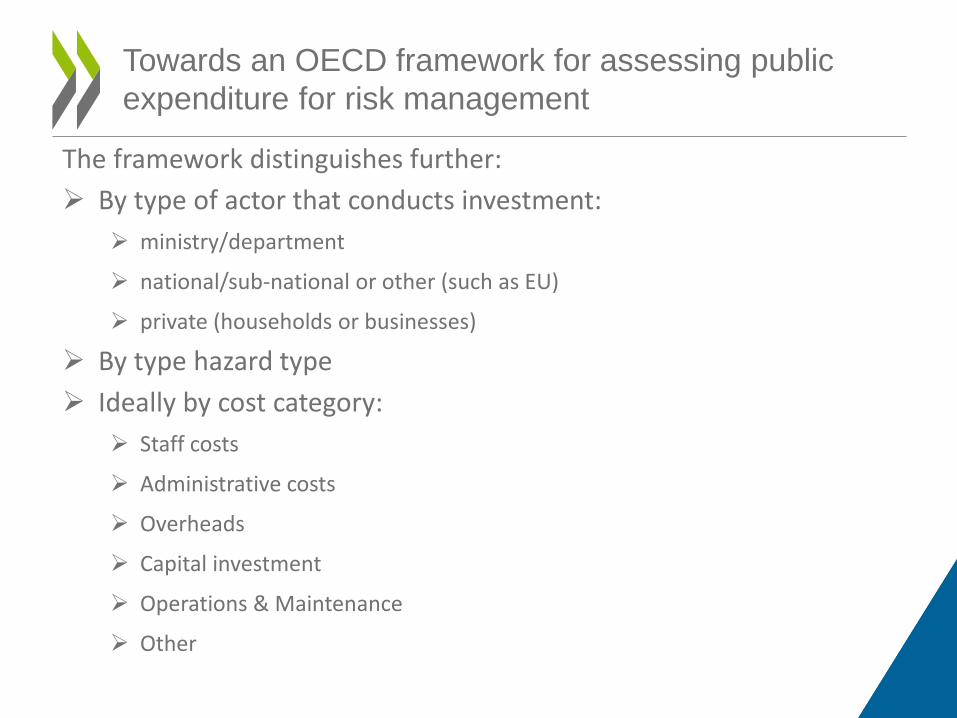
The framework distinguishes further:
By type of actor that conducts investment:
ministry/department
national/sub-national or other (such as EU)
private (households or businesses)
By type hazard type
Ideally by cost category:
Staff costs
Administrative costs
Overheads
Capital investment
Operations & Maintenance
Other
Towards an OECD framework for assessing public
expenditure for risk management
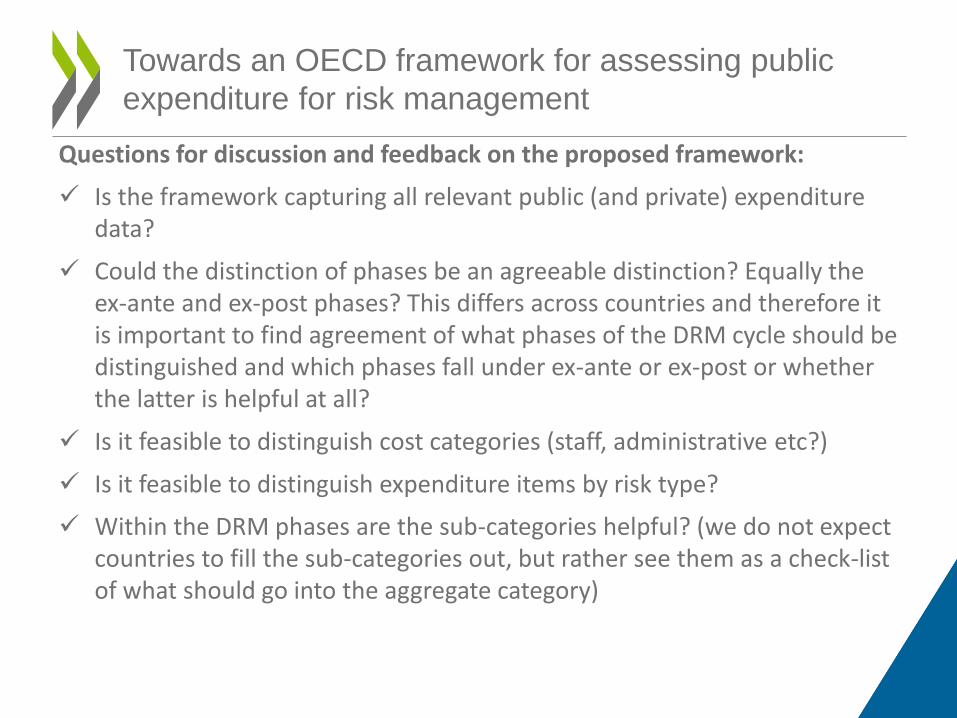
Questions for discussion and feedback on the proposed framework:
Is the framework capturing all relevant public (and private) expenditure data?
Could the distinction of phases be an agreeable distinction? Equally the ex-ante and ex-post phases? This differs across countries and therefore it is important to find agreement of what phases of the DRM cycle should be distinguished and which phases fall under ex-ante or ex-post or whether the latter is helpful at all?
Is it feasible to distinguish cost categories (staff, administrative etc?)
Is it feasible to distinguish expenditure items by risk type?
Within the DRM phases are the sub-categories helpful? (we do not expect countries to fill the sub-categories out, but rather see them as a check-list of what should go into the aggregate category)

For further information please contact: [email protected]


