
i
IMPROVING POWER LOSSES USING DISTIBUTED GENERATION
QUSAY A. SALIH
A thesis submitted in fulfillment of the requirement for the award of the Master’s
Degree of Electrical Engineering
Faculty of Electrical and Electronic Engineering
University Tun Hussein Onn Malaysia
June 2015
v
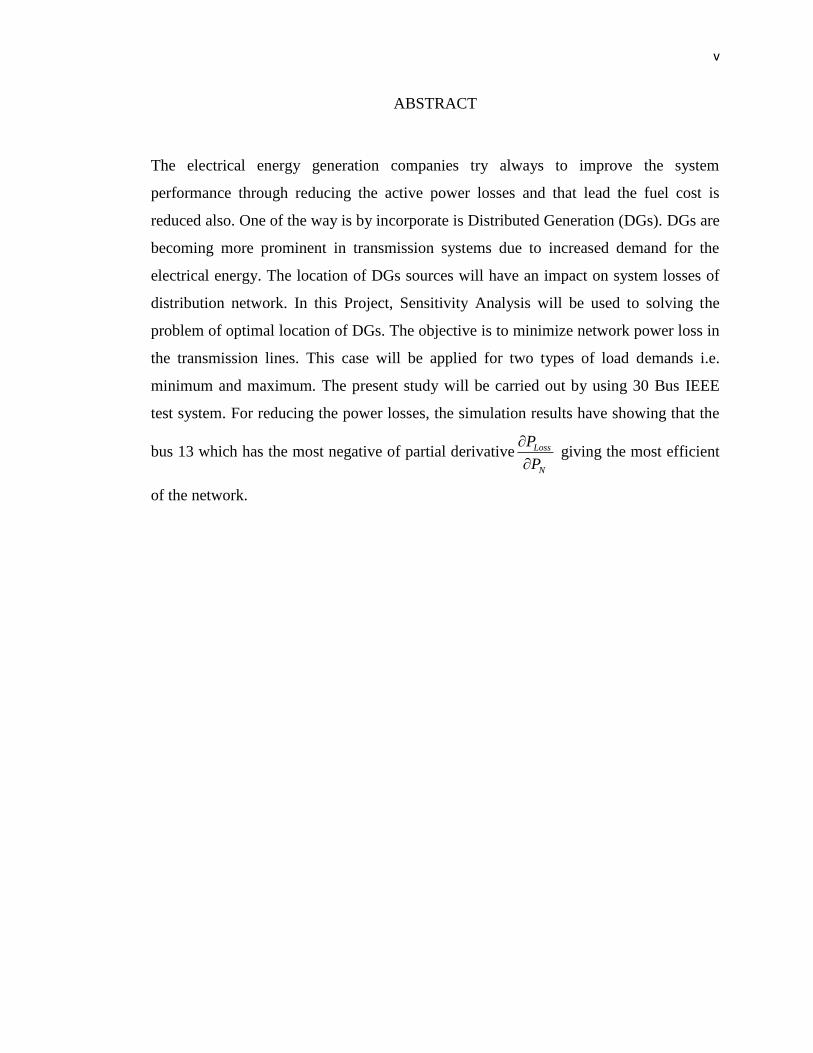
ABSTRACT
The electrical energy generation companies try always to improve the system
performance through reducing the active power losses and that lead the fuel cost is
reduced also. One of the way is by incorporate is Distributed Generation (DGs). DGs are
becoming more prominent in transmission systems due to increased demand for the
electrical energy. The location of DGs sources will have an impact on system losses of
distribution network. In this Project, Sensitivity Analysis will be used to solving the
problem of optimal location of DGs. The objective is to minimize network power loss in
the transmission lines. This case will be applied for two types of load demands i.e.
minimum and maximum. The present study will be carried out by using 30 Bus IEEE
test system. For reducing the power losses, the simulation results have showing that the
bus 13 which has the most negative of partial derivative Loss
N
P
P
giving the most efficient
of the network.

vi
ABSTRAK
Syarikat-syarikat penjanaan tenaga elektrik sentiasa berusaha meningkatkan keupayaan system
dengan mengurangkan kehilangan kuasa aktif dimana ianya boleh mengurangkan kos bahan api.
Salah satu cara adalah dengan menggabungan sistem yang ada dengan pengagih
penjana.Pengagih penjana menjadi lebih menonjol berbanding dengan sistem penghantaran
disebabkan peningkatan permintaan tenaga elektrik. Kedudukan atau lokasi pengagih penjana
akan memberi kesan terhadap kehilangan/kerugian di sistem pengagihan. Di dalam projek ini,
sensitif analisis digunakan untuk menyelesaikan masalah lokasi optimum bagi sesebuah
pengagih penjana. Objektif utama adalah untuk meminimumkan kehilangan kuasa rangkaian
elektrik di sistem penghantaran. Untuk kes ini, dua jenis beban digunakan iaitu beban minimum
dan beban maksimum. Kajian ini dijalankan dengan sistem ujiam IEEE 30 Bus. Bagi
mengurangkan kehilangan sistem, hasil simulasi dapat menunjukkan bahawa sistem mempunyai
terbitan separa Loss
N
P
P
yang lebih negative di bus ke 13 dimana ianya memberikan keputusan
paling efisian kepada rangkain elektrik.

vii
vii
CONTENTS
TITLE i
DECLARATION ii
DEDICATION iii
ACKNOWLEDGEMENT iv
ABSTRACT v
ABSTRAK vi
CONTENT vii
LIST OF TABLE x
LIST OF FIGURES xi
CHAPTER 1 INTRODUCTION 1
1.1 Introduction 1
1.2 Problem statement 2

viii
1.3 Objective of Study 3
1.4 Study Scope 3
1.5 Significance of Study 3
1.6 Organization of Study 3
CHAPTER 2 LITERATURE REVIEW 4
2.1 Introduction 3
2.2 Losses in Transmission Lines 4
2.3 Distributed Generation (DGs) 5
2.4 Overview of Distributed Generation Technologies 7
2.4.1 Non-renewable DG Sources 9
2.4.2 Renewable DGs Sources 9
2.4.3 Energy Storage Technologies 10
2.5 Previous Works 10
CHAPTER 3 METHODOLOGY 16
3.1 Introduction 16
3.2 Calculating the Losses of Real Power 16
3.3 Mathematical Analysis of the Problem 17
ix
3.4 Test Case System 21
3.5 Flow Chart Of Design 21
CHAPTER 4 RESULTS AND ANALYSIS 25
4.1 Introduction 25
4.2. Result and Analysis 25
4.2.1 Adding DG to bus 13 and 3 27
4.2.2 Adding a Generator Unit to Each Bus 32
4.2.3 Using Fixed Values for the Distributed 35
Generator Units
CHAPTER 5 CONCLUSIONS AND RECOMMENDATIONS 43
5.1 Introduction 43
5.2 Conclusion 43
5.3 Future Work 44
REFERENCES 45
APPENDIX A 47
APPENDIX B 50

x
LIST OF TABLE
2.1 Previous Studies 13
4.1 Bus loads in a descending order according to partial 26
derivative at minimum load
4.2 Bus loads in a descending order according to partial 26
derivative at maximum load
4.3 Power losses and power losses reduction at minimum 33
load and (1 MW DG)
4.4 Power losses and power losses reduction at maximum 34
load and (1 MW DG)
4.5 Partial derivative to DGs value injection in 36
(13-2-11-24-19-25-18) buses at minimum load
4.6 Partial derivative to DGs value injection in 37
(10-16-9-6-4-12-3) buses at minimum load
4.7 Partial derivative to DGs value injection in 40
(13-2-11-24-19-25-18) buses at maximum load
4.8 Partial derivative to DGs value injection in 41
(10-16-9-6-4-12-3) buses at maximum load
xi
LIST OF FIGURES
2.1 Criteria for classification of DGs 7
2.2 Distributed generation technologies 8
3.1 Flow chart of power flow calculation 21
3.2 Flow chart of find sen matrix 23
4.1 Variation of Ploss with the real power injection in bus 13 27
at minimum load
4.2 Variation of Ploss with the real power injection in bus 3 28
at minimum load
4.3 Variation Ploss with sensitivity value for bus 13 minimum load 29
4.4 Variation Ploss with sensitivity value for bus 3 minimum load 29
4.5 Variation Ploss with sensitivity value for bus 13 maximum load 30
4.6 Variation Ploss with sensitivity value for bus 3 maximum load 30
4.7 Variation Ploss s with sensitivity value for bus 13 maximum load 31
4.8 Variation Ploss with sensitivity value for bus 3 maximum load 32
4.9 Variation of Ploss with real power injection in 36
(13-2-11-24-19-25-19) buses at minimum load
4.10 Variation of Ploss with real power injection in 37
(10-16-9-6-4-12-3) buses at minimum load

xii
4.11 Ploss percentage reduction with real power injection 38
in (13-2-11-24-19-25-18) buses at minimum
4.12 Ploss percentage reduction with real power injection 39
in (10-16-9-6-4-12-3) buses at minimum
4.13 Variation of Ploss with real power injected in 39
(13-2-11-24-19-25-19) buses at minimum load
4.14 Variation of Ploss with real power injected in 40
(10-16-9-6-4-12-3) buses at minimum load
4.15 Variation of Ploss with real power injected in 41
(13-2-11-24-19-25-19) buses at maximum load
4.16 Variation of Ploss with real power injected in 42
(10-16-9-6-4-12-3) buses at maximum load

1
CHAPTER 1
INTRODUCTION
1.1 Introduction
The importance of electric power in today’s world cannot be overemphasized, for it
is the key energy source for industrial, commercial and domestic activities. Its
availability in the right quantity is essential to advancement of civilization. Electrical
energy produced at through the use of transmission lines run from one place to
another. As a result of the physical properties of the transmission medium, some of
the transmitted powers are lost to the surroundings. The overall effect of power
losses on the system is a reduction in the quantity of power available to the
consumers. As such, adequate measures must be put in place to reduce power losses
to the minimum [1].
Ideally, losses in an electric system should be around 3 to 6%. In developed
countries, it is not greater than 10%, however, in developing countries, the
percentage of active power losses is around 20%, therefore, utilities in the electric
sector are currently interested in reducing it in order to be more competitive, since
the electricity prices in deregulated markets are related to the system losses.
In India, collective of all states, in 2008 The technical and non-technical losses
are accounted as 23% of the total input energy [2].
Active power losses in the transmission are about 4–8% of the total active power
generated as example for that in Brazil the cost of the loss is half a billion U.S.
dollars a year [3].
Recently, Distributed Generations (DGs) have received great attention in power
systems as a solution to environmental and economical challenges caused by

2
conventional power plants. DGs are defined as electric power generations directly
connected to near the loads or in the distribution networks, also the DGs range from
a few kWs to a few MWs and DGs have many types like (wind turbines,
photovoltaic, full-cells, biomass, micro turbines, etc.) [4].
According to CIGRE report, the contribution of DGs in Denmark and the
Netherlands has reached 37% and 40%, respectively, as a result of liberalization of
power market in Europe [5].
In general because of the fundamental importance of these sources (renewable
energy) the international demand for energy has been growing progressively. This
demand, which is expected to increase by about 30% for 2040 as compared to 2010,
has been driven by the demographic and economic growth, mainly related to
emerging economies, especially in Asia [6].
1.2 Problem Statement
The power system (PS) losses in transmission lines systems vary with numerous
factors depending on system configuration, such as level of losses through
transmission and distribution lines, transformers, capacitors, insulators, etc. Power
losses can be divided into two categories, real power loss and reactive power loss. The
resistance of lines causes the real power loss, while reactive power loss is produced
due to the reactive elements. Normally, the real power loss draws more attention for
the utilities, as it reduces the efficiency of transmitting energy to customers.
Many research has been done to reduce active power loss, however with this
induction DGs in power system grid, these losses can be important to same extant,
moreover increased fuel cost and the need to develop environmentally friendly
technologies that can be a remedy to mitigate the emission of greenhouse gases and
worldwide climate changes.
1.3 Objective of Study
The main objective of the study is to improving real power losses using DGs, the
objective of this project can be broken down into:
i. To investigate the power flow and real power losses for power system.
ii. To measure Sensitivity Analysis of real power losses.

3
iii. To mitigate the real power losses.
1.4 Study Scope
Scope of this study can be broken down into several subtasks:
i. Developing of methods for calculating the real power losses in the power
system with the objective function of loss.
ii. Developing of methods for evaluating optimal location of DGs.
iii. The main software used to measure the sensitivity and analyze the results is
Matlab program.
iv. To test the developed program on (IEEE 30-Busbar).
1.5 Significance of Study
It is expected to attract to get results for reducing real power losses by using DGs
units. Better understanding of the flow of electric power on transmission lines
investigate the power losses along transmission lines. The help of computer software
gives an insight into the major problems on electric power transmission. The
minimization of losses on electric power transmission lines using an optimization
technique provides a solution in a compact form, to the major problem encountered
in power transmission.
1.6 Organization of Study
This Project study is organized is six chapters. Chapter 1 is an introduction to this
study, which includes a statement of the problem, background study, objective of
study and project scope. Chapter 2 is covers about the literature review. Chapter 3 is
discussing on methods and procedures used. Chapter 4 contains the results and
analysis of the obtained results summarizes. Fnally Chapter 5 contains the conclusion
and future works.

4
CHAPTER 2
LITERATURES REVIEW
2.1 Introduction
Energy is a basic necessity for the economic development of a nation. There are
different forms of energy, but the most important form is the electrical energy. A
modern and civilized society is so much dependent on the use of electrical energy.
Activities relating to the generation, transmission and distribution of electrical energy
have to be given the highest priority in the national planning process of any nation
because of the importance of electrical energy to the economic and social
development of the society. In fact, the greater of per capital consumption of
electrical energy in a country, the higher the standard of living of its people.
Therefore, the advancement of a country is measured in terms of its per capital
consumption of electrical energy. power plants’ planning in a way to meet the power
network load demand is one of the most important and essential issues in power
systems [7].
In general, transmission lines have two primary objectives: the first is to transmit
electrical energy from the generators to the load within single utility, and the second
is to provide paths for electrical energy centres a to flow between utilities [8].
Therefore, computation and reduction of transmission losses in these power networks
are of great concern to engineers. a lot of research works have been carried out on the
above listed aspects [7].
2.2 Losses in Transmission lines
From the physical principles of electric power transmission, when a conductor is
subjected to electric power, electric current flows in the medium. Resistance to the

5
flow produces heat (thermal energy) which is dissipated to the surroundings. This
power loss is referred to as Ohmic loss [9]. Ohmic loss otherwise known as line loss
on power transmission occurs as a result of resistance of conductors against current
flow. The effective resistance of the transmission line is a function of the current on
the line. This is because of the heat produced in the conductor resulting from current
flow, and this leads to a temperature rise in the conductor’s. This rise in temperature
increases the resistance of the conductor and consequently the losses on the line [10].
The power losses could take off a sizeable portion of the transmitted power since
transmission lines usually span a long distance, sometimes several hundred
kilometres [9]
The resistance R of a line conductor having resistivity ρ (Ω/m), length l (m) and a
(m2) area of cross section is given by:
/R l a
One way to reduce use power losses to reduce the current carrying in
transmission lines, but this way is limited because the high cost of HV transformers,
however, there is another way by using Distributed Generation (DGs).Usually
located near load centres.in this case not only transmission losses are kept low but
also existing transmission capacity is not occupied [11].
2.3 Distributed Generation (DGs)
The term (DGs) otherwise known as embedded generation (EG) in some quarters, is
generally defined as any source of electric energy of limited capacity that is directly
connected to the existing network on the customer site of the meter. The existing
network could be a distribution network or a sub-transmission network. At present,
there is no consensus on what exactly the rating of DGs as well as the voltage level at
the point of common coupling (PCC) to the grid should be. The definitions of these
two parameters somewhat vary from country to country and from one research group
to another. For example, while Portugal pegs the capacity limit of DGs to 10 MW
that can be connected at any voltage level, Austria defines DGs as an electric energy
source of up to 10 MW to be connected at the MV level. In France, DGs is defined in
capacity as greater than 40 MW and connected at 225 kV voltage level. Spain allows
the DGs capacity to go up to 50% of the feeder capacity .So far, Australia has been

6
able to practically install the largest size of 130 MW DGs at 132 kV on its power
grid, while Denmark allows the utility to decide the voltage level of connection for
DGs units ranging from less than 2 MW to greater than 50 MW. On the other hand,
the working group of CIGRE (International Council on Large Electric Systems)
defines DGs as a source of electric energy of maximum capacity of less than 50–100
MW . Although the capacity limit is not clearly stated for Germany, UK and The
Netherlands, the voltage levels at PCC are defined as up to 132 kV for UK, up to 110
kV for Germany and up to 150 kV for the Netherlands [12] .
Based on these varying capacity limits, in [13] suggested various classifications
of DGs based on their capacities as micro DGs of 1 W to less than 5 kW, small DGs
of 5 kW to less than 5 MW, medium DGs of 5 MW to less than 50 MW, and large
DGs of 50 MW to less than 300 MW. This classification is a welcome idea since it
encompasses all various definitions given by different groups/countries. There can be
various other criteria which can form the basis for defining DGs. Some of these are
shown in Figure 2.1.

7
Figure 2.1 criteria for classification of DGs
2.4 Overview of Distributed Generation Technologies
Traditionally, diesel generators were considered synonymous to distributed
generation due to their low cost and high reliability. However environmental issues
Supply of Active
Power Ancillary
Services
Transmission
Network Distribution
Network
Small
5kW-5MW Micro DG
1W-5KW
Medium DG
5-50MW Large DG
50-500MW
Renewable Non
Renewable
Purpose of
Interconnection
Capacity Point of DG
Interconnection DG
Technology
Ownership
Criteria for DG Definition
Utility
Owned
Independent
Power
Producer
Customer
Owned
Reserve
Requirement Reactive
Power System
Security Power
Quality Voltage
Regulation Frequency
Regulation

8
and high fuel cost associated with diesel generators has always been a cause of
concern. Over the years there has been a significant improvement in the development
of broad array of other DGs technologies.
The DGs technologies can be broadly classified as renewable energy based, non-
renewable energy and energy storage. Various DGs technologies are depicted in
Figure. 2.2.
Figure 2.1: Distributed generation technologies
Reciprocating
Engines
Gas Turbine
Combustion
Micro
Turbine
Small
Hydro
Micro
Hydro
Solar PV
Solar
Thermal
Tidal
Bio-mass
Geo-Thermal
Solar
Wind
Hydro
Thermal
Chemical
Electrical
Mechanical
Electro-
Chemical
Pumped-Hydro
CAES/Flywheel
Double-layer
Capacitor
SMES
Hydrogen
Electrolyser/
Fuel cell/SNG
Sensible heat storage/
Molten salt/
A-CAES
Seconadry Batteries
(Lead asid/NiCd/
NiMh/Li/NaS)
Flow Batteries
Distributed Generation Technology
Storage Renewable Non-Renewable

9
2.4.1 Non-renewable DGs Sources
The most popular DGs technology based on non-renewable sources is diesel
generator which belongs to the category of reciprocating engines. Diesel generators
are quite suitable for autonomous application. They can be started and shut down
almost spontaneously owing to low inertia thus making them a viable choice for back
up applications. Technological developments over the last decade have given way to
two new fossil fuel based technologies viz. micro turbines and fuel cell. Micro
turbines are mechanically simple, single shaft, high speed devices. Natural gas is the
primary fuel used in micro turbines although biogas is also being pursued. It is a
developing technology wherein an increase in efficiency and decline in operating
cost is expected. Micro turbines are not very environment friendly owing to harmful
emissions. Nevertheless, the emissions from natural gas are relatively lower in
comparison with that of other fossil fuels. Fuel cells are well suited for distributed
generation applications. Fuel cells are fast gaining popularity since they are efficient
and environment friendly [14].
2.4.2 Renewable DGs Sources
In addition to being replenishable, the chief reason for popularity of renewable
energy sources (RES) is its availability worldwide over wide geographical areas.
This is quite unlike conventional resources (oil, natural gas) which are concentrated
in specific countries. The RES comprise of photovoltaic (PV), wind, hydro, geo-
thermal, tidal and bio fuel. Recent years have seen a significant increase in
deployment of RES based DGs to grid. This is mainly attributed to two reasons:
1-the costs associated with RES based generation and storage is now on declining
trend thus giving way to their large scale deployment on the grid.
2- the traditional architecture of grid being based entirely on central generation is
weakening, giving way to a modular architecture comprising of interconnected
microgrids with distributed generation.

10
2.4.2 Energy Storage Technologies
The power from RES such as PV and wind is dependent on meteorological
conditions prevailing at that moment. Electrical energy storage can bridge the gap
between power from these sources and load by supplying power during the periods
of unavailability as well as storing the excess power during high periods of wind and
sun. A wide range of storage technologies based on mechanical, chemical and
physical principle are available.
2.5 Previous works
Researchers have developed a mathematical model to determine power losses over
typical transmission lines [1], as the resultant effect of ohmic and corona power
losses, the flow of current and voltage along the lines are taking into account. For
minimization of power losses on transmission lines, the classical optimization
techniques aided the formulation of an optimal strategy.
Particle Swarm Optimization (PSO) has used for optimal placement of Distributed
Generation (DG) and it is efficiently minimizing the total real power loss with
transmission line limits and constraints satisfaction [15]. The methodology used is
accurate and fast in determining the sizes and locations. The methodology is tested
on a 26 bus system. By installing DG at all potential locations, the total power loss of
the system has been reduced drastically with system voltage profile improvement.
To enhance voltage stability and to reduce network losses simultaneously,
researchers have used a Bifurcation method for finding the locating and sizing of
DGs [4]. First, vulnerable buses from voltage stability point of view are determined
using bifurcation analysis as the best locations to install DGs. Number of DGs is so
chosen that system voltage profile is brought into the given permissible voltage
security limits. Then, the global optimal size of DGs is determined employing the
dynamic programming search method.
Authors in have shown that [16], although it is considered that DG reduces losses
and improves system voltage profile is not always true. They have presented a GA-
IPSO based approach which utilizes combined sensitivity factor analogy to optimally
locate and size a multi-type DG in IEEE 57-bus test system with the purpose of
reducing power losses and improving the voltage profile. The multi-type DG can

11
operate as; type 1 DG (DG generating real power only), type 2 DG (DG generating
both real and active power) and type 3 DG (DGs generating real power and
absorbing reactive power). It further shown that though the system losses reduced
and the voltage profile improved with the location of the first DG, as the number of
DGs increases this is not the case. It reached a point where any further increase in
number of DGs in the network results to an increased in power losses and a distortion
in voltage profile.
In [17], researchers have investigated the problem of multiple DGs placement to
attain a high loss drop in large-scale primary distribution systems. An Improved
Analytical (IA) method is proposed. This method is based on IA expressions to
calculate the optimal size of four different DG types and a methodology to identify
the best location for DG allocation. A technique to get the optimal power factor is
presented for DG capable of delivering real and reactive power. Moreover, Loss
Sensitivity Factor (LSF) and Exhaustive Load Flow (ELF) methods are also
introduced. Results show that IA method is effective as compared with LSF and ELF
solutions.
New hybrid of OPF and JFPSO technique has used [18]. These methods only need a
predefined number of DGs to connect and it offers the optimal location and size of
DGs simultaneously. This method, hybrid of optimal power flow (OPF) and JFPSO
technique, finds the best combination of sites within a distribution networks. Among
a large number of combinations for a given network, it agrees searching the best
locations to connect a number of DG units. The simulation results have shown that
this method allows reduced losses and costs.
A local loss reduction method based on injected power sensitivity has been proposed
in [19]. In order to meet the requirements of safety and economic, this method can
reduced the loss in local lines quickly and effectively by adjusting the injected
active power of generator nodes and the injected reactive power of reactive power
compensation nodes. First, this method recognized the loss reduction rate model
which can transform the line loss rate reducing problem into the problem of adjusting
the power injection. Then, it determined the generator nodes and the reactive power
compensation nodes which need to adjust during the process of the loss reduction by
sensitivity calculation. Lastly, it calculated the tuning of injected power based on the
principle of equal and opposite tuning in pairs.

12
Optimal Proposed Approach (OPA) using genetic algorithm (GA) has been presented
to determine the optimal sitting and sizing of DG with multi-system constraints to
achieve a single or multi-objectives [20]. The Linear Programming (LP) is used not
only to confirm the optimization results attained by GA but also to explore the
influences of varying ratings and locations of DG on the objective functions. To test
the ability of the OPA, a real section of the West Delta sub-transmission network is
used. The results reveal that the proper sitting and sizing of DG are important to
improve the voltage profile, increase the spinning reserve, reduce the power flows in
critical lines and reduce the system power losses.
By using a sensitivity-based method, the researchers in [21] assesses the influence of
DGs on the active and reactive power losses of the system. From one base case
power flow solution, it is possible to approximate the active and reactive power
losses for a new generator connected at any bus for any combination of active power
injection, and also for any operating power factor. The analytical method can be
easily to judge the effects of varying the location, generation level and operating
mode of the generators. Moreover, a numerical index is also suggested to quantify
the influence of multi-distributed generators on power losses. The method is tested
on a 70-bus distribution network. The simulations results are compared with those
gained by the repetitive power flow solutions in order to validate the results found by
the sensitivity-based method. Before it is connected to a power grid and to maintain
the stability and reliability of existing system effectively, optimal location and size of
the DG selection is an essential procedure. However, the systematic and key rule for
this issue is still a vulnerable question; a method to regulate the optimal locations of
multiple DGs is suggested by considering power loss [22]. Also, their optimal sizes
are determined by using the Kalman Filter (KF) algorithm.
To deal with this optimization problem, the researchers used KF algorithm was
applied when the optimal sizes of multiple DGs are selected, the computation efforts
might be significantly increased with many data samples from a large-scale power
system because the entire system must be analyzed for each data sample. The
suggested process based on the KF algorithm seized the only few samples.
Therefore, dramatically, it reduced the computational requirement during the
optimization procedure [22].

13
No.
`
year
Author
Title
Publication
Outcome
Tools
Remarks
journal Vol. No. PP Tools Technique
1 2014 Bamigbola
Mathematical
modeling of electric
power flow and the
minimization of
power losses on
transmission lines
Applied
Mathematics
and
Computation
24 01
214
-
221
Minimize real power
losses
Matlab
mathematical
model for
determining
power losses
The traditional optimization method is employed for
the minimization of power losses on transmission
lines, thus giving a solution which on implementation
is sure to yield the optimal operating strategy.
2 2013
Bhumkittip,e
t al
Optimal Placement
and Sizing of
Distributed
Generation
for Power Loss
Reduction using
Particle Swarm
Optimization
Energy
Procedia
43 01
307
-
317
power Loss
Reduction
Matlab
/Simulink
Particle Swarm
Optimization
Single DG placement is used to find the optimal DG
location and its size which corresponding to the
maximum loss reduction.
3 2013
Esmaili,et al
Optimal placement of
distributed
generations
considering voltage
stability and power
losses with observing
Applied
Energy
113 01
125
2-
126
0
Reduces power losses
Matlab
Separately
optimized
method
Installing more DGs does not always help decrease
power losses. Consequently, grid losses should be
observed in the placement of DG units.
Table 2.1 Previous Studies

14
voltage-related
constraints
No.`
year
Author
Title
Publication
Outcome
Tools
Remarks
journal VOL No PP Tools Technique
4
2013
Julius ,et al
Effects of Distributed
Generation penetration
on system
power losses and
voltage profiles
International
Journal of
Scientific and
Research
Publications
03
12
1-8
System loss reduction
Matlab
/Simulink
Genetic
Algorithm
The system power losses reduced with the
introduction on DGs into the network up to an
optimal number where any further DG inclusion
resulted to an increase in system power losses.
.
5
2013
Hung,
Duong ,et
al
Multiple distributed
generator placement in
primary distribution
networks for loss
reduction
Transactions
on industrial
Electronics,
IEEE
60
04
170
0
-
170
8
Power Loss
Reduction
An
improved
analytical
An improved
analytical (IA)
method
The operating power factor of DG units for
minimizing losses has been found to be closer to the
power factor of combined load of the respective
system. This could be a good guidance for operating
DG units that have the capability to deliver both real
and reactive power for minimizing losses
6
2012
GomezGo,
et al
Optimization of
distributed generation
systems using a new
discrete PSO and OPF
Electric
Power
Systems
Research
84
1
174
-
180
Optimal site and size
of distributed
generation
Matlab
/Simulink
hybrid method
This paper introduces a new hybrid method, which
employs discrete particle swarm optimization (PSO)
and optimal power flow (OPF) to overcome this
shortcoming.

15
No.`
year
Author
Title
Publication
Outcome
Tools
Remarks
Journal VOL No PP Tools Technique
7
2012
Jing Liu, et
al
A Local Loss
Reduction Method
Based on Injected
Power Sensitivity
Power and
Energy
Engineering
Conference
(APPEEC)
1-4
R
educe the loss
Matlab
Injected
Power Sensitivity
This paper shows the advance of this method, such as
small adjustment range, fast calculation speed,
obvious effect of local loss reduction.
8
2010
Abou El-
Ela, et al
Maximal optimal
benefits of distributed
generation using
genetic algorithms
Electric
Power
Systems
Research
80
07
869
-
877
reduce the system
power losses
Matlab
/Simulink
Genetic
Algorithm (GA).
The proposed approach has been applied efficiency to
subsets of DG benefits, which Are Voltage Profile
Improvement (VPI), spinning reserve increasing
(SRI), Power flow Reduction (PFR) And Line-Loss
Reduction (LLR).
9
2009
Ayres, et al
Evaluation of the
impact of distributed
generation on power
loses by using a
sensitivity-based
method
Power &
Energy
Society
General
Meeting
1-6
mpact of DGs on
power losses
Matlab
Sensitivity-Based
method
The effects of varying the location, generation level
and operating mode of the generators can be easily
assessed by using the analytical method. Moreover, a
numerical index to quantify the impact of multi-
distributed generators on power losses is also
proposed
10
2009
Lee, Soo-
Hyoung, et
al
Selection of optimal
location and size of
multiple distributed
generations by using
Kalman filter
algorithm
Power
Systems,
IEEE
Transactions
on
24
3
139
3-
140
0
Power loss
minimization
Matlab
/Simulink
Kalman filter
algorithm
The proposed procedure based on the Kalman filter
algorithm took the only few samples, and therefore
reduced the computational requirement dramatically
during the optimization process.

16
CHAPTER 3
METHODOLOGY
3.1 Introduction
The world is witnessing a transition from its present centralized generation paradigm
to a future increased share of DGs. Integration of RES based distributed generators is
seen as a solution to decrease reliance on depleting fossil fuel reserves, increase
energy security and provide an environment friendly solution to growing power
demand. The planning of PS incorporating DGs has to take into account various
factors such as nature of DGs technology, impact of DGs on operating characteristics
of PS and economic considerations [14].
In this chapter we will determine the optimum locations for installing DGs units
depending on an algorithm to calculate the optimal locations. In addition, the percent
reduction in power loss will be calculated.
This study is for test case (IEEE-30 Bus) for both maximum and minimum loads
and for several selected locations of the network is used.
3.2 Calculating the Losses of Real Power
Power systems designed with several generators interconnected with one another by
long transmission lines are suffer from high losses. These losses depend on the
current and resistances in transmission lines. The losses usually referred as thermal
losses. While the resistance is usually a fixed value, the current is a variable which is
a compound function of the system (grid) arrangement, generator locations and
loads.
This work is concerned with the real power as it is directly related to transmission
losses. The system power losses ( LossP ) can be expressed as follows:

17
N
iLi
N
iGiLoss
PPP11
(3.1)
Where
PGi : real power generated at bus (i).
PLi : real power load at bus (i).
The losses in equation (3.1) may be difficult to solve analytically. Alternatively,
many methods were introduced to calculate the real losses, one of which is discussed
below:
])(2[1 1
22
N
i
N
ijj
jijijiijLoss CosVVVVGP (3.2)
Where
Gij are the conductance of the line
Vi and V j are the voltages at bus i and j;
i &
j are the phase angle of voltage at the ith and the jth bus, respectively
N Total number of buses
3.3 Mathematical Analysis of the Problem
The proposed formula aims at finding the derivatives of the real loss relative to the
real injected power at the load buses represented by the small size generator units.
These derivatives will be considered as indices for the locations that would have the
most and the least effect on the efficiency of reducing power losses in the grid
(system).
Buses of the grid were numbered in a way that suits the proposed formula. i.e. bus
number (1) was considered as a slack (NS) bus and was followed by (NL) total
number of bus loads and (NG) ) total number of bus generator bus, where (N)
represents the total number of buses. Therefore
N = NS + NL + NG
The solution using this method requires constructing a vector [ ]D representing the
partial derivatives of the real loss relative to the voltage angles 1
Loss
N
P
and the

18
voltages of bus loads
1
Loss
N N
P
V
and for all buses except the slack bus because it is
assumed constant. The equation for vector[ ]D can be written as follows:
2
3
2
3
1
[ ]
L
Loss
Loss
Loss
N
Loss
Loss
Loss
N
P
P
P
DP
V
P
V
P
V
Since equation (3.3) depends on the values and the angles of the system voltages,
hence these values can be derived to find the elements of the vector [D]. Therefore:
N
ij1j
jijiiji
Loss )](SinVV[G2P
N
ij1j
jijiiji
Loss )](CosVV[G2V
P
While [SEN] represents the sensitivity vector which gives the variation in the real
loss Loss
N
P
P
relative to the real power injected at all buses except for the slack bus
also gives the variation in the real loss relative to the re-active power injected at all
buses 1L
Loss
N
P
Q
except for the slack bus
(3.3)
(3.4)
(3.5)

19
2
2
1L
Loss
Loss
N
Loss
Loss
N
P
P
P
PSEN
P
Q
P
Q
We also need to construct a Jacobean matrix [ ]Jac which results from the last
iteration of the load formula, which can be written as follows:
2 2 2 2
2 2 1
2 2 1
2 2 2 2
2 2 1
1 1 1 1
2 2 1
[ ]
L
L
L
L L L L
L
N N
N N N N
N N
N N
N N N N
N N
P P P P
V V
P P P P
V VJac
Q Q Q Q
V V
Q Q Q Q
V V
The elements of this matrix can be found using equations (3.8) and (3.9) below:
)(SinYVVP
ijijijjij
i
where
ijY Bus admittance matrix
ij admittance angle
N
ij1j
ijijijjiiii
i )(SinYVBV2V
Q
(3.6)
(3.7)
(3.8)
(3.9)

20
where
iiB Imaginary part of complex admittance diameter
Then
[Jac]T [SEN] = [D]
Where [Jac]T transpose matrix for Jacobean matrix
[SEN] = [Jac]T
-1
[D]
Where [Jac]T
-1
inverse matrix for Jacobean matrix
1
12 2
2 2 2 22
12 2
2
2 2
1
.............. ...........
............. ...........
.........
L
L
L
L
NNLoss
NLoss N
N N N N N
Loss
Loss
N
QP P QP
P
QP P P Q
P
P P
Q V
P
Q
1
2
2
12
22 2 2
12 2
11 1 1 1
.... ............
......... ..........
L
L
LL L L L
Loss
Loss
LossNN
LossNN
NN N N N
P
P
PQP Q
VV V V
PQP P Q
VV V V V
The first elements [ ]PSEN from (
2
LossP
P
-
1L
Loss
N
P
P
) of the sensitivity vector [SEN]
matrix represent the partial derivatives of the real loss function relative to the active
power at all load buses can be written as below:
2
3
1
[ ]
L
Loss
Loss
Loss
N
P
P
P
PPSEN
P
P
(3.10)
(3.11)
(3.12)
(3.13)

21
While The second elements [ ]QSEN from (
2
LossP
Q
-
1L
Loss
N
P
Q
) of the sensitivity vector
[SEN] matrix represent the partial derivatives of the imaginer loss function relative
to the reactive power at all load buses can be written as below :
2
3
1
[ ]
L
Loss
Loss
Loss
N
P
Q
P
QQSEN
P
Q
3.4 Test Case System
The proposed approach is tested on the standard 30 bus IEEE test system, and its
parameter can be seen in appendix A.
3.5 Flowchart of Design
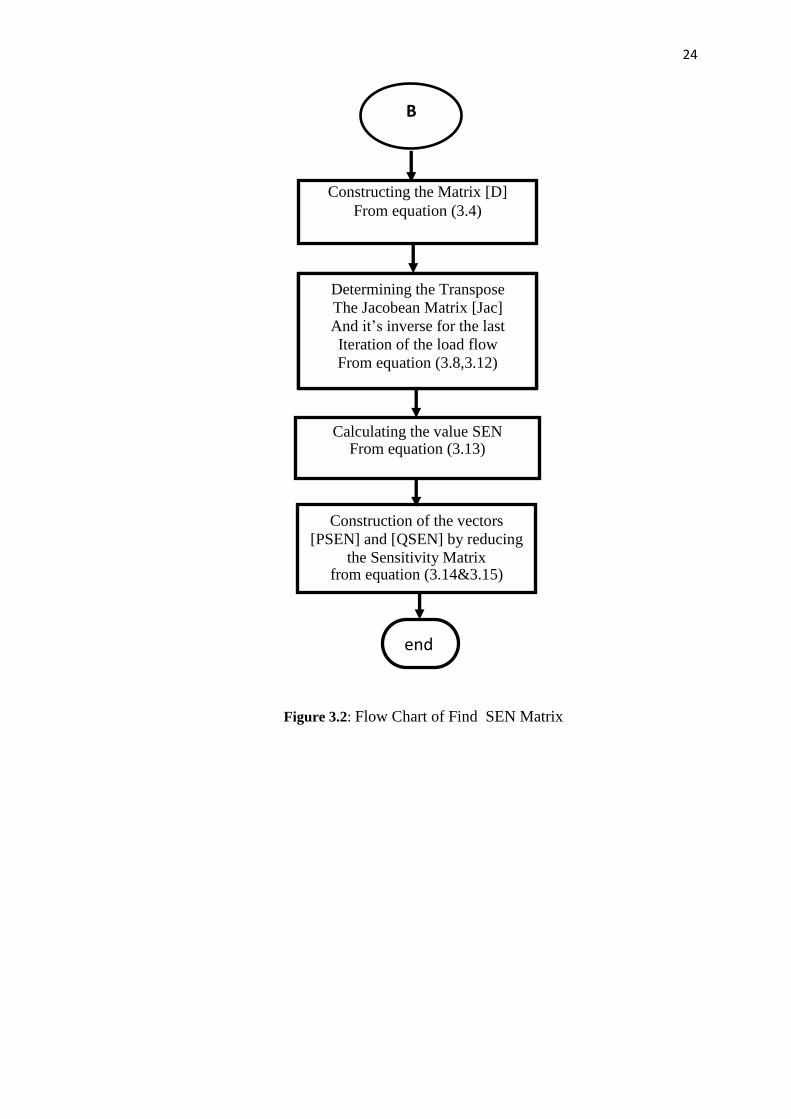
The figure 3.1 show the steps of power flow calculation A & B while the figure 3.2
show the steps of find SEN matrix.
(3.14)

22
Figure 3.1 : Flow chart of power flow calculation
YES
NO
A
Form Admittance Matrix from Equivalent
Impedance
i<N+1
Determine Equivalent
Impedance at Load
Bus
i = 1
N = total of bus
i = bus number
Read Data For IEEE 30 BUS
N, ,PG,PL,QL,V, ,
Start

23
B
Calculate load Flow and losses
Set Iteration Count n=0
Find ∆Ṕ for i=1,2,3,….N
And ∆Q for i=1,2,3,…..N
Calculate real and reactive components of power Ṕi
and Qi for i=1,2,3,…N
Determine max ∆Ṕi and max ∆Qi
Max Ṕi ≤ ε
max Qi ≤ ε
Solve for Voltage Corrections
with Jacobian Matrix
n = n+1
A
Figure 3.1: Flow chart of power flow calculation B
Yes
No
24
Figure 3.2: Flow Chart of Find SEN Matrix
Construction of the vectors
[PSEN] and [QSEN] by reducing
the Sensitivity Matrix from equation (3.14&3.15)
Calculating the value SEN From equation (3.13)
Transpose the Determining
[Jac] Matrix Jacobean The
last the for inverse it’s And
flow load the of Iteration
From equation (3.8,3.12)
Constructing the Matrix [D]
From equation (3.4)
B
end
45
REFERENCE
[1] Bamigbola, O., M. Ali, and M. Oke, Mathematical modeling of electric power flow and
the minimization of power losses on transmission lines. Applied Mathematics and
Computation, 2014. 241: p. 214-221.
[2] Magadum, M.R.B. and M.T.M. Timsani, Minimization of Power Loss in Distribution
Networks by Different Techniques.
[3] Belati, E. and G. Da Costa, Transmission loss allocation based on optimal power flow
and sensitivity analysis. International Journal of Electrical Power & Energy Systems,
2008. 30(4): p. 291-295.
[4] Esmaili, M., E.C. Firozjaee, and H.A. Shayanfar, Optimal placement of distributed
generations considering voltage stability and power losses with observing voltage-
related constraints. Applied Energy, 2014. 113: p. 1252-1260.
[5] Acharya, N., P. Mahat, and N. Mithulananthan, An analytical approach for DG
allocation in primary distribution network. International Journal of Electrical Power &
Energy Systems, 2006. 28(10): p. 669-678.
[6] Pietrosemoli, L. and C. Rodríguez Monroy, The impact of sustainable construction and
knowledge management on sustainability goals. A review of the Venezuelan renewable
energy sector. Renewable and Sustainable Energy Reviews, 2013. 27: p. 683-691.
[7] Onyemaechi, A.B. and O.O. Isaac, Minimization of Power Losses in Transmission
Lines.
[8] Gonen, T., Electrical Power Transmission System Engineering: Analysis and Design.
2014: CRC Press.
[9] Wang, C. and M.H. Nehrir, Analytical approaches for optimal placement of distributed
generation sources in power systems. Power Systems, IEEE Transactions on, 2004.
19(4): p. 2068-2076.
[10] Celli, G., et al., A multiobjective evolutionary algorithm for the sizing and siting of
distributed generation. Power Systems, IEEE Transactions on, 2005. 20(2): p. 750-757.
[11] de Souza, B.A. and J.M. de Albuquerque. Optimal placement of distributed generators
networks using evolutionary programming. in Transmission & Distribution Conference
and Exposition: Latin America, 2006. TDC'06. IEEE/PES. 2006. IEEE.

46
[12] Favuzza, S., et al., Optimal electrical distribution systems reinforcement planning using
gas micro turbines by dynamic ant colony search algorithm. Power Systems, IEEE
Transactions on, 2007. 22(2): p. 580-587.
[13] Cano, E.B. Utilizing fuzzy optimization for distributed generation allocation. in
TENCON 2007-2007 IEEE Region 10 Conference. 2007. IEEE.
[14] Paliwal, P., N. Patidar, and R. Nema, Planning of grid integrated distributed generators:
A review of technology, objectives and techniques. Renewable and Sustainable Energy
Reviews, 2014. 40: p. 557-570
[15]. Bhumkittipich, K. and W. Phuangpornpitak, Optimal Placement and Sizing of
Distributed Generation for Power Loss Reduction Using Particle Swarm Optimization.
Energy Procedia, 2013. 34: p. 307-317.
[16] Abungu, N., Effects of Distributed Generation penetration on system power losses and
voltage profiles. 2013.
[17] Hung, D.Q. and N. Mithulananthan, Multiple distributed generator placement in primary
distribution networks for loss reduction. Industrial Electronics, IEEE Transactions on,
2013. 60(4): p. 1700-1708.
[18] M. Gomez-Gonzalez, A. López, F. Jurado; "Optimization of Distributed Generation
Systems using a New Discrete PSO and OPF", Electric Power Systems Research, 2012,
Vol.84, No.1, pp. 174-180
[19] Wen, J., et al. A Local Loss Reduction Method Based on Injected Power Sensitivity. in
Power and Energy Engineering Conference (APPEEC), 2012 Asia-Pacific. 2012. IEEE.
[20] Abou El-Ela, A., S. Allam, and M. Shatla, Maximal optimal benefits of distributed
generation using genetic algorithms. Electric Power Systems Research, 2010. 80(7): p.
869-877.
[21] Ayres, H.M., et al. Evaluation of the impact of distributed generation on power losses by
using a sensitivity-based method. in Power & Energy Society General Meeting, 2009.
PES'09. IEEE. 2009. IEEE.
[22] Lee, S.-H. and J.-W. Park, Selection of optimal location and size of multiple distributed
generations by using Kalman filter algorithm. Power Systems, IEEE Transactions on,
2009. 24(3): p. 1393-1400.


