
Impact of Financial Market Uncertainty and
Macroeconomic Factors on Stock-Bond Correlation in
Emerging Markets
Nebojsa Dimic*, Jarno Kiviaho, Vanja Piljak, Janne Äijö
Department of Accounting and Finance
University of Vaasa
15 Dec 2014
Abstract
This paper examines the impact of global financial market uncertainty and domestic macroeconomic factors on stock-bond correlation in emerging markets. In particular, the impact is analyzed across different time horizons by applying wavelet analysis on a sample of 10 emerging markets. We find that time-varying stock-bond correlation patterns vary significantly between the time horizons. In particular, the correlation in short horizon changes the sign rapidly showing sustainable negative episodes while the correlation in long horizon stays positive most of the time. The most important factor influencing stock-bond correlation at short horizon is the monetary policy stance, while the factors with the highest impact in long term are inflation and stock market uncertainty. Finally, global stock market uncertainty plays more significant role than global bond market uncertainty in explaining stock-bond correlations in emerging markets.
JEL classifications: E44, F30, G15
Keywords: stock-bond correlation, emerging markets, macroeconomic factors, financial
market uncertainty, wavelet analysis
* Corresponding author at: P.O. Box 700, FI-65101 Vaasa, Finland. Tel +358 45 104 7707.
E-mail Addresses: [email protected] (N. Dimic), [email protected] (J. Kiviaho), [email protected] (V. Piljak), [email protected] (J. Äijö)

1
1. Introduction
This article focuses on the impact of global financial market uncertainty and domestic
macroeconomic factors on stock-bond correlation in emerging markets at short and long time
horizons. Examining the dynamics of the time-varying co-movements between stocks and
bonds is important for several reasons. Stock-bond correlation is one of the most influential
inputs to investors’ asset allocation decisions. Moreover, investors’ portfolio optimization,
risk management and hedging choices may be improved drastically taking into consideration
the relationship between two main asset classes. Finally, policy makers are increasingly using
the information about the joint behavior of stocks and bonds in determining the market views
on the inflation and the economic activity of the country. The issue of stock-bond correlation
in emerging markets is recently gaining considerable attention due to increasing demand for
the emerging market assets by the international investors seeking portfolio diversification
benefits. In particular, government bonds of the emerging markets have become an attractive
investment target in recent decade due to the following reasons: (i) emerging markets are
among the world's fastest growing economies in which government bonds represent the
second largest source of financing since 1990s; and (ii) increasing market liquidity and
transparency in emerging bond markets (see, e.g. Bunda et al., 2009; Piljak, 2013).
Additionally, assessment of stock-bond correlation dynamics at different time horizons is
important for international investors in the context of portfolio rebalancing decisions.1
The purpose of this study is two-fold. By applying the wavelet analysis approach, we
are able to examine stock-bond correlations over different time horizons in ten emerging
1 True long-term relationship between stock and bond returns can be altered in a short horizon due to the
short-term noise: investors’ immediate consumption needs and portfolio optimization (see Harrison and Zhang, 1999).

2
markets during the period 2001-2013.2 The advantage of applying the wavelet analysis in
examining co-movement dynamics between asset classes is related to simultaneous
consideration of time and frequency domains in one integrated framework. Second, we
investigate impact of global financial market uncertainty (both stock and bond market
uncertainty) and domestic macroeconomic factors on the stock-bond correlations at short-
and long-term horizons. In line with previous studies on relationship between the stock-bond
correlation and macroeconomic factors (Ilmanen 2003; Yang et al., 2009), we include
inflation, business cycle patterns and the monetary policy stance in our analysis.
The literature on stock-bond correlations has been traditionally focused on developed
markets (Andersson et al., 2008; Campbell and Ammer, 1993; Cappiello et al., 2006;
Ilmanen, 2003). The most prominent issue within this stream of literature is related to
examining various factors driving the stock-bond correlations. The debate on this issue still
remains open, given the mixed evidence in the literature on the role of macroeconomic
factors in driving stock-bond correlations. In particular, one segment of the literature
documents the importance of the macroeconomic fundamentals, specifically inflation,
business cycle environment and the monetary policy stance, in explaining stock-bond
correlations (Ilmanen, 2003; Li, 2004; Yang et al., 2009). Yang et al. (2009) provide
convincing evidence of time-varying stock-bond correlations over macroeconomic conditions
(the business cycle, the inflation environment, and monetary policy stance) by using data for
the US and the UK covering the past 150 years. Ilmanen (2003) points out inflation as a key
driver of stock-bond correlation. High inflation periods lead to changes in common discount
rates that dominate the cash-flow expectations and lead to the positive correlation between
the two asset classes. Further findings demonstrate that stocks tend to outperform bonds 2 A wavelet analysis approach has been applied in several studies to analyze financial time-series. For
example, Rua and Nunes (2009), Graham et al. (2012), and Kiviaho et al. (2014) apply wavelet squared coherency to analyze international co-movement of stock market returns. Kim and In (2005) use wavelet correlations to study the co-movement between stock returns and inflation, while Kim and In (2007) apply wavelet analysis to examine relationship between changes in stock prices and bond yields in G7 countries.
3
during the business cycle expansions, while bonds outperform stocks during the business
cycle contraction periods. Finally, easing the monetary policy has a positive effect on both
stocks and bonds exhibiting the positive relation with the correlation of those two asset
classes.
In contrast, Baele et al. (2010) argue that macroeconomic factors play only a minor
role in explaining stock-bond correlations in the US market. Andersson et al. (2008) use data
from the US, the UK, and German markets and find that inflation expectation is important
determinant of stock-bond correlation, while economic growth expectation is not a relevant
factor. Specifically, their result shows that stock and bond prices move in the same direction
when the inflation expectations are high.
More recent study by Aslanidis and Christiansen (2014) provides new insights into
the role of macroeconomic fundamentals in explaining stock-bond correlations. They find
that macroeconomic factors have only little explanatory power when the stock-bond
correlation is large positive; but however, when the stock-bond correlation is large negative,
then macroeconomic fundamentals are most useful explanatory variables. The rationale
behind this finding is that macroeconomic factors are important for bonds in all periods,
while for stocks they are important only in very volatile periods.
One additional segment of the related literature provides evidence that stock market
uncertainty plays an important role in explaining stock-bond correlations (Andersson et al.,
2008; Connolly et al., 2005, 2007; Kim et al., 2006). The aforementioned studies are using
implied volatility from equity index options as a proxy for stock market uncertainty, and
suggest that implied volatility changes have an impact on market participants’ risk aversion
therefore affecting the stock-bond correlation. Considerable attention in those studies has
been given to the “flight-to-safety” phenomenon, in which the correlation between stocks and
bonds become significantly negative during periods of high market uncertainty (Gulko, 2002;

4
Connolly et al., 2005; Andersson at al., 2008; Baur and Lucey, 2009). In particular, the
financial equity markets crashes make investors more risk averse, as they shift the funds from
stock to bond markets.
Among the literature on stock-bond correlation, studies examining emerging markets
are relatively scarce. In particular, Panchenko and Wu (2009) use the sample of 18 emerging
markets to investigate how the stock-bond co-movement is affected by emerging stock
market integration. In addition, Boyer et al. (2006) examine correlations between stock and
bonds in emerging markets within the context of financial crisis contagion. More recently,
Christopher et al. (2012) address the issue of the effects of sovereign credit ratings on time-
varying stock-bond correlations in emerging countries worldwide.
Our study contributes to the literature in three ways. First, we add to the literature on
stock-bond correlation by providing new evidence on the impact of macroeconomic factors
and global financial market uncertainty from the perspective of emerging markets. Second,
by using advantageous methodological framework of the wavelet analysis, we are able to
examine differences in importance of macroeconomic and financial market uncertainty
factors for the stock-bond correlations in long- and short-horizons. Third, we extend the
literature on financial market uncertainty by examining connections between global bond
market uncertainty and stock-bond correlations. Previous related studies on stock-bond
correlation focused on the impact of uncertainty coming from stock market (Andersson et al.,
2008; Connolly et al., 2005; 2007; Kim et al., 2006), while our study differs from the related
studies by examining also the impact of uncertainty originating from bond market.
The empirical findings reported in this article show that global financial market
uncertainty and domestic macroeconomic factors play important role in explaining the stock-
bond correlation in emerging markets. In addition, time-varying stock-bond correlation
patterns vary significantly between the time horizons. The short horizon correlation changes

5
the sign rapidly showing sustainable negative episodes during the crisis periods, which is
consistent with the “flight-to-quality” phenomenon. The long horizon correlation stays
positive most of the time indicating that emerging market stock and bond prices move in the
same direction signifying “equity like”3 properties of emerging market bonds in the long run.
Our findings also suggest that the most important factor influencing stock-bond
correlation at short horizon is the monetary policy stance, while the factors with the highest
impact on the stock-bond correlation in long run are inflation and stock market uncertainty.
Furthermore, our empirical findings demonstrate positive long run relationship between
inflation and stock-bond correlation suggesting that both stock and bond prices in emerging
markets tend to move in the same direction during high inflation periods. Moreover, our
analysis show that high equity market uncertainty, as measured by implied volatility, leads to
a higher comovement of stock and bond prices in emerging markets. Finally, global stock
market uncertainty plays more significant role than global bond market uncertainty in
explaining stock-bond correlations in emerging markets.
The remainder of this paper is organized as follows. Section 2 presents data and the
descriptive statistics. In Section 3, we set forth a brief description of the wavelet analysis
approach. The empirical results are presented in Section 4, while Section 5 provides
conclusions.
2. Data
2.1 Stock and bond market returns
3 Emerging markets bonds are often considered as "equity like" assets because of higher country risk in
emerging economies (see Kelly et al., 1998; Panchenko and Wu, 2009; Piljak, 2013).

6
The empirical analysis is performed using monthly data4 for stock and bond returns
on ten emerging markets and the United States. The selection of the emerging markets in our
sample is based on the country composition of the J.P. Morgan Emerging Market Bond Index
Plus (EMBI+)5. Stock market indices for each emerging market in the study are provided by
Morgan Stanley Capital International (MSCI). The inclusion of US market in the study was
due to its role as a global factor in the international financial markets as well as for the
comparison with the emerging markets. Stock and bond markets of US are represented by the
S&P 500 index and 10-year US government bonds, respectively. Similarly to Rua (2010),
stock and bond price indices are converted to the monthly returns by taking the first
difference of the natural log for each stock and bond price index. The use of monthly
frequencies is due to the fact that data on macroeconomic factors used in further analysis are
available only on monthly level. The source of the data is Thomson Reuters Datastream. The
sample period spans from January 2001 until December 2013, leading to the sample size of
156 observations for all of the markets included in the study. The starting point for the
sample period is dictated by the data availability.
(Insert Table 1)
Table 1 presents the summary statistics for stock and bond market returns for ten
emerging markets and the US. As shown in Panel A, all of the emerging markets in the
sample have positive and higher average stock returns than the US during the period under
4 Monthly data are used for stock-bond analysis in Kim and In 2007 and Aslinidis and Christiansen 2014 5 EMBI+ includes 18 countries. Our sample is limited to those countries with available data on stocks, bonds
and macroeconomic factors for the entire sample period The EMBI+ is J.P. Morgan’s most liquid US-dollar emerging markets debt benchmark. It tracks returns for actively traded debt instruments in emerging markets including Brady bonds, Eurobonds, and traded loans issued by sovereign entities. The EMBI+ index includes only issues with a current face amount outstanding of $500 million or more and remaining life of greater than 2.5 years. The J.P. Morgan indices are the most widely used and comprehensive emerging market sovereign debt benchmarks.

7
study. The highest stock returns are recorded for Colombia, Venezuela and Peru. The
volatility levels of each of the emerging stock markets from the sample are higher than the
volatility of US market. The least volatile emerging stock markets are Mexico and
Philippines with the standard deviations of 0.071 and 0.073 respectively, while the most
volatile emerging stock markets are Turkey, Venezuela and Argentina. Panel B presents the
statistical properties of the bond returns for emerging markets and US. Similarly to observed
pattern with stock markets, average returns of emerging market bonds are higher than US
(except for Argentina). Standard deviations of emerging market bonds are greater than the US
with the exceptions of Bulgaria and Mexico, suggesting that emerging countries have
generally riskier bond markets. Emerging market with the most volatile bond returns is
Argentina. The distribution of both stocks and bonds return series is non-normal, with
kurtosis exceeding 3 in all cases (leptokurtic series) and showing negative skewness (except
the US bonds).
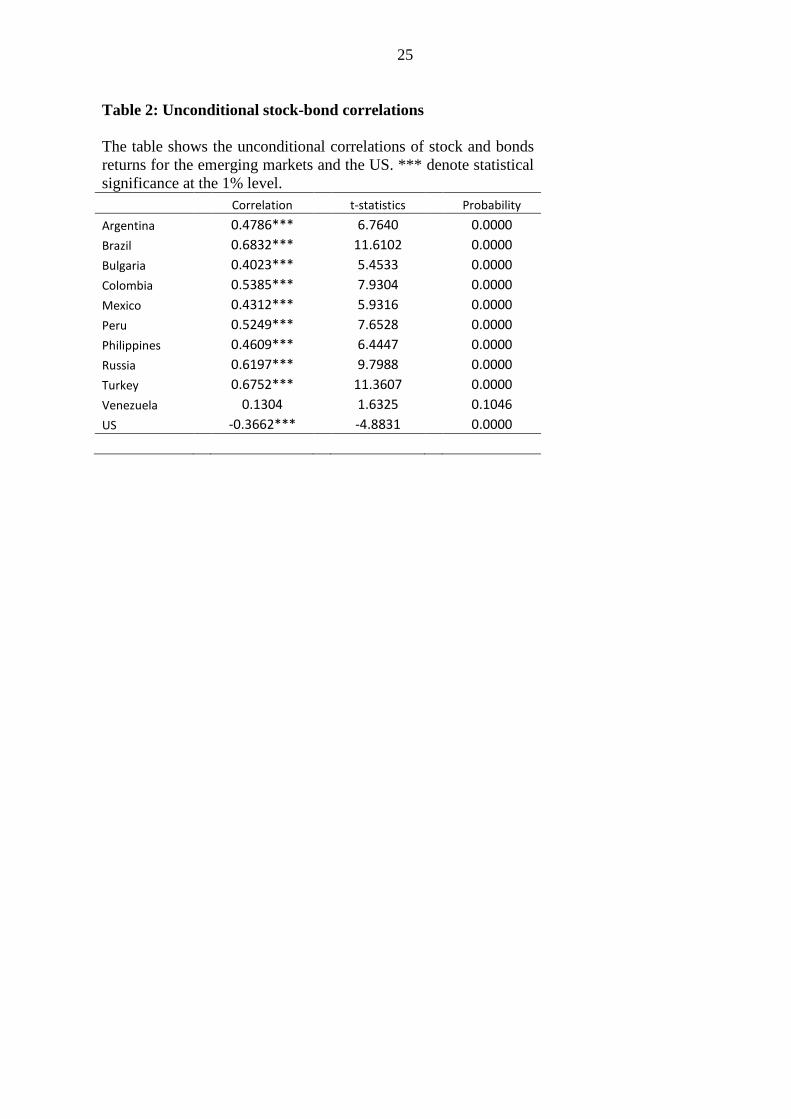
(Insert Table 2)
The unconditional stock-bond correlations for each country included in the study are
reported in Table 2. All emerging markets exhibit positive and statistically significant
correlation between stocks and bonds. The level of unconditional stock-bond correlation
differs substantially within the emerging market sample group ranging from 0.130
(Venezuela) to 0.683 (Brazil). On the opposite side, US market exhibit a negative statistically
significant correlation of stock and bond returns during the time period under study (-0.366).
2.2 Domestic macroeconomic factors and global financial market uncertainty

8
The impact of domestic macroeconomic factors on emerging markets’ stock-bond
return correlation is examined using monthly data on inflation, business cycle patterns and
the monetary policy stance. The consumer price index (CPI), the industrial production index
(IP) and the three-month interbank interest rates (IIR) of each emerging market from the
sample are used as a proxy for the domestic inflationary environment, business cycle patterns
and monetary policy stance, respectively..6
To examine the impact of global stock and bond market uncertainty on the emerging
markets stock-bond return correlation, we use implied volatilities extracted from the prices of
stock and bond index options. The option-implied volatility is widely regarded as the best
available estimate for the market uncertainty. To capture the uncertainty of US stock and
bond markets, we use VIX and MOVE implied volatility indices, constructed by the Chicago
Board Options Exchange and Bank of America Merrill Lynch, respectively. The VIX is
calculated from S&P 500 Index option bid/ask quotes and represents 30-day measure of the
expected volatility of the S&P 500 stock market Index. The Merrill Lynch Option Volatility
Estimate MOVE index is a yield curve weighted index of the normalized implied volatility on
1-month Treasury options representing a market estimate of future Treasury bond yield
volatility.7
3. Wavelets Analysis Approach
Wavelet transforms provide a highly useful and practical set of methods for analyzing
economic time-series.8 Wavelets can unravel both the time varying and frequency specific
behavior of the variables. The classical frequency analysis method, the Fourier transform, can 6 The data on the three-month interbank interest rates for Mexico and Peru were not available, so we used the
one-month interbank interest rates instead. 7 MOVE Index is a weighted average of volatilities on the two-, five-, ten-, and thirty-year contracts and
represents a widely used measure of government bond volatility. 8 For more information on Wavelet analysis see Torrence and Compo 1998 and Grinsted 2004.

9
only reveal static frequency properties. The wavelet transform, in turn, can reveal the
dynamical behavior of the variable on different frequencies. For our purpose of studying the
correlation structure between bond and stock markets, wavelet correlation analysis provides
an appropriate framework for unraveling the dynamic and frequency specific properties of the
correlation. Our analysis closely follows the approach of Rua (2010) and Croux (2001).
In wavelet analysis, the time and frequency localized properties of a time-series are
extracted with the help of a wavelet function 𝜓𝜏,𝑠(𝑡) by dilating and translating it with
𝜓𝜏,𝑠(𝑡) = 1√𝑠𝜓 �𝑡 − 𝜏
𝑠� (1)
where s is the frequency parameter and 𝜏 expresses the position in time. By convoluting the
function 𝜓𝜏,𝑠(𝑡) with a time-series 𝑥(𝑡), one obtains the wavelet transform 𝑊𝑥(𝜏, 𝑠):
𝑊𝑥(𝜏, 𝑠) = 1√𝑠
∫ 𝑥(𝑡)𝜓∗ �𝑡 − 𝜏𝑠� 𝑑𝑡∞
−∞ (2)
where * is the complex conjugate. Now from the wavelet transformations 𝑊𝑥 and 𝑊𝑦 of two
time-series 𝑥(𝑡) and 𝑦(𝑡) it is possible to obtain a wavelet correlation measure between these
two variables:
𝜌𝑥𝑦(𝜏, 𝑠) = ℝ(𝑊𝑥𝑥(𝜏,𝑠))�|𝑊𝑥(𝜏,𝑠)|²|𝑊𝑥(𝜏,𝑠)|²
(3)
where 𝑊𝑥𝑦(𝜏, 𝑠) is the cross-wavelet spectrum. The wavelet correlation measure 𝜌𝑥𝑦(𝜏, 𝑠)
takes values in [-1,1] and so is similar to the classical correlation coefficient. As the wavelet
function, we use the Morlet wavelet 𝜓𝜏,𝑠(𝑡) = 𝜋−1 4⁄ 𝑒𝑖𝑖0𝑡𝑒−𝑡2
2 , with 𝜔0 = 6.

10
4. Results
4.1 Stock-bond correlation at short- and long-term horizons
In this section, we report the correlation of stock and bond returns obtained by
applying the wavelet correlation approach. Stock-bond correlation output is illustrated by
contour plots that involve three dimensions: frequency, time and the wavelet correlation
value (height). The frequency dimension is shown on the vertical axis and range from the
highest frequency of two months (top of the plot) to lowest frequency of four years (bottom
of the plot). Time dimension is presented on horizontal axis. Finally, the height dimension
(wavelet correlation) is pictured via different shades of gray in the Figures. The correlation
scale ranges from -1 to 1 and is interpreted in the terms of darkness of the gray color.
Increasing positive value of stock-bond correlation matches up with deepening darkness of
gray, imitating the height in the surface plot; while the increasing negative stock-bond
correlation is symbolized by lightening of gray color.
Three-dimensional setting of wavelet based correlation enables us to detect the areas
of varying correlation between stock and bond series both over time (horizontal axis) and
frequency bands (vertical axis). In this integrated framework, a dark gray area at the bottom
(top) of the Figures corresponds to positive stock-bond correlation at low (high) frequencies,
whereas a dark gray area at the left-hand (right-hand) side signify positive stock-bond
correlation at the start (end) of the sample period (see Rua, 2010). Analogously, negative
stock-bond correlation is matched with the light gray color. The frequency scale enables us
to separate the stock-bond return correlation between short term and long term. Due to our
relatively small sample period of thirteen years, the short term is considered to be the

11
fluctuations ranging between two to four months while the long term can be thought of as
fluctuations between one to three years.
(Insert Figure 1)
Figure 1 presents the wavelet correlation of stock and bond returns in emerging markets
and the US. We note several interesting findings from the visual assessment of the stock-
bond correlation graphs presented in Figure 1. The evidence suggests that the stock-bond
correlation of both emerging countries and US varies considerably across frequencies and
over time.
Stock-bond correlations at short-term horizons (high frequency) tend to change the
sign and magnitude rapidly, going from highly positive to negative episodes for most of the
emerging markets in the sample. During the period from beginning of 2001 until the end of
2002 (period corresponding to “Dotcom market crash”), Argentina9, Bulgaria, Colombia,
Russia and Venezuela show sustainable episodes of negative stock-bond correlation.
Emerging countries with the biggest drop in correlation of stock and bond returns during this
time period are Venezuela (from +0.85 to -0.70) and Argentina (from +0.45 to -0.50). Other
emerging markets in the sample, specifically Mexico, Peru, Philippines and Turkey showed
increasing negative change in magnitude of stock-bond correlation during this period.
Another great decrease and negative patterns of short-term stock-bond correlation can be
spotted during the period corresponding to the financial crisis of 2008 in case of most of the
emerging markets. Negative correlation is observed in case of Brazil, Bulgaria, Ecuador,
Mexico, Peru, Russia and Venezuela. Country having the biggest drop in correlation during
this period is Russia with a change from +0.70 to -0.65. Rest of the emerging markets in the
9 This time period also coincides with the Argentina's debt default crisis.

12
sample showed a considerable decrease in magnitude of stock-bond correlation; however the
correlation remains positive in the short-term horizon.
Assessment of the short-term horizon analysis of stock-bond correlation in emerging
markets demonstrates that the stock-bond correlation varies considerably over time. In
addition, we observe the sustained negative episodes of correlation in short term that seem to
coincide with the crisis periods. This result is consistent with the “flight-to-safety”
phenomenon observed in the developed markets (Gulko 2002; Andersson et al., 2008; Baur
and Lucey, 2009). Our empirical finding further suggests that the short-term investors tend to
switch their positions from stocks to bonds during the crisis period and that emerging market
bonds provide a hedging opportunity for the emerging market stocks in the short run.
As can be seen from the Figure 1, the pattern of long-term horizon (low frequency)
correlation between emerging markets stock and bond returns is quite different; the sign of
correlation remains positive and less volatile for all of the emerging countries (with the
exception of Venezuela that shows a short period of negative correlation). The highest levels
of positive correlations between stock and bond returns are found in Bulgaria, Russia and
Turkey (+0.95 for all) during the period following the financial markets crash in 2008.
Highly positive stock-bond correlation at long-term horizon throughout the entire sample
gives no support for the “flight-to-safety” phenomenon. This result suggests that long term
investors do not see the emerging markets bonds as a safe asset compared to emerging market
stocks. Therefore, the emerging market bonds exhibit properties of “equity like” assets due to
the high country risk in emerging economies (Kelly et al., 1998; Panchenko and Wu, 2009;
Piljak 2013).
The next step in our analysis includes assessment of stock-bond correlation pattern for
US market at short and long horizon, and comparison with observed patterns in the emerging
markets. Similarly to emerging markets, US stock-bond correlation at short-term horizon

13
changes rapidly from positive to negative. Lowest levels of negative correlation are found
during the Dotcom crash (-0.80), and during the financial crisis of 2008 (-0.85). Stock-bond
correlation for US demonstrate completely different pattern from the emerging markets at
long-term horizon. Unlike the emerging countries, US market correlation between stock and
bond returns remains negative in long horizon, demonstrating lowest values during periods
corresponding to the “Dotcom crisis” and the financial crisis of 2008. Negative episodes of
US stock-bond correlation are consistent with the literature suggesting that bonds tend to
outperform stocks during the crisis periods leading to the negative relationship of stock-bond
returns (Ilmanen, 2003).
4.2 Impact of global financial market uncertainty and domestic macroeconomic
factors on stock-bond correlation
In the next stage of our analysis, we examine factors that may cause the time
variation in the correlation between stock and bond returns of emerging markets at different
time horizons. Previous evidence in the literature on developed markets suggests that
inflation and economic growth unconditionally determine the government bond yields
(Andersson et al., 2008). In particular, there is a negative relationship of inflation and
economic growth with bond prices. The impact of growth and inflation on stock prices is
somewhat uncertain.10 Nevertheless, some studies suggest that high inflation has a negative
impact on stock prices (Ilmanen, 2003). Monetary policy easing has a positive effect on both
stocks and bonds and therefore the positive relation with the stock-bond correlation. Finally,
financial market turbulence periods may cause risk-averse investors in developed countries to
shift to safer assets, such as government bonds, causing “flight-to-safety” episodes.
10 For more discussion on this issue please see Andersson et al. (2008).

14
To detect the impact of relevant factors affecting the stock-bond correlation in
emerging markets we account for both global financial markets uncertainty and domestic
macroeconomic factors. Global uncertainty factors used are VIX and MOVE indices that
serve as proxies for US stock and bond market uncertainty, respectively. Domestic factors
used to proxy the business cycle fluctuations, the inflation environment and the monetary
policy stance are Industrial Production (IP), Consumer Price Index (CPI) and three-month
interbank interest rates (IIR), respectively. Both global uncertainty and domestic
macroeconomic factors used are at a monthly level with the sample period corresponding to
the period used for wavelet correlation analysis.
We conduct regression analysis of the wavelet stock-bond correlation at different time
frequencies on the aforementioned proxy variables for financial market uncertainty, domestic
economic growth, inflation and monetary policy stance11. A separate OLS regression has
been conducted for each emerging market in the sample as well as for the US12.
Consequently, the following regression model is estimated:
𝑊𝑊𝑊𝑊𝑖,𝑓 = 𝛼 + 𝛽1𝑉𝑉𝑉 + 𝛽2𝑀𝑊𝑉𝑀 + 𝛽3𝑊𝐶𝑉𝑖 + 𝛽4𝑉𝐶𝑖 + 𝛽5𝑉𝑉𝑊𝑖 + 𝜀𝑖,𝑓 (4)
where 𝑊𝑊𝑊𝑊𝑖,𝑓 denotes the wavelet correlation between stock and bond returns for country i;
f is the frequency domain given at two different levels, expressed in time units of 3 months
(short-term horizon) and 2 years (long-term horizon).13
11 To check for the stationarity of explanatory variables used in the regression analysis two unit root tests
were performed, specifically Augmented Dickey-Fuller (ADF) and Phillips-Perron (PP). The lag length criterion for the unit root tests is based on Schwarz information criterion. The results suggest that the explanatory variables are stationary. Therefore, the null hypothesis of a unit root can be rejected for the time series used in regression analysis. The unit root tests results for all explanatory variables are not shown here due to space consideration, but they are available upon request.
12 To check for the multicollinearity between the explanatory variables we rely on Variance Inflation Factor (VIF) test. The results suggest no multicollinearity problem among the variables. The VIF test results are available upon request. The interested reader on VIF measure should refer to O'Brien (2007).
13 Similar approach in determining short and long horizons is applied in Kiviaho et al. (2014).

15
The regression results on the impact of global financial market uncertainty and
domestic macroeconomic factors on stock-bond return correlation in emerging markets and
the US are reported in Table 3. In common to most multi-country studies, slight differences
in terms of significance levels and the coefficient signs of explanatory factors do exist in the
regression models. Nevertheless, several interesting findings can be drawn from the empirical
results of the regressions. Generally, the results suggest considerable variations in factors
impacting the correlation in short-term horizon (high frequency) as opposed to the long-term
horizon (low frequency).
(Insert Table 3)
Short term horizon analysis (given in panel A) reveals that there is at least one highly
statistically significant factor of interest for each individual country. The results show that the
domestic monetary policy stance is the most influential factor in a short term, being highly
statistically significant in seven out of ten emerging markets. The coefficient sign of three-
month interbank interest rate is changing across the countries, suggesting that the way how
monetary policy affects the stock-bond correlation is not consistent in all emerging markets.
For instance, in certain countries (Brazil, Colombia and Mexico) the sign of the IIR
coefficient is positive, while for other countries (Argentina, Peru, Russia and Venezuela) the
sign is negative. Factor with the moderate impact on short-term stock-bond correlation in the
emerging markets is the US equity market uncertainty. The VIX index is statistically
significant in five markets in short horizon analysis. Furthermore, the MOVE index has only
a minor effect on the correlation in the short run, being significant in only three emerging
markets. The business cycle pattern is the least influential macroeconomic factor in the short
run as it is significant in only two markets, suggesting that the emerging market stock-bond

16
return correlation is virtually unaffected by the domestic business cycle patterns at the short
horizon.
Panel B of Table 3 reports the impact of global financial market uncertainty and
domestic macroeconomic factors on the correlation between stock and bonds at long-term
horizon (low frequency). Generally, in comparison to the short-term horizon analysis,
significantly higher impact of factors used on the stock-bond correlation is found at a long-
term horizon. For each emerging market there were at least three statistically significant
variables of interest that impacts the stock-bond correlation in a long run, while for certain
countries there are four or even five significant factors. The explanatory power of the model
(R-squared) considerably differs between short- and long-term analysis, ranging from 22% to
65% in a short-term, and from 74% to 96% for the long-term period.
The most influential macroeconomic factor for the long-term period stock-bond
correlation is the inflation, as the consumer price index variable is highly significant in all ten
emerging markets from the sample. This result is consistent with the general literature
suggesting that the inflation can be seen as one of the key driving factors for the correlation
between stock and bond returns. In particular, our results demonstrate that the inflation and
stock-bond return correlation at long-term horizon are positively related, given that the sign
of the estimated coefficient for inflation is positive in almost all emerging countries (except
Brazil and Venezuela). Since bond prices are negatively related to inflation, our finding
indicates that the high inflation has also a negative impact on stock prices, which is in line
with Ilmanen (2003) and Andersson et al. (2008). Hence, negative relation of inflation with
both stocks and bonds consequently leads to movement of stocks and bonds in the same
direction, resulting in positive relation of the inflation and stock-bond correlation.
The second most important factor for explaining the long horizon correlation of
emerging stocks and bonds is the global stock market uncertainty. The US stock market

17
implied volatility is found significant in nine out of ten emerging markets. Significant and
positive sign for the VIX coefficient is found in seven countries, namely Argentina, Brazil,
Bulgaria, Colombia, Peru, Russia and Venezuela, suggesting that high stock market
uncertainty affects negatively both stocks and bonds in those emerging markets in the long
run. This finding further implies that emerging markets stock and bond prices tend to
commove more during the periods of high US equity market uncertainty.
Third influential macroeconomic factor for the stock-bond correlation in the long run
is the business cycle, appearing significant in eight emerging markets. Estimated coefficients
of the industrial production index are positive and statistically significant in seven countries,
specifically Argentina, Bulgaria, Colombia, Peru, Russia, Turkey and Venezuela. This result
indicates that the domestic trend in growth may have the similar effect on stock and bond
returns in the long run, causing a positive correlation. The effect of monetary policy stance is
similar in short- and long-term horizons. Similarly to the short horizon, the sign of IIR
coefficient is not consistent in the long horizon. Empirical analysis also shows that MOVE
index represents the least influential factor for the emerging market stock-bond correlation
analysis in the long-term. Generally, the stock-bond correlation in emerging markets is
virtually unaffected by the implied volatility of US bond market. Therefore, the US stock
market uncertainty play much bigger role than US bond market uncertainty in impacting the
correlation between stock and bond returns in emerging markets.
We continue our analysis with examining factors affecting stock-bond correlation in
the US market at short and long horizons, and providing a brief comparison with the case of
the emerging markets. Regression results for US market demonstrate that implied volatility of
both stock and bonds impact the correlation of stock-bond returns at short and long horizons.
Negative significant coefficient for VIX is consistent with the general literature on stock-
bond correlation in developed markets and “flight-to-safety” phenomenon. Differently from

18
the emerging markets, the US stock-bond correlation is affected by the uncertainty
originating also from bond market. Finally, similarly to the emerging markets, the estimated
coefficients on CPI and IP are positive and highly statistically significant at long horizon,
implying that growths in inflation and production have a positive impact on stock-bond
correlation.
5. Conclusions
This article examines the short- and long-term horizon patterns of stock-bond
correlation in emerging markets and driving factors behind time-varying correlations. In
particular, we study the impact of global financial market uncertainty and domestic
macroeconomic factors on stock-bond correlation. We utilize the powerful tool of wavelet
correlations which enables us to simultaneously consider the time and frequency domains in
the co-movement between stock and bond returns.
Our study contributes to the literature by providing new evidence on the impact of
macroeconomic factors and global financial market uncertainty on both short- and long-term
stock-bond correlations in emerging markets. While the previous studies focus on the impact
of uncertainty coming only from stock markets we examine connections between global bond
market uncertainty and stock-bond correlations.
Our empirical findings indicate that the stock-bond correlation in emerging markets
differs considerably over time and between short and long horizons. Using the data from 10
emerging markets, namely Argentina, Brazil, Bulgaria, Colombia, Mexico, Peru, Philippines,
Russia, Turkey and Venezuela, we find that the short-term correlations between stocks and
bonds are changing the sign rapidly, showing sustained episodes of negative correlation
corresponding to the crisis periods. Hence, short-term analysis suggests that rapid changes in

19
the correlation of emerging markets stocks and bonds during the crisis periods are consistent
with the “flight-to-quality” phenomenon. Long-term horizon analysis demonstrates that the
stock-bond correlation in emerging markets remain positive throughout the entire sample
period, suggesting “equity like” properties of emerging market bonds in the long run due to
the country specific risks.
Further results indicate that the macroeconomic factors can explain the time variations
in the correlation of stock and bond returns in emerging markets both in short- and long-term
horizons. Generally, macroeconomic factors have greater explanatory power in explaining the
correlation in long run (low-frequency) compared to the short run (high frequency). The most
prominent macroeconomic factor in the short-term analysis is the domestic monetary policy
stance. Our analysis also suggests that monetary policy easing boosts the performance of
both stocks and bonds producing the positive relationship with stock-bond correlation for
Brazil, Colombia and Mexico, while easing monetary policy in Argentina, Peru, Russia and
Venezuela leads to decoupling performance of stocks and bonds in the short run.
Long-term horizon analysis shows that inflation and the US stock market implied
volatility represent the most important macroeconomic factors responsible for time varying of
stock-bond return correlation. Furthermore, the long run analysis demonstrates a positive
relationship between inflation and stock-bond correlation in emerging markets. Since bond
prices are negatively related to inflation, our finding indicates that the high inflation has also
a negative impact on stock prices. The empirical findings further indicate a positive
relationship between the US stock market uncertainty and the stock-bond correlation in
emerging markets. In addition, global stock market uncertainty plays more significant role
than global bond market uncertainty in explaining stock-bond correlations in emerging
markets.

20
The results of this study can offer interesting insights to both short- and long-term
investors, as they can benefit from taking into account time and frequency domains analysis
of stock-bond correlation in making asset allocation decisions. Moreover, our findings are
also helpful in providing a new understanding on the influence of macroeconomic factors and
financial market uncertainty on the stock-bond correlation in emerging markets at short and
long horizons.

21
References
Andersson, M, Krylova, E., Vähämaa, S., 2008. Why does the correlation between stock and
bond returns vary over time? Applied Financial Economics 18, 139-151.
Aslanidis, N, Christiansen, C., 2014. Quantiles of the realized stock-bond correlation and
links to the macroeconomy. Journal of Empirical Finance 28, 321-331.
Baele, L., Bekaert, G., Inghelbrecht, K., 2010. The determinants of stock and bond return
comovements. Review of Financial Studies 23, 2374-2428.
Baur, D. G., Lucey, B. M., 2009. Flights and contagion - An empirical analysis of stock-bond
correlations. Journal of Financial Stability 5, 339–352.
Bunda, I., Hamann, A. J., Lall, S., 2009. Correlations in emerging market bonds: The role of
local and global factors. Emerging Markets Review 10, 67-96.
Boyer, B. H., Kumagai, T., Yuan, K., 2006. How do crises spread? Evidence from accessible
and inaccessible stock indices. Journal of Finance 61, 957–1003.
Campbell, J., Ammer, J., 1993. What moves the stock and bond markets? A variance
decomposition for long-term asset returns. Journal of Finance 48, 3-37.
Cappiello, L., Engle, R., Sheppard, K., 2006. Asymmetric dynamics in the correlations of
global equity and bond returns. Journal of Financial Econometrics 4, 537-572.
Christopher, R., Kim, S-J., Wu, E., 2012. Do sovereign credit ratings influence regional stock
and bond market interdependencies in emerging countries? Journal of International
Financial Markets, Institutions and Money 22, 1070-1089.
Connolly, R., Stivers, C., Sun, L., 2005. Stock market uncertainty and the stock-bond return
relation. Journal of Financial and Quantitative Analysis 40, 161-194.
Connolly, R., Stivers, C., Sun, L., 2007. Commonality in the time-variation of stock-stock
and stock-bond return comovements. Journal of Financial Markets 10, 192-218.

22
Croux, C., Forni, M., Reichlin, L., 2001. A measure of comovement for economic variables:
Theory and empirics. The Review of Economics and Statistics 83, 232-241.
Graham, M., Kiviaho, J., Nikkinen, J., 2012. Integration of 22 emerging stock markets: a
three-dimensional analysis. Global Finance Journal 23, 34-47.
Grinsted, A., Moore, J. C., Jevrejeva, S., 2004. Application of cross wavelet transform and
wavelet coherence to geophysical time series. Nonlinear Processes in Geophysics 11,
561-566.
Gulko, L., 2002. Decoupling. Journal of Portfolio Management 28, 59-67.
Harrison, P., Zhang, H.H., 1999. An investigation of the risk and return relation at long
horizons. Review of Economics and Statistics 81, 399-408.
Ilmanen, A., 2003. Stock-bond correlations. Journal of Fixed Income 13, 55-66.
Kelly, J. M., Martins, L. F., Carlson, J. H., 1998. The relationship between bonds and stocks
in emerging countries. Journal of Portfolio Management 24, 110-122.
Kim, S., In, F., 2005. The relationship between stock returns and inflation: new evidence
from wavelet analysis. Journal of Empirical Finance 12, 435-444.
Kim, S., In, F., 2007. On the relationship between changes in stock prices and bond yields in
the G7 countries: wavelet analysis. Journal of International Financial Markets,
Institutions and Money 17, 167-179.
Kim, S-J., Moshirian, F., Wu, E., 2006. Evolution of international stock and bond market
integration: Influence of the European Monetary Union. Journal of Banking and
Finance 30, 1507-1534.
Kiviaho, J., Nikkinen, J., Piljak, V., Rothovius, T., 2014. The co-movement dynamics of
European frontier stock markets. European Financial Management 20, 574-595.
Li, L., 2004. Macroeconomic factors and the correlation of stock and bond returns. In
Proceeding of the 2004 American Finance Association Meeting.

23
O'Brien, R.M., 2007. A caution regarding rules of thumb for variance inflation factors.
Quality and Quantity 41, 673-690.
Panchenko, V., Wu, E., 2009. Time-varying market integration and stock and bond return
concordance in emerging markets. Journal of Banking and Finance 33, 1014–1021.
Piljak, V., 2013. Bond markets co-movement dynamics and macroeconomic factors:
Evidence from emerging and frontier markets. Emerging Markets Review 17, 29-43.
Rua, A., 2010. Measuring comovement in the time-frequency space. Journal of
Macroeconomics 32, 685-691.
Rua, A., Nunes, L. C., 2009. International comovement of stock market returns: a wavelet
analysis. Journal of Empirical Finance 16, 632-639.
Torrence, C., Compo, G. P., 1998. A practical guide to wavelet analysis. Bulletin of the
American metrological society 79, 61-78.
Yang, Y., Zhou, Y., Wang, Z., 2009. The stock-bond correlation and macroeconomic
conditions: One and a half centuries of evidence. Journal of Banking and Finance 33,
670-680.

24
Table 1: Descriptive statistic for stock and bond market returns
This table presents the summary statistics for stock (Panel A) and bond market returns (Panel B) in the emerging markets and the US. Data period spans from 1 January 2001 to 31 December 2013 for a total of 156 monthly observations.
Panel A: Stock market returns
Argentina Brazil Bulgaria Colombia Mexico Peru Philippines Russia Turkey Venezuela US
Mean 0.0053 0.0103 0.0123 0.0235 0.0117 0.0169 0.0098 0.0123 0.0060 0.0190 0.0038 Median 0.0137 0.0153 0.0189 0.0310 0.0184 0.0198 0.0156 0.0246 0.0255 0.0137 0.0117 Maximum 0.4247 0.2509 0.3484 0.2225 0.1590 0.2394 0.1762 0.2770 0.3707 0.4838 0.1037 Minimum -0.5392 -0.3864 -0.5816 -0.3308 -0.3664 -0.4470 -0.2788 -0.4350 -0.5318 -0.6398 -0.1839 Std. Dev. 0.126 0.105 0.109 0.085 0.071 0.090 0.073 0.101 0.141 0.127 0.045 Skewness -0.760 -0.786 -1.164 -0.594 -1.219 -0.970 -0.406 -0.790 -0.622 -0.743 -0.836 Kurtosis 5.489 4.880 8.905 4.527 7.399 6.517 3.914 4.993 4.350 9.482 4.430
Panel B: Bond market returns
Argentina Brazil Bulgaria Colombia Mexico Peru Philippines Russia Turkey Venezuela US
Mean -0.0005 0.0092 0.0064 0.0090 0.0068 0.0088 0.0094 0.0108 0.0089 0.0093 0.0042 Median 0.0111 0.0131 0.0068 0.0119 0.0077 0.0109 0.0085 0.0109 0.0110 0.0145 0.0050 Maximum 0.2912 0.2349 0.0678 0.1155 0.1171 0.1159 0.0747 0.1046 0.1175 0.1246 0.0940 Minimum -0.5781 -0.2099 -0.1739 -0.1340 -0.0753 -0.1584 -0.0970 -0.1369 -0.1715 -0.2553 -0.0736 Std. Dev. 0.101 0.049 0.023 0.031 0.023 0.036 0.024 0.030 0.040 0.051 0.023 Skewness -1.683 -0.454 -2.902 -0.827 -0.132 -1.071 -0.560 -0.698 -0.941 -1.462 0.054 Kurtosis 10.738 11.935 26.598 7.954 6.837 7.125 4.870 6.997 6.544 8.173 4.514
25
Table 2: Unconditional stock-bond correlations The table shows the unconditional correlations of stock and bonds returns for the emerging markets and the US. *** denote statistical significance at the 1% level. Correlation t-statistics Probability Argentina
0.4786***
6.7640
0.0000
Brazil
0.6832***
11.6102
0.0000 Bulgaria
0.4023***
5.4533
0.0000
Colombia
0.5385***
7.9304
0.0000 Mexico
0.4312***
5.9316
0.0000
Peru
0.5249***
7.6528
0.0000 Philippines
0.4609***
6.4447
0.0000
Russia
0.6197***
9.7988
0.0000 Turkey
0.6752***
11.3607
0.0000
Venezuela
0.1304
1.6325
0.1046 US -0.3662*** -4.8831 0.0000

26
Table 3: Relationship of the stock-bond correlations with the domestic macroeconomic
factors and the global financial market uncertainty in emerging markets and the USA
This table represents the regression model results linking the short- and long-term horizons of wavelet correlation with domestic macroeconomic factors and global financial uncertainty (Equation 4). The explanatory variables include two global factors originating in US market: VIX (Chicago Board Options Exchange Implied Volatility Index as proxy for global stock market uncertainty) and MOVE (Merrill Lynch Option Volatility Estimate Index as proxy for global bond market uncertainty). Domestic macroeconomic factors include: CPI (the Consumer Price Index as proxy for inflation environment), IP (the Industrial Production Index as proxy for domestic business cycle fluctuations), and IIR (the three-month interbank interest rate as a proxy for monetary policy stance). Figures in parenthesis are the Newey-West robust standard errors. *, **, *** denote statistical significance at the 10%, 5% and 1% respectively.
Panel A: Short-term horizon (f=0.25 year)
α VIX MOVE 𝑊𝐶𝑉𝑑𝑑𝑑𝑑𝑠𝑡𝑖𝑑 𝑉𝐶𝑑𝑑𝑑𝑑𝑠𝑡𝑖𝑑 𝑉𝑉𝑊𝑑𝑑𝑑𝑑𝑠𝑡𝑖𝑑 R² Argentina -0.7843** 0.0130*** -0.0008 0.0029 0.0061 -0.0095*** 0.652
(0.3841) (0.0043) (0.0015) (0.0025) (0.0040) (0.0021)
Brazil 1.2880 -0.0023 -0.0019 0.0003 -0.0196 0.0304** 0.233
(0.8743) (0.0067) (0.0020) (0.0003) (0.0136) (0.0144)
Bulgaria -0.5015 -0.0154*** 0.0009 0.0000 0.0032 -0.0515 0.260
(0.3509) (0.0052) (0.0016) (0.0001) (0.0040) (0.0320)
Colombia -2.2137*** 0.0096* -0.0016 0.0178*** 0.0037 0.0772*** 0.495
(0.4879) (0.0054) (0.0020) (0.0056) (0.0043) (0.0264)
Mexico -2.1035** -0.0040 0.0036** 0.0306*** -0.0122 0.0746*** 0.584
(1.0204) (0.0055) (0.0016) (0.0056) (0.0111) (0.0192)
Peru 0.8891 0.0178*** 0.0012 -0.0072 0.0007 -0.0968*** 0.460
(0.7675) (0.0043) (0.0014) (0.0139) (0.0032) (0.0247)
Philippines -0.5863 -0.0167** 0.0058*** 0.0035 0.0048 -0.0517 0.386
(0.8768) (0.0082) (0.0019) (0.0064) (0.0031) (0.0475)
Russia 2.5270*** 0.0093 -0.0007 0.0023* -0.0238** -0.0510*** 0.240
(0.7120) (0.0064) (0.0023) (0.0013) (0.0102) (0.0117)
Turkey 1.3502** -0.0097 0.0044*** -0.0016 -0.0070* -0.0091 0.284
(0.5489) (0.0062) (0.0017) (0.0034) (0.0043) (0.0167)
Venezuela 1.0331*** 0.0051 -0.0016 0.0006 0.0000 -0.0198*** 0.228
(0.3275) (0.0057) (0.0015) (0.0005) (0.0000) (0.0044)
USA -3,0742 -0,0173* 0,0083*** 0,0096** 0,0037 0,0121 0,190
(2,0761) (0,0099) (0,0027) (0,0045) (0,0256) (0,0545)

27
Table 3 (continued)
Panel B: Long-term horizon (f= 2 years) α VIX MOVE 𝑊𝐶𝑉𝑑𝑑𝑑𝑑𝑠𝑡𝑖𝑑 𝑉𝐶𝑑𝑑𝑑𝑑𝑠𝑡𝑖𝑑 𝑉𝑉𝑊𝑑𝑑𝑑𝑑𝑠𝑡𝑖𝑑 R² Argentina 0.5106*** 0.0039*** 0.0004 0.0077*** 0.0056*** 0.0004 0.920
(0.0604) (0.0013) (0.0003) (0.0005) (0.0006) (0.0004)
Brazil 0.9146*** 0.0030*** 0.0006** -0.0001*** -0.0010 -0.0055** 0.789
(0.1195) (0.0009) (0.0002) (0.0000) (0.0012) (0.0027)
Bulgaria -0.0817 0.0029** -0.0015*** 0.0001*** 0.0014* 0.0313*** 0.858
(0.0768) (0.0014) (0.0005) (0.0000) (0.0008) (0.0067)
Colombia -1.6784*** 0.0031* -0.0002 0.0166*** 0.0044*** 0.0201** 0.930
(0.1404) (0.0019) (0.0006) (0.0015) (0.0009) (0.0083)
Mexico 1.0286* -0.0115** 0.0034*** 0.0216*** 0.0107 0.0067 0.740
(0.5320) (0.0049) (0.0008) (0.0052) (0.0092) (0.0163)
Peru -0.6752*** 0.0036** 0.0000 0.0074** 0.0030*** 0.0096 0.902
(0.1873) (0.0016) (0.0005) (0.0032) (0.0008) (0.0107)
Philippines 0.7578*** -0.0007 0.0007*** 0.0016** 0.0000 0.0160** 0.808
(0.1070) (0.0007) (0.0002) (0.0008) (0.0003) (0.0072)
Russia -0.7763*** 0.0063* 0.0002 0.0019*** 0.0081*** -0.0041 0.844
(0.1896) (0.0033) (0.0009) (0.0004) (0.0026) (0.0060)
Turkey 2.0277*** 0.0008 -0.0002 0.0076*** -0.0011* -0.0180*** 0.948
(0.1030) (0.0011) (0.0003) (0.0005) (0.0006) (0.0023)
Venezuela -0.0156 0.0023** 0.0000 -0.0023*** 0.0002*** 0.0009 0.958
(0.0491) (0.0009) (0.0003) (0.0001) (0.0000) (0.0007)
USA -2.0932*** -0.0018** -0.0005* 0.0044*** 0.0073*** -0.0106** 0.909
(0.1910) (0.0009) (0.0003) (0.0004) (0.0022) (0.0042)

28
Figure 1: Stock-bond correlations for Argentina, Brazil, Bulgaria, Colombia, Mexico
and Peru based on the wavelet correlation measure.
This figure presents the wavelet based correlation measure of the stock-bond correlations for
both the emerging markets and the USA. Time and frequency are represented on the
horizontal and vertical axes, respectively. The wavelet correlation value is pictured by
different shades of gray color, indicated on gray scale from -1 to 1.

29
Figure 1 (cont.): Stock-bond correlations for Philippines, Russia, Turkey, Venezuela
and the USA based on the wavelet correlation measure.
This figure presents the wavelet based correlation measure of the stock-bond correlations
for both the emerging markets and the USA. Time and frequency are represented on the
horizontal and vertical axes, respectively. The wavelet correlation value is pictured by
different shades of gray color, indicated on gray scale from -1 to 1.


