
Impact of External Temperature Environment
on Large FCBGA Sn-Ag-Cu Solder Interconnect
Board Level Mechanical Shock Performance
Tae-Kyu Lee
Journal of Welding and Joining(Vol. 32, No. 3)
2014. 6

This is an Open-Access article distributed under the terms of the Creative Commons Attribution Non-Commercial License(http://creativecommons.org/licenses/by-nc/3.0) which permits unrestricted non-commercial use, distribution, and reproduction in any medium, provided the original work is properly cited.
Journal of Welding and Joining, Vol.32 No.3(2014) pp53-59
http://dx.doi.org/10.5781/JWJ.2014.32.3.53
53
Impact of External Temperature Environment on Large FCBGA Sn-Ag-Cu Solder Interconnect Board Level
Mechanical Shock Performance
Tae-Kyu Lee*,†
*Component Quality and Technology Group, Cisco Systems, Inc., San Jose, CA 95134
†Corresponding author : [email protected](Received June 24, 2014 ; Accepted June 26, 2014)
Abstract The mechanical stability of solder joints in electronic devices with Sn-Ag-Cu is a continuous issue since the material was applied to the industry. Various shock test methods were developed and standardized tests are used in the industry worldwide. Although it is applied for several years, the detailed mechanism of the shock induced failure mechanism is still under investigation. In this study, the effect of external temperaturewas observed on large Flip-chip BGA components. The weight and size of the large package produced a high strain region near the corner of the component and thus show full fracture at around 200G level shock input. The shock performance at elevated temperature, at 100℃ showed degradation based on board pad designs. The failure mode and potential failure mechanisms are discussed
Key Words : Solder, Mechanical shock, FCBGA, Reliability
ISSN 1225-6153
Online ISSN 2287-8955
1. Introduction
With more function and capacity on a single
Silicon chip, we can see a higher density com-
ponent trend in one side, like consumer electro-
nics which needs smaller form factor and lighter
packages to fit their product design features.
But on the other side, the higher functionality
and at the same time the high speed capacity
brings the component to a larger silicon die,
with ending up in a larger than ever body size
component. It is not unusual to see a 50+ mm
package in the telecom industry these days.
With larger body size and heavier weight per
components, the solder joints have a higher
chance to experience a greater challenge for
mechanical shock. It is well known that Tin
based solder alloy, like Sn-Ag-Cu solder joints
are more rigid from a mechanical property
standpoint, due to its higher modulus and long
stress relaxation time, than conventional Sn-Pb
eutectic solder joints. Because of this property,
exposed to dynamic operating conditions, such
as shock and bending, has been a point of
concern1-6). Another factor to consider is the
temperature of the component in full function.
Since these large BGA components are high
performance components and their junction
temperature easily brings this component to a
higher temperature state. Thus, the shock
performance needs to be observed not only at
room temperature but also at elevated tempera-
tures, which is expected to be different because
the mechanical properties of the Sn-Ag-Cu solder
joint is expected to be different at higher tempe-
ratures. This study presented here, is subject
to see the overall shock performance of a 52.5×
52.5mm2 Flip Chip ball grid array (FCBGA)
component at both room temperature and 100℃
temperature environment. The failure modes
and mechanism will be discussed.
Research Paper

Tae-Kyu Lee
268 Journal of Welding and Joining, Vol. 32, No. 3, 2014
54
Package
PCBPCB
Cu padCu pad
Solder ballSolder ball
ImmersionImmersion SnSn finishfinish
Package
Cu padCu pad
Solder ballSolder ball
PCBPCB
ImmersionImmersion SnSn finishfinish
Solder mask defined (SMD) Board pad
Non-solder mask defined (NSMD)Board pad
Bodysize :52.5x52.5 mm FCBGA 2597 balls, 1.0mm pitch, Ball diameter : 0.635mmSolder ball metallurgy: 96.5Sn-3.0Ag-0.5Cu (SAC305)2.36mm thickness. High Tg FR4, 8 layered
Strain Gauge
Accelerometer
(a)
52.5mm
(b)
154.2 mm
127 mm
Fig. 1 (a) Shock test board configuration (b) sche-
matically shown board side solder mask
defined (SMD) and Non-solder mask defined
(NSMD) pad design
Test board
Drop table
Stopper
0 1 2 3 4 5 6 7 8 9 10
-200
-100
0
100
200
300 Input table shock G levelMeasured G level from test board
Shock
Level (G
)
Time (ms)
Input and measured shock G level(b)(a)
Fig. 2 (a) Shock test set up and (b) measured
input shock level and G level at the com-
ponent edge on the board. Location of the
accelerometer is shown in Fig. 1(a)
Experimental Procedure
In this study observing the shock performance,
1.0-mm-pitch daisy-chained full-array flip chip
ball grid array (FCBGA) packages with a size
of 52.5 mm × 52.5 mm were used. Each package
was assembled on 2.36mm eight-layered print
circuit board (PCB) with adequate connection
to form two separate daisy chain circuits as
shown in Fig. 1(a). Two pad designs were
selected to see the performance difference
between solder mask defined (SMD) and Non-
solder mask defined (NSMD) pad designs. The
illustrations for both pad designs are shown in
Fig. 1(b). Regarding the monitoring and
connectivity measurement during shock, one
daisy chain is connected to the corner solder
joints to monitor the solder joint connection
during shock test and the other daisy chain
was distributed under the silicon die area to
provide as a heat source during the test. A
calibrated current was passed through the
inner daisy chain region to bring the temper-
ature up to 100℃ at the corner joints, which
was measured by a K-type thermocouple.
Sn-3.0Ag-0.5Cu (wt%) (SAC305) solder alloy
solder joints and solder paste were used for
assembly. The PCB used was an organic solder-
ability preservative (OSP) finish high-Tg FR4
test board. As seen in Fig. 1(a), the mounting
holes were located in a 127mm × 127mm con-
figuration. The test board was fixed onto the
drop table by four support standoff screws. The
schematic of the shock test set up is shown in
Fig. 2(a). To apply a shock wave, the drop
table was raised and dropped from a calibrated
height adjusted on the basis of the peak accele-
ration half-sine shock pulse with a 1.5mili-
second duration. With an input shock of 200G
at the table, the corner of the component
experienced a shock level of 300G as shown in
Fig. 2(b). The associated strain value at the
corner was 1700 microstrain at peak principal
strain. An accelerometer was attached to both
the table and board as indicated in Fig. 1(a).
For both room temperature and 100 ℃ elevated
temperature tests, the G level and the strain
were maintained at the same level with little
difference in principal max strain and max G
levels. Each test board run started at 200G
shock level until failure. The boards were
managed to have the component on topside
first with three times in the +z direction and
three times in the -z direction after that until
the failure occurred. All test boards were moni-
tored in-situ for its electrical continuity during
the shock test to detect failures. An increase
in resistance of 20% of the initial resistance
value during the test was considered a failure.
Tested boards were analyzed by dye-and-pry
analysis to observe the failure mode. Optical
microscopy and polarized light microscope images
were also taken to observe solder joint failures
and IMC growth.
Impact of External Temperature Environment on Large FCBGA Sn-Ag-Cu Solder Interconnect Board Level Mechanical Shock Performance
大韓熔接․接合學 誌 第32卷 第3號, 2014年 6月 269
55
PCB
Board fluctuation
cause strain at solder joint
Drop shock
Package side interface IMC
crack initiation and propagation
Laminate crack
Board side IMC crack
Ground or impact plate
(a) (b) (c) Package side
100㎛Board side
component
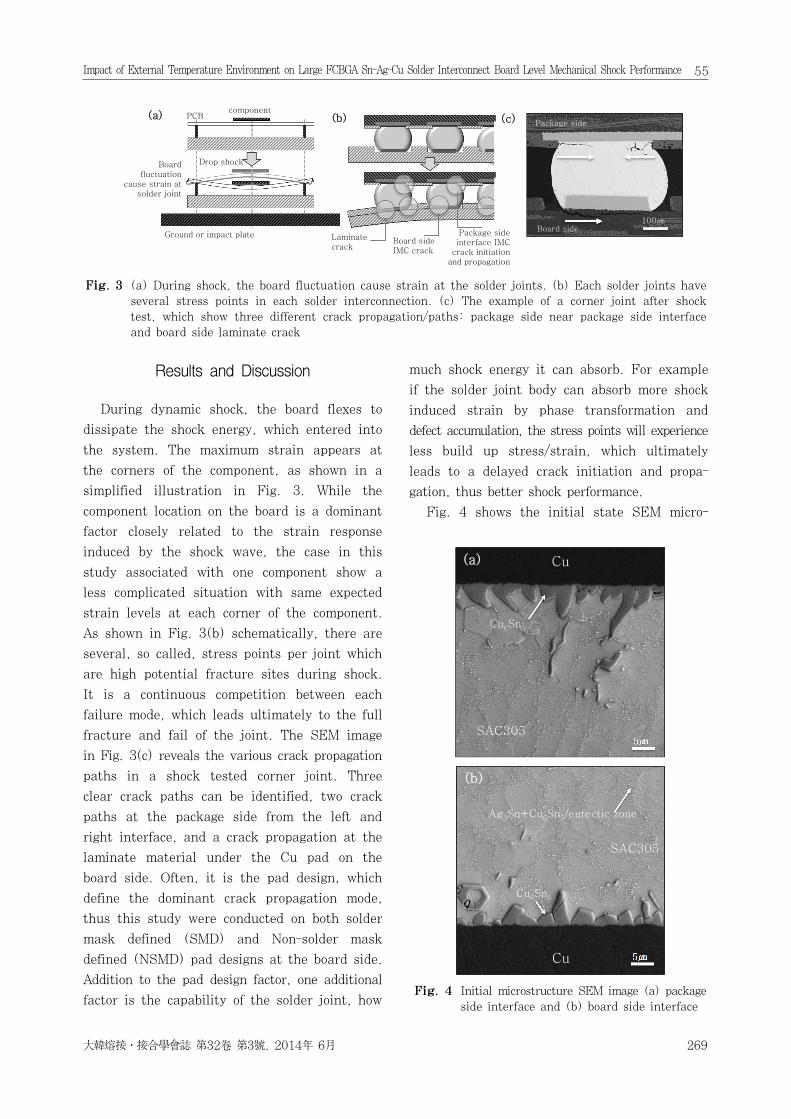
Fig. 3 (a) During shock, the board fluctuation cause strain at the solder joints. (b) Each solder joints have
several stress points in each solder interconnection. (c) The example of a corner joint after shock
test, which show three different crack propagation/paths: package side near package side interface
and board side laminate crack
(a) Cu
Cu6Sn5
SAC305
(b)
Cu
SAC305
Ag3Sn+Cu6Sn5/eutectic zone
Cu6Sn5
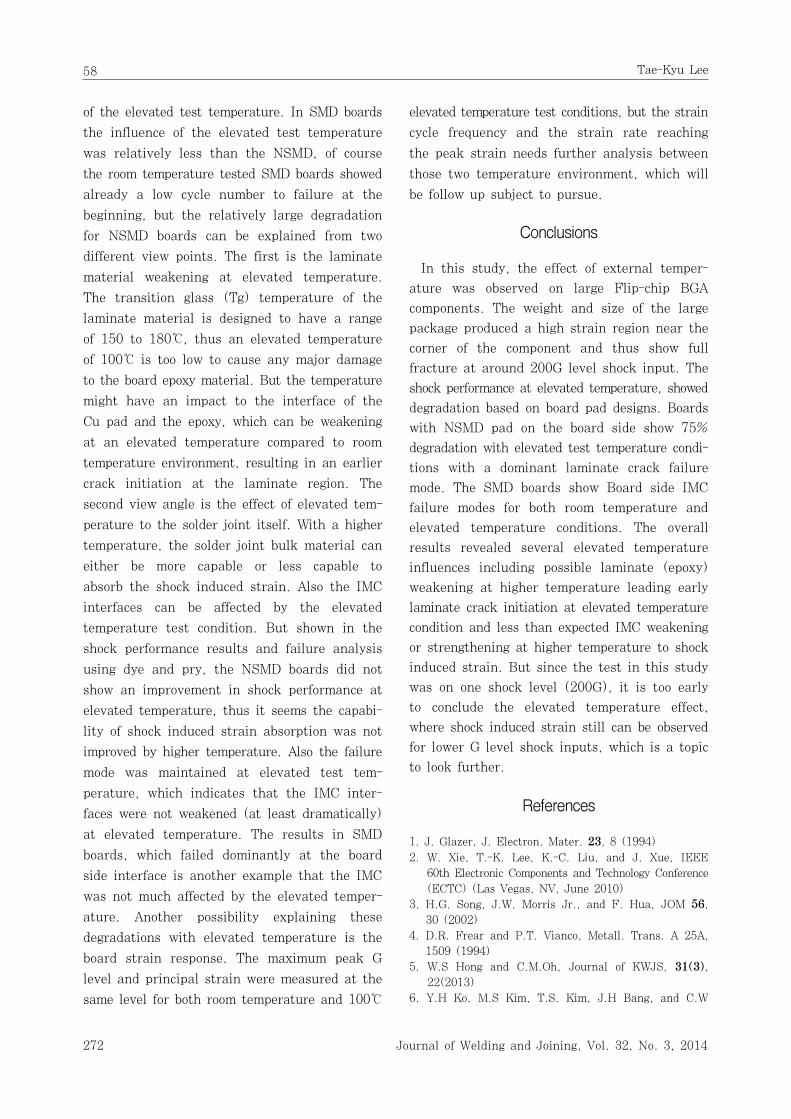
Fig. 4 Initial microstructure SEM image (a) package
side interface and (b) board side interface
Results and Discussion
During dynamic shock, the board flexes to
dissipate the shock energy, which entered into
the system. The maximum strain appears at
the corners of the component, as shown in a
simplified illustration in Fig. 3. While the
component location on the board is a dominant
factor closely related to the strain response
induced by the shock wave, the case in this
study associated with one component show a
less complicated situation with same expected
strain levels at each corner of the component.
As shown in Fig. 3(b) schematically, there are
several, so called, stress points per joint which
are high potential fracture sites during shock.
It is a continuous competition between each
failure mode, which leads ultimately to the full
fracture and fail of the joint. The SEM image
in Fig. 3(c) reveals the various crack propagation
paths in a shock tested corner joint. Three
clear crack paths can be identified, two crack
paths at the package side from the left and
right interface, and a crack propagation at the
laminate material under the Cu pad on the
board side. Often, it is the pad design, which
define the dominant crack propagation mode,
thus this study were conducted on both solder
mask defined (SMD) and Non-solder mask
defined (NSMD) pad designs at the board side.
Addition to the pad design factor, one additional
factor is the capability of the solder joint, how
much shock energy it can absorb. For example
if the solder joint body can absorb more shock
induced strain by phase transformation and
defect accumulation, the stress points will experience
less build up stress/strain, which ultimately
leads to a delayed crack initiation and propa-
gation, thus better shock performance.
Fig. 4 shows the initial state SEM micro-

Tae-Kyu Lee
270 Journal of Welding and Joining, Vol. 32, No. 3, 2014
56
0
5
10
15
20
25
SMD
Shock
cycl
e n
um
ber
to f
ailu
re
Test Temperature and pad design
Tested at RTTested at 100 ℃Average cycle number to failure
NSMD
Room Temperature at100℃ Room Temperature at100℃
Fig. 5 Shock test results at both room temperature
and 100℃ elevated temperature environment
testing condition per board side NSMD and
SMD pad design
IMC crack at the package side interface
Laminate crack at Board side
IMC crack at the board side interface
NSMD pad
SMD pad
NSMD SMD
Shock
test
at
room
tem
pera
ture
Shock
test
at
100
oC
Fig. 6 Dye and pry results at both room temperature
and 100℃ elevated temperature environment
testing condition per board side NSMD and
SMD pad design
structure at the package side and board side
interface. Since the surface finish for both side
were Cu OSP, the intermetallic phase at the
interface were Cu6Sn5 with scallop shape IMCs.
Finely distributed IMC precipitates inside the
solder bulk can be seen, which are well know
as a mixture of Ag3Sn and Cu6Sn5 IMC preci-
pitates. It has been reported that after isother-
mal aging, these mixed/eutectic structure are
being accumulate and transformed to equiaxed
grain structure with larger IMC precipitates in
fewer numbers7,8). But in this study, the effects
of isothermal aging condition are not covered.
During applying the input table shock of
200G to the test boards, the continuity of the
daisy chain were closely monitored using a
data logger and the results are shown in Fig.
5. Three boards were tested for each condition
and design variation. As shown in the result
plot, the NSMD boards tested at room temper-
ature show a cycle number to failure around
18 to 19 cycles. But immediately degraded to
around 5 cycles to failure for the boards tested
at 100℃ elevated temperature, which is a 75%
shock performance degradation.
In case of SMD boards, the cycle to failures
occurred in an already low number, around 2
cycles and degraded further to 1 cycle to failure
a 50% degardation. It is clearly shown that
the board side pad design implies a large effect
to the shock performance with an identical
component configuration. This brings an impor-
tant design guideline subject to better shock
performance for large body size and heavy
components.
Fig. 6 shows the dye and pry results on
selected components after the shock test to
failure. The results show several obvious obser-
vations. The first is that the NSMD boards
failure modes are dominantly laminate crack
propagation. For both room temperature and
elevated temperature tested boards, the laminate
crack path was the failure mode for NSMD
boards. On the other hand the SMD boards
show mainly the crack propagation through the
board side interface. The detailed crack path
will be discussed later in Fig. 8, but it is clear
that the failure mode for both room temperature
and elevated temperature are at the board side
interface. The second observation is that the
testing temperature did not made the failure
mode shift from one to the other. For both
NSMD and SMD, the same failure modes were
identified regardless of the testing temperature.
Fig. 7 show the optical images of cross sections
from the corner region for NSMD board sam-
ples (Fig. 7(a)) and SMD board (Fig. 7(b)).
The inset images are the higher magnification
polarized optical images from the images above

Impact of External Temperature Environment on Large FCBGA Sn-Ag-Cu Solder Interconnect Board Level Mechanical Shock Performance
大韓熔接․接合學 誌 第32卷 第3號, 2014年 6月 271
57
B1 C1 D1 E1 F1 G1
(a)
B1B1 C1C1 D1D1 E1E1
B1B1 C1C1 D1D1 E1E1
(b)
B1 C1 D1 E1 F1 G1
NSMD test board tested at room temperature
SMD test board tested at elevated temperature
FCBGA Package (corner)
FCBGA Package (corner)
PCB
PCB
Fig. 7 Cross section optical images after shock test.
(a) NSMD board after shock test at room
temperature. The inset images are higher
magnification Polarized images. (b) SMD
board shock tested at 100℃ elevated tem-
perature. The inset is the polarized images
from B1 to E1 joint. B1 joint show twin
structure inside the solder bulk region. Crack
propagation paths are indicated by white
boxes
(a)
(b)
5㎛
100㎛
SMD test board tested at room temperature
Package side
PCB
Board side
Board side
Cu pad
SAC305
Cu6Sn5
Cu
SAC305
Fig. 8 Cross section SEM images from a selected
joint in a SMD board, shock tested at
room temperature. (a) overall joint view
and (b) higher magnification SEM image of
the lower left corner. Region indicated in
Fig. 8(a)
it. Crack paths are indicated in the box.
Aligned with the dye and pry results shown in
Fig. 6, the NSMD board solder joints show
dominant crack propagation at the laminate
region and the SMD a crack propagation at
booth package side and board side interface,
with a dominant crack path at the board side
interface. It is also interesting to identify twin
structure development at the B1 joint in Fig. 7(b)
inset. A related publication on shock induced
twin formation can be found elsewhere9,10).
Fig. 8 is a set of SEM images from a SMD
board solder joint after shock test to see crack
path/propagation in more detail. The crack
initiation can be claimed to be start from the
corner of the joint slightly inside the solder
bulk area near the interface. It is often a
discussion item whether the IMC interface is
the crack initiation site for shock induced cracks,
but all of the solder joints in this study, which
have a board side crack propagation, showed
the crack initiation from the solder bulk region
penetrating into the IMC interface for further
propagation. The SEM image in Fig. 8(b) also
shows the same representative crack path/propa-
gation, which a crack is initiated from the bulk
into the IMC interface and then further propagated
through the root of the Cu6Sn5 IMC scallops.
Comparing to the NSMD boards, this crack
propagation in SMD boards are relatively
easier than propagation in laminate regions.
Addition to that, the crack propagation in IMC
has higher possibilities of showing faster electrical
discontinuity (by measuring the resistivity during
shock test) than laminate crack failure modes.
Because the laminate crack mode needs to cut
through the Cu trace to show the full discon-
tinuity, which is expected to be relatively late
than the interface solder crack in SMD samples.
Overall, the faster crack propagation in boards
side interface regions through the IMC root is
a fast propagation, which can be the main
reason for a shorter life cycle time than NSMD
boards. Another important factor is the influence
Tae-Kyu Lee
272 Journal of Welding and Joining, Vol. 32, No. 3, 2014
58
of the elevated test temperature. In SMD boards
the influence of the elevated test temperature
was relatively less than the NSMD, of course
the room temperature tested SMD boards showed
already a low cycle number to failure at the
beginning, but the relatively large degradation
for NSMD boards can be explained from two
different view points. The first is the laminate
material weakening at elevated temperature.
The transition glass (Tg) temperature of the
laminate material is designed to have a range
of 150 to 180℃, thus an elevated temperature
of 100℃ is too low to cause any major damage
to the board epoxy material. But the temperature
might have an impact to the interface of the
Cu pad and the epoxy, which can be weakening
at an elevated temperature compared to room
temperature environment, resulting in an earlier
crack initiation at the laminate region. The
second view angle is the effect of elevated tem-
perature to the solder joint itself. With a higher
temperature, the solder joint bulk material can
either be more capable or less capable to
absorb the shock induced strain. Also the IMC
interfaces can be affected by the elevated
temperature test condition. But shown in the
shock performance results and failure analysis
using dye and pry, the NSMD boards did not
show an improvement in shock performance at
elevated temperature, thus it seems the capabi-
lity of shock induced strain absorption was not
improved by higher temperature. Also the failure
mode was maintained at elevated test tem-
perature, which indicates that the IMC inter-
faces were not weakened (at least dramatically)
at elevated temperature. The results in SMD
boards, which failed dominantly at the board
side interface is another example that the IMC
was not much affected by the elevated temper-
ature. Another possibility explaining these
degradations with elevated temperature is the
board strain response. The maximum peak G
level and principal strain were measured at the
same level for both room temperature and 100℃
elevated temperature test conditions, but the strain
cycle frequency and the strain rate reaching
the peak strain needs further analysis between
those two temperature environment, which will
be follow up subject to pursue.
Conclusions
In this study, the effect of external temper-
ature was observed on large Flip-chip BGA
components. The weight and size of the large
package produced a high strain region near the
corner of the component and thus show full
fracture at around 200G level shock input. The
shock performance at elevated temperature, showed
degradation based on board pad designs. Boards
with NSMD pad on the board side show 75%
degradation with elevated test temperature condi-
tions with a dominant laminate crack failure
mode. The SMD boards show Board side IMC
failure modes for both room temperature and
elevated temperature conditions. The overall
results revealed several elevated temperature
influences including possible laminate (epoxy)
weakening at higher temperature leading early
laminate crack initiation at elevated temperature
condition and less than expected IMC weakening
or strengthening at higher temperature to shock
induced strain. But since the test in this study
was on one shock level (200G), it is too early
to conclude the elevated temperature effect,
where shock induced strain still can be observed
for lower G level shock inputs, which is a topic
to look further.
References
1. J. Glazer, J. Electron. Mater. 23, 8 (1994)
2. W. Xie, T.-K. Lee, K.-C. Liu, and J. Xue, IEEE
60th Electronic Components and Technology Conference
(ECTC) (Las Vegas, NV, June 2010)
3. H.G. Song, J.W. Morris Jr., and F. Hua, JOM 56,
30 (2002)
4. D.R. Frear and P.T. Vianco, Metall. Trans. A 25A,
1509 (1994)
5. W.S Hong and C.M.Oh, Journal of KWJS, 31(3),
22(2013)
6. Y.H Ko, M.S Kim, T.S. Kim, J.H Bang, and C.W

Impact of External Temperature Environment on Large FCBGA Sn-Ag-Cu Solder Interconnect Board Level Mechanical Shock Performance
大韓熔接․接合學 誌 第32卷 第3號, 2014年 6月 273
59
Lee, Journal of KWJS, 31(3), 4 (2013)
7. Tae-Kyu Lee, Hongtao Ma, Kuo-Chuan Liu and Jie
Xue, J. Electron. Mater. 39, 2564 (2010)
8. T.-K. Lee, W. Xie, B. Zhou, T. Bieler, and K.-C. Liu,
J. Electron. Mater. 40 (9), 1967 (2009)
Tae-Kyu Lee is a Reliability Engineer
in Cisco Component quality and te-
chnology (CQT) group, Packaging and
Interconnect Technology Team located
in San Jose, CA. Since he joined Cisco
in 2006, he is working on board level
interconnect reliability, next generation
packaging technology and solder material characte-
rizations. Tae-Kyu received his Ph.D. degree in
Materials Science and engineering from University of
California, Berkeley on studies related to high tem-
perature Superconducting Quantum Interference Device
(SQUID) non-destructive evaluation and was a Post-
doctoral fellow in Lawrence Berkeley National Labo-
ratory before joining Cisco. He is actively involved
in several industry consortia and as a lead organizer
for the Lead free solder technology workshop, for the
last five years, and serving as a Vice Chair in the
Electronic Packaging and Interconnect Technology
Committee in TMS. He is also an associate editor in
Journal of Electronic Materials.
9. E. El-Danaf, S.R Kalidindi, R.D. Doherty, Metal.
and Mat. Trans. 30A, 1223 (1999)
10. T.-K. Lee, B. Zhou, T. Bieler, C.Tseng, and J. Duh,
J. Electron. Mater. 42 (2), 215 (2013)


