Illinois Basin – Decatur Project
Sallie E. Greenberg, Ph.D. and the MGSC Project Team Advanced Energy Technology Initiative
University of Illinois – Illinois State Geological Survey
18 August 2015 – Pittsburgh, PA

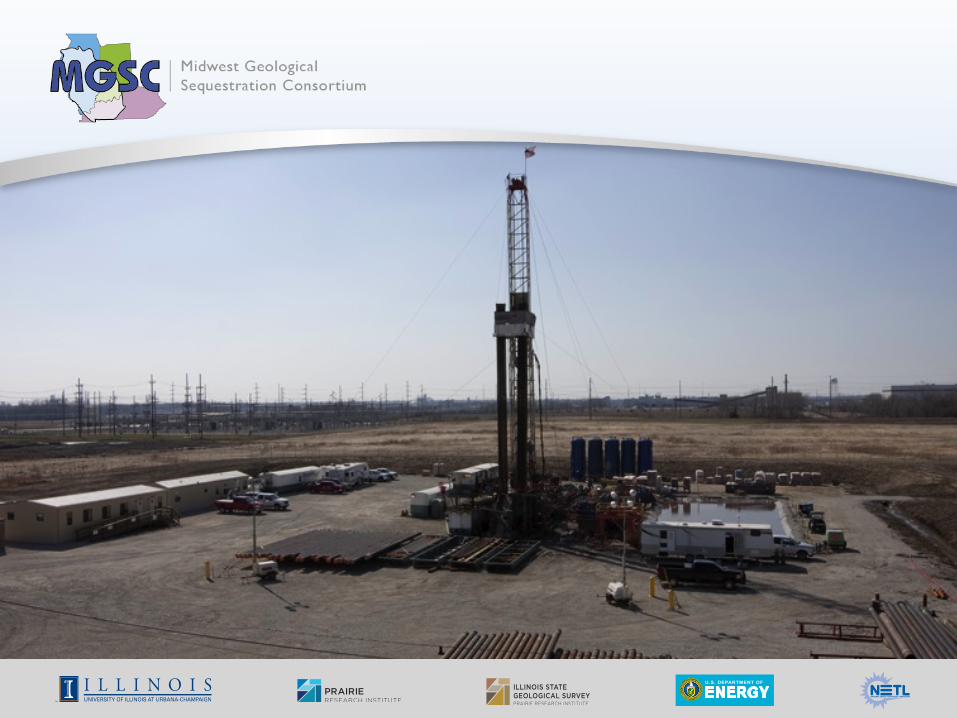
CCS in Decatur, IL USA
Illinois Basin – Decatur Project
• Large-scale demonstration
• Volume: 1 million tonnes • Injection period: 3 years • Injection rate: 1,000 tonnes/d • Compression capacity: 1,100
tonnes/day
• Status: Post-injection monitoring
Illinois Industrial CCS Project
• Industrial-scale
• Volume: 5 million tonnes • Injection period: 3 years • Injection rate: 3,000 tons/d • Compression capacity: 2,200
tonnes/day
• Status: Pre-injection monitoring

~800 meters
North
CCS1
CCS2
VW1
VW2
GM1
GM2
IBDP Wells (Series 1) andICCS wells (Series 2) at ADM
in Decatur, Illinois
Class VI permit issued Sep 2014
Richland Community College
NSEC
Class VI permit issued Feb 2015
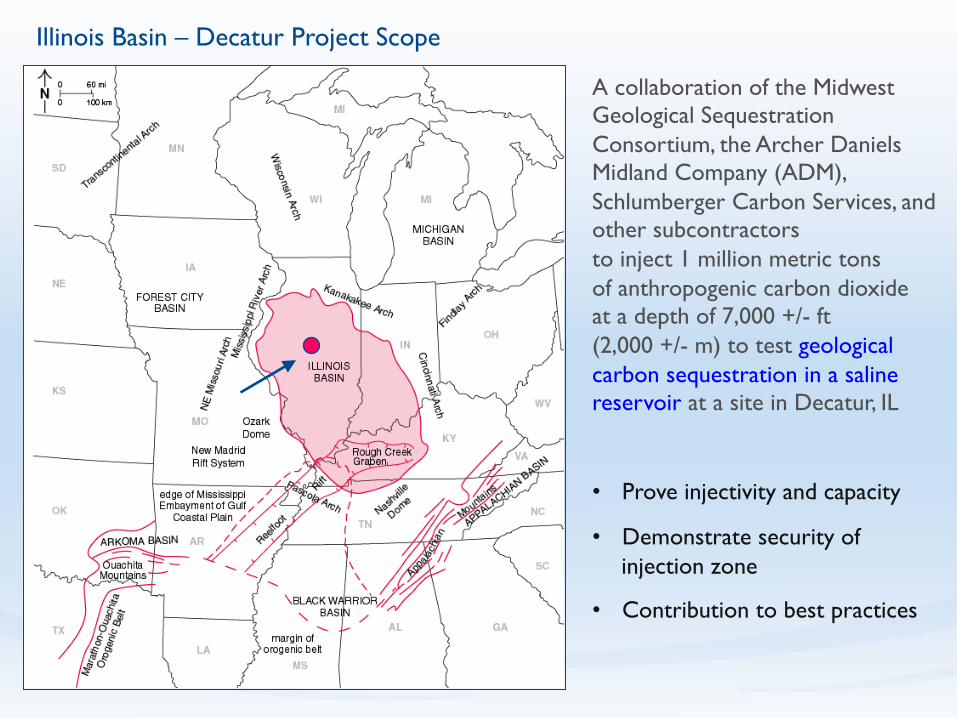
A collaboration of the Midwest Geological Sequestration Consortium, the Archer Daniels Midland Company (ADM), Schlumberger Carbon Services, and other subcontractors ���to inject 1 million metric tons ���of anthropogenic carbon dioxide ���at a depth of 7,000 +/- ft ���(2,000 +/- m) to test geological carbon sequestration in a saline reservoir at a site in Decatur, IL
• Prove injectivity and capacity
• Demonstrate security of injection zone
• Contribution to best practices
Illinois Basin – Decatur Project Scope
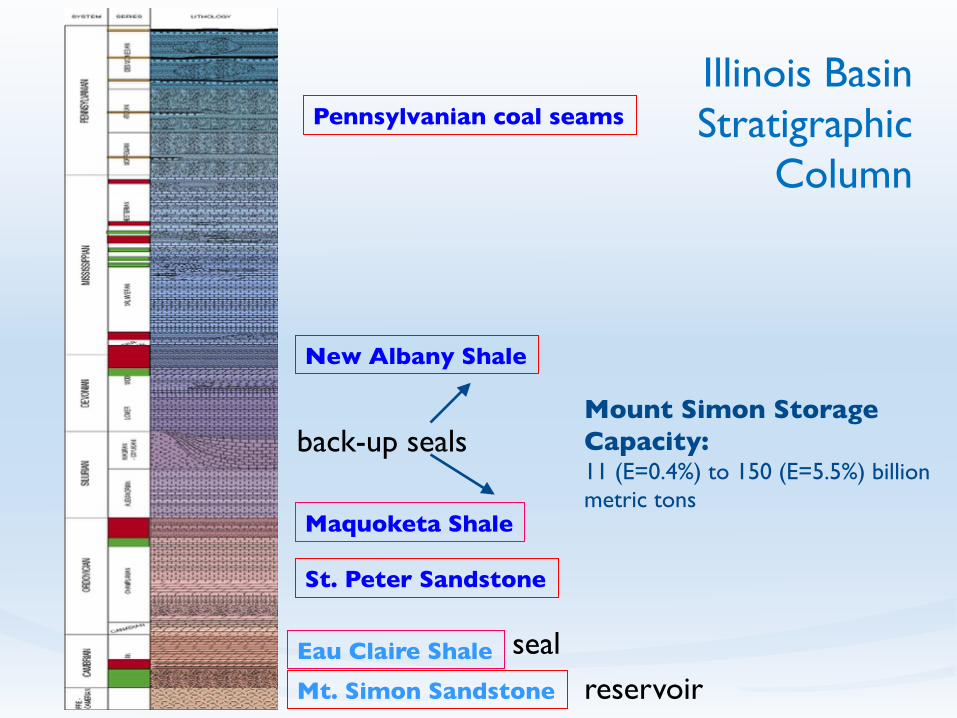
Mt. Simon SandstoneEau Claire Shale
Illinois Basin Stratigraphic
Column
Maquoketa Shale
New Albany Shale
St. Peter Sandstone
Pennsylvanian coal seams
reservoirseal
back-up sealsMount Simon Storage Capacity:11 (E=0.4%) to 150 (E=5.5%) billionmetric tons

Illinois Basin – ���Decatur Project Site���(on ADM industrial site)
A
B
C
D
A Dehydration/ compression facility location
B Pipeline route (1.9 km)C Injection well siteD Verification/ monitoring ���
well siteE Geophone well
800 m
A
B
C
D
A
B
C
D
E
800 m
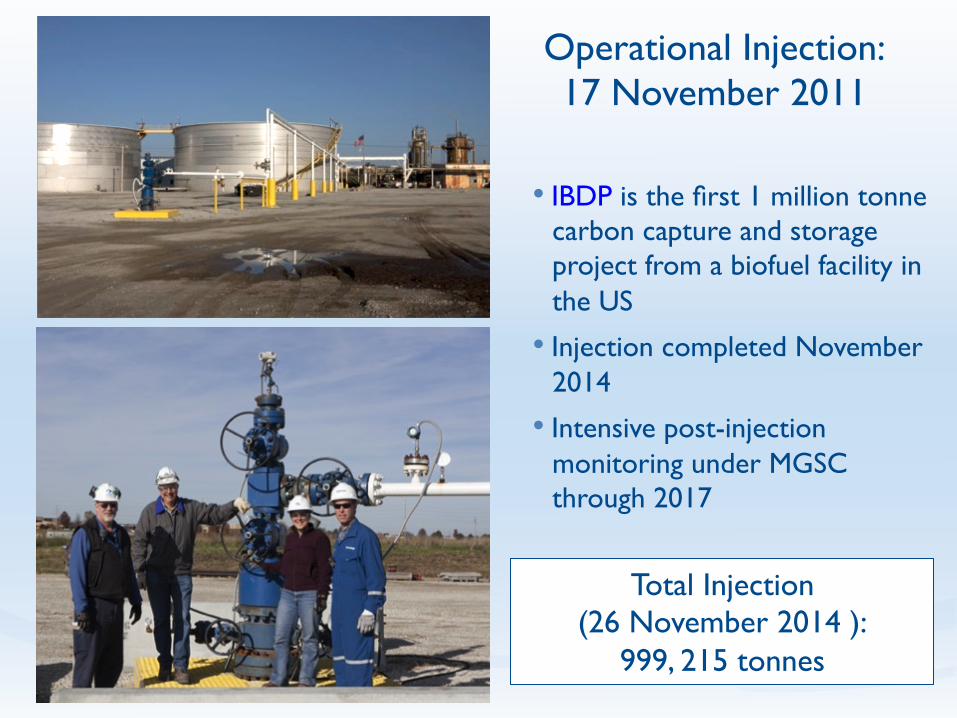
Operational Injection: ���17 November 2011
• IBDP is the first 1 million tonne carbon capture and storage project from a biofuel facility in the US
• Injection completed November 2014
• Intensive post-injection monitoring under MGSC through 2017
Total Injection ���(26 November 2014 ):
999, 215 tonnes
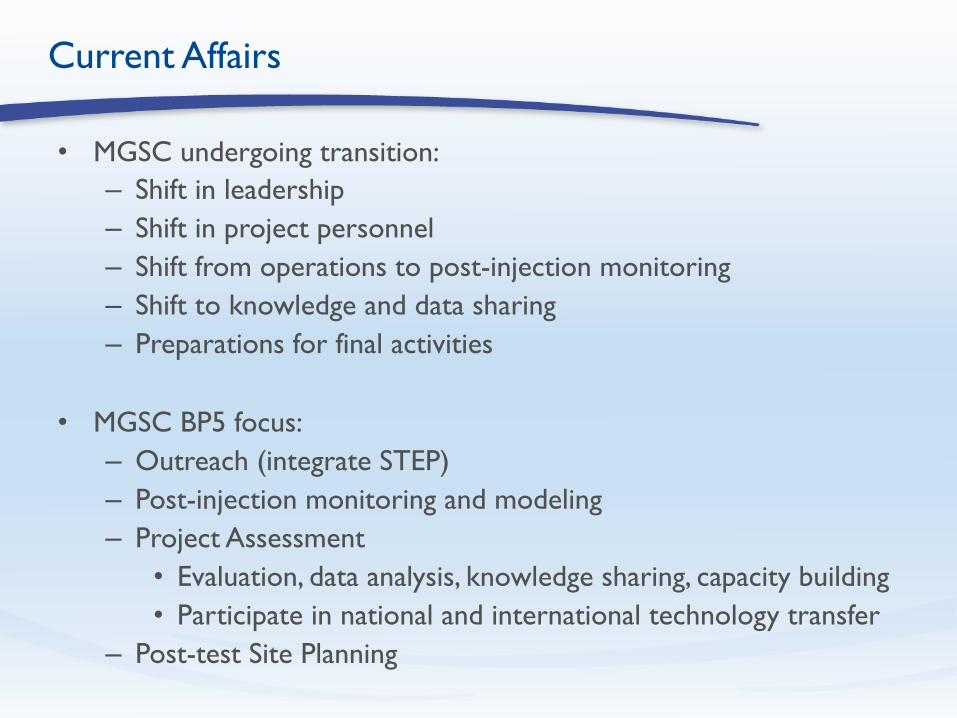
• MGSC undergoing transition: – Shift in leadership – Shift in project personnel – Shift from operations to post-injection monitoring – Shift to knowledge and data sharing – Preparations for final activities
• MGSC BP5 focus: – Outreach (integrate STEP) – Post-injection monitoring and modeling – Project Assessment
• Evaluation, data analysis, knowledge sharing, capacity building • Participate in national and international technology transfer
– Post-test Site Planning
Current Affairs

• 3D Surface Seismic Survey – January 2015 – Processing nearly complete
• Post-injection VSP, permit interim period – January 2015 – Working to improve comparisons between repeat VSPs
• Post-injection near surface monitoring – Moving from injection monitoring to reduced program
• Knowledge and data sharing best practices – Publications – National and international research collaborations – Collective data sets – Teaching data sets
Post-Injection Activities

Aligning Knowledge and Data Sharing Opportunities
Collabora've Research
Scien'fic Poten'al
Interna'onal Coopera'on
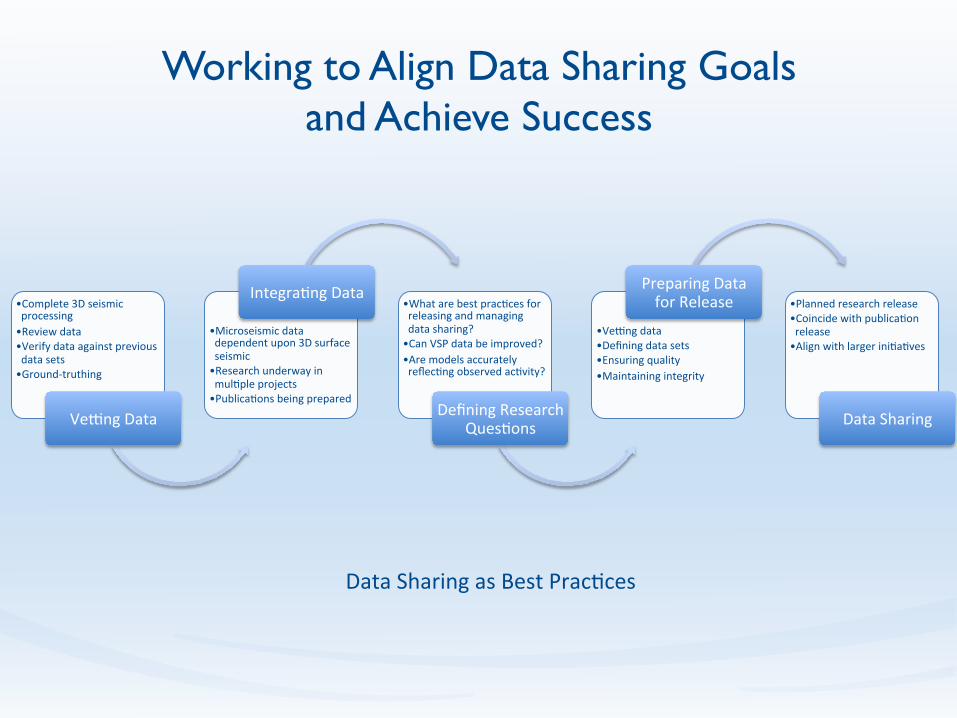
Working to Align Data Sharing Goals and Achieve Success
• Complete 3D seismic processing • Review data • Verify data against previous data sets • Ground-‐truthing
VeDng Data
• Microseismic data dependent upon 3D surface seismic • Research underway in mul'ple projects • Publica'ons being prepared
Integra'ng Data • What are best prac'ces for releasing and managing data sharing? • Can VSP data be improved? • Are models accurately reflec'ng observed ac'vity?
Defining Research Ques'ons
• VeDng data • Defining data sets • Ensuring quality • Maintaining integrity
Preparing Data for Release • Planned research release
• Coincide with publica'on release • Align with larger ini'a'ves
Data Sharing
Data Sharing as Best Prac'ces

! Began public engagement early ! Made public engagement
a priority ! Created, evaluated, and refined
communications plan ! Integrated public engagement
into project management ! Made sufficient investment in
time and resources ! Understood and consulted
community ! Maintained flexibility and
diligence
Outcome: Stakeholder engagement strategy that resonates with the Public

Research Q&A for Science & Society
! How do you know the CO2 is staying where you put it?! What happens in the event of earthquakes?
! Induced seismicity! Fracture and catastrophic release of stored CO2
! Where does formation water go when CO2 is injected?! Increased pressure
! Does CO2 injection fracture rocks during injection?! What are long-term implications of project?! Who is liable if something goes wrong with the project?! How do you know it is safe?

• Discussion and evaluation in plenary sessions preferable to breakout sessions. Led to fully involving experts, wider range of views and, greater discussion.
• Risk profile can change significantly over time and must be
continually reviewed.
• Self-rating of expertise level led greater understanding of where expert views diverged from well-informed non-experts.
• Scenarios with very high worst-case severities must be treated differently from scenarios whose high risk results from higher likelihood.
Outcome: We Better Understand Longitudinal Risk Profile of Carbon Capture and Storage Workflow
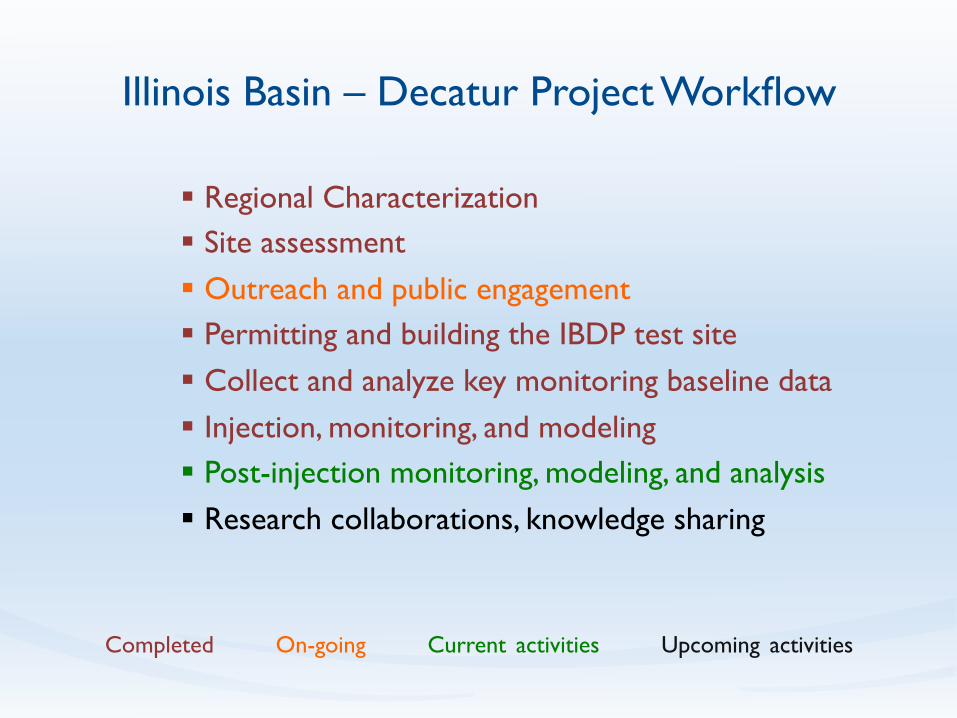
Illinois Basin – Decatur Project Workflow
! Regional Characterization! Site assessment
! Outreach and public engagement! Permitting and building the IBDP test site
! Collect and analyze key monitoring baseline data
! Injection, monitoring, and modeling! Post-injection monitoring, modeling, and analysis
! Research collaborations, knowledge sharing
Completed On-going Current activities Upcoming activities

Ini'al Risk Assessment
Research and Opera'onal Ac'vi'es
Communica'on, Educa'on, and Engagement
Interim Risk Assessment
Revisit Communica'on
and Crisis Management,
Risk Communica'on
Complete Injec'on &
Post-‐Injec'on
Monitoring
2008 2009 2010 2011 2012 2013 2014 2015 2016 2017
Geologic UncertaintyOperational UncertaintyRegulatory UncertaintySocial Uncertainty
Regulatory Uncertainty
Change in ScopeLong-term FundingChallenges in Knowledge SharingComplacency PotentialInstitutional Memory Loss
Communication Plan & Implement Communication and Crisis Management
IBDP Risk Assessment and Project Uncertainties

• At 500 m in total thickness at Decatur, the Mount Simon Sandstone has been shown to be a substantial storage resource meeting criteria of injectability and storage capacity
• Storage capacity of 11 (P90) to 150 (P10) billion metric tons have been assessed for the entire Illinois Basin
• Intervals of tens of meters of exceptional reservoir quality in the Lower Mount Simon show a combination of primary and secondary porosity in a sand-rich fluvial system
• Original depositional units are well-connected as flow units based on pressure response in the injection and verification wells
Outcome: We Better Understand Depositional and Diagenetic History of a Major Storage Resource

Lower Mt. Simon Fluvial Deposits
• Braid Plain and alluvial fan deposits; poorly to mod. sorted, cross-bedded sandstone to pebble conglomerate. Porosity up to 30% and 500mD permeability
• Fluvial flood plain and playa deposits; planar and ripple laminated mudstones and siltstones. Tight and impermeable
1m m� from Freiburg, ISGS

Mount Simon Depositional Analogue: Brahmaputra
River System
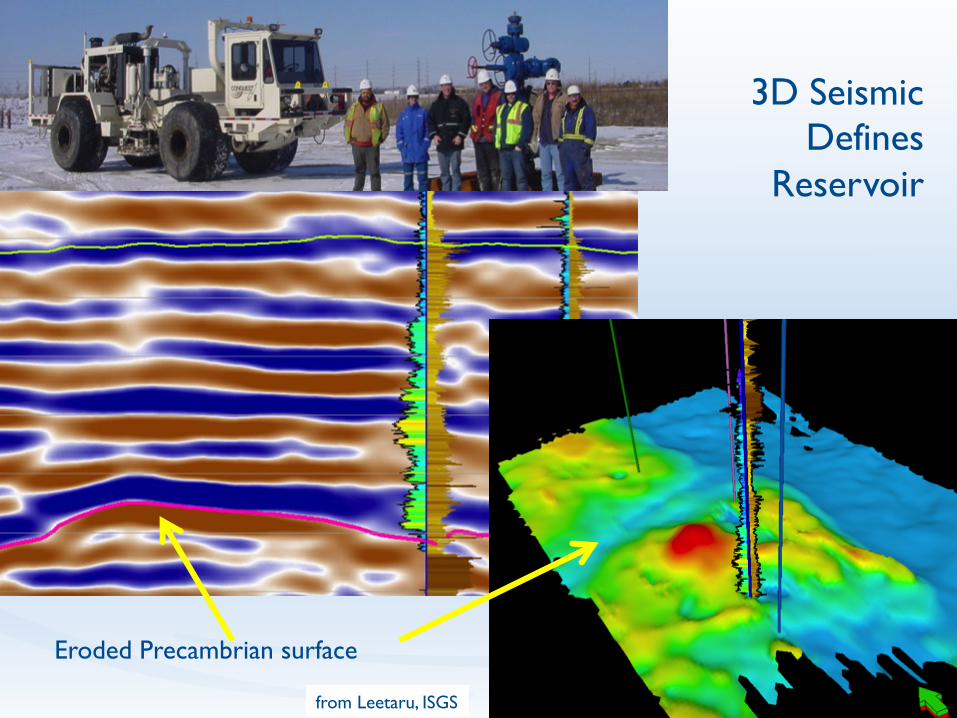
Eroded Precambrian surface
from Leetaru, ISGS
3D Seismic Defines
Reservoir
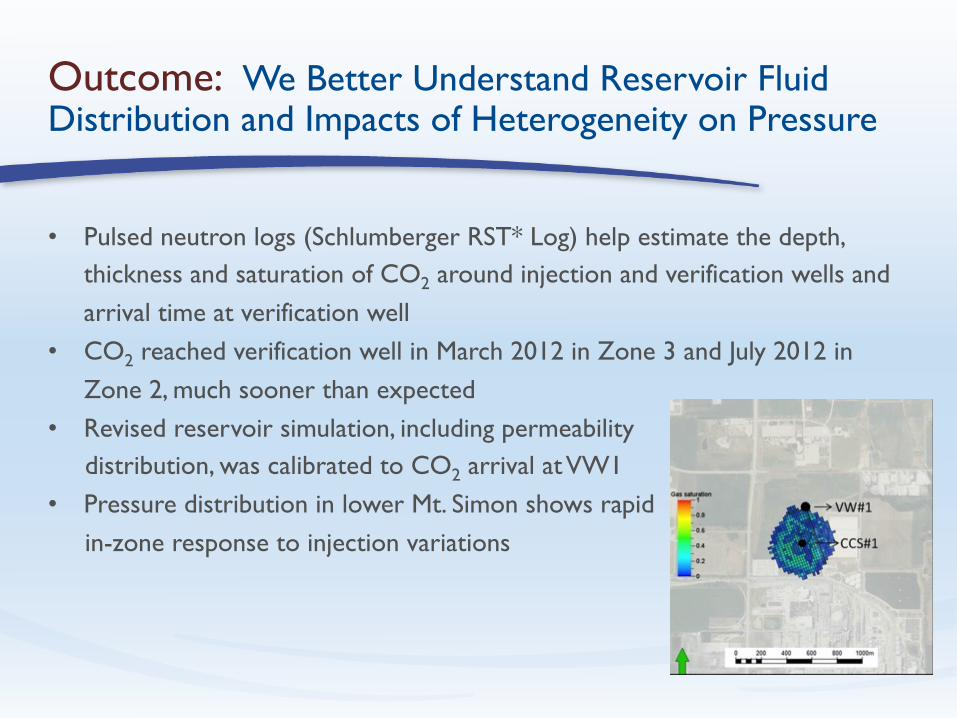
• Pulsed neutron logs (Schlumberger RST* Log) help estimate the depth, thickness and saturation of CO2 around injection and verification wells and arrival time at verification well
• CO2 reached verification well in March 2012 in Zone 3 and July 2012 in Zone 2, much sooner than expected
• Revised reservoir simulation, including permeability distribution, was calibrated to CO2 arrival at VW1 • Pressure distribution in lower Mt. Simon shows rapid in-zone response to injection variations
Outcome: We Better Understand Reservoir Fluid Distribution and Impacts of Heterogeneity on Pressure
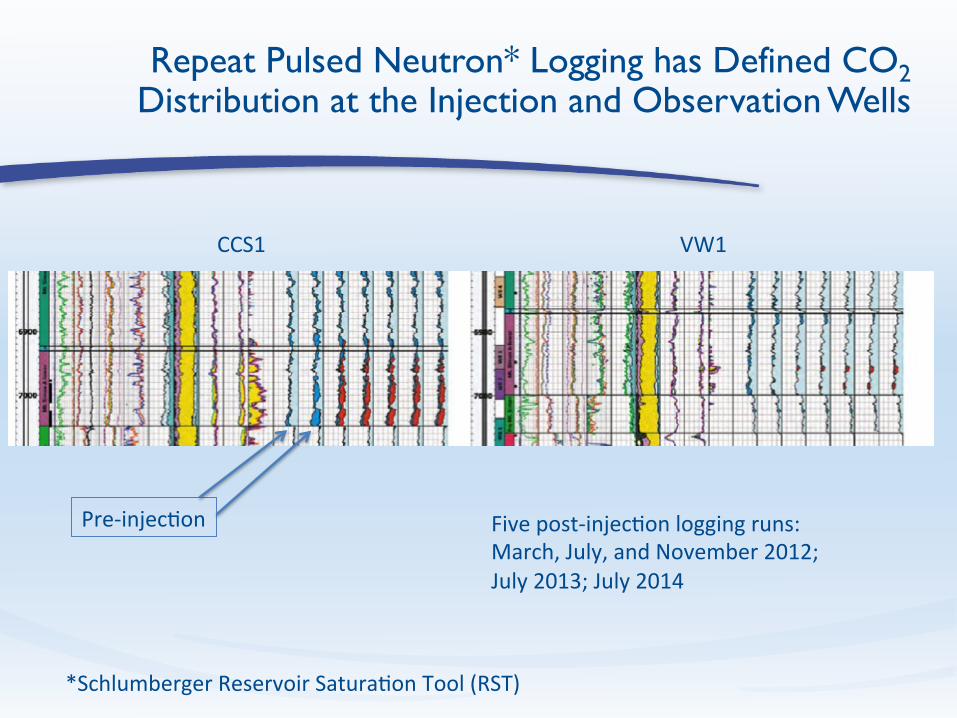
Repeat Pulsed Neutron* Logging has Defined CO2 Distribution at the Injection and Observation Wells
CCS1 VW1
*Schlumberger Reservoir Satura'on Tool (RST)
Pre-‐injec'on Five post-‐injec'on logging runs: March, July, and November 2012; July 2013; July 2014
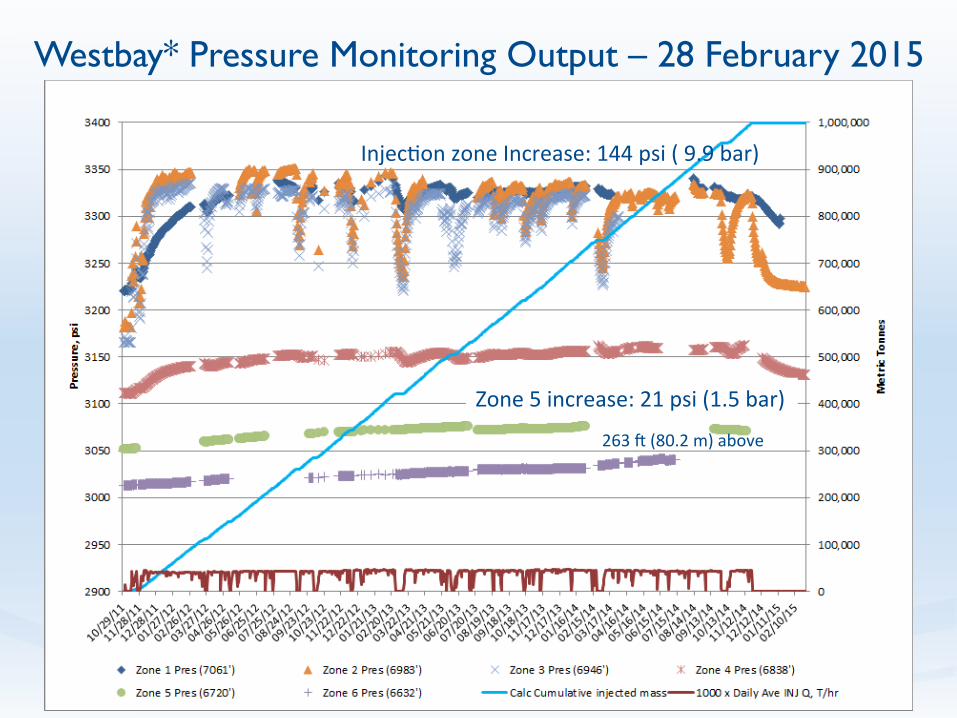
Westbay* Pressure Monitoring Output – 28 February 2015
Injec'on zone Increase: 144 psi ( 9.9 bar)
Zone 5 increase: 21 psi (1.5 bar)
263 f (80.2 m) above
Injec'on zone Increase: 144 psi ( 9.9 bar)
Zone 5 increase: 21 psi (1.5 bar)
263 f (80.2 m) above

Mudstone Baffle Between Injection Zones
1 mm�10 cm
1 mm
IBDP Injec*on Zone
ICCS Injec*on Zone
Baffle
VW1
6,863-‐6,863.25 Porosity: 1.5% Kv: <0.01 mD Kh: 4.13 mD in siltstone laminae
Zone 5

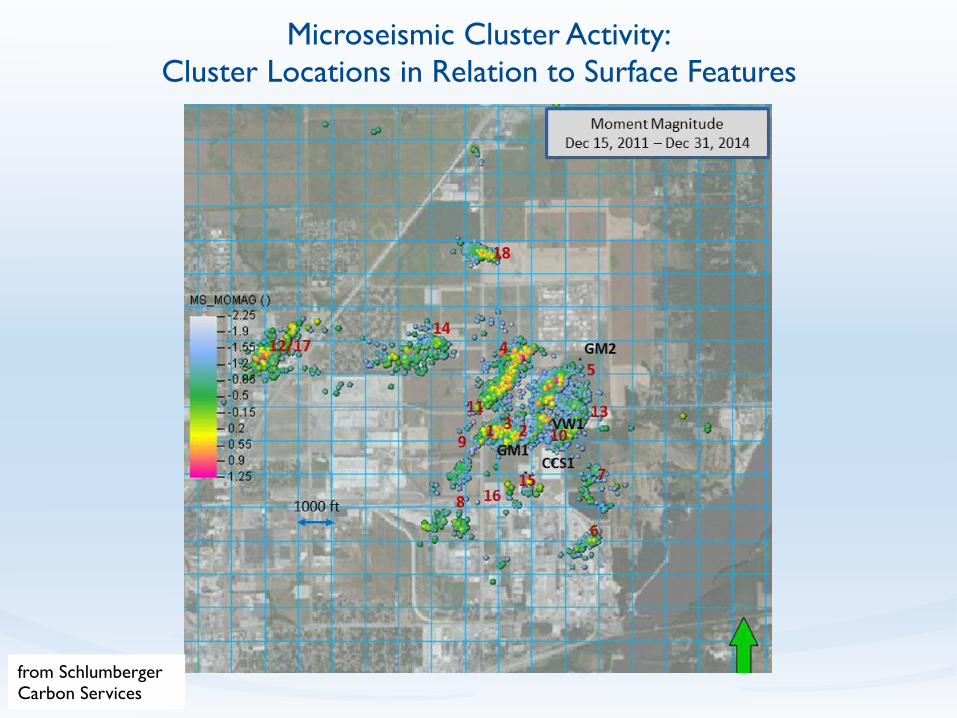
• Microseismic activity started only after injection began at site • Clusters north of injection well first to occur and lie over
Precambrian topography that may have localized planes of weakness due to compaction
• Cluster orientation consistent with northeast principal stress direction
• No pre-existing fault planes seen in 3D seismic • Timing of events ties to pressure propagation • Most events are in the pre-Mt. Simon and Precambrian
basement; none are above the lower Mt. Simon
Outcome: Microseismic Activity Has Supported Insight Into Reservoir Pressure Distribution

from Schlumberger Carbon Services
Microseismic Events Began in
January 2012
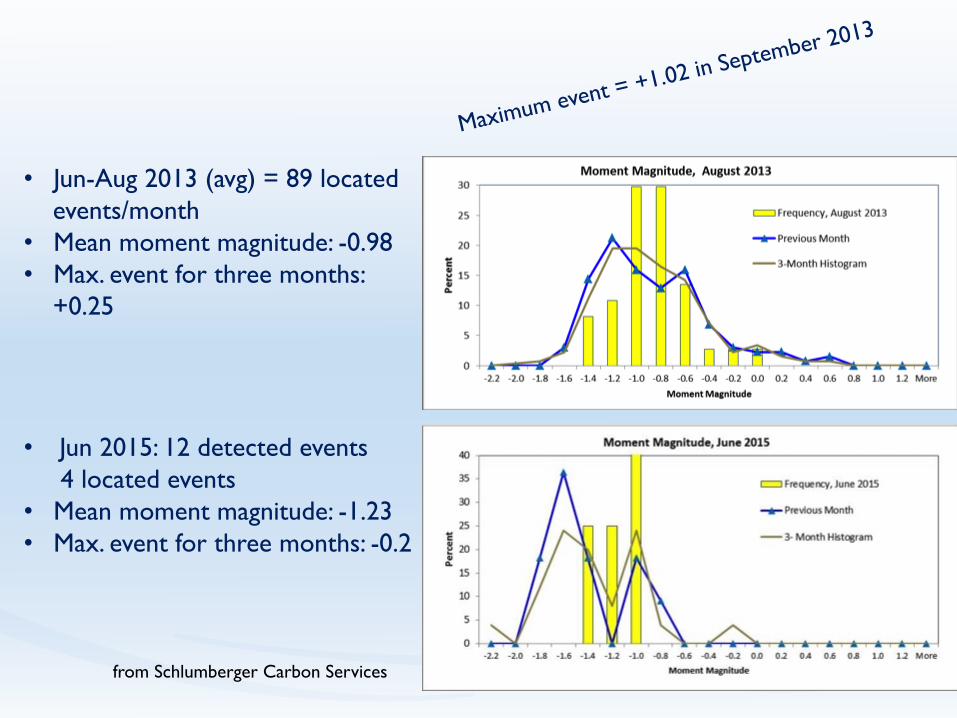
• Jun 2015: 12 detected events 4 located events• Mean moment magnitude: -1.23• Max. event for three months: -0.2
• Jun-Aug 2013 (avg) = 89 located events/month
• Mean moment magnitude: -0.98• Max. event for three months:
+0.25
Maximum event = +1.02 in September 2013
from Schlumberger Carbon Services
from SchlumbergerCarbon Services
Microseismic Cluster Activity: Cluster Locations in Relation to Surface Features

from SchlumbergerCarbon Services
Microseismic Cluster Activity: Cluster Locations in Relation to Surface Features
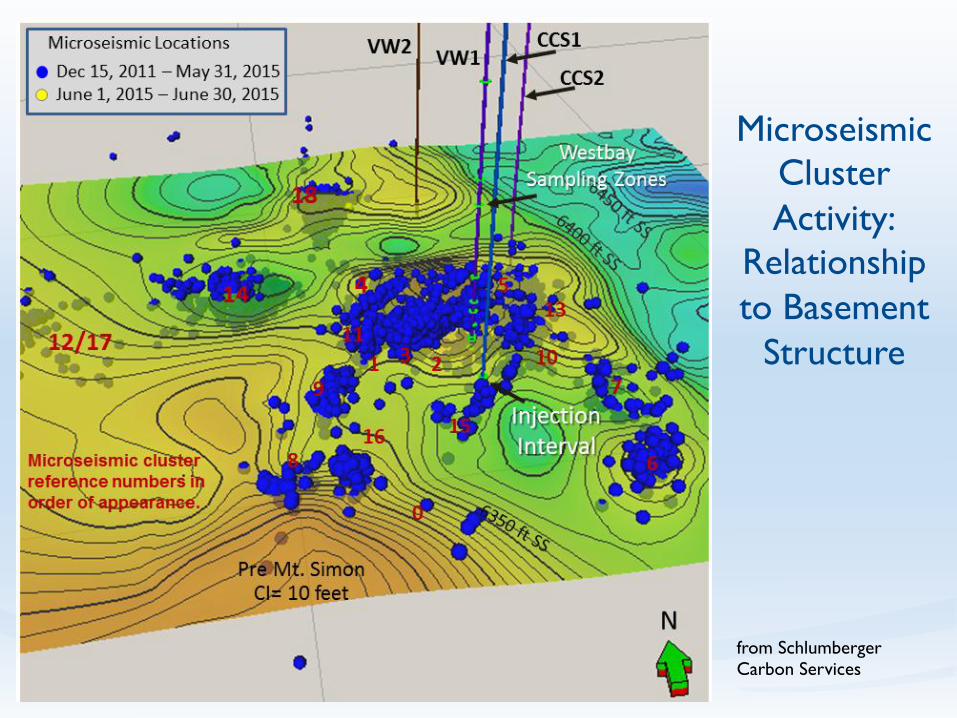
Microseismic Cluster Activity:
Relationship to Basement
Structure
from SchlumbergerCarbon Services
Grayed loca'ons are in the Precambrian
from Schlumberger Carbon Services
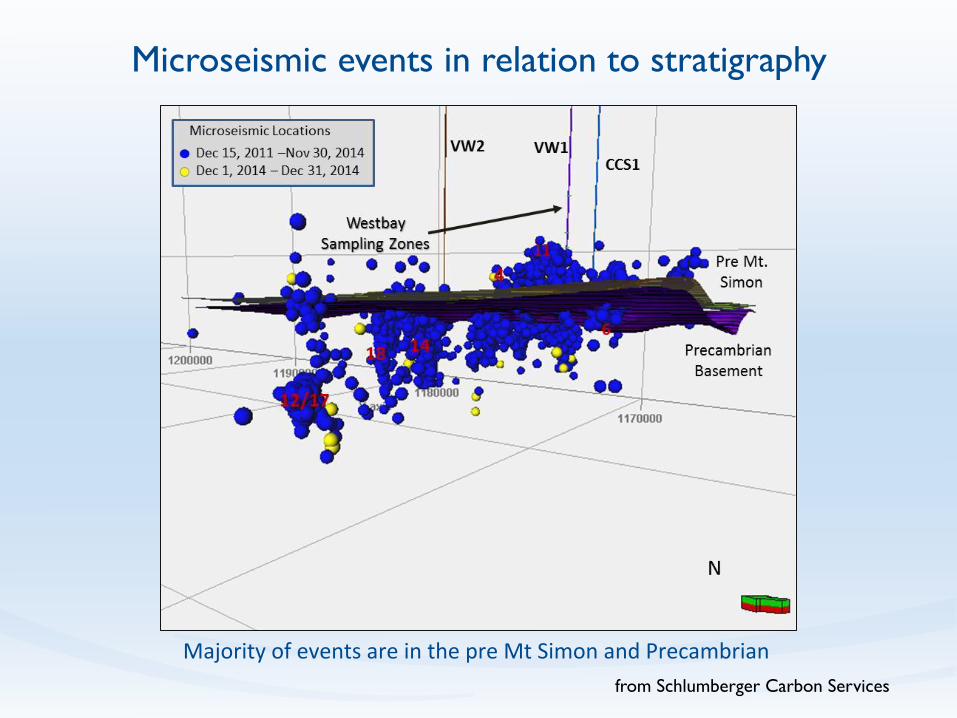
Majority of events are in the pre Mt Simon and Precambrian
Microseismic events in relation to stratigraphy
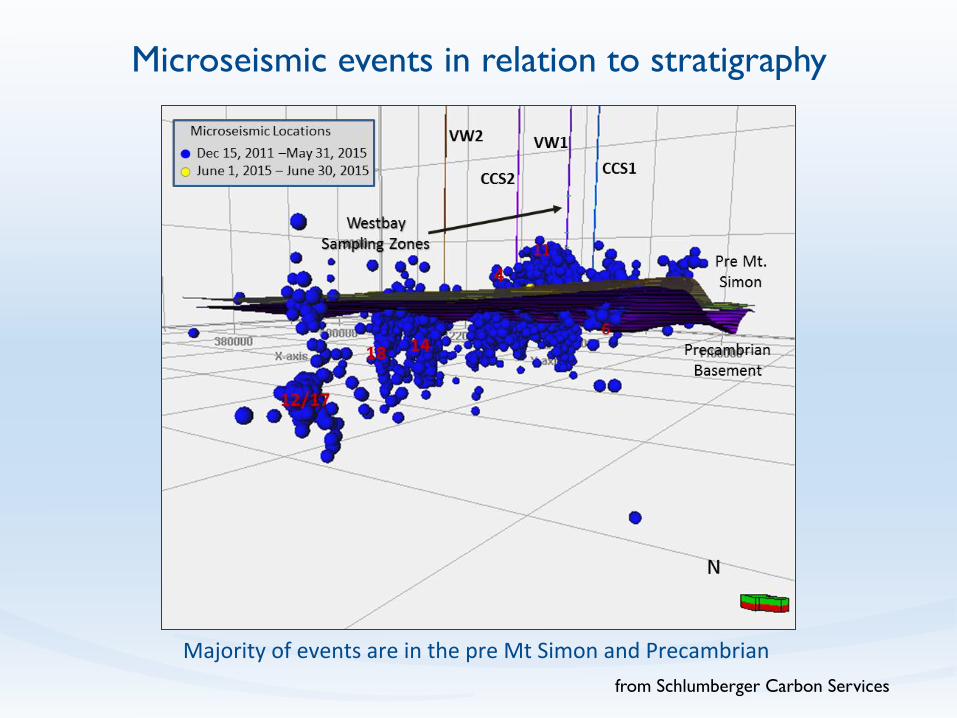
from Schlumberger Carbon Services
Majority of events are in the pre Mt Simon and Precambrian
Microseismic events in relation to stratigraphy

• Unconformable contact with Mt. Simon
• Sandstones and pebble conglomerates. Porosity <8% and perm. <1md.
• Bioturbation throughout suggesting marine environment and dating Pre-Mt. Simon at Cambrian
Pre-Mt. Simon Sandstone
1000 µm
from Freiburg, ISGS

Precambrian Basement
500 µm
• Upper Basement is Rhyolite
• Distinct Weathering Profile. Fractured
• Dated at 1.45 Ga
from Freiburg, ISGS

Outcome: Successful permitting of UIC wells for two projects provides precedent for future projects
! Proactively engage regulators ! Engage early ! Familiarize yourself with regulatory 'me clock
! Expect technical collaboration between USEPA and applicant ! USEPA focused on making technical, risk-based permitting decisions ! Modeling should be discussed in detail with USEPA prior to
development and verification ! Start early ! Seek out examples (publicly available) ! Provide balance of information – detail important, but can distract ! Remain flexible

Plume Monitoring Target
FormationMonitoring
ActivityMonitoring Location
Frequency: Interim Period
Frequency: CCS2 Injection Phase
Frequency: CCS2 Post-Injection Phase
Direct Plume Monitoring
Mt. Simon Fluid Sampling
VW1 Once Year 1-3: AnnualYear 4-5: None
None
Mt. Simon Fluid Sampling
VW2 None Annual Annual
Indirect Plume Monitoring
Mt. Simon Pulse Neutron logging/RST
VW1VW2
Once Year 2, Year 4 Year 1, 3, 5, 7, 10
Mt. Simon Pulse Neutron logging/RST
CCS1CCS2
Once Year 2, Year 4 Year 1, 3, 5, 7, 10
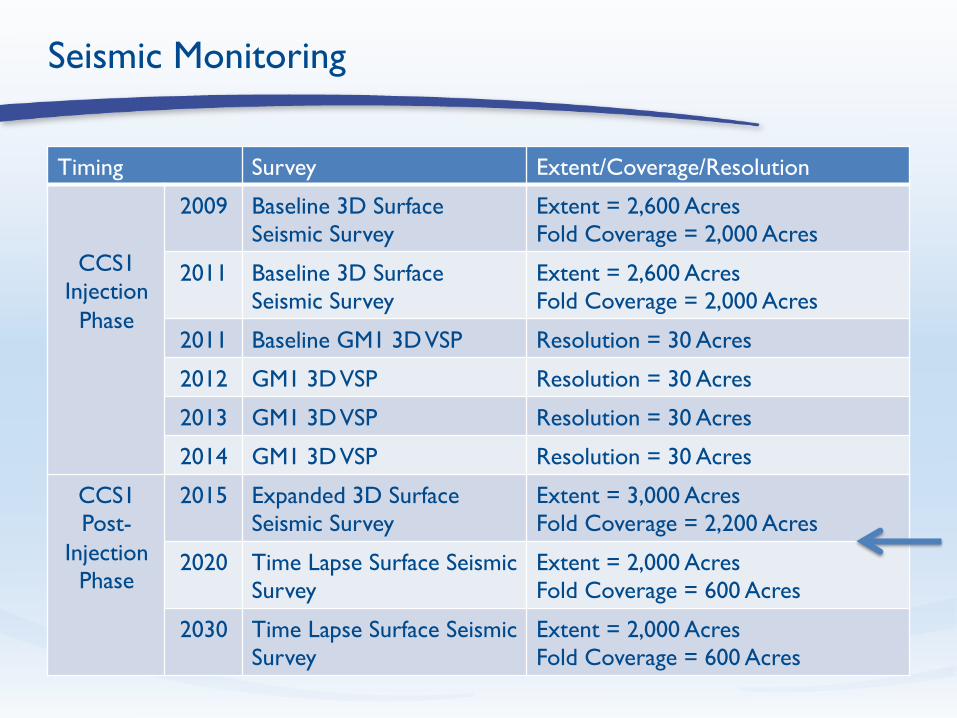
Timing Survey Extent/Coverage/Resolution
CCS1 Injection
Phase
2009 Baseline 3D Surface Seismic Survey
Extent = 2,600 AcresFold Coverage = 2,000 Acres
2011 Baseline 3D Surface Seismic Survey
Extent = 2,600 AcresFold Coverage = 2,000 Acres
2011 Baseline GM1 3D VSP Resolution = 30 Acres
2012 GM1 3D VSP Resolution = 30 Acres
2013 GM1 3D VSP Resolution = 30 Acres
2014 GM1 3D VSP Resolution = 30 Acres
CCS1 Post-
Injection Phase
2015 Expanded 3D Surface Seismic Survey
Extent = 3,000 AcresFold Coverage = 2,200 Acres
2020 Time Lapse Surface Seismic Survey
Extent = 2,000 AcresFold Coverage = 600 Acres
2030 Time Lapse Surface Seismic Survey
Extent = 2,000 AcresFold Coverage = 600 Acres
Seismic Monitoring
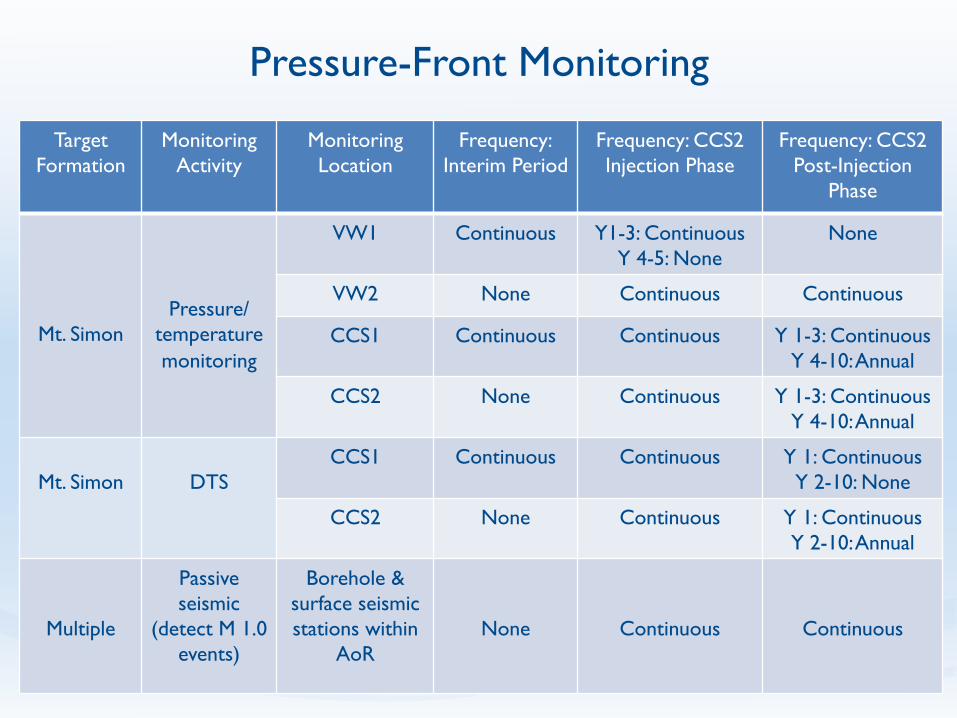
Pressure-Front Monitoring
Target Formation
Monitoring Activity
Monitoring Location
Frequency: Interim Period
Frequency: CCS2 Injection Phase
Frequency: CCS2 Post-Injection
Phase
Mt. SimonPressure/
temperature monitoring
VW1 Continuous Y1-3: ContinuousY 4-5: None
None
VW2 None Continuous Continuous
CCS1 Continuous Continuous Y 1-3: ContinuousY 4-10: Annual
CCS2 None Continuous Y 1-3: ContinuousY 4-10: Annual
Mt. Simon DTSCCS1 Continuous Continuous Y 1: Continuous
Y 2-10: None
CCS2 None Continuous Y 1: ContinuousY 2-10: Annual
Multiple
Passive seismic
(detect M 1.0 events)
Borehole & surface seismic stations within
AoRNone Continuous Continuous
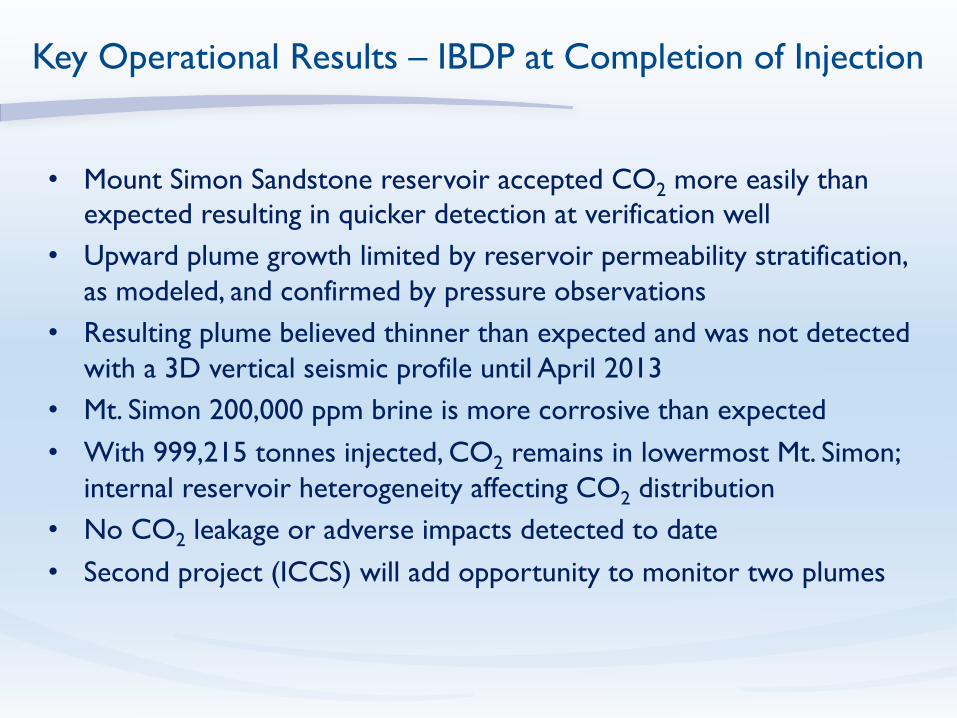
• Mount Simon Sandstone reservoir accepted CO2 more easily than expected resulting in quicker detection at verification well
• Upward plume growth limited by reservoir permeability stratification, as modeled, and confirmed by pressure observations
• Resulting plume believed thinner than expected and was not detected with a 3D vertical seismic profile until April 2013
• Mt. Simon 200,000 ppm brine is more corrosive than expected • With 999,215 tonnes injected, CO2 remains in lowermost Mt. Simon;
internal reservoir heterogeneity affecting CO2 distribution • No CO2 leakage or adverse impacts detected to date • Second project (ICCS) will add opportunity to monitor two plumes
Key Operational Results – IBDP at Completion of Injection

• International Journal of Greenhouse Gas Control: – Special Volume – 4 papers on microseismic research at IBDP – Publish Q1 or Q2 of 2016
• American Geophysical Union: – Geophysical Monitoring for Geologic Sequestration of Carbon Dioxide – 2 book chapters
• Microseismic Monitoring, Event Location, and Focal Mechanisms: A Case Study of the Illinois Basin – Decatur Project • Seismic Data Integration for Site Characterization and Monitoring.
• Pre-Cambrian Basin Geology • Illinois Basin Tectonic Regime • Open file reports
Publication Plan – 2015 to 2016 (subject to change)

At end of PISC period: • Operator submits a demonstration of non-endangerment of USDW to UIC
Program Director (40 CFR 146.93(b)(2) or (3) • Based on evaluation of site monitoring data in conjunction with computational
model • Uses site-specific conditions to confirm and demonstrate non-endangerment • Includes:
– Summary of existing monitoring data – Comparison of monitoring data and model predictions and model
documentation – Evaluation of CO2 plume – Evaluation of mobilized fluids – Evaluation of reservoir pressure – Evaluation of potential conduits for fluid movement – Evaluation of passive seismic data
Final Steps: Demonstration of Non-Endangerment


