iii
HOUSING EQUILIBRIUM PRICE FRAMEWORK FOR MALAYSIAN MIDDLE
CLASS GROUP IN AFFORDABLE HOUSING MARKET
FAZILAH BINTI RAMLI
A thesis submitted in
fulfillment of the requirements for the award of the
Degree of Master of Technology Management
Faculty of Technology Management and Business
Universiti Tun Hussein Onn Malaysia
AUGUST 2017

v
For my beloved mother and father
My brother, my sister,
My love
Much appreciate for all the support,
understanding and love
from all of you
vi
ACKNOWLEDGEMENT
I would like to express my sincere appreciation to my supervisor, Dr. Rozlin binti
Zainal and my co supervisor, Dr. Maimunah binti Ali for the support, advice and
guidance given through out the duration for this research.
Also, my deep appreciation goes to my parent for their support in terms of
encouragement and financial, patience and prayers. Last but not least, appreciation
also goes to everyone involved directly or indirectly towards the compliation of
thesis.
vii
ABSTRACT
Failure in getting housing equilibrium price for affordable housing market has
become a hot topic that is often discussed in the press due to the imbalance between
housing demanded and supplied. The basic purpose of the research was to investigate
the relationship between macroeconomic housing demand and supply determinant
factors and affordable housing needs in Malaysia, and to determine the equilibrium
house price for middle-class income in the affordable housing market. The research
involved the development of theoretical framework by synthesising the models and
framework developed by past researchers on the housing equilibrium price
framework. It also uses time series analysis together with regression analysis to
collect and analyse data. As initial, 371 respondents from household’s side and 32
respondents from developer’s side in Melaka Tengah were selected as samples as
case study in Melaka. During data analysed, around 200 questionnaires from
households and 32 questionnaires from developers can be used. The data was
analysed using SPSS software to investigate the relationship between
macroeconomic housing demand and supply determinant factors towards the needs
and supply of affordable housing market. From the investigation, current house price,
monetary status and population changes are the most critical factors that lead to the
needs of affordable housing supplies. Meanwhile, developers put the interest rate,
government interventions and population changes as the catalyst to develop the
affordable housing projects. On the other hand, the empirical data of housing prices
are collected from NAPIC from 2006 to 2015. The equilibrium price calculated from
the sales performance within four quarter reported by NAPIC is examined using
linear regression method. Based on these themes, the research contended that the
housing equilibrium price can be achieved using empirical data from demand and
supply with supported from current house price, monetary status and population
changes the interest rate, government interventions and population changes. Hence,
government is the key player and be a pulling effect in controlling the housing price
by using the housing demand and supply determinant factor to create a win-win
situation between middle-class income and housing developers.
viii
ABSTRAK
Kegagalan dalam mendapatkan harga keseimbangan perumahan untuk pasaran
perumahan yang mampu dimiliki telah menjadi topik hangat yang sering
dibincangkan dalam akhbar kerana ketidakseimbangan antara perumahan yang
diminta dan dibekalkan. Tujuan asas penyelidikan ini adalah untuk mengkaji
hubungan antara permintaan perumahan makroekonomi dan faktor penentu bekalan
dan keperluan perumahan yang mampu dimiliki di Malaysia, dan untuk menegtahui
harga rumah keseimbangan untuk pendapatan kelas pertengahan di pasaran
perumahan yang berpatutan. Kajian ini melibatkan pembangunan model teoritis
dengan mensintesis model yang dibangunkan oleh penyelidik terdahulu mengenai
kerangka harga keseimbangan perumahan. Ia juga menggunakan analisis siri masa
bersama-sama dengan analisis regresi untuk mengumpul dan menganalisis data.
Sebagai permulaan, 371 responden dari pihak isi rumah dan 32 responden dari pihak
pemaju di Melaka Tengah dipilih sebagai sampel memandangkan kajian kes di
Melaka. Sebanyak 200 soal selidik dari isi rumah dan 32 soal selidik dari pemaju
boleh digunakan. Data dianalisis dengan menggunakan perisian SPSS untuk
menyiasat hubungan antara permintaan perumahan makroekonomi dan faktor
penentu bekalan ke arah keperluan dan penawaran pasaran perumahan yang mampu
dimiliki. Status kewangan dan perubahan penduduk adalah faktor yang paling
kritikal yang membawa kepada keperluan bekalan perumahan yang mampu dimiliki.,
Pemaju meletakkan kadar faedah, campur tangan kerajaan dan perubahan penduduk
sebagai pemangkin untuk membangunkan projek perumahan yang mampu dimiliki.
Sebaliknya, data empirikal harga perumahan dikutip dari NAPIC dari 2006 hingga
2015. Harga keseimbangan yang dikira daripada prestasi jualan dalam tempoh empat
suku yang dilaporkan oleh NAPIC diperiksa menggunakan kaedah regresi linear.
Kajian ini menegaskan bahawa harga keseimbangan perumahan dapat dicapai
dengan menggunakan data empirikal dari permintaan dan bekalan kerana permintaan
untuk perumahan selalu wujud sebagai perumahan adalah suatu keperluan bahkan
harga yang ditawarkan tidak munasabah. Walau bagaimanapun, kerajaan adalah
pemain utama dan menjadi daya tarikan dalam mengawal harga perumahan dengan
menggunakan permintaan perumahan dan faktor penentu bekalan untuk mewujudkan
situasi menang-menang di antara isi rumah dan pemaju perumahan.
ix
TABLE OF CONTENTS
ACKNOWLEDGEMENT vi
ABSTRACT vii
ABSTRAK viii
TABLE OF CONTENTS ix
LIST OF TABLES xiii
LIST OF FIGURES xv
LIST OF SYMBOLS AND ABREVIATIONS xvii
LIST OF APPENDICES xviii
CHAPTER 1 INTRODUCTION 1
1.1 Background of Research 1
1.2 Research Problem 2
1.3 Research Questions 6
1.4 Research Aim and Objectives 7
1.5 Scope of Research 7
1.6 Significance of Research 8
1.7 Research Organisation 9
1.8 Conclusion 10
CHAPTER 2 LITERATURE REVIEW 11
2.1 Introduction 11
2.2 Current Scenario of Housing in Malaysia 11
2.3 General Attributes and Operational Definitions 18
2.3.1 Affordable Housing 18
2.3.2 Malaysian Middle Class Income Group 20
2.3.3 Housing Market 21
2.3.4 Medium-Cost Housing Needs 22
2.3.5 Medium-Cost Housing Provided 24
2.4 Previous Study on Related Topic 25

x
2.5 Law of Demand 28
2.6 Law of Supply 30
2.6.1 Short-Run Aggregate Housing Supply 32
2.6.2 New Construction 35
2.7 Macroeconomic Housing Demand Determinant Factors 38
2.7.1 Factor of Economy 38
2.7.2 Factor of Social 41
2.7.3 Factor of Politic 46
2.8 Housing Equilibrium Price Model 48
2.9 Summaries on Housing Demand and Supply Determinants 49
2.10 Theoretical Framework 52
2.11 Conclusion 56
CHAPTER 3 RESEARCH METHODOLOGY 57
3.1 Introduction 57
3.2 Research Design 57
3.3 Research Process 61
3.4 Research Instrument 64
3.4.1 Secondary Data Analysis 64
3.4.2 Questionnaire Survey 67
3.5 Selection Sample 71
3.6 Reliability Test 75
3.6.1 Pilot Test 75
3.7 Research Flow for Achieving Objective One 77
3.7.1 Preparing Data File 77
3.7.2 Factor Analysis 80
3.7.3 Factorability Considerations Analysis 80
3.7.4 Factor Extraction Analysis 80
3.8 Correlation Analysis 82
3.8.1 Pearson r Correlation Analysis 83
3.9 Regression Analysis 85
3.10 Research Flow for Achieving Objective Two 86
3.10.1 Correlation Analysis 88
3.11 Research Flow for Achieving Objective Three 89
xi
3.12 Conclusion 92
CHAPTER 4 DATA ANALYSIS AND RESULTS 93
4.1 Introduction 93
4.2 Data Analysis Results for Survey Method (Set I) 94
4.2.1 Effect of the Housing Demand Determinants toward
the Affordable Housing Market in Malaysia 97
4.3 Data Analysis Results for Survey Method (Set II) 105
4.3.1 Effect of Housing Supply Determinants toward
Affordable Housing Market in Malaysia 107
4.4 Data Analysis Results for Document Analysis Method 110
4.4.1 Stage One (Histogram Bar Chart Analysis) 110
4.4.2 Stage Two (Demand and Supply Mechanism) 114
4.4.3 Stage Three (Housing Equilibrium Price Identification) 115
4.5 Conclusion 120
CHAPTER 5 DISCUSSION 122
5.1 Introduction 122
5.2 Summary of Findings for Objective One 122
5.3 Macroeconomic Housing Demand Determinant Factors
toward the Need of Affordable Housing Market 123
5.3.1 House Price 123
5.3.2 Monetary Status 124
5.3.3 Changes of Population Structure 125
5.3.4 Infrastructure & Amenities Provided 126
5.3.5 Location 126
5.3.6 Housing Physical State 127
5.4 Summary of Findings for Objective Two 128
5.5 Macroeconomic Housing Supply Determinant Factors toward the
Affordable Housing Market Provided 129
5.5.1 Interest Rate 129
5.5.2 Government Interventions 130
5.5.3 Changes of Population Structures 130
5.5.4 Land Availability 131
5.5.5 Cost of Construction 132

xii
5.5.6 Location 133
5.6 Information Required in Performing Housing Equilibrium Price 134
5.6.1 Housing Demand and Supply Behavioural 134
5.6.2 Interaction between Housing Demand and Supply 136
5.6.3 Housing Equilibrium Price Respond in Housing Market 137
5.7 Conclusion 140
CHAPTER 6 CONCLUSIONS AND RECOMMENDATIONS 141
6.1 Introduction 141
6.2 Achievement of the First Objective (Housing Demand
Determinants) 142
6.3 Achievement of the Second Objective (Housing Supply
Determinants) 143
6.4 Achievement of the Objective Three (Housing Equilibrium Price) 145
6.5 Limitation of Research 146
6.6 Recommendations for Research 147
6.6.1 Recommendations for Practitioners 148
6.6.2 Recommendations for Body of Knowledge 148
6.6 Closure 149
References 149-163
Appendices 164-213

xiii
LIST OF TABLES
1.1 Total number of squatters for each state in Malaysia during
the year 2014
4
2.1 Housing affordability category 13
2.2 Comparison of housing affordability across states in
Malaysia 2014
14
2.3 Gap between housing needs and housing provided for low
starting year 1971 until 2010
17
2.4 Definition of affordable housing according to the type of
scheme
19
2.5 Mean and median monthly salary and wages by
occupation
20
2.6 Housing needs under five year Malaysian housing plans 23
2.7 Housing provided under five year Malaysian housing plans 25
2.8 Research gap analysis on housing market issues 26
2.9 Policy to curb speculations 34
2.10 Revised of RPGT 34
2.11 Scheme eligibility for each type of housing scheme 47
2.12 Housing demand determinant factors 51
2.13 Housing supply determinant factors 52
3.1 Sampling and coding plan 65
3.2 Total housing demand and supply for year 2006-2015 66
3.3 Summary of element in questionnaire form set i 69
3.4 Summary of element in the questionnaire form set ii 70
3.5 Descriptive scale of Likert scale 71
3.6 Sample size determination 74
3.7 Reliability statistics I (questionnaire set I) 76
3.8 Reliability statistics II (questionnaire set II) 76
3.9 Variable coding instruction 78
3.10 Summaries of screening data for questionnaire factors 79
xiv
3.11 Guidelines for determination of relationship strength 83
3.12 Variable coding summarise 87
3.13 Summaries of screening data for questionnaire factors 88
4.1 Household’s Demographic Results 94
4.2 KMO and Barlett’s Test 97
4.3 Total variance explained 98
4.4 Comparison of eigenvalues from SPSS software and
Monte Carlo parallel analysis
99
4.5 List of factors in five components extracted 100
4.7 New r-value set i 102
4.8 Interrelationship among demand determinant factors 103
4.9 Developer’s demographic results 106
4.10 Correlations result set II 107
4.11 New r-value set II 107
4.12 Interrelationship among supply determinant factors 108
4.13 Housing equilibrium price during the year 2006 until 2015 114
4.14 Regression results 116
4.15 Housing equilibrium price according to the level of price
categorised 117
5.1 Summary of findings for objective one 123
5.2 Summary of findings for objective two 128
xv
LIST OF FIGURES
1.1 Total of housing unit’s construction approved from year
2010 until 2014
4
2.1 Comparison between growth average of house prices and
household income
12
2.2 Comparison of new housing supply and households
density
15
2.3 Fundamental law of demand 28
2.4 House price growth 29
2.5 Fundamental law of demand 30
2.6 Long-run period supply 31
2.7 Short-run period supply 32
2.8 Theory of housing prices 33
2.9 Pipeline effect 36
2.10 New construction (completions) 36
2.11 Effects of exogenous shifters on new construction 37
2.12 Hierarchy of housing needs 42
2.13 Chart of urbanization level amongst key states 44
2.14 Process of ‘goldfish phenomenon’ 45
2.15 Demand and supply mechanism 49
2.16 Theoretical framework 55
3.1 Case study in Melaka 58
3.2 Research flow chart 63
3.3 Flow chart of data analysis process 77
3.4 Monte Carlo PCA analysis 82
3.5 Stages achieving objective one 84
3.6 Stages achieving objective two 89
3.7 Research flow chart for objective three 91
4.1 Scree plot 98
4.2 Macroeconomic housing demand determinant factors
involve toward affordable housing market need
105
xvi
4.3 Macroeconomic housing supply determinant factors
involve toward affordable housing market provided
110
4.4 Histogram bar chart of housing demand and supply
develop across year 2006 until 2015
111
4.5 Housing equilibrium price at RM50,000 until RM100,000 117
4.6 Housing equilibrium price at RM 100,000 until
RM150,000
118
4.7 Housing equilibrium price at RM150,000 until
RM200,000
118
4.8 Housing equilibrium price at RM200,000 until
RM250,000
118
4.9 Housing equilibrium price at RM250,000 until
RM300,000
119

xvii
LIST OF SYMBOLS AND ABREVIATIONS
α - Alpha
β - Beta
ρ - Price
CAGR - Compound Annual Growth Rate
CFO - Certificate of Occupancy
DIBS - Developer Interest Bearing Scheme
EP - Equilibrium price
GDP - Gross domestic Product
ICS - Interest capitalization schemes
NEAC - National Economic Action Council
NEP - New Economy Policy
NKRAs - National Key Result Areas
NRV - National Research Venture
OPR - Overnight Policy Rates
PAKR - Public Low Cost Housing Program
PHP - People Housing Program
PIR - Price-Income Ratio
PPA1M - Perumahan Penjawat Awam 1 Malaysia
PR1MA - 1 Malaysia Housing Program
REHDA - Real Estate and Housing Developers
RUMAWIP - Rumah Mampu Milik Wilayah Persekutuan
SPNB - Syarikat Perumahan Negara Berhad
UNCHS - United Nations Centre for Human Settlement
xviii
LIST OF APPENDICES
A Reliability test (households) 164
B Reliability test (developers) 165
C Categorical variables (household - demographic) 166
D Categorical variables (household - house price) 168
E Categorical variables (household - housing state) 170
F Categorical variables (household - monetary status) 172
G Categorical variables (household - population) 174
H Categorical variables (household - location) 176
I Categorical variables (household - infrastructure) 178
J KMO and Barlett test 179
K Total variance explained 180
L Rotated component 181
M Correlation (I) 182
N Categorical variables (developer) 183
O Correlation (II) 184
P Linear regression result I 185
Q Linear regression result II 187
R Linear regression result III 189
S Linear regression result IV 191
T Linear regression result V 193
U Graph of normal P-P plot of regression standardized
residual (Total Demand)
195
V Graph of normal P-P plot of regression standardized
residual (Total Supply)
195
W Sample of questionnaire form for households 196
X Sample of questionnaire form for developers 204
Y1 Chart of the housing demand trend in 2015 204
Y2 Chart of the housing supply trend in 2015 204
xix
Y3 Chart of the housing demand trend in 2014 205
Y4 Chart of the housing supply trend in 2014 205
Y5 Chart of the housing demand trend in 2013 205
Y6 Chart of the housing supply trend in 2013 205
Y7 Chart of the housing demand trend in 2012 206
Y8 Chart of the housing supply trend in 2012 206
Y9 Chart of the housing demand trend in 2011 206
Y10 Chart of the housing supply trend in 2011 207
Y11 Chart of the housing demand trend in 2010 207
Y12 Chart of the housing supply trend in 2010 207
Y13 Chart of the housing demand trend in 2009 208
Y14 Chart of the housing supply trend in 2009 208
Y15 Chart of the housing demand trend in 2008 208
Y16 Chart of the housing supply trend in 2008 209
Y17 Chart of the housing demand trend in 2007 209
Y18 Chart of the housing supply trend in 2007 209
Y19 Chart of the housing demand trend in 2006 210
Y20 Chart of the housing supply trend in 2006 210
Y21 Chart of housing equilibrium price during 2015 210
Y22 Chart of housing equilibrium price during 2014 211
Y23 Chart of housing equilibrium price during 2013 211
Y24 Chart of housing equilibrium price during 2012 211
Y25 Chart of housing equilibrium price during 2011 212
Y26 Chart of housing equilibrium price during 2010 212
Y27 Chart of housing equilibrium price during 2009 212
Y28 Chart of housing equilibrium price during 2008 213
Y29 Chart of housing equilibrium price during 2007 213
Y30 Chart of housing equilibrium price during 2006 213

CHAPTER 1
INTRODUCTION
1.1 Background of Research
In recent decades, the demand for affordable housing has been increasing over the
world until today (Wood, 2007). Even today, the affordable housing sector market
has yet to meet the demands of the global population in the city (Jenkins et al., 2007).
The population of Malaysia has increase from 21.3 million in 2000 to 30 million
people in 2013 with a growth rate of 1.6%. The GDP has increased within this time
along with the per capita income. The housing prices have increased by 12.3%
annually all over the country (DoS, 2015). In the last decade, housing needs
increased more than three times as fast for very low-income households with full-
time employment than for all other very low-income households. It is generally
accepted because housing market conditions can vary greatly across geographic areas
so local planning agencies and governments have a greater understanding of the
demographic and housing characteristics for their regions and are able to develop
effective housing strategies (Feldman, 2002).
The issue of affordable housing in the world has not subsided. Past research
in the US showed housing absolutely needs assistance in the form of federal financial
and require either for profit or for non-profit parties to be responsible (Wallace,
1995). Immense chasm between demand and supply of affordable housing supply
will cause the housing market price to be unstable besides leading to the problem of
squatters (Arman et al., 2009). According to the Kalarickal & Buckley (2006),
affordable housing market sector was identified as one of the most under-penetrated
markets by private companies.
2
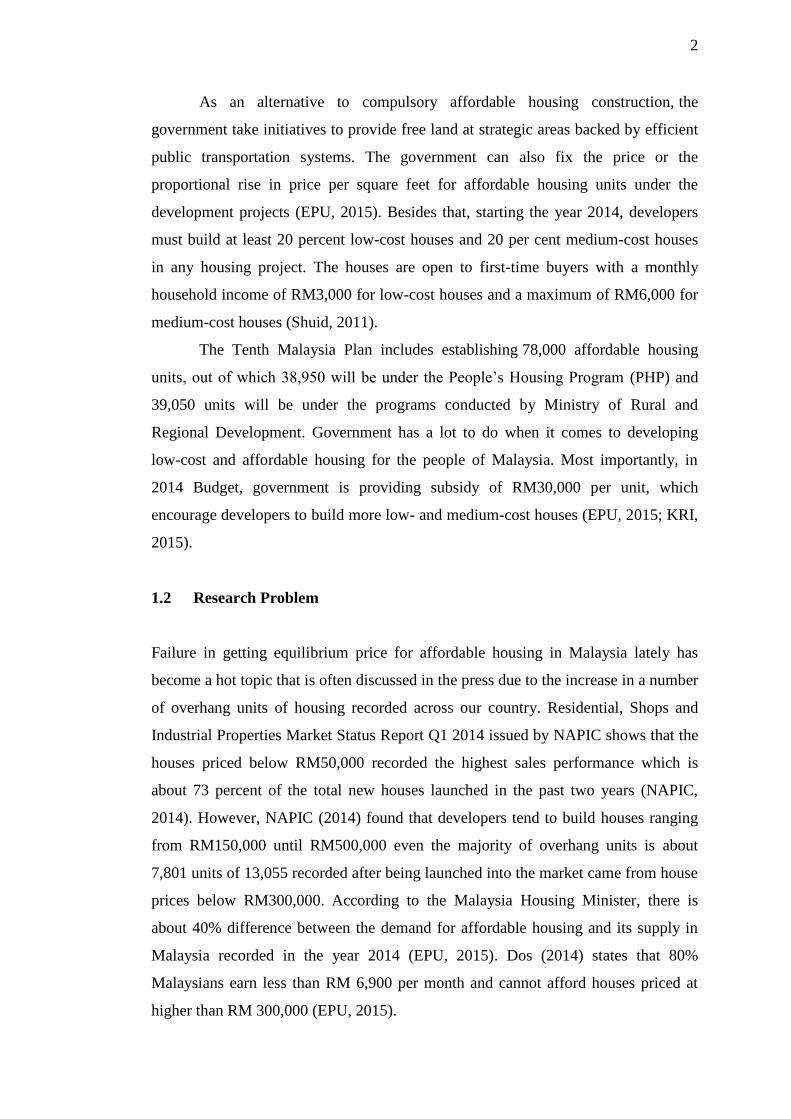
As an alternative to compulsory affordable housing construction, the
government take initiatives to provide free land at strategic areas backed by efficient
public transportation systems. The government can also fix the price or the
proportional rise in price per square feet for affordable housing units under the
development projects (EPU, 2015). Besides that, starting the year 2014, developers
must build at least 20 percent low-cost houses and 20 per cent medium-cost houses
in any housing project. The houses are open to first-time buyers with a monthly
household income of RM3,000 for low-cost houses and a maximum of RM6,000 for
medium-cost houses (Shuid, 2011).
The Tenth Malaysia Plan includes establishing 78,000 affordable housing
units, out of which 38,950 will be under the People’s Housing Program (PHP) and
39,050 units will be under the programs conducted by Ministry of Rural and
Regional Development. Government has a lot to do when it comes to developing
low-cost and affordable housing for the people of Malaysia. Most importantly, in
2014 Budget, government is providing subsidy of RM30,000 per unit, which
encourage developers to build more low- and medium-cost houses (EPU, 2015; KRI,
2015).
1.2 Research Problem
Failure in getting equilibrium price for affordable housing in Malaysia lately has
become a hot topic that is often discussed in the press due to the increase in a number
of overhang units of housing recorded across our country. Residential, Shops and
Industrial Properties Market Status Report Q1 2014 issued by NAPIC shows that the
houses priced below RM50,000 recorded the highest sales performance which is
about 73 percent of the total new houses launched in the past two years (NAPIC,
2014). However, NAPIC (2014) found that developers tend to build houses ranging
from RM150,000 until RM500,000 even the majority of overhang units is about
7,801 units of 13,055 recorded after being launched into the market came from house
prices below RM300,000. According to the Malaysia Housing Minister, there is
about 40% difference between the demand for affordable housing and its supply in
Malaysia recorded in the year 2014 (EPU, 2015). Dos (2014) states that 80%
Malaysians earn less than RM 6,900 per month and cannot afford houses priced at
higher than RM 300,000 (EPU, 2015).
3
Most of the private housing developers used the cost-based pricing method to
determine the price of residential properties (Rasid, 2013). According to Sheehan
(1997), cost-based pricing method is referring to the total up from the land cost,
construction cost, and soft cost. Even though the local authorities had set the price
ceilings housing category but the developers still disobey the regulations (Shuid,
2011). The mismatch between real market demand and what is being offered
obviously happen because of the developer’s behaviour. Even the policy had been
regulated which is there must be 30% medium-cost and 20% low-cost components
respectively to the landed development more than three acres while 30% medium-
cost component for developments on an area less than three acres, still the developers
do not show their interest to participate (NAPIC, 2014). Situation always happen
more likely despite there are 10 affordable houses unit requested by the market, the
developers only supplying two affordable units, four office spaces units, two retail
spaces units and two very high-cost properties units (MoF, 2015).
Besides that, developers seem take too much profit up to above 50% of the
cost of selling the house since there is no specific ways or methods they must
followed. This is happen because the developers are forced to pay high amounts of
constructions premium to the state government besides the soft cost, which act as a
hidden cost in the housing development projects. As sequences, the developers will
include the addition costs when pricing the house (Osmadi et al., 2015). They set the
house price at will even for the affordable housing price because there is no
monitoring from the government done all this time (Sinar Harian, 2013). The impact
is, the buyer cannot afford to buy the house and the speculators will control the
housing situation until the house price boomed (Osmadi et al., 2015). However,
limited studies have discussed on the weaknesses of pricing method used by the
developers to evaluate the housing prices (Osmadi et al., 2015).
Nevertheless, the traditional method used can be improved so that the
developers are more interested to provide the affordable house with affordable price
without ignoring the profit margin (Rasid, 2013; Bakhtiar, 2013). In addition, the
problem encountered based on the report shows immense chasm happening between
demand and supply for affordable housing in our country. From the perspective of
surplus in high-cost housing, it shows that our country has prompted real estate
developers, which are more focused on developing luxury property instead of
developing affordable housing (JPN, 2015). This statement is strongly agreed by
4
Wood (2007) who opines that property owners are more interested in projects
that can give them lucrative return and this, of course, do not refer to affordable
housing projects. Hence, prices of existing homes in the low and middle price
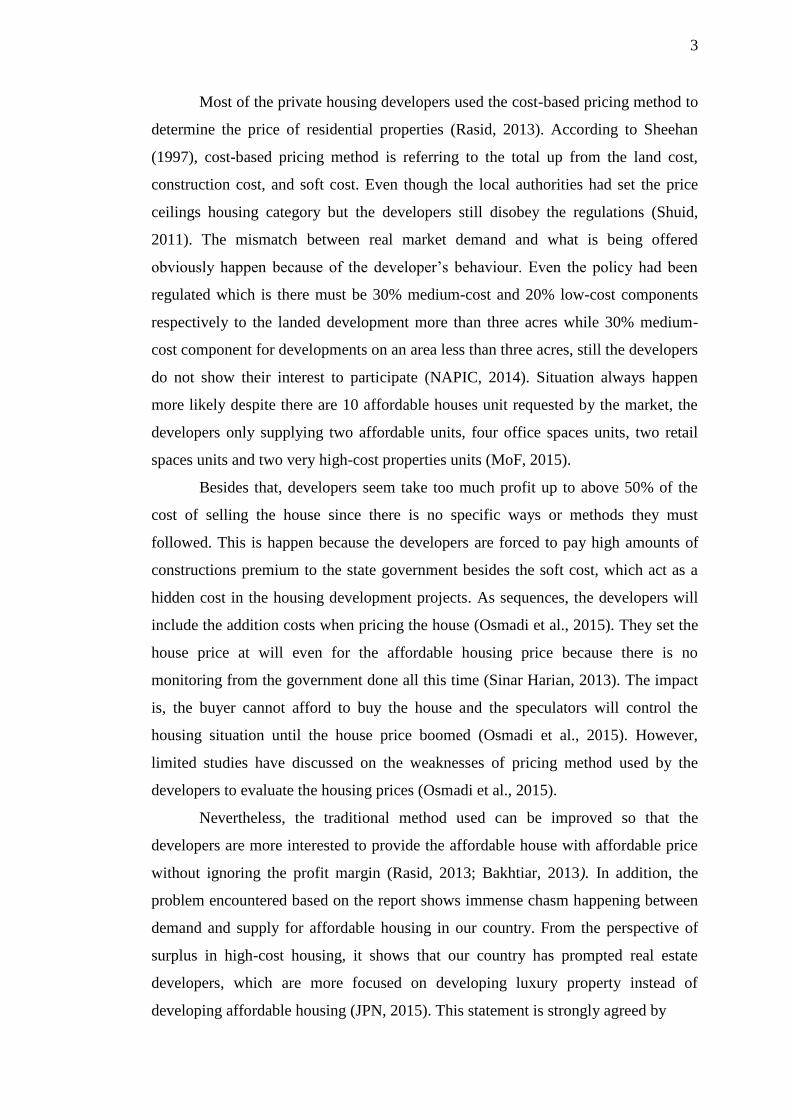
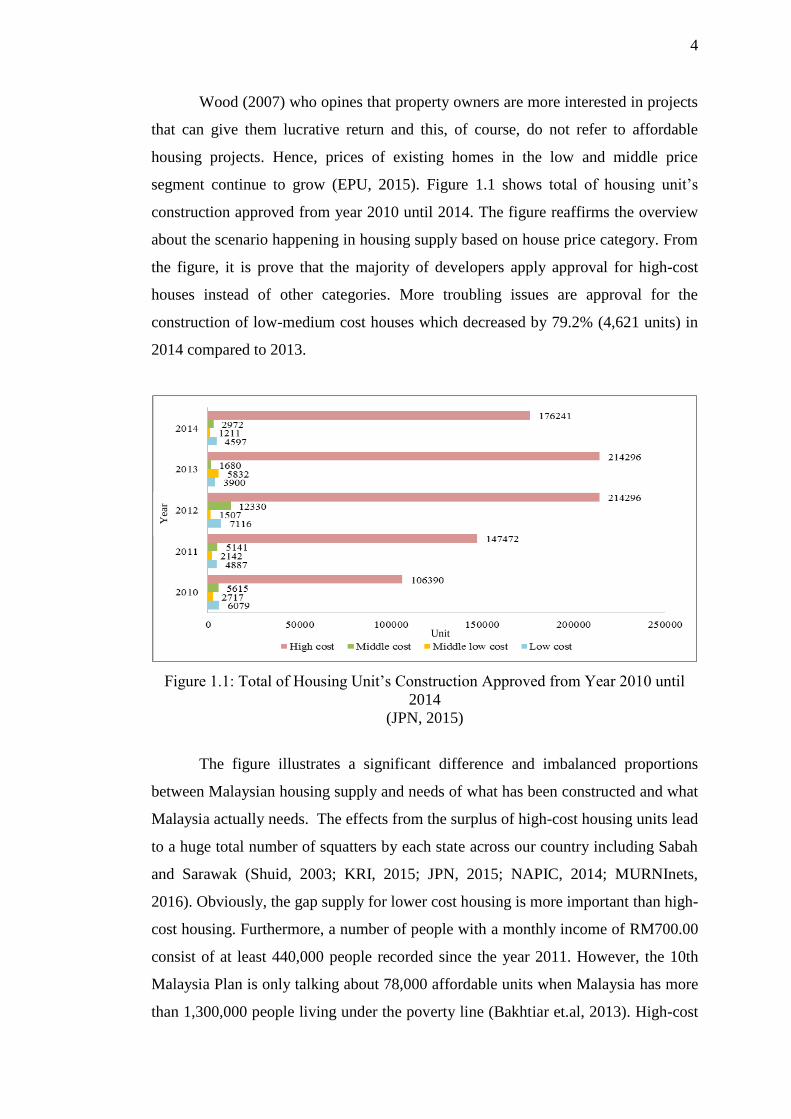
segment continue to grow (EPU, 2015). Figure 1.1 shows total of housing unit’s
construction approved from year 2010 until 2014. The figure reaffirms the overview
about the scenario happening in housing supply based on house price category. From
the figure, it is prove that the majority of developers apply approval for high-cost
houses instead of other categories. More troubling issues are approval for the
construction of low-medium cost houses which decreased by 79.2% (4,621 units) in
2014 compared to 2013.
Figure 1.1: Total of Housing Unit’s Construction Approved from Year 2010 until
2014
(JPN, 2015)
The figure illustrates a significant difference and imbalanced proportions
between Malaysian housing supply and needs of what has been constructed and what
Malaysia actually needs. The effects from the surplus of high-cost housing units lead
to a huge total number of squatters by each state across our country including Sabah
and Sarawak (Shuid, 2003; KRI, 2015; JPN, 2015; NAPIC, 2014; MURNInets,
2016). Obviously, the gap supply for lower cost housing is more important than high-
cost housing. Furthermore, a number of people with a monthly income of RM700.00
consist of at least 440,000 people recorded since the year 2011. However, the 10th
Malaysia Plan is only talking about 78,000 affordable units when Malaysia has more
than 1,300,000 people living under the poverty line (Bakhtiar et.al, 2013). High-cost
Yea
r
Unit
5
housing is indicated by prices over RM100,000 while low-cost housing is indicated
by prices less than RM42,000.
Table 1.1 shows the total number of squatters according to each state in
Malaysia during the year 2015. We can say that only Melaka recorded the lowest
total number of squatters since the state provided not only sufficient housing supply
units but also affordable housing prices. From Table 1.1, Sabah has the highest total
number of squatters in Malaysia followed by Johor and Sarawak where each of them
recorded 133059, 31553, 35233 inhabitants respectively. None of the states across
the country had zero squatters recorded for all this time. However, Melaka, Negeri
Sembilan, and Terengganu recorded the lowest total number of squatters in this year.
This sign actually warns responsible agencies to realize that there is still a huge gap
between demand and supply housing due to socioeconomic changes, urbanization
and evolving population structures. Squatters will continue to be widespread among
the low and lower middle-income households in urban areas as long as the issue of
inadequate supply of affordable housing is still unresolved.
Therefore in such situations that already discussed by NAPIC (2014), Wood
(2007), EPU (2014), Sinar Harian (2013) & MoF (2015) the implementation of an
equilibrium price for Malaysian middle-class income in the affordable housing
market among developers should be proposed in order to make sure they set an
equilibrium price on par with total demand. Considering that the private developers
carry out many housing development projects, it is vital for them to know and
implement the framework proposed in this research to ensure an adequate supply of
affordable housing to the middle-income households. According to KRI (2015) and
Osman et al. (2017) Melaka Housing Board is the only board who one step forward
in providing adequate affordable housing where it also indirectly solving the
squatters problem even Johor, Pulau Pinang, Pahang and Selangor were established
at the same time. The board showed that they can manage to oversee the affordable
housing development projects even the other housing board. Melaka Housing Board
is a state government agency that had been organized to oversee the affordable
housing development projects in Melaka. The Board was established in 2002 through
the passing of the Melaka Housing Board Enactment 2002. Secondly, all over the
years, Melaka is one forward step in providing adequate affordable housing where it
also indirectly solving the squatters problem compared to other states such as Johor,

6
Pulau Pinang, Pahang and Selangor by showing the improvement of house price year
by year in Melaka (KRI, 2015; Osman et al.,2017).
Table 1.1: Total Number of Squatters for Each State in Malaysia during 2015
(KRI, 2015)
1.3 Research Questions
This research seeks to answer the following questions based on the research problem
identified:
1. What is the relationship between housing demand determinants with
affordable housing needs in Malaysia?
2. What is the relationship between housing supply determinants with affordable
housing provided in Malaysia?
3. What is the housing equilibrium price for Malaysian middle-class income in
the affordable housing market?
State Family Family Members Building
Johor
11,151
31,553
8,346
Kedah 2,703 13,255 2,703
Kelantan 1,685 7,780 1,649
Melaka 7 19 7
Negeri Sembilan 195 382 233
Pahang 1,134 5,632 935
Perak 1,709 6,836 1,709
Perlis 1,853 8,570 1,853
Pulau Pinang 4,208 18,909 2,875
Sabah 28,087 133,059 26,479
Sarawak 8,431 35,233 7,784
Selangor 2,542 3,299 3,299
Terengganu 469 1,976 450
Wilayah Persekutuan Kuala Lumpur 3,217 12,868 3,217
Wilayah Persekutuan Labuan 970 5,521 970
Total 68,361 284,892 62,509
7
1.4 Research Aim and Objectives
This research is conducted to propose a housing equilibrium price framework for
Malaysian middle-class group to create an affordable housing market. Therefore,
several research objectives need to be achieve to reach the research aim namely,
1. To investigate the relationship between housing demand determinants and
affordable housing needs in Malaysia
2. To investigate the relationship between housing supply determinants and
affordable housing provided in Malaysia.
3. To determine the housing equilibrium price for Malaysian middle-class
income in the affordable housing market.
1.5 Scope of Research
Melaka Tengah was chose as case study in this research to represent Malaysia by
taking considerations that Melaka as UNESCO World Heritage Site. This research
focussed on Melaka Tengah because the district had proven that the district had
improved and maintained the housing affordability among the citizen even it is
surrounded with high population density together with high good potential
development and urbanization (Osman et al., 2017). Population for households for
Melaka Tengah was estimated around 23,540 respondents including who are living at
Ayer Keroh, Ayer Molek, Batu Berendam, Bukit Baru, Bukit Rambai, Kandang,
Klebang, Melaka, Paya Rumput, Sungai Udang, Tangga Batu and Tanjong Kling
(DoS, 2015). However, the research had some limitations since the total number of
respondents only covered for Melaka Tengah instead of all Melaka state.
The first and second research objective is to investigate the relationship
between housing demand and supply determinants and affordable housing market in
Malaysia. For these objectives, the researcher used the questionnaire method and
distributed to two different types of respondents. The first set of questionnaire was
distributed to households between the age group of 25 to 40 years old in Melaka by
taking considerations from KRI (2015) which state that the majority of households
aged from 25 to 40 years old are facing difficulties in homeownership. Meanwhile,
the alternate survey was focused on the housing developers in Melaka because
8
according to DoS (2015), NAPIC (2015) and KRI (2015), Melaka had stood out
providing housing under affordable level compared to other state (KRI, 2015).
Results from both set of questionnaires were analysed using SPSS software to
get the strength of the relationship between the macroeconomic housing demand
determinant factors (current house price, affordable housing physical state, monetary
status, population changes, affordable housing location, infrastructures and amenities
provided) and macroeconomic housing supply determinant factors (interest rate,
construction cost, land availability, population changes, location, government
interventions) toward the affordable housing market need and supply in Malaysia.
On the other hands, third objective aims to determine the equilibrium price
for affordable housing for Malaysian middle-class income. The researcher use
secondary data analysis method to extracted the total housing demand and supply
starting year 2006 until 2015 from the Property Market Status Report from NAPIC
website. According to Riddle (2004), more than 10 years is considered accepted for
the housing demand and supply. This objective was focused on the landed housing
properties include any type of terrace house, any type of detached house, cluster and
town house, priced between RM50,000 until RM300,000 by taking considerations
from MURNInets (2016) which states that RM300,000 is a maximum price in the
affordable market price for middle-class income groups which normally face
dilemmas in homeownership.
The different final process of analyses involved are the cost-benefit analysis
process and linear regression analysis to see the equilibrium price across 10 years
selected. The analysed series data was analysed by using Microsoft Excel for further
explanation and SPSS software to complete the demand and supply equation so that
the housing equilibrium price framework for the affordable housing market can be
developed.
1.6 Significance of Research
The importance of the research is to propose the equilibrium price for the affordable
housing market in Malaysia. As we know, the state of Melaka is already categorised
providing the affordable housing market which the housing price is at three times of
the median multiple DoS (2015), NAPIC (2015) and KRI (2015). Therefore, this

9
research is carried out to create awareness among developers on how to achieve the
equilibrium price in the affordable housing market.
Besides that, the government also can improve their policy to control housing
prices as the research is going to identify factors involved in getting equilibrium
price for affordable housing market. In addition, this research will promote ways to
get equilibrium price for affordable housing so that scholars can improve the
equilibrium price framework proposed in order to make Malaysian housing
affordable not only in Melaka.
1.7 Research Organisation
This research contains seven main chapters. Overall, combination and alterations
from chapter one, two, and three are giving the theoretical framework for the
research. Chapter one generally explains about the background of research and
research problem. From that, research questions and research aim, and research
objectives are developed meanwhile the scope of research is identified.
Chapter two explains about the affordable housing problem market in detail.
Besides that, it also discusses theory related to imbalance between demand and
supply determinants and other determinants that cause the changes in house price.
Issues on affordability toward housing homeownership are also explained in this
chapter.
Research methodology will be discussed in the next chapter which is in
chapter three. Within this chapter, it covers two technique of gathering data including
primary data and secondary data. This chapter is fundamental to the research because
it explains about the research process, framework concept, ways to gather data and
information, and analysis method chosen.
The subsequent chapter covers the process of analysing data from primary
data gathered from respondents. Through this chapter, each research objective will
nearly be achieved because the results obtained are displayed, and analysed
according to the priority based on stages planned in the previous chapter.
Chapter five presents the findings of each research objective. In this chapter,
further discusion will be done in order to form a conclusion for solving the
framework proposed in the starting chapter.

10
Heading to the last chapter which is chapter six. Conclusion and suggestions
to improve the affordable housing market will be stated and recommendations for
future research will be suggested.
1.8 Conclusion
Affordable housing is not a welfare issue but it is a structural issue caused by an
unresponsive housing sector. Choosing the suitable method in doing a research is
essential which may influence in generating good information. Last but not least, this
chapter is actually the beginning of the research process. Identifying the research
background followed by current issues were highlighted in the research problem.
Consequently, research questions will be raised from the problem that are in the
limelight lately.
CHAPTER 2
LITERATURE REVIEW
2.1 Introduction
House is the largest single asset for most people since it is a part of non-pension
wealth in their life. That is why; changes in house prices can greatly affect their total
household wealth indirectly. Every increase and decrease in house price has pros and
cons. However, lower house price can open up many opportunities for young
households to buy houses instead of renting them but at the same time, it could hurt
the entire house owner. Hence, particularly in recent years, housing equilibrium
prices have been in the limelight for various research areas. Relevant theories will be
discussed later in this chapter to shed light on this issue.
2.2 Current Scenario of Housing in Malaysia
Over the past few years, the housing price market in Malaysia had experienced a
huge value development that affected the purchasing power among the home buyers
especially first time home buyers (Mohd Shoed & Subramaniam, 2016). According
to BNM (2016), incomes were rising more than the growth of house prices between
years 2004 to 2007. This sign shows the housing affordability across Malaysia has
progressively declined due to the uneven pace of house prices and income growth
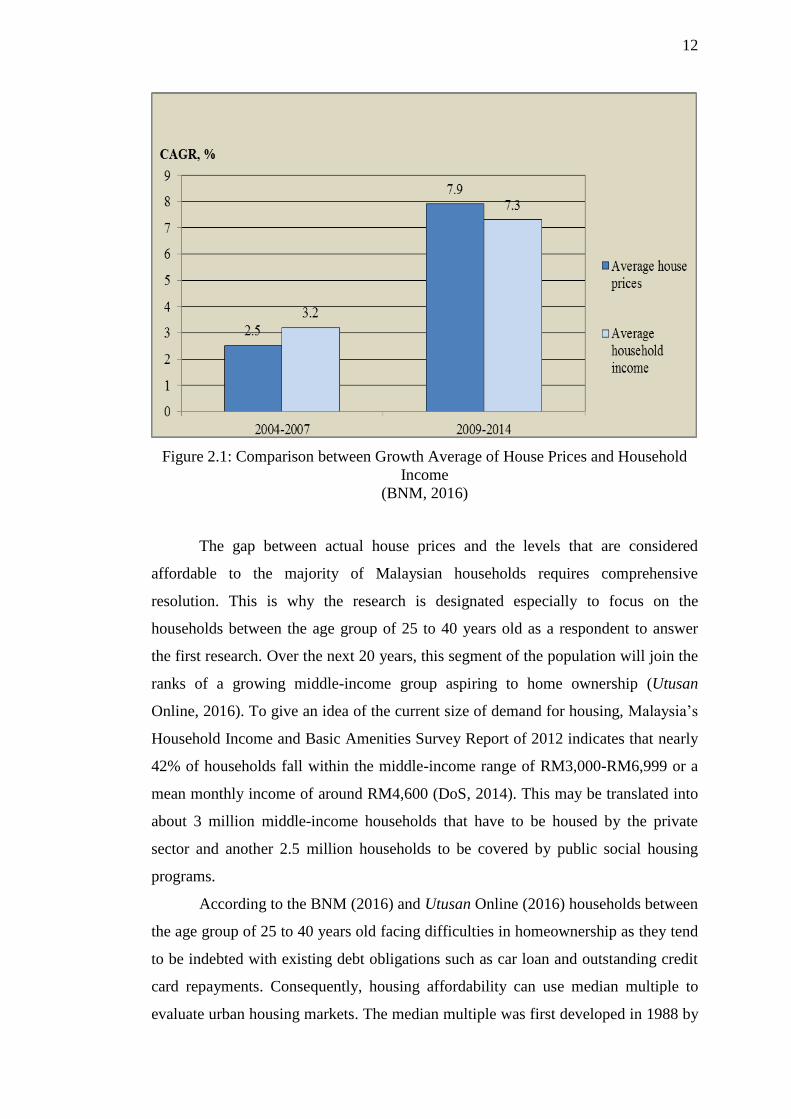
(BNM, 2016). The average of house prices in Malaysia rose by 7.9% in average
annual growth rate over a specified period of time (CAGR), exceeding the growth in
average household income of 7.3% over the same period during the period in 2009
and 2014 (see Figure 2.1).
12
Figure 2.1: Comparison between Growth Average of House Prices and Household
Income
(BNM, 2016)
The gap between actual house prices and the levels that are considered
affordable to the majority of Malaysian households requires comprehensive
resolution. This is why the research is designated especially to focus on the
households between the age group of 25 to 40 years old as a respondent to answer
the first research. Over the next 20 years, this segment of the population will join the
ranks of a growing middle-income group aspiring to home ownership (Utusan
Online, 2016). To give an idea of the current size of demand for housing, Malaysia’s
Household Income and Basic Amenities Survey Report of 2012 indicates that nearly
42% of households fall within the middle-income range of RM3,000-RM6,999 or a
mean monthly income of around RM4,600 (DoS, 2014). This may be translated into
about 3 million middle-income households that have to be housed by the private
sector and another 2.5 million households to be covered by public social housing
programs.
According to the BNM (2016) and Utusan Online (2016) households between
the age group of 25 to 40 years old facing difficulties in homeownership as they tend
to be indebted with existing debt obligations such as car loan and outstanding credit
card repayments. Consequently, housing affordability can use median multiple to
evaluate urban housing markets. The median multiple was first developed in 1988 by
13
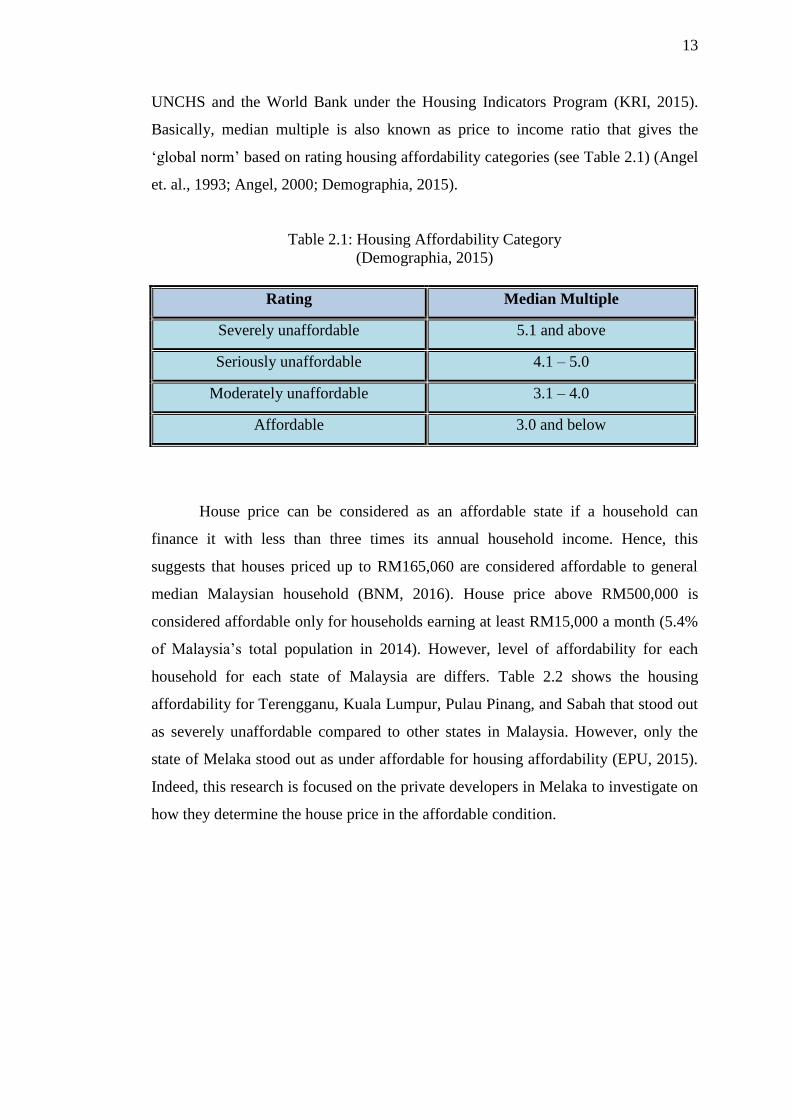
UNCHS and the World Bank under the Housing Indicators Program (KRI, 2015).
Basically, median multiple is also known as price to income ratio that gives the
‘global norm’ based on rating housing affordability categories (see Table 2.1) (Angel
et. al., 1993; Angel, 2000; Demographia, 2015).
Table 2.1: Housing Affordability Category
(Demographia, 2015)
Rating Median Multiple
Severely unaffordable 5.1 and above
Seriously unaffordable 4.1 – 5.0
Moderately unaffordable 3.1 – 4.0
Affordable 3.0 and below
House price can be considered as an affordable state if a household can
finance it with less than three times its annual household income. Hence, this
suggests that houses priced up to RM165,060 are considered affordable to general
median Malaysian household (BNM, 2016). House price above RM500,000 is
considered affordable only for households earning at least RM15,000 a month (5.4%
of Malaysia’s total population in 2014). However, level of affordability for each
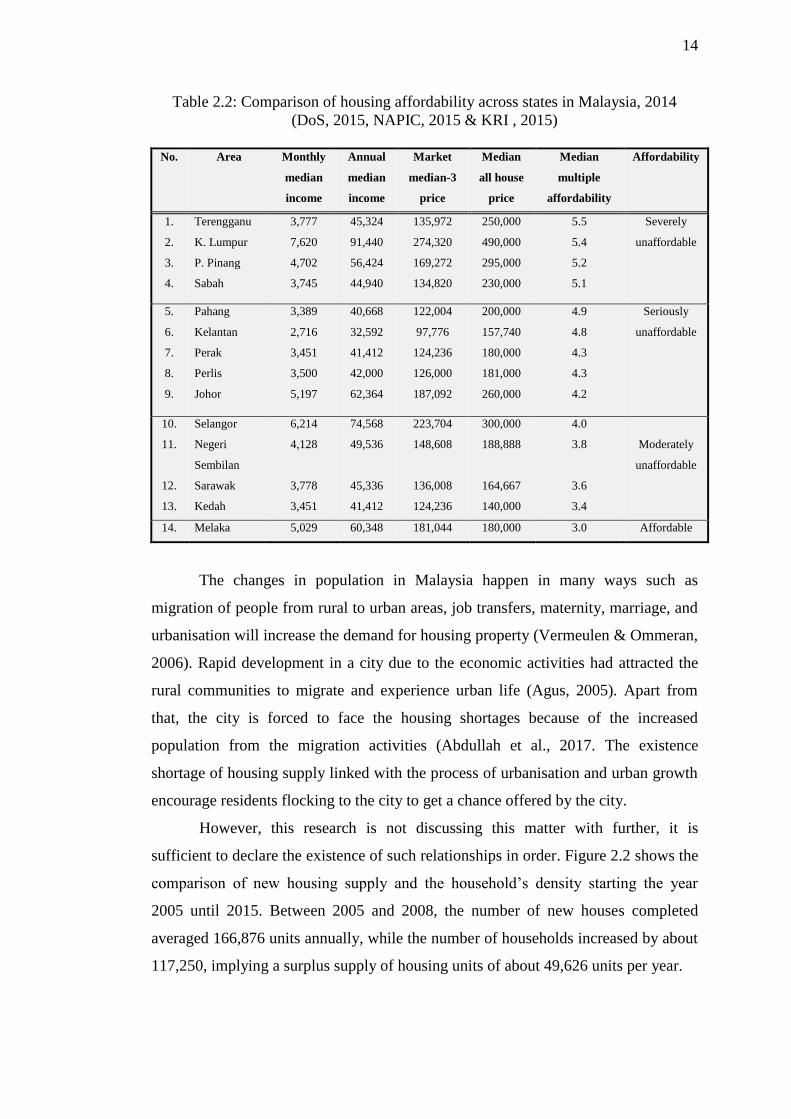
household for each state of Malaysia are differs. Table 2.2 shows the housing
affordability for Terengganu, Kuala Lumpur, Pulau Pinang, and Sabah that stood out
as severely unaffordable compared to other states in Malaysia. However, only the
state of Melaka stood out as under affordable for housing affordability (EPU, 2015).
Indeed, this research is focused on the private developers in Melaka to investigate on
how they determine the house price in the affordable condition.
14
Table 2.2: Comparison of housing affordability across states in Malaysia, 2014
(DoS, 2015, NAPIC, 2015 & KRI , 2015)
No. Area Monthly
median
income
Annual
median
income
Market
median-3
price
Median
all house
price
Median
multiple
affordability
Affordability
1.
2.
3.
4.
Terengganu
K. Lumpur
P. Pinang
Sabah
3,777
7,620
4,702
3,745
45,324
91,440
56,424
44,940
135,972
274,320
169,272
134,820
250,000
490,000
295,000
230,000
5.5
5.4
5.2
5.1
Severely
unaffordable
5.
6.
7.
8.
9.
Pahang
Kelantan
Perak
Perlis
Johor
3,389
2,716
3,451
3,500
5,197
40,668
32,592
41,412
42,000
62,364
122,004
97,776
124,236
126,000
187,092
200,000
157,740
180,000
181,000
260,000
4.9
4.8
4.3
4.3
4.2
Seriously
unaffordable
10.
11.
12.
13.
Selangor
Negeri
Sembilan
Sarawak
Kedah
6,214
4,128
3,778
3,451
74,568
49,536
45,336
41,412
223,704
148,608
136,008
124,236
300,000
188,888
164,667
140,000
4.0
3.8
3.6
3.4
Moderately
unaffordable
14. Melaka 5,029 60,348 181,044 180,000 3.0 Affordable
The changes in population in Malaysia happen in many ways such as
migration of people from rural to urban areas, job transfers, maternity, marriage, and
urbanisation will increase the demand for housing property (Vermeulen & Ommeran,
2006). Rapid development in a city due to the economic activities had attracted the
rural communities to migrate and experience urban life (Agus, 2005). Apart from
that, the city is forced to face the housing shortages because of the increased
population from the migration activities (Abdullah et al., 2017. The existence
shortage of housing supply linked with the process of urbanisation and urban growth
encourage residents flocking to the city to get a chance offered by the city.
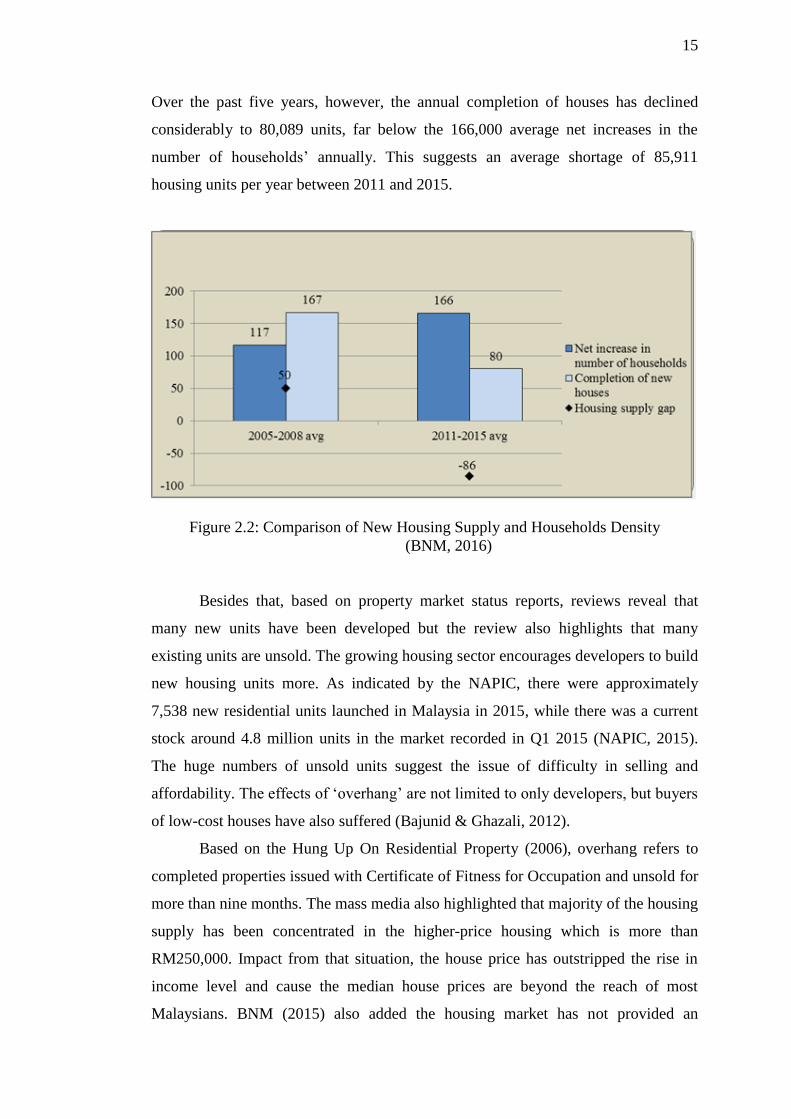
However, this research is not discussing this matter with further, it is
sufficient to declare the existence of such relationships in order. Figure 2.2 shows the
comparison of new housing supply and the household’s density starting the year
2005 until 2015. Between 2005 and 2008, the number of new houses completed
averaged 166,876 units annually, while the number of households increased by about
117,250, implying a surplus supply of housing units of about 49,626 units per year.
15
Over the past five years, however, the annual completion of houses has declined
considerably to 80,089 units, far below the 166,000 average net increases in the
number of households’ annually. This suggests an average shortage of 85,911
housing units per year between 2011 and 2015.
Figure 2.2: Comparison of New Housing Supply and Households Density
(BNM, 2016)
Besides that, based on property market status reports, reviews reveal that
many new units have been developed but the review also highlights that many
existing units are unsold. The growing housing sector encourages developers to build
new housing units more. As indicated by the NAPIC, there were approximately
7,538 new residential units launched in Malaysia in 2015, while there was a current
stock around 4.8 million units in the market recorded in Q1 2015 (NAPIC, 2015).
The huge numbers of unsold units suggest the issue of difficulty in selling and
affordability. The effects of ‘overhang’ are not limited to only developers, but buyers
of low-cost houses have also suffered (Bajunid & Ghazali, 2012).
Based on the Hung Up On Residential Property (2006), overhang refers to
completed properties issued with Certificate of Fitness for Occupation and unsold for
more than nine months. The mass media also highlighted that majority of the housing
supply has been concentrated in the higher-price housing which is more than
RM250,000. Impact from that situation, the house price has outstripped the rise in
income level and cause the median house prices are beyond the reach of most
Malaysians. BNM (2015) also added the housing market has not provided an
Net increase in
number of
households, 2005-
2008 avg, 117
Net increase in
number of
households, 2011-
2015 avg, 166
Completion of
new houses, 2005-
2008 avg, 167
Completion of
new houses, 2011-
2015 avg, 80 Housing supply
gap , 2005-2008
avg, 50
Housing supply
gap , 2011-2015
avg, -86
Net increase in
number of
householdsCompletion of new
houses
16
adequate supply of affordable housing especially for middle-class income group. The
gap between demand and supply during year 2014 was estimated around 960,000
units across Malaysia which recorded about 50% of the shortage is faced by Sabah
and Sarawak. The rest half percent recorded are Kuala Lumpur, followed by Pulau
Pinang and Johor having the highest shortage of affordable housing units (BNM,
2015). Contradict, Selangor is the only state found to have a surplus of affordable
housing units (BNM, 2015).
Table 2.3 shows the Gap between Housing Needs and Housing Provided for
Low Starting Year 1971 until 2010. Unfortunately, the government has not
documented the statistics for the targets in the Tenth Malaysia Plan (2011–2015) and
for the housing erected by the public and private sectors. In the Second Malaysia
Plan (from 1971 to 1975), the private sector increased its influence when the
government sought the cooperation of private developers in the provision of low-cost
houses. As per this plan, at least 30% of the houses in each private housing project
must be low cost. To sum up from all Malaysian plans, the private sector has
exceeded this set target by providing a surplus of 41%, 29.4%, and 116% of houses
over the past three consecutive Malaysia Plan periods (1991–1995, 1996–2000, and
2000–2005, respectively.
From the table, we can see that the housing provided by public sector and
government still cannot fill the gap for housing needs. Every five years Malaysian
plan is not be able to achieve their target in providing a sufficient unit of housing
especially for medium-cost housing. Seventh Malaysian Plan recorded that only 1/3
medium-cost housing of the market needs constructed by public sector meanwhile
the private sector constructed more than the market needs. The fall in supply is not
new. National housing production has been on a declining trend since the late
1970’s, notably for social housing, which once accounted for over 50% of total
housing output. A shortage of housing is likely to worsen as population growth
continues and the supply response remains sluggish. Latest household projection
suggest that housing supply would have to rise very significantly from its levels over
the past twenty years in order to meet rising demand. The shortfall between the
demand for housing each year and the number of housing completions is often
referred to as the ‘demand gap’. There has been a long-term gap between the
estimated annual demand for housing in the regions and the numbers of houses
constructed each year in each region as well as nationally
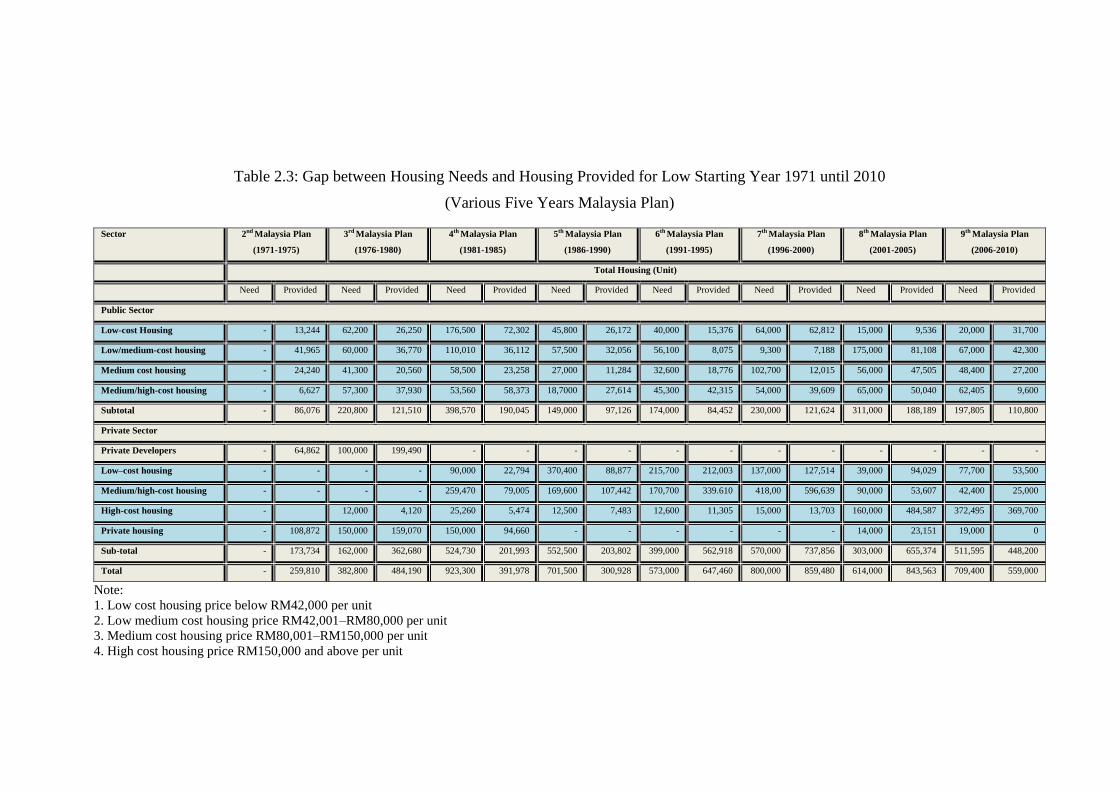
Table 2.3: Gap between Housing Needs and Housing Provided for Low Starting Year 1971 until 2010
(Various Five Years Malaysia Plan)
Sector 2nd Malaysia Plan
(1971-1975)
3rd Malaysia Plan
(1976-1980)
4th Malaysia Plan
(1981-1985)
5th Malaysia Plan
(1986-1990)
6th Malaysia Plan
(1991-1995)
7th Malaysia Plan
(1996-2000)
8th Malaysia Plan
(2001-2005)
9th Malaysia Plan
(2006-2010)
Total Housing (Unit)
Need Provided Need Provided Need Provided Need Provided Need Provided Need Provided Need Provided Need Provided
Public Sector
Low-cost Housing - 13,244 62,200 26,250 176,500 72,302 45,800 26,172 40,000 15,376 64,000 62,812 15,000 9,536 20,000 31,700
Low/medium-cost housing - 41,965 60,000 36,770 110,010 36,112 57,500 32,056 56,100 8,075 9,300 7,188 175,000 81,108 67,000 42,300
Medium cost housing - 24,240 41,300 20,560 58,500 23,258 27,000 11,284 32,600 18,776 102,700 12,015 56,000 47,505 48,400 27,200
Medium/high-cost housing - 6,627 57,300 37,930 53,560 58,373 18,7000 27,614 45,300 42,315 54,000 39,609 65,000 50,040 62,405 9,600
Subtotal - 86,076 220,800 121,510 398,570 190,045 149,000 97,126 174,000 84,452 230,000 121,624 311,000 188,189 197,805 110,800
Private Sector
Private Developers - 64,862 100,000 199,490 - - - - - - - - - - - -
Low–cost housing - - - - 90,000 22,794 370,400 88,877 215,700 212,003 137,000 127,514 39,000 94,029 77,700 53,500
Medium/high-cost housing - - - - 259,470 79,005 169,600 107,442 170,700 339.610 418,00 596,639 90,000 53,607 42,400 25,000
High-cost housing - 12,000 4,120 25,260 5,474 12,500 7,483 12,600 11,305 15,000 13,703 160,000 484,587 372,495 369,700
Private housing - 108,872 150,000 159,070 150,000 94,660 - - - - - - 14,000 23,151 19,000 0
Sub-total - 173,734 162,000 362,680 524,730 201,993 552,500 203,802 399,000 562,918 570,000 737,856 303,000 655,374 511,595 448,200
Total - 259,810 382,800 484,190 923,300 391,978 701,500 300,928 573,000 647,460 800,000 859,480 614,000 843,563 709,400 559,000
Note:
1. Low cost housing price below RM42,000 per unit
2. Low medium cost housing price RM42,001–RM80,000 per unit
3. Medium cost housing price RM80,001–RM150,000 per unit
4. High cost housing price RM150,000 and above per unit
18
2.3 General Attributes and Operational Definitions
2.3.1 Affordable Housing
Before framing the housing affordability, it is important to delineate the contours of
this term by defining the term affordable housing. According to Gopalan &
Venkataraman (2015), affordable housing refers to any housing that meets some
form of affordability criterion such as income level of the family and the
affordability (High Level Task Force on Affordable Housing for All, 2008).
However, UN-HABITAT, 2011 defined the affordable housing as the housing which
is adequate in quality and location, and is not so costly that it prevents its occupants
from meeting other basic living needs.
Meanwhile, MURNInets (2013) summarised that the definition of affordable
housing in Malaysia are includes houses built for low-income households, low-
medium households and medium households. Besides that, the definition also related
to the ability of the households to pay at least 1/3 of the total household income for
the purpose of payment either own ownership or lease. However, MURNInets (2013)
added that the concept of affordable housing does not have a fixed and uniformed
definition according to the type of scheme introduced by the government. This is
because all the housing scheme introduced are targeting different class income group
according to their target applicants which based on the eligibility criteria that had
been set.
Therefore, Table 2.4 shows the definition of affordable housing according to
the scheme introduced by the government. There are about seven types of affordable
housing projects in Malaysia namely Skim Perumahan Rakyat 1Malaysia (PR1MA),
Skim Perumahan Mampu Milik Swasta (MyHome), Perumahan Penjabat Awam
1Malaysia (PPA1M), Program Perumahan Rakyat (PPR), Rumah Mesra Rakyat
1Malaysia (RMR1M), Rumah Mampu Milik Wilayah Persekutuan (RUMAWIP) and
Rumah Selangorku (Starproperty, 2016).

19
Table 2.4: Definition of Affordable Housing According to the Type of Scheme
(Adaptation from Starproperty, 2016)
No. Type of Scheme Definition
1. 1Malaysia People’s
Housing
Includes houses built in price range starting from RM100,000
until RM400,000 for households income between RM2,500
until RM10,000
2. Private Affordable
Ownership Housing
Scheme (MyHome)
MyHome1
Includes houses built in price range starting from RM50,000
until RM90,000 at Peninsular for the first time buyer
households income between RM3,000 until RM4,000
MyHome2
Includes houses built in price range starting from RM90,001
until RM170,000 for the first time buyer households income
between RM4,001 until RM6,000
3. Program Perumahan
Penjawat Awam
1Malaysia (PPA1M)
Includes houses built in price range starting from RM150,000
until RM300,000 for the first time buyer government servants
income below RM10,000
4. Projek Perumahan
Rakyat (PPR)
Includes houses built in price range starting from RM30,000
until RM35,000 for the first time buyer households income
below RM2,500
5. Rumah Mesra Rakyat
1Malaysia (RMR1M)
Includes houses built in price range starting from RM45,000
until RM65,000 for households income between RM750 until
RM3,000
6. Rumah Mampu Milik
Wilayah Persekutuan
(RUMAWIP)
Includes houses built in price range starting from RM52,000
until RM300,000 for households income below RM15,000
(only for who stays and work in Wilayah Persekutuan)
7. Rumah Selangorku Includes houses built in price range starting from RM42,000
until RM250,000 for households income between RM3,000
until RM10,000 (only for who within vicinity of the Selangor
region)
8. Rumah Idaman
Rakyat (RIR)
Includes houses built in price range starting from below
RM300,000 for first time buyers/disable persons (OKU) or
single mother having personal income under RM7,500 or
households income under RM10,000
20
2.3.2 Malaysian Middle Class Income Group
Since 2014, economists and academics have believed the term “middle class” did not
have the same meaning it had more than 10 years ago when considering the
challenges faced by this group in coping with the demands of life today (Surendra,
2017). As indicated in the Routledge Handbook of World Englishes, the middle class
basically a class of salaried workers. Again according to the book, the middle class
income group is depending on their salary and upon increment salaries as their main
income sources. Kirkpatrick (2010) also highlighted that the purchasing power
among the middle-income group are depends upon the value of the currency.
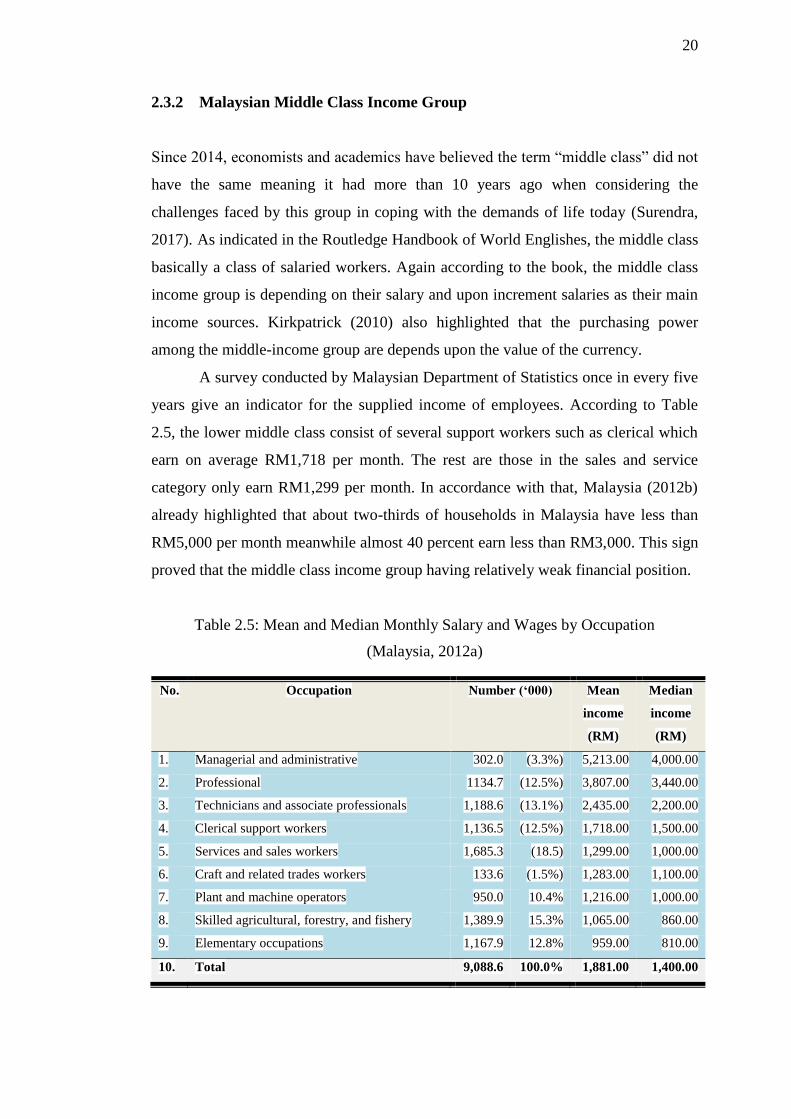
A survey conducted by Malaysian Department of Statistics once in every five
years give an indicator for the supplied income of employees. According to Table
2.5, the lower middle class consist of several support workers such as clerical which
earn on average RM1,718 per month. The rest are those in the sales and service
category only earn RM1,299 per month. In accordance with that, Malaysia (2012b)
already highlighted that about two-thirds of households in Malaysia have less than
RM5,000 per month meanwhile almost 40 percent earn less than RM3,000. This sign
proved that the middle class income group having relatively weak financial position.
Table 2.5: Mean and Median Monthly Salary and Wages by Occupation
(Malaysia, 2012a)
No. Occupation Number (‘000) Mean
income
(RM)
Median
income
(RM)
1. Managerial and administrative 302.0 (3.3%) 5,213.00 4,000.00
2. Professional 1134.7 (12.5%) 3,807.00 3,440.00
3. Technicians and associate professionals 1,188.6 (13.1%) 2,435.00 2,200.00
4. Clerical support workers 1,136.5 (12.5%) 1,718.00 1,500.00
5. Services and sales workers 1,685.3 (18.5) 1,299.00 1,000.00
6. Craft and related trades workers 133.6 (1.5%) 1,283.00 1,100.00
7. Plant and machine operators 950.0 10.4% 1,216.00 1,000.00
8. Skilled agricultural, forestry, and fishery 1,389.9 15.3% 1,065.00 860.00
9. Elementary occupations 1,167.9 12.8% 959.00 810.00
10. Total 9,088.6 100.0% 1,881.00 1,400.00
21
On the other hands, those group in the administrative, managerial and
professional categories earn as much as RM10,000 until RM30,000 per month,
meanwhile those in other category earn RM2,000 until RM4,000 per month. In this
case, Kirkpatrick (2010) had mentioned that group is categorized as new middle class
income as the group enjoy a higher income level. To address this, the government
had set up several housing programmes especially for the middle class income group
since the demand for housing is not strong among those do not own houses but also
among house owners who want to improve their quality of life (Abdul Rahman,
2013).
2.3.3 Housing Market
Previous research (Oberlink, 2008) specifies housing is such a fundamental necessity
that people often question about where to live largely on the basis of what kind of
housing options are available and whether these options meet their current budget
and requirement. Pettinger (2012) defined the housing market as medium that consist
of supply and demand for houses, usually in a particular country or region. A key
element of the housing market is the average house prices and trend in house prices.
However, according to Olanwareju et al. (2016) housing market is a major industry
of the arrangement that brings buyers and sellers into a close contact to exchange
goods or services where price mechanisms or market regulations are applied for
efficiency.
Pettinger (2012) highlighted that a housing market usually involve five main
element namely, supply for housing, demand for housing, house prices, rented sector
and government intervention. Olanwareju (2016) explained in his paper that the price
paid for a good or service in the market is determined by the supply and demand
forces. Specifically, a market aims to allocate resources and to maximize the surplus
of buyers and sellers. Sullivan et al. (2013) added, with the market structure, a buyer
will not pay more than the value of the good or service earned. On the other hand, the
market allows sellers to maximize their surplus. However, the market also can be
imperfect because of factors like price, income distribution and quantity regulation,
taxes, subsidies, social interests, common resources, monopoly, and high costs of the
transaction that could also lead to inefficiency (Parkin, 2013).

22
2.3.4 Medium-Cost Housing Needs
Housing needs and housing demand are two different terms. According to Health
(2014), housing need is refers to shortfalls from certain normative standards of
adequate accommodation. This measure mainly refers to the level of need for more
or improved social housing. Housing need drivers include demographic trends such
as migration rates, population age structures and household headship rates Health,
2014). Besides that, economic factors are also involved directly and indirectly in
terms of their influence over demographic outcomes such as household formation.
Hence, any comprehensive housing needs framework must include both
demographic and economic variables (Health, 2014).
Housing need has always been seen as strongly related to demographic
trends in population and household numbers, and any housing need framework must
take account of demographics including age structures (Bramley, 2010). On the other
hands, housing demand is a market driven concept and relates to the type and number
of houses that households will choose to occupy based on preference and ability to
pay. Usually, the term housing requirement is sometimes used to combine these two
measures to generate an overall picture of the housing market (Health, 2014).
According to (Health, 2014), governments may require estimates of housing need for
a variety of purposes. If regularly refreshed they should provide a way of monitoring
the state of the housing system, analogous to government’s monitoring of poverty or
the state of the labour market.
Bramley et al. (2010) reported the main factors identified behind housing
need, as distinct from housing demand. As the report notes, housing need may refer
to such as insecurity of tenure or lack of affordability, or housing that is unsuitable
due to its type or condition. As there is no universal set of measures to determine
either need or demand, estimates of how many homes and of what type are
required are likely to vary (Bramley et al., 2010). However, a determination of need,
for the provision of social housing, will be affected by certain policy
judgements as well as the measures used. Statements about the numbers of
houses that need to be built as opposed to the existing ‘need’ and projected
demand for housing will therefore be influenced by certain value judgments and
factors such as the availability of resources (Schmuecker, 2011).
23
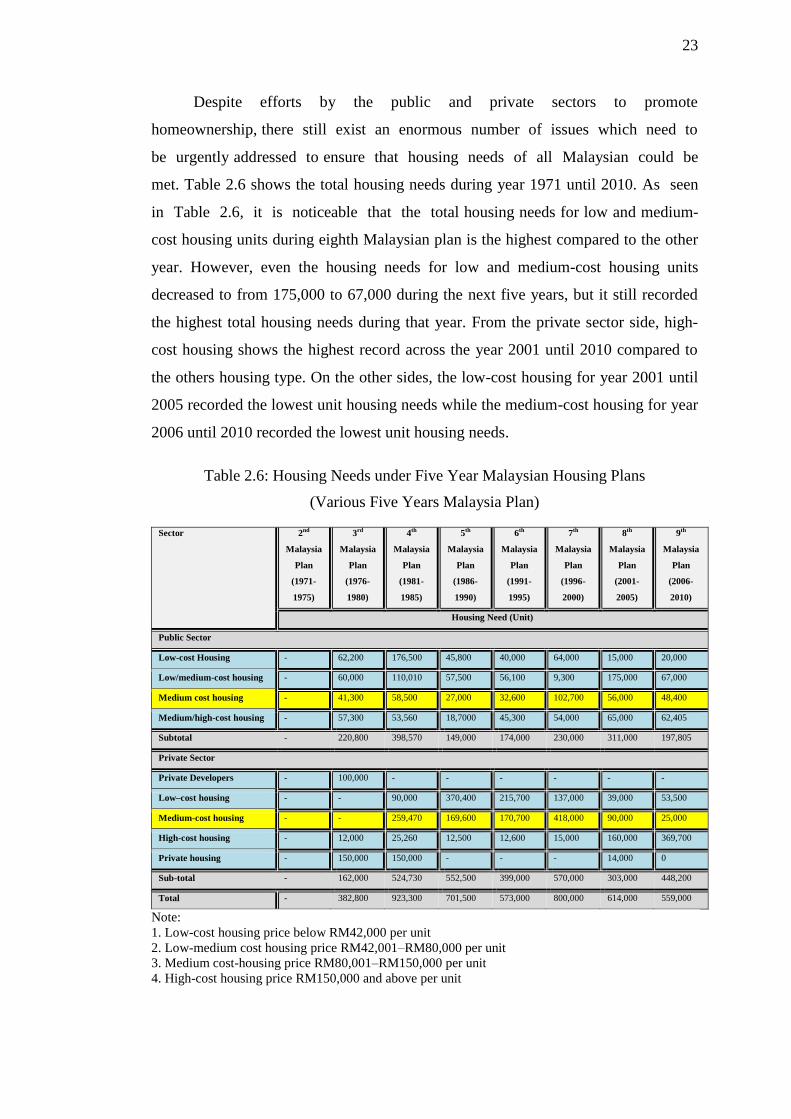
Despite efforts by the public and private sectors to promote
homeownership, there still exist an enormous number of issues which need to
be urgently addressed to ensure that housing needs of all Malaysian could be
met. Table 2.6 shows the total housing needs during year 1971 until 2010. As seen
in Table 2.6, it is noticeable that the total housing needs for low and medium-
cost housing units during eighth Malaysian plan is the highest compared to the other
year. However, even the housing needs for low and medium-cost housing units
decreased to from 175,000 to 67,000 during the next five years, but it still recorded
the highest total housing needs during that year. From the private sector side, high-
cost housing shows the highest record across the year 2001 until 2010 compared to
the others housing type. On the other sides, the low-cost housing for year 2001 until
2005 recorded the lowest unit housing needs while the medium-cost housing for year
2006 until 2010 recorded the lowest unit housing needs.
Table 2.6: Housing Needs under Five Year Malaysian Housing Plans
(Various Five Years Malaysia Plan)
Sector 2nd
Malaysia
Plan
(1971-
1975)
3rd
Malaysia
Plan
(1976-
1980)
4th
Malaysia
Plan
(1981-
1985)
5th
Malaysia
Plan
(1986-
1990)
6th
Malaysia
Plan
(1991-
1995)
7th
Malaysia
Plan
(1996-
2000)
8th
Malaysia
Plan
(2001-
2005)
9th
Malaysia
Plan
(2006-
2010)
Housing Need (Unit)
Public Sector
Low-cost Housing - 62,200 176,500 45,800 40,000 64,000 15,000 20,000
Low/medium-cost housing - 60,000 110,010 57,500 56,100 9,300 175,000 67,000
Medium cost housing - 41,300 58,500 27,000 32,600 102,700 56,000 48,400
Medium/high-cost housing - 57,300 53,560 18,7000 45,300 54,000 65,000 62,405
Subtotal - 220,800 398,570 149,000 174,000 230,000 311,000 197,805
Private Sector
Private Developers - 100,000 - - - - - -
Low–cost housing - - 90,000 370,400 215,700 137,000 39,000 53,500
Medium-cost housing - - 259,470 169,600 170,700 418,000 90,000 25,000
High-cost housing - 12,000 25,260 12,500 12,600 15,000 160,000 369,700
Private housing - 150,000 150,000 - - - 14,000 0
Sub-total - 162,000 524,730 552,500 399,000 570,000 303,000 448,200
Total - 382,800 923,300 701,500 573,000 800,000 614,000 559,000
Note:
1. Low-cost housing price below RM42,000 per unit
2. Low-medium cost housing price RM42,001–RM80,000 per unit
3. Medium cost-housing price RM80,001–RM150,000 per unit
4. High-cost housing price RM150,000 and above per unit

24
2.3.5 Medium-Cost Housing Provided
As Dispaquale (1999) points out that housing provided is unlike other markets where
we observe price per standard unit (such as price per pound of apples), we
observe housing expenditures (price times quantity) since there is no standard
housing quantity since each unit can vary considerably on many quality
dimensions in the housing market. This is because, housing provided is the outcome
of complicated decision making by builders and the owners of existing housing.
However, we have little direct evidence that permits us to observe the behavior of
housing providers. In order to understand the micro foundations of housing
provided, developers should come with information on the quality and quantity
of housing services provided, maintenance and capital improvement decisions,
rents, and asset values (Dispaquale, 1999).
First, housing provided by the for the poor under Eight Year Malaysian
Plans has not been satisfactory. The housing provided for medium-cost housing
and high –cost housing by the private sector is about 496, 996 units. On the other
hand, the low achievement levels for the low-cost housing provided which is only
9,536 units are due to a complicated and ambiguous relationship between
federal, state and local levels. Such relationship has caused the overlapping in the
distribution of work which may retard the performance of the public sector (Shuid,
2011). In the Seventh Malaysian Plan (1996 – 2000), 737, 856 units of houses were
built by the private sector in which 206, 208 units were medium-cost and 348, 250
units were high-cost units (see Table 2.7).
Meanwhile, housing provided by the public sector in the medium-and high-
cost housing is high as clearly indicated in the Sixth Malaysian Plan. However, in
the case of private sector, housing provided for low-cost housing type by private
developers fell below the targeted level as they are not keen in building low-cost
houses due to a low level of profitability. It is not surprising to learn that the
construction of medium and high-cost housing by private sector has exceeded
targeted level with a 158.6% for medium cost and a 386.2% for high cost
housing during the Sixth Malaysia Plan. The level of achievement for medium
and high- cost housing has further increased to 187.5% and 435.3% respectively for
the period 1996 through 2000.

150
Abdullah, Y. A., Kuek, J. N., Hamdan, H., & Zulkifli, F. L. M. (2017). Combating
Squatters In Malaysia: Do We Have Adequate Policies As
Instrument?. Planning Malaysia Journal, 15(2).
Agus, M. R. (1992). Pembangunan perumahan: isu dan prospek. Dewan Bahasa
dan Pustaka, Kementerian Pendidikan Malaysia.
Agus, M. R. (2002). The role of state and market in the Malaysian housing
sector. Journal of Housing and the Built Environment, 17(1), pp. 49-67.
Angel, S., Mayo, S. K. & Stephens, W. L. (1993). The Housing Indicators Program:
A Report on Progress and Plans for the Future. Journal of Housing and the
Built Environment, 8(1), pp. 13-48.
Angel, S. (2000). Housing Policy Matters: A Global Analysis: A Global Analysis.
New York: Oxford University Press Inc.
Arman, M., Zuo, J., Wilson, L., Zillante, G & Pullen, S. (2009). Challenges of
responding to sustainability with implications for affordable housing
Ecological Economics, 68, pp. 3034-3041.
Asek, B. The people housing programme: A study of the implementation of federal
government housing in peninsular Malaysia. Ph.D Thesis. University of
Malaya; 2007.
Ayuso, J., & Restoy, F. (2006). House prices and rents: An equilibrium asset pricing
approach. Journal of Empirical Finance, 13(3), pp. 371-388.
Babbie, E. (2011). Introduction to social research. Canada: Wadsworth cengage
learning.
Bailey, M. J., Muth, R. F. & Nourse, H. O. A. (1963). Regression method for real
estate price index construction. Journal of the American Statistical
Association. 58(304), pp. 933-942.
Bajunid, A. F. I., & Ghazali, M. (2012). Affordable mosaic housing: rethinking low-
cost housing. Procedia-Social and Behavioral Sciences, 49, 245-256.
Bakhtiar, B., Zaharim, A., Sopian, K., Saadatian, O & Moghimi, S (2013). Quality
housing in affordable price for Malaysian low-income. WSEAS Transactions
on Environment and Development, 9(2), pp. 78 - 91.
Ball, M. (1986). Housing analysis: time for theoretical refocus? Housing Studies,
1(3), pp. 147 - 165.
Bank Negara Malaysia (BNM) (2016). Financial reporting for Islamic banking
institutions. Retrieved on March 10, 2016, from
151
http://www.bnm.gov.my/guidelines/01_banking/02_financial_reporting/Finan
cial_Reporting_for_Islamic_Banking_Institutions.pdf.
Berlin, C. (2007). Sampling and descriptive statistics. Taiwan, National Taiwan
Normal University: SLP
Berry, A. A. The relationship between selected housing and demographic
characteristics and employment status among rural, low-income
families. Ph.D Thesis. Northeast Louisiana University: 2003
Blanc, D. (2001). The effect of public social housing on households consumption in
France. Journal of Housing Economics.10: 429-455.
Bowen, G. A. (2009). Document Analysis as Qualitative Research Method.
Qualitative Research Journal, 9(2): 27-40.
Bramley, G., Pawson, H., White, M., Watkins, D., & Pleace, N. (2010). Estimating
housing need.
Burke, T. (2004). Measuring housing affordability. Australian Housing and Urban
Research Institute, 50107.
Cagamas Holdings Berhad. (2013). Housing the Nation: Policies, Issues and
Prospects. Kuala Lumpur: Cagamas Holdings.
Capozza, D. R., Hendershott, P. H., Mack, C., & Mayer, C. J. (2002). Determinants
of real house price dynamics. National Bureau of Economic Research.
Cohen, J. (1988). Set correlation and contingency tables. Applied Psychological
Measurement, 12(4), pp. 425-434.
Commerce International Merchant Bankers Berhad (CIMB) (2014). Property Market
Report.
Corbin, J & Strauss, A. (2008). Basic of qualitative research: Techniques and
procedures for developing grounded theory. 3rd
ed. Thousand Oaks, CA:
Sage Publications.
Demographia. (2015). 11th Annual Demographia International Housing
Affordability Survey: 2015. Retrieved on December 15, 2015, from
http://www.demographia.com/dhi.pdf
Department of National Housing (JPN) (2015). Laporan Perangkaan Tahunan 2014.
Kuala Lumpur: Ministry of Urban Wellbeing, Housing and Local
Government. Retrieved on March 10, 2016, from
http://ehome.kpkt.gov.my/index.php/pages/view/36
152
Department of Statistics (DoS). (2007). Monograph Series No.4: Urbanisation and
Urban Growth in Malaysia. Putrajaya: Department of Statistics.
Department of Statistics (DoS). (2011). Report on Household Expenditure Survey.
Putrajaya: Department of Statistics.
Department of Statistics (DoS). (2014). Household Income and Basic Amenities
Survey. Kuala Lumpur: Department of Statistics Housing Income Survey.
Retrieved on January 1, 2016, from
https://www.statistics.gov.my/index.php?r=column/cone&menu_id=cUp6NlN
ndGlaQkZhK0gwYUMyWFRxdz09
Department of Statistics (DoS). (2015). Malaysia Economic Statistics Time Series
2015. Kuala Lumpur: Department of Statistics (DoS). Retrieved on March 10,
2016, from
https://www.statistics.gov.my/dosm/uploads/files/3_Time%20Series/Malaysia
Time_Series_2015/Penerbitan_Time_Series_2015.pdf
DeSalvo, J. (1975). Benefits and costs of New York city’s middle-income housing
program. Journal of Political Economy. 83, pp. 791-804.
DeVellis, R. F. (2003). Scale development: Theory and applications. 2nd
ed.
Newbury Park, CA: Sage Publications
Devi Prasad, B & Sampath Kumar, R. D. (1991). Opinion molding by the press: An
analysis of the election related content of editorials and letters to the editors,
Media Asia. 18(1), pp. 24-29.
DiPasquale, D. and W. Wheaton. 1996. Econometric Analysis of Office and
Industrial Markets. Chap. 12 in Urban Economics and Real Estate
Markets.Englewood Cliffs, NJ: Prentice Hall.
Doling, J. (1992). Housing policies and the little tigers: how do they compare with
other industrialised countries? Housing Studies Journal, 14(2), pp. 229-250.
Economic Planning Unit (EPU). (2015). Eleventh Malaysia Plan 2016-2020:
Anchoring Growth on People. Retrieved July 10, 2016, from
http://rmkll.epu.gov.my/index.php/en/
Epley, D. R., & Rabianski, J. (1986). Principles of real estate decisions. Reston Pub
Co.
Fang, Y. (2005). Residential Satisfaction Conceptual Framework Revisited- A Study
On Redevelopment Neighbourhoods in Inner City Beijing. United States:
University of Colorado at Denver.

153
Farrel, P. (2011). Writing a built environment dissertation, practical guidance and
examples. United Kingdom: John Wiley & Sons Ltd.
Feldman, R. (2002). The Affordable Housing Shortage: Considering the Problem,
Causes and Solution, Banking and Policy Working Paper 02-2. Federal
Reserve Bank of Minneapolis.
Fisher, L. M., Pollakowski. H. O., & Zabel, J. (2009). Amenity-based housing
affordability indexes. Journal of Real Estate Economics, 37(4), pp. 705-746.
Flavin, M., & Yamashita, T. (2002). Owner-occupied housing and the composition
of the household portfolio. American Economic Review. 92(1), pp 345 – 362.
Franzosi, R. (2008). Content analysis: Objective, systematic, and quantitative
description of content. Content analysis Journal, 1, pp. xxi-xlx.
Freeman, A. M. (2003). The Measurement of Environmental and Resource Values:
Theory and Methods. 2nd
ed. Washington,DC: Resources for the Future (RFF)
Publications.
Funston, J. (2001). Government and politics in Southeast Asia. Singapore: Institute
of South East Asian Studies.
Gallin, J. (2003). The long-run relationship between house prices and income:
evidence from local housing markets. Regional Science Association
International Conference. Athens. University of Georgia. 2002.
Gan, Q., & Hill, R. J. (2009). Measuring housing affordability: Looking beyond the
median. Journal of Housing economics, 18(2), pp. 115-125.
Gao, A.H. & Wang, G.H.K. (2007). Multiple transactions model: a panel data
approach to estimate housing market indices. Journal of Real Estate
Research. 29(3), pp. 241-265.
Gavett, T. W. (1967). Quality and a pure price index: a survey of the problems
encountered in accommodating measures of quality change when computing
pure price indexes. Monthly Labor Review. 90, pp. 16 -20.
Gopalan, K., & Venkataraman, M. (2015). Affordable housing: Policy and practice
in India. IIMB Management Review, 27(2), 129-140.
Green, R., & Hendershott, P. H. (1996). Age, housing demand, and real house
prices. Regional Science and Urban Economics Journal, 26(5): 465-480.
Green, R. K., Malpezzi, S., & Mayo, S. K. (2005). Metropolitan-specific estimates of
the price elasticity of supply of housing, and their sources. The American
Economic Review Journal, 95(2): 334-339.

154
Grimes, A., & Aitken, A. (2010). Housing supply, land costs and price
adjustment. Real Estate Economics, 38(2), pp. 325-353.
Hair, J. J. F., Babin, B., Money, A. H. & Samouel, P. (2003). Essentials of business
research methods. United States: John Wiley & Sons, Inc.
Hansen, J. Australian house prices: a comparison of hedonic and repeat-sales
measures. Economic Record. 2009. 85, pp. 132 -145.
Hartini, N. S. (2016, April 25), Rebut peluang memiliki rumah. Utusan Online.
Retrieved on May 23, 2016, from
http://www.utusan.com.my/rencana/rebut-peluang-memiliki-rumah-1.290265
Harvey, J. (1992). Urban land economics. 3rd
ed. London: Palgrave Macmillan.
Harvey, J. & Jowsey, E. (2004). Urban Land Economics. 6th
ed. London: Palgrave
Macmillan.
Hashim, Z. A. House price and affordability in Malaysia. Akademika Journal. 2010.
78: 37-46.
Heath, S. (2014). Housing demand and need (England). England: House of
Commons Library.
Hendershott, H. & R. Haurin. (1988). Adjustments in the Real Estate Market.
AREUEA Journal. 16(2): 343-353.
Hoek-Smit, M.C., & Diamond, D.B. The Design and Implementation of Subsidies
for Housing Finance. World Bank Seminar on Housing Finance. March 10 -
13. United States. University of Pennsylvania. 2003. pp. 1–40.
Holly, S., Pesaran, M. H., & Yamagata, T. (2010). A spatio-temporal model of house
prices in the USA. Journal of Econometrics, 158(1), pp. 160-173.
Horn, J. L. (1965). A rationale and test for the number of factors in factor
analysis. Psychometrika, 30(2), pp. 179-185.
Horner, M. W., & Mefford, J. N. (2007). Investigating urban spatial mismatch using
job–housing indicators to model home–work separation. Environment and
Planning A, 39(6), pp. 1420-1440.
Hulchanski, J. D. (1995). The concept of housing affordability: six contemporary
uses of the housing expenditure-to-income ratio. Housing Studies, 10(4): 47-
491.
Iacoviello, M., & Neri, S. (2007). The role of housing collateral in an estimated two-
sector model of the US economy. Working Papers in Economics, 412.
Iman, A, H, B, H, M. An Introduction to Property Marketing. Johor: UTM. 2002
155
Iman, A, H, B, H, M. Basic Aspects of Property Market Research. Revised Ed.
Johor: UTM
Iman, A, H, B, H, M & Hamidi, N. Implikasi Pencemaran Alam Sekitar Terhadap
Nilai Harta Tanah Kediaman. First Real Estate Educators and Researchers
Malaysia (REER) Seminar. City Campus. Johor: UTM. 2005. ms 1-9
Insch, G. S., Moore, J. E., & Murphy, L. D. (1997). Content analysis in leadership
research: Examples, procedures, and suggestions for future use. The
Leadership Quarterly Journal, 8(1), pp. 1-25.
Ishak, S. N. H., Chohan, A. H., & Ramly, A. (2007). Implications of design
deficiency on building maintenance at post-occupational stage. Journal of
Building Appraisal, 3(2): 115-124.
Jaafar, M., Bakar, S. P. S. A., & Daud, W. M. D. W. (2015). Training New Housing
Entrepreneurs—A Malaysian Scenario. In Entrepreneurship Education and
Training. InTech.
Jenkins, P., Smith, H. & PingWwang, Y. (2007). Planning and Housing in the rapidly
Urbanizing World: Housing, Planning and Design Series, London.
Jomo, K. S. (1999). Development planning in Malaysia: a critical appraisal. Kuala
Lumpur: Utusan Publication and Distribution.
Jomo, K. S. & Gomez, E. T. (2000). The Malaysian development dilemma.
Cambridge: Cambridge University Press.
Jupp, P. (2006). Data collection and analysis. 2nd
ed. Sage Pub. Inc.
Kalarickal, J. & Buckley, R. M. (Eds.). (2006). Thirty Years of World bank Shelter
Lending, World Bank, Washington, DC.
Kalra, S., Mihaljek, D., & Duenwald, C. K. (2000). Property prices and speculative
bubbles: Evidence from Hong Kong SAR.
Kamsari, S. A. (2016, May, 1). 40 tahun bekerja belum memiliki rumah. Utusan
Online. Retrived on May 23, 2016, from
http://www.utusan.com.my/berita/nasional/40-tahun-bekerja-belum-miliki-
rumah-1.300507
Kau, J. B. & Sirmans, C. F. (1985). Taxation and real estate investment. New York:
Mcgraw-Hill.
Keep, M. Regional house prices: affordability and income ratios, Standard Note
SN/SG/1922. United Kingdom: Library, House of Commons. 2012.
156
Kerlinger, F.N. (1986). Foundations of behavioral research. 3rd
ed. New York: Holt,
Rinehart and Winston Publications.
Khalid MS. Abandoned housing development: The Malaysian experience. PhD
thesis. Heriot-Watt University; 2010.
Khazanah Research Institute (KRI). (2014). The State of Households. Kuala Lumpur.
Retrieved on January 18, 2016, from
www.KRIinstitutes.org
Khazanah Research Institute (KRI). (2015). Making Housing Affordable. Kuala
Lumpur: Creative Commons Attribution. Retrieved on January 18, 2016,
from
www.KRIinstitutes.org
Khazanah Treasure (2015). Malaysian Economy First Quarter 2015. Ministry of
Finance. Retrieved on January 1, 2016, from
http://www.treasury.gov.my/pdf/ekonomi/suku_tahunan/sukutahun1_2015.pdf
Kiel, K. A., & Zabel, J. E. (2008). Location, location, location: The 3L Approach to
house price determination. Journal of Housing Economics,17(2), pp. 175-
190.
Kim, S. S., Yang, I. H., Yeo, M. S., & Kim, K. W. (2005). Development of a housing
performance evaluation model for multi-family residential buildings in
Korea. Building and environment Journal, 40(8), pp. 1103-1116.
Kim, J. O., & Mueller, C. W. (1978). Factor analysis: Statistical methods and
practical issues. Sage publication.
Kirkpatrick, A. (Ed.). (2010). The Routledge handbook of world Englishes.
Routledge.
Kuang, W., & Li, X. (2012). Does China face a housing affordability issue?
Evidence from 35 cities in China. International Journal of Housing Markets
and Analysis Journal, 5(3): 272-288.
Kraft, J., & Kraft, A. (1979). Benefits and costs of low rent public housing. Journal
of Regional Science, 19(3), pp. 309-317.
Krejcie, R. V., & Morgan, D. W. (1970). Determining sample size for research
activities. Educ psychol meas.
Labin, A. M. J. E., Che-Ani, A. I., & Kamaruzzaman, S. N. (2014). Affordable
housing performance indicators for landed houses in the central region of
Malaysia. Modern Applied Science, 8(6): 70.

157
Li, M. M., & Brown, H. J. (1980). Micro-neighborhood externalities and hedonic
housing prices. Land economics, 56(2), pp. 125-141.
Lit, P. K. & Soon, S. K. (2008). What’s ahead for Malaysia? Current challenges and
emerging trends. Selangor: Pelanduk Pubns Sdn Bhd.
Malaysia (2012a) Household income and amenities survey report, Putrajaya:
department of statistics
Malaysia (2012b) Labour force survey report, Putrajaya: department of statistics
Malaysia (1981). Fourth Malaysia Plan (1981-1985). KL: Prime Minister‟s
Department
Malaysia (1986). Fifth Malaysia Plan (1986-1990). KL: Prime Minister‟s
Department
Malaysia Urban-Rural-National Indicators Network on Sustainable Development
(MURNInets) (2011). KT1-P1: Peratus Unit Rumah Mampu Milik Berkualiti
(Affordable Quality Housing). Retrieved on December 25, 2015, from
http://murninet.townplan.gov.my/murninets/nodes/view/type:petunjuk/slug:kt
1-p1-peratus-unit-rumah-mampu-milik-berkualiti
Malpezzi, S. (2002). Hedonic pricing models: a selective and applied review.Section
in Housing Economics and Public Policy: Essays in Honor of Duncan
Maclennan.
Mansor, H. I., & Law, S. H. (2014). House prices and bank credits in Malaysia: An
aggregate and disaggregate analysis. Habitat International, 42, pp. 111-120
Milligan, V., Phibbs, P., Fagan K., & Gurran, N. (2004). A Practical Framework for
Expanding Affordable Housing Services in Australia: Learning from
Experience, Final Report 61 AHURI, Melbourne. Ministry of Housing and
Local Government, 2009 and 2013.
Ministry of Finance (MoF). (2013). Review of Real Property Gains Tax (RGPT).
Retrieved from
http://www.treasury.gov.my/pdf/budget/speech/appendices12.pdf
Ministry of Housing and Local Government Malaysia. (2002). Garis panduan
pelaksanaan harga baru rumah kos rendah. Kuala Lumpur: Ministry of
Housing and Local Government Malaysia.
Montgomery, D. C., Peck, E. A., & Vining, G. G. (2015). Introduction to linear
regression analysis. Canada: John Wiley & Sons Inc Publication.

158
Mourouzi‐Sivitanidou, R. (2002). Office rent processes: the case of US metropolitan
markets. Real Estate Economics, 30(2), pp. 317-344.
Murty, D. V. R. (2001). Developmental Journalism. New Delhi: Dominant
Publishers.
N/A (2013, July 11). Pemaju kaut untung besar: Rangka undang-undang kawal harga
rumah. Sinar Harian. p. 25.
N/A(2017).Soft property market in 2017: Buyers old to focus on second hand homes.
TheStar Online. Retrieved on August 15, 2017, from
https://www.pressreader.com/malaysia/the-star-malaysia
starbiz/20170324/281586650423032
Starproperty (2016). Malaysia Affordable Housing Guide 2016/2017 – Part 2.
Malaysia: Starproperty
http://www.starproperty.my/index.php/articles/investment/malaysia-
affordable-housing-guide-20162017-part-2/
National Economic Action Council (NEAC). (1998). Economic action plan. Kuala
Lumpur: NEAC.
National Property Information Centre (NAPIC) (2014). Residential, Shops and
Industrial Properties Market Status Report Q1 (2014). Kuala Lumpur:
Valuation and Property Services Department. Retrieved on December 5,
2015, from
http://napic.jpph.gov.my/portal/web/guest/publication
National Property Information Centre (NAPIC) (2015). Market Status Report (2015).
Kuala Lumpur: Valuation and Property Services Department. Retrieved on
December 5, 2015, from
http://napic.jpph.gov.my/portal/web/guest/publication
Neuendorf, K. A. (2002). The content analysis guidebook. London: Sage
Publications.
Nneji, O., Brooks, C., & Ward, C. W. (2013). House price dynamics and their
reaction to macroeconomic changes. Economic Modelling, 32, pp. 172-178.
Nursyahidah, A. B. (2015, Disember 31). Bajet 2016. Berita Harian. pp. 15.
ODPM (Office of the Deputy Prime Minister). (2005). Sustainable communities:
Homes for all. London: The Stationary Office.
Oberlink, M. R. (2008). Opportunities for creating livable communities. AARP,
Public Policy Institute.

159
Olanrewaju, A., Tat, L., Tan, S. Y., Naoto, M., Nizamani, Z., & Aziz, A. R. A.
(2016). Analysis Of Economic Determinants Of Affordable Housing Prices.
Olanrewaju, A., Aziz, A. R. A., Tan, S. Y., Tat, L. L., & Mine, N. (2016). Market
analysis of housing shortages in Malaysia. Procedia Engineering, 164, 315-
322.
Olsen, E. and Barton, D. The benefits and costs of public housing in New York City.
Journal of Public Economics. 1983. 20: 299–332.
Omar, I (2003). Penilaian Harta Tanah. Dewan Bahasa Dan Pustaka, Kuala Lumpur
Osland, L. The importance of unobserved attributes in hedonic house price models.
International Journal of Housing Markets and Analysis. 2013. 6(1), pp. 63–
78.
Osmadi, A., Mustafa Kamal, E., Hassan, H & Abdul Fattah, H. Exploring the
elements of housing price in Malaysia. Asian Social Science. 2015. 11(24):
26–38.
Owusu-Ansah, A. (2012). Modeling the supply of new residential construction for
local housing markets: The case of Aberdeen, UK. In 19th Annual European
Real Estate Conference, Edinburgh, UK.
Pallant, J. (2010). SPSS survival manual. A step by step guide to data analysis using
SPSS. Australia: Allen & Unwin Book Publishers.
Palmquist, R. B. A note on transaction costs, moving costs, and benefit
measurement. Journal of Urban Economics. 1992. 32(1), pp. 40 - 54.
Parker, C. (2015). Housing supply, choice and affordability: Trends, economic
drivers and possible policy interventions. Auckland Council.
Parkin, M. Economics, 10th Ed. Pearson Education Limited, Harlow, 2013
Parmeter, C. F. & Pope, J. C. (2009). Quasi-experiments and hedonic property
methods in John, A. and Price, M.K. (Eds), Handbook of Experimental
Economics and Environment, Edward Elgar, Englewood Cliffs, NJ.
Pettinger, T. (2012). UK Economy in the 1980s. Economicshelp. com
Phang, S. Y. (2010). Affordable homeownership policy: implications for housing
markets. International Journal of Housing Markets and Analysis,3(1), pp. 38-
52.
Pivo, G. (2013). The Definition of Affordable Housing: Concerns and Related
Evidence. Working paper, FannieMae, Accessed 7 January 2014 at: www.
fanniemae. com/resources/file/fundmarket.

160
PR1MA (2012). Rumahku Komunitiku. Retrieved on December 5
http://www.pr1ma.my/
Quigley, J. A simple hybrid model for estimation real estate price indexes”, Journal
of Housing Economics, 1995. 4, pp. 1-12.
Rai, R. K. (2011). Knowledge management and organizational culture: a theoretical
integrative framework. Journal of Knowledge Management, 15(5): 779-801.
Rapley, T. (2007). Doing conversation, discourse and document analysis. London:
Sage Publications.
Rashid, M. F. A., & Ghani, I. A. (2007). Migrasi dan kemiskinan bandar: suatu
kajian literatur1. PKPPM, Pulau Pinang.
Rasid, K. A. (2013). Pasaran harta tanah kediaman berdasarkan implikasi penentuan
harga rumah oleh pemaju, kajian kes Nusajaya. Master’s Thesis. Universiti
Teknologi Malaysia; 2013.
Rasiah, R. & Shari, I. (2001). Market, government and Malaysia's new economic
policy. Economics, 25(1), pp. 57 - 78.
Real Estate Housing Developers’ Association Malaysia (REHDA) (2008). Towards
Sustainable Development: Improving the One-Stop Center (OSC). REHDA
Bulletin January 2008.
Riddel, M. (2004). Housing-market disequilibrium: an examination of housing-
market price and stock dynamics 1967-1998. Journal of Housing Economics,
13, pp. 120-35.
Rohe, W. M., & Stegman, M. A. (1994). The effects of homeownership: On the self-
esteem, perceived control and life satisfaction of low-income people. Journal
of the American Planning Association, 60(2), pp. 173-184.
Rose, S., Spinks, N., & Canhoto, A. I. (2014). Management research: Applying the
principles.1st
ed. New York: Routledge.
Rosen, H. S. (1979). Housing decisions and the US income tax: An econometric
analysis. Journal of Public Economics, 11(1), pp.1-23.
Ross‐McGill, H., Hewison, J., Hirst, J., Dowswell, T., Holt, A., Brunskill, P., &
Thornton, J. G. (2000). Antenatal home blood pressure monitoring: a pilot
randomised controlled trial. BJOG: An International Journal of Obstetrics &
Gynaecology, 107(2) pp. 217-221.
161
Sadi, A., Assaf, A. A. & Bubshaitr F. A. (2010). Factors affecting affordable housing
cost in Saudi Arabia. International Journal of Housing Markets and Analysis,
3(4) pp. 290–307.
Salleh, S. (2008). Faktor Yang Dipertimbangkan Dalam Menentukan Harga Jualan
Rumah Oleh Pemaju Perumahan: Kajian Di Negeri Kedah Dan Perlis. Kertas
Penyelidikan Jabatan Penilaian dan Perkhidmatan Harta Negeri Perlis.
Sanchez-Garcia, J. C. (2015). Entrepreneurship Education and Training. InTech
Schmuecker, K. (2011). The good, the bad and the ugly. Housing demand, 2025
Schreier, M. (2012). Qualitative content analysis in practice. Sage Publications.
Schneider, A., Hommel, G., & Blettner, M. (2010). Linear Regression
Analysis. Dtsch Ä rztebl Int, 107, pp. 776-782.
Seeley, I. H. (1983). Building Economics. London: Macmillan Press.
Sekaran, U. & Bougie, R. (2013). Research business method: a skill building
approach. 6th
ed. United States: John Wiley & Sons. Inc.
Sheehan, B. An analysis of housing development costs in Portland, Oregon. Master’s
Thesis. Portland State University; 1997.
Shiller, R. J. (2007). Understanding recent trends in house prices and home
ownership. National Bureau of Economic Research.
Sixth Malaysia Plan (1991-1995). KL: Prime Minister‟s Department Malaysia
(1996).
Seventh Malaysia Plan (1996-2000). KL: Prime Minister‟s Department Malaysia
(2001).
Eighth Malaysia Plan (2001-2005). Putrajaya: Prime Minister‟s Department
Malaysia (2006).
Ninth Malaysia Plan (2006-2010). Putrajaya: Prime Minister‟s Department.
Shuid, S. (2003). Low Medium Cost Housing in Malaysia: Issued and Challenges.
International Islamic University Malaysia.
Shuid, S. Role of the state and market in low cost housing provision in malaysia: The
case study of open registration system for low cost house buyers. Ph.D
Thesis. International Islamic University Malaysia, 2011.
Shuid, S. (2015). The housing provision system in Malaysia. Habitat International,
pp. 1–14.

162
Sivitanidou, R. & P. Sivitanides. Office Capitalization Rates: Real Estate and Capital
Market Influences. Journal of Real Estate Finance and Economics, 1999.
18(3), pp. 297-322.
Stone, M. E. (2006). What is housing affordability? The case for the residual income
approach. Housing policy debate, 17(1), 151-184.
Suhaida, M. S., Tawil, N. M., Hamzah, N., Che-Ani, A. I., Basri, H., & Yuzainee, M.
Y. (2011). Housing affordability: A conceptual overview for house price
index. Procedia Engineering, 20, pp. 346-353.
O'Sullivan, A., Sheffrin, S and Perez, S. Microeconomics: Principles, Applications,
and Tools. 8th Ed. Prentice Hall. San Francisco, 2013
Sumka, H. & Stegmant, M. An economic analysis of public housing in small cities.
Journal of Regional Science. 1978. 18, pp. 395 – 410.
Tabachnick, B. G., & Fidell, L. S. (2007). Experimental designs using ANOVA.
Thomson/Brooks/Cole.
Tan, Y. K. (2011). An Hedonic Model for house prices in Malaysia. In International
Real Estate Society Conference 15(1), pp. 12-15.
Tiebout, C. M. (1956). The urban economic base reconsidered. Land
Economics, 32(1), pp. 95-99.
Tsai, I. C., & Peng, C. W. (2011). Bubbles in the Taiwan housing market: the
determinants and effects. Habitat International Journal, 35, pp. 37–390.
Tsai, I.T. (2013). Housing affordability, self-occupancy housing demand and housing
price dynamics. Habitat International Journal. 40 pp. 73-81.
Tsatsaronis, K., & Zhu, H. (2004). What drives housing price dynamics: cross-
country evidence. BIS Quarterly Review, March.
Vermeulen, W., & van Ommeren, J. (2006). Housing supply and the interaction of
regional population and employment (No. 65). CPB Netherlands Bureau for
Economic Policy Analysis.
Wagelin, E. (1979). Urban low-income housing and development: A case study in
peninsular Malaysia. Leiden: Martinus Nijhoff.
Wallbaum, H., Ostermeyer, Y., Salzer, C & Zea, E. E. (2012). Indicator based
sustainability assessment tool for affordable housing construction
technologies. Ecological Indicators,18, pp. 353 -364.
Wallace, J. E. (1995). Financing Affordable Housing in the United States, Housing
Policy Debate, 6(4), pp. 785 - 814.
163
Weiss, M. L. (Ed.). (2014). Routledge Handbook of Contemporary Malaysia.
Routledge.
Wen, X. C., & He, L. Y. (2015). Housing demand or money supply? A new
Keynesian dynamic stochastic general equilibrium model on China’s housing
market fluctuations. Physica A: Statistical Mechanics and its
Applications,432, pp. 257-268.
Werna, E. (1999). Modes of Low-Income Housing Provision in Washington, D.C: A
Comparative Look at Policymaking for Developing Countries. Washington,
D.C: Woodrow Wilson International Center for Scholars.
Wheaton, W & R. Torto. An Investment Model of the Demand and Supply for
Industrial Real Estate. AREUEA Journal. 1990. 18(4) pp. 530-547.
Wood, J. (2007). Synergy city: planning for a high density, supersymbiotic society
Landscape and Urban Planning, 83, pp. 77-83.
World Bank. (1993). Housing: Enabling markets to work. Washington D.C: The
World Bank.
Wurtzebach, C. H., Miles, M. E., & Cannon, S. E. (1994). Modern Real Estate John
Wiley & Sons. New York, 1, 994.
Yahya, N. (2003). Low-Cost Public Housing: Fulfilling the Basic Needs and
Lifestyles. In Seminar on Accessibility to Basic Needs.
Yang, Z., & Shen, Y. (2008). The affordability of owner occupied housing in
Beijing. Journal of Housing and the Built Environment, 23(4): 317-335.
Zainal, R. (2015). Decision making process model for housing developers in
Malaysia (Doctoral dissertation, Universiti Teknologi Malaysia).
Zainuddin, Z. (2010). An empirical analysis of Malaysian housing market: Switching
and non-switching models (Doctoral dissertation, Lincoln University).
Zhang, X. Q & Sheng, Y. K. (2002). State and market: Governing housing in Asia.
Housing and the built environment 17, pp. 1-6.
Zhang, W. (2007). The Spatial Interaction of Housing Cost and Commuting Cost:
Evidence from Beijing Market. Progress in Geography, 2, 3542.
Zulkepli, M.. Pembangunan model penentuan keperluan perumahan. Kajian kes:
Johor Bahru, Malaysia. Doctoral’s Thesis. Universiti Tun Hussein Onn
Malaysia; 2011.


