
IEEJ:February 2013 All Right Reserved

1/18Theme: Activation of EnergyTheme: Activation of Energy‐‐Saving Initiatives throughSaving Initiatives through
Establishment of EnergyEstablishment of Energy‐‐Effective Organization &Effective Organization &Development of New TechnologiesDevelopment of New Technologies
T. Ohta, Manufacturing Planning Office, Functional Products Manufacturing Dept., Denso Corporation
1. Corporate Profile■Major Products
■ Domestic Sites
Aichi Pref.
Mie Pref.9 sites in Chubu area
Daian Plant
We deliver satisfaction to our customers by offering attractive products.
●Car air‐conditioning system ●Air cleaners, etc.
●Car navigation system●ETC on‐board equipment●Remote security system
Convenience
Safety
Environment Comfort
●ISCV (Idle Speed Control Valve)●VCT (Variable Cam Timing)●OCV (Oilflow Control Valve)
●Sensing system for driving assist system●ABS/ESC actuators & ECUs●Airbag sensors and ECUs / Vehicle periphery monitoring system ●Combination meters ... etc.
Functional Products Manufacturing Dept.
Daian Plant (Inabe City, Mie Pref.)(Functional Products Manufacturing Dept.,Ignition Manufacturing Dept., Driving SafetyManufacturing Dept., Ceramics Manufacturing Dept.)
Type‐1 Designated Energy Management Factory
Nishio Plant
Agui Plant
Ikeda Plant
HeadquartersAnjo Plant
Takatana Plant
Kota Plant
Toyohashi PlantZenmyo Plant
IEEJ:February 2013 All Right Reserved

Eco‐Management
Eco‐Products
Eco‐Factory
Eco‐Friendly
Improvement & Expansion of Eco‐Management
Development & Designing Ensuring Both Eco‐Friendliness &
Advanced Performance
Cross‐company collaboration & improved provision of
information concerning eco‐activities
2. Denso's Environment Policy
We are engaged in continuous ecoWe are engaged in continuous eco‐‐activities to achieve numerical targets.activities to achieve numerical targets.
Constant Reduction of Impact on the Global Production Environment
CO2 Reduction in Production & Logistics Activities
• Epoch‐making improvement in productivity (e.g. innovative production technologies)
• Building of a change‐resistant, energy‐saving structure and achievement of significant improvements in per‐unit CO2 emissions by promoting "Energy JIT"*1and other activities designed to halve the energy consumption in a long run.
1. Production
2. LogisticsWorldwide energy‐saving by ensuring efficient transportation and eco‐driving.
Emission per sales*2: Reduction by 60% from the 1990 levelEmission: Reduction by 7% from the 1990 level*3
*1 JIT: Just In Time
*2 Physical production value (Actual production value adjusted for selling price, etc.)*3 Average for the 2008‐2012 period.
2/18
Denso Eco Vision 2015
IEEJ:February 2013 All Right Reserved

■ Environment Committee & Action Organization
The Manufacturing Department is working as one team to The Manufacturing Department is working as one team to implement initiatives and achieve the company's common goals.implement initiatives and achieve the company's common goals.
3. Energy Management System 3/18
Social Environment Subcommittee
Social Environment Subcommittee
REACH ProjectREACH ProjectEnergy-Saving Tech. GroupPublic Relations Group
Field-based Kaizen & implementation
CO2 ProjectCO2 Project Energy GroupEnergy Group
Environment Committee
Machineries Dept.
Machineries Dept.
Prototype Mfg. Dept.
Prototype Mfg. Dept.
Facilities Dept.Facilities Dept.
Powertrain Control Systems Business G.Powertrain Control
Systems Business G.
(Launched in 1992)
Eng. Div.
1
Eng. Div.
2
Eng. Div.
3
Eng. Div.
4
Production Eng. Div.
Plant No.
1
Plant No.
2
Inspection Office
Production Management Office
Chief Implementation Officer: General Manager of the Dept.
Implementation Leader: Head of Manufacturing Planning Office
<Execution Organization>
[Me]
Secretariat
Production Sec. 1-8
(2008 - )
Product Environment Subcommittee
Product Environment Subcommittee
DENSO Group Environment Conference in Japan
Business Group & Region Environment Committee
Electronic Systems Business G.
Electronic Systems Business G.
Information & Safety Systems Business G.
Information & Safety Systems Business G.
Components Eng. Dept.
Components Eng. Dept.
Overseas Regional Environment Committees
Energy‐Saving Committee in the Functional Products Mfg. Dept.
To monitor the progress made in implementing energy‐saving plans and
undertake follow‐up activities
Production Environment Subcommittee
Production Environment Subcommittee
Gasoline Injector Mfg. Dept.Diesel Injector Mfg. Dept.Ignition Mfg. Dept.Ceramics Mfg. Dept.
Electric Sys. Mfg. Dept. IElectric Sys. Mfg. Dept. IIEHV Components Mfg. Dept.
Thermal Systems Business G.
Thermal Systems Business G.
Functional Products Mfg. Dept.
Functional Products Mfg. Dept.
IEEJ:February 2013 All Right Reserved

4. Performance in Past 3 Years and Goals for FY2011 4/18
■ Reduction in CO2 Emission(1,000t-CO2)
Evaluation Evaluation Evaluation
(t-CO2/ ¥100M)
(t-CO2)
■ Unit CO2 Emission & CO2 Emission
Unit CO2 emission goals were not achieved due to external factors.
We will continue our efforts toward achieving the unit emission We will continue our efforts toward achieving the unit emission target target even if we face unexpected external factorseven if we face unexpected external factors similar to those in 2010.similar to those in 2010.
FunctionalProducts
Unit CO2 emission: 7.31t‐CO2/¥100M or lower
Reduction in CO2 emission: 710t‐CO2or more
■ Goal Setting for FY2011
⇒Stretch Goal: 1,065t‐CO2
Unit
Emission
Emission
9.08.07.0
8.98.1 7.4
9.17.5
7.2
12.7Reduction
Reduction
10.7
Reduction
11.2
○ ○ ○
<Internal Stretch Goal>Improvement of unit CO2 emission by 3% on a Y‐o‐Y basis
Company‐
Wide
<Baseline Goal>Continuous reduction in unit CO2 emission (40% or more lower than the 1990 level)
×
○
○
○
×
×
TargetFY2008 FY2009 FY2010
FY2008 FY2009 FY2010
2.292.42Actual
1.671.74
1.271.37
150% of company mandate
Global RecessionImpact of Heat
Wave16141210
IEEJ:February 2013 All Right Reserved

5. Current Energy Consumption by Manufacturing Dept. 5/18
Reduce the rising air consumptionReduce the rising air consumptionand improve the unit air consumption.and improve the unit air consumption.
Factor 1. Our FY2010 Kaizen activities focused on the savingof electricity.
Factor 2. The cutting‐process in‐sourcing increased air usage.(Examples of use: Air blow to purge cutting water/remove cutting swarf)
■ Changes in unit CO2 emission by energy
1.1
0.9
0.4
Unit E
mission
(t‐CO2/¥1
00M) 7.0
FY2009
6.0
6.32
0.37
0.97
6.12ImprovedElectricity
Air Worsened
Leveled‐off
The unit air consumption has been worsening.
FY2010
0.37
1,736t‐CO2
FY2009
Electricity66%
Electricity77%
Air23%
FY2010
1,367t‐CO2
Air34%
■ Factors of the Increase in Unit Air Consumption
Gas
FY2008
7.35
0.43
1.121.03
1.0
0.3
6.5
7.5 <Breakdown of CO2 Reduction by Year/by Energy>
1.00
0.95
1. 05
Uni
t Air
Con
sum
ptio
n40,000
50,000
45,000
55,000
0FY2009 FY2010
Air
Con
sum
ptio
n
(1,000 m3)
42,083
47,687
0.97
1.03
(t‐CO2/¥100M
Rotor CuttingSprocket Cutting
Lines launched in FY2010
FY2011
50,103
1.05
Sleeve CuttingSprocket Cutting #2Cutting for Company M
Lines launched in FY2011
IEEJ:February 2013 All Right Reserved

Process
Line Name Washing Machine
Air Purge Air Blow Booster Valve
Convum Air Pump A
ir micro
intermittent
Shift to
blowers
Pressure
reduction
Shift to C
/Ps
Intermittent
Control
Pressure
Reduction
Intermittent
Control
Pressure
Reduction
Connection
to Standby
Rem
oval
Shift to C
/Ps
Shift to
Vacuum
P
Shift to
Intermittent
Efficiency
Increase
Airless
Intermittent
Control
Assy Intake VCT #7 180,020 ● - - - - ● ● ● ● ● - - - - - -
Assy High-vacuum DS 157,687 - ● - - - ● ● ● ● - ● ● - ○ - -
Assy Intake VCT #6 123,693 ● - - - - ● ● ● ● ● - - ● - - -
Cut RII Housing゙ 106,258 ● - ● ● ● ● ● ● ● - - - - ● ● ●
Assy Exhaust VCT #3 103,367 ● - - - - ● ● ● ● ● - - - - - -
Cut VCT housing゙ 93,137 ● - ● ● ● ● ● ● ● ● - - - ● ● ○
Assy APM III Tr #1 89,352 - - - - - ● ● ● ● - ● ● - - - -
Assy Intake VCT #4 89,219 ● - - - - ● ● ● ● ● - - - - - -
Assy OCV V #1 87,596 ● - - - - ● ● ● - ● - - - ● - -
Cut NP2 Cutting 87,544 - - ○ ● ● ● ● ● ● - - - - ● ● ●
Assy OCV #3 87,397 - ● ○ ● ● ○ ○ ● ● ● ● ● - ● - -
Air consum
ptionSm
all
Mon.Ave.
(m3/m)
<In the past: Improvement needs were prioritized in order of absolute consumption>
Large
6. Review & Analysis of Air Reduction Initiatives 6/18
■ Verification of Implementation Using Kaizen Matrix
《Initiatives in the Past》1. Lines with large air consumption2. Kaizen activities through which significant
improvements were expectedThe main focus was placed on the reduction of "absolute amount."《Current Initiatives》
Identify innovative Kaizen solutions.
●:Implemented ○:To be implemented -:N/A
Large Kaizen effects Small
Double AT liner
Major Kaizen Effects Minor
1.0
1.2
1.4
1.7
1.7
1.9
2.2
2.4
2.5
3.2
4.2
35,207Cut
180,020Intake VCT #7Assy
93,137VCT Housing゙Cut
●●●●●●-12,509High-Vacuum DS OffCut
●○○○●○--70,120E-VCT CuttingCut
●●●-----74,139AT liner #1Assy
●●○●●●-○106,258RII Housing゙Cut
●○○●●●--87,397NP2 CuttingCut
●●●-----54,212ECT #2Assy
●●●-----45,958Intake VCT #1Assy
●○○●●○○-82,996VCT Rotor #4Cut
Connection to
standbyP
ressure R
eductionInterm
ittent C
ontrolP
ressure R
eductionInterm
ittent C
ontrol
Shift to C
/Ps
Pressure
Reduction
Shift to
blowers
Air BlowAir PurgeWashing M/CLine NameProcess
UsageperUnit
(m3/unit)
<Kaizen needs are prioritized in order of air consumption/unit>Mon. Ave.
(m3/m)
Cutting lines rank high, indicating a lot of Kaizen works to do
⇒Assign a person in charge of eachitem to ensure 100% Kaizen.
○○○●○○--
●●●----●
●●●●●●-●
Kaizen Scale
Difficulty
Investment
Prod. Tech Secretariat/Prod.
Difficult Easy
SmallLarge
Large Small
Investigate actual state to exert utmost air reduction efforts iInvestigate actual state to exert utmost air reduction efforts in cutting lines.n cutting lines.
IEEJ:February 2013 All Right Reserved

7. Investigation of Actual State to Exert Utmost Air Reduction EffortsProcedure: Analyze cutting lines' air consumption to identify all Kaizen opportunities.
7/18
■ Review of Air Consumption by Major Cutting Lines
Double AT Cutting Investigation by Secretariat in Dec. 2010
■ Findings from On-Site Investigation<List of Inspection Results>
Air leakage■■■
Incorrect calendar time switch on/off time■
No use of energy-saving air guns■
Excessive air pressure■■■
Too long airgun discharge time●
●●
Continuous air blowing for post- installation improvement
Findings321
Work-feeding blowForeign body
removing blow
[Classified by Factor]
Identify causes by gathering opinions directly from relevant depIdentify causes by gathering opinions directly from relevant departments.artments.
1. Different volume of consumption duringoperating hours
→Larger air consumption at copy lines2. Large air consumption during lunch time3. Air consumption during non-operating hours.→Air is consumed when no production is taking place.
Results
21
1
VCT Rotor Cutting #4
2
5.1m3/min
33
Air reduction with no energy-saving consideration (for quality/productivity improvement)Insufficient maintenance & control (administration issue)
●
■
Many air-loss cases were identified.
RII Valve CuttingVCT Rotor Cutting #3
An energy measuring system is used for the review.
Air
(m3 )
Air
(m3 )6.3m3/min
Air
(m3 )
Air
(m3 )
Com
parison betw
een copy lines
6:00 12:00 18:00 0:00 6:00
6:00 12:00 18:00 0:00 6:00
IEEJ:February 2013 All Right Reserved

Driving force
Air vacuum 14,027,000m3 15,900,000m3
FY2011 (Estimate)FY20100
42%
Air blow accounts for approx. 40%
(1,000 m3)
Air consumption by 10 major cutting lines (by purpose of use)
■ Review meeting with relevant departments
8. Investigation of Causes for Air Loss (Hearing Directly from Relevant Departments)
[Me]
[Production]
[Production Tech.]
[Maintenance]
8/18
Are our energy-saving efforts really paying off?
Quality & productivity improvement should be prioritized!
<Challenges>3. Activate energy-saving initiatives by developing human
resources who can play an active and leading role in Kaizen efforts.
<True Causes>1. Although the importance of energy-saving is well
recognized, priority is placed on production activities.
We are too busy to care about energy-saving.
[Production]
Is there any new and efficient air blow technology that costs
less but makes instant improvements?
Air blow is the quickest way to ensure high quality and utilization rate.
2. Kaizen activities to ensure quality and productivity are hindering energy-saving efforts.
4. Develop a new and low-cost air blow technology that can achieve both improvement in quality/productivity and energy saving.
Accelerate energyAccelerate energy‐‐saving initiatives through human resource and new saving initiatives through human resource and new technology development. technology development.
Case 1Case 1
Case 2Case 2
Air purge
Air blow
IEEJ:February 2013 All Right Reserved

9-1. Case-1 Development of "Core" Human ResourcesChallenge: Activate energy-saving initiatives by developing "core" human resources who can play an active
and leading role in Kaizen efforts.
9/18
Process
《Launch of "Energy-Saving Basic Learning Center" that provides hands-on experience》
《Showcase of Initiatives》Exhibitions to present company-
wide/intra-department energy-saving initiatives and their goals
《Horizontal Implementation》Exhibitions to present intra-department
Kaizen efforts and promote their horizontal implementation
《Information Provision》Ideas, tips, and insights to develop
energy-saving technologies
《Hands-On Experience》Visual and tactile experiences to
physically feel energy-saving effects
《Energy Visualization》Real-time view of energy consumption at individual production lines and facilities
Active Human Resource Recruiting
Step2 Development of HRSpecialized in Energy Saving
Step3
We created an ideal space of education for members of the
Manufacturing Department based on their own voices.
The Center provides members of the Manufacturing Department withThe Center provides members of the Manufacturing Department withopportunities to learn about energy saving in a nearby place.opportunities to learn about energy saving in a nearby place.
Creation of Space for Joyful Experience
Step1
IEEJ:February 2013 All Right Reserved

Active Human Resource Recruiting
10/189‐2. Development of "Core" Human Resources
7/6展示会写真貼る
■ Energy-Saving Exhibition・ Sponsored by 8 outside manufacturers (May 27)
EnergyEnergy‐‐saving leaders are to play a central role in promoting energysaving leaders are to play a central role in promoting energy‐‐saving activities in saving activities in their workplace.their workplace.
17 5
75
42
30
Approval of theEnergy-Saving Committee
1. Regular Meeting(Monthly)
2. Workshop(Quarterly)
→Introduction of latest technologies & joint study session with other departments
Priority should be given to other works.
Meeting of Energy-Saving Leaders (Organization & Activities)
Eng. Div.
Production
Inspection Production Mgmt.
Q/ASecretariat17 persons (1 person/section)
4 persons (1 person/div.)
1 person 1 person
1 person
1 person
26 persons in total
In-Sourcing Planning
■ Survey Results
I'd like to participate proactively.
I'd like to participate if time allows.
80% or more are interested in energy-saving initiatives.
I need to learn more.
Submitted a proposal to identify and organize human resources who will become a
"core in the field."
There are a lot of applicable items! We can implement them in
our section!
Total:169
respondents
ProcessStep3Step1
Development of HRSpecialized in Energy SavingCreation of Space for Joyful Experience
Step2
IEEJ:February 2013 All Right Reserved

11/18
〔My Idea〕 Let people understand Kaizen procedures through practical experience of air leakage repair (HR development)
4. Confirmation of Practical Effects and Maintenance/Control
Joyful experience of joy that comes from seeing data
2. On-site leakage inspectionInspection of all facilities using five senses &
testing devices
Number of Leakage: 51 (1,860NL/min)
9‐3. Development of "Core" Human Resources
1. Knowledge about air leakage (Launch of the Basic Learning Center)
・Amount of leakage andmonetary loss
・Location of leakage・Inspection method ...etc.
To help obtain sufficient knowledge about current
state of air loss
Let's eliminate air leakage first!
2nd Leaders' Meeting
3. Inclusion in the Kaizen Timetable/Schedule
This leak can be fixed by
replacing the packing!
Implement Kaizen
without fail
Confirmation of Kaizen effects using measuring
system
Constant review of air consumption;Correction of defects if any
Process Creation of Space for Joyful Experience Active Human Resource Recruiting
Step1 Step2
【Me】
After launchBefore launch
Repetitive implementation resulted in the rise in energyRepetitive implementation resulted in the rise in energy‐‐saving awareness saving awareness and activation of initiatives.and activation of initiatives.
Results of HR Development
[Evaluation by Leader Meeting Members]
0
1
2
3
4
5積極性
改善力
抽出力連帯感
根気度
Willingness
Persever-ance
Ability to Improve
Ability to IdentifySense of Unity
Development of HRSpecialized in Energy Saving
Step3
IEEJ:February 2013 All Right Reserved

■ Investigation of Actual Air Blow Operation within Department
Blow Method Image Number of Locations
Air Consumption(units)
0 50 100 150 200
Connected to the Standby
Switch
Standby ON
Standby OFF 3633
Intermittent Air Blowing
Start of Work
End of Work0.5S 11612
Small air consumption; ideal for air-
saving
Not wide-spread
Pulse (Electric)
Start of Work
End of Work
0.1S 0.1S.64
(1,000 m3/year)
Connected to Master Valve
Valve Open Valve Shut
Left to blow
0 10 20 30 40 50Dispensing
Shutoff741
Operation Time:8 hrs
Develop a lowDevelop a low‐‐cost, easycost, easy‐‐toto‐‐attach pulse blow device.attach pulse blow device.
Controlling SequencerElectromagnetic Valve
1. High initial cost
2. Long time required for control/installation; difficult to fabricate
■ Reasons impeding the spread of (electric) pulse blow
12/18
(Cost to design electric hard/soft circuits; cost to purchase electric parts)
(Wiring on the control board, work to establish connection to the facilities, adjustments)
10‐1. Case 2 Development of New Air Blowing Devices– Company's First Pulsed‐Air Blower
per location
Locations at which production is
prioritized: 159
Intermittent and repetitive blows for maximum effect of impingement pressure
Is there any easier way to spread the
use?
IEEJ:February 2013 All Right Reserved

[Supervisor]
10‐2. Development of Low‐Cost & Easy‐to‐Attach Pulse Blow Device
<Investigation on Company K's Air-Pulse Generator>
■ Proposal to the Manufacturer
13/18■ Joint Review Meeting with Technology Departments
[Production Technology]
[Production Promotion]
[Production Engineering]
[Machineries]
《Prior Comparison with Conventional Method》
The development was launched as the air-based system was determined to be superior in all aspects.
Fabricate an air pulse blowing device and carry out a test.Fabricate an air pulse blowing device and carry out a test.
0.7 year2.1 yearsPayback Period
¥61,000¥190,000Total Cost
¥800/year¥100/yearRunning Cost
4H16HConstructionTime
¥40,000¥70,000Parts Cost
Not required¥20,000Design CostInitial Cost
EasyDifficultKaizen Difficulty Level
Current (Electric)Item
Threshold function
The challenge is how to achieve smooth pulse operation and sufficient dispensing volume!
AND FunctionOR Function
This function will enable us to shift to the pulse blow system!
Evaluate the feasibility and costs!
(Electricity) (Cost of controlling air)
(¥20,000)(¥100,000)
There is a device that generates pulses using compressed air only to
avoid explosion!
The product will be reliable because Company K has air pump technologies.
Can we find any examples in our in-house energy-saving
report?We want to develop a pulse blow device by
combining with existing mechanical valves.
Mechanical valve Threshold
・Threshold function is to switch on and off signals using air pressure differences.
・There are approx. 40 types of air sequence valves.
Combine
Developed (Air)
Air Sequence Device<Results>
IEEJ:February 2013 All Right Reserved

14/18
The devise must be improved so that it can be controlled only wiThe devise must be improved so that it can be controlled only with the valve and th the valve and the air circuit.the air circuit.
10‐3. Pulse Operation Test
<Result>Well worked (repetitive & smooth operation)
Pressure failure
3. The spool moves.
&
<Air Circuit>
Pulse Generator
Signal air
We made a wrong choice of
valves!
Pressure rises
■ Operation Check Using a Test Device
Valve<Operation Flow>
Filler plug
*The device repeats the process from step 1 through step 7 until the signal air stops.
B
AP
1. Signal air pressure istransmitted.
12
2. The pressure within thegenerator rises.
4/
5. The pressure within thegenerator drops.
Spool
Pulse Generator
4. The blow starts.
5/
6. The spool moves.
7. The blow stops.
7 Pulse Generator
Signal Air
But
This is no energy saving.
The blow does not stop when the signal air pressure drops.
The air is blowing
unstopped
We need to develop a function that stops the spool at one side.
B
AP
B
AP
3
6
IEEJ:February 2013 All Right Reserved

■ Apply the principle of unilateral electromagnetic solenoid valves.
15/18
1. The pulse width can bechanged arbitrarily. (0.1 sec. – 15 sec.)
OffBlow On
OffOn
Pulse blow
Signal air pressure
Pulse-width adjusting
screw
Inlet air pressure
2. Dispensing VolumeAdjustable up to 1,500NL/min.
Let's examine the energyLet's examine the energy‐‐saving effect using a real device.saving effect using a real device.
10‐4. Improvement of Device & Operation Test
Completed pulsed-air blowerA spring is installed in the valve
so that the spool always returns to the blow-off side.
Signal air pressure
Pulse Generator
Spring
<Pulse Generator Improvement Plan>
B
A
P
IEEJ:February 2013 All Right Reserved

10‐5. Examination of Energy‐Saving Effects Using Actual Device
Improved productivity in the visual inspection process
■ Evaluation Test
《Aim of Blow》
<Selection of Processfor Installation>
1. Time allowance to perform the test2. Significant air consumption
Removal of cutting water & swarf from the
end section
Removal of cutting water & swarf from the Ф20 hole
<Before Improvement>Connected to thestandby switch
Once the switch is turned on, the air continues to blow.
We successfully developed a lowWe successfully developed a low‐‐cost, easycost, easy‐‐toto‐‐attach pulse blow device.attach pulse blow device.
■ Confirmation of Effects
2. Quality Check
1.2t-CO2/year (Oil Equivalent: 1.12Kl/year)(Effect of installation in the Dept.: 90.2t-CO2/year
[Oil Equivalent: 84Kl/year])
The pulse wave was shaped as intended.
1. Pulse status ... Measurement of flow waveform
The result was also satisfactory in terms of quality.
Blow
*Measured with an airpower meter.Flow (L)
Time (t)
Hydraulic pressure cutting line (Before the completion inspection)
16/18
0.30.2Level of Cleanliness
AfterBefore
Spec:Max. particle size 0.5mm
(Workability) GoodGoodInspector's Visibility
Blow Shut-off
Blow:0.2 sec. Shut-off:0.2 sec.
3. Reduction in CO2 Emission
Installed device
The blow work requires minimum air.
<After Improvement>Pulsed Air Blow
Shut-off
IEEJ:February 2013 All Right Reserved
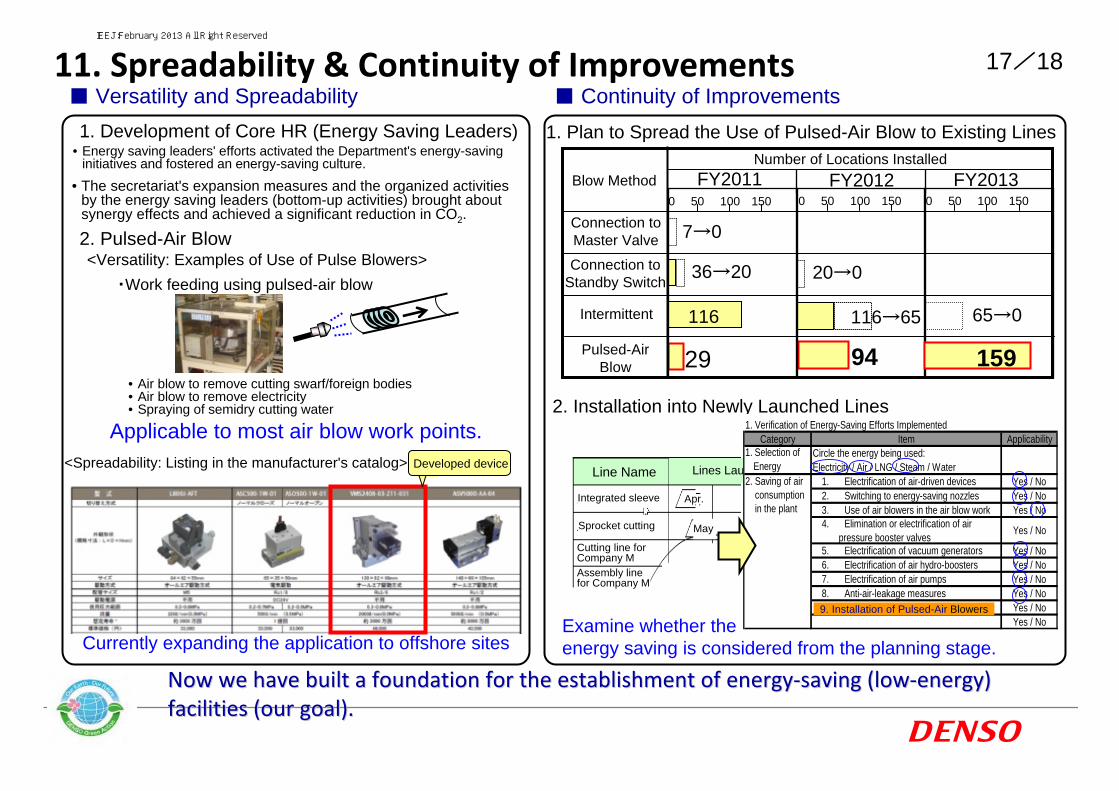
11. Spreadability & Continuity of Improvements
• Air blow to remove cutting swarf/foreign bodies• Air blow to remove electricity• Spraying of semidry cutting water
17/18■ Continuity of Improvements■ Versatility and Spreadability
・Work feeding using pulsed-air blow
Pulsed-Air Blow
Blow Method
Connection to Standby Switch
Intermittent
Connection to Master Valve
94
7→0
FY2011
116
36→20
0 50 100 150 0 50 100 150FY2012 FY2013
20→0
65→0
29 159
Number of Locations Installed
Now we have built a foundation for the establishment of energyNow we have built a foundation for the establishment of energy‐‐saving (lowsaving (low‐‐energy) energy) facilities (our goal).facilities (our goal).
Examine whether theenergy saving is considered from the planning stage.
1. Development of Core HR (Energy Saving Leaders) 1. Plan to Spread the Use of Pulsed-Air Blow to Existing Lines
2. Installation into Newly Launched Lines
<Versatility: Examples of Use of Pulse Blowers>2. Pulsed-Air Blow
<Spreadability: Listing in the manufacturer's catalog>
Applicable to most air blow work points.
Currently expanding the application to offshore sites
• Energy saving leaders' efforts activated the Department's energy-saving initiatives and fostered an energy-saving culture.
• The secretariat's expansion measures and the organized activities by the energy saving leaders (bottom-up activities) brought about synergy effects and achieved a significant reduction in CO2.
116→65
0 50 100 150
Integrated sleeve
Assembly line for Company M
Cutting line for Company M
Sprocket cutting
Line Name
Apr.
May
Lines Launched in FY2011Developed device
1. Verification of Energy-Saving Efforts ImplementedCategory Item Applicability
Circle the energy being used:Electricity / Air / LNG / Steam / Water
1. Electrification of air-driven devices Yes / No2. Switching to energy-saving nozzles Yes / No3. Use of air blowers in the air blow work Yes / No4. Elimination or electrification of air pressure booster valves Yes / No
5. Electrification of vacuum generators Yes / No6. Electrification of air hydro-boosters Yes / No7. Electrification of air pumps Yes / No8. Anti-air-leakage measures Yes / No
Yes / NoYes / No
1. Selection of Energy2. Saving of air consumption in the plant
9. Installation of Pulsed-Air Blowers
IEEJ:February 2013 All Right Reserved

12. Summary of Energy‐Saving Effects 18/18■ CO2 Reduction within the Department
The department's stretch goal was also achieved!
Mon
thly
Red
uctio
n (t-
CO
2)
Stretch Goal: 1,065t-CO2 or more
Actual Reduction: 1,286t-CO2Revised upward to: 1,150t-CO2
Company's mandatory goal: 710t-CO2 or more
Reduced 58t-CO2 (1.5 times the previous year)
■ Effects of Core Human Resource Development
The unit consumption improved through the air-saving efforts centered on the introduction of pulsed-air blow system.
FY2011 Result: 1.01
FY2010 Result: 1.03
Impact of production loss due to the Earthquake
Apr. May Jun. Jul. Aug. Sep. Oct. Nov. Dec. Jan. Feb. Mar.
■ Actual Unit Air Consumption■ Effects of the Introduction of Pulsed-Air Blow Function
The function was introduced to 23 locations and reduced 25t-CO2 during FY2011.
Num
ber o
f Im
prov
ed
Loca
tions
(uni
ts)
50
150
100
FY2011 FY2012 FY2013
200
[Oil Equivalent: 23.3kl/year]
[Oil Equivalent: 1,060kl/year]<Reduction Effects Achieved through Improved Management
0
(71)
(65)
Figures in the brackets indicate the number of points improved during the year.
159
94
23
-25.2t-CO2
-58.2t-CO2
-90.2t-CO2
For further effects, we will implement electricity reduction efforts by leveraging the momentum created through the current energy‐saving initiatives.
Uni
t Air
Con
sum
ptio
n(t-
CO
2/¥10
0M)
Jul. Aug. Sep. Oct. Nov. Dec. Jan. Feb. Mar.Installation of booth
Exhibition Leaders' Meeting
Result for FY2010
Accumulated Reduction
(t-CO2)
Plan/monthResults/monthPlan/AreaResults/Area
IEEJ:February 2013 All Right Reserved
Contact: [email protected] The back issues are available at the following URL http://eneken.ieej.or.jp/en/whatsnew/JPOIEL.html


