
Copy 8 4 of 250 copies
IDA PAPER P-1733
q.m
N OPERATING COSTS OF AIRCRAFTAND FLIGHT SIMULATORS
* 4: Jesse OrlanskyMark I. KnappJoseph String
March 1984
Prepared for* Office of the Under Secretary of Defense for Research and Engineering
AO 101984
p 1 INSTITUTE FOR DEFENSE ANALYSES
* 84 08 08 083 IDA Log No. HO 83-25682

- . - -.-p.
The work reported in this document was conducted under contractMDA 903 84 C 0031 for the Department of Defense. The publicationof this IDA Paper does not indicate endorsement by the Departmentof Defense, nor should the contents be construed as reflecting theofficial position of that agency.
• "-.' I Approved for public release, distribution unlimited.
[ This paper has been reviewed by IDA to assure that it meets highstandards of thoroughness, objectivity, cnd sound analyticalmethodology and that the coiiclusions stem from the methodology.IDA does not, however, necessarily endorse the conclusions orrecommendations that it may contain.
.1i~i
7-.%
.3-
,-,.,'

UNCLASSIFIEDSECURITY CLASSIFICATION OF THIS PAE (*ban Dat Ent
REPORT DOCUMENTATION PAGE READ INSTRUCTIONSB3EFORE COMPLETIG FORM. PORT UMGER 2. GOVT ACCESSION NO. 3. RCIqlPINT'S CATALOG NUMIER
* 4. TITLE S. TYPE Of REPORT A PERIOO COVEREOOperating Costs of Aircraft and FlightSimulatorsFia Feb. 1983 - March 1984
S. PERFORMING ONG. REPORT NUMBER
IDA Paper P-17337. AUTHOR(o) S. CONTRACT OR GRANT NUMBER(o)
o Jesse Orlanskymark i. Knapp MDA 903-84-C-0031Joseph String. PERFORMING ORGANIZATION NAME ANO ADDRESS 10 PROGRAM ELEMENT. PROJECT. TASK
Institute for Defense Analyses AREA a WORK UNIT NUMBeRS
1801 N. Beauregard St. Task T-3-175-" • Alexandria, VA 22311
I1. CONTROLLING OFFICE NAME ANO AOORESS 12. REPORT OATSMilitary Assistant for Training and Personnel March 1984Technology, DUSD (R&AT), OJSDRE Is. NUMBER OF PAGES
2814. MONITORING A0G[NCY NAME & AOORlSS('f dffemet frm Contolling Off(co) IS. SECURITY CLASS. (of this rport)
Do-IDA Management Office Unclassified1801 N. Beauregard St.Alexandria, VA 22311 a. OECASIFICATlONIOOWNORAOING
SCHEULE N/AIS. DISTRIBUTION STATEMENT (o tho Rewt)
Approved for public release, distribution unlimited.
" 17, OISTRIBUTION STATEMENT (of the abstract ented In Slock 20, If dlfferet lro Ropoa)
* None
I. SUPPLEMENTARY NOTES
*" N/A4-
IS. KEY wORDS (Contine an reverse old* if necessary and Identify by black rnmmbo)Operating costs, Military aircraft operating costs, Flight simulator operatingcosts, Military flight training costs, Training cost-effectiveness, Flighttraining cost trends
20. ABSTRACT (Cantlaue an roan.s do It necesar an Idonti by block anmhov)This paper presents data and analyses of the operating costs of flight
simulators and aircraft used in military training. The results should beuseful in cost-effectiveness analyses of ongoing flight training programs.The effectiveness of flight simulators for training, however, is not
.i addressed in this paper; hence, the findings of this study alone do notprovide the basis for judgnnts or decisions that require both cost andeffectiveness data. - (Cont.)
DO IJ 5AM 7 1473 EDITION OFNOV 65 IS OBSOLETE UNCLASSIFIED-1 SECURITY CLASSIFICATION OF THIS PAGE (WN" Data Entered)

UNCLASSIFIED" bqj
~~sgcuCLII* "ASII|CATION oiv TIS PA@Ufllml fbi l.d~
20. (Continued)
1. The average variable operating costs of 39 simulators in use in theFY 1980-1981 time period fall within a narrow range ($116 to $170 peroperating-hour). despite the di/ersity of simulator types and associated
aircraft missions (e.g., baber, fighter, cargo), and aircraft sizes ortypes (i.e., fixed-wing or rotary-wing).
2. The simlator-to-aircraft operating cost ratios were about the same..n the FY 1975-1976 and FY 1980-1981 time periods (27 and 39 combinations,respectively); the median value was 8 percent.
3. No relationship was found between the type of simulators, ascategorized by the Services (e.g., Part Task Trainer, Cockpit ProceduresTrainer, Weapon Systems Trainer) and its operating costs.
4. Data pertaining to a heterogeneous group of 15 Air Force simulator/
fixed-wing aircraft that were operational in both the FY 1976-1977 andFY 1980-1981 time periods indicate that:a. Both aircraft and simulator operating costs approximately
doubled, so that average and median simulator-to-aircraftvariable operating cost ratios were similar in both timeperiods.
b. The entire increase in average aircraft operating costs isconsistent with the rate of econrmic inflation, while onlyabout 40 percent of the increase in average simulatoroperating costs can be attributed to inflation. Datalimitations precluded explanation of the remainder of thegrowth in simulator operating costs.
c. Siimlator utilization by the Air Force was about 30 percentlower in FY 1980-1981 than in FY 1976-1977.
UNCLASSIFIEDSECUNITY CLASSIFICATION OF TIS PAGEI(WO Data Entered)

F.,
IDA PAPER P-1733
OPERATING COSTS OF AIRCRAFTAND FLIGHT SIMULATORS
Jesse OrlanskyMark I. KnappJoseph String*March 1984
Acceis~1iOTI f
NTT"' '~
0T
I DA
INSTITUTE FOR DEFENSE ANALYSES1801 N. Beauregard StreetAlexandria, Virginia 22311
Contract MDA 903 84 C 0031Task T-3-175

0CONTENTS
Foreword . . . . . . . . . . . . . . . . . . . . . . . . . v
Summary . . . . . . . . . . . . . . . . . . . . . . . . . vi
0 Abbreviations . . . . . . . . . . . . . . . . . . . . . .viii
A. PURPOSE . . . . . . . . . . . . . . . . . . . . . . . 1
B. BACKGROUND . . . . . . . . . . . . . . . . . . . . . . 1
_ C. OPERATING COSTS IN FY 18-18 . .. .. .. .. . .. 2
. Aircraft and Simulators in the Data Base .. . .. 2
2. Cost Methodclogy . . . . . . . . . . . . . . . . . 3
3. Aircraft and Simulator Operating Costs . .. . .. 7
40a Aircraft . . . . . . . . . . . . . . . . . . . 7
b. Simulators . . . . . . .. . . . . . . . . . . 9
c. Results and Analysis (FY 1980-1981) . .. . .. II
D. COMPARISONS OF OPERATING COST DATA: FY 198o-1981
0 ~VERSUS FY 1975-1976 and FY 1976-1977 .. .. .. . .. 14
. FY 198-1981 and FY 1975-1976 . .. .. .. . .. 14
"2. FY 198-1981 and FY 1976-1977 . • 16
Irv E. SUMMARY OF FINDINGS .. .. .. .. .. .. .. . .. 18
"R e f e r e n c e s . . . . . . . . . .. . . . . . . . . ... 2 0
I..
°' TABLES
1 Cost Elempents Used to Compute Variable Operating Cost
Per Hour of Aircraft and Simulators (FY 1980-1981) 4
. 2 Variable Operating Costs Per Hour of Aircraft and
Simulators (FY 1980 and 1981) .. .. .. .. .. . .. 8
3 Variable Operating Costs of Aircraft Simulators(FY 1980 and FY 1981) . . . . . . . . . . . . . . . .. 14
ItI

Tables (cont'd)
4~ Comparison of Military Simulator-to-Aircraft VariableOperating Cost Ratios (FY 1975-1976 and FY 1980-1981) . 15
5 Comparison of Simulator Utilization, Variable Costs,and Cost Ratios for 15 Air Force Fixed-W-ngAircraft (FY 1976-1977 and FY 1980-1981) ........... ... 17
FIGURES
1 Variable Operating Costs Per Hour for 39 FlightSimulators and Aircraft, FY 1980 and FY 1981 ......... .. 12
iv

9•
*0 FOREWORD
- bThis study was performed for the Office of the Deputy
Under Secretary of Defense Research and Engineering (Research
and Advanced Technology) under Tne technical cognizance of the
Military Assistant for Training and Personnel Technology. The
technical officer is Captain Paul R. Chatelier, USN. This
paper is one of a series concerned with the effectiveness and
cost of' military training.
The cost data reported in this paper were collected by
Joseph String when he was a merber of the Institute for Defense
* Analyses. Joseph String is i.w employed by Rockwell Inter-
national.
We acknowledg;e, with appreciation, the cooperation of
personnel of the Army, Navy, and Air Force who provided the
O basic data. We are also indebted to the following people,
who reviewed early drafts and offered constructive comments
• that resulted in the improvement of this paper:
Alfred F. Smode, Training Analysis and Evaluation Group
Department of the Navy
Robert R. Swab, Aeronautical Systems Division (AFSC),
Department of the Air Force
Milton E. Wood, Air Force Human Resources Laboratory (AFSC),
Department of the Air Force
Norman J. Asher, Institute for Defense Analyses
Kelsey M. Olver, Institute for Defense Analyses
v
leV
'4

I.'% IL
SUMMARY
This paper presents data and analyses of the operating
costs of flight simulators and aircraft used in military
* training. The results should be useful in cost-effectiveness
analyses of ongoing flight training programs and of the
operating and support phases of new flight training programs.
The effectiveness of flight simulators for training, however,
0 is not addressed in this paper; hence, the findings of this
study alone, as summarized below, do not provide the basis for
judgments or decisions that require the results of both cost
and effectiveness analyses.
* 1. The average variable operating costs of 39 simulators
in operation in the FY 1980-1981 time period fall within a
narrow range ($116 to $170 per operating-hour), despite the
diversity of simulator types and associated aircraft missions
(e.g., bomber, fighter, cargo), sizes, or types (i.e., fixed-
wing or rotary-wing). (See Section C.3.c.)
2. The simulator-to-aircraft operating cost ratios in
the FY 1975-1976 and FY 1980-1981 time periods (27 and 39
combinations, respectively) are essentially the same. (See
Section D.1.)
3. No relationship was found between the type of simu-
lators, as categorized by the Services (e.g., Part Task Trainer,i.
Cockpit Procedures Trainer, Weapon Systems Trainer) and its
operating costs. (See Section C.3.c.)
4. Data pertaining to a heterogeneous group of 15 Air
Force simulator/fixed-wing aircraft that were operational in
both tne FY 1976-1977 and FY 1980-1981 time periods indicate
that (see Section D.2):vI

* a. Both aircraft and simulator operating costs
approximately doubled, so that average and median simulator-
to-aircraft variable operating cost ratios were similar in
both time periods.
*6 b. The entire increase in average aircraft operating
costs is consistent with the rate of economic inflation, while
only about 40 percent of the increase in average simulator
operating costs can be attributed to inflation. Data limita-
* tions precluded explanation of the remainder of the growth
in simulator operating costs.
c. Simulator utilization by the Air Force was about
30 percent lower in FY 1980-1981 than in FY 1976-1977.
vi
, vii

ABBREVIATIONS
ATC Air Training Command
CPT Cockpit Procedures Trainer
FS Flight Simulator
GFE Government-Furnished Equipment
HQ Headquarters
MAC Military Airlift Command
M/D/S Mission/Design/Series
NCLT Night Carrier Landing Trainer
O&M Operations and Maintenance
OFT Operational Flight Trainer
P&A Pay and Allowances
POL Petroleum, Oil, and Lubricants
PTT Part Task Trainer
SAC Strategic Air Command
TAC Tactical Air Command
VAMOSC Visibility and Management of Operating and SupportCosts
W.ST Weapon Systems Tne
vviii
Vil

OPERATING COSTS OF MILITARY AIRCRAFT AND FLIGHT SIMULATORS
A. PURPOSE
The purpose of this paper is to provide and analyze recent
data on the costs of operating military aircraft and flight
simulators. This information is needed to evaluate the cost-
effectiveness of current flight training programs, and should
be useful in estimating the cost-effectiveness of future flight
training programs.
This paper, however, does not consider the effectiveness
of flight simulators for military training; therefore, the find-
ings of this study, alone, do not provide a sufficient basis
for any judgment or decision that requires the results of a
cost-effectiveness analysis. A relevant example is the estab-
lishment of the optimum combination of aircraft flying time and
simulator time in flight training.
B. BACKGROUND
Flight simulators are used widely for purposes of train-
ing and evaluation, both in civil and military flying. Limited
at one time lnrgely to undergraduate flight training, their
* use extends now to advanced training for high performance
operational aircraft, combat engagement, use of weapon systems,
and aerial refueling. The well-known reasons for their use
include lower operating costs; safety; independence of weather,
air traffic, and geography; and their excellent amenability to
performance measurement.
It is obvious that flight simulators cost less to operate
than do aircraft. Nevertheless, it is still important to know
the magnitude of that difference, that is, the precise ratio

of simulator-to-aircraft operating costs. For extant flight
training programs the optimum combinations of simulators and
aircraft can be determined by comparing chelr operating cost
ratios to their relative effectiveness (i.e., the transfer
* effectiveness ratio).
According to data presented in an earlier study, the use
of flight simulators can reduce the amount of flight time
needed to establish a specified level of proficiency on a wide
* variety of flying tasks (Orlansky and String, 1977). The
amount of flight time saved was estimated as about half the
amount of time spent on that task in a flight simulator.
Although the same study found that the median cost ratio of
* 33 simulator/aircraft combinations was 12 percent in FY 1975-
1976, that value represents a mix of military and commercial
airline equipment. The data for the military equipment, only,
indicate a simulator-to-aircraft operating cost ratio of eight
* percent.
This paper (a) presents data and analysis for the FY 1980-
1981 time period that are comparable to that of the FY 1975-
1976 era reported in the earlier study, (b) discusses differ-
ences and similarities in operating costs between the two time
periods and, (c) compares and evaluates operating costs of 15
Air Force simulator/fixed-wing aircraft combinations that were
in inventory in both the FY 1976-1977 and FY 1980-1981 periods.
C. OPERATING COSTS IN FY 1980-1981
1. Aircraft and Simulators in the Data Base
cr The data base developed for this paper comprises 39 mili-
tary aircraft/sinulator combinations for which cost data were
available for the FY 1980-1981 time period.'
'Cost data for the FY 1980-1981, FY 1975-1976, and FY 1976-1977 eras arecompared in Section D below. The development of the data base for theFY 1975-1976 period is discussed in Orlansky and String, 1977.
2(&

1. 1.7 ., M. TV q T
The 3 4 aircraft in the sample cover the full spectrum of
military missions; fighter, attack, cargo, bomber, reconnaissance,
utility, patrol, and electronic warfare. Eight rotary-wing
and 26 fixed-wing aircraft are included.
It is recognized that the characteristics of simulators
vary widely, primarily as a result of the type of training for
which a simulator is designed, the characteristics of the air-
craft it is intended to simulate, and the technology available
at the time of its development. It follows that a number of
simulators designed to perform the same type of training task
may exhibit disparate degrees of complexity and markedly differ-
ent investment and operating costs. For the purpose of this
paper, however, we used the categories assigned by the Services,
as follows:
Cockpit procedures trainer CPT
Part task trainer PTT
* Operational flight trainer OFT
Flight simulator FS
Night carrier landing trainer NCLT
Weapon systems trainer WST
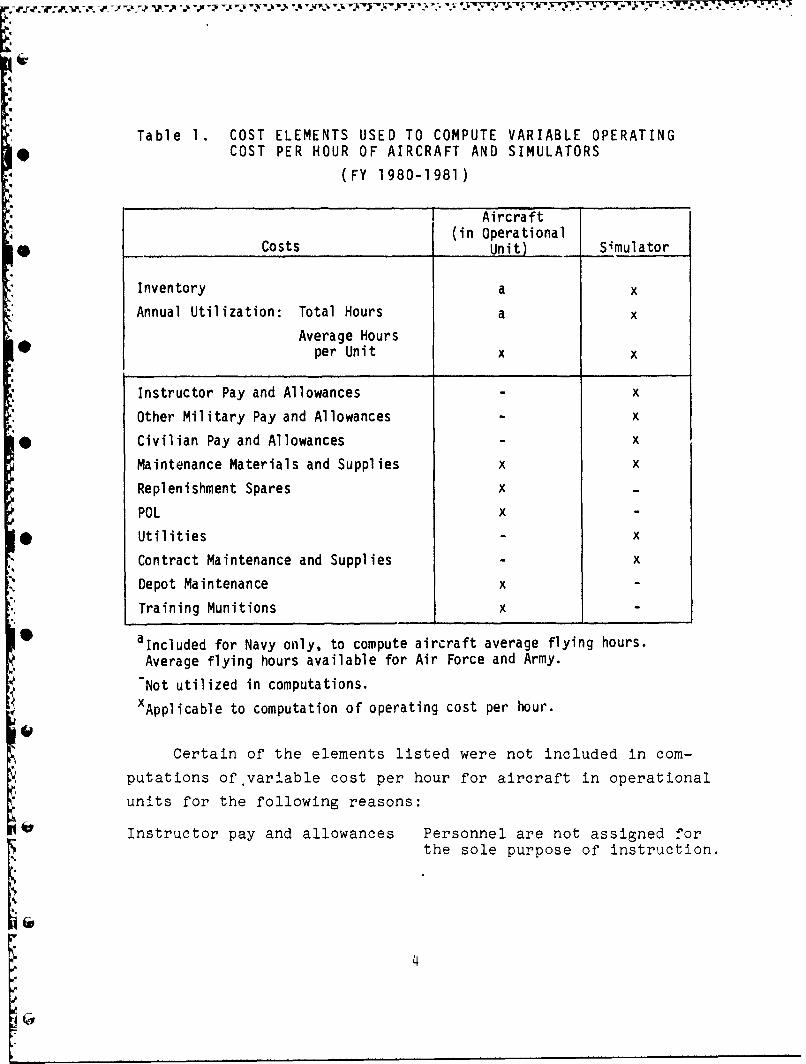
2. Cost Methodology
Variable operating costs are costs that vary as a function
of the amount of usage of equipment, i.e., they exclude operating
60 costs that are independent of rate of usage. The complete list
of cost elements, shown in Table 1, was used to compile the variable
operating costs of aircraft and simulators treated in this
study.'
'The high costs associated with peacetime attrition of aircraft and air-cre',s that could ce avoided by substituting simulator time for flyingtime can be considered a valid element for comparison. They were omittedin this paper, however, so as not to bias results heavily in favor ofsimulator utilization.
3
. . ... r'. v- - -. yW o . .yW
V
Table 1. COST ELEMENTS USED TO COMPUTE VARIABLE OPERATING
* COST PER HOUR OF AIRCRAFT AND SIMULATORS
(FY 1980-1981)
AircraftCosts (in OperationalCosts Unit) Simulator
Inventory a x
Annual Utilization: Total Hours a x
Average Hoursper Unit x x
Instructor Pay and Allowances x
Other Military Pay and Allowances x
* Civilian Pay and Allowances x
Maintenance Materials and Supplies x x
Replenishment Spares x
POL x
* Utilities x
Contract Maintenance and Supplies x
Depot Maintenance x
Training Munitions x
*0 alncluded for Navy only, to compute aircraft average flying hours.
Average flying hours available for Air Force and Army.
Not utilized in computations.X Applicable to computation of operating cost per hour.
Certain of the elements listed were not included in com-
putations of 'variable cost per hour for aircraft in operational
units for the following reasons:
Instructor pay and allowances Personnel are not assigned forE the sole purpose of instruction.
4,.

Other military pay and allow- Operational units are sized forances and combat and contingency potential.
The numbers of personnel assigneddo not vary with peacetime activ-
ity rates. This applies also tobase maintenance labor, which is,
itherefore, omitted.
Utilities Do not vary with flight activity.
Contract maintenance and Aircraft maintenance in opera-supplies tional units usually is done
organically.
Similarly, several cost elements were excluded from calcu-
lations of simulator cost per operating-hour:
Petroleum, oil, and Not utilized in training device* lubricants (POL) operations.
Replenishment spares Usually not explicitly identi-fied in available data; may beincluded under Contract Mainte-nance and Supplies.
Depot maintenance Usually included in the reporteddepot maintenance cost of theassociated aircraft, so is notidentifiable.
Training munitions None are expended in flightsimulator operations.
The cost elements that were used to compute variable
operating cost per aircraft flying-hour and per simulator
operating-hour' are defined and reported in this paper, as
follows:
EAircraft cost per flying-hour, aircraft cost per operating-hour, and simu-lator cost per operating-hour are considered comparable in this paper.While aircraft operating-hours exceed actual flying hours by some z iallincrement (e.g., for maintenance ground testing), routine reports generatedby the Services rarely discriminate between the two. Similarly, it isprobable that actual simulator operating-hours exceed the values reportedas training utilization by some amount.
5

Maintenance Materials and Supplies: Relatively low-
unit-cost materials and supplies stocked at base level.
Replenishment Spares: Relatively high-unit-cost
replacement parts and subsystems. Excludes War Readiness
Material.
Petroleum, Oil, and Lubricants (POL): Fuel consumed
per flying-hour. Excludes consumption of oil and lubricants,
the costs of which are trivial in this context.
Depot Maintenance: Includes organic civilian labor,
materials and overhead, contractor maintenance and Government-
Furnished Equipment (GFE) to contractor. Includes only those
costs that vary with flying-hour activity level (i.e., excludes
fixed depot costs).
Training Munitions: Cost of annual authorization per
aircrew, reduced to cost per flying-hour.
Instructor Pay and Allowances (P&A): Taken as $30
for Air Force SAC and MAC simulators, and $28 for Air Force TAC,
*Army, and Navy simulators; more than one instructor is required
for some devices. These values were determined by dividing
the average annual P&A of an 0-3 (Army/Marine/Air Force captain
and Navy lieutenant) by 1,000 direct instructional (i.e., direct
student contact) hours per year. Although military personnel
of various grades act as instructors, we chose to use a common
grade (0-3) for comparability among all Services.
It was not always possible to identify all of the cost
elements in Table 1 for all aircraft-simulator combinations
because some of the data available to us were either incompleteor provided aggregate totals. Furthermore, peculiarities of
the various sources of data required different methods of data
reduction to approximate comparability of operating costs per
hour. These are discussed in the next section, where aircraftand simulator operating costs fc4" FY 1980-1981 are presented.
6

3. Aircraft and Simulator Operating Costs
Table 2 presents the variable operating costs per hour of
39 military aircraft/simulator pairs for which cost data were
available for the FY 1980-1981 time period. Derivation of the
* entries, by Service, are discussed in the following paragraphs.
a. Aircraft
(1) Air Force Aircraft
* Excepting Training Munitions, the operating costs of
Strategic Air Command (SAC) aircraft' in Table 2 were taken
from Table 2-2 of [1].2 Training Munitions costs were com-
puted from values in Tables 2-5 and 4-4 in [1]. The costs of
of SAC aircraft are expressed in FY 1981 dollars.
With the exception of Training Munitions, the costs of
most of the Tactical Air Command (TAC) aircraft 3 in Table 2
were determined from Table 13 of [2]. Those costs are given
* as FY 1981 dollars, but were deflated to FY 1980 dollars for
Table 2. Training Munitions costs were computed with reference
to Tables 7 and 32 of [2].
Costs of Military Airlift Command (MAC) aircraft4 were
extracted from Table 2-2 of [], and are expressed in FY 1981
dollars in Table 2. Training Munitions, included in the costs
of the CH-3 and H-53, were computed from values in Tables 2-5
and 4-4 in [1].
(2) Navy Aircraft
; The variable flying-hour costs of all Navy aircraft
66 were derived from VAMOSC-Air TSS reports [3] for FY 1979.
r B-52D/G/H, KC-135A, and FB-LII.2Numbers in brackets (C ]) are keyed to the list of References for Cost
Data at the end of this paper.
3E-3A, F-4D/E, F-15, F-liA/D, and RF-4C.
'C-130E, C-141A, WC-135B, CH-3, H-53, and C-5A.
Ii; 7

Table 2. VARIABLE OPERATING COSTS PER HOUR OF AIRCRAFT
AND SIMULATORS
(FY 1980 and 1981)
Cost per FlyingHour in Opera-
* Class (Type) of tional Units Simulator Simulator-Simulator and (Excluding Cost to-Aircraft
Service Aircraft Simulator Attrition) Per Hour Cost Ratio
CPT/PTT
Army UH-IH 2C35 211 37 0.17
• Navy E-2C 2C2OA 1073 320 0.30F-4J 2C17 2250 133 0.06P-3A/B 2C45 1318 139 0.10SH-3H 2C44 716 266 0.37
Air Force B-52D M4B41 6420 185 0.03B-52G Ti 6367 133 0.02B-52H T25 5671 151 0.03KC-135A M826 3242 117 0.04T-38 T26A 1098 87 0.08C-130E T19 1419 89 0.06
OFT/FS/NCLT
Army UH-1H 2824 211 58 0.27CH-47 2B31 1013 231 0.?3AH-1 2633 545 322 0.59
Navy A-7E 2F103 1229 119 0.10F-14A 2F95 2885 87 0.03
Air Force FB-111 T36 4470 214 0.05A-7D T33 1917 129 0.07E-3A -- 5489 122 0.02F-40 T3 2660 234 0.09
* F-4E T9 2710 185 0.07F-15 T49 3518 111 0.03F-111A T31 4080 150 0.04F-11ID T35 4150 177 0.04RF-4C T2 2104 195 0.09C-141A T24 2872 120 0.04WC-135B T23 2841 211 0.07CH-3 T42 628 116 0.18H-53 T43 1159 122 0.10
WST
Navy A-6E 2 F114 lP76 159 0.08A-7E 2F84B 1229 93 0.08A-7E 2F 11 1229 71 0.06F-4J 2F88 2250 97 0.04P-3A/B 2F69D 1318 160 0.12P-3C 2F87 1286 119 0.09
(F/T)F S-3A 2F92A 1452 254 0.17SH-2F 2F106 722 112 0.16SH-3D 2F64B 1039 120 0.12
Air Force C-5A T37 6123 124 0.02
,mI,

+ O They are expressed in FY 1980 dollars in Table 2. Line items
were selected from [3] to compute values for the five elements! " of total variable operating cost per hour in operational units
shown in Table 2, as follows:
O Computation from VAMOSC
Cost Element Report Line Items
Maintenance Materials and (Organizational + Intermediate
Supplies Maintenance Supplies) +2 FlyingHours, Regular
SReplenishment Spares Recurring Investment, Replace-
ment Repairables * TotalFlying Hours
POL Organizational POL Costs +Fly-Ing Hours, Regular
10Depot Maintenance (Subtotal Depot Support - Sub-~total Aircraft Rework) + Total
Flying Hours
. Training Munitions Organizational T~rain~ing Exp~end-
(3) Army Aircraft
."., Depot Maintenance costs came from [4] and/or [5] ;
..4
hyTraining Munitions cost (included in AH-1 cos only) wasSC toobtained from [6].
Cosb. Simulators
" (i)1 Air Force SimulatorsMainenanPertinent data on flight simulators were acquired
from the Air Force operational commands. Of the 290 devices
"in the Air Force inventory [7, the sample analyzed accounts
for 91 of 116 devices held by SAC, TAC, and MAC.
Cost data and hours utilized for simulators associated
with TAC aircraft were obtained from Headquarters, TAC [8].
The data covered 28 of the 43 simulators listed in the TACworldwide inventory E71. Enlisted and civilian personnel costs,
utility costs, and "Other Operations and Maintenance (O&M) costs
9

were furnished, and instructor costs were computed from the
instructional crew sizes given by TAC. Costs were then
?educed to a per-operating-hour value and expressed in Table 2
in FY 1980 dollars.
Data acquired for 39 of 45 active SAC simulators were
limited to location, utilization rates, and enlisted personnel
authorizations [9]. "Irstructor P&A" was computed assuming
one instructor per simulator. "Other Military Pay and Allow-
ances" was then computed for an average personnel grade of
E-5. The sum of the applicable elements other than labor
(in Table 1) were computed via ratios of non-labor to labor
costs (based on TAC data) for each of the remaining simulators
* in the sample. SAC simulator costs per operating-hour are
expressed in Table 2 in FY 1981 dollars.
Complete cost and operating-hour data were furnished
by Hq, MAC [10, 11] for all currently active simulators in the
* MAC inventory. The element "Contract Maintenance and Supplies"
(in Table 1) reportedly does not apply, and MAC explicitly
stated that the costs of "Depot Maintenance" and "Replenishment
Spares" were not provided because they were inextricably embedded
0 in total M/D/S aircraft system costs. We used our standard
method to compute Instructor P&A cost rather than the informa-
tion provided by MAC. MAC simulator costs in Table 2 are
expressed in FY 1981 dollars.
(2) Navy S~mulators
Each Navy simulator cost shown in Table 2 is the sum
of (a) cost data provided in [121 reduced to a per-operating-
hour value and (b) Instructor P&A cost (constant $28 per hour),
assuming one instructor-hour per simulator operating-hour.
Costs are expressed in FY 1980 dollars. There are some incon-
sistencies an voids in these source data:
10

7 7 37--
(a) In comparison with the Navy's inventory of 160
flight simulators [13], the sample of 23 for which cost and
operating-hour information was provided in [12] is very small.
(b) Costs are probably understated because data on
software support and replenishment spares were not made avail-
able.
(3) ArmySimulators
Army flight training device data were furnished for
* units at Ft. Rucker [14]. "Other Military Pay and Allowances"
and "Maintenance Materials and Supplies" are not explicitly
addressed since Ft. Rucker relies heavily on contractors for
simulator maintenance labor and replacement parts. As a
*result, "Contract Maintenance and Supplies" costs are con-
siderably higher for Army devices than for comparable Navy
and Air Force simulators.
Each Army flight simulator cost given in Table 2 is
the sum of (a) costs furnished by Ft. Rucker and (b) Instructor
P&A cost (constant $28/hr.), assuming one instructor-hour per
simulator operating-hour.1 Costs are expressed in FY 1980
dollars.
c. Results and Analysis (FY 1980-1981)
The variable operating costs per hour for aircraft in
operational units and simulators, listed in Table 2, are shown
graphically in Figure 1.
'Instructor P&A is not an element of the 2C35 CPT simulator. Its opera-tion does not require instructor participation.
11

*~ 3m
LUU
4. I0
Q Q LL. M
4- C
* 0 co
amok
4.L-
ul
CD 4)00 go
_ _ _~~( _ _ j3m'a.C
golo
'acLa..
~4a**~Js
L ~ _ _ _ _ _ _ _
41 >. V -
04 0 00O 0'Cos
4'-4

Three observations are apparent from Figure 1:
(1) The median ratio of the 39 military simulator-to-aircraft operating costs is eight percent in FY 1980-1981, the same as that found earlier for the FY 1975-1976 period.
(2) The scatter of operating cost data shows no patternrelevant to the way in which simulators are cate-gorized by the Services (e.g., CPT, OFT, WST).
(3) The data points that represent rotary-wing aircraft/simulator operating costs fall within a relativelynarrow band at the bottom of the figure.
These observations prompted a closer look at simulator
operating costs. Table 3 presents the average and median simu-
lator operating costs per hour (from Table 2), arrayed by
simulator group and aircraft type. It reveals a relatively
narrow range of average and median operating costs, despite the
diversity of aircraft missions, sizes, and types (i.e., fighter,
attack, cargo, bomber; fixed-wing and rotary-wing) and simulator
* categories (e.g., CPT/PTT, WST) in the data base. The stratifica-
tion of points that represent rotary-wing aircraft/simulator
pairs is traceable to relatively low costs per flying-hour over
a narrow range,1 while operating costs of the associated simu-
40 lators range almost as widely as those of the fixed-wing air-
craft ($37-$322 versus $71-$320 per hour, respectively). These
data result in relatively high simulator:aircraft operating cost
ratios for rotary-wing aircraft (averages are 0.24 for rotary-
wing versus 0.07 for fixed-wing). Table 3 (and Figure 1) also
suggests that it may not be feasible to develop a mathematical
relationship to estimate simulator operating costs based only
on simulator category and aircraft mission, size, or type.
'With reference to Table 2, the average rotary-wing aircraft cost perflying-hour is $754; the range is $211 to $1,158. The average fixed-wing cost per flying-hour is $3,096; the range is $1,073 to $6,420.
13

Table 3. VARIABLE OPERATING COSTS OF MILITARY AIRCRAFTSIMULATORS
(FY 1980 and FY 1981)
Average FY 1980 - FY 1981 Dollars per HourType of For Fixed- For Rotary-
Simulator Wing Aircraft Wing Aircraft Total
CPT/PTT
Cost 150 152 151
(No.) (9) (2) (11)
OFT/FS/NCLT
Cost 158 170 161
(No.) (13) I (5) (18)
WST
Cost 135 116 131
(No.) (8) (2) (10)
All Types
* Cost 150 154 151
(No.) (30) (9) (39)
Median FY 1980 - FY 1981 Dollars per Hour
! All Types
Cost 133 120 124
(No.) (30) (9) (39)
D. COMPARISONS OF OPERATING COST DATA: FY 1980-1981 VERSUS
FY 1975-1976 AND FY 1976-1977
1. FY 1980-1981 and FY 1975-1976
A direct comparison of military simulator-to-aircraft
operating cost ratios for the FY 1975-1976 and FY 1980-1981
time periods is provided in Table 4. Data for the later era
are contained in Table 2. Data for the FY 1975-1976 period
represent the 27 military aircraft/simulator combinations
E14

Table 4. COMPARISON OF MILITARY SIMULATOR-TO-AIRCRAFT*O VARIABLE OPERATING COST RATIOS
FY 1975-1976 and FY 1980-1981
FY 1975-1976_a FY 1980-1981'
* QNo. of Simulator/Aircraft Combina-tions in Sample
Fixed-Wing 20 30
Rotary-Wing 7 9
Total 27 39
Measures of Central TendencyRange Average Median Range Average Median
Fixed-Wing 0.02-0.40 0.10 0.08 0.02-0.30 0.07 0.06
Rotary-Wing 0.02-0.31 0.16 0.12 0.10-0.59 0.24 0.18
Total 0.02-0.40 0.12 0.08 0.02-0.59 0.11 0.08
aorlansky and String, 1977
bTable 2, this paper.
from a mix of 33 military and commercial airline aircraft/
simulator pairs that constitute the data base in a study
referred to earlier (Orlansky and String, 1977).9
Table 4 presents, for each period, the sample size and
measures of central tendency (range, average, and median) forthe total sample and for the fixed-wing and rotary-wing
Q@ simulator/aircraft pairs in the sample. The simulator/
aircraft combinations that make up the data bases for the
two time periods differ somewhat, but each includes a mix of
military fixed-wing and rotary-wing aircraft of different
siv types (e.g., fighter, attack, cargo, bomber). It is felt,
therefore, that the sample sizes are sufficiently large and
diverse to yield results that are, at least, indicative of
each era.
15

The fixed-wing average and median operating cost ratios
are somewhat lower in the FY 1980-1981 period than in FY 1975-
1976.1 The data show that the average fixed-wing aircraft
operating cost doubled over the five-year interval (consistent
with inflation), while the average operating cost of the
associated simulators increased by about one-third.2 Average
and median rotary-wing operating cost ratios, on the other hand,
increased markedly (by 50 percent) from the earlier to the
later time period. The rotary-wing data show that the increase
* in average simulator operating cost substantially exceeded that
of the average cost per flying-hour. In total, the average
and median simulator:aircraft operating cost ratios show almost
no change from FY 1975-1976 to FY 1980-1981 because the sizable
* increases in rotary-wing ratios offset the modest decreases
in the fixed-wing ratios.
2. FY 1980-1981 and FY 1976-1977
Table 5 permits more precise comparis.ons of simulator
and aircraft operating costs over time than Table 4. FY 1980-
1981 data are compared with FY 1976-1977 c ta using equivalent
subsets of the data bases in Table 4; specifically, 15 Air Force
simulator/aircraft combinations. Cost-element content is
'Training Munitions is an element of aircraft operating cost in the FY 1980-1981 figures (see Table 1), but is not included for the earlier period.This disparity, however, accounts for less than 0.01 of the differencesin the ratios.2 The cost of fuel (POL), which is an element of aircraft operating cost,
but not of simulator operating cost (see Table 1), almost tripled overthis five-year period. Escalation of the remaining elements of operatingcost for both aircraft and simulators averaged about 40 percent [Ref. 1,Table 5.1].3 The 12 percent median operating cost ratio found and reported in Orlanskyand String, 1977, resulted from the inclusion of six commercial airliner/simulator combinations in that data base. All six exhibited relativelyhigh (12 to 23 percent) operating cost ratios.
16

ooLN t A m m I m P% m f r IN r to Nl ; In -r I
S. c In=0 0
00 C
ID
&AI
0tj E 1 m mo .LM t w mC w~ (M . w IN t UN N N
V; o. coON 0 0i
2 in) 0 .-
LA ( CC L.n A.
_j- CZ v- a
*I U.. t
t rn
~17- 05 0
oM co Ch C1
-A C 000 N L oc . n m w 0 PI n 1 04 lL. 0 44 CMN N N ( U- - a
0o W N - N C C N M O 0 t
P-44 LL C 0 r o 4
ui rl I 4J IN - P.Ch 4 q %D - 05 .- 0 04 NM M N t N C0u i a t L)c p I La.. IM'~' a% ta IN to Ni-(A.t Ln M - .
'A. 0L LA. 17% cor
FA- 0 I C
(14 0Or.. %r0 LI -- L I I
=D ~ ' $1 0 0T oO toC%0 tNt o W N. o- I tTINo - 00o " - 'h4J k 0 t N N -e- -i e- NMM IN CM C%4 IT VN - -- i- V LI- L. j A - N- V .1.0LA. to
* 0. C1A 00-i4n0 C-00 q ~ 000 t n I or
L 0- 0 i " t % .(4 (1c i - P - V n o
o Mo col ii a c o L l I A
C- toJ N I-t 0n @3 .-f6V LO :IM- M .- 0 4J0
- ' .- C,;(JI 4,. I 4 5
I- I
4n %D C417cl4

similar for both periods (see Table 1), except for the omission
* of Training Munitions in FY 1976-1977.1 Table 5 shows that:
a. The average and median simulator:aircraft operating
cost ratios remained essentially unchanged over the four-year
interval.
b. The average and median flying-hour costs doubled from
FY 1976-1977 to FY 1980-1981, an increase consistent with the
rate of inflation. The average and median simulator operating
* cost per hour also doubled over the same period, although only
about 40 percent of the increase can be attributed to inflation.
(See footnote 2, page 16). Data limitations preclude explana-
tion of the remainder of the simulator operating cost growth.
c. Average and median simulator utilization decreased byi32 and 28 percent, respectively, from FY 1976-1977 to FY 1980-
1981. We did not explore the reasons for the reduced utilization
* of flight simulators.
E. SUMMARY OF FINDINGS
1. The variable operating costs of 39 simulators in the
0 FY 1980-1981 period fall within a relatively narrow range
($116 to $170 per operating-hour), despite the diversity of
simulator types and associated aircraft missions, sizes, and
types.
2. The average and median simulator-to-aircraft variable
operating cost ratios for the FY 1975-1976 and FY 1980-1981
time periods (27 and 39 combinations, respectively) are essen-
tially the same. Sizable increases in rotary-wing operating
cost ratios were offset by modest decreases in the fixed-wing
ratios.I, 'As explained in a previous footnote, the omission of Training Munitionsaccounts for less than 0.01 of the aggregate differences in simulator:aircraft operating cost ratios.
5. 18

3. No relationship was found between simulator types
(e.g., PTT, CPT, WST) and simulator variable operating costs.
The operating cost of a simulator may be dependent primarily "
upon the training requirements and characteristics of the
aircraft that the simulator is designed to reproduce, the
technology available at the time of its development, and the
level of complexity required to fulfill its function.
4. Data pertaining to a group of 15 Air Force simulator/
fixed-wing aircraft that were in the operational inventory in
FY 1976-1977 and FY 1980-1981 indicate that: P
a. Both aircraft and simulator operating costs approxi-
mately doubled, so that average and median simulator-to-aircraft
*operating cost ratios were similar in both time periods.
b. The entire increase in average aircraft operating
costs is consistent with the rate of economic inflation, while
only about 40 percent of the increase in average simulator
• operating costs can be attributed to inflation. Data limita-
tions precluded explanation of the remainder of the simulator
operating cost growth.
to c. Simulator utilization by the Air Force was about
30 percent lower in FY 1980-1981 than in FY 1976-1977.
19
19
1.

REFERENCES
Cost Data
1. Headquarters, USAF/ACMC, USAF Cost and Planning FactorsRegulation, AFR 173-13, 1 February 1951.
2. Headquarters, USAF/ACMC, USAF Cost and Planning FactorsPamphlet, AFP 173-13, 1 February 1950.
3. NALCOMIS-O&S/VAMOSC-AIR, Navy and Marine Corps Aircraft* Cost Report by.T/M/S, FY 1979.
4. Headquarters, US Army, United States Army. Aviation
Planning Manual, FM 101-20, 15 August 19l.
5. Comptroller of the Army, Directorate of Cost Analysis.
6. Headquarters, US Army, DCS/Operations and Plans, TrainingDirectorate.
7. Headquarters, USAF, DCS/Plans and Operations, DeputyDirector for Operations and Training, Flight SimulatorLocation, October 1980.
8. Letter to Institute for Defense Analyses from Headquarters,Tactical Air Command, Directorate of Cost and ManagementAnalysis, Flight Simulator Cost and Utilization, 14 July1981.
9. Headquarters, Strategic Air Command (LGMAA).
10. Letter from Headquarters, Military Airlift Command,Directorate of Cost and Management Analysis to theInstitute for Defense Analyses, MAC Flight SimulatorOperational Cost Data, 5 January 19b2.
11. Telecon with Military Airlift Command, Operations,20 January 1982.
12. AirLant cost data for FY 1980, via Information Spectrum, Inc.
20

* 13. Headquarters, Naval Air Systems Command, Weapons TrainingDivision (NavAir 413), inventory printout of aircraft-related training devices as of April 20, 1981.
14. US Army Aviation Center, Directorate of Resource Manage-ment, Cost Analysis Division, Variable Operating Costs of
* Flight Training Simulators vs. Aircraft, 1 May 19K,Ft. Rucker, Ala.
Other Reference
*Orlansky, Jesse and Joseph String, Cost-Effectiveness ofFlight Simulators for Military Training, IDA Paper P-1275,Institute for Defense Analyses, Alexandria, VA 22311,August 1977 (AD A052 801).
21
;


