
IAEAInternational Atomic Energy Agency
Indicators for SustainableEnergy Development (ISED)
Alan McDonald
Department of Nuclear Energy, IAEA
Partnerships FairCSD-14 • New York • 3 May 2006

IAEA 2
Downloadable from the web
• http://www-pub.iaea.org/MTCD/publications/PDF/Pub1222_web.pdf
• http://www.blackwell-synergy.com/toc/narf/29/4

IAEA 3
Genesis of EISD
• 1995 work initiated by DESA
• Agenda 21, Chapter 40• Development and promotion of
indicators for sustainable development
• 3 energy indicators• Annual energy use per capita
• Share of consumption of renewable resources
• Intensity of energy use

IAEA 4
ISED
• 5 agencies• UNDESA, OECD/IEA,
IAEA, Eurostat, EEA
• 7 countries• Brazil, Cuba,
Lithuania, Mexico, Russia, Slovakia, Thailand
IAEA 5
Design objectives
• Match UN format• Main themes, sub-themes
• Social, economic, environmental, institutional
• Match data availability in most countries
• Clarity and consistency
• Relevant to policy assessment for sustainability
• Pilot testing / adjustment for usability
IAEA 6
30 indicators
• 4 social
• 16 economic
• 10 environmental
IAEA 7
Social (SOC1)
• Theme: Equity
• Sub-theme: Accessibility
• Indicator: Share of households (or population) without electricity or commercial energy, or heavily dependent on non-commercial energy
• Components:• Households (or population) without electricity or
commercial energy, or heavily dependent on noncommercial energy
• Total number of households or population
IAEA 8
Social (SOC2, 3 & 4)
• Share of household income spent on fuel and electricity
• Household energy use for each income group and corresponding fuel mix
• Accident fatalities per energy produced by fuel chain
IAEA 9
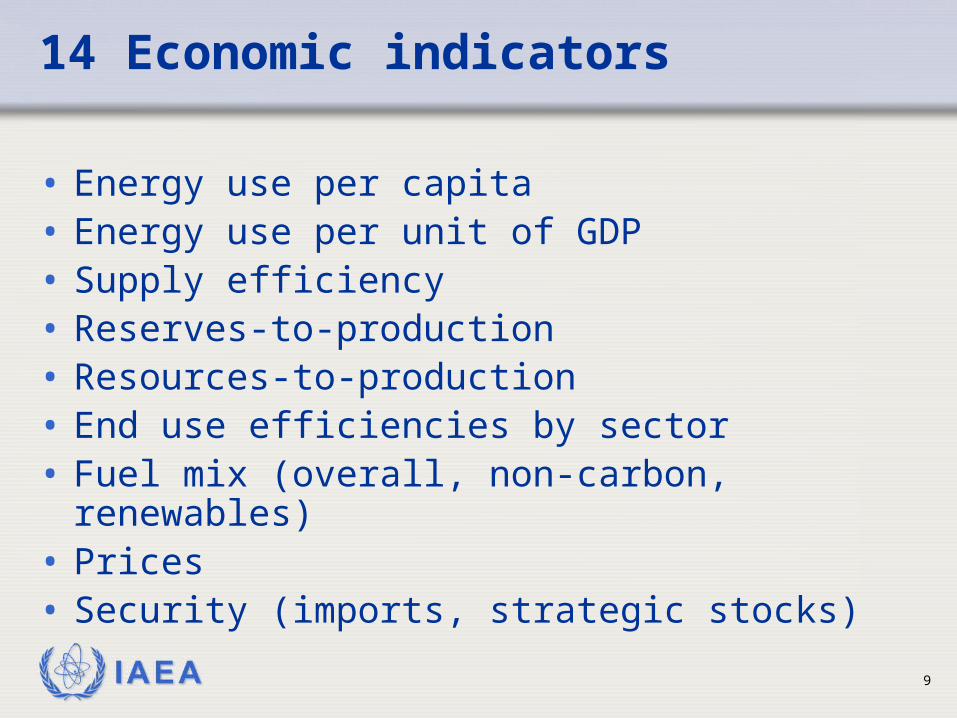
14 Economic indicators
• Energy use per capita• Energy use per unit of GDP• Supply efficiency• Reserves-to-production• Resources-to-production• End use efficiencies by sector• Fuel mix (overall, non-carbon, renewables)• Prices• Security (imports, strategic stocks)

IAEA 10
10 Environmental indicators
• GHG emissions
• Air quality
• Water quality
• Soil quality
• Deforestation
• Solid waste (including radioactive waste)
IAEA 11
Not a test or a contest
• Unlike some other indicators, ISED are meant to be used for national analyses – UN system.
• They are not meant to set up pass-fail situations or international benchmarking, although others do use indicators in this way.
• Indicators judge according to established criteria – they do not judge between good and bad
• Intended to motivate the question, “Why?”

IAEA 12
Indicators need context
• Each ISED gives an indication of one aspect of energy use
• Each needs to be read together with other indicators
• Need to be read in the context of each country’s economy and resources
• Indicators have proper applications and limitations

IAEA 13
Indicators as a tool
• Indicators are not magic, do not generate magic numbers or magic answers
• Need thoughtful interpretation in context to avoid false identification of causality, etc.
• Can inform policy decisions, help gauge policy effectiveness and unintended consequences

IAEA 14
Electricity access in Ghana
0%
20%
40%
60%
80%
100%
2003 2015 2030
ele
ctr
icit
y a
cc
es
s
urban rural

IAEA 15
Energy intensities in Thailand

IAEA 16
Energy intensity of GDP
TPES/GDP (toe per thousand $)
0
0.05
0.1
0.15
0.2
0.25
0.3
1971 1973 1975 1977 1979 1981 1983 1985 1987 1989 1991 1993 1995 1997 1999 2001
Austria Bangladesh Egypt

IAEA 17
Share of Traditional Energy Use in Total Energy (% )
0
10
20
30
40
50
60
70
80
90
Austria Bangladesh Egypt
1980 1996
Traditional energy use
IAEA 18
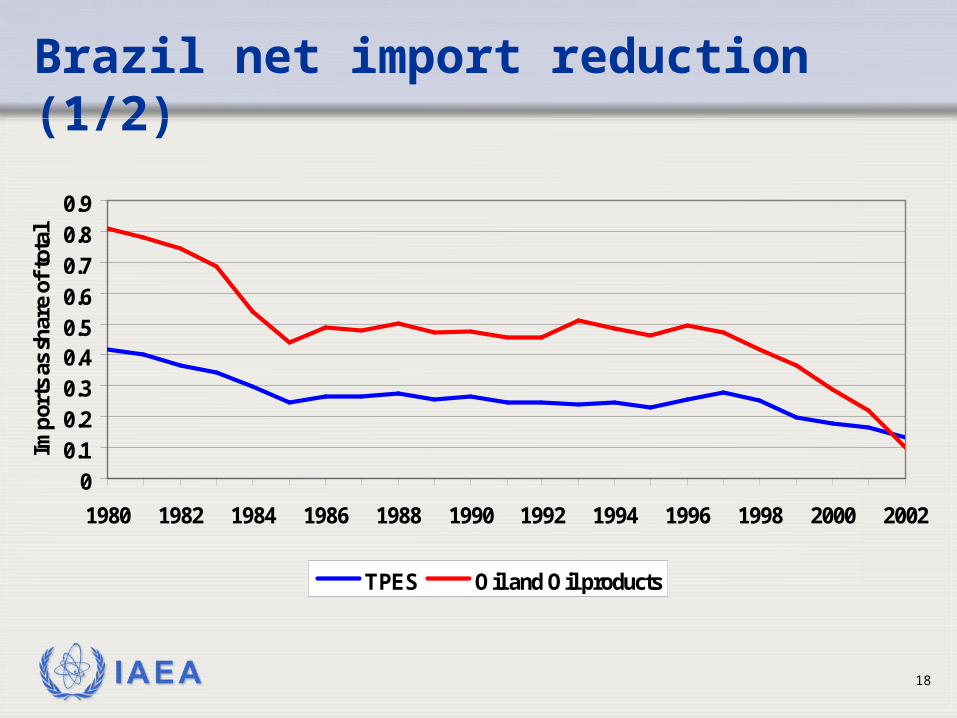
Brazil net import reduction (1/2)
00.10.20.30.40.50.60.70.80.9
1980 1982 1984 1986 1988 1990 1992 1994 1996 1998 2000 2002
Imp
orts
as
shar
e of
tot
al
TPES Oil and Oil products

IAEA 19
Brazil net import reduction (2/2)
00.10.20.30.40.50.60.70.80.9
1980 1982 1984 1986 1988 1990 1992 1994 1996 1998 2000 2002
Imp
orts
as
shar
e of
tot
al
TPES Oil and Oil products
IAEA 20
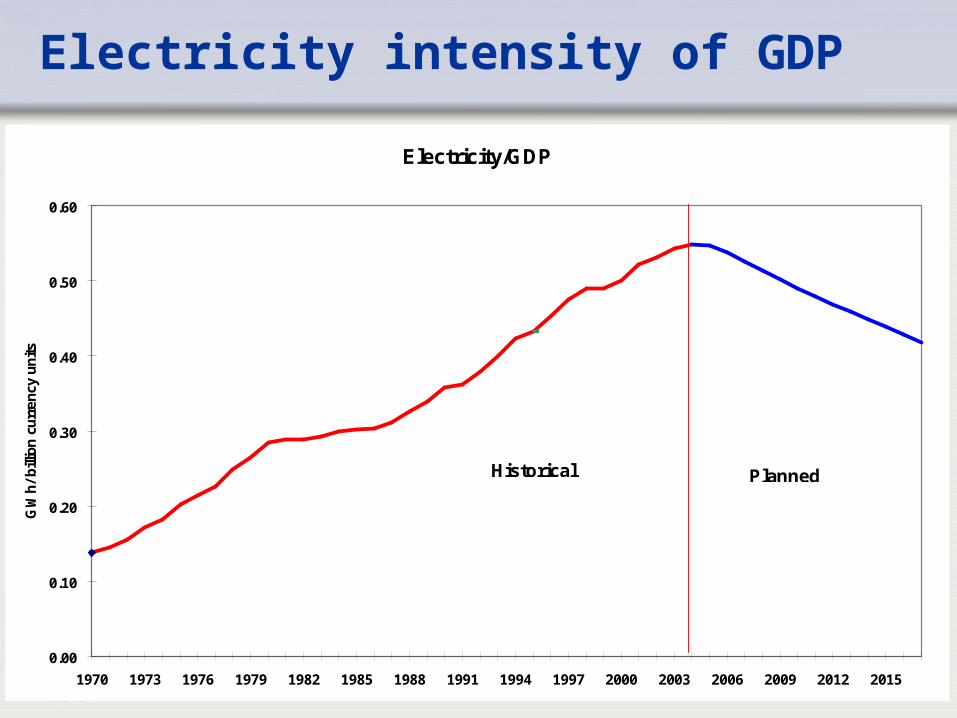
Electricity intensity of GDP
Electricity/GDP
0.00
0.10
0.20
0.30
0.40
0.50
0.60
1970 1973 1976 1979 1982 1985 1988 1991 1994 1997 2000 2003 2006 2009 2012 2015
GW
h/ b
illio
n cu
rren
cy u
nits
Historical Planned

IAEA 21
National Plan - Implied Decoupling
• Current National Electricity Plan
• Ratio of growth rates 0.43 between 2011 & 2015
• Low compared to Japan & U.S.A
GDP growth rate
(A)Electricity demand
growth rate (B)Ratio of growth rates
(B/A)U.S.A Japan
1971-1980 7.5 15.6 2.09 1.03 1.13
1981-1990 8.7 11.2 1.29 0.78 0.95
1991-1995 7.5 11.6 1.550.77 -
1996-2000 5.0 8.1 1.64
2001-2005 5.1 5.4 1.05
2006-2010 5.0 2.7 0.54
2011-2015 4.0 1.7 0.43
IAEA 22
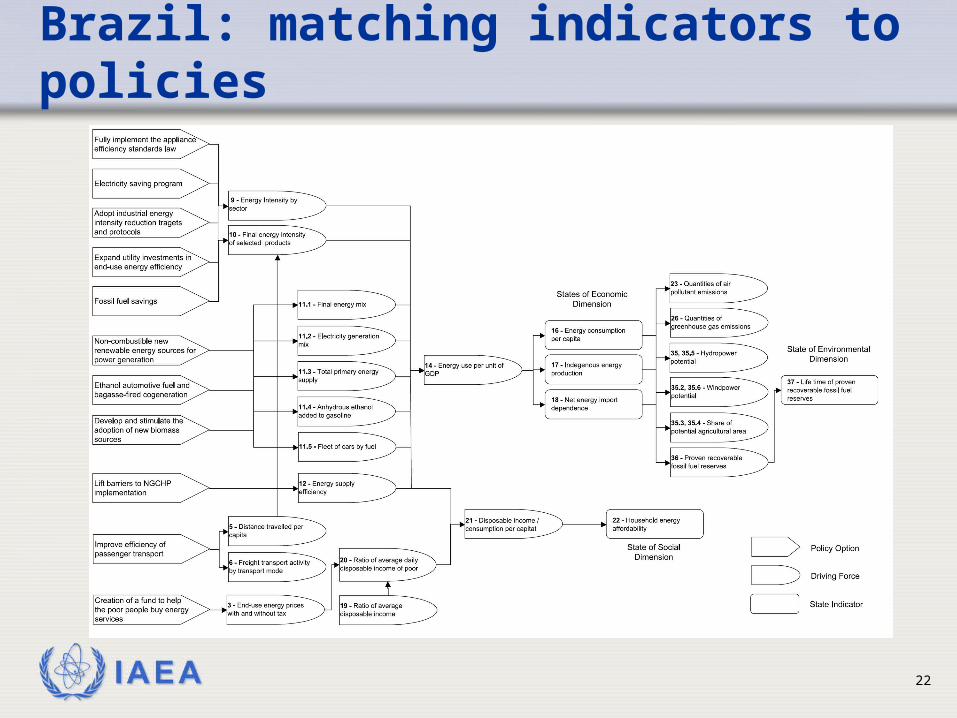
Brazil: matching indicators to policies

IAEA 23
Capacity building for energy analysis
• Transfer analytic tools tailored to developing countries
• Transfer data on technologies, resources and economics
• Train local experts
• Jointly analyze national options
• Help establish continuing local expertise
IAEA 24
Current implementation
• Add indicators to IAEA analytic tools• Models calculate indicators
• Include in databases
• Include in transfer and training
• Two more possibilities• CDM assessment by countries
• Used by individual partnerships where appropriate

IAEA 25
IAEA
…atoms for peace.


