
i
NICKEL OXIDE DOPED NOBLE METALS SUPPORTED CATALYSTS FOR
CARBON DIOXIDE METHANATION AND DESULFURIZATION REACTIONS
SUSILAWATI BT TOEMEN
UNIVERSITI TEKNOLOGI MALAYSIA

i
NICKEL OXIDE DOPED NOBLE METALS SUPPORTED CATALYSTS FOR
CARBON DIOXIDE METHANATION AND DESULFURIZATION REACTIONS
SUSILAWATI BT TOEMEN
A thesis submitted in fulfilment of the
requirements for the award of the degree of
Master of Science (Chemistry)
Faculty of Science
Universiti Teknologi Malaysia
JANUARY 2011

iii
BISMILLAHIRROHMANIRROHIM.....
A Special Dedication to my beloved family especially mum and
dad for their everlasting support

iv
ACKNOWLEDGEMENTS
In the name of Allah, the Most Gracious, the Most Merciful,
All praise to Allah, for His Mercy has given me patience and strength to
complete this work. All the praise to Allah again.
Special thanks go to my supervisor, Prof. Dr. Wan Azelee Wan Abu Bakar as
my main supervisor, and Associate Professor Dr. Rusmidah Ali as my co-supervisor
for their invaluable advice and encouragement during the course of this research.
Without their time and patience much of this work could not have been
accomplished.
A million thanks also go to all lecturers and laboratory staffs of Faculty
Science, Faculty of Mechanical Engineering and Institute Ibnu Sina also to my entire
fellow friends especially to Fatirah, Nooradilah, Mariami Alisa and Noor Safina
Sulaiman for their technical cooperation, knowledge, encouragement and guidance
throughout this research. I am grateful to Universiti Teknologi Malaysia and Ministry
of Science, Technology and Innovation Malaysia for financial support.
Last but not least, I wish to express my sincere appreciation to my beloved
family and Megat Mohd Hazwan Yahya for their continuous support, advices and
motivation for me to complete my research. Thanks to the love pouring into my life.
Thank you so much.

v
ABSTRACT
Malaysia has one of the most extensive natural gas pipeline networks in Asia. Using pipeline system, the gas will be channelled to the onshore station where the natural gas will undergo separation of acidic gases. Nowadays, the removal of toxic gases such as H2S and CO2 via chemical conversion attracted many researchers due to the effectiveness of the technique. In this research, new catalysts of high industrial impact that can catalyze the reactions of CO2 methanation and H2S desulfurization were developed. A series of catalysts based on nickel oxide doped with ruthenium, rhodium, palladium and platinum were prepared. Then, the best two catalysts were subjected to undergo several optimizations such as different calcination temperature of catalysts, calcinations temperature of alumina, different support materials, preparation method, reproducibility testing and regeneration testing. Pd/Ru/Ni (2:8:90)/Al2O3 and Rh/Ni (30:70)/Al2O3 catalysts exhibited the most potential catalysts resulted from the activity testing monitored by FTIR and GC. These catalysts were prepared using wetness impregnation technique, aging at 85oC and followed by calcination at 400oC. Both catalysts achieved 100% H2S desulfurization below 200oC. In the presence of H2S gas, only 3.64% CH4 was produced over Pd/Ru/Ni (2:8:90)/Al2O3 catalyst from 57.31% CO2 conversion, while 0.5% CH4 was obtained from 4.53% CO2 conversion over Rh/Ni (30:70)/Al2O3 at temperature of 400oC, respectively. However, the methane percentage increased to 39.73% for Pd/Ru/Ni (2:8:90)/Al2O3 catalyst from 52.95% CO2 conversion and 70.75% for Rh/Ni (30:70)/Al2O3 catalyst from 90.1% CO2 conversion during testing without flowing of H2S gas. Moreover, the XRD diffractogram showed that both catalysts are highly amorphous in structure with BET surface area in the range of 220-270 m2g-1. FESEM analysis indicated a rough surface morphology and non-homogeneous spherical shape with the smallest particles size in the range 40-115 nm for fresh Pd/Ru/Ni (2:8:90)/Al2O3 catalyst and formation of aggregates with rough surface morphology for fresh Rh/Ni (30:70)/Al2O3 catalyst. The elemental analysis performed by EDX confirmed the presence of Ni, Ru, Pd, Al and O in the Pd/Ru/Ni (2:8:90)/Al2O3 catalyst while, Ni, Rh, Al and O in the Rh/Ni (30:70)/Al2O3 catalyst. Characterization by FTIR and TGA-DTG revealed the existence of nitrate and hydroxyl ions on the catalysts surface.

vi
ABSTRAK
Malaysia mempunyai rangkaian pempaipan gas asli yang luas di Asia. Dengan menggunakan sistem pempaipan, gas asli akan dibawa ke daratan bagi menjalankan proses pemisahan gas berasid. Pada masa kini, penyingkiran gas toksik seperti H2S dan CO2 menggunakan penukaran kimia telah menarik perhatian banyak penyelidik kerana keberkesanannya. Dalam penyelidikan ini, mangkin baru berimpak industri yang tinggi telah dibangunkan bagi memangkinkan tindak balas methanasi CO2 dan penyahsulfuran H2S. Siri mangkin berasaskan nikel didopkan dengan rutenium, rodium, paladium dan platinum telah disediakan. Kemudian, dua mangkin terbaik akan menjalani beberapa pengoptimisinan seperti suhu pengkalsinan mangkin yang berbeza, suhu pengkalsinan bahan penyokong, pelbagai bahan penyokong, pelbagai kaedah penyediaan, ujian pemboleh ulangan dan ujian penjanaan semula. Pd/Ru/Ni (2:8:90)/Al2O3 dan Rh/Ni (30:70)/Al2O3 merupakan mangkin yang berpotensi yang dikenal pasti daripada ujian aktiviti yang dipantau oleh FTIR dan GC. Mangkin-mangkin ini disediakan menggunakan kaedah pengisitepuan, dikeringkan pada 85oC diikuti pengkalsinan pada suhu 400oC. Mangkin-mangkin ini mencapai 100% penyahsulfuran pada suhu bawah 200oC. Dalam kehadiran gas H2S ini, hanya 3.64% gas metana dihasilkan daripada 57.31% penukaran CO2 bagi mangkin Pd/Ru/Ni (2:8:90)/Al2O3 manakala, 0.5% gas metana dihasilkan oleh Rh/Ni (30:70)/Al2O3 daripada 4.53% penukaran CO2 pada suhu 400oC, masing-masing. Walau bagaimanapun, peratusan gas metana ini meningkat ke 39.73% bagi mangkin Pd/Ru/Ni (2:8:90)/Al2O3 daripada 52.95% penukaran CO2 dan 70.75% bagi mangkin Rh/Ni (30:70)/Al2O3 daripada 90.10% penukaran CO2 semasa ujian tanpa aliran gas H2S. Selain itu, difraktogram XRD menunjukkan kedua-dua mangkin ini mempunyai struktur sangat amorfos dengan luas permukaan BET di dalam anggaran 220-270 m2g-1. Analisis FESEM mempamerkan struktur permukaan yang kasar dan ketidaksekataan bentuk dengan saiz zarah yang kecil di dalam julat 40-115 nm bagi mangkin Pd/Ru/Ni (2:8:90)/ Al2O3 dan pembentukan agregat serta struktur permukaan yang kasar bagi mangkin Rh/Ni (30:70)/Al2O3. Analisis EDX telah mengenal pasti kewujudan element Ni, Ru, Pd, Al dan O dalam mangkin Pd/Ru/Ni (2:8:90)/Al2O3 manakala elemen Ni, Rh, Al dan O dalam mangkin Rh/Ni (30:70)/Al2O3. Pencirian oleh FTIR dan TGA menunjukkan kewujudan ion nitrat dan hidroksil di atas permukaan mangkin.

vii
TABLE OF CONTENTS CHAPTER TITLE PAGE
DECLARATION
DEDICATION
ACKNOWLEDGEMENT
ABSTRACT
ABSTRAK
TABLE OF CONTENTS
LIST OF TABLES
LIST OF FIGURES
LIST OF ABBREVIATIONS
LIST OF APPENDICES
ii
iii
iv
v
vi
vii
xi
xiv
xviii
xx
1 INTRODUCTION
1.1 Natural Gas
1.2 Acid Gas Treating Processes
1.3 Problem Statement
1.4 Significant of Study
1.5 Objectives of the Research
1.6 Scope of the Research
1
4
7
9
9
10
2
LITERATURE REVIEW
2.1 Introduction
2.2 Nickel Based Methanation Catalysts
2.3 Noble Metals Used in Methanation Reaction
2.4 Supports for the Methanation Catalysts
11
11
18
24

viii
3
EXPERIMENTAL
3.1 Introduction
3.2 Chemicals and Reagents
3.3 Catalysts Preparation
3.4 Catalytic Reaction Conditions
3.5 Optimization Parameters
3.5.1 Amount of Nickel Loading
3.5.2 Calcination Temperature of Supported
Catalysts
3.5.3 Type of Support Materials
3.5.3.1 Preparation of Carbon Support from
Palm Kernel Shell (PKS)
3.5.4 Pre-Calcination Temperature of alumina
support
3.5.5 Different Preparation Techniques
3.5.6 H2S Testing
3.5.7 Reproducibility Testing
3.5.8 Regeneration Activity
3.6 Methane Measurement via Gas Chromatography
3.7 Characterization
3.7.1 X-Ray Diffraction Spectroscopy (XRD)
3.7.2 Field Emission Scanning Electron Microscopy
- Energy Dispersive X-Ray (FESEM-EDX)
3.7.3 Nitrogen Absorption Analysis (NA)
3.7.4 Fourier Transform Infrared Spectroscopy
(FTIR)
3.7.5 Thermogravimetry Analysis-Differential
Thermal Analysis (TGA-DTA)
29
29
30
31
33
34
34
34
34
35
36
36
37
37
37
38
39
39
40
40
41
ix
4
RESULTS AND DISCUSSION
4.1 Catalytic Testing Measurement
4.1.1 Catalytic Performance of Supported NiO
Based Catalyst with Ruthenium as a First
Dopant
4.1.2 Catalytic Performance of Supported NiO
Based Catalyst with Rhodium as a First
Dopant.
4.2 Optimization Parameter of Catalytic Performance
4.2.1 Effect of Nickel Loading
4.2.2 Effect of Different Calcination Temperature
towards Supported Catalyst
4.2.3 Effect of Different Support Materials
4.2.4 Effect of Different Calcination Temperature
towards Alumina Support
4.2.5 Effect of Different Methods of catalyst
Preparation
4.2.6 Effect of H2S Gas on the Alumina Supported
Catalyst
4.2.7 Reproducibility Testing towards Potential
Catalyst
4.2.8 Regeneration Testing on the Potential Catalyst
4.3 Methane Gas Measurement via Gas Chromatography
4.4 Catalyst Testing of CO2 Methanation Reaction using
Two Reactors over Pd/Ru/Ni (2:8:90)/Al2O3 Catalyst
4.5 Characterization of the Potential Catalysts
4.5.1 X-Ray Diffraction Analysis (XRD)
4.5.1.1 X-Ray Diffraction (XRD) Analysis
over Pd/Ru/Ni (2:8:90)/Al2O3
Catalyst
4.5.1.2 X-Ray Diffraction (XRD) Analysis
over Rh/Ni (30:70)/Al2O3 Catalyst
42
42
45
49
49
52
56
59
61
64
67
69
71
74
76
76
76
81

x
5
4.5.2 Field Emission Scanning Electron Microscopy
and Energy Dispersive X-Ray
4.5.2.1 FESEM Analysis over Pd/Ru/Ni
(2:8:90)/Al2O3 Catalyst
4.5.2.2 FESEM Analysis over Rh/Ni
(30:70)/Al2O3 Catalyst
4.5.3 Nitrogen Absorption Analysis (NA)
4.5.4 Fourier Transform Infra-Red (FTIR) Analysis
4.5.5 Thermogravimetry Analysis – Differential
Thermal Analysis (TGA-DTA)
CONCLUSIONS AND RECOMMENDATIONS
5.1 Conclusions
5.2 Recommendations
REFERENCES
APPENDICES (A-E)
84
84
88
91
94
97
99
100
102
115-119

xi
LIST OF TABLES TABLE NO. TITLE PAGE
1.1 Chemical composition of crude natural gas from Telaga Bergading, Petronas Carigali Sdn. Bhd.
4
3.1 Wavenumber of CO2, H2S, CO and CH4 gasses in FTIR spectra
33
4.1 Percentage conversion of CO2 from methanation reaction over various alumina supported nickel oxide based catalysts with ruthenium as a dopant and co-dopant
43
4.2 Percentage conversion of CO2 from methanation reaction over various alumina supported nickel oxide based catalysts with rhodium as a dopant and co-dopant
46
4.3 Comparison of CO2 conversion from methanation reaction over Pd/Ru/Ni/Al2O3 catalyst with different loading of nickel calcined at 400oC for 5 hours
50
4.4
Comparison of CO2 conversion from methanation reaction over Rh/Ni/Al2O3 catalyst with different loading of nickel calcined at 400oC for 5 hours
52
4.5 Comparison of CO2 conversion from methanation reaction over Pd/Ru/Ni (2:8:90)/Al2O3 catalyst calcined for 5 hours at four different calcination temperatures
54
4.6 Comparison of CO2 conversion from methanation reaction over Rh/Ni (30:70)/Al2O3 catalyst calcined for 5 hours at different calcination temperatures
54
4.7
Comparison of CO2 conversion from methanation reaction over Pd/Ru/Ni catalyst with the ratio of 2:8:90 coated on various support materials then calcined at 400oC for 5 hours
56
4.8 Comparison of CO2 conversion from methanation reaction over Rh/Ni catalyst with the ratio of 30:70 coated on various support materials then calcined at 400oC for 5 hours
58

xii
4.9 Comparison of CO2 conversion from methanation reaction over Pd/Ru/Ni (2:8:90) catalyst coated on alumina which has been calcined for 5 hours at different temperature
59
4.10 Comparison of CO2 conversion from methanation reaction over Rh/Ni (30:70) catalyst coated on alumina which has been calcined for 5 hours at different temperature
60
4.11
Comparison of CO2 conversion from methanation reaction over Pd/Ru/Ni (2:8:90)/Al2O3 and Rh/Ni (30:70)/Al2O3 catalysts prepared by different preparation methods and calcined at 400oC
62
4.12
Percentage conversion of CO2 from methanation reaction and H2S desulfurization over Pd/Ru/Ni (2:8:90)/Al2O3 catalyst calcined at 400oC for 5 hours testing with and without the presence of H2S gas
65
4.13
Percentage conversion of CO2 from methanation reaction and H2S desulfurization over Rh/Ni (30:70)/Al2O3 catalyst calcined at 400oC for 5 hours testing with and without the presence of H2S gas
66
4.14 The product and by-product of CO2 methanation reaction over Pd/Ru/Ni (2:8:90)/Al2O3 catalyst detected via GC
72
4.15 The product and by-product of CO2 methanation reaction over Rh/Ni (30:70)/Al2O3 catalyst detected via GC
73
4.16 The product and by-product of CO2 methanation reaction using two reactors over Pd/Ru/Ni (2:8:90)/Al2O3 catalyst detected via GC
75
4.17 Peaks assignment in the X-ray diffraction patterns of Pd/Ru/Ni (2:8:90)/Al2O3 catalyst calcined at 700oC for 5 hours
79
4.18 Peaks assignment in the X-ray diffraction patterns of Rh/Ni (30:70)/Al2O3 catalyst calcined at 1000oC for 5 hours
80
4.19 Peaks assignment in the X-ray diffraction patterns of Rh/Ni (30:70)/Al2O3 catalyst calcined at 700oC for 5 hours
83
4.20 Peaks assignment in the X-ray diffraction patterns of Rh/Ni (30:70)/Al2O3 catalyst calcined at 1000oC for 5 hours
84
4.21 EDX analysis of fresh and spent Pd/Ru/Ni (2:8:90)/Al2O3 catalysts, calcined at 400oC for 5 hours
87

xiii
4.22 EDX analysis of fresh and spent Rh/Ni (30:70)/Al2O3 catalysts, calcined at 400oC for 5 hours
90
4.23 BET surface area and average pore diameter of the fresh and spent Pd/Ru/Ni (2:8:90)-Al2O3 and Rh/Ni (30:70)/Al2O3 catalysts calcined at 400oC for 5 hours
91
4.24 FTIR analysis of Pd/Ru/Ni (2:8:90)/Al2O3 and Rh/Ni (30:70)/Al2O3 catalysts calcined at 400oC for 5 hours
96
xiv
LIST OF FIGURES
FIGURE NO. TITLE PAGE
1.1 World gas reserves (6102 tcf)
2
1.2 Domestic, commercial and industrial utilization of natural gas
3
3.1 Uncoated and coated of alumina support
30
3.2 Schematic diagram of home-built micro reactor
31
3.3 Schematic diagram of glass tube for home-built micro reactor
31
3.4 Diagram of FTIR sample cell
32
3.5 Carbon support from Palm Kernel Shell (PKS)
35
3.6 Calibration graph of standard 99.0% pure methane
38
4.1 FTIR spectra of gaseous products obtained from catalytic screening over i) Pd/Ru/Ni (2:8:90)/Al2O3 ii) Rh/Ni (10:90)/Al2O3 catalysts during CO2 methanation reaction
48
4.2 Catalytic performance of CO2 conversion from methanation reaction over Pd/Ru/Ni/Al2O3 catalyst calcined at 400oC for 5 hours with various loading of nickel: i) 90 wt% (Pd/Ru/Ni (2:8:90)/Al2O3), ii) 80 wt% (Pd/Ru/Ni (5:15:80)/Al2O3) and iii) 70 wt% (Pd/Ru/Ni (5:25:70)/Al2O3)
50
4.3 Catalytic performance of CO2 conversion from methanation reaction over Rh/Ni/Al2O3 catalyst calcined at 400oC for 5 hours with various loading of nickel: i) 90 wt% (Rh/Ni (10:90)/Al2O3), ii) 80 wt% (Rh/Ni (20:80)/Al2O3) and iii) 70 wt% (Rh/Ni (30:70)/Al2O3)
51

xv
4.4 Catalytic performance of CO2 conversion from methanation reaction over Pd/Ru/Ni (2:8:90)/Al2O3 catalyst calcined for 5 hours at different calcination temperatures: i) 400oC, ii) 500oC, iii) 700oC and iv) 1000oC
53
4.5 Catalytic performance of CO2 conversion from methanation reaction over Rh/Ni (30:70)/Al2O3 catalyst calcined for 5 hours at different calcination temperatures: i) 400oC, ii) 500oC and iii) 700oC
55
4.6 Catalytic performance of CO2 conversion from methanation reaction over Pd/Ru/Ni (2:8:90) catalyst with various support materials: i) Al2O3 beads ii) TiO2/SiO2 beads and iii) Carbon chips from PKS calcined at 400oC for 5 hours
57
4.7 Catalytic performance of CO2 conversion from methanation reaction over Rh/Ni (30:70) catalyst with various support materials: i) Al2O3 beads ii) TiO2/SiO2 beads and iii) Carbon chips from PKS and calcined at 400oC for 5 hours
58
4.8 Catalytic performance of CO2 conversion from methanation reaction over Pd/Ru/Ni (2:8:90) catalyst coated on alumina calcined for 5 hours at different temperatures: i) 700oC and ii) 1000oC
60
4.9 Catalytic performance of CO2 conversion from methanation reaction over Rh/Ni (30:70) catalyst coated on alumina calcined for 5 hours at different temperatures: i) 700oC and ii) 1000oC
61
4.10 Catalytic performance of CO2 conversion from methanation reaction over Pd/Ru/Ni (2:8:90)/Al2O3 catalyst prepared by different preparation methods i) wetness impregnation method and, ii) wetness impregnation modification method iii) Sol-gel method
63
4.11 Catalytic performance of CO2 conversion from methanation reaction over Rh/Ni (30:70)/Al2O3 catalyst prepared by different preparation methods i) wetness impregnation method and, ii) wetness impregnation modification method iii) sol-gel method
63
4.12 Catalytic performance of CO2 conversion from methanation reaction over Pd/Ru/Ni (2:8:90)/Al2O3 catalyst calcined at 400oC for 5 hours testing with and without the presence of H2S gas
64

xvi
4.13 Catalytic performance of CO2 conversion from methanation reaction over Rh/Ni (30:70)/Al2O3 catalyst calcined at 400oC for 5 hours testing with and without the presence of H2S gas
66
4.14 The trend plot of reproducibility testing over Pd/Ru/Ni (2:8:90)/Al2O3 catalyst calcined at 400oC for 5 hours towards CO2 conversion from methanation reaction
67
4.15 The trend plot of reproducibility testing over Rh/Ni (30:70)/Al2O3 catalyst calcined at 400oC for 5 hours towards CO2 conversion from methanation reaction
68
4.16 Regeneration catalytic testing over Pd/Ru/Ni (2:8:90)/Al2O3 catalyst for 3 hours at various temperatures towards CO2 conversion from methanation reaction
70
4.17 Regeneration catalytic testing over Rh/Ni (30:70)/Al2O3 catalyst at various temperatures and various times towards CO2 conversion from methanation reaction
71
4.18 Catalytic performance of CO2 methanation reaction using two reactors over Pd/Ru/Ni (2:8:90)/Al2O3 catalyst calcined at 400oC for 5 hours and testing simultaneously with H2S gas
75
4.19 XRD diffractograms of Pd/Ru/Ni (2:8:90)/Al2O3 catalyst calcined at a) 400oC, b) 700 oC and c) 1000oC for 5 hours
77
4.20 XRD diffractograms of Rh/Ni (30:70)/Al2O3 catalyst calcined at a) 400oC, b) 700 oC and c) 1000oC for 5 hours
81
4.21 FESEM micrographs of fresh and spent Pd/Ru/Ni (2:8:90)/Al2O3 catalysts, calcined at 400oC for 5 hours with magnification 5000X and 50000X
85
4.22 EDX Mapping over Pd/Ru/Ni (2:8:90)/Al2O3 catalyst calcined at 400oC for 5 hours
86
4.23 FESEM micrographs of fresh and spent Rh/Ni (30:70)/Al2O3 catalysts, calcined at 400oC for 5 hours with magnification 5000X
88
4.24 EDX Mapping over Rh/Ni (30:70)-Al2O3 catalyst calcined at 400oC for 5 hours
89
4.25 Isotherm plot of fresh Pd/Ru/Ni (2:8:90)/Al2O3 catalyst
92

xvii
4.26 Isotherm plot of spent Pd/Ru/Ni (2:8:90)/Al2O3 catalyst
93
4.27 Isotherm plot of fresh Rh/Ni (30:70)/Al2O3 catalyst
94
4.28 Isotherm plot of spent Rh/Ni (30:70)/Al2O3 catalyst
94
4.29 FTIR spectra of (a) fresh (b) spent (c) regenerated Pd/Ru/Ni (2:8:90)/Al2O3 catalysts calcined at 400oC for 5 hours
95
4.30 FTIR spectra of (a) fresh (b) spent (c) regenerated Rh/Ni (30:70)/Al2O3 catalysts calcined at 400oC for 5 hours
95
4.31 Thermogram of Pd/Ru/Ni (2:8:90)/Al2O3 catalyst after aging in an oven for 24 hours at 80oC-90oC
97
4.32 Thermogram of Rh/Ni (30:70)/Al2O3 catalyst after aging in an oven for 24 hours at 80oC-90oC
98

xviii
LIST OF ABBREVIATIONS
ABS - Absorbance
BET - Brunnauer, Emmet and Teller
BJH - Barret-Joyner-Halenda
Btu - British thermal unit
c - Cubic
cf - Cubic feet
Cu Kα - X-ray diffraction from Copper K energy levels rate of
conversion (percentage)
d - Pore diameter
DTA - Differential Thermal Analysis
EDX - Energy Dispersive X-ray Analysis
fcc - Face-centered cubic
FESEM - Field Emission Scanning Electron Microscope
FID - Flame Ionization Detector
FTIR - Fourier Transform Infrared
GC - Gas Chromatography
GHSV - Gas Hourly Space Velocity
ΔH - Enthalpy change
h - Hexagonal
hr - Hour
IWI - Incipient Wetness Impregnation techniques.
LNG - Liquefied Natural Gas
m - Monoclinic
MgKα - X-ray diffraction from Magnesium K energy levels rate of
conversion (percentage)
MS - Mass Spectroscopy
NA - Nitrogen Adsorption

xix
P/ Po - Relative pressure; obtained by forming the ratio of the
equilibrium pressure and vapour pressure Po of the adsorbate
at the temperature where the isotherm is measured
PDF - Powder Diffraction File
PKS - Palm Kernel Shell
ppm - Part per million
PROX - Prefential oxidation
RWSG - Reverse Water Gas Shift
SMSI - Strong metal support interaction
SDS - Sodium dodecyl sulphate
SNG - Substitute natural gas
tcf - Trillion cubic feet
TGA - Thermogravimetry Analysis
UGC - Urea gelation co-precipitation
VOC - Volatile Organic Compounds
wt% - Weight percentage
WGS - Water Gas Shift
XRD - X-ray Diffraction
θ - Half angle of diffraction beam
λ - Wavelength

xx
LIST OF APPENDICES APPENDIX TITLE PAGE A Preparation of Alumina Supported Nickel Oxide Based
Catalysts and Its Ratio
115
B Calculation of Methane Percentage 116 C Schematic Diagram of Home Built Micro Reactor
Connected using Two Isothermal Furnaces 117
D Calculation of atomic weight percentage ratio of element in
catalyst preparation
118
E Calculation of weight loss over Pd/Ru/Ni (2:8:90)/Al2O3 catalyst
119

1
CHAPTER 1
INTRODUCTION
1.1 Natural Gas
Natural gas is a vital component of the world’s supply of energy and one of
the most useful of all energy sources. It is considered as an environmental friendly
clean fuel, offering important environmental benefits when compared to other fossil
fuels. Natural gas is colorless, odorless, tasteless, shapeless and lighter than air.
Natural gas is the flammable gaseous mixture that occurs alone or with petroleum in
underground reservoirs. It is predominantly methane (CH4) and some higher
molecular weight paraffins (CnH2n+2) generally containing up to four carbon atom.
Natural gas is the result of the decay of animal and plant remains (organic
debris) that has occurred over millions of years. Over time, the mud and soil that
covered the organic debris changed to rock and trapped the debris beneath the newly-
formed rock sediment. Pressure and to some extent, heat changed some of the
organic material into coal, some into oil (petroleum) and some into natural gas.
Whether or not the debris formed coal, petroleum or gas depended upon the nature of
the debris and the localized conditions under which the changes occurred (James,
2007).
Natural gas is produced in many countries around the world and most of
those countries produce both oil and natural gas, a few produce only natural gas
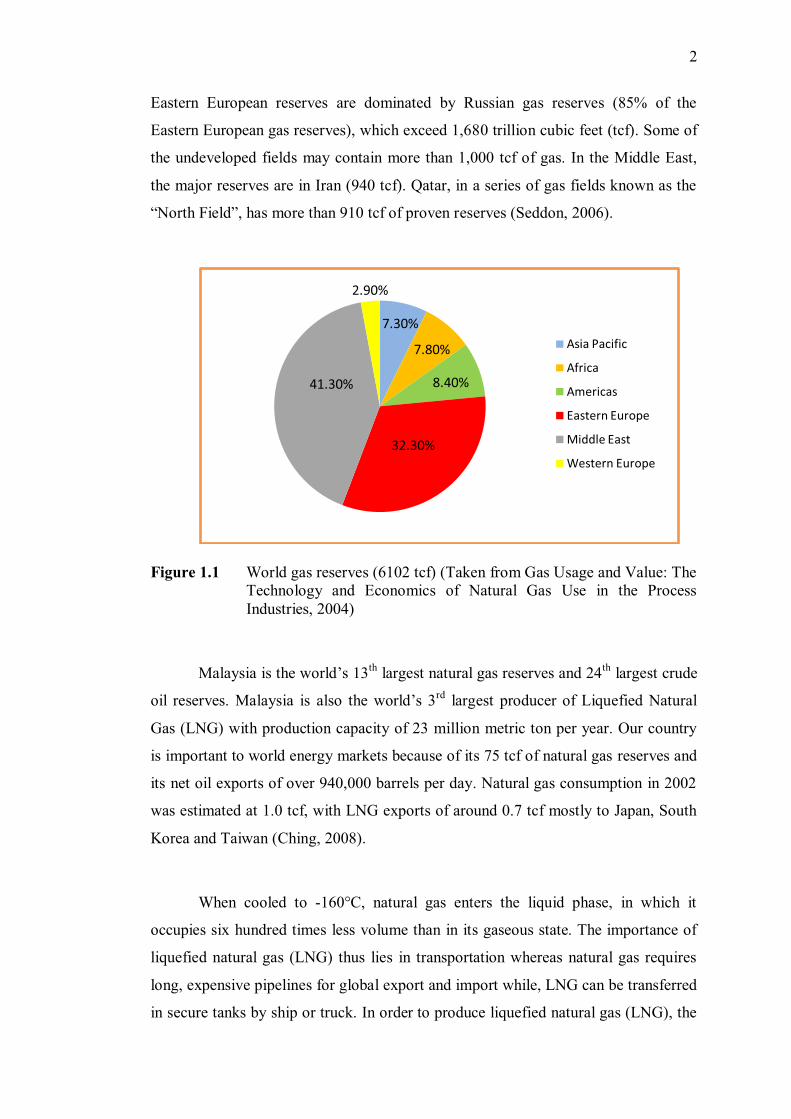
(James, 2007). Figure 1.1 shows natural gas reserves around the world. As illustrated
in the figure, most of the world supply is in Eastern Europe and the Middle East. The
2
Eastern European reserves are dominated by Russian gas reserves (85% of the
Eastern European gas reserves), which exceed 1,680 trillion cubic feet (tcf). Some of
the undeveloped fields may contain more than 1,000 tcf of gas. In the Middle East,
the major reserves are in Iran (940 tcf). Qatar, in a series of gas fields known as the
“North Field”, has more than 910 tcf of proven reserves (Seddon, 2006).
Figure 1.1 World gas reserves (6102 tcf) (Taken from Gas Usage and Value: The Technology and Economics of Natural Gas Use in the Process Industries, 2004)
Malaysia is the world’s 13th largest natural gas reserves and 24th largest crude
oil reserves. Malaysia is also the world’s 3rd largest producer of Liquefied Natural
Gas (LNG) with production capacity of 23 million metric ton per year. Our country
is important to world energy markets because of its 75 tcf of natural gas reserves and
its net oil exports of over 940,000 barrels per day. Natural gas consumption in 2002
was estimated at 1.0 tcf, with LNG exports of around 0.7 tcf mostly to Japan, South
Korea and Taiwan (Ching, 2008).
When cooled to -160°C, natural gas enters the liquid phase, in which it
occupies six hundred times less volume than in its gaseous state. The importance of
liquefied natural gas (LNG) thus lies in transportation whereas natural gas requires
long, expensive pipelines for global export and import while, LNG can be transferred
in secure tanks by ship or truck. In order to produce liquefied natural gas (LNG), the
7.30%
7.80%
8.40%
32.30%
41.30%
2.90%
Asia Pacific
Africa
Americas
Eastern Europe
Middle East
Western Europe

3
gas from offshore platform as the raw material needs to undergo various processes.
Using pipeline system, the gas will be channel to the onshore station where the
natural gas will undergo separation of acidic gas. This separation involved the
removal of toxic gases such as H2S and CO2. Technology used for liquefying natural
gas so that it can be transported in tankers is improving. As technology continues to
expand the options for gas transportation, demand for natural gas is expected to
grow.
Gas customers or end users, fall into three broad classes which are residential,
commercial and industrial. In addition, utilities and power suppliers use gas to
generate electricity and some fleets of vehicles use gas as a transportation fuel.
Figure 1.2 shows the domestic, commercial and industrial utilization of natural gas.
Homeowners and other residential customers use gas for heat, hot water, cooking and
cloth drying as well as in gas fireplaces and logs. Commercial businesses which
account for about 14% of gas consumption use gas mainly for heat and hot water.
Some larger buildings are also air-conditioned by gas powered equipment and many
restaurants use gas to cook. Industrial customers who represent about 44% of all gas
consumed use the fuel in tens of thousands of factories and mills to manufacture a
great variety of product, from paper to cars (Busby, 1999).
Figure 1.2 Domestic, commercial and industrial utilization of natural gas (Taken from Natural Gas in Non-Technical Language, 1999)
42%
14%
44%
0%
5%
10%
15%
20%
25%
30%
35%
40%
45%
50%
Domestic Commercial Industrial
4
This means that people tends to use more energy rather than conserve it
because demand is strongly affected by price. Future supplies of natural gas and
other limited energy resources will depend on how much energy we consume, how
much we attempt to preserve for future generations and how well we learn to develop
and use our remaining resources efficiently.
1.2 Acid Gas Treating Processes
Growing demand for natural gas is leading to an increase in the production of
standard and contaminated natural gas. Malaysia large reserves and the existence of
huge gas reserves in the nearby countries have ensured that natural gas is the future
energy resource for Malaysia (Md. Yasin, 1987). Malaysia also has one of the most
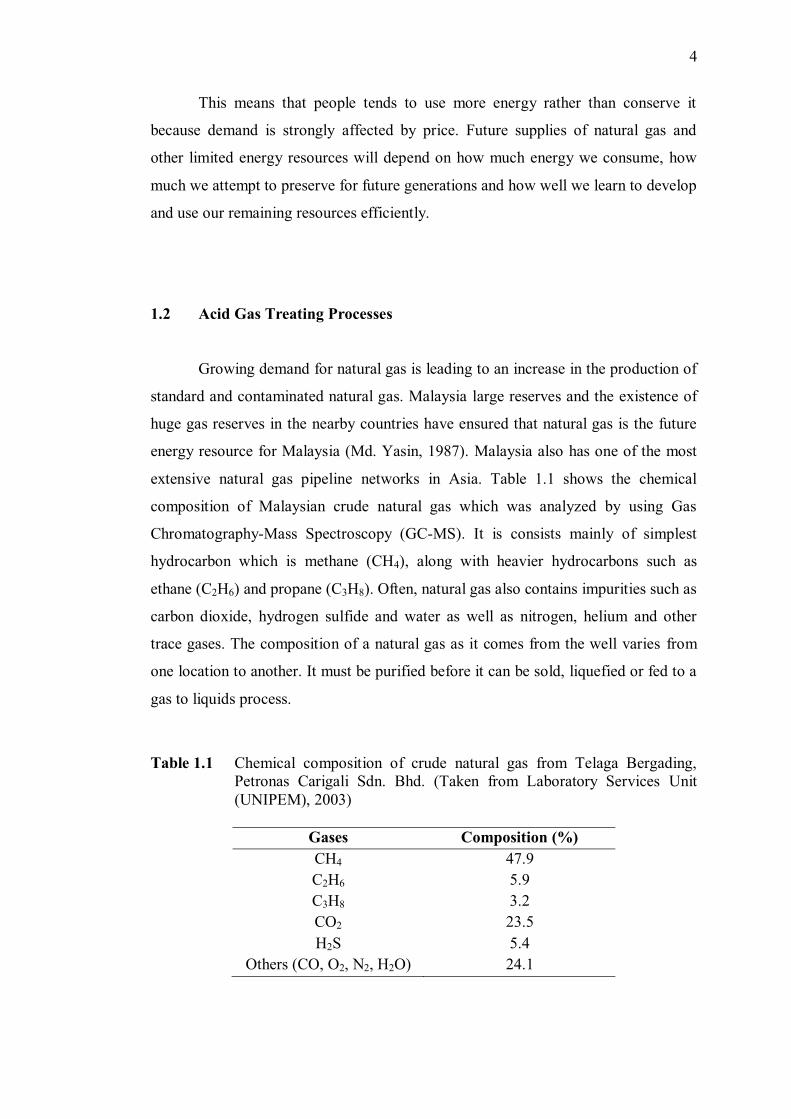
extensive natural gas pipeline networks in Asia. Table 1.1 shows the chemical
composition of Malaysian crude natural gas which was analyzed by using Gas
Chromatography-Mass Spectroscopy (GC-MS). It is consists mainly of simplest
hydrocarbon which is methane (CH4), along with heavier hydrocarbons such as
ethane (C2H6) and propane (C3H8). Often, natural gas also contains impurities such as
carbon dioxide, hydrogen sulfide and water as well as nitrogen, helium and other
trace gases. The composition of a natural gas as it comes from the well varies from
one location to another. It must be purified before it can be sold, liquefied or fed to a
gas to liquids process.
Table 1.1 Chemical composition of crude natural gas from Telaga Bergading, Petronas Carigali Sdn. Bhd. (Taken from Laboratory Services Unit (UNIPEM), 2003)
Gases Composition (%) CH4 47.9 C2H6 5.9 C3H8 3.2 CO2 23.5 H2S 5.4
Others (CO, O2, N2, H2O) 24.1
5
Gas processing is necessary to ensure that the natural gas intended for use is
clean-burning and environmentally acceptable. Natural gas used by consumers is
composed almost entirely of methane but natural gas that emerges from the reservoir
at the wellhead contains many components that need to be extracted. Although, the
processing of natural gas is less complicated rather than the processing and refining
of crude oil, it is equal and necessary before it can be used by end user.
One of the most important parts of gas processing is the removal of carbon
dioxide and hydrogen sulfide. The removal of acid gases (CO2, H2S and other sulfur
components) from natural gas is often referred to as gas sweetening process. There
are many acid gas treating processes available for removal of CO2 and H2S from
natural gas. These processes include Chemical solvents, Physical solvents,
Adsorption Processes Hybrid solvents and Physical separation (Membrane) (Kohl
and Nielsen, 1997).
According to previous research done by Hao et al. (2002), there are ways to
upgrading the low quality natural gas with selective polymer membranes. The
membrane processes were designed to reduce the concentrations of CO2 and H2S in
the natural gas to US pipeline specifications. However, this technique incurs high
cost and low selectivity towards toxic gas separation. This technique also needs
further development because the performance of membrane depends upon the
specific characteristics of flue gas composition, and the specific features of the
separation (i.e. large volumetric flow rate, low pressure source, high temperature, and
the relative low commodity value of H2S and CO2) (Rangwala, 1996).
Another method of H2S removal and one that leaves the CO2 in the natural
gas is called the Iron Sponge process. The disadvantage of this is that it is called a
batch-type function and is not easily adapted to continuous operating cycle. The Iron
Sponge is simply the process of passing the sour gas through a bed of wood chips
that have been impregnated with a special hydrated form of iron oxide that has a high
affinity for H2S. Regeneration of the bed incurs excessive maintenance and operating
costs, making this method inconsistent with an efficient operating program. If there
are any real advantages in using this process, it is a fact that CO2 remains in the gas,

6
thereby reducing the shrinkage factor which could be significant for very large
volumes with an otherwise high CO2 content (Curry, 1981).
Chemical absorption processes with aqueous alkanolamine solutions are used
for treating gas streams containing H2S and CO2. They offer good reactivity at low
cost and good flexibility in design and operation. However, depending on the
composition and operating conditions of the feed gas, different amines can be
selected to meet the product gas specification (Mokhatab et al., 2006). Some of the
commonly used alkanol-amine for absorption desulfurization are monoethanolamine
(MEA), diethanolamine (DEA), triethanolamine (TEA), diglycolamine (DGA), di-
isopropanolamine (DIPA) and methyldiethanolamine (MDEA). MDEA allows the
selective absorption of H2S in the presence of CO2 but can be use effectively to
remove CO2 from natural gas in present of additives (Salako and Gudmundsson,
2005).
On the other hand, CO2 and H2S can be removed from natural gas via
chemical conversion techniques. Catalysts for CO2 methanation had been extensively
studied because of their application in the conversion of CO2 gas to produce
methane, which is the major component in natural gas (Wan Abu Bakar et al.,
2008a). Usually, the catalysts were prepared from the metal oxide because of the
expensiveness of pure metal. This process can increase the purity and quality of the
natural gas without wasting the undesired components but fully used them to produce
high concentration of methane (Ching, 2008). Methane (CH4) gas was formed from
the reaction of hydrogen gas and carbon dioxide gas through methanation process by
reduction reaction as shown in Equation 1.1 below:-
CO2 (g) + 4H2 (g) → CH4 (g) + 2H2O (l) (1.1) This reaction is moderately exothermic, Ho = -165 kJ/mol. Meanwhile, H2S can also
be reduced to elemental sulfur simultaneously by oxidation reaction as in Equation
1.2 below:-
H2S (g) + ½ O2 (g) → S (s) + H2O (l) (1.2)

7
In order for this method to be effective, a suitable catalyst must be applied to
promote selective CO2 methanation because of the main side product under this
reaction also will be form (Eq. 1.3), which obviously should be avoided. Thus, high
selectivity of the catalyst in promoting CO2 methanation is paramount importance. In
Equation 1.3, carbon monoxide produced by this reaction can also be used to form
methane by reaction in Equation 1.4 with hydrogen.
CO2 (g) + H2 (g) → CO (g) + H2O (l) (1.3)
CO (g) + 3H2 (g) → CH4 (g) + H2O (l) (1.4)
Since the catalytic process through methanation and desulphurization
reactions offers the best way to remove CO2 and H2S in the natural gas, therefore, the
present study is to develop a catalyst based on nickel oxide with modifying the
dopants using noble metal in order to fully remove these sour gasses at high
conversion percentage possibly at low temperature.
1.3 Problem Statement
Carbon dioxide and hydrogen sulfide are commonly referred to as acid gases
because they form acids or acidic solution (corrosive compounds) in the presence of
water. These gases are generally undesirable components of natural gas. Natural gas
can contain up to 28% of H2S gas, consequently, it maybe an air pollutant near
petroleum refineries and in oil and gas extraction areas. H2S itself is colorless and
flammable gas. It smells like rotten eggs that is toxic at extremely low concentration
and can cause loss of the sense of smell. Inhalation of excessive levels of H2S gas in
confined space can result in unconsciousness, respiratory failure and death. It also
has potential to corrode pipelines, storage tanks and other ship component which
may cause operability problems including engine breakdown (Fred and Hans,1998).
Besides that, the removal of H2S gas from natural gas often necessary before
combustion. The combustion of natural gas in the presence of H2S yielded sulfur
dioxide which when dissolved in water turn to very corrosive sulfuric acid or
sulfurous acid. This may cause the acid rain phenomena to the earth which leads to

8
the increase of acidity of the soil and affect the chemical balance of lakes and
streams.
Carbon dioxide is also referred to as diluents because none of them burn and
thus they have no heating value. This gas is not very harmful and may actually be
used sometimes as “fillers” to reduce the heat content of the supply energy. Thus, its
removal may be required in some instances merely to increase the energy content of
the gas per unit volume. CO2 removal may also be required because it forms a
complex, CO2·CO2, which is quite corrosive in the presence of water. For gas being
sent to cryogenic plants, removal of CO2 may be necessary to prevent solidification
of the CO2 (Sanjay, 1987). Since the melting points of CO2 and H2S are higher than
the boiling point of methane, it can potentially freeze during the cryogenic process.
Freezing can lead to clogged LNG pipelines and storage vessels, producing various
maintenance issues and hindering overall process efficiency. Similar to the H2S gas,
CO2 in the presence of water may enhance the production of carbonic acid which
leads to the acid rain phenomena. Furthermore, carbon dioxide is one of the
greenhouse gases. As the level of carbon dioxide increases the warming of the earth’s
surface will also increase (Schneider, 1989). This phenomenon is called as
greenhouse effect thus, can cause global warming. However, if none of these
situations are encountered, there is no need to remove CO2.
The existence of both carbon dioxide and hydrogen sulphide will reduce the
quality of natural gas and at the same time increase the production cost of natural gas
to fulfill the US Pipeline Specification, in which, the natural gas should only consist
of 2 w/w % CO2 and 4 ppm H2S before it can be distributed to world market
(Echterhoff and McKee, 1991). These gaseous are needed to be removed in order to
prevent or minimize the release of hazardous gases into environment. This will helps
to reduce problems of acid rain, ozone layer depletion or greenhouse effect. Many
scientists believe that increasing levels of carbon dioxide in the earth’s atmosphere
will change the global climate.

9
1.4 Significant of Study
In this research, the potential catalyst that can be used to remove CO2 and
H2S simultaneously which are present in wet natural gas consisting of 23% CO2 and
5% H2S was developed based on nickel oxide doped with noble metal. This catalyst
offers very promising techniques for natural gas purification since H2S gas is being
converted to stable element of sulfur and unwanted CO2 gas is being converted to the
product, CH4 thus will enhance the methane production.
The purification technique via this catalyst can remove acid gases in wet
natural gas which is hazardous to the environment. This will help to prevent
phenomena of acid rain, ozone layer depletion or greenhouse effect. Besides, it may
be necessary to avoid the corrosion and clogging to the delivery pipeline. This
purification method will certainly improve the quality and quantity of Malaysian
natural gas and increase the market price of our natural gas that will benefit to our
country. The utmost important, the potential catalyst will contribute to the growth of
the national economy and create green and sustainable environment.
The catalyst is easily prepared, environmental friendly and reusable. All the
ingredients in the fabrication of the catalyst are easily available, cheap and stable.
The beauty of the catalyst is safer to handle because it can be used at low reaction
temperature. It requires minimum modification to the already existing system and
offers cost effective operating system.
1.5 Objectives of the Research
The main goal of this research is to develop the catalyst that can catalyze
methanation and desulfurization reactions effectively and simultaneously at a very
low temperature.

10
The objectives of this research are :-
1. To synthesize the best supported nickel oxide based for carbon dioxide
methanation and H2S desulphurization reactions.
2. To test the catalytic activity of the prepared catalysts by using in-house built
micro reactor coupled with FTIR.
3. To conduct several optimization parameters of the best prepared catalyst.
4. To characterize the best prepared catalysts in order to understand the physical
properties of the prepared catalyst.
1.6 Scope of the Research
A series of alumina supported catalyst based on nickel oxide doped with
noble metal were prepared using wetness impregnation techniques. Ruthenium
chloride, nitrate salts of rhodium, palladium and platinum had been used as precursor
for the dopants in this research. Meanwhile, catalytic testing was carried out by using
house-built micro reactor coupled with FTIR towards the prepared catalysts. The
production of methane gas was determined by Gas Chromatography analysis. All the
prepared catalysts were tested based on trial and error basis where different mixed
metal oxides with 90 wt% nickel loading were tested until the best performance
catalyst was obtained. Then, the best two prepared catalysts were optimized
according to the amount of nickel loading, different calcination temperatures of
catalysts, different calcination temperatures of alumina support, various support
materials and various preparation method. Lastly, the potential catalysts were tested
on its reproducibility and regeneration activity. The characterization of the potential
catalysts were conducted by various techniques in order to understand the physical
properties of the catalysts such as X-Ray Diffraction for bulk structure, Field
Emission Scanning Electron Microscope for morphology study, Energy Dispersive
X-Ray Analysis for elemental composition study, Nitrogen Adsorption for pore
texture and surface area of the catalyst. Meanwhile, Thermal Gravimetric Analysis to
study the mass loss of the catalyst during temperature change and Fourier Transform
Infrared Spectroscopy for the functional group study present in the catalyst.


