
Srei Infrastructure Finance Limited
Annual Report 2011-12
Invisible hand
Srei Infrastructure Finance Limited
Registered Office:
‘Vishwakarma’, 86C, Topsia Road (South)
Kolkata - 700 046
www.srei.com
Sre
i Infra
stru
ctu
re F
inance L
imite
dA
nnual R
ep
ort 2
011-1
2

Board of Directors
Salil K. GuptaChief Mentor
Hemant KanoriaChairman & Managing Director
Sunil KanoriaVice Chairman
Saud Ibne SiddiqueJoint Managing Director
V. H. Pandya
S. Rajagopal
Satish C. Jha
Shyamalendu Chatterjee
Sujitendra Krishna Deb
Chief Financial Officer
Sanjeev Sancheti
Company Secretary
Sandeep Lakhotia
Auditors
Messrs Haribhakti & Co.Chartered Accountants
Principal Banker
Axis Bank Limited
Audit Committee
Salil K. GuptaChairman
V. H. Pandya
S. Rajagopal
Sujitendra Krishna Deb
Shyamalendu Chatterjee
Sunil Kanoria
Sandeep LakhotiaSecretary
Compensation Committee
Salil K. GuptaChairman
Shyamalendu Chatterjee
Sujitendra Krishna Deb
Sunil Kanoria
Sandeep LakhotiaSecretary
Committee of Directors
Hemant KanoriaChairman
Sunil Kanoria
Saud Ibne Siddique
Sandeep LakhotiaSecretary
Share Transfer andInvestors’ RelationsCommittee
Salil K. GuptaChairman
Hemant Kanoria
Sunil Kanoria
Sandeep LakhotiaSecretary
Asset Liability ManagementCommittee
Sunil KanoriaChairman
Saud Ibne Siddique
Shyamalendu Chatterjee
Sanjeev Sancheti
Sandeep Lakhotia
S. B. TiwariSecretary
Central Credit and InvestmentCommittee
Hemant KanoriaChairman
Sunil Kanoria
Saud Ibne Siddique
Ganesh P. BagreeSecretary
Risk Committee
Shyamalendu ChatterjeeChairman
Saud Ibne Siddique
Sujitendra Krishna Deb
Ashwini Kumar Secretary
Registered Office
“Vishwakarma”
86C, Topsia Road (South)
Kolkata - 700 046
Tel: +91 33 6160 7734
Fax: +91 33 2285 7542 / 8501
Email: [email protected]
Website: www.srei.com
Contents
Corporate identity 04 CMD’s message 06 Vice Chairman’s message 10 Present everywhere 14 Protective action 16
Visible difference 18 Touch of growth 20 Adequate protection 22 Making people grow 24 Preferred partner 26
Touching lives. Reaching out 28 Group structure 30 Infrastructure report 31 Analysis of financial statements 40
Risk management 46 Directors’ profile 50 Directors’ report 52 Report on corporate governance 82
Shareholders’ information 91 Auditor’s report and financial statements 101 Consolidated financial statements 150
1 billion = 100 crore, 1 million = 10 lakh
All figures attributed to Srei are figures of Srei Consolidated unless otherwise stated.
Cautionary Statement
This report contains forward-looking statements, which may be identified by their use of words like ‘plans’, ‘expects’, ‘will’,
‘anticipates’, ‘believes’, ‘intends’, ‘projects’, ‘estimates’ or other words of similar meaning. All statements that address
expectations or projections about the future, including but not limited to statements about the Company’s strategy for
growth, product development, market position, expenditures and financial results, are forward looking statements.
Forward-looking statements are based on certain assumptions and expectations of future events. The Company cannot
guarantee that these assumptions and expectations are accurate or will be realised. The Company’s actual results,
performance or achievements could thus differ materially from those projected in any such forward looking statements.
The Company assumes no responsibility to publicly amend, modify or revise any forward looking statements, on the basis
of any subsequent developments, information or events.
Concept, content and design at [email protected]
print anderson 9831778971

The visible reality is a challengingperiod with moderate growth andstretched balance sheets.
The invisible reality is some selecthands working quietly to alleviatethe pain of their respectivestakeholders.
Srei Infrastructure Finance Limitedis one such Invisible Hand.Working quietly perseveringbehind the scenes.
Leveraging its scale, experience,spread, portfolio and alliances. To protect stakeholder interests on one hand and to reinforceoptimism on the other.
And in doing so, reporting betterbusiness growth than theprevailing industry average.

2
In a challenging 2011-12, most companiesworking in India’s infrastructure sectorreported weaker volume growth.
Srei strengthened revenues 49 per cent anddisbursals 49 per cent.
Annual Report 2011-12
3
Srei Infrastructure Finance Limited is different things todifferent people.
For some, Srei is a holistic infrastructure financialinstitution present in various business verticals.
For others, Srei is a national infrastructure driver, havingfinanced over `57,000 crore in infrastructure equipmentand projects over the last five years.
For some, Srei is a friend of entrepreneurs, helping themwith advice and funding the timely purchase of capitalequipment.
For others, Srei is a rural economy driver, building one ofthe largest global networks of wirelessly connected ITkiosks reaching around 30 crore rural Indians.
But for all, Srei is really the invisible hand.
Empowering entrepreneurs. Investing in relationships.Providing knowledge. Widening opportunities.Strengthening businesses.
Building the nation. Enhancing hope.
4
PedigreeEstablished in 1989 as a non-banking finance company
focused on growth coming out of India’s infrastructure
Headed by Hemant Kanoria (Chairman and Managing
Director), Sunil Kanoria (Vice Chairman) and Saud
Siddique (Joint Managing Director). Supported by a team
of experienced professionals
Some of the Institutions which have supported Srei:
FMO, UPS Capital, HSBC, ANZ Grindlays, DBS, Austrian
Development Bank, DEG and BIO
Presence Headquartered in Kolkata (India)
Present across the length and breadth of India with 198
offices; established two offices in Russia and one in
Germany
Securities listed on the Bombay Stock Exchange,
National Stock Exchange, Calcutta Stock Exchange and
London Stock Exchange (the first Indian NBFC to list
GDRs on this exchange)
VisionTo be the most inspiring global holistic infrastructure
institution
Mission To be an Indian multinational company providing
innovative integrated infrastructure solutions
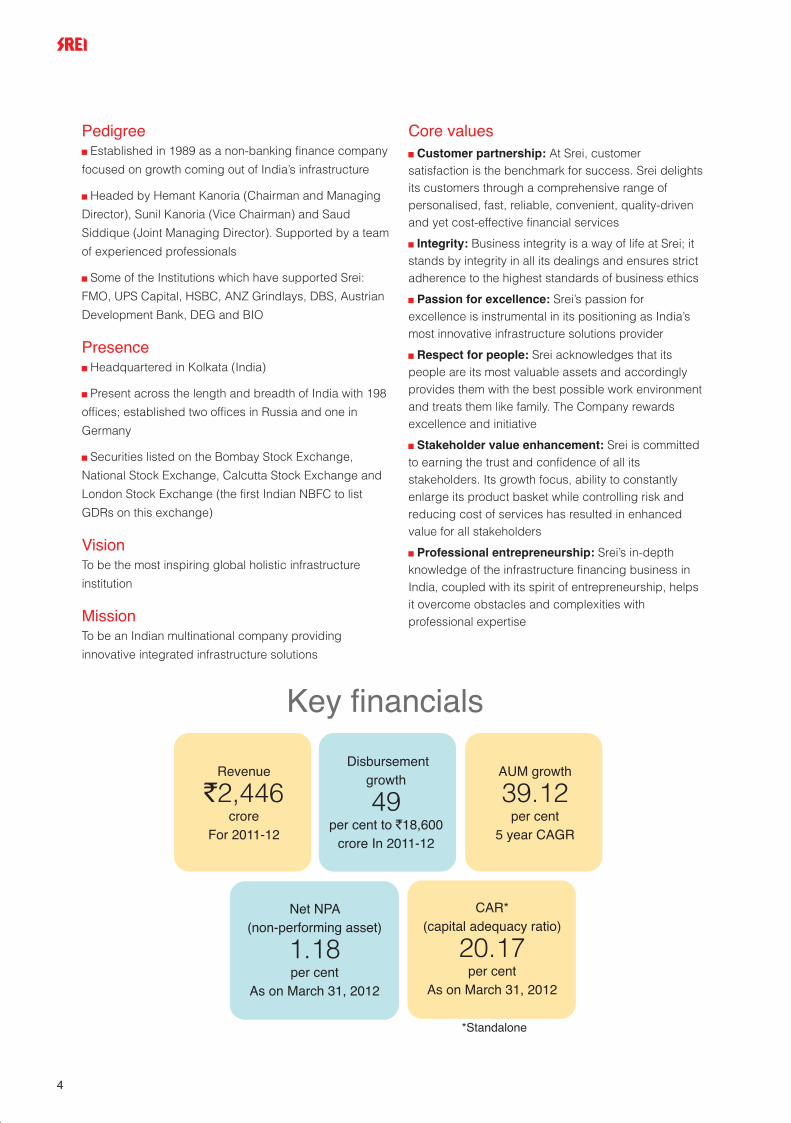
Key financials
Core valuesCustomer partnership: At Srei, customer
satisfaction is the benchmark for success. Srei delightsits customers through a comprehensive range ofpersonalised, fast, reliable, convenient, quality-drivenand yet cost-effective financial services
Integrity: Business integrity is a way of life at Srei; itstands by integrity in all its dealings and ensures strictadherence to the highest standards of business ethics
Passion for excellence: Srei’s passion forexcellence is instrumental in its positioning as India’smost innovative infrastructure solutions provider
Respect for people: Srei acknowledges that itspeople are its most valuable assets and accordinglyprovides them with the best possible work environmentand treats them like family. The Company rewardsexcellence and initiative
Stakeholder value enhancement: Srei is committedto earning the trust and confidence of all itsstakeholders. Its growth focus, ability to constantlyenlarge its product basket while controlling risk andreducing cost of services has resulted in enhancedvalue for all stakeholders
Professional entrepreneurship: Srei’s in-depthknowledge of the infrastructure financing business inIndia, coupled with its spirit of entrepreneurship, helpsit overcome obstacles and complexities withprofessional expertise
Revenue
`2,446crore
For 2011-12
Disbursement growth
49 per cent to `18,600
crore In 2011-12
AUM growth
39.12 per cent
5 year CAGR
CAR* (capital adequacy ratio)
20.17 per cent
As on March 31, 2012
Net NPA (non-performing asset)
1.18 per cent
As on March 31, 2012
*Standalone

Annual Report 2011-12
5
Infrastructure Business
Fund Based Fee Based Strategic Investments
TelecomInfrastructure
ProjectAdvisory
EquipmentFinancing
ProjectFinancing
InsuranceBroking
InvestmentBanking
Venture Capital /Fund Management
ProjectDevelopment
Transportation
Power
Rural ITInfrastructure
RentalsConstruction /
Oil & Gas
SEZ and IndustrialParks

6
Chairman and ManagingDirector’s message
Hemant Kanoria, Chairman and Managing Director, Srei Infrastructure Finance Limited

Annual Report 2011-12
7
The year 2011-12 has been quite
challenging, when we have witnessed
a good growth in disbursements, but
tardy growth in profits. It is only
because of our unique business
model of being a holistic infrastructure
institution that we have been able to
withstand the downturn in the
economy. Our business has therefore
been well insulated as our
infrastructure portfolio is well
diversified, both in terms of the
sectors and clients. The biggest
advantage for the Company has been
its deep understanding of the risks in
the sector and ways to mitigate it
which has been learnt over more than
two decades of arduous practice.
Economy outlookAccording to the Twelfth Five Year
Plan (2012-17) projections, it is
estimated that USD 200 billion is to be
invested annually in infrastructure, of
which 50 per cent is expected to
come from the private sector. Srei,
being one of the leading private
sector infrastructure institutions in the
country, is well positioned to
capitalise on this opportunity. With
over twenty three years of rich
experience, Srei has a pivotal role to
play in the coming years in driving the
infrastructure success story, in
partnership with its key stakeholders.
However, the macroeconomic
scenario, both in India and abroad, is
presently quite stressed. None of the
key economic indicators are
encouraging at this juncture. High
interest rate, plunging Index for
Industrial Production (IIP) figures,
slowing export demand, depreciating
rupee, unsustainable current account
deficit and rising fiscal deficit have all
resulted in a marked slowdown in
economic growth as reflected in
quarter-on-quarter declining GDP
growth. In FY12, Indian economy
could manage only 6.5 per cent GDP
growth, far below expectation.
Government’s policy paralysis has
further compounded the problem.
Over and above these, a crisis in the
Eurozone has been building up for
almost two years now. The US
economy, with high unemployment
and diminishing consumption
demand, is yet to recover from the
2008 crisis. As I write this, a sense of
déjà vu overwhelms me, as if I am
transported back to 2009, when world
over, governments in most countries
were prompt to come up with stimulus
packages that provided temporary
relief from the downturn. This time
around, the possibility of fresh
stimulus is less and it seems that
there is a lot of uncertainty amongst
leaders on the way forward.
Indian economy may remain trapped
in a low growth phase for some time.
However in spite of slowdown, during
the year under review, your Company
disbursed `18,600 crore and
registered almost a 50 per cent rise in
income from `1,638 crore in 2010-11
to `2,446 crore in 2011-12. The net
profits have fallen from `179 crore in
2010-11 to `112 crore in 2011-12,
which has been primarily due to
marked-to-market (MTM) losses on
account of foreign exchange, as
rupee suddenly depreciated sharply.
Though the exchange rate
movements were closely followed, the
magnitude and suddenness of the
rupee depreciation caught everyone
off-guard. The management is
constantly monitoring the movement
of rupee and adequate care is being
taken to ensure that minimum impact
is felt. During the year under review,
RBI has also been successively
increasing interest rates which have
created pressure on the Net Interest
Margin. The primary reason for RBI to
do so has been to bring down
inflation.
A closer look at our economy will
reveal that over the years inflation has
become a recurrent and persistent
problem in India, but the interesting
fact here is that almost every time,
inflation has been driven by supply-
side factors. So, to take care of
supply side constraints, massive
investment in infrastructure is the
need of the hour. It has been seen
that the higher interest rates and
depreciating rupee have had a
negative impact on the economy. It
has added ‘fuel to fire’ in a situation
where inflation remains uncontrolled
and growth rate has declined.
Therefore, it is necessary for the
government to act with alacrity, by
introducing policies and streamlining
processes which will accelerate
growth by creating an enabling
environment for investments in
infrastructure, industrial and services
sectors. The government would need
to work towards creating a more
investor-friendly environment by
promulgating laws so that

8
conceptualisation to implementation
of infrastructure projects can be
carried out expeditiously. We
sincerely believe that the private
sector needs to provide continuous
feedback to government and work
with them to evolve the regulatory
regime conducive for private sector
participation in infrastructure. To make
that happen, your Company has been
in regular dialogue with the
government and its various
departments, both at the Centre and
the State levels.
Company outlookHowever, I am quite pleased to state
that your Company has developed a
remarkable resilience and is always
able to bounce back enthusiastically
while facing any challenge. Srei has
maintained its market leadership in
infrastructure equipment financing
and has expanded its asset portfolio.
Besides financing information
technology (IT) and healthcare
equipment, we have also taken up
financing of logistics and rural
infrastructure equipment. In
equipment financing, we disbursed
over `12,170 crore in FY12, up from
`8,108 crore in FY11, growth of 50 per
cent. In addition, your Company has
expanded its project finance portfolio.
Under project financing, `6,261 crore
was disbursed in FY12 vis-à-vis
`4,389 crore in FY11, growth of 43 per
cent. In today’s scenario of scarce
liquidity and high cost of credit, the
only way to counter a fall in margins is
by expanding the volume of business.
But the management has been
The objective is to gear up for thefuture – enhance our efficiency, serveour customers better and to enhancevalue for stakeholders.

Annual Report 2011-12
9
extremely cautious about the selection
of projects and asset quality. One of
the key reasons for your Company’s
growth has been its strong ability to
manage risks. Every time an asset or
a project has been financed, starting
from asset quality and detailed project
evaluation to borrower profile; his
track record, order book and
competence - everything is subjected
to meticulous evaluation. In addition,
your Company follows stringent
provisioning norms for non-performing
assets (NPAs). Collective decision-
making in order to minimise chances
of error arising from individual
judgment has resulted in excellent
asset portfolio.
Our plans to replicate our business
model in other geographies apart
from Russia are still on. But keeping in
mind the global slowdown, we have
been looking at opportunities more
carefully. However, the groundwork in
terms of identifying prospective
markets, understanding the regulatory
and legal frameworks, suitable
partner-search in those markets, is in
progress. So that once the situation
improves, we will lose no time in
expanding our overseas operations.
Meanwhile, the Russian operations
have stabilised and are now on a
growth path.
Your Company’s unique Corporate
Social Responsibility (CSR) driven
business model, Srei Sahaj e-Village
Limited, which aims to bridge the
urban-rural digital divide, has been
scaling up its operations. Sahaj today
has 24,275 IT-enabled Common
Service Centres (CSCs), each run by
a Village Level Entrepreneur (VLE),
catering to around 300 million people
in the remotest of villages in six states
namely West Bengal, Assam, Odisha,
Bihar, Uttar Pradesh and Tamil Nadu.
These CSCs would provide a bouquet
of internet-driven services like
issuance of birth and death
certificates, registration of land
records, offering of insurance and
banking products, offering of e-
learning courses, railway ticket
booking, mobile recharges, utilities bill
collections and even training rural
youth to equip them for blue collar
employment. Sahaj empowers rural
youth and makes them self-reliant, but
its actual impact on the society is
transformational in nature as these
VLEs eventually evolve into job-
creators. The management remains
committed to this initiative as we
sincerely believe that this venture has
the potential to metamorphose the
socio-economic fabric of rural India.
The road aheadA slowdown provides an opportunity
to consolidate. We, at Srei, are trying
to capitalise on this by investing in the
training of our manpower and
upgrading our systems, technology
and processes. The objective is to
gear up for the future - enhance our
efficiency, serve our customers better
and to enhance value for
stakeholders. In the last few years, we
have embraced technology in a big
way to streamline our procedures.
Human intellect is our key resource for
pursuing a multi-dimensional growth
strategy. Apart from providing training,
your Company is continuously
engaged in a process of selective
recruitment for strategic positions.
Slowdown cannot last long, so we
must be ready when the opportunity
beckons.
To conclude, despite the gloomy
outlook globally, the infrastructure
space continues to hold tremendous
promise; we are sanguine to keep on
growing intelligently, learning,
adapting and performing. In addition,
having established a presence across
the entire life-cycle of any
infrastructure project, the
management will continuously strive
to evolve synergies so as to optimise
revenues from each project. Your
Company will do its best in mitigating
those risks which are within its control
and make suitable recommendations
to the government on the course of
policy action to be adopted.
Our country continues to be one of the
most promising investment
destinations in the world and we are
committed to making it
infrastructurally strong. Your support
and confidence continues to provide
us the strength and conviction.
Thank you.
Hemant Kanoria
Chairman &
Managing Director

10
Srei’s invisible hand continued to enhancevalue for its stakeholders during a visibleslowdown in the economy – a safeinsurance for the future.
Q: How would you evaluate the Companyʼsperformance in 2011-12?
The year 2011-12 was one of the most challenging that
we have faced in a long time. Our raw material (funds) cost
increased and it took time to pass this increase to customers.
The pace of growth of economy declined and there was a
danger that this would extend to our receivables.
It is markets like these that vindicate and validate the depth
of our business model. On one hand, the Indian economy
grew a shade under 7 per cent; during the last quarter of the
financial year, growth was the slowest in 29 quarters at 5.3
per cent. On the other hand, Srei grew its revenues by 49 per
cent.
Q: The big question: how did Srei outperformthe growth of the Indian economy andinfrastructure sector?
Over the years, Srei has consciously selected to broaden
its operating platform – to extend from fund to fee businesses
on the one hand and within each to extend itself across
sectors and spaces. We did this with the objective to
capitalise on any possible upturn in business across the
broad spread of the Indian economy: we were convinced that
if one segment of the Indian economy would be passing
through a period of sluggishness, there would be an
improvement in another, leading to stable, secure and
predictable growth. As it turned out, the strength of this
business model was demonstrated during the last financial
year when the entire Indian economy passed through a
slowdown: yet, Srei grew its income from fund-based
business by 63 per cent, more than compensating for de-
Sunil Kanoria, Vice Chairman, explains the challenges of2011-12 and how Srei was instrumental in strengtheningIndia’s infrastructure sector.

Annual Report 2011-12
11
growth in income in its fee-based
business.
Q: Is there any other factorthat helped Srei outperformits sectoral average?
There were a number of strategic
initiatives that insulated us relatively
from the full brunt of the slowdown.
We became selective about projects
we were engaged in. We appraised
the track record of promoters to
commission projects on schedule. We
scrutinised project fundamentals
closely to ascertain competitive
advantages. We sent our executives
into the marketplace to work closely
with customers and strengthen their
competitiveness. We leveraged this
customer proximity to protect our
receivables on one hand and
generate fresh business on the other.
We recognised that the most effective
way to beat the slowdown was by
altering our promotional schemes that
would make it easier for our
customers to procure equipment. A
number of these initiatives were
unseen and invisible but will surely
translate into attractive numbers over
the foreseeable future.
Q: How did Srei grow itsfund-based business 7.51times the growth rate of theIndian economy and 5.84times the growth rate of theIndian infrastructure sectorspend against the GDP?
In the equipment financing
business (which is a part of our fund-
based business), our disbursement
grew by over 50 per cent. The big
question: how did we outperform the
sectoral growth rate by a long shot?
The answer lies in a single word -
‘relationships’. We enjoyed
engagements with major original
equipment manufacturers (OEMs),
which meant that our customers had
more choices to select from. Our
close engagement with our customers
meant that we were the first lender to
be repaid as we occupied prime
share of our customer’s wallet space.
The bottom line was that we didn’t
hope and wait for the market to
recover; we immediately altered the
dynamics of our business. The result
of this closer engagement was that we
strengthened the business of our
customers, strengthening their
capability to repay us and the result
was that our receivables continued to
be timely and robust. I must also add
that when it came to the project
finance business, we were even more
cautious on account of its enhanced
risk exposure; we selected to work
with projects marked by relatively
lower risk and multiple exit routes.
Q: How did the fee-basedbusiness segment at Sreiperform?
The scenario for our fee-based
business segment was more
challenging than we envisaged for
some good reasons. This business
segment is largely driven by
government projects. However, with
the declining number of projects
getting launched and competition
intensifying, we were unable to meet
the target that we set for ourselves at
the beginning of the year. As a result,
growth in this segment was negative.
Q: In the last annual report,the Company madereferences to the possibilityof some of its strategicinvestments being divestedwith the objective to arrive atresponsible price discoveryand bring some cash backinto the Company.
Over the years, Srei has invested
`2,027 crore in the equity of various
infrastructure projects. It is our stated
objective to progressively encash a
part of this portfolio at various points
in time. However, we ran into a
challenging year that prevented this
from transpiring. Besides, the telecom
sector (where we have 79 per cent of
our strategic investments), went
through its own challenges, which
prevented us from encashing
attractive value. However, we must
assure our shareholders that the long-
term potential of each business
continues to be robust and holds out
prospects of attractive value
enhancement over the medium-term.
Q: How will you evaluateSreiʼs role in the Indianinfrastructure market?
Three things come to mind:
Endurance: Srei has been operating
in the Indian infrastructure sector for
the last 23 years. In a business
marked by mortality, where a number
of peers have since been assimilated

12
into other companies and where a
number of competitors have sold out,
we continue to grow our business.
Evolution: Srei has progressively
evolved from a loan provider to a
holistic financier - project financing,
equipment financing and equity
investments – which has helped
catalyse infrastructure creation in
India. Consider: Srei as an investor
has been involved in more than 5,412
lane km of road building, 587 MW of
thermal power plants, 40,403 telecom
towers and five oil rigs, among other
projects.
Relationships: Srei has evolved from
financier to consultant. Our role does
not end with disbursement; we help
customers deploy their assets, locate
alternative projects where the
equipment can be deployed during
lean periods and help sell the
equipment following project
completion. As a result, we don’t just
provide equipment; we provide the
power of relationships. So, much of
the value that we provide is below the
line and hence, invisible.
Q: Can you dwell on thepower of this invisiblecontribution?
As a Group, we have invested in
the broad sweep of India’s
infrastructure - roads, power, oil & gas
and telecom infrastructure, among
others. When mid-sized or small
companies found it difficult to raise
the necessary funds, Srei provided
the first round of capital in exchange
for a stake in the project to kickstart
the project. The recipient of funds
benefited from timely (at times before
schedule) project completion; Srei
benefited from an enhanced value of
its investment. This underplayed
invisible role is how Srei has been
strengthening the value of its balance
sheet.
Telecom infrastructure: Viom is India’s
largest independent passive telecom
infrastructure company with more than
40,400 towers and a high tenancy of
2.39x compared to the industry
average of 1.6x. Our towers cover all
22 circles in India. The invisible way in
which we innovated to spread the
concept of sharing of telecom towers
also resulted in lower telecom tariffs,
increasing the penetration of telecom
services.
Road projects: We selected to invest
in 5,412 lane km of roads with the
prospect of an attractive throughput.
The result is we make it possible for
large number of people and huge
quantity of freight traffic to move from
one point to another.
Power projects: We invested in power
generation and distribution. A large
number of people switch on light
without recognising Srei’s role.
Q: Do you think thechallenges will continue?
In the short-term, the outlook
appears challenging for the following
reasons:
Forex: This is something which is
beyond our control and we have to be
dependent on the market dynamics.
We did hedge some of our forex
exposure which was previously open,
which is expected to reduce the
impact. Though we need to account
for the exchange differences in our
quarterly results, actual significant
repayments will only start from 2014.
Liquidity: The rate increase by the
apex bank created a liquidity crunch,
prompting us to arrange alternative
options like borrowings from foreign
banks and financial institutions.
Customer growth: Despite the
challenging scenario, we expect to
grow our customer base primarily due
to the holistic relationships we enjoy,
graduating from a mere lender into a
partner.
Q: How will the infrastructuresector perform in 2012-13?
Despite a slowdown, the country reported anincrease in the number of infrastructureprojects in 2011-12. The pace of roadconstruction increased from 4.1 km between2006-07 and 2008-09 to 7 km a day between2009-10 and 2011-12.

Annual Report 2011-12
13
Despite a slowdown, the country
reported an increase in the number of
infrastructure projects in 2011-12. The
pace of road construction increased
from 4.1 km between 2006-07 and
2008-09 to 7 km a day between 2009-
10 and 2011-12. We continue to be
optimistic as the Planning Commission
has envisaged an investment of over
USD 1 trillion in the country’s
infrastructure during the Twelfth Five-
Year Plan (2012-17) with more than 50
per cent of this investment expected
from the private sector.
Q: What can theshareholders expect in 2012-13?
The start of the year has been
gloomy. Liquidity is yet to improve.
The funding cost is high; inflation is
deterring spending. The government
needs to take a firm stand on
regulatory changes.
In this environment, we will focus on
enhancing our business volume,
albeit cautiously, to set off a decline in
yields owing to enhanced funding
costs. We will focus on reducing our
cost-to-income ratio. We will focus on
receivables to reduce our NPA. By
doing these, we expect to add value
in a significant way.
Infrastructure gap
Infrastructure investment: India invested USD 50 billion (about 4.7 per cent of GDP) in infrastructure last year(2010-11) compared with Chinaʼs USD 635 billion (or close to 9 per cent of GDP).
Power: Chinaʼs effective power capacity is more than five times that of Indiaʼs. India suffered high losses intransmission and distribution, estimated at 27 per cent last year compared with less than 7 per cent for China.Average power consumption for a household in India is 40 per cent of that in China: 145 kwh per capita for Indiaversus 360 kwh per capita for China.
Six decades of infrastructure development in India and China
India China
Infrastructure Services 1951 1981 2011* 1952 1981 2011
Mobile Phones (million) − − 893.8 − − 986.3
Mobile Phone Density (per 100 people) − − 76.9 − − 73.2
Power Capacity (GW) 2.3 33.4 206.2 1.8 69.2 1,152.2
Power Generation (billion kwh) 6.6 129.2 865.8 7.2 8,309.3 3,695.9
Roads (1,000 km) 399.9 1,485.4 4,236.4 126.7 897.5 4,063.5
Rail Lines Route Length (km) 53,600 61,200 64,400 24,500 53,900 93,345
Electrified Tracks (km) 400 5,400 19,600 − 1,700 36,115
Rail Freight (billion-tonne-km) 44.1 158.5 626.5 .08 571 2,946.5
Rail Passenger (billion km) 66.5 208.6 978.5 .02 138.2 961.2
Sources and Notes: *2011 India data are for calendar year except when in italics. Indian data for 1951 and 1981 are in financial years.Indian data are from Economic Survey 2011-12 except telecom data are from Telecom Regulatory Authority of India.
Data for China are from China Online and Statistical Communique from Ministry of Statistics.
Italics represent data for latest available

14
Invisible hand.Present everywhere.
The road we drive on is being built by the public
agency that engaged the construction giant whose
on-site equipment was funded by Srei.
The mobile conversation we are engaged in is
carried by telecom towers connected to a switch that
is in turn connected to pan-Indian mobile towers
funded / owned by Srei.
The electricity that provides illumination for our
reading is generated by the power generating
company whose assets were funded by Srei.
Srei is everywhere. Srei is invisible.
Srei is not static; the Company commenced
operations with equipment financing, but
progressively evolved to a Holistic Infrastructure
Institution.
Srei doesn’t just fund projects; the Company
catalyses the growth of India’s infrastructure (power
projects, roads, hydel power plants, telecom towers
and equipment rentals, among others).
Srei doesn’t finance and forget; the Company
leverages enduring relationships that make it
possible for customers to protect their viability
across the project life-cycle.
Srei isn’t just another economic entity; it is a direct
proxy of India’s growth story.
Invisible hand alright. But evident everywhere.

Annual Report 2011-12
15
Infrastructure project financingSrei possessed the foresight to enter and grow its
presence in the infrastructure project financing business
in 1996, well before the country’s infrastructure boom
had started. What started out as a presence in a small
way in this segment, has now extended to a range of
infrastructure sectors (roads, power, ports, railways,
aviation, mining, telecom and gas, among others). The
project finance division had a loan book of `9,199 crore
as on March 31, 2012, which has grown at a high CAGR
of 132 per cent during the last five years.
Srei does not just provide funds; the Company leverages
its extensive sectoral and project life cycle experience to
advise entrepreneurs and companies on diverse
options, overall financial structure, project management,
business planning, among others – on how to structure
their projects with the objective to mitigate risks and
enhance sustainability. In providing this value-add over
most financial institutions, Srei extends beyond
supplying finance and provides something much more
valuable. A business-strengthening proposition. Yet
invisible.
Infrastructure equipment financingSrei retained its industry leadership position across two
decades in a challenging space marked by stiff
competition. Srei strengthened its business proposition
by entering into a joint venture with BNP Paribas,
France, for infrastructure equipment financing; this
resulted in fresh capital infusion on one hand and
extension into emerging financing segments like IT and
medical equipment on the other. The result: the business
reported a CAGR in revenues of 69 per cent in the five
years leading to 2011-12. BNP Paribas brought to this
relationship an experience and knowledge of having
worked in 40 countries. Effective. Yet invisible.
Fee-based businessSrei provided funds to industry and infrastructure service
providers for years. Thereafter, the company made a
significant extension in its business model; it moved into
fee-based business activities (project advisory, project
development, investment banking, venture capital &
fund management and insurance broking). This mix of
fund and fee-based services has helped the Company
provide value-added services across project life-cycles.
Friend, philosopher and guide. Yet invisible.
Strategic investment Srei evolved from financing to investing in infrastructure
companies. The Company also made strategic
investments in companies engaged in telecom networks,
transportation projects, power projects, equipment
banks and rural IT infrastructure. These investments
were about scale and competitiveness and were taking
forward India’s infrastructure growth agenda. The
investee companies comprised the largest independent
passive telecom infrastructure provider, one of the
largest IT solution providers in rural India, India’s one of
the largest equipment banks, one of India’s oldest power
utility companies and various road BOT SPVs. So, Srei’s
additional dimensions extend beyond infrastructure
equipment and project finance. Yet invisible.
Mentor Srei is more than a financial intermediary; it is a mentor.
The Company doesn’t just fund equipment purchase; it
leverages a rich industry exposure to more than 70
equipment brands to advise customers on what
equipment they should procure as per their requirement.
The right product selection translates into high
equipment uptime, relatively low business cost and
enhanced viability. Because of this ability to understand
terrains on one hand and equipment versatility on the
other, Srei is a preferred financier to partner with for a
number of equipment manufacturers entering India.
Positioned at the forefront when advising customers on
critical business-influencing decisions. Yet invisible.
Sreiʼs infrastructure involvement
5,412 lane km Roads
587 MW Power generation
14service providersTenants of Viomʼs
telecom towers
77 Number of
Infrastructure projectsfinanced(2011-12)
130 Number of projects
under Advisoryservices

16
Invisible hand.Protective action.
The Reserve Bank of India increased interest rates
13 times during 18 months till October 2011 to
control inflation. But in doing so, increased funding
costs for equipment and infrastructure projects while
draining liquidity from within the country.
Srei was not completely insulated from this impact.
The Company chose to absorb a part of this
increase in borrowing rates to keep funds costs
affordable for most of its customers. The result was a
decline in Srei’s Gross interest spread by 61 bps to
3.15 per cent in 2011-12. However, the company
countered this reality through an increase in
disbursements by 49 per cent to `18,600 crore while
protecting its net NPAs at 1.18 per cent, which, given
how most large projects in India (especially roads)
were questioned for their viability, was creditable.
Annual Report 2011-12
17
Even as its various initiatives were largely invisible to
external stakeholders, the company protected its
business through the following initiatives:
Alternative borrowing sources: Srei progressively
replaced bank finance with cost-competitive alternatives
like non-convertible debentures (NCDs). The Company
expects to borrow low cost long-term funds from foreign
commercial banks. The Company’s strong relationships
with its banking consortium enabled it to enhance
securitisation from `1,717 crore in 2010-11 to `4,334
crore in 2011-12 even as this business activity was
particularly stressed.
Asset-liability mismatch: There was constant endeavor
by the Company to source long term rightly priced funds
to ensure healthy asset liability profile. There was
scarcity of long term resources in India and liquidity in
the international market was also tight. Apart from Term
Borrowing from Banks, Debentures and External
Commercial Borrowings, the Company enjoys renewable
credit lines from the domestic banks. It is expected that
interest rate in India should come down gradually. The
Company aims to source more long term debentures
and ECBs in future to ensure healthy liquidity and assets
liability profile.
Forex management: The Company selected not to
hedge its existing unhedged foreign currency positions
to circumvent paying a large hedging premium and
because foreign currency loans are essentially long-term
in nature. Even as the Company was impacted
temporarily in the short-term due to marked-to-market
loss provisions, it expects that there will be minimum
impact in the longer term.
Infrastructure bonds: Srei’s classification as an
Infrastructure Finance Company (IFC) enabled it to
mobilise over 13,500 retail investors and tax-free bonds
worth `25 crore.
Result: Despite a challenging industry environment, Srei
recorded a gross interest spread of 3.15 per cent in
2011-12 and a capital adequacy ratio* of 20.17 per cent
in 2011-12 (RBI stipulation is 15 per cent).
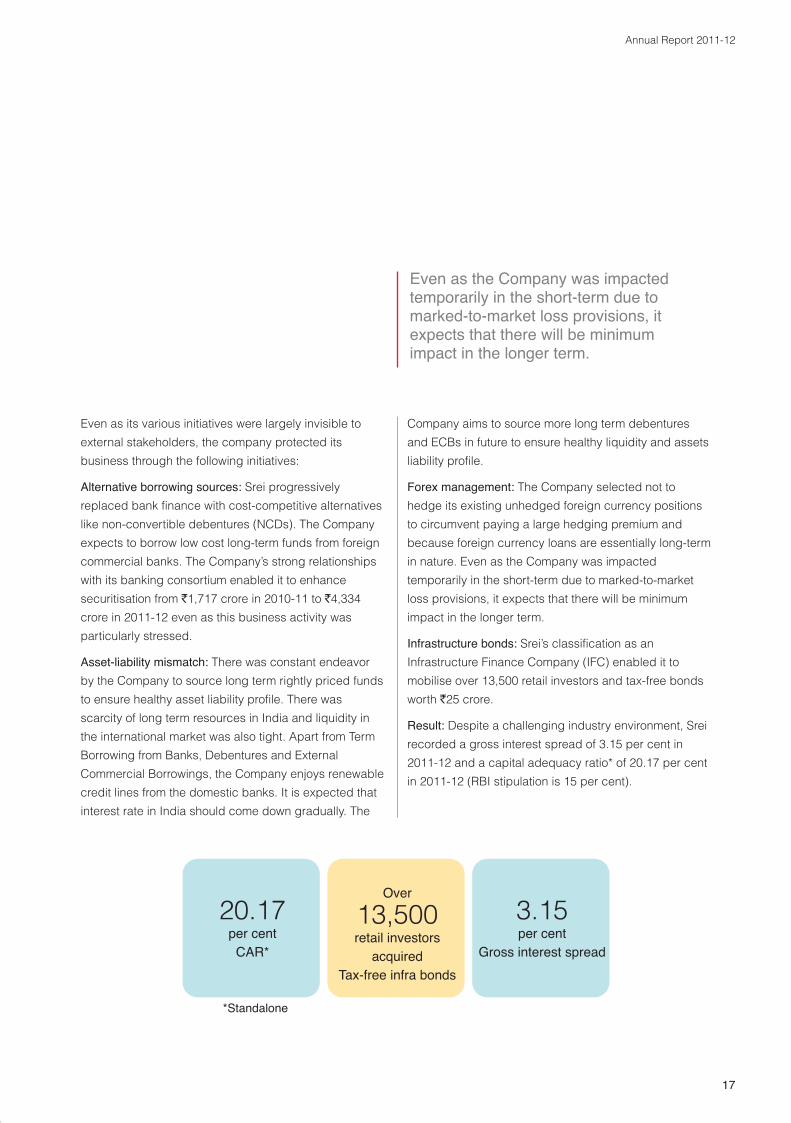
20.17 per cent
CAR*
Over
13,500retail investors
acquired Tax-free infra bonds
3.15per cent
Gross interest spread
Even as the Company was impactedtemporarily in the short-term due tomarked-to-market loss provisions, itexpects that there will be minimumimpact in the longer term.
*Standalone

18
Invisible hand.Visible difference.

Annual Report 2011-12
19
In 2011-12, there was a considerable slowdown in new
projects launched in India. Srei was not insulated from
this reality. Consequently, the Company’s advisory
business faced a decline in revenues. However, the
Company responded to this reality through various
counter-initiatives.
Technical focus: As projects declined and competition
increased, Srei’s advisory business focused on technical
parameters of bids, making project structures financially
competitive and scoring higher over peers.
Lean cost model: The advisory business engaged
affordable manpower even as it remained largely lean,
outsourcing most of its low-tech manpower requirement,
thus keeping the model variable and scalable.
Right sector: The Company appraised and funded viable
projects, growing disbursements by 49 per cent to
`18,600 crore in 2011-12. The Company has always
been prudent in selecting the industries to focus on; in
the last financial year, the Company selected to go slow
with projects in the oil & gas sector last year. However,
due to changed business environment and brightening
industry prospects, it is now optimistic of better
deployment of its rigs.
Court ruling: The Supreme Court’s cancellation of 122
2G licenses affected the industry’s viability. Despite this
challenging reality, Srei continued to offer innovative
solutions and maintained an average tenancy of 2.39x
for its telecom towers business compared to an industry
average of 1.6x. Its robust business model comprises
tower erection at one end and providing managed
services at the other, making it possible to extend a one-
off transaction into an ongoing relationship.
Result: Srei-partnered SPVs, bagged two toll projects
worth `1,473 crore and executed two projects in 2011-
12. Besides, the Company was awarded 36 advisory
services projects in 2011-12, emphasising the viability of
its business in a challenging environment.
Sreiʼs advisory business focused ontechnical parameters of bids, makingproject structures financially competitiveand scoring higher over peers.

20
Invisible hand.Touch of growth.

Annual Report 2011-12
21
India’s manufacturing sector grew a mere 3 per cent in
2011-12. The country’s GDP growth in the last quarter of
2011-12 was 5.3 per cent, its lowest in 29 quarters.
Despite this evident slowdown, Srei posted a 49 per
cent disbursement growth in 2011-12.
Srei’s higher disbursement capitalised on the Ministry of
Road Transport and Highways awarding projects for
6,500 km in 2011-12, compared with 5,083 km in 2010-
11. Now that the Ministry has set a target of 8,800 km for
2012-13, Srei aims at higher disbursement in the road
sector.
Srei capitalised on an improving reality through the
following initiatives:
Project selection: Srei selected projects following
through stringent scrutiny, covering project viability and
profitable exits.
Process management: Srei strengthened processes,
systems, credit policies and standard operating
procedures. So even as the Company enhanced
disbursals, net NPAs remained low at 1.18 per cent.
Value chain: Srei selected to be present across the
infrastructure value chain – countering challenges,
strengthening its risk understanding, diversifying and
improving revenue streams.
Reach: Srei’s 198 offices are strategically located across
India, accessing critical ground level information leading
to informed decisions. The Company leveraged its rich
experience to enter new geographies.
Result: Srei reported a CAGR of 34 per cent in
disbursements over the five years ending 2011-12.
34 per cent
Disbursement growth5-year CAGR
39.12 per cent
AUM growth 5-year CAGR
1.18 per centNet NPA
Do you know?
• When you commute on Delhi Gurgaon Expresswayor further on Delhi Jaipur Highway, major equipmentto build these were funded by Srei.
• The equipment to build Simhadri NTPC power plantwith a generation capacity of 2,000 MW was fundedby Srei.
• Companies like Punj Lloyd, Gannon and IVRCLwere financed for their equipment needs by Srei.

22
Invisible hand.Adequate protection.
In 2011-12, debt became dearer, new projects fewer
and the equipment finance market increasingly
competitive.
Even as Srei continued to lead this segment, it was
not completely unaffected. Srei BNP Paribas
countered the segment’s challenges with the singular
focus of strengthening its business in an uncertain
industry environment through the following initiatives:
Capital availability: The Company opted for cost-
effective fund mobilisation to enhance the adequate
availability of low-cost capital.
Rising interest rates: The Company provided
equipment finance around floating interest rates
leading to higher operational flexibility and interest
pass-through to customers. Besides, delinquency
was compensated by penalties. The Company
secured high-yield transactions, increased Srei
Benchmark Rate (SBR) collections and optimised the
borrowing mix, protecting its net interest margin.
Receivables management: The Company secured its
industry position with adequate property collateral,
made a timely exit from stressed accounts and
emphasised vigilance when funding retail small and
medium enterprises (SMEs).

Annual Report 2011-12
23
5New business
segments entered
18.5 per cent
Customer growth 5-year CAGR
`17,474 croreAUM
Relationships: Srei BNP Paribas introduced schemes
with equipment manufacturers to catalyse equipment
offtake.
Focusing on sunrise sectors: Srei BNP Paribas focused
on the following sunrise opportunities marked by
aggressive growth and attractive profitability:
Rural infrastructure (irrigation, transportation and
storage)
Pre-owned construction equipment, partnering
customers across the asset life-cycle
Logistics equipment with a focus on roads, railways
and ports
All Volvo brands (Volvo CE, Volvo Eicher CV, Volvo
buses and Volvo Penta engines) by engaging as an all-
India financier with Volvo Financial Services
Result: Srei BNP Paribas maintained its leadership as
the dominant infrastructure equipment financing
Company. Even as the broad industry segment grew
around 18 per cent, Srei BNP Paribas recorded a
revenue growth of 52 per cent and net profit growth of
51 per cent in 2011-12.
EXCON MeetDuring this meet, schemes like Asset Power
(pre-approved 100 per cent finance of a
particular brand for existing customers) and
Money Power (pre-approved vehicle loan for any
brand) were introduced.
The Company tied up with 19 manufacturers
and disbursed over `531 crore to finance 1,727
infrastructure and construction equipment.
OthersThe Khusiyo Ki Barish II (KKB-II) event
catalysed offtake during sluggish monsoons.
The Company participated in Cargo Transport
Logistic (CTL) exhibition, Mumbai.
Organised Milap 2011, inviting all prominent
manufacturers around the theme of ‘Together we
make tomorrow happen’.
Events

24
Invisible hand.Making people grow.

Annual Report 2011-12
25
The conventional practice in BOT road construction is
for the project concessionaire to commence
construction only following financial closure.
Srei partnered SPV has been awarded 14 road projects
covering more than 5,412 lane km.
As opposed to waiting for financial closure, the
Company leveraged its immediate access to bridge
financing to EPC contractors to support project SPV in
mobilisation of necessary resources in the project site
immediately. This strategy helped the Company save
nearly a year in financial negotiations and project
commencement, kickstarting a virtuous cycle that
benefited its contractors, sub-contractors, their
employees and the local community.
Besides, Srei partnered relatively small and medium
sized contractors possessing a deep understanding –
geographic and social – of the local terrain. In turn, Srei
assisted these contractors in their equipment financing
requirement. More importantly, Srei provided these
contractors their due credit and recognition in the
project, enhancing their sense of ownership.
The result of this unseen strategy of transforming
relatively unknown contractors into full-fledged project
owners is that Srei’s road construction projects are
implemented faster than usual, advancing BOT
revenues and accelerating payback.
Result: Of the 14 road construction projects allotted to
Srei, seven were completed, and the remaining are
under implementation as per schedule.
As opposed to waiting for financialclosure, Srei leveraged its immediateaccess to bridge financing to EPCcontractors to support project SPV inmobilisation of necessary resources inthe project site immediately.
Aiding our Customer Partners
Srei success story also includes how we have been able to help our customer partners in growing them and
helping them create a name for themselves in the industry.
Once a small time contractor, a customer partner from Rajasthan, today has some big contracts in his kitty,
thanks to our support.
A customer partner from Hyderabad was in a fiasco when his payment from agricultural sector jobs was not
coming through. We helped him to get work from one of our known contractors and today he is flourishing.
Another customer partner from Bhopal, who was just a small time contractor couple of years back, currently has
equipment worth crore of rupees with him and of which 70 per cent has been funded by us. He is today one of
the biggest players in Madhya Pradesh.

26
Invisible hand.Preferred partner.

Annual Report 2011-12
27
The conventional practice for intending international
equipment companies was to enter India, set up shop,
deploy people and hope for the best.
Following Srei’s experience, a number of these
international companies revised their strategy.
A number of these companies prefer to decode the
complexity of India through alliances with Srei. What is
generally well known about Srei is that it is the market
leader in equipment financing; what is not so well known
is that the Company has deployed executives across
198 offices in India; most of these locations are not
necessarily cities and towns but industrial hubs in semi-
urban locations; most of these executives visit their
customers and prospective clients periodically; their job
is to possess an updated insight into the business
models of their target audience; the objective is to
advise the use of specific equipment that can take
businesses ahead through enhanced uptime, efficiency,
terrain adaptability and superior price-value.
These alliances (more than 67) at the close of 2011-12
shrunk the learning curve for OEM multinational
companies (MNCs) entering India, helped them evolve
innovative schemes customised to the local terrain
during sectoral slowdowns, enabled them to generate a
quicker return on their investment and carve out market
shares quicker than they would otherwise have done
had they ventured alone.
Srei has deployed executives across 198offices in India; most of these locationsare not necessarily cities and towns butindustrial hubs in semi-urban locations.
Catalyst to growth of Manufacturer Partners
With a varied experience of more than 23 years, strong parentage and a huge customer base, we have been
able to help all our vendors in varied ways. We have helped them as a provider of funds, in growing their market
reach, in increasing their business numbers and with continuously supporting them with new ideas and
innovations.
Today we are proud to have a manufacturer partner retention ratio of 100 per cent with more and more vendors
willing to directly associate with us. All our vendors enjoy high volumes and deal with all major product line.
Strong customer relationship has helped manufacturers in building and developing themselves to suit their own
requirements.
Further we also help them in financial closure with Bid-Bond guarantee, Performance guarantee, Rentalisation
guarantee and their Working Capital requirements and equipment purchase.

28
Invisible hand.Touching lives.Reaching out.
At Srei, corporate social responsibility extends beyond
helping individuals and institutions. We embrace it as a
way of doing business rather than looking at it as an
annual exercise.
Our presence as a key player in the infrastructure space
emphasises our socio-economic accountability towards
society. The result is an invisible hand extending beyond
mere profit-seeking, towards holistic societal
improvement.
We are making little difference to society through “Srei
Foundation”.
The Foundation’s social and economic upliftment
initiative is structured around three major areas
comprising education, healthcare and wellness. Besides
these, the Foundation draws social attention to our rich
spiritual heritage and to imbibe right value system
through the ‘World Confluence of Humanity, Power and
Spirituality’. Aptly called ‘Enlightenment, a journey -
through service’, this unique event has been bringing
together spiritual leaders of diverse faiths for the last
three years.
Serving the role of an invisible hand rejuvenating souls
for the better..across the globe.
To replenish mother earth’s resources is our only hope
for survival. Our businesses have internalised this and
have been engaging in such activities.

Annual Report 2011-12
29
Quippo Construction silently helped the cause of nature
by lending a backhoe loader from its equipment bank to
help clean the Santragachi Jheel, West Bengal’s largest
lake and home for migratory birds. Our assistance
helped decongest the lake by over 25 per cent, ensuring
visit of more than 6,000 migratory birds thereafter.
Our telecom business observed ‘World Environment
Day’ by undertaking a massive pan-India tree plantation
exercise. The power vertical attempted to create
pollution-free surroundings by planting trees along the
road side connecting NH-2 highway and Neamatpur.
Srei’s environmental and social policy reinforces its
commitment to sustainable development and has
embedded the philosophy within core business process
thus creating Environmental and Social Management
System (ESMS). This policy forbids us to invest in
projects with an adverse environmental impact.
We have extended our efforts to reach the deprived
social segment also. We have partnered with The
Friends Foundation of Asia, an NGO, to provide shelter
to the homeless and medical care for the ill, especially
those suffering from cancer. We have supported World
Wildlife Fund India (country's largest voluntary body in
the field of conservation) to conserve the Gangetic
dolphins in six districts of West Bengal.
We inculcated a sense of responsibility in our employees
by practicing ways to reduce the wasteful consumption
of electricity. Distribution of paper carriers and seeds
was initiated in the telecom offices. A similar initiative,
Project Akshar: putting drop-boxes to collect discarded
paper and converting them to extremely affordable, eco-
friendly notebooks for children, was implemented at Srei,
Delhi office.
We took responsibility of two schools at Santoshpur and
Birati at Kolkata with over 600 students from class UKG
to X. These schools provide quality English medium
education to the children from the surrounding
underprivileged backgrounds. Our efforts are inspired
by the objective of nurturing the young souls through
facilitation of better education and preparing them for
creating a better tomorrow.
Along with other institutions, we have promoted the
Institute for Inspiration and Self Development (IISD).
Together with AOC International, IISD has undertaken a
number of educational and training initiatives in West
Bengal. The Company has supported the children of
employees, of the contractor workers and other needy
children with education and scholarship schemes.
We developed a CSR-driven model through Srei Sahaj
attempting to bridge the urban-rural digital divide by
leveraging technology in providing digital services to
remote villages. In the process, we have created a
network of Village Level Entrepreneurs (VLEs) who are
essentially empowered rural youth, now self-reliant and
capable of creating new jobs. In this network are a good
number of women VLEs, most of them being
housewives.
The Bill & Melinda Gates Foundation showed interest in
our Srei Sahaj e-Village programme with a common
objective of creating employment opportunities for the
rural masses by empowering Village Level
Entrepreneurs (VLEs).
Srei Foundation has conducted counseling sessions and
medical camps to promote general health and well-
being through family support programmes. Human
beings are mortal but we can turn the 'end of a life' to a
new beginning for other lives. In partnership with a
reputed NGO, we are enhancing awareness on organ
donation among our own employees. We also routinely
sponsor and participate in the Walkathon.
Our journey has just begun. Srei looks forward to being
proactively engaged with employees, customers and
communities – the invisible hand addressing humanity
through responsible corporate citizenship.

30
Group structure
Subsidiaries*
Sub-subsidiaries**
Joint Ventures***
Srei Capital Markets Ltd.
Srei Venture Capital Ltd.
Srei InfrastructureAdvisors Ltd.
Srei Sahaj e-Village Ltd.
IIS InternationalInfrastructure
Services GmbH,Germany
Global InvestmentTrust Ltd.
Srei InsuranceBroking Pvt. Ltd.
Bengal SreiInfrastructure
Development Ltd.(JV with WBIDC)
Srei EquipmentFinance Pvt. Ltd.
(Srei BNP Paribas Lease
Group JV )
Zao Srei Leasing, Russia
HyderabadInformation
Technology VentureEnterprises Ltd.
CyberabadTrustee
Company Pvt.Ltd.
Srei AdvisorsPTE. Ltd.,Singapore
Quippo Valuers &Auctioneers Pvt.
Ltd.
QuippoConstruction
Equipment Ltd.
Quippo Oil & GasInfrastructure Ltd.
Quippo Energy Pvt. Ltd.
Mumbai FuturisticEconomic Zone
Pvt. Ltd.
*Other Subsidiaries are Srei Forex
Ltd., Controlla Electrotech Pvt. Ltd.,
Srei Mutual Fund Asset Management
Pvt. Ltd. and Srei Mutual Fund Trust
Pvt. Ltd.
**Other Sub-subsidiaries are Quippo
Prakash Marine Holdings Pte. Ltd.
(Singapore), Quippo Prakash Pte. Ltd.
(Singapore), Quippo Energy Middle
East Ltd. (Dubai), Quippo Energy
Yemen Ltd. (Yemen), Quippo Energy
Nigeria Pvt. Ltd. (Nigeria) and Quippo
Mauritius Pvt. Ltd. (Mauritius).
***Other Joint Ventures are SICOM
Srei Maharashtra Infrastructure Pvt.
Ltd., NAC Infrastructure Equipment
Ltd., Srei (Mauritius) Infrastructure
Development Company Ltd. and Aalat
LLC (Abu Dhabi).
Srei Infrastructure Finance Ltd.

Annual Report 2011-12
31
The Eleventh Five Year Plan (2007-12) emphasised the need
for massive expansion in infrastructure investment based on
a combination of public and private investment, the latter
through various forms of public-private partnerships (PPPs).
Substantial progress has been made in this respect. The
total infrastructure investment is estimated to have increased
from 5.7 per cent of GDP in the base year of the Eleventh
Plan to around 8 per cent in the last year of the Plan. A large
number of PPP projects have taken off, and many of them
are currently operational in both the Centre and the states.
The Twelfth Plan is expected to continue catalysing the pace
of infrastructure investment, as this is critical for sustaining
and accelerating growth. During the Twelfth Plan period
(2012-17), infrastructure investment will go up to `50 lakh
crore. It is expected that around 50 per cent of these
investments will originate from the private sector.
Budget 2011-12To meet the huge financing needs for infrastructure
projects, the first Infrastructure Debt Fund with an initial size
of `80 billion was launched in March 2012. In the current
year, tax free bonds worth `600 billion are proposed to be
issued through government undertakings. These include
`100 billion each for National Highway Authority of India
(NHAI), Indian Railways Finance Corporation (IRFC), India
Infrastructure Finance Company Ltd. (IIFCL) and the power
sector, besides `50 billion each for Housing and Urban
Development Corporation Ltd. (HUDCO), National Housing
Bank (NHB), Small Industries Development Bank of India
(SIDBI) and ports. The salient proposals for the
infrastructure sector in the Budget 2012-13 have been
listed below:–
To add sectors such as irrigation (including dams,
channels and embankments), terminal markets, common
infrastructure in agriculture markets, soil testing laboratories
and capital investment in fertiliser sector as eligible sectors
for Viability Gap Funding (VGF) under the scheme to
support PPP in infrastructure. Oil and gas / LNG storage
facilities and oil and gas pipelines, fixed network for
telecommunication and telecommunication towers will also
be made eligible sectors for VGF
To facilitate sectors such as power, airlines, roads and
bridges, port and shipyards, affordable housing, fertiliser
and dams in raising overseas funds, rate of withholding tax
on interest payment on external commercial borrowings
(ECBs) was reduced from 20 per cent to 5 per cent for
three years
IIFCL has put in place a structure for credit enhancement
and take-out finance to ease credit access to infrastructure
projects
Rationalisation of dividend distribution tax to remove its
cascading effect in a multi-tier corporate structure
To enhance the allocation under Rural Infrastructure
Development Fund (RIDF) to `200 billion with `50 billion
exclusively earmarked to create warehousing facilities
Sources :
http://media2.intoday.in/indiatoday/images/budgeteng2012-b.pdf
http://indiamicrofinance.com/wp-content/uploads/2011/09/12th-
Plan-India-draft-approach.pdf
Infrastructure Report

32
India has a road network of over 4.32 million km. Around 85
per cent of passenger traffic and 65 per cent of freight
traffic is carried by the countries roads. India has less than
4 km of roads per 1,000 people, including all its paved and
unpaved roads. In terms of roads, which are motorable
throughout the year or four or more lane highways, India
had less than 0.07 km of highways per 1,000 people as of
2010.
Although National Highways (NH) account for only 1.7 per
cent of the road network, they carry 40 per cent of the total
road traffic. The total length of National Highways are
70,934 km, of which about 26 per cent is still single-laned,
51 per cent is double-laned and only 23 per cent is four /
six / eight-laned.
India’s road sector needs investments of USD 120 billion
over the next five years. The National Highway
Development Programme (NHDP) involves a total
investment of USD 60 billion on concessions / contracts to
be awarded by 2012. Under NHDP, about 15,000 km is
completed and about 10,000 km is under construction.
Over the next three years, it is proposed to take up new
sections of about 25,000 km, through a combination of PPP
and EPC (Engineering Procurement and Construction).
However, India expects another 3,530 km of expressways
to come up by 2014 from the projects under construction.
The government has drawn up an ambitious target to lay
18,637 km network of new expressways by 2022.
Budget 2012-13Target to cover a length of 8,800 km under NHDP during
FY 2012-13
Allocation to the Road Transport and Highways Ministry
enhanced by 14 per cent to `253.6 billion
ECB allowed for capital expenditure on the maintenance
and operations of toll systems for roads and highways, if
they are part of the original project
NHAI to raise `100 billion in 2012-13 through tax-free
bonds
Announced IDF, increased FII investment and lowered
withholding tax
Support of `240 billion for rural roads under Pradhan
Mantri Gram Sadak Yojna for 2012-13, an increase of 20
per cent over the previous year
Full exemption from import duty on specified equipment
imported on road construction by contractors of Ministry of
Road Transport and Highways, NHAI and State
governments is being extended to contracts awarded by
metropolitan development authorities. Tunnel boring
machines and parts of their assembly are covered by this
exemption. These are allowed to be imported duty-free and
without end-use conditions
Government policy and initiatives100 per cent FDI under automatic route in all road
development projects including support services to land
transport like operating highway bridges, toll roads,
vehicular tunnels and services incidental to land transport
like cargo handling, construction and maintenance of roads
and bridges
Full income tax exemption for a period of 10 years
including highway widening projects
Formulation of Model Concession Agreement
IIFCL to provide viability gap funding up to 40 per cent of
project cost (entire amount to be made available during
construction phase)
Concession period allowed up to 30 years
Sources :
http://media2.intoday.in/indiatoday/images/budgeteng2012-b.pdf
Between 2006-07 and 2008-09, NHAI constructed
4,522 km of highways which increased to 7,758 km
between 2009-10 and 2011-12. The pace increased
from building 4.1 km a day in the first three-year phase
to 7 km a day in the subsequent three-year phase.
Growing pace
Roads

Annual Report 2011-12
33
Indian Railways has a route network of about 64,000 km
spread across 7,083 stations and operating around 19,000
trains daily. Over 23 million passengers travel by trains and
around 2.65 million tonnes (MT) of freight is transported by
trains on a daily basis.
The government increased the scope of PPP beyond
providing maintenance and other such services. The
government is providing new lines and increasing the
rolling stock to build up capacity. The government is
investing in building rail infrastructure in the country. With
increasing participation expected from private players –
both domestic and foreign – freight traffic is expected to
grow rapidly over the medium to longterm. The Indian
Railways has set a target of achieving a freight market
share of 50 per cent by 2030 from 30 per cent in 2010.
Additionally, Ministry of Railways proposes to develop 50
world-class stations in the PPP mode to improve and
enhance railway infrastructure in the country.
Indian Railways’ Mission 2020 aims at adding 25,000 route
km to the railway network and increase the scope of PPP in
railway projects.
Budget 2012-13Highest ever Plan outlay of `601 billion
725 km new lines, 700 km doubling, 800 km gauge
conversion and 1,100 km electrification targeted in 2012-13
`68.72 billion provided for new lines, `33.93 billion for
doubling, `19.5 billion for gauge conversion and `8.28
billion for electrification
IRFC Ltd. allowed `100 billion in 2012-13 through tax-free
bonds
Government policy and initiativesSpecial task force to be set up to clear investment
proposals within 100 days
31 projects covering a length of more than 5,000 km in 10
states being executed with contributions from state
governments
Private sector involvement encouraged in building
healthcare and educational institutes, commercial
complexes, cold storages, among others on railway land to
create new revenue streams
Private operators allowed to run special freight trains
RailTel created 37,000 route km long optic fibre cable
(OFC)-based communication infrastructure to improve
Indian Railway’s communication and safety systems
The OFC network, of which 26,650 route km is of high
bandwidth capacity, can also be commercially exploited
Sources: http://www.ibef.org/
http://indiabudget.nic.in/ub2012-13/eb/po.pdf
http://media2.intoday.in/indiatoday/images/budgeteng2012-b.pdf
Railways

34
The long Indian coastline spanning around 7,500 km is
serviced by 13 major ports and 200 non-major ports. India's
ports handle more than 95 per cent of the country's total trade
in terms of volume and about 70 per cent in terms of value.
As per Shipping Ministry’s Vision 2020, the traffic at major
ports is likely to touch 1,215 MT by 2019-20 and 1,280 MT
for non-major ports. Thus, the anticipated traffic at Indian
ports will be 2,495 MT by 2019-20 from the 2009-10 level of
850 MT registering a decadal CAGR of 11.32 per cent.
Rapid growth in traffic resulted in major ports operating at a
capacity utilisation of more than 90 per cent thereby
resulting in congestion, high berth occupancy and lengthier
turnaround time for vessels. For efficient port operations, 70
per cent capacity utilisation is considered to be optimum.
India announced a combined USD 110 billion package to
develop its ports and shipbuilding industry by 2020. The
ten-year plan, known as Maritime Agenda 2010-2020,
intends to develop the Indian ports capacity to 3,200 MT by
2020. This Plan will replace the existing National Maritime
Development Programme (NMDP).
The goals of the new Plan are as follows:
To create a port capacity of around 3,200 MT to handle
the expected traffic of about 2,500 MT by 2020
To bring ports at par with the best international ports in
terms of performance and capacity
To increase the tonnage under the Indian flag and Indian
control and also the share of Indian ships in our EXIM trade
To increase India’s share in global ship building to 5 per
cent from the present 1 per cent
To increase the share of Indian seafarers from 6-7 per
cent to at least 9 per cent in the global shipping industry by
2015
Budget 2012-13The reduction in withholding tax from 20 per cent to 5 per
cent on ECB related payments will help ports raise low-cost
foreign debt
Ports allowed to raise `50 billion through tax-free bonds
The Economic Survey FY12 pointed out that a major
chunk of investment in the port sector is expected to come
through the PPP mode. It also added that capacity
expansion of ports in the 12th Plan is proposed largely
through private sector investment and internal accruals
Government policy and initiatives100 per cent FDI permitted for port projects (all areas of
operation) under automatic route
Full income tax exemption for a period of 10 years
Model Concession Agreements have been standardised
and simplified
Standardisation of bidding documents to ensure
uniformity and transparency in award of projects
TAMP regulates the ceiling for tariffs charged at major
ports
Autonomy given to non-major ports to set their own tariffs
led to a healthy growth in traffic and also greater private
sector investment
Private sector allowed to construct cargo-handling berths
and dry docks, container terminals, warehouses and ship-
repair facilities on BOT basis
Sources:
http://media2.intoday.in/indiatoday/images/budgeteng2012-b.pdf
Ports
Annual Report 2011-12
35
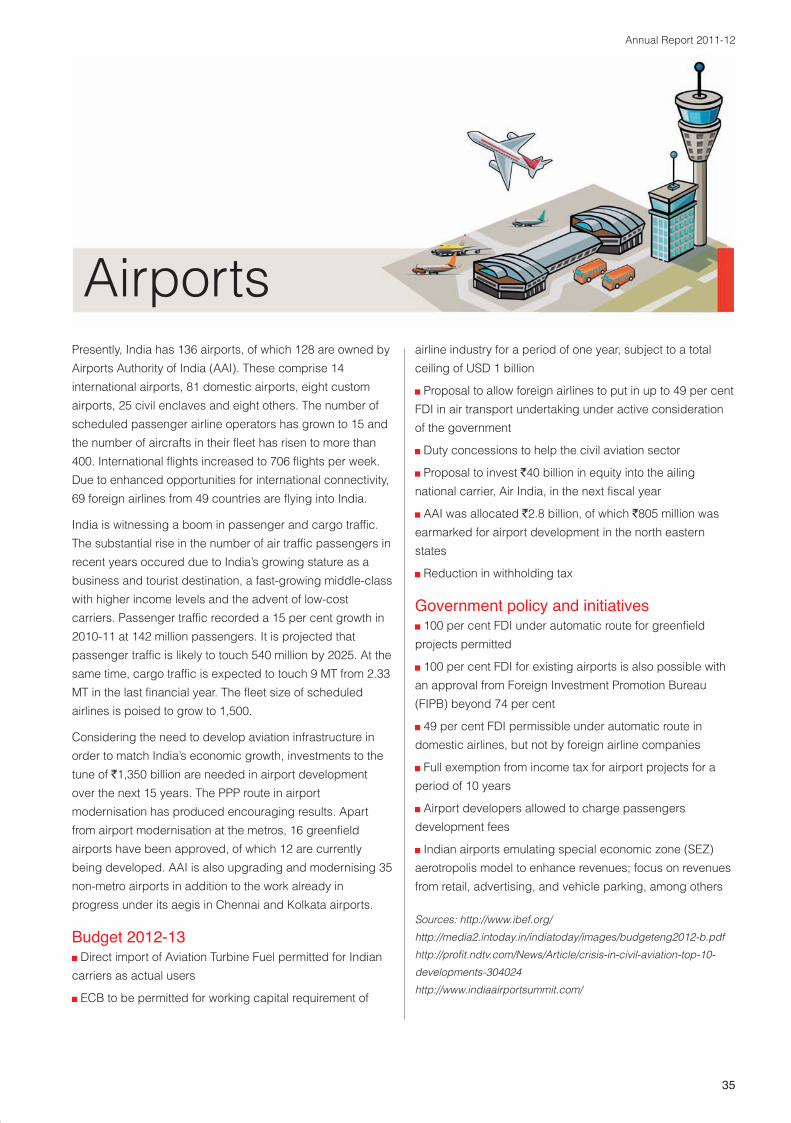
Presently, India has 136 airports, of which 128 are owned by
Airports Authority of India (AAI). These comprise 14
international airports, 81 domestic airports, eight custom
airports, 25 civil enclaves and eight others. The number of
scheduled passenger airline operators has grown to 15 and
the number of aircrafts in their fleet has risen to more than
400. International flights increased to 706 flights per week.
Due to enhanced opportunities for international connectivity,
69 foreign airlines from 49 countries are flying into India.
India is witnessing a boom in passenger and cargo traffic.
The substantial rise in the number of air traffic passengers in
recent years occured due to India’s growing stature as a
business and tourist destination, a fast-growing middle-class
with higher income levels and the advent of low-cost
carriers. Passenger traffic recorded a 15 per cent growth in
2010-11 at 142 million passengers. It is projected that
passenger traffic is likely to touch 540 million by 2025. At the
same time, cargo traffic is expected to touch 9 MT from 2.33
MT in the last financial year. The fleet size of scheduled
airlines is poised to grow to 1,500.
Considering the need to develop aviation infrastructure in
order to match India’s economic growth, investments to the
tune of `1,350 billion are needed in airport development
over the next 15 years. The PPP route in airport
modernisation has produced encouraging results. Apart
from airport modernisation at the metros, 16 greenfield
airports have been approved, of which 12 are currently
being developed. AAI is also upgrading and modernising 35
non-metro airports in addition to the work already in
progress under its aegis in Chennai and Kolkata airports.
Budget 2012-13Direct import of Aviation Turbine Fuel permitted for Indian
carriers as actual users
ECB to be permitted for working capital requirement of
airline industry for a period of one year, subject to a total
ceiling of USD 1 billion
Proposal to allow foreign airlines to put in up to 49 per cent
FDI in air transport undertaking under active consideration
of the government
Duty concessions to help the civil aviation sector
Proposal to invest `40 billion in equity into the ailing
national carrier, Air India, in the next fiscal year
AAI was allocated `2.8 billion, of which `805 million was
earmarked for airport development in the north eastern
states
Reduction in withholding tax
Government policy and initiatives100 per cent FDI under automatic route for greenfield
projects permitted
100 per cent FDI for existing airports is also possible with
an approval from Foreign Investment Promotion Bureau
(FIPB) beyond 74 per cent
49 per cent FDI permissible under automatic route in
domestic airlines, but not by foreign airline companies
Full exemption from income tax for airport projects for a
period of 10 years
Airport developers allowed to charge passengers
development fees
Indian airports emulating special economic zone (SEZ)
aerotropolis model to enhance revenues; focus on revenues
from retail, advertising, and vehicle parking, among others
Sources: http://www.ibef.org/
http://media2.intoday.in/indiatoday/images/budgeteng2012-b.pdf
http://profit.ndtv.com/News/Article/crisis-in-civil-aviation-top-10-
developments-304024
http://www.indiaairportsummit.com/
Airports

36
India’s total installed generation capacity as on April 2012
stood at 201,637.03 MW, with thermal power, contributing
133,363.18 MW, nuclear 4,780.00 MW, hydroelectric power
38,990.40 MW and renewable energy 24,503.45 MW. The
Government of India plans to install an Integrated National
Power Grid by 2012 with around 200,000 MW generation
capacity and 37,700 MW of inter-regional power transfer
capacity.
While some progress was made in reducing Transmission
and Distribution (T&D) losses, these still remain
substantially higher than the global benchmark, at around
33 per cent. In order to address some of the issues in this
segment, reforms have been undertaken by dividing of the
State Electricity Boards into separate generation,
transmission and distribution units and privatisation of
power distribution was initiated either through outright
privatisation or the franchisee route; results of these
initiatives have been somewhat mixed. There was a gradual
improvement in metering, billing and collection efficiency.
The Power Ministry has set a target for adding 76,000 MW
of electricity capacity in the 12th Five-Year Plan (2012-17)
and 93,000 MW in the 13th Five-Year Plan (2017-22). For
the 12th Five-Year Plan, investments to the tune of USD 314
billion have been envisaged for the power sector.
Budget 2012-13The Central Plan Outlay for Ministry of Power is `624.25
billion of which `96.42 billion is budgetary support
ECB in power sector permitted to partly finance the rupee
debt of existing power plants
To address the concern of fuel supply constraints, Coal
India Limited (CIL) was advised to sign a fuel supply
agreement with power plants that entered into long-term
Power Purchase Agreements with distribution companies
and will get commissioned on or before March 31, 2015
Proposal for full exemption from basic customs duty and a
concessional Countervailing Duty (CVD) of 1 per cent to
steam coal till March 31, 2014
Natural gas, LNG and certain uranium fuel to get full duty
exemption this year
Announcement of infrastructure debt fund, increased FII
investment and lowering of withholding tax
Allocated `49 billion to Rajiv Gandhi Grameen
Vidyutikaran Yojna (RGGVY) under Bharat Nirman
programme
Allocated `31.14 billion for Restructured Accelerated
Power Development and Reform Programme (R-APDRP)
Sunset Date for tax holiday under Section 80IA for the
sector was extended by a year
Additional depreciation of 20 per cent in the initial year is
proposed to be extended to new assets acquired by power
generation companies
Power sector allowed to raise `100 billion in 2012-13
through tax-free bonds
Government policy and initiativesExcept for nuclear energy (that is to remain in public
sector domain), 100 per cent FDI under automatic route
allowed for power generation, transmission and distribution,
including non-conventional energy
No income tax for a block of 10 years in the first 15 years
of operation and import duty waiver on capital goods used
for MPPs (above 1,000 MW generation capacity)
The conditions for grant of excise duty exemption for
goods supplied to mega power projects have been
amended. Now, the project developers, instead of the
manufacturers, have been made liable to pay the duty in
case they do not ensure that exempted goods are used
only in their projects
The government removed tariff protection on capital
goods
Electrical machinery figures among the items that are to
be produced at the SEZs cleared by the government
Private sector allowed to establish coal, gas or liquid-
based thermal projects of any size
Sources : http://www.ibef.org/
http://indiabudget.nic.in/ub2012-13/eb/po.pdf
http://media2.intoday.in/indiatoday/images/budgeteng2012-b.pdf
Power
Annual Report 2011-12
37
TelecomIndia’s total telecom subscriber base stood at 951.34 million
as on March 2012. The overall tele-density reached 78.66
per cent. The broadband subscriber stood at 13.79 million.
The next spurt in telecom growth is expected to happen in
villages and smaller towns where tele-density is at 39.22
per cent. Telecom services in rural markets are projected to
grow at 40 per cent annually. The government aims to
increase rural tele-density to 60 per cent by 2017 and to
100 per cent by 2020. The tower sharing business is
expected to play a crucial role in increasing rural
penetration. Sharing passive infrastructure reduces
operational costs and encourages new players to enter the
business and roll out their services instantly. Roll out of new
value-added 3G and 4G services will determine the course
of telecom growth in urban India.
The government aims to provide ‘broadband on demand’
by 2015 and achieve a target of 175 million broadband
users by 2017 and 600 million by 2020.
Budget 2012-13The central plan outlay for Department of
Telecommunications is `152.31 billion of which `48 billion
comprises budgetary support
Fixed network for telecommunication and
telecommunication towers are made eligible sectors for
VGF
Reduction in withholding tax
Government policy and initiatives100 per cent FDI allowed under automatic route in
telecom equipment financing
FDI ceiling of 74 per cent for telecom services (automatic
up to 49 per cent, FIPB approval needed beyond 49 per
cent)
Working towards the national goal of carbon emission
reduction, the Telecom Regulatory Authority of India (TRAI)
directed operators to achieve carbon reduction to the
extent of 5 per cent by 2012-13, 12 per cent by 2016-17
and 17 per cent by 2018-19. With regards to these norms
under 'Green Telephony', TRAI further mandated for all
operators that at least 50 per cent of all rural towers and 20
per cent of all urban towers are to be powered by hybrid
power by 2015. The government has given an approval for
the same
The National Telecom Policy (NTP) 2012 was announced
in May. The important features of the new policy include the
following :
Licenses to be de-linked from spectrum
Allow spectrum pooling, sharing and trading
Allow sharing of networks
Unified licensing regime to allow operators to offer any
service
Liberalise merger and acquisition norms in order to
facilitate consolidation
Number portability on a pan-India basis
Abolition of roaming charges
Creation of a Telecom Finance Corporation to facilitate
investments in the sector
To make India a global hub for telecom equipment
manufacturing
Sources : http://www.ibef.org/
http://indiabudget.nic.in/ub2012-13/eb/po.pdf
38
Around 87 minerals are produced in India, of which four are
fuel minerals, 10 metallic, 47 non-metallic, three atomic and
23 minor minerals. It contributes about 2 to 2.5 per cent to
the country’s GDP. The mining and quarrying sector has
shown particular weakness in the year 2011-12.
With coal accounting for nearly 55 per cent of India’s power
generation and India’s demand for power continuously out-
stripping supply, mining of coal will continue to grow. India
has an estimated coal reserve to the tune of 287 billion
tonnes. Of this, 110 billion tonnes are ‘proved’ reserves.
There is a rising demand for more sophisticated equipment.
Modern technology for locating deep-seated deposits in
complex geological environments and off-shore zones and
state-of-the-art drilling techniques with sophisticated rigs
(such as rig control systems) for three-dimensional sub-
surface delineation of ore bodies will determine the future
contours of the mining industry.
Additionally, keeping in mind the environmental impact of
mining and the problems concerning land acquisition,
development of infrastructure facility around the mineral
bearing areas and simultaneously developing the overall
region will become integral to the mining industry.
Budget 2012-13Full exemption of basic customs duty and a 1 per cent
concessional CVD to steam coal for a period of two years
till March 31, 2014
Full exemption of basic customs duty on coal mining
projects
Reduction in the basic customs duty from 10 per cent or
7.5 per cent to 2.5 per cent on machinery and instruments
used in the mining sector to survey and prospect minerals
Increase in export duty from `3,000 per tonne to 30 per
cent ad valorem on chromium ore
Increase in the basic customs duty from 5 per cent to 7.5
per cent on non-alloy, flat rolled steel
Introduction of TDS on trading in coal, lignite and iron ore
Reduction in withholding tax
Government policy and initiatives100 per cent FDI allowed under automatic route for coal
and lignite mining for captive consumption in iron, steel and
cement production
Automatic approval for 100 per cent FDI for mining of all
non-atomic minerals, including diamonds and precious
stones
Coal India Limited (CIL) was advised to sign fuel supply
agreements with power plants which have entered into
long-term Power Purchase Agreements with distribution
companies and will get commissioned on or before March
31, 2015. Further, an inter-ministerial group was set up to
undertake a periodic review of the allocated coal mines and
will make recommendations on de-allocations, if required
The Rashtriya Swasthya Bima Yojana (RSBY) to be
extended to cover unorganised sector workers in
hazardous mining
Introduction of a competitive bidding process to allocate
coal blocks for captive mining to ensure greater
transparency and increased participation in production
from these blocks
Sources : http://pmindia.nic.in/getdoc.php?id=U3QB39277.pdf
http://www.ey.com/Publication/vwLUAssets/Exploring_India_Mining
_the_opportunities/$FILE/Exploring_India_Mining_the_opportunities
_FINAL.pdf
Union_Budget_analysis_2012_13
Mining
Annual Report 2011-12
39
Coal and oil, together, represent about two-thirds of total
energy use. Natural gas accounts for about 9 per cent
share. India has about 5.7 billion barrels of proven oil
reserves.
India’s crude oil production was at 38.19 MMT (million
metric tonne) for 2011-12; up from 37.70 MMT in 2010-11
and the natural gas production including coal bed methane
(CBM) for 2011-12 was at 51.67 BCM (billion cubic metre)
against 52.22 BCM in 2010-11. The country's total installed
oil refining capacity was 193.39 MTPA (million metric tonne
per annum) by 1st January, 2012. Shale gas has the
potential of emerging as another potential energy source for
India. Several shale formations are spread over
sedimentary basins like Cambay, Satpura-Gondwana,
Krishna-Godavari and Kaveri. The Directorate General of
Hydrocarbons (DGH) has initiated steps to identify
prospective areas of shale gas exploration.
Government’s Vision 2015 aims to expand the marketing
network as well as quality of products and services to
customers covering four broad areas of LPG (liquefied
petroleum gas), kerosene, auto fuels and compressed
natural gas/piped natural gas.
Budget 2011-12VGF allowed for oil and gas / LNG storage facilities and
oil and gas pipelines
Cess on crude petroleum oil produced in India increased
to `4,500 / MT from `2,500 / MT
Full exemption from basic duty on natural gas and
Liquefied Natural Gas (LNG)
Government policy and initiatives100 per cent FDI allowed in exploring crude oil and
natural gas under automatic route
100 per cent FDI allowed in pipelines for petroleum
products, natural gas and LNG
The government is exploring PPP route to set up a
network of gas pipelines across India with a commitment
towards developing a Natural Gas Grid
The ninth round of New Exploration Licensing Policy
(NELP IX) has on offer 34 blocks (including 15 recycled
blocks) covering a sedimentary basin area of 88,807 sq.
km.
The first eight rounds of NELP resulted in signing of
production-sharing contracts for 235 blocks
Sources : http://www.ibef.org/industry/oilandgas.aspx
Union_Budget_analysis_2012_13
Oil and Gas

40
1. Review of the Profit andLoss AccountHighlights, 2011-12Assets under management increasedfrom `20,505 crore in 2010-11 to`30,764 crore in 2011-12, registering agrowth of 50 per cent.
Disbursements increased 49 per centfrom ̀ 12,497 crore in 2010-11 to ̀ 18,600crore in 2011-12. Disbursement recordedby the equipment financing businesswas `12,170 crore whereas that forproject finance was `6,261 crore in 2011-12.
Total income increased 49 per centfrom `1,638 crore in 2010-11 to `2,446crore in 2011-12.
Profit before tax reduced 18 per centfrom `289 crore in 2010-11 to `237crore in 2011-12.
Profit before notional forex marked-to-market provisions and tax increased 9per cent from `275 crore in 2010-11 to`302 crore in 2011-12.
Profit after tax and minority interestdecreased 38 per cent from `179 crorein 2010-11 to `112 crore in 2011-12.
Earning per share was recorded at `2.2in 2011-12 as against `7.74 in 2010-11.
Gross interest spread was 3.15 percent in 2011-12 as against 3.76 percent in 2010-11.
RevenueGroup revenues grew from `1,638crore in 2010-11 to `2,446 crore in
2011-12. Group revenues accrued fromthree verticals – fund-based businesses,fee-based businesses and investments.
Income from fund-based businessesincreased 63 per cent from `1,203crore in 2010-11 to `1,957 crore in2011-12. This was attributed by anincrease in interest bearing asset(including securitised asset) ofequipment finance business by 45 percent and that of project finance by 81per cent.
The Company's fee-based businessesgenerated revenues of `91 crore in2011-12 against `121 crore in 2010-11.Fee-based business contributed 4 percent to the total income in 2011-12 asagainst 7 per cent in 2010-11.
Net Income from rural IT infrastructure(Srei Sahaj) grew 14 per cent from `54crore in 2010-11 to `62 crore in 2011-12 following increased services beingoffered through CSCs.
Income from strategic investmentsincreased from `11 crore in 2010-11 to`15 crore in 2011-12. This incomelargely accrued from monetising anexisting investment. Incomes fromstrategic investments would vary fromyear to year as these depend on thetiming of the sale of such investments.
Equipment rental income contributed`295 crore to the total income in 2011-12 as against `232 crore in 2010-11.
The Group's non-core incomeincreased by 34 per cent from `16
crore in 2010-11 to `27 crore in 2011-12. Non-core income accounted foronly 1.1 per cent of the total income of2011-12, reflecting the continuingstrength of the core businesses.
Operational expensesThe Group's total operating cost(before interest and depreciation) was`395 crore in 2011-12 (`317 crore in2010-11). The increase was mainly dueto an increase in manpower andincreased scale of operations.
Employee costs: Expenses grew 39 percent from ̀ 123 crore in 2010-11 to ̀ 172crore in 2011-12, attributed to anincrease in team strength from 2,116 ason March 31, 2011 to 2,593 as onMarch 31, 2012 and due to generalincrease in employee wages.
Administrative costs: Expenses increasedfrom `193 crore in 2010-11 to `223 crorein 2011-12, owing to increased overheadcosts like power and fuel, repair andmaintenance, travelling and conveyance,advertisement, etc. Most of these costincreases were driven by increasedmanpower and larger scale of operations(number of offices for the equipmentfinance business increased from 47 to85).
Interest liabilityFinance charges increased 89 per centfrom `830 crore in 2010-11 to `1,565crore in 2011-12. This increase wasdue to an increase in borrowing by over58 per cent in 2011-12 and notional
Profit before notionalforex marked to market
provisions & tax
11.09 per cent
5-year CAGR
Disbursement
34.19 per cent
5-year CAGR
AUM
39.12 per cent
5-year CAGR
Total income
32.21per cent
5-year CAGR
Analysis of financial statements

Annual Report 2011-12
41
forex marked to market loss of `65crore in 2011-12 against a profit of `14crore in 2010-11.
TaxationThe Group's current tax liability
increased from `80 crore in 2010-11 to
`90 crore in 2011-12 due to increase in
deferred tax liability. However, income tax
provision under MAT reduced in line with
reduction in profit before tax. However,
income tax in respect of earlier years
increased from `13 crore in 2010-11 to
`24 crore in 2011-12. Thus, the total tax
expense increased by 22 per cent from
`93 crore in 2010-11 to `114 crore in
2011-12. The average tax expense rate
was about 48 per cent in 2011-12 as
against 32 per cent in 2010-11.
2. Analysis of the BalanceSheet Highlights, 2011-12Capital adequacy ratio* was 20.17 per
cent as on March 31, 2012 against
29.36 per cent as on March 31, 2011.
Book value per share increased from
`53 as on March 31, 2011 to `54 as on
March 31, 2012.
Net worth increased 4 per cent from
`2,641 crore as on March 31, 2011 to
`2,738 crore as on March 31, 2012.
Debt-equity ratio was 5.81 as on March
31, 2012 against 3.81 as on March 31,
2011.
Capital employedCapital employed increased 47 percent from `12,705 crore as on March31, 2011 to `18,654 crore as on March31, 2012, owing to the increased in thelevel of activity in various businessverticals.
Equity: Share capital comprised503,086,333 equity shares with a facevalue of `10 totaling `503 crore. Therewas no increase in equity capital ascompared to the previous year. As onMarch 31, 2012 Promoters' holdingconstituted 47.07 per cent and foreign
institutional investors constituted 13.03per cent.
Reserves: Group reserves grew 4 percent from `2,565 crore as on March 31,2011 to `2,675 crore as on March 31,2012.
External funds: Secured debt increased57 per cent from `8,736 crore as onMarch 31, 2011 to `13,717 crore as onMarch 31, 2012. Secured loanscomprised debentures, term loans andworking capital loans. The growth insecured debt was largely due to
Sources of funds
2011-12 2010-11Amount Percentage Amount Percentage Y-o-Y growth( `crore) of total ( `crore) of total (%)
Share capital 503 2.49 503 3.61 -
Reserves and surplus 2,675 13.24 2,565 18.43 4
Minority interest 91 0.45 74 0.53 23
Long-term borrowings 5,728 28.35 4,236 30.44 35
Short-term borrowings 8,212 40.65 4,071 29.25 102
Current maturities of 1,976 9.78 1,686 12.11 17long-term borrowings
Deferred tax liabilities (Net) 141 0.70 102 0.73 38
Other long-term liabilities 72 0.36 44 0.32 64
Trade payables 439 2.17 292 2.10 50
Others current liabilities 210 1.04 172 1.24 22
Long-term provisions 124 0.61 94 0.68 32
Short-term provisions 33 0.16 78 0.56 -58
Total 20,204 100 13,917 100 45
*Standalone

42
increase in non-convertible debenture(116 per cent) and working capitalloans (100 per cent). Of theoutstanding term loans, 59.16 per cent(54.27 per cent in the previous year)was rupee-denominated debt and40.84 per cent (45.73 per cent in theprevious year) was from internationalsources.
During the year the group increased itssubordinated debentures / bonds /loans exposure by 101.27 per cent,strengthening its capital adequacy.
Buyers credit exposure during the yearincreased to `187 crore from `69 crorein the previous financial year.
Other current and non-current liabilities:Other current and non-current liabilitiesincreased 42 per cent from `508 croreto `721 crore. This was mainly due to50 per cent increase in trade payablesand 22 per cent increase in othercurrent liabilities.
Other current and non-currentprovisionsProvisions however reduced marginallyby 9 per cent to `157 crore from `173crore in 2010-11 mainly due todecrease in provision for taxation andproposed dividend.
Total provision on standard and nonstandard assets increased from `86crore to `114 crore. Gross NPA on aconsolidated basis increased to 1.58per cent from 1.04 per cent, whereasnet NPA increased from 0.65 per centto 1.18 per cent.
Application of funds
2011-12 2010-11
Amount Percentage Amount Percentage Y-o-Y growth( `crore) of total ( `crore) of total (%)
Fixed assets 2,075 10.27 1,539 11.06 35
Goodwill 440 2.18 425 3.05 4
Deferred tax assets (Net) 32 0.16 36 0.26 -11
Non-current investments 2,101 10.40 2,031 14.59 3
Long-term financial assets 3,079 15.24 2,462 17.69 25
Short-term financial assets 405 2.00 466 3.35 -13
Current maturities of 1,588 7.86 1,364 9.80 16long-term financial assets
Long-term loan assets 2,235 11.06 1,687 12.12 32
Short-term loan assets 445 2.20 537 3.86 -17
Current maturities of 5,847 28.96 2,321 16.68 152long-term loan assets
Trade receivables 347 1.72 234 1.68 48
Inventories 13 0.06 17 0.12 -24
Current investments 22 0.11 - - -
Cash and bank balances 409 2.02 169 1.21 142
Other long-term advances 100 0.49 228 1.64 -56
Other short-term advances 289 1.43 89 0.64 225
Other non-current assets 465 2.30 257 1.85 81
Other current assets 312 1.54 55 0.40 467
Total 20,204 100 13,917 100 45
Annual Report 2011-12
43
Net block: Group's net block (including
CWIP) was `2,075 crore as on March
31, 2012 against `1,539 crore as on
March 31, 2011. The increase in net
block was mainly due to increase in
assets on operating lease of ̀ 388 crore
(net block comprised assets for own
use `1,007 crore, asset for operating
leases `878 crore) and capital work in
progress (CWIP) of `190 crore.
Financial assetsThis comprises of principal outstanding
for equipment finance loans given to
customers. This amount reflects the
growth in the equipment finance
business. Outstanding equipment
finance loan book grew by 18 per cent
to `5,072 crore.
Loans asset: This largely comprises of
outstanding project finance loan book,
which grew sharply from `4,545 crore
to `8,527 crore, an increase of 88 per
cent. This reflects the strong growth in
the project finance business.
Trade receivables: Trade receivables
increased by 48.5 per cent to `347
crore as on March 31, 2012. The
debtors largely comprised of
receivables from Quippo rental
businesses, rural entrepreneurs for the
IT infrastructure provided to them by
Sahaj and fee income debtors.
Cash and bank balance: Cash and
bank balances increased 142 per cent
to `409 crore in 2011-12 as against
`169 crore in 2010-11.
Other current and non-currentassetsOther current and non-current assets
increased 85 per cent from `629 crore
to `1,166 crore. This was mainly due to
225 per cent increase in other short
term advances, 87 per cent increase in
other non-current assets and 467 per
cent increase in other current assets.

44
Total income ( `crore)
Invisible hands worked acrossbusinesses, tiers, locations and time
to protect the Company’s performancein a challenging industry environment.
07-0
880
1
852 97
21,
638
2,44
6
08-0
909
-10
10-1
1
11-1
2
07-0
819
818
616
327
5 302
08-0
909
-10
10-1
1
11-1
2
07-0
813
382
156
179
112
08-0
909
-10
10-1
1
11-1
2
07-0
871
71,
141
1,27
9
2,64
1 2,
738
08-0
909
-10
10-1
1
11-1
2
07-0
85,
737
6,62
0 9,01
7 12
,497
18,6
00
08-0
909
-10
10-1
1
11-1
2
07-0
88,
214
10,3
67
13,7
79 20
,505
30
,764
08-0
909
-10
10-1
1
11-1
2
07-0
816
.58
9.63
16.0
3
10.9
44.
57
08-0
909
-10
10-1
1
11-1
2
07-0
823
.51
12.1
320
.99
10.7
2
4.35
08-0
909
-10
10-1
1
11-1
2
PBT (after removing effect of forex)
( `crore)PAT
( `crore)Net worth ( `crore)
Disbursement#
( `crore)
# For Disbursement and AUM 100 per cent of Srei BNPParibas (50:50 JV between Srei & BNP Paribas) has beenconsidered.
** Based on Profit after Minority Interest@ Based on Standalone Net worth
AUM#
( `crore)NPM**
(%)Return on average
net worth@**(%)

Annual Report 2011-12
45
07-0
82.
501.
342.
211.
640.
67
08-0
909
-10
10-1
1
11-1
2
07-0
812
.33
39.1
821
.98
29.3
720
.17
08-0
909
-10
10-1
1
11-1
2
07-0
83.
78
3.29
3.99
3.76
3.15
08-0
909
-10
10-1
1
11-1
2
07-0
81.
01
1.33
1.06
1.04
1.58
08-0
909
-10
10-1
1
11-1
2
07-0
80.
280.
47
0.45
0.65
1.18
08-0
909
-10
10-1
1
11-1
2
07-0
866
98 11
0 53
54
08-0
909
-10
10-1
1
11-1
2
07-0
812
.18
7.07
7.
46
7.74
2.
22
08-0
909
-10
10-1
1
11-1
2
* Based on Standalone Numbers** Based on Profit after Minority Interest
Return on averageasset**
(%)
CAR* (%)
Gross interest spread (%)
Gross NPA (%)
Net NPA ( %)
Book value ( `)
EPS ( `)

46
Risk management
While doing its business, Srei is exposed to various risks
and managing them ensures for sustainable growth. Srei
has always remained cautious and focused to keep its risks
within manageable levels. The Company endeavours to
identify and manage risks effectively by adopting best
industry and regulatory practices. It promotes a high
degree of awareness in identifying business risks and
adopting internal control measures to reduce them to
acceptable levels.
Srei has robust and integrated risk management systems to
ensure that risks assumed by it are within the defined risk
appetite and are adequately compensated. It has in place
a well-established risk management structure to manage
various financial and non-financial risks, which include
business, strategic, operational, market, credit, liquidity,
reputational and process risks.
Srei’s Board of Directors is at the fountainhead of all risk
management policies and strategies and is responsible for
setting Srei’s aggregate risk appetite. In its functions, it is
supported by Board sub-committees – risk committee of
the Board, central credit and investment committee and
asset liability management committee. Srei has a prudent
risk governance structure, which ensures that the function
of risk management remains the responsibility of all the
employees and are actively encouraged to manage risks at
various levels.
Gaining knowledge and experience of the various micro
and macro operating fundamentals and situations under
which the Company operates is the first step of risk
management. With this knowledge, it identifies various
factors that affect operations or may be a potential threat.
Risk quantification, integration and assessment are the next
steps and based on these, strategic decisions are taken
and implemented to maintain the desired risk-return profile.
Post decision making, risk monitoring is a continuous
process, which ensures risks always remain within our
appetite and appropriate decisions can be taken in a timely
manner.
An overview of major risks affecting the Company is
evaluated below.

Annual Report 2011-12
47
Any delay or non-payment of loans
from borrowers may result in significant
financial losses and hence
management of credit risk is the most
important aspect of the lending activity.
Each project/transaction is analysed
in great detail by a team of highly
qualified and experienced
professionals to understand the
various risks attached with it. All
transactions pass through a stringent
credit appraisal and before taking
any exposure, all relevant risks
(business, industry, financial,
management, project and
sustainability) are critically analysed
along with the available and possible
mitigants. Srei also has a robust
internal credit rating mechanism for
transactional risk measurement. A
framework for risks-based pricing is
in place, which ensures that the
Company is adequately
compensated for the risks being
taken. Decision on any credit
proposal is taken on the basis of
analysing overall risks, our risk
appetite and risk-return analysis.
Post approval, disbursement is made
only after compliance of approved
terms and conditions, which passes
multiple scrutinies. Srei also has
strong mechanism for portfolio risk
management. All accounts are closely
monitored and reviewed periodically
to identify early warning signals and
corrective steps are taken in a timely
manner. Best industry practices are
also captured in credit policy, credit
risk policy, standard operating
procedures and credit appraisal
manual. All internal policies are
periodically reviewed and updated
based on change in environmental,
regulation and market dynamics.
Credit risk 01 Srei’s ability to meet financial
obligations in a timely manner and
have adequate funding options is
critical for maintaining the business
cycle. Srei regularly maps its assets
and liabilities position, cash-flow
situation and market condition, which
helps it determine the average liquidity
position that it needs to maintain at any
given point. Various payment dates are
also aligned with receipts to achieve
the maximum possible liquidity. Along
with the gap and liquidity ratio analysis,
we also use scenarios and stress case
analysis to assess liquidity and funding
risk.
Strong credit-worthiness and
relationships with a large number of
domestic and international banks
ensure adequate funding
arrangements. The Company’s
excellent track record with zero default
and sound lending practices make it a
preferred borrower. By exploring new
instruments of borrowings and new
markets, we continue to expand and
diversify our borrowing base. Our
prudent lending practices and good
credit rating help secure funds at
competitive terms.
Liquidity and funding risk 02
48
To diversify our borrowing mix and
optimise cost of funds, we also borrow
in foreign currency. We have proper
hedging strategies in place to hedge
foreign currency exposure. If any open
position is kept on the basis of our view
on interest rate movements, it is kept
well within our risk appetite. Value at
risk (VAR) is used for assessing forex
risks and open positions are made well
within our risk appetite. Our balance
sheet size provides an adequate
cushion for any loss on this portfolio on
account of adverse foreign exchange
rate movements. The open forex
position is continuously monitored and
kept within the defined limit by using
appropriate hedging tools.
Foreign exchange risk 04Any operational error or breakdown /
malfunction may result in business
processing risks. If this risk is not
properly managed, the Company may
have to incur both monetary and
productivity losses. Over the years,
Srei developed systematic, defined
and stringent operating processes and
policies that direct functioning of all the
departments within the organisation.
The process also has a proper
operations control mechanism
whereby all transactions and events
are cross-checked to avoid processing
risks. Key responsibility areas of
employees are clearly defined and
reviewed on an ongoing basis.
Business loss owing to unauthorised
access, use, disclosure, disruption or
modification of information and data
systems may lead to information
security risks. To mitigate these risks,
the Company has a robust information
technology set-up with proper security
measures being adopted to prevent
unauthorised use of information and its
disclosure. The system also has
features like off-site disaster recovery
that prevents loss of data. Globally-
accepted security features covering
firewalls, encryption technologies and
spam-guards are also in place. All
documentation and processes are
password-protected with appropriate
document back-up management
systems. We also have a proper
system in place to maintain
confidentiality of Company information.
Operational risk 05Net interest margin (NIM) is the primary
source of income and hence, it is
essential to maintain it at satisfactory
levels, even in case of unfavourable
interest rate movements. Rate-
sensitive-asset and liability gap
analysis is carried out to assess
interest rate risk. Rate of interest on
majority of the Company’s assets and
liabilities are floating in nature. The
asset liability committee (ALCO)
periodically reviews the cost of
borrowings and the Srei benchmark
rate (SBR) and decision on revision of
SBR is taken, whenever required. Any
mismatch between the benchmark
used on the liabilities against the ones
on the assets is continuously monitored
by ALCO and strategies are created to
manage them.
Interest rate risk 03
Annual Report 2011-12
49
On account of financing infrastructure
projects, Srei may get exposed to
environmental and social risks.
Assessment and mitigation of
sustainability risks is an integral part of
Srei’s overall risk management
framework. While analysing a credit
proposal, we not only look at economic
project benefits but also the
environmental and social benefits,
which are critical aspects for
sustainability. All projects are
categorised on the basis of sensitivity
of the environmental and social issues
attached with the project. Sustainability
risk is not only analysed at the time of
initial loan approval, but is also
periodically during loan tenure. We
also partner with the borrower to
mitigate risks arising out of
environmental and social issues. Srei’s
environmental and social risk
management policy is based on
guidelines and norms of best
international practices (also referred to
as IFC standards) and incorporates
requirements under Indian
environmental rules and regulations.
Sustainability risk 06Unfavourable outcome of litigation and
non-compliance with rules and
regulations may lead to financial losses
and affect growth. As a mitigation
measure, the Company has competent
teams, who are well-conversant with
the local regulatory environment. These
teams remain updated on all relevant
regulations and ensure that these are
adhered to. In case of any changes in
the regulatory environment,
appropriate steps are swiftly taken.
To avoid any losses on account of
deficiency in documentation, Srei’s
qualified and experienced legal team
gets involved in every transaction right
from documentation to the final closure.
The legal team works closely with the
business team to ensure that
transactions are based on
unambiguous legal opinions. Legal
disputes are managed by an
experienced and professional team by
evaluating probability and impact
analysis of the outcome of litigation.
Legal and compliance risk 07Reputational risk may arise from
negative perception on the part of
customers, counterparties,
shareholders, investors and regulators
that can adversely affect the
Company’s ability to maintain existing
or establish new business relationships
and continue to source funds. Srei has
a stringent policy to handle reputational
risk arising from these issues. Regular
reviews are conducted to improve
policies and procedures to safeguard
against reputational risk. An
appropriate whistle blowing policy is
also in place.
Srei has a clean credit history with no
instance of failing to meet financial
obligations or not adopting proper
governance measures. We respond
quickly and effectively to complaints
and manage these promptly. Strong
relationships with various stakeholders
also plays an important role in
mitigating reputational risk.
Reputational risk 08

50
He has over 28 years of global infrastructure financing experience. He has worked with the
International Finance Corporation (IFC), the private sector arm of the World Bank, for more
than 16 years, based out of Washington DC. During 2004-2007, he was based out of Hong
Kong, and was the head of business development for infrastructure projects in the East Asia
and Pacific region for IFC. He has also served as the CEO and Board Member of a publicly
listed water infrastructure fund in Singapore. He was a member of the top management of
Hyflux Ltd. in Singapore, one of the leading water infrastructure companies of Asia. He also
previously worked with Swiss Bank Corporation in New York on structured financing and
asset securitisation transactions. He is a member of the Board of Directors and Chairman of
the Audit Committee of the Emerging Africa Infrastructure Fund (EAIF). The EAIF, a USD 700
million fund, is sponsored by a prestigious group of investors including UK, Dutch, German,
Swedish and Swiss government entities and leading private global banks. He has been a
visiting faculty at the Indian Institute of Management, Calcutta.
Saud Ibne SiddiqueJoint Managing Director
He is a Chartered Accountant with more than 24 years of experience in the financial
services industry. He is presently the Vice President of The Associated Chambers of
Commerce & Industry of India (ASSOCHAM), Member of the Central Direct Taxes Advisory
Committee and the Governing body member of the Construction Industry Development
Council (CIDC). He has also served as President of Merchants' Chamber of Commerce,
Federation of Indian Hire Purchase Association (FIHPA) and Hire Purchase & Lease
Association (HPLA) and has also served as a Member on Planning Commission's Working
Group on Construction for the Tenth Five Year Plan.
Sunil KanoriaVice Chairman
He has over 32 years of experience in industry, trade and financial services. He is presently
the Chairman of the National Committee on Infrastructure of Federation of Indian Chambers
of Commerce & Industry (FICCI), Member of FICCI National Executive Committee and
Council Member of Indo-German Chamber of Commerce. Previously, he has been on the
Board of Governors of Indian Institute of Management - Calcutta, Member of Regional
Direct Taxes Advisory Committee, Government of India and President of Calcutta Chamber
of Commerce.
Hemant KanoriaChairman & Managing Director
He has more than 54 years of experience and has served as the former Chairman of West
Bengal Industrial Development Corporation Limited, a leading state financial institution. He
has also served as the President of The Institute of Chartered Accountants of India.
Salil K. GuptaChief Mentor
Directorsʼ Profile

Annual Report 2011-12
51
He is a Chartered Accountant with over 41 years of experience in the Assurance and Business
Advisory services of a Big Four Firm in India, where he was a partner for a little over two
decades; experience in Due Diligence Review, Valuation and Internal Audits, among others.
Sujitendra Krishna DebDirector
He is a Former Director and Chief Economist of Asian Development Bank, Manila and
President of Bihar Council of Economic Development. He was also a Member of the
Economic Advisory Council to the Prime Minister and Chairman, Special Task Force on
Bihar.
Satish C. JhaDirector
ShyamalenduChatterjee
Director
He is the former Chairman & Managing Director of Bank of India and a former Chairman of
Indian Bank and has more than 39 years of experience in the banking industry.S. Rajagopal
Director
He is an Economics and Law graduate and an associate of the Indian Institute of Bankers.
He has spent over 47 years in the banking and financial industry, holding offices with India's
Central Bank - Reserve Bank of India (RBI), the Capital Markets Regulator - Securities and
Exchange Board of India (SEBI) and the Industrial Development Bank of India (IDBI).
V. H. PandyaDirector
He has over 45 years of experience in Commercial and Investment Banking. He was the
Executive Director of UTI Bank Limited, Mumbai. He has extensive exposure in the areas of
International Banking having worked in SBI, London for 3 years and in Washington D. C. for
5 years. He has expertise in the areas of Corporate Finance, International Business, Retail
Banking, Project Financing and Balance Sheet Management, among others.
Directorsʼ Profile

52
Consolidated Standalone
Year ended Year ended Year ended Year endedMarch 31, 2012 March 31, 2011 March 31, 2012 March 31, 2011
Total Revenue 2,44,633 1,63,809 1,18,069 74,624
Total Expenses (including depreciation etc.) 2,12,504 1,27,072 1,05,017 52,213
Profit before bad debts, provisions & tax 32,129 36,737 13,052 22,411
Bad Debts & Provisions etc. 8,452 7,840 2,173 1,197
Profit Before Tax 23,677 28,897 10,879 21,214
Current Tax 5,466 8,267 1,760 4,185
Mat Credit entitlement (189) (94) (49) -
Deferred Tax 3,674 (203) 1,198 3,350
Income Tax in respect of earlier years 2,411 1,309 2,174 249
Profit After Tax before Minority Interest 12,315 19,618 5,796 13,430
Minority Interests 1,134 1,694 - -
Net Profit 11,181 17,924 - -
Pre Acquisition Profit / (Loss) - 474 - -
Minority Interests of Pre Acquisition Profit / (Loss) (39) (474) - -
Profit After Tax after adjustment of Minority Interests 11,142 17,924 - -
Adjustment on account of Amalgamation - (570) - -
Surplus brought forward from Previous Year 30,339 25,618 23,791 19,679
Profit Available For Appropriation 41,481 42,972 29,587 33,109
Paid up Equity Share Capital 50,324 50,324 50,324 50,324
Amount transferred to Reserves 9,965 8,227 4,193 4,918
Financial Results ( `in Lakh)
Your Directors are pleased to present the Twenty Seventh Annual Report together with the Audited Accounts of your Company
for the financial year ended March 31, 2012. The summarised consolidated and standalone financial performance of your
Company is as follows:
Directors’ Report

Annual Report 2011-12
53
OPERATIONAL REVIEWYour Company is one of the leading
private sector infrastructure financing
institutions in India. Some of the key
highlights of your Company’s
performance during the year under
review are:
The gross profit (before depreciation/
amortisation, bad debts, provision
and tax) is `14,592 lakh as against
`24,219 lakh in the last year.
Profit before taxation is `10,879 lakh
as against `21,214 lakh in the last
year.
Net profit after taxation is `5,796 lakh
as against `13,430 lakh in the last
year.
The total assets under management
of the Srei Group is `30,76,435 lakh
as against `20,50,524 lakh in the last
year.
The Consolidated Financial Statements
have been prepared by your Company
in accordance with the requirements of
the accounting standards notified by
the Central Government under the
Companies (Accounting Standards)
Rules, 2006. The audited Consolidated
Financial Statements together with
Auditors Report thereon forms part of
the Annual Report.
The capital adequacy ratio (CAR) of
your Company stood at 20.17 per cent
as on March 31, 2012, well above the
regulatory minimum level of 15 per cent
prescribed by the Reserve Bank of
India for systemically important non-
deposit taking NBFCs (NBFCs-ND-SI).
Of this, the Tier I CAR was 14.59 per
cent.
Your Company has complied with all
the norms prescribed by the Reserve
Bank of India (RBI) including the Fair
practices, Anti money laundering &
Know your customer (KYC) guidelines
and also all the mandatory accounting
standards notified by the Central
Government under the Companies
(Accounting Standards) Rules, 2006. It
has adopted a sound and forward
looking accounting policy of providing
for non performing assets in terms of
the management’s best estimates as
well as the guidelines laid down by the
Foreign Financial Institutions, which are
more stringent than the guidelines of
the RBI.
AMALGAMATION OF QUIPPOINFRASTRUCTUREEQUIPMENT LIMITED INTOAND WITH YOUR COMPANYThe Scheme of Amalgamation of
Quippo Infrastructure Equipment
Limited (Quippo) into and with your
Company was approved by the
Hon’ble High Court at Calcutta vide its
Order made on January 18, 2011. The
Scheme has become effective w.e.f.
March 04, 2011 after filing of certified
copy of the Order with the Registrar of
Companies, West Bengal at Kolkata.
Consequently, all the assets and
liabilities and the entire business of
Quippo stand transferred to and vested
in your Company, as a going concern,
with effect from the Appointed Date i.e.
April 01, 2010.
During the year under review, an
application for dissolution without
winding up of Quippo was filed before
the Hon’ble High Court at Calcutta which
approved the same vide its Order dated
November 22, 2011. The said dissolution
has become effective w.e.f. December
21, 2011 after filing of certified copy of
the Order with the Registrar of
Companies, West Bengal at Kolkata.

54
PUBLIC DEPOSITSIn April 2010, your Company decided
to convert itself into a non-deposit
taking NBFC in order to qualify for
registration as an ‘Infrastructure
Finance Company’. Your Company had
decided that it would not accept any
further public deposits or renew such
maturing deposits in any manner w.e.f.
April 20, 2010 and the entire amount of
outstanding public deposits as on April
19, 2010 together with interest
promised to the depositors, has been
kept in an Escrow Account with Axis
Bank Limited, a scheduled commercial
bank for the purpose of making
payment to the depositors as and when
they raise the claim. The amount
payable to the depositors as on March
31, 2012 is `49,73,000/-.
During the year under review, your
Company has not accepted any
deposits from the public within the
meaning of the provisions of the Non-
Banking Financial Companies
Acceptance of Public Deposits
(Reserve Bank) Directions, 1998.
PUBLIC FINANCIALINSTITUTION (PFI) During the year under review, your
Company has been notified as a Public
Financial Institution (PFI) under Section
4A of the Companies Act, 1956 by the
Ministry of Corporate Affairs (MCA),
Government of India vide its notification
dated September 26, 2011.
MUTUAL FUND ACTIVITYDuring the year under review, the
Securities and Exchange Board of
India (SEBI) has permitted your
Company to set up a Mutual Fund for
Infrastructure Debt Fund Schemes.
Accordingly, your Company is in the
process of complying with the
necessary requirements for the grant of
Certificate of Registration for the Mutual
Fund.
PROMOTERSʼ GROUPSHAREHOLDINGThe Promoters’ Group of your
Company has increased their net
shareholding in your Company during
the year by 0.85 per cent from 46.22
per cent to 47.07 per cent, through the
creeping acquisition route allowed as
per SEBI (Substantial Acquisition of
Shares and Takeovers) Regulations,
2011.
The Promoters’ Group has shown
increased commitment to the business
strategy and substantial growth of your
Company and your Company believes
that this will result in enhanced value for
all the stakeholders.
As on March 31, 2012, 17.23 per cent
(out of 47.07 per cent) of shareholding
held by the Promoters’ Group of your
Company is under pledge.
PUBLIC ISSUE OF LONGTERM INFRASTRUCTUREBONDS IN THE NATUREOF SECUREDREDEEMABLE NON-CONVERTIBLEDEBENTURESYour Company was classified by the
During the year under
review, your Company has
been notified as a Public
Financial Institution (PFI)
under Section 4A of the
Companies Act, 1956 by
the Ministry of Corporate
Affairs (MCA), Government
of India vide its notification
dated September 26,
2011.

Annual Report 2011-12
55
RBI as ‘Infrastructure Finance
Company’ (IFC) within the overall
classification of ‘Non Banking Finance
Company’ in March, 2011.
Consequently, your Company became
eligible to issue Long Term
Infrastructure Bonds eligible for
deduction under Section 80CCF of
Income Tax Act, 1961.
During the year under review, your
Company raised `24,88,56,000
(Rupees Twenty four crore eighty eight
lakh fifty six thousand only) through the
public issue of Long Term Infrastructure
Bonds of face value of `1000 each, in
the nature of Secured Redeemable
Non-convertible Debentures (the
Bonds), eligible for deduction under
Section 80CCF of the Income Tax Act,
1961. The issue opened on December
31, 2011 and closed on March 06,
2012. The Bonds were thereafter
allotted on March 22, 2012. These
Bonds are listed on the Wholesale Debt
Market (WDM) Segment of the Bombay
Stock Exchange Limited (BSE). The
entire proceeds have been utilised for
the purpose of ‘Infrastructure Lending’
in terms of Central Board of Direct
Taxes (CBDT) Notification dated
September 09, 2011.
The public issue of Long Term
Infrastructure Bonds has not only
facilitated diversification of your
Company’s sources for mobilising long
term resources but has also provided
the retail investors an opportunity to
participate in India’s infrastructure
development and progress. The
various communication efforts of your
Company surrounding the Bonds
played a meaningful role in enhancing
your Company’s brand image amongst
relevant constituencies.
UNSECUREDSUBORDINATED BONDSIn the year 2000, your Company had
issued on rights basis 52,66,075
Unsecured Subordinated Bonds of
`100/- each aggregating to
`52,66,07,500/- vide Letter of Offer
dated June 16, 2000. Each Bond has
an overall tenure of 12 years, reckoned
from the date of allotment viz. August
25, 2000 and the face value of the
Bonds along with an overall premium of
20 per cent of the original face value is
to be redeemed in seven installments,
commencing from the completion of
sixth year from the date of allotment.
Your Company has accordingly
redeemed on August 25, 2011, being
sixth redemption date, `15/- towards
principal amount and `3/- towards
premium amount total aggregating to
`18/- per Unsecured Subordinated
Bond and the face value of the
aforesaid Bonds accordingly stands
reduced to `10/- per Bond. The
aggregate principal amount
outstanding as on March 31, 2012 is
`5.27 crore.
DIVIDENDYour Company has had a consistent
dividend policy that balances the dual
objectives of appropriately rewarding
shareholders through dividends and
retaining capital, in order to maintain a
healthy capital adequacy ratio to
support long term growth of your
Company. Consistent with this policy,
your Board has recommended a
Dividend of `0.50 per Equity Share (5
per cent) for the Financial year 2011-12
to the Equity shareholders of your
Company. The Dividend shall be
subject to tax on dividend to be paid by
your Company but will be tax-free in the
hands of the shareholders.
MANAGEMENTDISCUSSION ANDANALYSIS REPORT
ECONOMIC REVIEWa. Global OutlookThe International Monetary Fund (IMF)
predicts that global GDP growth will be
3.5 per cent in 2012 and is likely to
improve to 4.1 per cent in 2013. The
developed economies will grow the
slowest vis-à-vis Emerging Market
Economies (EMEs) and developing
nations.
Amongst the developed nations, the
Eurozone will fare the worst. Sovereign
debt problem in Europe had been
simmering for quite a while, but last
autumn the European crisis became
acute. Strong policy measures were
taken and to alleviate immediate
pressure on the financial markets in the
Eurozone, the European Central Bank
had to inject liquidity of more than € 1
trillion through two long-term
refinancing operations. Also, the
European Union adopted a tough fiscal
pact. The proposed fiscal correction,
tightening of credit conditions and

56
persistently high unemployment would
limit the growth prospects in the
Eurozone in the short to medium term.
While economies like Germany and
France will have very low but positive
growth in 2012, other debt-ridden
economies like Spain and Italy will
register negative growth thereby
dragging down growth of the entire
region. As per IMF projections, euro
area is likely to grow at minus 0.3 per
cent in 2012 and 0.9 per cent in 2013.
The US economy, on the other hand, is
showing signs of a gradual recovery
from the 2008 crisis with consumer
spending picking up and declining
unemployment. However, with hardly
any pick-up in industrial growth and
mixed signals from housing data, there
are still some lingering concerns over
the sustainability of recovery in the US.
Federal Reserve has not ruled out the
possibility of further fiscal stimulus
through a third round of quantitative
easing (QE3). IMF projects a 2.1 per
cent growth in the US in 2012 and 2.4
per cent in 2013.
The EMEs and developing nations
encounter challenges mostly external
in nature. Low demand from developed
economies leads to lower exports from
EMEs and developing nations. The
liquidity injection in the US after the
2008 crisis had fuelled commodity
prices across the world driving up
inflation in EMEs and developing
nations. In addition, these nations are
exposed to volatile capital flows
leading to sharp changes in their
exchange rates. With demand in
developed nations not likely to pick up
anytime soon and with a fresh round of
liquidity injection (this time in Europe),
the EMEs and developing nations are
likely to remain exposed to the above-
mentioned challenges. Since last year,
many of them had already resorted to
monetary tightening, capital controls
and exchange rate intervention in order
to curb inflationary trends and limit the
adverse impact of excess capital
inflows on their economies. The impact
of the policies in these economies has
been varied. While inflation has started
moderating in Brazil and Russia, China
still faces problems of overheating and
trying for a soft-landing. Policy making
in these nations is likely to be tested for
one more year. As per IMF, in 2012
China is likely to grow at 8.2 per cent,
Russia at 4 per cent and Brazil at 3 per
cent.
International crude oil prices have been
rising since January 2012 fuelled by
geo-political tensions and abundant
global liquidity. Any disruption in supply
can lead to a sharp hike in oil price and
this will have a cascading impact
across industries and make inflation
management difficult, especially in
EMEs where demand is still buoyant.
b. Indian ScenarioThe year under review was a
particularly difficult year for doing
business in India. Wholesale Price
Index (WPI) inflation remained above 9
per cent from April to November, 2011.
To rein in inflation, RBI resorted to
raising the interest rate. After raising
repo rate by 150 basis points in FY11,
RBI increased it by another 125 basis
points in FY12. While inflation has
started moderating since December,
2011, it is still around 7 per cent mark
which is way above RBI’s comfort level.
The higher interest rate regime,
however, slowed down the economy
and GDP growth averaged 6.9 per cent
in the first three quarters of FY12. The
Index of Industrial Production (IIP)
figure reflects how the high interest rate
has affected economic activity. IIP
registered a growth of only 3.5 per cent
between April - February FY12 vis-à-vis
8.1 per cent during the corresponding
figure in FY11. With capital goods and
intermediate goods registering
negative growths during this phase, it
is quite likely that GDP growth in FY12
will be less than the forecast of 6.9 per
cent. The slowdown in growth has also
been mirrored in the deceleration of
non-food credit growth.
India’s infrastructure deficit and the
resultant supply bottlenecks have
played a role in fuelling inflation.
However, our economy is saddled with
the twin problems of a high and
sustained fiscal deficit and a growing
current account deficit (CAD), and this
limits government’s ability to boost
demand through pump-priming the
economy. CAD for FY12 is expected to
be at a record high of 3.5 to 4 per cent
of GDP. India’s CAD has usually been
bridged with capital account inflows.
However, overall capital inflows have
declined sharply in April - December
FY12 with portfolio flows far lower vis-

Annual Report 2011-12
57
à-vis previous year. The consequent
drawdown of forex reserves worth USD
7.1 billion during April - December
FY12 also sharply depreciated the
rupee. Companies who accessed
foreign funding suddenly found
themselves exposed to foreign
exchange risk.
In addition, if we factor in the
uncertainty that has been created
amongst investors and potential
investors from the Union Budget
announcements on General Anti
Avoidance Rules (GAAR) and
retrospective taxation, further capital
flight from India is very much a
possibility if Government does not
quickly take steps to allay investor
concerns. Thus, the rupee is likely to
remain under pressure going forward.
To ease liquidity situation and to
improve the investment climate, RBI cut
the Cash Reserve Ratio (CRR) by 125
basis points from January 2012
onwards and followed it up with a 50
basis point cut in repo and reverse
repo rates each in April 2012. The cut
in repo rate comes after a gap of 3
years. It is easy to pull a string, pushing
it is difficult. Thus, while raising policy
rates did ultimately lead to moderation
in inflation by curbing investment, it
remains to be seen how long it takes for
the repo rate cut to trigger fresh
investments.
Another concern area is the front-
loading of Government’s borrowing
programme. It envisages a borrowing
of USD 75 billion in the first half of FY13.
Even if RBI cuts policy rates, lack of
liquidity in the market will ensure that
end interest rates remain high. Thus,
government borrowing can crowd out
private investment.
A recent CRISIL report shows that non-
performing assets (NPAs) are on the
rise with default rates at a ten year high.
Tight liquidity scenario and elevated
interest rates imply that banking
system’s capability to lend will be
tested in FY13.
Rating agency Standard & Poor’s has
downgraded India’s outlook from stable
to negative. This is likely to push up
borrowing cost from overseas markets.
To sum it up, FY13 is likely to be an
extremely challenging year for India’s
policy makers.
NBFIs IN INDIAThe year under review witnessed RBI
issuing guidelines to allow banks and
non banking finance companies
(NBFCs) to sponsor Infrastructure Debt
Funds (IDFs). The IDFs can be set as
Mutual Funds (IDF-MFs) or as NBFCs
(IDF-NBFCs) which would be regulated
by Securities & Exchange Board of
India (SEBI) and RBI respectively. All
NBFCs, including Infrastructure
Finance Companies (IFCs) registered
with RBI, may sponsor IDF-MFs.
However, only IFCs are eligible to
sponsor IDF-NBFCs. Sponsor IFCs are
to contribute minimum 30 per cent and
maximum 49 per cent to the equity of
the fund.
For setting up IDF, any NBFC has to
have minimum 5 years of experience
Rating agency Standard &
Poor’s has downgraded
India’s outlook from stable to
negative. This is likely to
push up borrowing cost from
overseas markets.

58
with profits for last 3 years, should have
minimum net owned funds of `300
crore, a capital adequacy ratio of 15
per cent and NPAs should be less than
3 per cent of net advances.
In case of IDF-NBFC, the entity must
have a minimum credit rating of ‘A’ of
CRISIL or equivalent rating, its Tier II
capital cannot exceed Tier I and can
invest only in public private partnership
(PPP) and post commercial operational
date (post-COD) infrastructure projects
which have completed at least one year
of satisfactory commercial operation.
IDF-NBFC, registered with RBI, can
raise resources through issue of either
Rupee or Dollar denominated bonds of
minimum 5-year maturity and the
investors would be primarily domestic
and off-shore institutional investors,
especially insurance and pension
funds, which have long-term resources.
IDF-NBFC also needs to enter into a
tripartite agreement with the project
concessionaire and the project
authority.
Eligible non-resident investors can
invest in Rupee denominated units
issued by IDF-MFs registered with
SEBI. Any IDF-MF must invest minimum
90 per cent of its funds in debt
securities of infrastructure companies
or special purpose vehicles (SPVs)
across all infrastructure sectors, project
stages and project types.
After careful evaluation of the eligibility
criteria and the degree of flexibility of
investing, your Company has
embarked on the process of floating an
IDF-MF to tap India’s infrastructure
opportunities.
The year under review also witnessed
further relaxation of the external
commercial borrowing (ECB) window
for IFCs. RBI has allowed IFCs to avail
of credit enhancement under the
automatic route for domestic debt
raised through issue of capital market
instruments like debentures and bonds
from eligible direct/indirect foreign
equity holder(s), which as per extant
guidelines could be availed only from
multilateral/regional financial institutions
and Government owned development
financial institutions, under the approval
route.
RBI, while laying down guidelines on
Credit Default Swaps (CDS) for
corporate bonds, has stipulated that
NBFCs shall only participate in CDS
market as users and will be allowed to
buy credit protection only to hedge
their credit risk on corporate bonds
held by them. NBFCs are not allowed
to sell protection and hence cannot
enter into short positions in CDS
contracts. NBFCs can unwind their
CDS position with the original
counterparty or by assigning them in
favour of buyer of the underlying bond.
NBFCs are to maintain a minimum
capital adequacy ratio based on risk
weights assigned to both on and off
balance sheet items. They, however,
recognise only six categories as off
balance sheet items which have
linkages to NBFC activities. To expand
the off balance sheet regulatory
The year under review also
witnessed further relaxation
of the external commercial
borrowing (ECB) window for
IFCs.

Annual Report 2011-12
59
framework, RBI has now stipulated that
NBFCs will need to calculate the total
risk weighted off balance sheet credit
exposure as the sum of the risk-
weighted amount of the market related
and non-market related off balance
sheet items.
RBI has instructed NBFCs to strictly
adhere to issuance of non-convertible
debentures (NCDs) with a tenor of 90
days to 1 year.
In a separate development during the
year under review, the Cabinet
Committee on Infrastructure has come
up with a master list of Infrastructure
Sectors which now has 5 major sectors
and 29 sub-sectors. The 5 major
sectors are (a) Transport, (b) Energy,
(c) Water Sanitation, (d)
Communication, and (e) Social &
Commercial Infrastructure. This master
list will serve as a reference point,
although the Committee allows
flexibility to each financing agency to
spell out its reasons and draw its own
list of eligible sub-sectors out of the
master list with adequate justification
for inclusion or exclusion of any sub-
sector from its list. Such a master list
will also serve as a reference point for
NBFCs, especially IFCs.
BUSINESS OUTLOOK ANDFUTURE PLANSIndia has stepped into the Twelfth Five
Year Plan (2012-17) where the total
investment figure for infrastructure is
envisaged at USD 1 trillion and within
that 50 per cent of that is expected to
come from the private sector. However,
the prolonged high interest regime has
affected the infrastructure verticals and
today the sector is saddled with
depleting order books, broken cash
cycles, high leveraging, debt
restructuring and a rising NPAs.
Union Budget FY13 was expected to
come up with initiatives that would set
in motion infrastructure activities. Some
of the welcome announcements were:
Allowing ECB window to the cash-
starved power and aviation sectors
Increasing the scope for Viability Gap
Funding (VGF) to new areas like
irrigation, oil & gas pipelines,
agriculture market terminals, etc.
Allowing infrastructure public sector
undertakings (PSUs) to raise tax-free
bonds worth USD 12 billion
Allowing import duty exemptions for
equipment imports in solar power,
energy-saving devices, safety
equipment for railways, aircraft
maintenance equipment, specified
road construction equipment, coal
mining machinery, etc.
Providing incentives for affordable
housing.
While plan outlay for FY13 registered an
increase of 22 per cent over previous
year, outlay for infrastructure for FY13
stands increased to almost USD 30
billion, an increase of 32 per cent over
previous year. The budget also
announced that the first infrastructure
debt fund (IDF) will be launched soon.
Government is also committed towards
implementing a Direct Tax Code (DTC)
and introducing a Goods & Services
Tax (GST). The micro-issues on these
fronts are being ironed out.
However, to get the private sector
enthused about investing in
infrastructure projects, attention has to
be given to regulations which would
ensure project viability. Regulations
need to be fully thought through to
avoid frequent changes in policies as
those pose a risk for private investment
by leading to time and cost overruns.
The issue of land acquisition remains a
sensitive issue with different states
adopting different policies regarding
resettlement, rehabilitation and
compensation of the displaced. Clarity
on guidelines for environmental
clearances is also a must for speedy
project implementation. Shortage of
skilled and semi-skilled manpower is
emerging as a serious issue. This is
one area where private sector has to
partner the government for expeditious
scaling up of human capital. Planning
Commission Chairman Mr. Montek
Singh Ahluwalia has gone on record
saying Twelfth FYP will focus on skill
upgradation of human capital. These
issues, once addressed, will result in
greater investment flow into India’s
infrastructure.
However, the budget proposals on
GAAR and taxation on retrospective
basis have put a huge question mark
on the future of the India Growth Story.
The principal motive for GAAR is to
plug any loophole that would allow an
entity to go without paying capital gains
tax or withholding tax while conducting

60
any transaction (sale or purchase) of an
asset based in India. But applying it on
a retrospective basis, and that too for
50 years, has made investors nervous.
Government is trying to address these
investor concerns.
Clarity in policy and regulations is the
need of the hour. On the policy front,
your Company has established a
regular channel of communication and
feedback with relevant Ministries and
government agencies. This is because
the management of your Company is
upbeat and confident about India’s
prospects among its global peers. Your
Company believes the recent problems
on the policy front are temporary in
nature and will get addressed in due
course. India will continue to remain an
attractive investment destination.
RBI has started lowering its policy rates
and it is expected that CRR will be cut
further to inject more liquidity into the
system. And once Government
succeeds in bringing in some clarity on
the policy front, investment will
ultimately pick up, and with that
investment in infrastructure too. And
when that happens, your Company with
its in-depth knowledge of the
infrastructure business, strong financial
position, prudent risk management
techniques and its knack for innovation,
will be all set to take advantage of the
opportunities that would unfold. Even if
the business environment remains
tough, your Company is adequately
geared to meet the challenges.
BUSINESS REVIEWThe three main business activities of
your Company are categorised as
Fund based, Fee based and Strategic
Investments.
I. FUND BASED ACTIVITIES
INFRASTRUCTUREPROJECT FINANCEThe Government has identified
infrastructure development as a key
priority area in its five year plans. The
Eleventh Five Year Plan (FY 2007-12)
envisaged an investment of about `21
lakh crore (USD 514 billion) in the
infrastructure sector. The Government
of India has doubled the planned
expenditure on infrastructure during the
Twelfth Five Year Plan (FY 2012-17) to
USD 1 trillion. It emphasises the
importance of investment in
infrastructure for achieving a
sustainable and inclusive growth of 9 to
10 per cent in GDP over the next
decade. The investment in
infrastructure as a percentage of GDP
is expected to increase from 5.15 per
cent during the Tenth Five Year Plan to
7.55 per cent during the Eleventh Five
Year Plan and to 10 per cent during the
Twelfth Five Year Plan. This constitutes
a significant shift in favour of investment
in infrastructure.
Given the scale of investment required,
a substantial proportion of the
investment will have to be met through
private financing or Public Private
Participation (PPP). Private sector share
in the infrastructure spending is
expected to increase from an estimated
36 per cent in the Eleventh Five Year
Plan to 50 per cent in the Twelfth Five
Year Plan. Your Company believes that
given its history, capabilities and
financial strength, it is well placed to
benefit from these opportunities. During
the previous financial year, your
Company successfully obtained from
RBI a change in your Company’s
classification to an Infrastructure
Finance Company (IFC), which among
other things has helped it to diversify its
borrowings, access long-term funds to
a greater extent, and a flexibility to
increase its exposure to borrowers and
groups. During the year, your Company
has been notified as a Public Financial
Institution under the provisions of the
Companies Act, 1956.
Given the thrust on infrastructure
creation and recognising the growth
potential in the sector, your Company
has remained focused on infrastructure
financing for the last two decades, and
has established itself as a holistic
infrastructure institution, providing a
range of innovative financial solutions
including equipment/asset finance,
project finance, operating leases, debt
syndication, etc. Over the years, your
Company has financed various small
and medium sized projects that have
contributed to the symbiotic growth of
both the project developers and your
Company. Leveraging upon its acute
and in-depth knowledge of the
infrastructure sector, combined with its
expertise in financial structuring and
the continued support of various
bilateral/multilateral agencies, your
Company was able to expand

Annual Report 2011-12
61
infrastructure project finance business
and has emerged as a strong niche
player. While there are many financial
institutions/ banks to fund infrastructure
development in the country, IFCs like
your Company, have been active in
financing the small and medium sector
projects, thus facilitating a more
inclusive growth.
During the year under review, your
Company sustained its healthy growth.
Its aggregate portfolio size recorded a
growth by over 78 per cent to `8,897
crore in the financial year 2011-12. The
key infrastructure investments in various
sectors included Conventional Power,
Renewable Energy, Roads, Ports, SEZ
& Industrial Parks, Telecommunications,
Oil and Gas, Urban Infrastructure, etc.
Through its structured risk mitigation
techniques, its innovative financing
structures, security packages and
maturity profiles of loans, your
Company was able to contribute to an
increased availability of infrastructure
services in the country with better
efficiency.
Power:Power generation in the country has
grown at CAGR of 5.8 per cent during
the period FY 1990-91 to FY 2010-11. It
is estimated that, in order to sustain
GDP growth at 9 per cent, the demand
for grid power will grow by 6 per cent
per annum to 1,200 billion units (Bu) by
the end of the Twelfth Plan. If fuel oil /
diesel based captive generation is to be
curtailed, as it should be for energy
efficiency, we have to plan for grid
supply of at least 1,350 Bu.
Although the Eleventh Plan had
targeted creation of 79 GW of additional
capacity for grid power, actual
realisation may not exceed 50 GW,
largely on account of slippages in
public sector projects. The shortfall in
achieving the targets has been primarily
due to poor project implementation,
shortage of indigenous power
equipment and slow down of capacity
addition due to lack of fuel, particularly
coal. As more than 80 GW of new power
capacity is already under construction,
it may be reasonable to target 100 GW
of new power capacity during the next
Plan. This will, however, need an
effective resolution of issues on
availability of fuel (notably coal) and
effective measures for improving
financial health of power utilities. Over
40 GW of planned capacity has been
mothballed as of March 2012, due to
coal supply bottlenecks and price
curbs. The Twelfth Plan should,
therefore, aim at capacity creation of
about 100 GW, which will include 29
GW of capacity from projects which
were supposed to be completed in the
Eleventh Plan, but are now expected to
be completed in the first two years of
the Twelfth Plan. Capitalising on this
vast opportunity, your Company has
allocated about 35 per cent of its total
allocation to this sector. With an interest
in thermal power, wind power, solar
power, hydro-electric power and power
from co-generation & waste heat
recovery systems, during the year, your
Company has executed several
transactions with power generation
companies with financial participation
Power generation in the
country has grown at CAGR
of 5.8 per cent during the
period FY 1990-91 to FY
2010-11.

62
in over 2700 MW of thermal power
plants, over 500 MW of wind farms and
over 500 MW of hydro power plant
among others. During the year, your
Company also financed power
transmission and distribution projects.
Railways and Logistics:The Indian Railways’ contribution to
national integration has been
unparalleled. It has played a unique
role in meeting the transportation
needs of the common man, while
simultaneously serving as a critical
infrastructure facilitator for the carriage
of goods. Indian Railways are one of
the largest rail networks in the world
carrying 22 million passengers every
day and carrying 923 million tonne of
freight a year.
Like other sub-sectors of infrastructure,
there is a need to improve the railway
sector in order to ensure a better future
for the country. The private sector’s
contribution to railways has increased
considerably over the years from 0.6
per cent in the Tenth Five Plan to 4.1
per cent in the Eleventh Plan. The
Indian Railways has allowed private
sector entities to operate container
trains. The Indian Railways has put into
place ‘Vision 2020’ which envisages
private investments in the railways at
USD 304 billion spread across
augmentation of capacity and
modernisation over the next 10 years.
The Twelfth Five Year Plan envisages
an investment of USD 74 billion as
compared to USD 50 billion in the
Eleventh Plan which will result in the
emergence of many opportunities in
the railway segment. Your Company
has examined investment opportunities
in financing rolling stocks (including
liquid cargo container movement),
setting up of Inland Container Depots
(ICDs), warehouses & cold storages
and development of railway sidings.
The proposed Wagon Leasing Scheme
announced by the Indian Railways is
expected to throw open vast business
opportunities for your Company.
Aviation and Airports:Airport standards across India, with a
few recent exceptions, need
considerable up-gradation to come up
to global benchmarks. The Eleventh
Plan saw extensive modernisation of
the airport infrastructure through a
combination of public & private
investment. Chennai and Kolkata
airports are being modernised by the
public sector along with 35 non-metro
airports. The two major metro airports
viz. Delhi & Mumbai have been
successfully modernised in the PPP
model. In addition, Hyderabad,
Bangalore and Cochin airports offer
good examples of the success of the
PPP model.
India is expected to be the fastest
growing civil aviation market in the
world. Considering the growth in the
Indian economy and the need to
develop aviation infrastructure,
investments to the tune of USD 30
billion are required in airport
development over the next fifteen
years. In addition, ‘Vision 2020’ issued
in 2007, envisages the requirement of
Considering the growth in
the Indian economy and
the need to develop
aviation infrastructure,
investments to the tune of
USD 30 billion are required
in airport development over
the next fifteen years.
Annual Report 2011-12
63
1,000 aircraft upto 2020. It also aims at
modernisation of all the airports with
multiple airports at large metropolitan
cities. To meet these goals, the
Planning Commission has allocated
USD 17 billion for the aviation sector in
the Twelfth Plan as compared to USD 9
billion in the Eleventh Plan. Your
Company has participated in a number
of transactions in the aviation sector in
the past and will continue to closely
follow developments and opportunities
in this sector.
Ports and Port Equipment:The capacity of our ports to deal
effectively with growing international
trade volumes has increased in the
Eleventh Plan in part on account of
private investment in the so-called
minor ports, as well as container
terminals dry-bulk and liquid handling
facilities in the major ports. As a result,
both berthing time and turn-around
times have fallen. However, investment
in ports will meet only 50 per cent of the
Eleventh Plan target. It is imperative
that the pace of expansion of the port
sector will increase in the Twelfth Plan.
It is estimated that investments in the
port sector during the Twelfth Plan
would be approximately USD 26 billion,
an increase of about 160 per cent from
the previous plan period. During the
year, your Company has expanded
exposure to this sector by financial
participation in a mix of major ports,
minor ports and captive ports. The port
sector now comprises about 10 per
cent of the portfolio of your Company.
Telecommunications:The Indian telecom industry has
expanded tremendously in size and
reach, with the total number of landline
and mobile subscribers crossing 950
million. However, tele-density in India is
still lower compared to many
developing countries and there is still
plenty of scope to increase tele-density,
particularly in rural areas, improve
broadband facilities and increase 3G &
other value added services. To meet
these goals, the Twelfth Plan envisages
an investment of USD 253 billion.
Today, the sector faces several
challenges and is mired in controversy
on the allotment and cancellation of 2G
licenses. In spite of the challenges,
leveraging on its acute understanding
of this industry and its long standing
relationships with vendors, during the
year, your Company has structured
financing packages that include
investment in telecom towers and rural
connectivity.
Roads:A good road network is a critical
infrastructure requirement for rapid
growth. India has the second largest
road network in the world totalling over
4.24 million km but most of it is of poor
quality. Half of the network is not paved
and the National Highways account for
only 2 per cent of the total length. The
roads in India need massive
investments to increase & improve
network coverage, quality of roads,
rural penetration to connect villages to
cities, etc. The Twelfth Plan envisages
an investment of USD 123 billion in this
sector, which is more than 70 per cent
higher than USD 70 billion planned
under the Eleventh Plan. During the
year, your Company has selectively
participated in financing road projects
aggregating over 1,500 km allotted by
National Highway Authority of India
(NHAI) and State Authorities.
INFRASTRUCTUREEQUIPMENT FINANCE -SREI EQUIPMENTFINANCE PRIVATELIMITED (SREI BNPPARIBAS)Srei BNP Paribas, a joint venturebetween your Company and BNPParibas Lease Group, is registered withRBI as a non-deposit taking NBFC(Category - Asset Finance) and is in thebusiness of equipment financing with awide spectrum of asset finance businesswhich includes Technology andSolutions, Healthcare, Captive financingsolutions for leading manufacturers likeVolvo and Logistic Solutions.Infrastructure is the sector, whichcontributes to a majority, and client profileincludes the best names in the countrytoday. Some of the large names havebeen in a stress but the superior riskmitigation and relationship that Srei BNPParibas enjoys with the customers helpkeep all major accounts regular.
Srei BNP Paribas has been able tomaintain its position as one of theleading equipment financier in India inthe last financial year in continuation toits previous year with a disbursement ofasset cost of over `15,000 crore, whichhas been far higher than the growth inthe equipment sales. The industry grew

64
at an average of 35 per cent and thisyear witnessed entry of new buyersespecially in the entry segment. Themarket share of Srei BNP Paribas is ata dominant 30 per cent amongst allfinanciers in this business vertical.
In the year under review, the total
disbursements in terms of asset cost of
Srei BNP Paribas grew by 50 per cent
from `10,010 crore to `15,016 crore,
with an increase in portfolio by 45 per
cent, and the profit before tax from
`213 crore to `305 crore.
During the year under review, Srei BNP
Paribas made a start in logistics, pre-
owned equipment and farm equipment.
These new businesses will help in
diversification of portfolio, and open
new vistas for future. New branches
have been added and the
geographical footprint has increased.
The prognosis for the year ahead is
positive, but circumspect in certain
geographies and sectors. Investments
in infrastructure sector will grow, both in
public and private sector, and the
contribution of new business like
logistics and pre-owned equipment will
add to the business volumes. The
relationship between both the
shareholders, Srei Infrastructure
Finance Limited and BNP Paribas
Lease Group, continues to be at the
best terms and best practices and
cross selling opportunities are being
exploited. Srei BNP Paribas will have a
cautious approach and watch policy
decisions with strong focus on
relationship with customers and
assisting in their business as partners.
In order to improve the capital
adequacy ratio and infuse fresh Capital
for growth, both the shareholders
subscribed to 16,10,000 Equity shares
respectively of Srei BNP Paribas in
June, 2011 at a price of `310/- per
Equity share aggregating to `99.82
crore.
INTERNATIONALBUSINESS OPERATIONSEver since the turn of the century, like
every innovative business in India, your
Company too wanted to take Indian
business to the world, as an
Infrastructure Company. This marked
the first step towards globalisation of
your Company’s business and thus the
first overseas subsidiary company in
Germany was set up in year 2003 in the
name of IIS International Infrastructure
Services GmbH (IIS) as a limited
liability company. The objective for
setting up IIS was to provide
infrastructure advisory and equipment
renting company in Europe and other
foreign countries.
Through IIS, your Company has made
investments in leasing and advisory
business in Russia, Singapore and
UAE. IIS is the overseas holding
company and acts as the fulcrum for
making overseas investments in
various countries and IIS is providing
strategic directions to these
subsidiaries on ongoing basis.
Your Company commenced business
in Russia in year 2006 through its step
down subsidiary, ZAO Srei Leasing
(ZSL). Your Company holds 64 per cent
share capital in ZSL through IIS with the
balance 36 per cent being held by
International financial institutions like
EBRD, DEG and FMO. The company is
in active operation since last six years
and survived severe financial crisis in
Russia during 2008-09. In 2011, the
Russian economy has demonstrated
recovery trends backed by high oil
prices. The leasing market grew by
almost 50 per cent to USD 50 billion
approx. Capitalising on this trend, the
company has recorded over 100 per
cent growth in its business in 2011
continuing the trend of profitability
since its inception in 2006.
ZSL has invested in relationship
development with major vendors and
financial institutions which have helped
the company achieve growth in
disbursements and access to affordable
funds. ZSL remained focused in liquid
infrastructure assets which has enabled
the company to maintain portfolio
quality. At the same time, the company
has also adopted a cautious approach
and is looking to finance clients with
strong balance sheets and sustainable
business models.
In order to increase market visibility,
ZSL is aggressively undertaking
branding exercises, the impact of
which was seen in the previous year
and will be more prominent in coming
years. As on September 30, 2011, ZSL
ranked among top 60 leasing
companies in Russia out of about 700
leasing companies in the country
(Source: Expert RA).
Annual Report 2011-12
65
With business volumes growing, there is
a need to establish best industry
practices from across the globe to
efficiently manage the operations.
Keeping this in mind, ZSL is planning to
ramp up its activities by strengthening
Standard Operating Procedures (SOPs)
for various critical business processes,
increase manpower, extend its
distribution network by opening three
representative offices in the country. The
company is also in the process
increasing its share capital by USD 10
million approx in the current year by way
of a rights issue to its existing
shareholders. This would be big boost
to the aggressive business strategies
planned for ZSL during next three years.
With the leasing market expected to
grow further by about 30-50 per cent in
2012, ZSL is anticipating an average
business growth of about 50-60 per
cent during next three years. Keeping
the momentum, the company will
continue to invest in relationship
development in the current year and
look to expand its geographical
presence in Russia which will help the
company achieve a sustainable growth
and enhance shareholder value in the
long run.
II. FEE-BASED ACTIVITIES
INFRASTRUCTUREPROJECT ADVISORYInfrastructure Project Advisory Division
of your Company has now proven
credentials through successful
execution of key assignments and is
positioning itself in all major thrust
areas of infrastructure in energy &
power, transportation – through
sustainable approach in mass public
transport, conventional transport
planning of urban and regional areas,
etc. Our endeavour in urban
development sector is through
integrated city development in roads,
water supply, sewerage, tourism,
recreation, etc. The Advisory Division
has streamlined its focus in Social
Infrastructure Sector in Education and
Skill Development. It continues to
provide services in conceptualisation,
feasibility, detailed project reports, bid
process, business plan and structuring
of PPP models with innovative tools.
Your Company has successfully
concluded execution of key
assignments in mass transportation
assignments in Bangalore, Mumbai
and Lucknow. The Advisory Division of
your Company is involved in
prestigious strategic road master
planning of Uttar Pradesh and this
assignment has been delivered with
specialised in-house inputs on demand
modelling with precision. The Advisory
Division has positioned itself in future
strategy for more business
opportunities from the State.
In the Urban Infrastructure space, the
Advisory Division is advancing its
progress in Southern States and has
been rewarded with overwhelming
mandates by Bangalore Development
Authority in detail planning and design
of Rehabilitation of EWS Housing
Schemes and Redevelopment of
Sheshdripuram Market Projects. Your
Your Company has
successfully concluded
execution of key
assignments in mass
transportation assignments
in Bangalore, Mumbai and
Lucknow.

66
Company has managed to bag sizeable
mandates from Cuttack Development
Authority on PPP structuring of Housing
Projects. The Advisory Division is
currently involved in consultancy for City
Development Plans of ten Municipalities
in the State of Madhya Pradesh. In
tourism sector, your Company has been
awarded with an assignment by Asian
Development Bank (ADB) for
Transaction Advisory services for
development of Vizag Tourism Cluster
and Lepakshi Tourism Cluster in the
State of Andhra Pradesh. Your
Company has also penetrated in the
western region through a focused
approach and secured project
management mandates in water sector
in Goa. Your Company is also involved
in strategic global advisory support (first
in India) to foreign developers in
recreation sectors like giant Aquarium /
Oceanarium for the cities of Mumbai
(Thane) & Jalandhar. These
assignments are in progress and likely
to multiply in coming years.
Your Company continues its efforts in
the Education Sector to help the
Schools adopt the State of the Art tools
and techniques in evaluation of
students’ performance in an objective
and scientific manner. The CCE solution
compatible software programme
package developed by your Company
is being installed in schools in the form
of Web based and Windows based
Applications. Your Company also
imparts necessary training to School
Teachers on CCE issues and has been
empanelled by CBSE. During the year,
your Company has successfully
completed the capacity building
programme for CCE training mandated
by CBSE for 100 schools pan-India.
Advisory skills have acquired the status
of ‘Knowledge Partners’ in your
Company and have been synergising
with other verticals to enhance value
added services and cross functional
specialised services. The Advisory
Division has been teaming with
Infrastructure Project Development and
Srei Sahaj Groups in transportation
(Personal Rapid Transit in Amritsar) and
capacity buildings programmes
(National Schemes on Skill
Development) and have been quite
successful.
To enhance the business spectrum of
advisory through strategic approach,
your Company is targeting ambitious
projects in infrastructure sector. The
Advisory Division of your Company has
been contemplating its efforts on
attracting business opportunities
emerging from the implementation of
‘Delhi Mumbai Industrial Corridor
Project’ and has been empanelled by
DMICDC as ‘Consultants as Programme
Managers’. This is a mega project and
given an opportunity, the Advisory
Division will gain a key recognition in the
advisory segment - nationally and
globally for all times to come. This will
lead to sustainable stream of revenues
in focussed areas and identify strategic
investment potential.
INFRASTRUCTUREPROJECT DEVELOPMENTInfrastructure Project Development has
Your Company continues its
efforts in the Education
Sector to help the Schools
adopt the State of the Art
tools and techniques in
evaluation of students’
performance in an
objective and scientific
manner.

Annual Report 2011-12
67
given your Company an opportunity to
emerge as India's one of the leading
Infrastructure Developers in the Road
sector. This feat could be achieved
because of your Company’s strong
presence and functional expertise in
the infrastructure space through
equipment financing, project financing
and project management expertise.
Your Company’s intellectual capital
strength helped it to leverage and build
inextricable partnerships with
customers and other leading global
concessionaires and ensures effective
coordination and smooth sailing of
projects from beginning to end. Your
Company’s in-house knowledge,
strength of financial engineering &
solutions, knowledge of customers as
partners have created a unique model
of “Prosperity through Partnership” and
a win-win solution for all stakeholders.
Presently, your Company, under
consortium arrangements with various
companies, has a diversified portfolio
of annuity and toll-based road projects
close to 5,500 lane km with a total
Capital Cost of around `13,000 crore,
awarded by the National Highways
Authority of India (NHAI) under National
Highways Development Programme
(NHDP), Ministry of Road Transport and
Highways (MORTH) and various other
State Governments. During the year
under review, your Company as co-
developer has successfully completed
the construction of Thrissur-Angamali
Road Project in Kerala on NH-47 under
NHAI and Jaora Nayagaon Road
Project in Madhya Pradesh on SH-31
under Madhya Pradesh Road
Development Corporation (MPRDC).
Your Company has also received the
commercial operation date (COD) for
Chandikhole Jagatpur Bhubaneswar
Project in Odisha on NH-5 under NHAI
and the collection of Toll together with
work for six laning of the project has
commenced. Your Company, under
consortium arrangement, has further
bagged two more prestigious Road
projects worth `1,400 crore, one in
Maharashtra (Solapur - Maharashtra
Karnataka Border) on NH-9 under
NHAI and the other in Rajasthan
(Bikaner to Suratgarh) on NH-15 under
PWD Rajasthan on build-operate-
transfer (BOT) basis under your
Company’s expanding portfolio.
III. STRATEGICINVESTMENTSThe investment macro-scenario during
FY 2012 was adversely impacted by
high domestic interest rates, tightening
liquidity, depressed primary markets,
sudden depreciation of the Indian
Rupee, rising energy costs and the
negative fall-out of international
financial markets grappling with the
Eurozone debt crisis. Unlike 2008, there
was a lack of swift policy responses by
the authorities to the emerging
situation; the problems associated with
sluggish decision-making were further
compounded by controversies over
financial wrong-doing. This increased
economic uncertainty levels and
impacted investor sentiments
adversely. In particular, sectors such as
telecom, power and mining were hard-
hit by negative investor sentiments.
Your Company has always taken a long
term view on its investments. While
there has been continued investor
interest in our investment portfolio,
optimising value for shareholders
requires that we exercise patience and
wait for the right opportunity to capture
value. Economic conditions during
2011 were not conducive to realising
right value. With approximately USD 7
billion of initial public offerings (IPOs)
being cancelled or deferred during
2011, either raising equity or exiting
through IPOs was not available as an
option. While private equity (PE) funds
were active during the year, deal sizes
were relatively small and mismatches in
valuation expectations between sellers
and prospective investors was a
common refrain in the PE space.
However, with signs of recovery in the
US economy, and global stock markets
beginning to show an upward trend
during the last quarter of FY 2012, the
changing economic scenario may offer
better opportunities during FY 2013,
especially if policy inaction is
addressed and domestic reforms are
pushed through. In the interim, the
focus of your Company will be on
closely managing existing investments
with a view to enhancing value.
Your Company believes strongly in the
resilience of the Indian economy and its
ability to sustain and improve growth
rates over the longer term. Based upon
this conviction, your Company
continues to look at new investment
opportunities related to the
68
infrastructure & financial sectors where
it can add value with its deep
knowledge of the sector, its skilled
resources, the ability to access
financing & scale up operations, and
bring in partners where needed. Such
transactions carry relatively lower risk
while holding out the prospect of above
average returns. Your Company will
also continue to focus on identifying
opportunities in emerging verticals
within the infrastructure sector that offer
strong prospects for future growth,
such as water and waste management
and renewable energy.
In terms of the investment process &
risk management, your Company
continues to refine its policies,
procedures and risk review systems to
ensure that its investment portfolio is
subject to sound controls and
decisions are taken after thorough and
exhaustive analysis to safeguard
shareholders’ interests.
RESOURCESYour Company is classified as an IFC
by RBI within the overall classification
of NBFCs in India. Your Company has
been mobilising resources at the most
competitive rates and raised the
required resources from its bankers
and financial institutions all the while
ensuring proper asset liability match.
a) Bank FinanceYour Company mobilised resources to
the extent of `4,085 crore during the
year at the most competitive rates
available in the market and continued
its focus on domestic sources.
b) Bonds / Debentures /Commercial PapersYour Company has focused to
mobilised long term funds by issue of
Non Convertible Debentures (NCDs) to
maintain healthy assets liability profile.
Your Company has mobilised `653
crore by issue of Long Term NCDs
during the FY 2012. Your Company has
also mobilised `24.89 crore by issue of
Long Term Infrastructure Bonds during
FY 2012. Your Company has also
raised `7,114.50 crore through
Commercial Papers during FY 2012.
c) Tier II CapitalTo augment resources and increase the
capital base, your Company raised Tier
II Capital aggregating to `350 crore
during the year.
d) Foreign InstitutionalBorrowingsYour Company has drawn ECB of USD
30 million and Euro 15 million during the
FY 2012 inspite of tight liquidity in the
international market. Your Company
has drawn Euro 15 million from
Oesterreichische Entwicklungsbank
AG (Development Bank of Austria)
which is their first loan in India. As
liquidity in the international market
improves, your Company will
endeavour to mobilise much more long
term funds under ECB window for on-
lending to borrower in the infrastructure
sector. This will equip your Company
with long term funds and enable to
maintain healthy asset-liability profile.
RISK MANAGEMENTManagement of wide array of risks is an
integral part of your Company’s
business. With experience of more than
twenty years in the lending business,
your Company has always remained
very cautious while taking risks to
ensure long term sustainability of your
Company. Your Company has a robust
and integrated Risk Management
system to ensure that the risks are
properly identified, assessed,
measured, aggregated, mitigated and
monitored effectively. The Risk
Management Architecture in your
Company comprises of Risk
Management Structure, Risk
Management Policies and Risk
Management Implementation &
Monitoring Systems.
Risk governance structure of your
Company ensures independence
between the business and risk
management. Risk Committee of the
Board (RCB) has the overall
responsibility of developing framework
for the prudent risk management in the
company. RCB is a sub-committee of
the Board, which is headed by a non
executive Director. Under the guidance
of RCB, risk management department
is responsible for managing enterprise
wide risk on a regular and dynamic
basis. Your Company ensures that
various risks are properly identified and
assessed while conducting each
business. After identifying the risks,
suitable mitigants are explored;
thereafter decisions are taken on the
basis of Company’s risk appetite and
analysis of risk-return matrix. Your
Company uses a comprehensive range

Annual Report 2011-12
69
of quantitative and qualitative tools for
assessing, managing and monitoring
risks. Some of these tools are common
to a number of risk categories, while
others are tailored to the particular
features of specific risk categories.
Appropriateness of all the risk
assessment methodology is
continuously reviewed in light of
dynamic risk environment.
All the loan proposals are routed
through a very stringent risk
assessment process. Team of qualified
and experienced personnel scrutinises
the proposals at various stages and
during the assessment process all the
relevant information from formal and
informal channels are collected to
arrive at an appropriate decision. Your
Company’s internal policies are more
conservative and stringent than the
minimum regulatory requirement. Your
Company also follows best industry
practices in the area of risk
management to reduce the possibility
of losses. For portfolio risk
management, various caps are
stipulated based on company’s risk
appetite. Your Company emphasises
on diversification of its portfolio to
ensure that concentration risk in terms
of single borrower, group, industry and
geography can be mitigated. These
caps are periodically reviewed based
on changes in macro-economic
environment, regulatory environment
and industry dynamics. Existing credit
exposure in the portfolio is continuously
monitored and reviewed. Corrective
action, if required, is taken well in
advance based on early warning
signal, so that any surprise in the
portfolio can be avoided. Your
Company keeps close track of macro
economic development including
changes and its impact on movement
in interest rate, foreign exchange rate
and liquidity position in the market.
Interest rate risk is managed by linking
lending rate of interest to Srei
Benchmark Rate (which is used for
linking rate of interest on loans given by
your Company) and reviewing it
periodically with change in your
Company’s cost of funds. Your
Company has Asset Liability
Management Committee (ALCO) in
place, which periodically reviews SBR,
borrowing mix, liquidity, funding, ALM
position and currency risk. Well
diversified base of lenders and product
mix coupled with prudent lending
practices ensure that adequate funding
is made available to your Company at
all times.
For managing operational risk, your
Company emphasises on well defined
and effective policies and procedures
in alignment of your Company’s
business and needs. It is continuously
monitored through effective control
system. Checks and balances are in
place and roles and accountability are
clearly defined to mitigate operational
risk. With well defined communication
system, your Company ensures that
prompt action is taken in case of need
to minimise the losses. To minimise
losses from information security risk,
your Company focuses on upgradation
For managing operational
risk, your Company
emphasises on well defined
and effective policies and
procedures in alignment of
your Company’s business
and needs.

70
of IT infrastructure in line with the best
emerging practices.
In addition to the above, at enterprise
level, various other risks are also
identified and its impact on your
company’s business is assessed.
Concrete action plan is made to
minimise the impact of risk and residual
risks is managed on a continuous basis
and kept within our risk appetite.
HUMAN RESOURCESACTIVITIESIn today’s dynamic world, the dynamics
of every business is constantly in
motion. Hence the Human Resource
Development (HRD) function today
helps organisation build its capability to
take care of the shareholders’
expectations by facilitating human
capital management, talent
management & development and talent
retention. Therefore this poses special
challenges on part of the HRD function,
which needs to see its role evolving from
an arbitrator of human relations dealing
only with issues of employee motivation
and morale to one managing the
resource supply chain and contributing
to business in a substantial way.
Therefore, a robust Performance
Management System called “STEP”
(Success through Enhanced
Performance) has also been
institutionalised and has been
successfully enabling talent management
for the third consecutive year.
Similarly, LEaD Srei which stands for
Leadership, Entrepreneurship and
Development, is constantly
endeavoring and nurturing key talent.
LEaD Srei has successfully conducted
around thirty workshops. This year the
Institute aims for successful graduation
of participants.
Your Company has also adopted to
infuse young talent at the entry level
through a well structured ‘Management
Trainee’ programme. In order to ensure
that the trainees are groomed to build
organisation’s capability, a quarterly
management trainee review was
implemented and adhered to.
As Human Capital measurement has
long been an important activity, the
Oracle HR MIS got rolled out in your
Company by the end of September,
2011.
This year the function will continue to
pursue the theme of building the
organisation’s capability in order to
deliver expected returns to the
shareholders.
Your Company continues to induct
talent for its present and future needs.
The number of employees of Srei
Group increased from 2,116 on March
31, 2011 to 2,593 on March 31, 2012.
INFORMATIONTECHNOLOGYThe realm of Information Technology (IT)
is a fast changing one. IT is setting the
pace at which the world around us is
changing. The challenges and
opportunities facing the customers and
consumers of IT have become very
different to what they were a decade
ago or even a year ago. The world of
A robust Performance
Management System
called “STEP” (Success
through Enhanced
Performance) has also
been institutionalised and
has been successfully
enabling talent
management for the third
consecutive year.

Annual Report 2011-12
71
tomorrow is one where uncertainty and
fierce global competition are going to be
the norm. Rightly so, your Company is
looking up to IT more than ever before.
Each year cedes a new set of
experiences which paves the path for
better tomorrow through constant drive
to learn, improve and reinvent in the
process.
As your Company scales up for growth,
it is imperative that the right
investments are made in technology to
sustain business performance and also
invest in niche technology that would
make all business functions efficient,
enriching the customer experience in
dealing with your Company.
Your Company has already initiated the
implementation and integration of its
front-office with back-office operations
through Sunguard – Ambit 42 and
Oracle Apps respectively. While Oracle
Financials and HRMS (Human
Resource Management System) are
already implemented, the Sunguard –
Ambit 42 is in final stages of
completion. This will enable faster
information exchange and
dissemination, thereby expediting all
fact based decision making.
Your Company is increasing its focus
on customer service and has identified
the need to reach out to customers
through multiple channels using IT.
Various technological initiatives like
Line of Business Applications, Internet-
based services, workforce
collaboration, and virtualisation have
helped your Company to take a lead in
this direction.
Your Company is also looking at
mobility as a gamechanger. Your
Company is in the process of
empowering its employees, customers
and distributors with these end-point
devices. Collaboration is another big
priority. Connecting the feet-on-street
workforce to decision-making to risk
management to the delivery of product
and quality services will be a key
enabler.
Your Company has moved forward
towards its commitment to implement
new service desk model based on ITIL
framework, data centre virtualisation
and consolidation programmes along
with IT security enhancements. This
has not only increased the reliability
and availability of data center
significantly, it has also helped your
Company in reducing the cost to a
great extent.
Your Company is also on the verge of
completing ISO 27001 certification for
its Data Centre operations.
The entire Srei group companies are
completely networked through a
secured virtual private network (VPN)
and are integrated through its
ERP/Mailing system seamlessly to
provide significant improvement in
collaboration across the group
companies.
INTERNAL CONTROL ANDAUDITYour Company’s vision, mission and
core values have laid down the
foundation for the entire internal control
mechanism. On the administrative
controls side, your Company has a
proper reporting structure, several
oversight committees, defined roles
and responsibilities at all levels and
rigorous performance appraisal system
to ensure appropriate checks and
balances. On the financial controls
side, management with the knowledge
and understanding of the business, its
organisation, operations and
processes, has put in place
appropriate controls including
segregation of duties to deter and
detect misstatements in financial
reporting.
Your Company has an independent
Internal Audit Department reporting
directly to the Audit Committee of the
Board. The Audit Committee, which has
a wide mandate, consists of eminent
professionals who are well versed with
financial management.
The Internal Audit Department is
adequately staffed with Chartered
Accountants and other professionals,
who are well experienced in financial
services and related risks and controls.
The department has professionals who
are experienced in IT risks and controls
also. The purpose, scope, authority and
responsibility of the internal audit
department are delineated in the Audit
Charter approved by the Audit
Committee. Internal Audit Department
influences and facilitates improvements
in the control environment by constantly
evaluating the risk management and
internal control measures. The Team

72
ensures seamless efficient business
operation and supports mitigation of
associated risks by the process
owners.
The Internal Audit Department plays an
active role in tracking the management
action plans and issue resolution. It
monitors progress of action plans
resulting from audit reviews and
provide periodical updates on the
status of outstanding issues to the
Audit Committee and Senior
Management. The effectiveness and
quality of internal audit functions are
reviewed by the Audit Committee on an
ongoing basis. Training needs to
update the skills of the Internal Audit
Department staff are identified
regularly. Such trainings are provided
either through external vendors or
internally.
The Internal Audit and the Internal
Control procedures adopted in your
Company are adequate and
commensurate with the size and
complexity of its business.
ENVIRONMENTAL ANDSOCIAL MANAGEMENTSYSTEMEnvironmental & Social Management
System (ESMS) has been adopted by
your Company to adequately meet,
respond to and enhance benchmarks
in Environmental and Social (E&S)
management. ESMS reduces the
business risk of its portfolio related to
E&S issues and adhere to Sustainable
Finance Practice, which has been
integrated as a part of overall Credit &
Risk Policy. This management system
is aimed at properly evaluating,
assessing and ensuring customer
compliance with relevant E&S
requirements and encourages clients
to take corrective action & mitigation
plans.
The core elements of our ESMS are a
self declared Policy Framework, due-
diligence (rapid, sustainability, client
risk assessment, project/activity risk
categorisation and if required site
visiting), appraisal (analysis of E&S
impacts and client’s capacity &
commitment to address them),
mitigation measures, action plans,
monitoring & review of ongoing
projects, training & workshop and
continuous improvement of the system.
In your Company, a full scale E&S due-
diligence is carried out for any
business activity as per International
Finance Corporation Performance
Standards and Country’s E&S Laws,
Rules & Notifications, based on which a
‘go’ or ‘no go’ decision is given by
ESMS team. Your Company neither
participates nor invests in certain
activities and industries, which fall in
the exclusion list of your Company.
Over the past years, your Company has
been able to successfully manage,
reduce and control the E&S risks
associated with its portfolio. In the year
under review, your Company rejected
several business opportunities due to
non-conformity to E&S policy like
absence of sufficient regulatory
clearances, public interest litigations,
land and other issues. On the other
hand, your Company has encouraged
sustainable development by investing in
various renewable energy projects. Your
Company will endeavour a Corporate
Rollout Programme by conducting E&S
training for its clients across the country
for carrying out business with better
management of E&S risks, thereby
enhancing your Company’s USP and
brand name in the market.
Your Company believes in a
sustainable finance business approach
by considering conservation,
management and sustainable use of
human and natural resources. This
endeavour certainly creates a strong
and confident long term relationship
with its stakeholders.
CORPORATE SOCIALRESPONSIBILITYRecognising its social responsibility,
your Company had established a
public charitable trust in the name of
‘Srei Foundation’ with the objective of
granting scholarships and other
financial assistance to deserving and
talented candidates. The Fund also
supports setting up of schools,
colleges, medical and scientific
research institutions. Donations to Srei
Foundation qualify for deduction under
Section 80G of the Income Tax Act,
1961. Your Company has granted
donation of Rupees Fifty lakh to Srei
Foundation during the financial year
2011-12.
Your Company also promotes all-round
development of a clean environment
and help in propagating and imparting

Annual Report 2011-12
73
education for the betterment of
agriculture / horticulture and other
similar activities.
Your Company is fully aware of the fact
that as a corporate citizen, it is also
entrusted with the responsibility to
contribute for the betterment of the
community at large. During the year
under review, your Company supported
a variety of charitable projects and
social welfare activities and has
contributed a sum of `82,13,082/-
(Rupees Eighty two lakh thirteen
thousand and eighty two only) to
several welfare and charitable
organisations.
CORPORATEGOVERNANCEYour Company has always practised
sound corporate governance and takes
necessary actions at appropriate times
for enhancing and meeting
stakeholders’ expectations while
continuing to comply with mandatory
provisions of corporate governance.
A separate section on Corporate
Governance and a Certificate from the
Auditors of your Company regarding
compliance with the requirements of
corporate governance as stipulated
under Clause 49 of the Listing
Agreement with the Stock Exchanges,
form part of the Annual Report.
TRANSFER TO INVESTOREDUCATION &PROTECTION FUNDDuring the year under review, your
Company has transferred a sum of
`3,54,549/- to the Investor Education &
Protection Fund, the dividend amount
which was due & payable and
remained unclaimed and unpaid for a
period of seven years, as provided in
Section 205A(5) of the Companies Act,
1956. Cumulatively, the dividend
amount transferred to the said Fund
upto March 31, 2012 was
`28,33,842.69.
SUBSIDIARY COMPANIESDuring the year under review, the Share
Capital of Srei Mutual Fund Asset
Management Private Limited, a wholly
owned subsidiary of your Company
was enhanced to `13 crore (Rupees
Thirteen crore only) consequent upon
infusion of fresh capital by your
Company.
Your Company enhanced its aggregate
stake from 99.80 per cent to 99.90 per
cent in Quippo Oil & Gas Infrastructure
Limited, a subsidiary of your Company
by acquisition of 30,000 equity shares.
IIS International Infrastructure Services
GmbH (IIS), Germany, a subsidiary of
your Company has enhanced its stake
in Zao Srei Leasing, Russia, a sub-
subsidiary of your Company, from
57.14 per cent to 64.20 per cent by
acquisition of 25,950 equity shares.
Further, IIS has infused further capital
of SGD 50,000 (Singapore Dollars Fifty
Thousand only) in Srei Advisors Pte.
Limited, Singapore, a wholly owned
subsidiary of IIS. Quippo Infocomm
Limited (QIL) has ceased to be a sub-
subsidiary of your Company w.e.f. July
16, 2011 consequent upon sale of
43,000 equity shares of QIL by Srei
Your Company enhanced
its aggregate stake from
99.80 per cent to 99.90 per
cent in Quippo Oil & Gas
Infrastructure Limited.

74
Infrastructure Advisors Limited, a
subsidiary of your Company, at par
value.
Further, Quippo Construction Equipment
Limited (QCEL), a subsidiary of your
Company reduced its stake from 68 per
cent to 40.28 per cent in Kasco Steel
Limited (KSL) pursuant to which KSL
ceased to be a sub-subsidiary of your
Company w.e.f. September 22, 2011.
Subsequently, QCEL disposed off its
entire shareholding in KSL on December
03, 2011.
Further, Quippo Holding Cooperatief
U.A., Netherlands, a subsidiary of
Quippo Oil and Gas Infrastructure
Limited and Quippo International B.V.,
Netherlands, a subsidiary of Quippo
Holding Cooperatief U.A., Netherlands
were liquidated w.e.f. February 13,
2012. Quippo Mara Infrastructure
Limited, British Virgin Islands, a
subsidiary of Quippo International B.V.,
Netherlands ceased to be a sub-
subsidiary of your Company w.e.f.
February 13, 2012 on account of
liquidation of its holding company.
During the year under review, Quippo
Mauritius Private Limited, Mauritius was
incorporated on March 05, 2012 as a
wholly owned subsidiary of Quippo
Energy Private Limited, a wholly owned
subsidiary of your Company. Thereafter,
Quippo Energy Nigeria Private Limited,
Nigeria was incorporated on March 22,
2012 as a wholly owned subsidiary of
Quippo Mauritius Private Limited,
Mauritius.
Further, consequent upon receipt of
requisite approvals of the regulatory
authorities, your Company has
acquired 51 per cent shareholding in
Srei Insurance Broking Private Limited
(SIBPL) and hence, SIBPL has become
a subsidiary of your Company w.e.f.
March 31, 2012.
The Statement pursuant to Section 212
of the Companies Act, 1956, containing
details of your Company’s subsidiaries
in India and Overseas, forms part of the
Annual Report.
In compliance with General Circular
No: 2/2011 dated February 08, 2011 of
Government of India, Ministry of
Corporate Affairs, the audited
statement of accounts along with the
reports of the Board of Directors and
Auditors relating to your Company’s
subsidiaries in India and Overseas are
not annexed as required under Section
212 of the Companies Act, 1956.
Shareholders who wish to have a copy
of the full report and accounts of the
aforesaid subsidiary companies will be
provided the same by the Company
Secretary on receipt of a written request
from them. These documents will also
be available for inspection by any
shareholder at the Registered Office of
your Company and the concerned
subsidiary companies during business
hours on all working days. Further, the
documents shall be available on the
website of your Company. However, as
directed by the Ministry of Corporate
Affairs, Government of India, the
financial data of the subsidiaries have
been separately furnished and form
part of the Annual Report. Further, in
Your Company has
acquired 51 per cent
shareholding in Srei
Insurance Broking Private
Limited (SIBPL) and hence,
SIBPL has become a
subsidiary of your Company
w.e.f. March 31, 2012.
Annual Report 2011-12
75
line with the Listing Agreement with the
Stock Exchanges and in accordance
with the Accounting Standard 21 (AS-
21), Consolidated Financial Statements
prepared by your Company include
financial information of its subsidiary
companies.
PARTICULARS OFEMPLOYEESThe names and other particulars of the
employees as required under Section
217(2A) of the Companies Act, 1956
read with the Companies (Particulars of
Employees) Rules, 1975, are set out in
the annexure to the Directors’ Report
and form part of this report.
PARTICULARS OFCONSERVATION OFENERGY, TECHNOLOGYABSORPTION, FOREIGNEXCHANGE EARNINGSAND OUTFLOWYour Company has no activity relating
to Conservation of Energy and
Technology Absorption as stipulated in
the Companies (Disclosure of
Particulars in the Report of Board of
Directors) Rules, 1988. However, your
Company uses information technology
extensively in its operations.
During the year under review, the total
foreign exchange earnings and
expenditure of your Company was
`117 lakh and `18,972 lakh
respectively (previous year `238 lakh
and `10,953 lakh respectively).
SREI WEBSITEThe website of your Company,
www.srei.com, has been redesigned to
present the Company’s businesses up-
front on the home page. The redesigned
site carries a comprehensive database
of information of interest to the investors
including the financial results of
your Company, dividend declared,
shareholding pattern, any price sensitive
information disclosed to the regulatory
authorities from time to time, analyst
reports, investor presentations, media
coverage, corporate profile and
business activities of your Company and
the services rendered by your Company
to its investors.
DIRECTORSDuring the year under review, Mr.
Kishore Kumar Mohanty resigned as
Director of your Company w.e.f. June
07, 2011 due to his personal
preoccupations. The Board wishes to
place on record its sincere appreciation
of the sterling contribution made by Mr.
Mohanty towards the growth and
development of your Company through
his wealth of knowledge and
experience during his long tenure of
over ten years as a Director of your
Company.
Further, Mr. Avinder Singh Bindra
resigned as Director of your Company
w.e.f. February 07, 2012 due to his
personal preoccupations. The Board
wishes to place on record deep
appreciation of the contribution, advice
and guidance extended by him during
his tenure as a Director of your
Company.
Mr. Saud Ibne Siddique was re-
appointed as the Joint Managing
Director of your Company for a further
period of 3 (three) years w.e.f. April 01,
2012 based on the recommendation of
the Compensation Committee of your
Company. In accordance with the
provisions of Section 302 of the
Companies Act, 1956, the Members
were furnished an abstract of the terms
of re-appointment and payment of
remuneration to Mr. Saud Ibne
Siddique as Joint Managing Director of
your Company.
Further, the status of directorship of Mr.
Shyamalendu Chatterjee was changed
from being a Non-Executive Director to
an Independent Director w.e.f. April 01,
2012 in accordance with Clause 49I(A)
of the Listing Agreement.
In accordance with the provisions of the
Companies Act, 1956 and your
Company's Articles of Association, Mr.
Salil K. Gupta, Mr. Shyamalendu
Chatterjee and Dr. Satish C. Jha retire
by rotation at the ensuing Annual
General Meeting (AGM) and being
eligible, offer themselves for re-
appointment. All these Directors have
filed Form DDA with your Company as
required under the Companies
(Disqualification of Directors under
Section 274(1)(g) of the Companies
Act, 1956) Rules, 2003. The brief
resume / details relating to Directors
who are to be appointed / re-appointed
are furnished in the Notice of the
ensuing AGM. The Board of Directors
of your Company recommends the re-
appointment of all the above Directors
at the ensuing AGM.

76
In accordance with the approval of
Central Government read with General
Circular No: 4/2011 dated March 04,
2011 of Government of India, Ministry
of Corporate Affairs, your Company has
approved payment of remuneration of
`50 lakh by way of commission on net
profits calculated under Section 198 of
the Companies Act, 1956 to Non-
executive Directors of your Company
for the financial year 2011-12.
AUDIT COMMITTEEThe Audit Committee comprises of Mr.
Salil K. Gupta, Mr. V. H. Pandya, Mr. S.
Rajagopal, Mr. Sujitendra Krishna Deb,
Mr. Shyamalendu Chatterjee,
Independent & Non Executive Directors
and Mr. Sunil Kanoria, Non Executive
Director. Mr. Salil K. Gupta, Chief
Mentor & Director of your Company is
the Chairman of the Audit Committee.
DIRECTORSʼRESPONSIBILITYSTATEMENTIn terms of provisions of Section
217(2AA) of the Companies Act, 1956
(Act), your Directors confirm that:
(i) In the preparation of the annual
accounts for the financial year
ended March 31, 2012, the
applicable accounting standards
have been followed along with
proper explanation relating to
material departures;
(ii) the Directors have selected such
accounting policies and applied
them consistently and made
judgements and estimates that are
reasonable and prudent so as to
give a true and fair view of the state
of affairs of your Company at the
end of the financial year and of the
profit of your Company for the year;
(iii) the Directors have taken proper and
sufficient care for the maintenance
of adequate accounting records in
accordance with the provisions of
this Act for safeguarding the assets
of your Company and for preventing
and detecting fraud and other
irregularities; and
(iv) the Directors have prepared the
annual accounts for the financial
year ended March 31, 2012 on a
going concern basis.
AUDITORSMessrs Haribhakti & Co., Chartered
Accountants having registration No.
103523W allotted by The Institute of
Chartered Accountants of India (ICAI),
retire as Auditors of your Company at
the conclusion of the ensuing Annual
General Meeting (AGM) and have
confirmed their eligibility and
willingness to accept the office of
Auditors, if re-appointed. Your
Company has received a confirmation
from Messrs Haribhakti & Co.,
Chartered Accountants to the effect
that their re-appointment, if made,
would be within the limits prescribed
under Section 224(1B) of the
Companies Act, 1956. They have also
confirmed that they hold a valid peer
review certificate as prescribed under
Clause 41(1)(h) of the Listing
Agreement.
The Audit Committee and the Board of
Directors of your Company recommend
the re-appointment of Messrs
Haribhakti & Co., Chartered
Accountants, as the Auditors of your
Company. Members are requested to
consider their re-appointment as
Auditors of your Company to hold office
from conclusion of ensuing AGM to the
conclusion of next AGM on
remuneration to be decided by the
Board of Directors based on
recommendation of the Audit
Committee of your Company.
SECRETARIAL AUDITREPORTAs a measure of good corporate
governance practice, your Company
appointed Dr. K. R. Chandratre,
Practising Company Secretary, to
conduct the Secretarial Audit. The
Secretarial Audit Report for the financial
year ended March 31, 2012 is provided
in the Annual Report.
The Secretarial Audit Report confirms
that your Company has complied inter
alia with all the applicable provisions of
the Companies Act, 1956, Depositories
Act, 1996, Listing Agreements with the
Stock Exchanges, Securities Contracts
(Regulation) Act, 1956 and all the
Regulations and Guidelines of SEBI as
applicable to your Company, including
the SEBI (Substantial Acquisition of
Shares and Takeovers) Regulations,
2011 and the SEBI (Prohibition of
Insider Trading) Regulations, 1992.

Annual Report 2011-12
77
ACKNOWLEDGEMENTYour Directors would like to express
their grateful appreciation for the
excellent support and co-operation
received from the Financial Institutions,
Banks, Central & State Government
Authorities, RBI, SEBI, Ministry of
Corporate Affairs (MCA), Registrar of
Companies, Indian and Overseas
Stock Exchanges, Depositories, Credit
Rating Agencies, Customers,
Manufacturers, Vendors, Suppliers,
Business Associates, Shareholders
and other Stakeholders during the year
under review. Your Directors also place
on record their deep appreciation for
the valuable contribution of the
employees at all levels for the progress
of your Company during the year and
look forward to their continued co-
operation in realisation of the corporate
goals in the years ahead.
On behalf of the Board of Directors
Kolkata Hemant Kanoria
May 14, 2012 Chairman & Managing Director
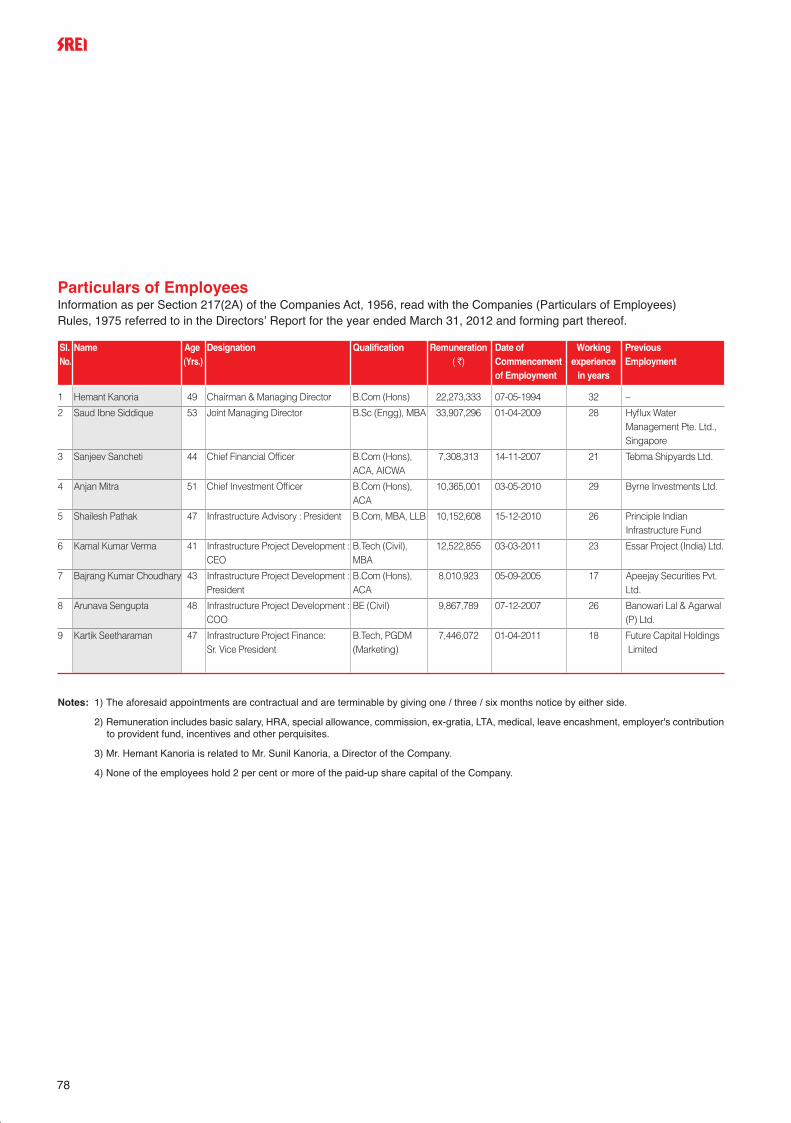
78
Particulars of EmployeesInformation as per Section 217(2A) of the Companies Act, 1956, read with the Companies (Particulars of Employees) Rules, 1975 referred to in the Directorsʼ Report for the year ended March 31, 2012 and forming part thereof.
Sl. Name Age Designation Qualification Remuneration Date of Working Previous No. (Yrs.) ( `) Commencement experience Employment
of Employment in years
1 Hemant Kanoria 49 Chairman & Managing Director B.Com (Hons) 22,273,333 07-05-1994 32 –
2 Saud Ibne Siddique 53 Joint Managing Director B.Sc (Engg), MBA 33,907,296 01-04-2009 28 Hyflux WaterManagement Pte. Ltd.,Singapore
3 Sanjeev Sancheti 44 Chief Financial Officer B.Com (Hons), 7,308,313 14-11-2007 21 Tebma Shipyards Ltd. ACA, AICWA
4 Anjan Mitra 51 Chief Investment Officer B.Com (Hons), 10,365,001 03-05-2010 29 Byrne Investments Ltd.ACA
5 Shailesh Pathak 47 Infrastructure Advisory : President B.Com, MBA, LLB 10,152,608 15-12-2010 26 Principle IndianInfrastructure Fund
6 Kamal Kumar Verma 41 Infrastructure Project Development : B.Tech (Civil), 12,522,855 03-03-2011 23 Essar Project (India) Ltd.CEO MBA
7 Bajrang Kumar Choudhary 43 Infrastructure Project Development : B.Com (Hons), 8,010,923 05-09-2005 17 Apeejay Securities Pvt.President ACA Ltd.
8 Arunava Sengupta 48 Infrastructure Project Development : BE (Civil) 9,867,789 07-12-2007 26 Banowari Lal & Agarwal COO (P) Ltd.
9 Kartik Seetharaman 47 Infrastructure Project Finance: B.Tech, PGDM 7,446,072 01-04-2011 18 Future Capital HoldingsSr. Vice President (Marketing) Limited
Notes: 1) The aforesaid appointments are contractual and are terminable by giving one / three / six months notice by either side.
2) Remuneration includes basic salary, HRA, special allowance, commission, ex-gratia, LTA, medical, leave encashment, employer's contributionto provident fund, incentives and other perquisites.
3) Mr. Hemant Kanoria is related to Mr. Sunil Kanoria, a Director of the Company.
4) None of the employees hold 2 per cent or more of the paid-up share capital of the Company.

Annual Report 2011-12
79
Secretarial Audit Report
The Board of Directors
Srei Infrastructure Finance Limited“Vishwakarma”
86C, Topsia Road (South)
Kolkata - 700 046
I have examined the registers, records and documents of Srei
Infrastructure Finance Limited ("the Company") for the financial year
ended on March 31, 2012 according to the provisions of
➢ The Companies Act, 1956 and the Rules made under that
Act; ➢ The Securities Contracts (Regulation) Act, 1956 ('SCRA'),
the Rules made under that Act;➢ The Depositories Act, 1996 and the Regulations and Bye-
laws framed under that Act;➢ The following Regulations and Guidelines prescribed under
the Securities and Exchange Board of India Act, 1992
(`SEBI Act') The Securities and Exchange Board of India (Substantial
Acquisition of Shares and Takeovers) Regulations, 2011; The Securities and Exchange Board of India (Prohibition
of Insider Trading) Regulations, 1992; The Securities and Exchange Board of India (Issue of
Capital and Disclosure Requirements) Regulations, 2009; The Securities and Exchange Board of India (Employee
Stock Option Scheme and Employee Stock Purchase
Scheme) Guidelines, 1999; The Securities and Exchange Board of India (Issue and
Listing of Debt Securities) Regulations, 2008; and The Securities and Exchange Board of India (Buy Back
of Securities) Regulations, 1998;➢ The Equity Listing Agreements with Calcutta Stock
Exchange Limited, Bombay Stock Exchange Limited and
National Stock Exchange of India Limited and GDR Listing
Agreement with London Stock Exchange and Debt Listing
Agreement with Bombay Stock Exchange Limited.
1. Based on my examination and verification of the registers,
records and documents produced to me and according
to the information and explanations given to me by the
Company, I report that the Company has, in my opinion,
complied with the provisions of the Companies Act, 1956
("the Act") and the Rules made under the Act and the
Memorandum and Articles of Association of the Company,
with regard to:
(a) maintenance of various statutory registers and documents
and making necessary entries therein;
(b) closure of the Register of Members / Debenture holders;
(c) forms, returns, documents and resolutions required to be
filed with the Registrar of Companies and Central
Government;
(d) service of documents by the Company on its Members,
Debenture holders, Debenture Trustees, Auditors and the
Registrar of Companies;
(e) notice of Board meetings and Committee meetings of
Directors;
(f) the meetings of Board and Committees of Board including
passing of resolutions by circulation;
(g) the 26th Annual General Meeting held on July 30, 2011;
(h) minutes of proceedings of General Meetings and of the
Board and its Committee meetings;
(i) approvals of the Members, the Board of Directors, the
Committees of Board and government authorities,
wherever required;
(j) constitution of the Board of Directors / Committee(s) of
Board, appointment, retirement and re-appointment of
Directors including the Managing Director, Joint
Managing Director and Whole-time Directors;
(k) payment of remuneration to Directors including the
Managing Director, Joint Managing Director and Whole-
time Directors;
(l) appointment and remuneration of Auditors;
(m)transfers and transmissions of the Company's shares and
debentures, issue and allotment of shares and
debentures and issue and delivery of original and
duplicate certificates of shares and debentures;
(n) payment of interest on debentures and redemption of
debentures;
(o) declaration and payment of dividends;
(p) transfer of certain amounts as required under the Act to
80
the Investor Education and Protection Fund;
(q) borrowings and registration, modification and satisfaction
of charges;
(r) investment of the Company's funds including inter
corporate loans and investments and loans to others;
(s) giving guarantees in connection with loans taken by
subsidiaries and associate companies;
(t) form of balance sheet as prescribed under Part I, form of
statement of profit and loss as prescribed under Part II
and General Instructions for preparation of the same as
prescribed in Schedule VI to the Act;
(u) Buy-back of Equity shares;
(v) Board's Report;
(w) contracts, common seal, registered office and publication
of name of the Company; and
(x) generally, all other applicable provisions of the Act and
the Rules made under the Act.
2. I further report that:
(a) the Directors have complied with the requirements as to
disclosure of interests and concerns in contracts and
arrangements, shareholdings / debenture holdings and
directorships in other companies and interests in other
entities;
(b) the Directors have complied with the disclosure
requirements in respect of their eligibility of appointment,
their being independent and compliance with the Code
of Ethics for Directors and Management Personnel;
(c) the Company has obtained all necessary approvals under
the various provisions of the Act; and
(d) there was no prosecution initiated and no fines or
penalties were imposed during the year under review
under the Companies Act, SEBI Act, SCRA, Depositories
Act, Listing Agreement and Rules, Regulations and
Guidelines framed under these Acts against / on the
Company, its Directors and Officers.
3. I further report that the Company has complied with the
provisions of the Depositories Act, 1996 and the Bye-laws
framed thereunder by the Depositories with regard to
dematerialisation / rematerialisation of securities and
reconciliation of records of dematerialised securities with
all securities issued by the Company.
4. I further report that:
(a) the Company has complied with the requirements under
the Equity Listing Agreements entered into with the
Calcutta Stock Exchange Limited, Bombay Stock
Exchange Limited, and National Stock Exchange of India
Limited and GDR Listing Agreement with London Stock
Exchange and the Debt Listing Agreement with Bombay
Stock Exchange Limited;
(b) the Company has complied with the provisions of the
Securities and Exchange Board of India (Substantial
Acquisition of Shares and Takeovers) Regulations, 1997/
2011 including the provisions with regard to disclosures
and maintenance of records required under the
Regulations;
(c) the Company has complied with the provisions of the
Securities and Exchange Board of India (Prohibition of
Insider Trading) Regulations, 1992 including the
provisions with regard to disclosures and maintenance of
records required under the Regulations;
(d) the Company has not issued any Stock Options and
hence the provisions of the Securities and Exchange
Board of India (Employee Stock Option Scheme and
Employee Stock Purchase Scheme) Guidelines, 1999 with
regard to implementation of Employee Stock Option
Scheme, grant of Options and other aspects are not
applicable; and
(e) the Company has complied with the provisions of the
Securities and Exchange Board of India (Issue and Listing
of Debt Securities) Regulations, 2008.
(f) The Company has not bought back any securities and
hence the provisions of Securities and Exchange Board of
India (Buy Back of Securities) Regulations, 1998 are not
applicable.
Dr. K. R. Chandratre
Practising Company Secretary
May 11, 2012 Certificate of Practice No. 5144

Annual Report 2011-12
81
We, Saud Ibne Siddique, Joint Managing Director (CEO) and Sanjeev
Sancheti, Chief Financial Officer (CFO) of Srei Infrastructure Finance
Limited both certify to the Board that we have reviewed the financial
statements of the Company for financial year ended on March 31,
2012 and to the best of our knowledge and belief, we certify that –
1. The Statements do not contain any materially untrue statement or
omit any material fact or contain statements that might be
misleading; that the Statements together present a true and fair
view of the Company’s affairs and are in compliance with existing
accounting standards, applicable laws and regulations.
2. There are no fraudulent or illegal transactions.
3. For the purposes of financial reporting, we accept the
responsibility for establishing and maintaining the internal
controls which are monitored by the Company’s Internal Audit
Team and have evaluated based on feedbacks received from the
Company’s Internal Audit Team, the effectiveness of the internal
control systems of the Company pertaining to financial reporting
and have reported to the Auditors and the Audit Committee, the
deficiencies, if any, in the operation and design of such internal
controls.
4. We have indicated to the Auditors and the Audit Committee:
(i) significant changes, if any in the internal controls over
financial reporting during the year;
(ii) significant changes, if any in accounting policies made
during the year and the same have been disclosed in the
notes to the financial statements; and
(iii) instances of significant fraud, if any of which we have
become aware and the involvement therein, if any of the
management or an employee having a significant role in
the Company’s internal control system over financial
reporting.
Saud Ibne Siddique Sanjeev Sancheti
Joint Managing Director (CEO) Chief Financial Officer (CFO)
The Board of Directors May 14, 2012Srei Infrastructure Finance Limited‘Vishwakarma’86C Topsia Road (South)Kolkata – 700 046
We have examined the compliance of conditions of corporate
governance by Srei Infrastructure Finance Limited, for the year ended
on March 31, 2012, as stipulated in Clause 49 of the Listing
Agreement of the Company with the stock exchanges.
The compliance of conditions of Corporate Governance is the
responsibility of the Management. Our examination was limited to
procedures and implementations thereof, adopted by the Company
for ensuring the compliance of the conditions of the Corporate
Governance. It is neither an audit nor expression of opinion on the
Financial Statements of the Company.
In our opinion and to the best of our information and according to the
explanations given to us, we certify that the Company has complied
with the conditions of Corporate Governance as stipulated in the
above mentioned Listing Agreement.
We further state that such compliance is neither an assurance as to
future viability of the Company nor the efficiency with which the
Management has conducted the affairs of the Company.
For Haribhakti & Co.
Chartered Accountants
(Firm’s Registration No.103523W)
Anand Kumar Jhunjhunwala
Place : Kolkata Partner
Dated : May 14, 2012 Membership No.056613
To
The Members,
Srei Infrastructure Finance Limited
Certificate by Chief Executive Officer (CEO)and Chief Financial Officer (CFO)
Auditors’ Certificate on Corporate Governance

82
Corporate Governance is the
combination of voluntary practices and
compliance with laws and regulations
leading to effective control and
management of the Organisation.
Good Corporate Governance leads to
long term shareholder value and
enhances interest of other
stakeholders.
Srei is committed to the adoption of and
adherence to the best Corporate
Governance practices at all times and
continuously benchmarks itself against
each such practice in the industry. Srei
understands and respects its fiduciary
and trusteeship role and responsibility
to its stakeholders and strives hard to
meet their expectations. Srei believes
that Corporate Governance is a journey
for constantly improving sustainable
value creation and is an upward
moving target. Over the years, the
governance processes and systems
have therefore been strengthened at
Srei.
The Company’s Equity shares are
presently listed on three Stock
Exchanges in India and the Global
Depository Receipts (GDRs) are listed
on London Stock Exchange. Srei has
complied in all material respects with
the features of Corporate Governance
Code as per Clause 49 of the Listing
Agreement with the domestic Stock
Exchanges. In accordance with Clause
49 of the Listing Agreement with the
domestic Stock Exchanges, the details
of compliances by the Company for the
year ended March 31, 2012 are as
under:
A. MANDATORYREQUIREMENTS
1. Companyʼs philosophy onCode of GovernanceThe Company has endeavoured to
benchmark itself against global
standards in all areas, including
Corporate Governance. Good
Corporate Governance implies
optimum utilisation of the resources and
ethical behaviour of the enterprise to
enhance the shareholders’ value with
strong emphasis on transparency,
accountability and integrity, which are
the primary objectives of Srei.
2. Board of Directors
Composition
The Board has strength of 9 (Nine)
Directors as on March 31, 2012. The
Board comprises of Executive, Non-
Executive and Independent Directors.
Two Directors are Non-executive
Directors, two Directors are Executive
Directors (including the Chairman) and
five Directors are Non-executive and
Independent Directors.
None of the Directors on the Board is a
member of more than 10 committees
and Chairman of more than 5
committees across all companies in
which he is a Director. All the Directors
have made necessary disclosures
regarding committee positions
occupied by them in other companies.
The Company has taken a Directors’
and Officers’ Liability Insurance Policy
in order to safeguard and protect the
interests of the Directors from any
contingent liabilities.
The agenda papers along with the
explanatory notes for Board meetings
are sent well in advance to the
Directors. In some instances,
documents are tabled at the meetings
and presentations are also made by the
respective executives on the matters
related to them at the Board meetings.
The Composition of the Board of
Directors as on March 31, 2012 is in
conformity with the provisions of Clause
49 of the Listing Agreement. The details
of the Board of Directors as on March
31, 2012 are as under:
Report on Corporate Governance

Annual Report 2011-12
83
Mr. Hemant Kanoria (Promoter) and Mr.
Sunil Kanoria hold 421732 and
1802714 Equity shares in the Company
respectively as on March 31, 2012.
None of the other directors hold any
Equity shares in the Company. The
shareholding of Mr. Sunil Kanoria is
locked-in for a period of three years till
March 17, 2014.
Mr. Salil K. Gupta, Mr. V. H. Pandya and
Mr. S. Rajagopal, Independent
Directors of the Company are holding
4,86,00,000 Equity shares (allotted to
the Company pursuant to
amalgamation of Quippo Infrastructure
Equipment Limited (Quippo) into and
with the Company in lieu of 1,80,00,000
Equity shares held by the Company in
Quippo) for the benefit of the Company
and/or the shareholders of the
Company, as Trustees of ‘Srei Growth
Trust’. These shares are locked-in for a
period of three years till March 17,
2014.
All the Independent Directors of the
Company furnish a declaration at the
time of their appointment as also
annually that they qualify the tests of
their being independent as laid down
under Clause 49. All requisite
declarations were placed before the
Board.
Except Mr. Hemant Kanoria and Mr.
Sunil Kanoria, no Director of the
Company is related to any other
Director on the Board.
Number of Board meetings held and
the dates on which held
Five Board meetings were held during
the year 2011-12 on May 19, 2011, July
30, 2011, October 20, 2011, December
19, 2011 and February 03, 2012. A
Circular Resolution was approved by
the Board of Directors on March 28,
2012. The maximum time gap between
any two consecutive meetings did not
exceed four months.
*Appointed w.e.f. May 19, 2011** Resigned w.e.f. February 07, 2012***Resigned w.e.f. June 07, 2011
Sl. No. Directors Category
1. Mr. Salil K. Gupta (Chief Mentor) Non-Executive & Independent
2. Mr. Hemant Kanoria (Chairman) Chairman & Managing Director
3. Mr. Sunil Kanoria (Vice Chairman) Non-Executive
4. Mr. V. H. Pandya Non-Executive & Independent
5. Mr. S. Rajagopal Non-Executive & Independent
6. Mr. S. Chatterjee Non-Executive
7. Dr. Satish C. Jha Non-Executive & Independent
8. Mr. Sujitendra Krishna Deb* Non Executive & Independent
9. Mr. Avinder Singh Bindra** Non Executive & Independent
10. Mr. Saud Siddique Joint Managing Director
11. Mr. K. K. Mohanty*** Non-Executive

84
Attendance of each Director at Board meetings and at the last AGM
*Appointed w.e.f. May 19, 2011** Resigned w.e.f. February 07, 2012***Resigned w.e.f. June 07, 2011
Directors No. of Board meetings attended Attendance at the last AGM held on July 30, 2011
Mr. Salil K. Gupta 5 Yes
Mr. Hemant Kanoria 5 Yes
Mr. Sunil Kanoria 4 Yes
Mr. V. H. Pandya 3 Yes
Mr. S. Rajagopal 5 Yes
Mr. S. Chatterjee 5 Yes
Dr. Satish C. Jha 3 No
Mr. Sujitendra Krishna Deb* 4 Yes
Mr. Avinder Singh Bindra** 4 Yes
Mr. Saud Siddique 4 Yes
Mr. K. K. Mohanty*** - N.A.
Number of other Companies or Committees in which the Director is a Director / Chairman
The following table gives the number of outside directorships and the Committee positions held by each of the Directors as
on March 31, 2012 -
*Appointed w.e.f. May 19, 2011**Includes Directorships in private limited companies, foreign companies, companies under Section 25 of the Companies Act, 1956 andalternate directorships***Includes only Audit Committee and Shareholders’ Grievance Committee
Directors No. of Directorship in other Companies No. of Committee positions held(other than Srei Infrastructure Finance Limited) in Indian Public Limited Companies
(other than Srei Infrastructure Finance Limited)***
Indian Public Others** Chairman MemberLimited Companies
Mr. Salil K. Gupta 1 2 - 1
Mr. Hemant Kanoria 6 5 2 1
Mr. Sunil Kanoria 4 2 - 3
Mr. V. H. Pandya 4 - 2 -
Mr. S. Rajagopal 9 5 1 4
Mr. S. Chatterjee 1 1 - 1
Dr. Satish C. Jha 2 - - 1
Mr. Sujitendra Krishna Deb* - - - -
Mr. Saud Siddique 2 2 - -

Annual Report 2011-12
85
4. Remuneration of DirectorsDetails of remuneration paid/payable to Directors for the year ended March 31, 2012 are as follows:
3. Audit Committee
Terms of Reference, Composition,
Name of Members and Chairman
The Audit Committee comprises of Mr.
Salil K. Gupta, Mr. V. H. Pandya, Mr. S.
Rajagopal, Mr. Sujitendra Krishna Deb,
Independent & Non Executive Directors
and Mr. Sunil Kanoria, Non Executive
Director. Mr. Salil K. Gupta, Chief Mentor
& Director of the Company is the
Chairman of the Audit Committee. All the
members of the Audit Committee are
financially literate. The Head of Internal
Audit Department and the Chief
Financial Officer attends the meetings of
the Audit Committee and the Company
Secretary acts as the Secretary to the
Audit Committee. The Statutory Auditors
of the Company are invited to attend the
Audit Committee meetings. The
Committee also invites senior
executives, as it considers appropriate,
to be present at the meetings of the
Committee. The Terms of Reference of
this Committee includes ensuring proper
disclosures in the financial statements,
recommending re-appointment of
statutory auditors and fixation of their
remuneration, reviewing annual financial
statements before submission to the
Board, reviewing adequacy of internal
control systems and other matters
specified for Audit Committee in Section
292A of the Companies Act, 1956 and
under the Listing Agreements. The
Chairman of the Audit Committee was
present at the last Annual General
Meeting of the Company to answer
shareholder queries.
The Audit Committee has
recommended to the Board of Directors,
the re-appointment of Messrs Haribhakti
& Co., Chartered Accountants, as the
Auditors of the Company to hold office
till the conclusion of the next Annual
General Meeting.
Meetings and attendance during the
year
Five meetings of the Audit Committee
were held during the year 2011-12 on
May 19, 2011, July 30, 2011, October
20, 2011, December 19, 2011 and
February 03, 2012. The attendance of
each member of the Committee is
given below:
MembersNo. of
Meetingsattended
Mr. Salil K. Gupta 5
Mr. Sunil Kanoria 4
Mr. V. H. Pandya 3
Mr. S. Rajagopal 5
Mr. Sujitendra Krishna Deb* 3
*Appointed w.e.f. May 19, 2011
(Amount in `)
# includes sitting fees paid for various Board Committee meetings
* Appointed w.e.f. May 19, 2011
** Resigned w.e.f. February 07, 2012
*** Resigned w.e.f. June 07, 2011
1 includes basic salary, incentives, allowances, contribution toprovident fund, leave encashment and other perquisites
2 The Commission for the year ended March 31, 2012 will be paid,subject to deduction of tax, after adoption of the accounts by themembers at the ensuing Annual General Meeting
Directors Sitting Fees# Salary & Perquisites1 Commission2 Total
Mr. Salil K. Gupta (Chief Mentor) 3,60,000 - 15,00,000 18,60,000
Mr. Hemant Kanoria (Chairman & Managing Director) N.A. 1,62,73,333 60,00,000 2,22,73,333
Mr. Sunil Kanoria (Vice Chairman) 5,40,000 - 10,00,000 15,40,000
Mr. V. H. Pandya 87,500 - 5,00,000 5,87,500
Mr. S. Rajagopal 1,40,000 - 5,00,000 6,40,000
Mr. S. Chatterjee 1,05,000 - 5,00,000 6,05,000
Dr. Satish C. Jha 60,000 - 5,00,000 5,60,000
Mr. Sujitendra Krishna Deb* 97,500 - 5,00,000 5,97,500
Mr. Avinder Singh Bindra** 85,000 - - 85,000
Mr. Saud Siddique (Joint Managing Director) N.A. 3,39,07,296 - 3,39,07,296
Mr. K. K. Mohanty*** - - - -
86
The appointment of Managing Director
and Joint Managing Director is
governed by resolutions passed by
the Board of Directors and the
Shareholders of the Company, which
covers the terms and conditions of
such appointment, and approval of
Central Government, wherever
applicable. Payment of remuneration
to Managing Director and Joint
Managing Director is governed by the
respective agreements executed
between them and the Company, and
approval of Central Government,
wherever applicable. The agreement
with the Joint Managing Director has
been entered into by the Company for
a period of 3 (Three) years w.e.f. April
01, 2012 whereas the agreement with
the Managing Director has been
entered into by the Company for a
period of 5 (Five) years w.e.f. April 01,
2010. The said appointments may be
terminated by giving respectively clear
90 (Ninety) days or 3 (Three) months
notice in writing.
The Non-Executive Directors are paid
remuneration by way of sitting fees
for each meeting of the Board or any
Committee thereof attended by them
and reimbursement of out-of-pocket
expenses incurred, wherever
applicable, for attending such
meetings. The sitting fees as
determined by the Board are
presently `20,000/- for attending
each meeting of the Board, `15,000/-
for attending each meeting of the
Audit Committee and `10,000/- for
attending each meeting of remaining
Committees.
Further, the members of the
Company at their meeting held on
August 09, 2010 as well as the
Central Government vide its letter
dated March 04, 2011 have
approved payment of commission to
Non-Executive Directors of the
Company annually for each of the
three financial years of the Company
commencing from Financial Year
2010-11, upto a maximum limit of ̀ 50
lakh payable in one financial year to
be divided amongst Non-Executive
Directors in such manner as may be
decided by the Board from time to
time. In accordance with the
approval of Central Government read
with General Circular No: 4/2011
dated March 04, 2011 of Government
of India, Ministry of Corporate Affairs,
your Company has approved
payment of remuneration of `50 lakh
by way of commission on net profits
calculated under Section 198 of the
Companies Act, 1956 to Non-
executive Directors of your Company
for the financial year 2011-12.
No pecuniary transactions have been
entered into by the Company with
any of the Non-Executive Directors of
the Company, save and except the
payment of sitting fees and
commission to them.
The remuneration by way of
commission to the Non-Executive
Directors is decided by the Board of
Directors and distributed to them
based on their attendance and
contribution at the Board and certain
Committee meetings as well as time
spent on operational matters other
than at the meetings.
5. Code of Conduct for Directorsand Senior Executives A Code of Ethics as applicable to the
Directors and Senior Executives has
been approved by the Board. The said
Code has also been displayed on the
Company’s website www.srei.com. The
Board members and Senior Executives
have affirmed their compliance with the
Code and a declaration signed by the
Chairman & Managing Director (CEO in
terms of Clause 49) is given below:
It is hereby declared that the Company
has obtained from all the Board
members and Senior Executives an
affirmation that they have complied with
the Code of Ethics for the financial year
2011-12.
sd/-
Hemant Kanoria
Chairman & Managing Director
6. Share Transfer and InvestorsʼRelations Committee
Details of the Members, Compliance
Officer and No. of Complaints received
The Share Transfer and Investors’
Relations Committee oversees and
reviews redressal of shareholder and
investor grievances, transfer &
transmission of shares, issue of
duplicate shares, exchange of new
design share certificates, recording
dematerialisation & rematerialisation of
shares and related matters. The Share
Transfer and Investors’ Relations
Committee meets at least once in a
fortnight to approve share transfer and
other matters. The Committee
comprises Mr. Salil K. Gupta, Chief

Annual Report 2011-12
87
Mentor & Director, Mr. Hemant Kanoria,
Chairman & Managing Director and Mr.
Sunil Kanoria, Vice Chairman & Non
Executive Director of the Company. Mr.
Salil K. Gupta, Chief Mentor & Director
of the Company is the Chairman of the
Share Transfer and Investors’ Relations
Committee. During the year 2011-12,
the Share Transfer and Investors’
Relations Committee met 26 times. Mr.
Sandeep Lakhotia, Company Secretary
is the Compliance Officer of the
Company and assigned with the
responsibilities of overseeing investor
grievances.
Total number of shares physically
transferred during the year 2011-12
was 18,212 shares compared to 13,118
shares during the year 2010-11.
During the financial year ended March
31, 2012, the Company received 11
complaints from the shareholders and
none of the complaints received were
pending as on that date.
The Company has formulated and put
in place a comprehensive Investor
Grievance Redressal Policy prescribing
the standards of shareholders’ service
& grievance redressal procedure and
mechanism to be adhered to by the
Registrar and Share Transfer Agents as
well as the Company.
It has been a constant endeavour of the
Company to send regular emails to the
shareholders keeping them abreast of
all the latest events, press releases and
corporate announcements that are
made by the Company from time to
time. Weekly emails to new
shareholders intimating corporate
profile, annual reports and investor
presentation and quarterly emails to all
shareholders intimating financial results
are being sent to those shareholders
who have registered their email
addresses with their respective
Depository Participants. In the wake of
electronic regime being the order of the
day, all shareholders are requested to
update their email addresses with their
respective Depository Participants to
enable the Company to serve them
better.
Apart from the Audit Committee and
Share Transfer and Investors’ Relations
Committee, the Company inter alia has
various other Committees like
Committee of Directors, Risk
Committee, Central Credit & Investment
Committee, Compensation Committee
and Asset Liability Management
Committee.
7. General Body Meetings
Details of the location of the last three
AGMs and the details of the
resolutions passed
The date, time and venue of the last
three AGMs of the Company have been
provided in the section on
Shareholders’ Information in the Annual
Report. All the resolutions set out in the
respective Notices were passed by the
Shareholders.
No Resolution requiring a postal ballot
was placed before the last Annual
General Meeting of the Company held
on July 30, 2011.
Similarly, no Special Resolution
requiring a postal ballot is being
proposed at the ensuing Annual
General Meeting of the Company.
8. DisclosuresDisclosures on materially significant
related party transactions i.e.
transactions of the Company of
material nature, with its promoters,
the directors or the management,
their subsidiaries or relatives etc. that
may have potential conflict with the
interests of Company at large
Transactions effected with the related
parties are disclosed under Note No.
35 in ‘Notes to the Financial Statements’
in the Annual Report, in accordance
with the requirements of Accounting
Standard AS 18 issued by The Institute
of Chartered Accountants of India.
Besides the transactions reported in
the Annual Report as aforesaid, no
transaction of material nature has been
entered into by the Company with its
directors or management and their
relatives, etc. that may have a potential
conflict with the interests of the
Company. The Register of Contracts
containing transactions, in which
directors are interested, is placed
before the Board regularly.
Details of non-compliance by the
Company, penalties, strictures
imposed on the Company by Stock
Exchange or SEBI or any statutory
authority, on any matter related to
capital markets, during the last three
years

88
Half-yearly report sent to each household of
shareholders
Since half-yearly and annual results of the Company are published in
leading English daily newspaper having a nationwide circulation and
prominent Bengali daily newspaper (having circulation in Kolkata) and
regularly hosted on the Company’s website, these are not sent individually
to the Shareholders of the Company. There is no declaration/publication
of second half-yearly results as the audited annual results are taken on
record by the Board and then communicated to the Shareholders through
the Annual Report.
Quarterly results The Quarterly results of the Company are published in prominent English
Newspapers having nationwide circulation as well as a Bengali
Newspaper and regularly hosted on Company’s website.
Newspapers in which results are normally
published
Business Standard and Aajkaal.
Whether it also displays official news
releases
Yes
The presentations made to institutional
investors or to the analysts
Yes
Whether MD & A is a part of Annual Report
or not
Yes
Any website, where displayed Yes, at the Company’s website www.srei.com
During the last three years, there were no
strictures or penalties imposed by either
Stock Exchanges or SEBI or any statutory
authority for non-compliance of any
matter related to the capital markets.
In regard to the Application under
Section 633 of the Companies Act, 1956
filed on November 26, 2008 in the
Hon’ble Calcutta High Court by the
Directors and Company Secretary of the
Company, the Ad-interim order of
injunction restraining the Regional
Director and the Registrar of Companies,
West Bengal from instituting or causing
to be instituted any proceedings against
the Directors and Company Secretary of
the Company is still continuing.
Insider Trading Code
In accordance with the Securities and
Exchange Board of India (Prohibition of
Insider Trading) Regulations, 1992, the
Board of Directors of the Company has
formulated ‘Srei Code of Conduct for
Prohibition of Insider Trading’ (Srei
Code) in the shares and securities of the
Company by its Directors and
designated employees. The said Code
is available on the Company’s website
www.srei.com.
Mr. Sandeep Lakhotia, Company
Secretary, is the Compliance Officer for
monitoring adherence to the
Regulations for the preservation of price
sensitive information, pre-clearance of
trades and implementation of the Code
of Conduct for the prohibition of Insider
Trading.
9. Means of CommunicationThe Company regularly interacts with theShareholders through the multiplechannels of communication such aspublication of results, Annual Report,Press Release and the Company’swebsite. The Company also informs theStock Exchanges in a prompt manner, allprice sensitive and all such other matterswhich in its opinion, are material andrelevant for the Shareholders.

Annual Report 2011-12
89
a) Chairman of the Board Whether Non-executive Chairman is entitled to
maintain a Chairman’s office at the Company’s
expense and also allowed reimbursement of
expenses incurred in performance of his duties
Not Applicable as the Company has an Executive Chairman.
10. General Shareholdersʼ InformationA section on Shareholders’ Information is separately provided in the Annual Report.
B. NON MANDATORY REQUIREMENTS
b) Independent DirectorsIndependent Directors may have a tenure not
exceeding, in the aggregate, a period of nine
years, on the Board of the Company
Not adopted.
c) Remuneration Committee No, but the Company already has a Compensation Committee of the
Board in place and the same comprises of Non-executive Directors; the
Chairman of the Committee being an Independent Director. The Chairman
of Compensation Committee was present at the last Annual General
Meeting of the Company to answer shareholder queries.
No meeting of the Compensation Committee was held during the year
2011-12. However, a circular resolution was approved by the
Compensation Committee on March 27, 2012 recommending re-
appointment of the Joint Managing Director of the Company.
d) Shareholder rightsA half-yearly declaration of financialperformance including summary of thesignificant events in last six-months, may besent to each household of shareholders
Since half-yearly and annual results of the Company are published in a
leading English daily newspaper having a nationwide circulation and a
Bengali daily newspaper (having circulation in Kolkata) and regularly
hosted on Company’s website, these are not sent individually to the
shareholders of the Company. There is no declaration/publication of
second half yearly results as the audited annual results are taken on
record by the Board and then communicated to the shareholders through
the Annual Report.
e) Audit qualificationsCompany may move towards a regime of
unqualified financial statements
The Company is in the regime of unqualified financial statements.
90
g) Mechanism for evaluating Non-Executive Board MembersThe performance evaluation of Non-Executivedirectors could be done by a peer groupcomprising the entire Board of Directors,excluding the director being evaluated; and PeerGroup evaluation could be the mechanism todetermine whether to extend/continue the termsof appointment of Non-Executive directors
Presently the Company does not have such a mechanism as
contemplated for evaluating the performance of Non-Executive Directors.
h) Whistle Blower Policy The Company has formulated a codified Whistle Blower Policy and
employees of the Company are encouraged to escalate to the level of the
Audit Committee any issue of concerns impacting and compromising with
the interest of the Company and its stakeholders in any way. The Company
is committed to adhere to highest possible standards of ethical, moral and
legal business conduct and to open communication and to provide
necessary safeguards for protection of employees from reprisals or
victimisation, for whistle blowing in good faith.
The Company affirms that none of the employees have been denied
access to the Audit Committee.
f) Training of Board MembersA Company may train its Board members in thebusiness model of the Company as well as therisk profile of the business parameters of theCompany, their responsibilities as directors, andthe best ways to discharge them
New Directors appointed by the Board are given formal induction and
orientation with respect to the Company’s vision, strategic direction, core
values including corporate governance practices, financial matters and
business operations.
The Board members are also provided with the necessary
documents/brochures, reports and internal policies to enable them to
familiarise with the Company’s procedures and practices.
Periodic presentations are made at the Board and Board Committee
Meetings, on business and performance updates of the Company, global
business environment, business strategy and risks involved.
Updates on relevant statutory changes encompassing important laws are
regularly intimated to the Directors.

Annual Report 2011-12
91
1.Annual General Meetinga. Date and Time Friday, August 10, 2012 at 10.30 a.m.
b. Venue Science City Mini Auditorium, JBS Haldane Avenue, Kolkata – 700 046
2.Financial Calendar (Tentative)a. Financial reporting for 2012-13
Quarter ending June 30, 2012 On or before August 14, 2012
Quarter/Half year ending On or before November 14, 2012
September 30, 2012
Quarter ending December 31, 2012 On or before February 14, 2013
Year ending March 31, 2013 On or before May 30, 2013
b. Annual General Meeting for the year August/September, 2013
ending on March 31, 2013
3.Book Closure Date Friday, August 03, 2012 to Friday, the August 10, 2012 (both days inclusive)
for payment of Dividend
4.Dividend Payment Credit/dispatch between August 20, 2012 and August 28, 2012
5.Listing on Stock Exchanges The Equity Shares and other Securities of the Company are presently
listed on the following Stock Exchanges:
a. The Calcutta Stock Exchange Limited
7, Lyons Range, Kolkata – 700 001
b. Bombay Stock Exchange Limited
P.J. Towers, Dalal Street, Fort, Mumbai – 400 001
c. National Stock Exchange of India Limited
Exchange Plaza, C/1, Block G,
Bandra-Kurla Complex, Bandra (E), Mumbai – 400 051
The Global Depository Receipts (GDRs) issued by the Company are listed
and admitted to trading on London Stock Exchange w.e.f. April 21, 2005.
The Debt securities of the Company are listed on the Wholesale Debt
Market (WDM) Segment of Bombay Stock Exchange Limited (BSE).
6.Listing Fees
Shareholders’ Information
Annual Listing fees for 2012-13 have been paid to all the above mentioned
domestic and overseas Stock Exchanges.
The Company has paid custodial fees for the year 2012-13 to National
Securities Depository Limited (NSDL) and Central Depository Services
(India) Limited (CDSL) on the basis of number of beneficial accounts
maintained by them as on March 31, 2012.
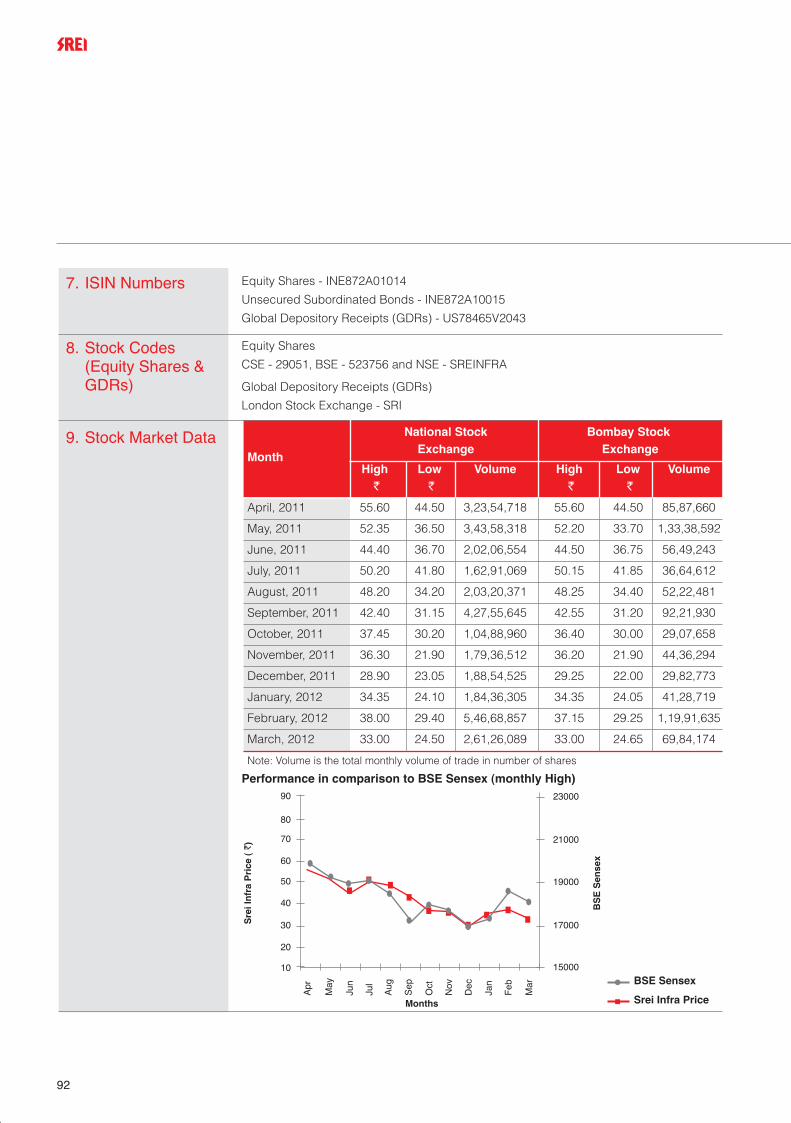
92
7. ISIN Numbers Equity Shares - INE872A01014
Unsecured Subordinated Bonds - INE872A10015
Global Depository Receipts (GDRs) - US78465V2043
8. Stock Codes(Equity Shares &GDRs)
Equity Shares
CSE - 29051, BSE - 523756 and NSE - SREINFRA
Global Depository Receipts (GDRs)
London Stock Exchange - SRI
Performance in comparison to BSE Sensex (monthly High)
9. Stock Market DataMonth
National Stock Bombay Stock Exchange Exchange
High Low Volume High Low Volume` ` ` `
April, 2011 55.60 44.50 3,23,54,718 55.60 44.50 85,87,660
May, 2011 52.35 36.50 3,43,58,318 52.20 33.70 1,33,38,592
June, 2011 44.40 36.70 2,02,06,554 44.50 36.75 56,49,243
July, 2011 50.20 41.80 1,62,91,069 50.15 41.85 36,64,612
August, 2011 48.20 34.20 2,03,20,371 48.25 34.40 52,22,481
September, 2011 42.40 31.15 4,27,55,645 42.55 31.20 92,21,930
October, 2011 37.45 30.20 1,04,88,960 36.40 30.00 29,07,658
November, 2011 36.30 21.90 1,79,36,512 36.20 21.90 44,36,294
December, 2011 28.90 23.05 1,88,54,525 29.25 22.00 29,82,773
January, 2012 34.35 24.10 1,84,36,305 34.35 24.05 41,28,719
February, 2012 38.00 29.40 5,46,68,857 37.15 29.25 1,19,91,635
March, 2012 33.00 24.50 2,61,26,089 33.00 24.65 69,84,174
Note: Volume is the total monthly volume of trade in number of shares
Apr
Sre
i In
fra
Pri
ce (
`)
BS
E S
ense
x
May
Jun
Jul
Aug
Sep
Oct
Nov
Dec
Jan
Feb
Mar
Months
10
20
30
40
50
60
70
80
90
BSE Sensex
Srei Infra Price
23000
21000
19000
17000
15000
Annual Report 2011-12
93
10.Registered Officea. Address “Vishwakarma”, 86C Topsia Road (South), Kolkata – 700 046
b. Telephone No. 91-33-6160 7734
c. Facsimile Nos. 91-33-2285 7542/8501
d. Website www.srei.com
e. Email [email protected]
11. Registrar and ShareTransfer Agentʼsdetails
a. Name & Address Maheshwari Datamatics Private Limited, 6 Mangoe Lane, 2nd Floor, Kolkata - 700 001
b. Telephone Nos. 91-33-2243 5029/5809, 2248 2248
c. Facsimile No. 91-33-2248 4787
d. Email [email protected]
12.Financial Year April 01 to March 31
13.Particulars ofPast three AGMs
* One Special resolution was passed:
To approve holding of an office or place of profit by Mr. Shyamalendu Chatterjee, Director
of the Company in Srei Sahaj e-Village Limited, subsidiary of the Company.
** Two Special resolutions were passed:
To approve holding of an office or place of profit by Dr. Satish C. Jha, Director of the
Company in Srei Venture Capital Limited, subsidiary of the Company.
To approve payment of commission to Non-executive Directors of the Company of an
aggregate maximum amount not exceeding one per cent of the net profits of the Company
in any financial year (computed in the manner referred to in Section 198 and 309(4) of the
Companies Act, 1956) or `50,00,000/- (Rupees Fifty Lakhs only) whichever is less for a
period of three financial years from 2010-11 till 2012-13.
*** Two Special resolutions were passed:
To approve holding of an office or place of profit by Mr. Saud Ibne Siddique, Joint
AGM Year Venue Date Time
26th* 2010/11 ‘Science City Mini Auditorium’, 30/07/2011 10.00 a.m.
JBS Haldane Avenue, Kolkata - 700 046 (Saturday)
25th** 2009/10 ‘Science City Mini Auditorium’, 09/08/2010 10.30 a.m.
JBS Haldane Avenue, Kolkata - 700 046 (Monday)
24th*** 2008/09 ‘Science City Mini Auditorium’, 12/09/2009 10.30 a.m.
JBS Haldane Avenue, Kolkata - 700 046 (Saturday)

94
14. Distribution ofShareholding ason March 31,2012
Category (Shares)No. of Shareholders No. of Shares
Total Per cent Total Per cent Up to 500 45002 72.66 8251741 1.64
501 to 1000 8798 14.20 6784331 1.35
1001 to 2000 4098 6.62 6402539 1.27
2001 to 3000 1119 1.81 2866799 0.57
3001 to 4000 785 1.27 2800056 0.56
4001 to 5000 460 0.74 2125476 0.42
5001 to 10000 876 1.41 6481187 1.29
10001 and above 800 1.29 467374204 92.90
Total 61938 100.00 503086333 100.00
15. Dividend History(Last 5 Years)
Financial Year Dividend Per Share* ( `) Total Dividend** ( `in lakh)
2010 - 11 0.75 4385
2009 - 10 1.20 1625
2008 - 09 1.00 1359
2007 - 08 1.20 1631
2006 - 07 1.00 1274
*share of paid up value of `10/- per share
**inclusive of dividend distribution tax
Managing Director of the Company in Srei Venture Capital Limited, subsidiary of the
Company.
To approve holding of an office or place of profit by Mr. Saud Ibne Siddique, Joint
Managing Director of the Company in Srei Capital Markets Limited, subsidiary of the
Company.

Annual Report 2011-12
95
16. Categories ofShareholders ason March 31,2012
Category Category of Shareholder Number of Total Number As a Percentage
Code Shareholders of Shares of (A+B+C)
A Shareholding of Promoter
and Promoter Group
1 Indian 5 88882989 17.67
2 Foreign 1 147937030 29.41
Total Shareholding of Promoter 6 236820019 47.07
and Promoter Group*
B Public Shareholding
1 Institutions 62 65644775 13.05
2 Non-institutions 61869 200599939 39.87
Total Public Shareholding 61931 266244714 52.92
C Shares held by Custodians and 1 21600 0.00
against which Depository Receipts
have been issued (Public)
GRAND TOTAL (A+B+C) 61938 503086333 100.00
*17.23 per cent (out of 47.07 per cent) shareholding held by the Promoters’ Group is under
pledge
17. Equity ShareCapital history
The Paid up Capital of the Company consists of 50,30,86,333 Equity shares of `10/- each
fully paid up and allotted as under:
Date of Allotment No. of Shares Issue Price (` per Share)
30.03.1985 2,742 10
27.06.1986 31,600 10
24.05.1987 16,000 10
13.12.1988 5,000 10
30.05.1990 6,08,558 10
20.04.1991 2,56,100 10
31.08.1992 32,20,000 10
13.01.1994 41,40,000 20
21.11.1997 4,54,54,545 22
05.09.1998 27,688 15
01.06.1999 5,500 10
18.04.2005 3,45,94,000 44.38
22.11.2005 2,10,50,056 33
20.02.2006 3,556 37
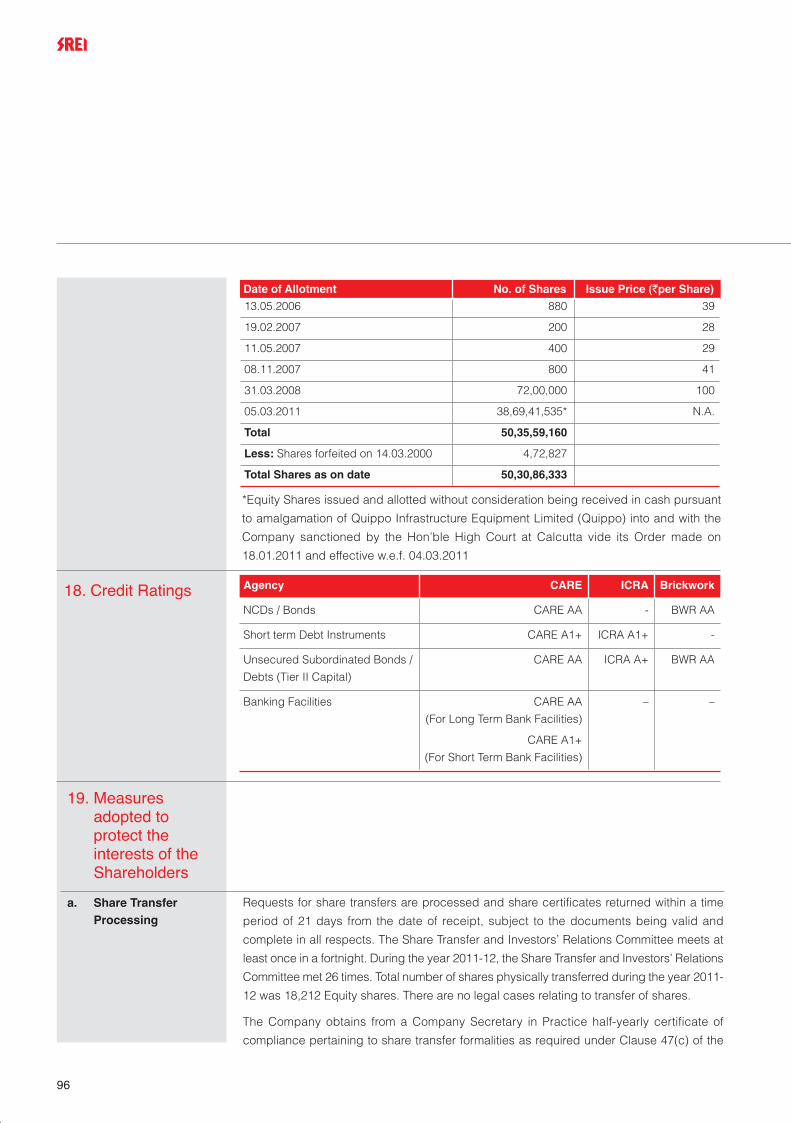
96
18. Credit Ratings Agency CARE ICRA Brickwork
NCDs / Bonds CARE AA - BWR AA
Short term Debt Instruments CARE A1+ ICRA A1+ -
Unsecured Subordinated Bonds / CARE AA ICRA A+ BWR AA
Debts (Tier II Capital)
Banking Facilities CARE AA – –
(For Long Term Bank Facilities)
CARE A1+
(For Short Term Bank Facilities)
19. Measuresadopted toprotect theinterests of theShareholders
a. Share TransferProcessing
Requests for share transfers are processed and share certificates returned within a time
period of 21 days from the date of receipt, subject to the documents being valid and
complete in all respects. The Share Transfer and Investors’ Relations Committee meets at
least once in a fortnight. During the year 2011-12, the Share Transfer and Investors’ Relations
Committee met 26 times. Total number of shares physically transferred during the year 2011-
12 was 18,212 Equity shares. There are no legal cases relating to transfer of shares.
The Company obtains from a Company Secretary in Practice half-yearly certificate of
compliance pertaining to share transfer formalities as required under Clause 47(c) of the
13.05.2006 880 39
19.02.2007 200 28
11.05.2007 400 29
08.11.2007 800 41
31.03.2008 72,00,000 100
05.03.2011 38,69,41,535* N.A.
Total 50,35,59,160
Less: Shares forfeited on 14.03.2000 4,72,827
Total Shares as on date 50,30,86,333
*Equity Shares issued and allotted without consideration being received in cash pursuant
to amalgamation of Quippo Infrastructure Equipment Limited (Quippo) into and with the
Company sanctioned by the Hon’ble High Court at Calcutta vide its Order made on
18.01.2011 and effective w.e.f. 04.03.2011
Date of Allotment No. of Shares Issue Price (`per Share)

Annual Report 2011-12
97
Listing Agreement with Stock Exchanges and files a copy of the certificate with the Stock
Exchanges.
b. Bad Delivery In case of Bad Delivery, the relevant documents are sent immediately after specifying the
defects through a covering letter.
c. Redressal ofGrievances
Necessary system has been put in place in order to attend with promptness any grievances
or queries by the Shareholders. An exclusive email id has also been designated by the
Company for prompt redressal of shareholder grievances. The Shareholders can email their
queries/grievances to [email protected]. A comprehensive Investor Grievance
Redressal Policy has been formulated and put in place by the Company.
d. Prevention ofFraudulent Transfers
A locking provision is in existence whereby, whenever any intimation is received from the
shareholders regarding loss of shares or of any legal dispute, the shares are immediately
kept locked so that fraudulent transfer is stalled.
e. Dematerialisation ofShares
Based on a SEBI directive, the Equity shares of the Company are permitted to be traded only
in dematerialised form and are available for demat under both the Depositories in India -
National Securities Depository Limited (NSDL) and Central Depository Services (India)
Limited (CDSL).
As on March 31, 2012, a total of 44,56,31,476 Equity shares of the Company representing
88.58 per cent of the total Equity Share Capital were held in dematerialised form (38.64 per
cent as on March 31, 2011). The entire Promoters’ Group shareholding in the Company is
in dematerialised form.
The bifurcation of shares held in Physical and Demat form as on March 31, 2012 is given
below -
Physical / Electronic No. of Holders No. of Shares Per centPhysical 4,044 5,74,54,857 11.42
NSDL 38,927 39,16,00,818 77.84
CDSL 18,967 5,40,30,658 10.74
Total 61,938 50,30,86,333 100.00
20. OutstandingGDRs / ADRs /Warrants / anyConvertibleInstruments,conversion dateand likely impacton Equity
In April, 2005, 86,48,500 Global Depository Receipts (GDRs) were issued by the Company throughbook building process at a price of US$ 4.05 per GDR, each GDR representing four underlyingEquity shares of the Company. The GDRs are presently listed and traded on the London StockExchange. As on March 31, 2012, 21,600 Equity shares of the Company representing 0.004 percent of the paid up Share Capital of the Company are held as shares underlying the GDRs.
GDR is not a specific time-bound instrument and can be surrendered any time and converted intothe underlying equity shares in the Company. The shares so released in favour of the investors uponsurrender of GDRs can either be held by the investors concerned in their name or sold off in theIndian secondary markets for cash. To the extent of the shares so sold in Indian markets, GDRscan be reissued under the available head room.

98
23. Nomination Individual shareholders holding shares singly or jointly in physical form can nominate aperson in whose name the shares shall be transferable in case of death of the registeredshareholder(s). Nomination forms can be obtained from the Company’s Registrar and ShareTransfer Agents or can be downloaded from the Company’s website www.srei.com.Nomination facility in respect of shares held in electronic form is available with the DepositoryParticipants as per bye-laws and business rules applicable to NSDL and CDSL.
21. Address forShareholdersʼcorrespondence
The Company Secretary
Srei Infrastructure Finance Limited
“Vishwakarma”, 86C Topsia Road (South), Kolkata - 700 046
Email : [email protected], [email protected]
Deutsche Bank Trust Company Americas is the Depositary and ICICI Bank Limited is the Custodianof all the Equity Shares underlying the GDRs issued by the Company.
22. Transfer ofUnclaimedamounts toInvestorEducation andProtection Fund
Pursuant to Section 205C of the Companies Act, 1956, dividends that are unpaid/unclaimed
for a period of seven years from the date they became due for payment are required to be
transferred by the Company to the Investor Education and Protection Fund (IEPF) administered
by the Central Government. Given below are the dates of declaration of dividend and
corresponding dates when unpaid/unclaimed dividends are due for transfer to IEPF:
The shareholders are regularly advised to claim the unencashed dividends lying in theunpaid dividend accounts of the Company before the due dates for crediting the same tothe Investor Education and Protection Fund. Separate letters have been sent on February24, 2012 and March 31, 2012 to the shareholders who are yet to encash the dividend for thefinancial year 2004-05 indicating that the unclaimed amount will be transferred to theInvestor Education and Protection Fund (IEPF), if not claimed by the shareholders before thedue date of transfer to the said Fund.
During the year under review, the Company has credited a sum of `3,54,549/- to the InvestorEducation and Protection Fund pursuant to Section 205C of the Companies Act, 1956 readwith the Investor Education and Protection Fund (Awareness and Protection of Investors)Rules, 2001. Cumulatively, the aggregate dividend amount transferred to the said Fund uptoMarch 31, 2012 stands at `28,33,842.69.
Financial Year Date of Declaration of Dividend Due Date of Transfer to IEPF2004 - 05 September 17, 2005 October 23, 2012
2005 - 06 August 19, 2006 September 24, 2013
2006 - 07 September 25, 2007 October 31, 2014
2007 - 08 September 20, 2008 October 26, 2015
2008 - 09 September 12, 2009 October 14, 2016
2009 - 10 August 09, 2010 September 09, 2017
2010 - 11 July 30, 2011 September 05, 2018

Annual Report 2011-12
99
24. NationalElectronicClearing Service(NECS)
SEBI had vide its Circular No. DCC/FITTCIR-3/2001 dated October 15, 2001 advised that allcompanies should mandatorily use ECS facility, wherever available. In the absence of ECSfacility, companies may use warrants for distributing the dividends and vide its Circular No.D&CC/FITTCIR-04/2001 dated November 13, 2001, SEBI had advised companies tomandatorily print the Bank Account details furnished by the Depositories, on the dividendwarrants. This ensures that the dividend warrants, even if lost or stolen, cannot be used forany purpose other than for depositing the money in the accounts specified on the dividendwarrants and ensures safety for the investors. However, members who wish to receivedividend in an account other than the one specified while opening the Depository Account,may notify their DPs about any change in the Bank Account details. Remittance of moneythrough Electronic Clearing System (ECS) has been replaced by National Electronic ClearingService (NECS) with effect from October 01, 2009. Advantages of NECS over ECS includefaster credit to the beneficiary’s account and ease of operations for the remitting agency.
25. Reconciliation ofShare CapitalAudit
As stipulated by SEBI, a qualified practising Company Secretary carries out an audit toreconcile the total admitted capital with National Securities Depository Limited (NSDL) andCentral Depository Services (India) Limited (CDSL) and the total issued and listed capital.This audit is carried out every quarter and the report thereon is submitted to the concernedStock Exchanges. The audit confirms that the total Listed and Paid-up Capital is inagreement with the aggregate of the total number of shares in dematerialised form (held withNSDL and CDSL) and total number of shares in physical form.
27. ComplianceOfficer
Mr. Sandeep LakhotiaCompany Secretary“Vishwakarma”, 86C Topsia Road (South), Kolkata - 700 046Tel : 91-33-6160 7734Fax : 91-33-2285 7542/8501Email : [email protected], [email protected]
26. Secretarial Audit The Company undertook a Secretarial Audit of records and documents as a good corporate
governance practice. The Secretarial Audit Report confirms that the Company has complied
inter alia with all the applicable provisions of the Companies Act, 1956, Depositories Act,
1996, Listing Agreements with the Stock Exchanges, Securities Contracts (Regulation) Act,
1956 and all the Regulations and Guidelines of SEBI as applicable to the Company,
including the SEBI (Substantial Acquisition of Shares and Takeovers) Regulations, 2011 and
the SEBI (Prohibition of Insider Trading) Regulations, 1992. The Secretarial Audit Report for
the financial year ended March 31, 2012 is provided in the Annual Report.
28. Role ofCompanySecretary inoverallgovernanceprocess
The Company Secretary plays a key role in ensuring that the Board procedures are followedand regularly reviewed. The Company Secretary ensures that all relevant information, detailsand documents are made available to the Directors and senior management for effectivedecision making at the meetings. The Company Secretary is primarily responsible to ensurecompliance with applicable statutory requirements and is the interface between themanagement and regulatory authorities for governance matters. All the Directors of theCompany have access to the advice and services of the Company Secretary.

100

Annual Report 2011-12
101
Auditorsʼ Report
To the Members,
Srei Infrastructure Finance Limited
1. We have audited the attached Balance Sheet of SREI
INFRASTRUCTURE FINANCE LIMITED (“the Company”)
as at March 31, 2012 and also the Statement of Profit and
Loss and the Cash Flow Statement of the Company for
the year ended on that date, both annexed thereto.
These financial statements are the responsibility of the
Company’s Management. Our responsibility is to express
an opinion on these financial statements based on our
audit.
2. We conducted our audit in accordance with the auditing
standards generally accepted in India. Those Standards
require that we plan and perform the audit to obtain
reasonable assurance about whether the financial
statements are free of material misstatements. An audit
includes examining, on a test basis, evidence supporting
the amounts and disclosures in the financial statements.
An audit also includes assessing the accounting
principles used and significant estimates made by the
Management, as well as evaluating the overall financial
statement presentation. We believe that our audit
provides a reasonable basis for our opinion.
3. As required by the Companies (Auditor’s Report) Order,
2003 (as amended) [the ‘Order’], issued by the Central
Government of India in terms of sub-section (4A) of
Section 227 of ‘The Companies Act, 1956’ (the ‘Act’), we
give in the Annexure a statement on the matters specified
in paragraphs 4 and 5 of the said Order.
4. Further to our comments in the Annexure referred to in
paragraph 3 above, we report that:
i. We have obtained all the information and explanations,
which to the best of our knowledge and belief, were
necessary for the purposes of our audit;
ii. In our opinion, proper books of account as required by
law have been kept by the Company so far as it appears
from our examination of those books;
iii. The Balance Sheet, the Statement of Profit and Loss and
the Cash Flow Statement dealt with by this report are in
agreement with the books of account;
iv. In our opinion, the Balance Sheet, the Statement of Profit
and Loss and the Cash Flow Statement dealt with by this
report comply with the Accounting Standards referred to
in sub-section (3C) of Section 211 of the Act;
v. On the basis of the written representations received from
the directors as on March 31, 2012 and taken on record
by the Board of Directors, none of the directors is
disqualified as on March 31, 2012 from being appointed
as a director in terms of clause (g) of sub-section (1) of
Section 274 of the Act;
vi. In our opinion and to the best of our information and
according to the explanations given to us, the said
financial statements give the information required by the
Act, in the manner so required and give a true and fair
view in conformity with the accounting principles
generally accepted in India;
a) in the case of the Balance Sheet, of the state of affairs of
the Company as at March 31, 2012;
b) in the case of the Statement of Profit and Loss, of the
profit of the Company for the year ended on that date;
and
c) in the case of the Cash Flow Statement, of the cash flows
of the Company for the year ended on that date.
For Haribhakti & Co.
Chartered Accountants
(Firm’s Registration No.103523W)
Anand Kumar Jhunjhunwala
Place : Kolkata Partner
Date : 14th May, 2012 Membership No. 056613

102
ANNEXURE TO THE AUDITORSʼ REPORT(Referred to in paragraph 3 of our report of even date)
(i) (a) The Company has maintained proper records showingfull particulars, including quantitative details andsituation of fixed assets.
(b) According to the information and explanations given tous, the fixed assets of the Company have beenphysically verified by the management during the yearand no material discrepancies between the bookrecords and the physical inventory have been noticed.In our opinion, the frequency of verification isreasonable.
(c) There was no substantial disposal of fixed assets duringthe year.
(ii) In respect of shares and securities held as stock for trade:
(a) According to the information and explanations given tous, the stock for trade has been physically verified bythe management during the year. In our opinion, thefrequency of verification is reasonable.
(b) The procedures of physical verification of stock fortrade followed by the management are reasonable andadequate in relation to the size of the Company and thenature of its business.
(c) The Company is maintaining proper records of stockfor trade and no material discrepancies were noticedon physical verification.
(iii) The Company has neither granted nor taken any loans,secured or unsecured, to or from companies, firms or otherparties covered in the register maintained under section301 of the Act. Accordingly, the provisions stated in clauses4 (iii)(a) to (g) of the Order are not applicable to theCompany.
(iv) In our opinion and according to the information andexplanations given to us, there exists an adequate internalcontrol system commensurate with the size of the Companyand the nature of its business with regard to the purchaseof shares and securities held as stock for trade, fixed assetsand with regard to the sale of services. During the courseof our audit, we have neither come across nor have beeninformed of any continuing failure to correct majorweaknesses in such internal control system of theCompany.
(v) According to the information and explanations given to us,there were no contracts or arrangements during the year,referred to in section 301 of the Act, that need to have beenentered in the register maintained under that section.Accordingly, clauses 4(v) (a) and (b) of the Order are notapplicable to the Company.
(vi) In our opinion and according to the information andexplanations given to us, the Company has complied withthe directives issued by the Reserve Bank of India, therelevant provisions of Sections 58A and 58AA or any otherrelevant provisions of the Act and the Companies(Acceptance of Deposits) Rules, 1975 with regard to thedeposits accepted from the public.
(vii) In our opinion, the Company has an internal audit systemcommensurate with the size and nature of its business.
(viii) Being a Non-Banking Financial Company, the provisions ofclause 4 (viii) of the Order are not applicable to theCompany.
(ix) (a) According to the information and explanations given tous, the Company is generally regular in depositing withappropriate authorities undisputed statutory duesincluding provident fund, investor education andprotection fund, employees’ state insurance, income-tax, sales-tax, wealth-tax, service tax, custom duty, cessand other material statutory dues applicable to it.
According to the information and explanations given tous, no undisputed amounts payable in respect ofprovident fund, investor education and protection fund,employees’ state insurance, income-tax, sales-tax,wealth-tax, service tax, custom duty, cess and othermaterial statutory dues, were in arrears, as at March 31,2012 for a period of more than six months from the datethey became payable.
(b) According to the information and explanations given tous, the dues as on March 31, 2012 of income-tax, sales-tax, wealth-tax, service tax, customs duty, excise dutyand cess which have not been deposited on account ofany dispute, are as follows:
Name Nature Amount Period to Forumof the of (` in lakh) which the where
Statute dues amount disputerelates is
(Financial pendingyear)
Income Income 471 2005-06 ITAT, NewTax Tax and DelhiAct, 1961 2006-07 remanded
back tothe
AssessingOfficer
Income Income 388 2005-06 CITTax Tax (Appeals),Act, 1961 New
Delhi
Income Income 493 2007-08 ITAT,Tax Tax NewAct, 1961 Delhi
Income Income 493 2007-08 CITTax Tax (Appeals),Act, 1961 New
Delhi
Income Income 1,809 2008-09 Hon’bleTax Tax Supreme Act, 1961 Court,
New Delhi
(SLP filed on
04.05.2012)
Income Fringe 226 2005-06 Hon’bleTax Benefit to HighAct, 1961 Tax 2008-09 Court,
Calcutta

Annual Report 2011-12
103
(x) The Company has no accumulated losses as at the endof the financial year covered by our audit. The Companyhas not incurred cash losses in the said financial yearand the immediately preceding financial year.
(xi) In our opinion and according to the information andexplanations given to us, the Company has not defaultedin repayment of dues to financial institutions, banks anddebenture holders.
(xii) In our opinion and according to the information andexplanations given to us, the Company has maintainedadequate documents and records in cases where theCompany has granted loans and advances on the basisof security by way of pledge of shares, debentures andother securities.
(xiii) In our opinion and according to the information andexplanations given to us, the Company is not a chit fundor a nidhi / mutual benefit fund / society. Therefore, theprovisions of clause 4(xiii) of the Order are not applicableto the Company.
(xiv) In respect of dealing or trading in shares, securities,debentures and other investments, in our opinion andaccording to the information and explanations given tous, proper records have been maintained of thetransactions and contracts and timely entries have beenmade therein. The shares, securities, debentures andother investments have been held by the Company in itsown name, except to the extent of the exemption grantedunder Section 49 of the Companies Act, 1956.
(xv) In our opinion and according to the information andexplanations given to us, the terms and conditions of theguarantees given by the Company, for loans taken byothers from banks or financial institutions during the year,are not prejudicial to the interest of the Company.
(xvi) In our opinion and according to the information andexplanations given to us, term loans have been primafacie applied for the purposes for which the loans wereobtained.
(xvii) In our opinion and according to the information andexplanations given to us and on an overall examination ofthe Balance Sheet of the Company, we report that fundsraised on short-term basis have prima facie not beenused during the year for long-term investment.
(xviii) The Company has not made any preferential allotment ofshares to parties and companies covered in the Registermaintained under Section 301 of the Act.
(xix) According to the information and explanations given tous and the records examined by us, securities / chargeshave been created in respect of all debentures issuedby the Company during the year.
(xx) We have verified the end use of money raised during theyear by public issue of Infrastructure Bonds, as disclosedin Note 4.1 in the financial statements.
(xxi) During the course of our examination of the books andrecords of the Company, carried out in accordance withthe generally accepted auditing practices in India andaccording to the information and explanations given tous, we have neither come across any instance of fraud onor by the Company, noticed or reported during the year,nor have we been informed of any such case by themanagement.
For Haribhakti & Co.
Chartered Accountants
(Firm’s Registration No.103523W)
Anand Kumar Jhunjhunwala
Place : Kolkata Partner
Date : 14th May, 2012 Membership No. 056613

104
(` in Lakh)Balance Sheet as at 31st March, 2012
Note As at 31st March, 2012 As at 31st March, 2011
EQUITY AND LIABILITIESShareholdersʼ FundsShare Capital 2 50,324 50,324Reserves and Surplus 3 207,877 204,989
258,201 255,313Non-Current LiabilitiesLong-Term Borrowings 4 319,654 162,189Deferred Tax Liabilities (Net) 5 7,988 6,790Other Long-Term Liabilities 6 832 1,000Long-Term Provisions 7 3,617 1,448
332,091 171,427Current LiabilitiesShort-Term Borrowings 8 586,649 276,499Trade Payables 9 266 257Other Current Liabilities- Current Maturities of Long-Term Borrowings 4 78,429 90,276- Others 10 11,620 7,171Short-Term Provisions 11 3,071 4,835
680,035 379,0381,270,327 805,778
ASSETS Non-Current AssetsFixed Assets 12- Tangible Assets 43,509 39,194- Intangible Assets 84 62- Capital work in Progress 6,278 911Non-Current Investments 13.1 262,213 250,551
Long-Term Loans and Advances- Loan Assets 14 266,511 199,466- Other Long-Term Advances 15 2,864 3,031Other Non-Current Assets 16 6,365 8,380
587,824 501,595Current AssetsCurrent Investments 13.2 2,200 -Trade Receivables 17 3,355 4,641Cash and Bank Balances 18 14,936 2,265Short-Term Loans and Advances- Loan Assets 14 27,664 43,709- Other Advances 19 21,798 14,939Other Current Assets- Current Maturities of Long-Term Loan Assets 14 588,206 234,718- Other Current Assets 20 24,344 3,911
682,503 304,1831,270,327 805,778
Significant Accounting Policies and Notes to Financial Statements 1 to 42
The Notes referred to above form an integral part of the Balance Sheet
This is the Balance Sheet referred to in our report of even date
For Haribhakti & Co. On behalf of the Board of DirectorsChartered Accountants(Firm's Registration No. 103523W)
Anand Kumar Jhunjhunwala Hemant Kanoria Salil K. GuptaPartner Chairman & Managing Director Chief Mentor & DirectorMembership No. 056613
Place : Kolkata Sandeep LakhotiaDate : 14th May, 2012 Company Secretary
10 Lakh is equal to 1 Million

105
Annual Report 2011-12
(` in Lakh)
For Haribhakti & Co. On behalf of the Board of DirectorsChartered Accountants(Firm's Registration No. 103523W)
Anand Kumar Jhunjhunwala Hemant Kanoria Salil K. GuptaPartner Chairman & Managing Director Chief Mentor & DirectorMembership No. 056613
Place : Kolkata Sandeep LakhotiaDate : 14th May, 2012 Company Secretary
Statement of Profit and Loss for the year ended 31st March, 2012
Year ended Year endedNote
31st March, 2012 31st March, 2011
INCOME
Revenue from Operations 21 117,678 74,570
Other Income 22 391 54
Total 118,069 74,624
EXPENSES
Finance Cost 23 94,800 43,505
Employee Benefit Expenses 24 4,176 3,022
Administrative and Other Expenses 25 4,501 3,878
Depreciation and Amortisation Expense 12 1,540 1,808
Total 105,017 52,213
Profit before Bad Debts, Provisions & Tax 13,052 22,411
Bad Debts / Advances written off 50 1
Provision for Bad & Doubtful Debts 37 -
Provision for Non-Performing Assets 1,100 -
Contingent Provisions against Standard Assets 986 1,196
2,173 1,197
Profit Before Tax 10,879 21,214
Tax Expense :
- Current Tax 1,760 4,185
- Mat Credit Entitlement (49) -
- Deferred Tax 1,198 3,350
Total Tax for current year 2,909 7,535
Profit After Tax for current year 7,970 13,679
Income tax in respect of earlier years 2,174 249
Profit After Tax 5,796 13,430
Earnings per Equity Share (Basic and Diluted) (in `) 26 1.15 5.80
(Par Value ` 10/- per Equity Share)
Significant Accounting Policies and Notes to Financial Statements 1 to 42
The Notes referred to above form an integral part of the Statement of Profit and Loss
This is the Statement of Profit and Loss referred to in our report of even date.
10 Lakh is equal to 1 Million

106
(` in Lakh)Cash Flow Statement for the year ended 31st March, 2012
31st March, 2012 31st March, 2011
A. Cash Flows from Operating ActivitiesNet Profit Before Tax 10,879 21,214Adjustment for :Depreciation and Amortisation 1,540 1,808Bad Debts written off 50 1Contingent Provisions against Standard Assets 986 1,196Provision for Premium on Unsecured Subordinated Bonds 88 88Loss on sale of Fixed Assets (net) 53 -Finance Cost 94,800 43,417Income from Trade Investments - (28)Profit on sale of Investments (net) - (70)Liabilities No Longer Required written back - (44)Dividend Income (28) (40)Provision for Dimunition in value of Stock for Trade 16 90Operating Profit before Working Capital Changes 108,384 67,632Adjustments for:(Increase) / Decrease in Receivables / Others (421,246) (150,572)(Increase) / Decrease in Current Investments / Stock for Trade (2,200) (341)(Increase) / Decrease in Fixed Deposit (Deposit with original maturity period of more than three months) (644) (1,048)(Decrease) / Increase in Trade Payables 2,304 572Cash Generated from Operations (313,402) (83,757)Interest Paid (91,022) (41,749)Direct Taxes paid (9,880) (3,394)Net Cash (Used in) / Generated from Operating Activities (414,304) (128,900)
B. Cash Flows from Investing ActivitiesPurchase of Fixed Assets (11,474) (33,191)Proceeds from Sale of Fixed Assets 177 -(Increase) in Investments (Other than Subsidiary) (6,316) (13,417)(Increase) of Investments in Subsidiary (355) (1,990)Investments in Joint Venture (4,991) -Income from Trade Investments - 28Dividend Received 28 40Net Cash (Used) / Generated in Investing Activities (22,931) (48,530)
C. Cash Flows from Financing ActivitiesIncrease / (Decrease) in Debentures (net) 94,199 (21,000)Increase / (Decrease) in Working Capital facilities (net) 219,776 149,649Increase / (Decrease) in Other Loans (net) 139,518 46,493Dividend Paid (3,771) (1,393)Dividend Tax Paid (612) (231)Net Cash (Used) / Generated in Financing Activities 449,110 173,518Net Increase / (Decrease) in Cash & Cash Equivalents 11,875 (3,912)Cash & Cash Equivalents at the beginning of the year 716 4,505Add: Cash & Cash Equivalents acquired on Amalgamation - 123Cash & Cash Equivalents at the end of the year 12,591 716
Explanations:
1. The above Cash Flow Statement has been prepared under the Indirect Method as set out in the Accounting Standard 3 (AS 3) 'Cash Flow Statements' notified by the Central Government under Companies (Accounting Standards) Rules, 2006
2. Previous year's figures have been regrouped / reclassified wherever necessary to conform to the current year's classification.This is the Cash Flow Statement referred to in our report of even date.
For Haribhakti & Co. On behalf of the Board of DirectorsChartered Accountants(Firm's Registration No. 103523W)
Anand Kumar Jhunjhunwala Hemant Kanoria Salil K. GuptaPartner Chairman & Managing Director Chief Mentor & DirectorMembership No. 056613
Place : Kolkata Sandeep LakhotiaDate : 14th May, 2012 Company Secretary
10 Lakh is equal to 1 Million

Annual Report 2011-12
107
Srei Infrastructure Finance Limited
SIGNIFICANT ACCOUNTING POLICIES AND NOTES TO FINANCIAL STATEMENTS
1 Significant Accounting Policies
1.1 Basis of Preparation
The financial statements have been prepared in conformity with Generally Accepted Accounting Principles in India, to comply
in all material respects with the notified Accounting Standards (‘AS’) under the Companies Accounting Standard Rules, 2006,
the relevant provisions of the Companies Act, 1956 (‘the Act’) and the guidelines issued by the Reserve Bank of India (‘RBI’)
as applicable to an 'Infrastructure Finance Company – Non Deposit Taking' Non-Banking Finance Company (‘NBFC’). The
financial statements have been prepared under the historical cost convention, on accrual basis. The accounting policies applied
by the Company are consistent with those applied in the previous year except as otherwise stated elsewhere.
Presentation and disclosure in Financial Statements
During the year ended 31st March, 2012, the revised Schedule VI notified under the Companies Act, 1956 has become
applicable to the Company for preparation and presentation of its financial statements. Except accounting for dividend on
investment in subsidiary, the adoption of new Schedule VI does not impact recognition and measurement principles followed
for preparation of financial statements. However, it has significant impact on presentation and disclosures made in the financial
statements. The Company has also reclassified the previous year figures in accordance with the requirements applicable in the
current year.
Operating Cycle
As per the revised Schedule VI, "An operating cycle is the time between the acquisition of assets for processing and their
realisation in cash or cash equivalents".
For the company, there is generally no clearly identifiable normal operating cycle and hence the normal operating cycle for the
company is assumed to have a duration of 12 months.
Current and Non-Current Asset
An asset is classified as ‘current’ when it satisfies any of the following criteria:
- it is expected to be realised in, or is intended for sale or consumption in, the Company’s normal operating cycle; or
- it is held primarily for the purpose of being traded; or
- it is expected to be realised within twelve months after the reporting date; or
- it is cash or cash equivalent unless it is restricted from being exchanged or used to settle a liability for at least twelve months
after the reporting date.
All other assets are classified as ‘non-current’.
Current and Non-Current Liability
A liability is classified as ‘current’ when it satisfies any of the following criteria:
- it is expected to be settled in the Company’s normal operating cycles; or
- it is held primarily for the purpose of being traded; or
- it is due to be settled within twelve months after the reporting date; or
- the company does not have an unconditional right to defer settlement of the liability for at least twelve months after the
reporting date.
All other liabilities are classified as ‘non-current’.
1.2 Use of estimates
The preparation of financial statements requires the management to make estimates and assumptions which are considered
to arrive at the reported amounts of assets and liabilities and disclosure of contingent liabilities as on the date of the financial
statements and the reported income and expenses during the reporting year. Although these estimates are based upon the

Srei Infrastructure Finance Limited
SIGNIFICANT ACCOUNTING POLICIES AND NOTES TO FINANCIAL STATEMENTS (Contd.)
management’s best knowledge of current events and actions, actual results could differ from these estimates. Any revision to
the accounting estimates are recognised prospectively in the current and future years.
1.3 Fixed Assets, Depreciation / Amortisation and Impairment
i) Fixed Assets
Fixed assets are carried at cost less accumulated depreciation / amortisation and impairment losses, if any. Cost comprises of
the purchase price and any directly attributable cost of bringing the asset to its working condition for its intended use. Borrowing
costs relating to acquisition of fixed assets, which take substantial period of time to get ready for their intended use, are also
capitalised to the extent they relate to the period till such assets are ready to put to use.
Intangible Assets expected to provide future enduring economic benefits are carried at cost less accumulated amortisation and
impairment losses, if any. Cost comprises of purchase price and directly attributable expenditure on making the asset ready
for its intended use.
ii) Depreciation / Amortisation
Depreciation / Amortisation is provided on Straight Line Method (‘SLM’), which reflects the management’s estimate of the useful
lives of the respective fixed assets and the rates derived from such useful lives thereof are greater than or equal to the
corresponding rates prescribed in Schedule XIV of the Act. The details of estimated useful life for each category of assets are
as under:
108
Asset category Estimated Useful Life
I Assets for Own Use
i) Buildings 45 - 61 years
ii) Furniture & Fixtures 16 years
iii) Motor Vehicles 11 years
iv) Computers 4 - 6 years
v) Office Equipment 21 years
vi) Intangible Assets 3 - 6 years
II Assets for Operating Lease
vii) Plant and Machinery 10 - 30 years
viii) Aircrafts 9 years
Fixed Assets costing up to ` 5,000/- are depreciated fully over a period of 12 months from the date of purchase.
Depreciation / Amortisation on assets purchased / sold during the reporting period is recognised on pro-rata basis.
Lease-hold assets including improvements are amortised over the period of the lease or the estimated useful life of the asset,
whichever is lower.
iii) Impairment of Fixed Assets
The carrying amount of assets is reviewed at each Balance Sheet date to determine if there is any indication of impairment, based
on internal / external factors. An impairment loss is recognised wherever the carrying amount of an asset exceeds its recoverable
amount.

109
Annual Report 2011-12
Srei Infrastructure Finance Limited
SIGNIFICANT ACCOUNTING POLICIES AND NOTES TO FINANCIAL STATEMENTS (Contd.)
After impairment, depreciation is provided on the revised carrying amount of the asset over its remaining useful life.
A previously recognised impairment loss is increased or reversed depending on changes in circumstances. However, the
carrying value after reversal is not increased beyond the carrying value that would have prevailed by charging usual
depreciation, if there was no impairment.
1.4 Capital Work in Progress
Capital work in progress is stated at cost and includes development and other expenses, including interest during construction
period.
1.5 Borrowing Costs
Borrowing costs relating to the acquisition / construction of qualifying assets are capitalised until the time all substantial activities
necessary to prepare the qualifying assets for their intended use are complete. A qualifying asset is one that necessarily takes
substantial period of time to get ready for its intended use.
The ancillary costs incurred in connection with the arrangement of borrowings are amortised over the life of underlying
borrowings. Premium payable on redemption of bonds is amortised over the tenure of the bonds. These form part of the
borrowing costs.
Borrowing costs also include exchange differences arising from Foreign currency borrowings, to the extent they are regarded
as an adjustment to the borrowing costs.
All other costs related to borrowings are recognised as expense in the period in which they are incurred.
1.6 Operating Leases
Assets given on operating leases are included in fixed assets. Initial direct costs incurred before the asset is ready to be put
to use, are included in the cost of the asset and those incurred afterwards, are recognised in the Statement of Profit and Loss
as they are incurred.
1.7 Investments
Investments that are intended to be held for not more than a year are classified as current investments. All other investments
are classified as non-current investments. Current investments are carried at lower of cost and market price determined
category-wise. All non-current investments, including investments in Subsidiary Companies, are carried at cost. However,
provision for diminution in value, other than temporary in nature, is made to recognise a decline, on an individual basis. The
cost of Investments acquired on amalgamations is determined as per the terms of the scheme of amalgamation.
Cost is arrived at on weighted average method for the purpose of valuation of investment.
1.8 Stock for Trade
Stock for Trade is carried at lower of cost and market price, determined category-wise.
1.9 Loan Assets
Loan Assets include loans advanced by the Company, secured by collateral offered by the customers, if applicable.
Loan assets are carried at net investment amount including installments fallen due and are net of unmatured / unearned finance
charges, amounts received, assets not paid for, etc.
1.10 Provisioning / Write-off of assets
The Company makes provision for Standard and Non-Performing Assets as per the Non-Banking Financial (Non-Deposit
Accepting or Holding) Companies Prudential Norms (Reserve Bank) Directions, 2007, as amended from time to time. The
Company also makes additional provision towards loan assets, to the extent considered necessary, based on the management’s
best estimate. Provision for doubtful debtors towards fee based income is also made on similar basis.
Loan assets overdue for more than four years, as well as those, which, as per the management are not likely to be recovered,
are considered as bad debts and written off.
Srei Infrastructure Finance Limited
SIGNIFICANT ACCOUNTING POLICIES AND NOTES TO FINANCIAL STATEMENTS (Contd.)
1.11 Foreign Currency Transactions and Balances
The reporting currency of the Company is the Indian Rupee (`).
i) Initial Recognition
Foreign currency transactions are recorded in the reporting currency by applying to the foreign currency amount the prevailing
exchange rate between the reporting currency and the foreign currency, as on the date of the transaction.
ii) Conversion
Year end foreign currency monetary items are reported using the year end rate. Non-monetary items which are carried in terms
of historical cost denominated in a foreign currency are reported using the exchange rate at the date of the transaction. Non-
monetary items which are carried at fair value or other similar valuation denominated in a foreign currency are reported using
the exchange rates prevailing at the date when the values were determined.
iii) Exchange Differences
Exchange differences arising on the settlement or reporting of monetary items, at rates different from those at which they were
initially recorded during the year or reported in previous financial statements and / or on conversion of monetary items, are
recognised as income or expense in the year in which they arise. Exchange differences arising out of foreign currency
borrowings are considered as an adjustment to interest cost and recognised in accordance to para 1.5 above.
iv) Forward Exchange Contracts (not intended for trading or speculation purpose)
The premium or discount arising at the inception of forward exchange contracts is amortised as expense or income over the
life of the respective contracts. Exchange differences on such contracts are recognised in the Statement of Profit and Loss in
the year in which the exchange rates change. Any profit or loss arising on cancellation or renewal of forward exchange contract
is recognised as income or expense in the year in which it is cancelled or renewed.
v) Derivatives and Hedges
In terms of the announcement made by The Institute of Chartered Accountants of India, the accounting for derivative contracts
(other than those covered under AS-11) is done based on the “marked to market” principle, on a portfolio basis and the net loss,
after considering the offsetting effect on the underlying hedged item, is charged to the Statement of Profit and Loss. Net gains
are ignored as a matter of prudence.
1.12 Revenue Recognition
Revenue is recognised to the extent it is probable that the economic benefits will flow to the Company and the revenue can be
reliably measured.
i) Income from Loans and Leases:
Income from Loans and Leases is recognised in the Statement of Profit and Loss on accrual basis as stated herein below,
except in the case of non-performing assets where it is recognised, upon realisation, as per the Prudential Norms / Directions
of RBI, applicable to NBFCs.
a) Interest income from loan assets is recognised based on the internal rate of return, to provide a constant periodic rate ofreturn on the net investment outstanding over the period of the contract, or as per the terms of the contract.
b) Income from operating lease is recognised on straight line basis over the lease term or other systematic basis which ismore representative of the time pattern of the users benefit.
c) Fees on processing of loans are recognised when a binding obligation for granting loan has been entered into.
d) Delayed-payment interest / incremental interest pursuant to upward revision in benchmark interest rate is accrued, onlyto the extent of probable recovery, as per the best estimate of the management.
e) Gains arising on securitisation / assignment of assets, if any, are recognised over the tenure of agreements as per guidelineon securitisation of standard assets issued by RBI, while loss, if any is recognised upfront. These are considered asincome from loans under the head 'Revenue from Operations'.
110

111
Annual Report 2011-12
Srei Infrastructure Finance Limited
SIGNIFICANT ACCOUNTING POLICIES AND NOTES TO FINANCIAL STATEMENTS (Contd.)
ii) Fee Based Income
Fees for advisory services are accounted based on the stage of completion of assignments, when there is reasonable certainty
of its ultimate realisation / collection.
Other fee based income is accounted for on accrual basis.
iii) Other Operating Income
a) Income from Dividend of shares of corporate bodies is accounted when the Company's right to receive the dividend is
established.
b) Income from investment in units of Funds is recognised on cash basis as per the Prudential Norms of RBI.
c) Interest income on fixed deposits / margin money is recognised on time proportion basis taking into account the amount
outstanding and the rate applicable.
d) Profit or Loss on sale of non-current and current investments are recognised when a binding obligation has been entered
into.
e) All other operating income is accounted for on accrual basis.
1.13 Retirement and Other Employee Benefits
a) Retirement and employee benefits in the form of Provident Fund and Employee State Insurance are defined contribution
plans and the Company’s contributions, paid or payable during the reporting period, are charged to the Statement of Profit
and Loss.
b) Gratuity liability is a defined benefit plan and is provided for on the basis of actuarial valuation on projected unit credit
method at the Balance Sheet date.
c) Long-Term compensated absences are provided for based on actuarial valuation as per projected unit credit method at
the Balance Sheet date.
d) Actuarial gains / losses are charged to the Statement of Profit and Loss and are not deferred.
1.14 Taxes on Income
Tax expense comprises of current tax [(net of Minimum Alternate Tax (MAT) credit entitlement)] and deferred tax.
Current tax is the amount of tax payable on the taxable income for the year determined in accordance with the provisions of
the Income Tax Act, 1961.
Deferred tax reflects the impact of current year timing differences between taxable income and accounting income for the year
and reversal of timing differences of earlier years.
Deferred tax is measured based on the tax rates and the tax laws enacted or substantively enacted at the Balance Sheet date.
Deferred tax assets and deferred tax liabilities are offset, if a legally enforceable right exists to set off current tax assets against
current tax liabilities. The deferred tax assets and deferred tax liabilities relate to the taxes on income levied by the same
governing taxation laws. Deferred tax assets are recognised only to the extent that there is reasonable certainty that sufficient
future taxable income will be available against which such deferred tax assets can be realised. In situations where the company
has unabsorbed depreciation or carry forward tax losses, all deferred tax assets are recognised only if there is virtual certainty
supported by convincing evidence that they can be realised against future taxable profits.
At each Balance Sheet date, the Company re-assesses unrecognised deferred tax assets. It recognises unrecognised deferred
tax assets to the extent that it has become reasonably certain or virtually certain, as the case may be, that sufficient future
taxable income will be available against which such deferred tax assets can be realised.

Srei Infrastructure Finance Limited
SIGNIFICANT ACCOUNTING POLICIES AND NOTES TO FINANCIAL STATEMENTS (Contd.)
112
MAT credit is recognised as an asset only when and to the extent there is convincing evidence that the company will pay normal
income tax during the specified period. In the year in which the MAT credit becomes eligible to be recognised as an asset in
accordance with the recommendations contained in guidance note issued by The Institute of Chartered Accountants of India,
the said asset is created by way of a credit to the Statement of Profit and Loss and shown as MAT Credit Entitlement. The
Company reviews the same at each Balance Sheet date and writes down the carrying amount of MAT Credit Entitlement to the
extent there is no longer convincing evidence to the effect that the Company will pay normal income tax during the specified
period.
1.15 Segment Reporting
Based on the risks and returns associated with business operations and in terms of Accounting Standard-17 (Segment
Reporting), the Company is predominantly engaged in a single reportable segment of ‘Financial Services’.
1.16 Provision, Contingent Liabilities and Contingent Assets
A provision is recognised when the company has a present obligation as a result of past event and it is probable that outflow
of resources will be required to settle the obligation, in respect of which a reliable estimate can be made. Provisions are not
discounted to their present value and are determined based on best estimate required to settle the obligation at the Balance
Sheet date. These are reviewed at each Balance Sheet date and adjusted to reflect the current best estimates. Contingent
Liabilities are not recognised but are disclosed in the notes to financial statements. Contingent Assets are neither recognised
nor disclosed in the financial statements.
1.17 Cash and Cash Equivalents
Cash and cash equivalents in the Cash Flow Statement comprises of cash on hand, cash at Bank, demand deposits with banks,
cheques on hand, remittances in transit and short-term highly liquid investments with an original maturity of three months or less.
1.18 Earnings Per Share (EPS)
Basic EPS is calculated by dividing the net profit or loss for the period attributable to equity shareholders by the weighted
average number of equity shares outstanding during the year.
For the purpose of calculating diluted EPS, the net profit or loss for the period attributable to equity shareholders and the
weighted average number of shares outstanding during the period are adjusted for the effects of all dilutive potential equity
shares.
1.19 Assets under Management
Contracts securitised, assigned or co-branded are derecognised from the books of accounts. Contingent liabilities thereof, if
any, are disclosed separately in the notes to financial statements.
1.20 Prior Period and Extra Ordinary Items
Prior Period and Extra Ordinary items having material impact on the financial affairs of the Company are disclosed separately.

113
Annual Report 2011-12
Srei Infrastructure Finance Limited
SIGNIFICANT ACCOUNTING POLICIES AND NOTES TO FINANCIAL STATEMENTS (Contd.)
1 Includes 21,600 shares represented by 5,400 Global Depository Receipts (GDRs) issued vide Prospectus dated 18.04.2005.
2.1 Reconciliation of Equity Shares outstanding
The reconciliation of the number of equity shares outstanding and the corresponding amount thereof, as at the Balance Sheet
date is set out below:
NOTES TO FINANCIAL STATEMENTS
2. SHARE CAPITAL(` in Lakh)
Particulars 31st March, 2012 31st March, 2011
Authorised
Equity Shares, ` 10/- par value per share
710,000,000 (31st March, 2011: 710,000,000) Equity Shares 71,000 71,000
Preference Shares, ` 100/- par value per share
10,000,000 (31st March, 2011: 10,000,000) Preference Shares 10,000 10,000
81,000 81,000
Issued and subscribed
Equity Shares, ` 10/- par value per share
503,559,160 (31st March, 2011: 503,559,160) Equity Shares 50,356 50,356
Fully Paid-up
Equity Shares, ` 10/- par value per share
503,086,3331 (31st March, 2011: 503,086,333) Equity Shares 50,309 50,309
Forfeited Shares (472,827 Equity Shares) 15 15
50,324 50,324
Equity Shares31st March, 2012 31st March, 2011
No. of Shares ` in lakh No. of Shares ` in lakh
At the beginning of the financial year 503086333 50,309 116144798 11,614
Add: Issued as fully paid-up bonus shares by
capitalisation of Securities Premium - - 92915839 9,292
Add: Allotment pursuant to Scheme of Amalgamation,
without payment being received in Cash - - 294025696 29,403
At the end of the financial year 503086333 50,309 503086333 50,309
10 Lakh is equal to 1 Million

114
Srei Infrastructure Finance Limited
SIGNIFICANT ACCOUNTING POLICIES AND NOTES TO FINANCIAL STATEMENTS (Contd.)
2.2 Rights, preferences and restrictions in respect of each class of Shares
The Company’s authorised capital consists of two classes of shares, referred to as equity shares and preference shares, having
par value of ` 10/- and ` 100/- each respectively. Each holder of equity shares is entitled to one vote per share. The preference
shareholders have a preferential right over equity share holders, in respect of repayment of capital and payment of dividend.
However, no such preference shares have been issued by the Company during the years ended 31st March, 2011 & 31st
March, 2012.
The Company declares and pays dividend in Indian rupees. The dividend, if any, proposed by the Board of Directors is subject
to the approval of the shareholders in the ensuing Annual General Meeting.
Dividend per equity share proposed for the current year is ` 0.50 (Previous year: ` 0.75).
In the event of liquidation of the Company, the holders of equity shares will be entitled to receive any of the remaining assets of
the company, after distribution of all preferential amounts. The distribution will be in proportion to the number of equity shares
held by the shareholders.
2.3 Shares allotted as fully paid-up without payment being received in cash / by way of bonus shares (during 5 years preceding 31st
March, 2012)
Pursuant to amalgamation of Quippo Infrastructure Equipment Limited (Transferor Company) into and with the Company,
approved by the Equity Shareholders of the Company and sanctioned by the Hon’ble High Court of Calcutta on 18th January,
2011, the Company issued and allotted 92,915,839 equity shares of ` 10/- par value, as fully paid up bonus shares, to the pre-
amalgamation equity shareholders of the Company on 5th March, 2011.
Further, the Company issued and allotted 294,025,696 equity shares of ` 10/- par value, as fully paid-up, towards consideration
for the aforesaid amalgamation, to the shareholders of the Transferor Company on 5th March, 2011. This includes 48,600,000
equity shares allotted to Srei Growth Trust, a Trust settled by the Company on 4th March, 2011, to receive equity shares of the
Company in exchange of the Company’s shareholding in the Transferor Company. The beneficial interest in the Trust amounting
to ` 1,851.50 lakh, representing the cost of shares of the Transferor Company, is shown under ‘Non-Current Investments’ in the
Balance Sheet.
2.4 Shareholders holding more than 5% equity shares each, are set out below:
Name of the Shareholders31st March, 2012 31st March, 2011
No. of Shares % of holding No. of Shares % of holding
Deigratia International Pte Limited 147937030 29.41 167937030 33.38
Opulent Venture Capital Trust 57974595 11.52 57974595 11.52
Srei Growth Trust* 48600000 9.66 48600000 9.66
Adisri Investment Private Limited 38992840 7.75 38992840 7.75
Adhyatma Commercial Private Limited 34705703 6.90 10395000 2.07
Fidelity Investment Trust Fidelity Series Emerging Markets Fund 31414121 6.24 - -
* Held in the name of Trustees

115
Annual Report 2011-12
Srei Infrastructure Finance Limited
SIGNIFICANT ACCOUNTING POLICIES AND NOTES TO FINANCIAL STATEMENTS (Contd.)
3. RESERVES AND SURPLUS(` in Lakh)
Particulars 31st March, 2012 31st March, 2011
Capital Reserves
Opening balance 1,945 1,945
Closing balance 1,945 1,945
Securities Premium Reserve
Opening balance 19,754 29,046
Less: Issuance of Bonus shares - (9,292)
Closing balance 19,754 19,754
Bond / Debt Redemption Reserve
Opening balance 6,478 4,250
Add: Addition during the year (refer note 3.1) 3,818 3,020
Less: Transfer to Surplus, on repayment of Bond / Debt (792) (792)
Closing balance 9,504 6,478
Special Reserve (Reserve Fund as per Section 45-IC of the
Reserve Bank of India Act, 1934)
Opening balance 13,417 10,727
Add: Addition during the year 1,167 2,690
Closing balance 14,584 13,417
General Reserve
Opening balance 139,604 1,734
Add: Addition on account of Amalgamation - 137,870
Closing balance 139,604 139,604
Surplus
Opening balance 23,791 19,679
Add: Net profit after tax transfer from Statement of Profit and Loss 5,796 13,430
Amount available for appropriation 29,587 33,109
Appropriations:
Proposed dividend 2,515 3,773
Corporate dividend tax on proposed dividend 393 627
Special Reserve 1,167 2,690
Bond / Debt Redemption Reserve (net) 3,026 2,228
Closing balance 22,486 23,791
Total Reserves and Surplus 207,877 204,989
10 Lakh is equal to 1 Million

116
Srei Infrastructure Finance Limited
SIGNIFICANT ACCOUNTING POLICIES AND NOTES TO FINANCIAL STATEMENTS (Contd.)
3.1 Bond / Debt Redemption Reserve
During the year, the Company has created Bond / Debt Redemption Reserve of ` 3,797 lakh (Previous year: ` 3,020 lakh)
towards redemption of Unsecured Subordinated Bonds / Debentures / Debt (Tier II Capital). Debt Redemption Reserve of ̀ 792
lakh (Previous year: ` 792 lakh) has been reversed due to repayment of Bond / Debt during the year.
During the year, the Company has also created Bond / Debt Redemption Reserve of ` 21 lakh (Previous year: ` Nil) towards
redemption of Long-Term Infrastructure Bonds, which were raised during the year.
4. LONG-TERM BORROWINGS(` in Lakh)
Particulars
31st March, 2012 31st March, 2011Non- Current Non- Current
Current MaturitiesTotal
Current MaturitiesTotal
Maturities Maturities
A. Secured
Bonds / Debentures:
Long-Term Infrastructure Bonds (refer note 4.1) 2,489 - 2,489 - - -
Non-Convertible Debentures (refer note 4.2) 65,300 1,700 67,000 1,700 - 1,700
Term Loans (refer note 4.3):
From Banks:
- Rupee Loans 105,998 56,926 162,924 64,545 42,380 106,925
- Foreign Currency Loans 25,442 12,718 38,160 11,147 33,443 44,590
From Financial Institutions:
- Foreign Currency Loans 55,336 5,325 60,661 53,173 4,334 57,507
Deposits
Public Deposits (refer note 4.4) - - - 16 29 45
Other Loans
Buyer’s Credit from Banks - Foreign
Currency Loans (refer note 4.5) - 1,233 1,233 1,081 - 1,081
(A) 254,565 77,902 332,467 131,662 80,186 211,848
B. Unsecured
Bonds / Debentures:
Non-Convertible Debentures - - - - 4,300 4,300
Subordinated bonds/debentures
(Tier II Capital) (refer note 4.6) 65,000 527 65,527 30,527 790 31,317
Term Loans
From Financial Institutions - - - - 5,000 5,000
Deposits
Inter-Corporate Deposits 89 - 89 - - -
(B) 65,089 527 65,616 30,527 10,090 40,617
Total (A+B) 319,654 78,429 398,083 162,189 90,276 252,465
10 Lakh is equal to 1 Million

117
Annual Report 2011-12
4.1 Long-Term Infrastructure Bonds – Secured, Redeemable, Non-convertible Debentures
During the year, the Company has raised ` 2,489 lakh (Previous year: ` Nil) through public issue of Long-Term Infrastructure
Bonds in the nature of Secured, Redeemable Non-Convertible Debentures, eligible for deduction under section 80 CCF of the
Income-Tax Act, 1961. Fund raised has been utilised for the purposes of infrastructure lending as per the terms of the issue.
Maturity profile and rate of interest of these Bonds are as set out below:
Bonds with interest rate of 8.90% have an overall tenure of 10 years and those with 9.15%, 15 years. Buyback option is available
for all bonds at the end of 5 years i.e. on 22.03.2017. Bonds are secured by exclusive charge on specific receivables of the
Company & pari-passu mortgage/charge on immovable property.
Srei Infrastructure Finance Limited
SIGNIFICANT ACCOUNTING POLICIES AND NOTES TO FINANCIAL STATEMENTS (Contd.)
(` in Lakh)
Maturity ProfileRate of Interest
2016-17 2012-16Total
8.90% 1,291 - 1,291
9.15% 1,198 - 1,198
Total 2,489 - 2,489
4.2 Non-Convertible Debentures
(` in Lakh)
Rate of InterestMaturity Profile*
Total2021-22 2016-17 2015-16 2014-15 2013-14 2012-13
9.75% 1 - - - - - 1,700 1,700
10.80% 2 - 6,668 6,666 6,666 - - 20,000
10.90% 2 - - - - 5,000 - 5,000
11.00% 2 - - - - 300 - 300
11.40% 2 - - - 6,700 - - 6,700
11.75% 2 - 29,300 - - - - 29,300
11.90% 2 4,000 - - - - - 4,000
Total 4,000 35,968 6,666 13,366 5,300 1,700 67,000
* Includes current maturities
1 Secured against Receivables of the Company.
2 Secured against Receivables of the Company and mortgage of immovable property.
All the above debentures are redeemable at par.
10 Lakh is equal to 1 Million

118
Srei Infrastructure Finance Limited
SIGNIFICANT ACCOUNTING POLICIES AND NOTES TO FINANCIAL STATEMENTS (Contd.)
The above Term Loans are secured by charge on specific assets covered by loan / lease agreements with customers and / or
receivables arising therefrom.1 Includes ` 2,111 lakh (Previous year ` 2,372 lakh) guaranteed by subsidiary company.2 Includes loans of ` 14,333 lakh (Previous year ` 13,713 lakh) guaranteed by Export Import Bank of the United States.
4.4 Public Deposits
In order to qualify for registration as an ‘Infrastructure Finance Company’, the Company decided not to accept or renew public
deposits w.e.f. 20th April, 2010. The amount of public deposits outstanding as on 19th April, 2010 (including matured and
unclaimed deposits) along with accrued and future interest thereof is kept in the form of a Fixed Deposit, under lien, with Axis
Bank Limited, a scheduled commercial bank, for the purpose of making payment to the depositors. The outstanding balance
of the Fixed Deposit as at 31st March, 2012 is ` 88 lakh (` 250 Lakh as at 31st March, 2011).
4.5 Buyerʼs credit from Banks (Foreign Currency Loan)
These foreign currency loans from banks are repayable by bullet payment and have tenures ranging from 1-3 years. These
loans are secured by import documents covering title to capital goods and extension of pari passu charge towards working
capital facilities.
4.6 Unsecured Subordinated bonds / debentures (Tier II Capital)
During the year ended 31st March, 2012, the Company raised subordinated debt qualifying for Tier II capital amounting to
` 35,000 lakh (31st March, 2011: ` 5,000 lakh). The following table sets forth the details of the outstanding as at 31st March,
2012:
4.3 Term Loans
Maturity Profile*Rate of Interest
Beyond 5 years 3-5 years 1-3 years 0-1 yearsTotal
From Banks - Rupee Loans1 259 33,425 72,314 56,926 162,924
From Banks - Foreign Currency Loans 13,739 10,940 763 12,718 38,160
From Financial Institutions - Foreign Currency Loans2 11,737 20,066 23,533 5,325 60,661
Total 25,735 64,431 96,610 74,969 261,745
* Includes current maturities
Rate of InterestMaturity Profile
2021 - 22 2020 - 21 2019 - 20 2017 - 18 2016 - 17 2012 - 13Total
10.20% - - 20,000 - - - 20,000
10.50% - 5,000 - - - 527* 5,527
11.40% 10,000 - - - - - 10,000
11.75% - - - 1,000 85 - 1,085
11.85% - - - - 2,000 - 2,000
11.90% 21,915 - - - - - 21,915
12.00% - - - - 5,000 - 5,000
Total 31,915 5,000 20,000 1,000 7,085 527 65,527
*The interest rate is floating and is computed based on average yield to maturity (YTM) calculated from the balance maturity of 12
year Government of India (GOI) security paper for the remaining tenure of the Bonds.
*Each bond is having an overall tenure of 12 years, reckoned from the date of allotment. The bonds shall be redeemed at a premium
of 20% of the original face value.
(` in Lakh)
(` in Lakh)

119
Annual Report 2011-12
Srei Infrastructure Finance Limited
SIGNIFICANT ACCOUNTING POLICIES AND NOTES TO FINANCIAL STATEMENTS (Contd.)
5. DEFERRED TAX LIABILITIES (Net)
In terms of Accounting Standard 22, the net Deferred Tax Liability (DTL) recognised during the year is ` 1,198 lakh (Previous
year: ` 3,350 lakh). Consequently, the net DTL as at year-end stands at ` 7,988 lakh (31st March, 2011 ` 6,790 lakh). The break-
up of major components of net DTL is as follows:
(` in Lakh)
Particulars Liability / (Asset) as at
31st March, 2012 31st March, 2011
Depreciation on Fixed Assets 6,598 5,222
Deferred Revenue Expenditure 2,695 2,059
Others (1,305) (491)
Total 7,988 6,790
6. OTHER LONG-TERM LIABILITIES(` in Lakh)
Particulars 31st March, 2012 31st March, 2011
Interest Accrued but not due on Borrowings 5 2
Capital Advances - 75
Security Deposits & Retentions 827 923
Total 832 1,000
7. LONG-TERM PROVISIONS(` in Lakh)
Particulars 31st March, 2012 31st March, 2011
Provision for Employee Benefits (Non-Current Portion) (refer note 34)
Gratuity 120 89
Unavailed Leave 216 144
(A) 336 233
Others
Provision for Non-Performing Assets (refer note 7.1) 1,100 -
Contingent Provisions against Standard Assets (refer note 7.1) 2,181 1,195
Provision for Premium on Unsecured Subordinated Bonds - 20
(B) 3,281 1,215
Total (A+B) 3,617 1,448
10 Lakh is equal to 1 Million

120
Srei Infrastructure Finance Limited
SIGNIFICANT ACCOUNTING POLICIES AND NOTES TO FINANCIAL STATEMENTS (Contd.)
7.1 Nature of certain provisions and their movement year-on-year.
Provision for non-performing assets (NPAs) is made in the financial statements according to the Prudential Norms prescribed
by RBI for NBFCs. The Company also makes additional provision based on the management’s best estimate, to the extent
considered necessary.
The Company creates a general provision at 0.25% of the standard assets outstanding on the balance sheet date, as per the
RBI Prudential Norms.
The following table sets forth the movement of aforesaid Provisions year-on-year:
(` in Lakh)
Particulars
Provisions for NPAs Contingent Provisions against Standard Assets
Year ended Year ended31st March, 2012 31st March, 2011 31st March, 2012 31st March, 2011
Opening balance - - 1,195 -
Provision made during the year 1,100 - 986 1,195
Closing balance 1,100 - 2,181 1,195
8. SHORT-TERM BORROWINGS(` in Lakh)
Particulars 31st March, 2012 31st March, 2011
A. Secured
Loans repayable on demand
Working Capital Facilities from banks (Rupee Loan) (refer note 8.1) 149,000 143,000
Other Loans
Working Capital Facilities from banks (Rupee Loan) (refer note 8.1) 293,646 82,006
Short-Term Loans from Banks (refer note 8.2)
- Rupee Loans 40,000 15,000
- Foreign Currency Loans 5,087 -
Buyer’s credit from Banks - Foreign Currency Loan (refer note 4.5) 1,984 -
Deposits
Public Deposits (refer note 4.4) 16 1
(A) 489,733 240,007
10 Lakh is equal to 1 Million

121
Annual Report 2011-12
Srei Infrastructure Finance Limited
SIGNIFICANT ACCOUNTING POLICIES AND NOTES TO FINANCIAL STATEMENTS (Contd.)
8.1 Working capital facilities from banks, including working capital demand loans earmarked against such facilities, are secured
by hypothecation of underlying assets (short-term as well as long-term loan assets) covered by hypothecation loan of agreements
and operating lease agreements with customers and receivables arising therefrom, ranking pari passu (excluding assets
specifically charged to others). As per the prevalent practice, these facilities are renewed on a year-to-year basis and therefore,
are revolving in nature.
8.2 Short-Term Loans from banks are secured by charge on specific assets covered by loan/ facility agreements with customers
and / or receivables arising therefrom.
8.3 Face value of Commercial Paper outstanding as at 31st March, 2012 is ` 67,850 lakh (as at 31st March, 2011 ` 26,120 lakh).
Face value of maximum outstanding at any time during the year ended 31st March, 2012 was ` 207,850 lakh (Previous year
` 63,500 lakh). Face value of Commercial Paper repayable within one year is ` 67,850 lakh (Previous year ` 26,120 lakh).
(` in Lakh)
Particulars 31st March, 2012 31st March, 2011
B. Unsecured
Deposits
Inter Corporate Deposits
- From Related Parties 1,090 1,775
- From Others 15,068 6,244
Other Loans
Non-Convertible Debentures - 3,500
Rupee Loan from Banks 15,000 -
Commercial Papers (refer note 8.3)
- From Banks - 965
- From Others 65,758 24,008
(B) 96,916 36,492
Total (A+B) 586,649 276,499
9. TRADE PAYABLES(` in Lakh)
Particulars 31st March, 2012 31st March, 2011
Trade Payables
Due to Micro, Small and Medium Enterprises1 - -
Due to others 266 257
Total 266 257
1 The Company has not received any memorandum from ‘Suppliers’ (as required to be filed by the ‘Suppliers’ with the notified authority
under the Micro, Small and Medium Enterprises Development Act, 2006) claiming their status as on 31st March, 2012 as micro, small
or medium enterprises. Consequently, the interest paid / payable by the company to such Suppliers, during the year is ` Nil (Previous
year: ` Nil).
10 Lakh is equal to 1 Million

122
Srei Infrastructure Finance Limited
SIGNIFICANT ACCOUNTING POLICIES AND NOTES TO FINANCIAL STATEMENTS (Contd.)
10. OTHER CURRENT LIABILITIES - OTHERS(` in Lakh)
Particulars 31st March, 2012 31st March, 2011
Interest Accrued but not due on Borrowings 6,868 3,081
Advance from Customers 312 -
Statutory Liabilities 600 915
Security Deposits & Retentions 1,723 1,490
Payable to Employees 234 135
Commission Payable to Directors 110 110
Unclaimed Dividend 39 37
Unclaimed Matured Public Deposits and Interest Accrued thereon 38 50
Liability for Operating Expenses 1,696 1,343
Loss payable on Derivative Contracts - 10
Total 11,620 7,171
11. SHORT-TERM PROVISIONS(` in Lakh)
Particulars 31st March, 2012 31st March, 2011
Provision for Employee Benefits (Current Portion) (refer note 34)
Unavailed leave 40 20
(A) 40 20
Others
Proposed Dividend 2,515 3,773
Provision for Corporate Dividend Tax 408 627
Provision for Premium on Unsecured Subordinated Bonds 108 158
Provision for Taxation (net of Advance tax / Tax deducted at source) - 257
(B) 3,031 4,815
Total (A+B) 3,071 4,835
10 Lakh is equal to 1 Million

123
Annual Report 2011-12
Srei Infrastructure Finance Limited
SIGNIFICANT ACCOUNTING POLICIES AND NOTES TO FINANCIAL STATEMENTS (Contd.)
12.
FIX
ED
AS
SE
TS
(`in
Lak
h)
Gro
ss B
lock
/ O
rigin
al C
ost
Dep
reci
atio
n / A
mor
tisat
ion
and
Impa
irmen
t1N
et C
arry
ing
Val
ue
Par
ticul
ars
As
atA
dditi
ons
/D
ispo
sals
/A
s at
As
atF
or th
eD
ispo
sals
/A
s at
As
atA
s at
Apr
il 01
,ad
just
men
tsad
just
men
tsM
arch
31,
Apr
il 01
,ye
arad
just
men
tsM
arch
31,
Mar
ch 3
1,M
arch
31,
2011
durin
g th
e du
ring
the
2012
2011
durin
g th
e20
1220
1220
11ye
arye
arye
ar
I. Ta
ngib
le A
sset
s:
Ass
ets
for
Ow
n us
e
Land
- Fr
eeho
ld2,
382
-
224
2,15
8 -
-
-
-
2,
158
2,38
2
Bui
ldin
gs2
11,9
90
168
-
12,1
58
122
222
-
344
11,8
14
11,8
68
Leas
ehol
d Im
pro
vem
ents
1,
101
931
-
2,03
2 26
11
2 -
13
8 1,
894
1,07
5
Furn
iture
and
Fix
ture
s60
7 26
3 17
85
3 33
55
14
74
77
9 57
4
Com
put
ers
94
59
-
153
27
27
-
54
99
67
Offi
ce E
qui
pm
ent
344
267
3 60
8 16
38
-
54
55
4 32
8
Mot
or V
ehic
les
23
20
-
43
-
3 -
3
40
23
Tota
l (A
)16
,541
1,
708
244
18,0
05
224
457
14
667
17,3
38
16,3
17
Ass
ets
give
n on
Ope
ratin
g Le
ase
Pla
nt &
Mac
hine
ry3
24,2
54
4,34
5 -
28
,599
2,
685
827
-
3,51
2 25
,087
21
,569
Airc
rafts
1,98
7 -
-
1,
987
679
224
-
903
1,08
4 1,
308
Tota
l (B
)26
,241
4,
345
-
30,5
86
3,36
4 1,
051
-
4,41
5 26
,171
22
,877
Tota
l (I)
= (
A+
B)
42,7
82
6,05
3 24
4 48
,591
3,
588
1,50
8 14
5,
082
43,5
09
39,1
94
II. In
tang
ible
Ass
ets:
Com
put
er S
oftw
are
75
54
-
129
13
32
-
45
84
62
Tota
l (II)
75
54
-
129
13
32
-
45
84
62
Tota
l Fix
ed A
sset
s= (
I+II)
42,8
57
6,10
7 24
4 48
,720
3,
601
1,54
0 14
5,
127
43,5
93
39,2
56
Pre
viou
s ye
ar10
,104
32
,753
-
42,8
57
1,79
3 1,
808
- 3,
601
39,2
56
III. C
apita
l wor
k in
Pro
gres
s91
1 5,
367
-
6,27
8 -
-
-
-
6,
278
911
1 Non
e of
the
Com
pan
y’s
Fixe
d A
sset
s ar
e co
nsid
ered
imp
aire
d a
s on
the
Bal
ance
She
et d
ate.
2 Bui
ldin
g in
clud
es `
9,91
8.95
lakh
in re
spec
t of w
hich
con
veya
nce
is p
end
ing
.3 A
dd
ition
s to
Pla
nt &
Mac
hine
ry in
clud
es b
orro
win
g c
osts
for
qua
lifyi
ng a
sset
s ca
pita
lised
dur
ing
the
year
am
ount
ing
to `
174.
98 la
kh (
Pre
viou
s ye
ar: `
Nil)
as
per
AS
16
(“B
orro
win
g C
osts
”).
10 L
akh
is e
qual
to 1
Mill
ion

124
Srei Infrastructure Finance Limited
SIGNIFICANT ACCOUNTING POLICIES AND NOTES TO FINANCIAL STATEMENTS (Contd.)
13.1 NON-CURRENT INVESTMENTS
Quantity ` in lakh
ParticularsFace As at 31st As at 31st As at 31st As at 31st
value March, March, March, March,
(`) 2012 2011 2012 2011
A. Trade Investments - at cost unless otherwise stated
I. In Equity Instruments (Unquoted)
(a) In Subsidiaries
Srei Capital Markets Ltd. 10 5050000 5050000 505.00 505.00
Srei Forex Ltd.
(Net of provision for other than temporary diminution
aggregating ` 50 lakh (31st March, 2011: ` 50 lakh) 10 500000 500000 - -
Srei Insurance Broking Pvt. Limited (subsidiary w.e.f.
31st March, 2012) 10 1275000 - 143.67 -
Srei Venture Capital Ltd. 10 250000 250000 25.00 25.00
Global Investment Trust Ltd. 10 50000 50000 5.00 5.00
Srei Infrastructure Advisors Ltd. 10 500000 500000 50.00 50.00
Srei Sahaj e-Village Ltd. 10 9510000 9510000 951.00 951.00
Controlla Electrotech Pvt. Ltd. 10 35305 35305 707.87 707.87
IIS International Infrastructure Services GmbH, Germany ** ** ** 3,389.96 3,389.96
Srei Mutual Fund Asset Management Pvt. Ltd. 10 13000000 11000000 1,300.00 1,100.00
Srei Mutual Fund Trust Pvt. Ltd. 10 50000 50000 5.00 5.00
Quippo Oil & Gas Infrastructure Ltd. 10 29970000 29940000 10,420.04 10,409.09
Quippo Construction Equipment Ltd. 10 50000 50000 96.00 96.00
Quippo Energy Pvt. Ltd. 10 1000000 1000000 20,189.70 20,189.70
Mumbai Futuristic Economic Zone Pvt. Ltd. 10 10000 10000 8,046.60 8,046.60
Quippo Valuers & Auctioneers Pvt. Ltd. 10 200000 200000 232.13 232.13
Subtotal- (a) 46,066.97 45,712.35
(b) In Joint Ventures
Srei Equipment Finance Pvt. Ltd. 10 26610000 25000000 7,491.00 2,500.00
Subtotal- (b) 7,491.00 2,500.00
(c) Others
TN (DK) Expressways Ltd. (Pledged with Bank) 10 13000 13000 1.30 1.30
Madurai Tuticorin Expressways Ltd. (Pledged with Bank) 10 19500 19500 1.95 1.95
Guruvayoor Infrastructure Pvt. Ltd.(Pledged with Bank) 10 20010000 20010000 2,001.00 2,001.00
Jaora-Nayagaon Toll Road Co. Pvt. Ltd. (Pledged with Bank) 10 2800 2800 0.28 0.28
10 Lakh is equal to 1 Million
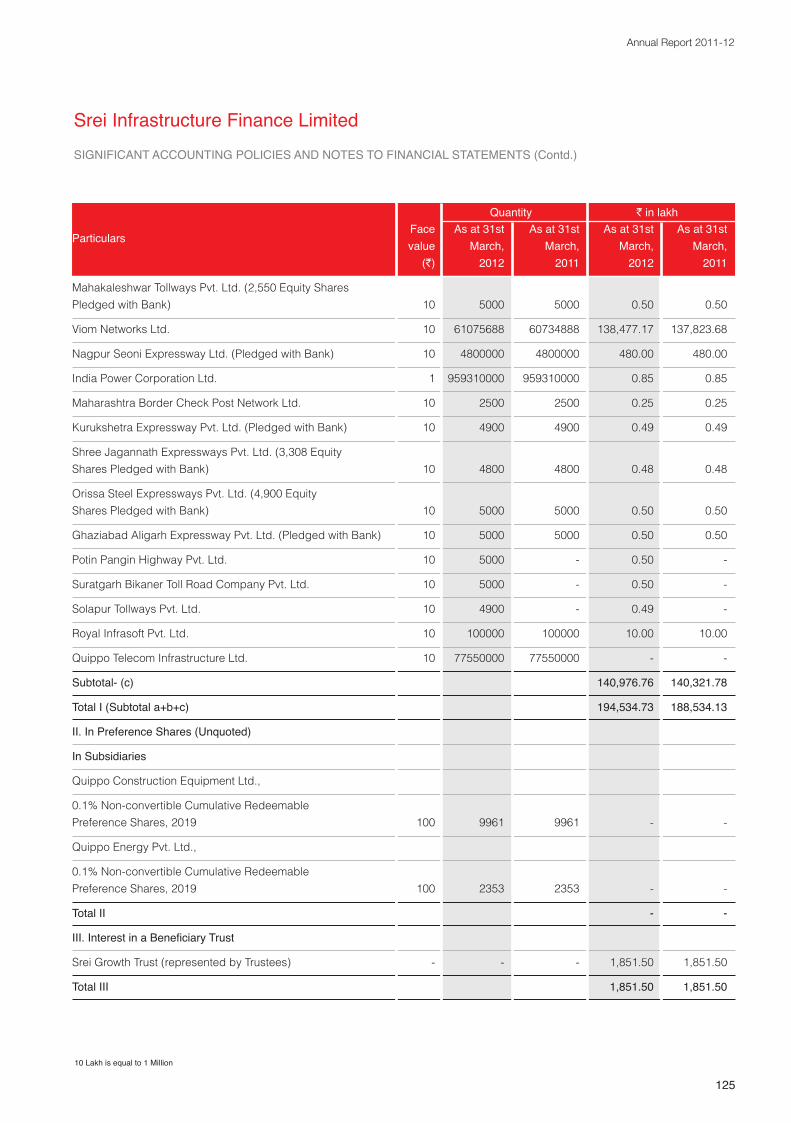
125
Annual Report 2011-12
Srei Infrastructure Finance Limited
SIGNIFICANT ACCOUNTING POLICIES AND NOTES TO FINANCIAL STATEMENTS (Contd.)
Quantity ` in lakh
ParticularsFace As at 31st As at 31st As at 31st As at 31st
value March, March, March, March,
(`) 2012 2011 2012 2011
Mahakaleshwar Tollways Pvt. Ltd. (2,550 Equity Shares
Pledged with Bank) 10 5000 5000 0.50 0.50
Viom Networks Ltd. 10 61075688 60734888 138,477.17 137,823.68
Nagpur Seoni Expressway Ltd. (Pledged with Bank) 10 4800000 4800000 480.00 480.00
India Power Corporation Ltd. 1 959310000 959310000 0.85 0.85
Maharashtra Border Check Post Network Ltd. 10 2500 2500 0.25 0.25
Kurukshetra Expressway Pvt. Ltd. (Pledged with Bank) 10 4900 4900 0.49 0.49
Shree Jagannath Expressways Pvt. Ltd. (3,308 Equity
Shares Pledged with Bank) 10 4800 4800 0.48 0.48
Orissa Steel Expressways Pvt. Ltd. (4,900 Equity
Shares Pledged with Bank) 10 5000 5000 0.50 0.50
Ghaziabad Aligarh Expressway Pvt. Ltd. (Pledged with Bank) 10 5000 5000 0.50 0.50
Potin Pangin Highway Pvt. Ltd. 10 5000 - 0.50 -
Suratgarh Bikaner Toll Road Company Pvt. Ltd. 10 5000 - 0.50 -
Solapur Tollways Pvt. Ltd. 10 4900 - 0.49 -
Royal Infrasoft Pvt. Ltd. 10 100000 100000 10.00 10.00
Quippo Telecom Infrastructure Ltd. 10 77550000 77550000 - -
Subtotal- (c) 140,976.76 140,321.78
Total I (Subtotal a+b+c) 194,534.73 188,534.13
II. In Preference Shares (Unquoted)
In Subsidiaries
Quippo Construction Equipment Ltd.,
0.1% Non-convertible Cumulative Redeemable
Preference Shares, 2019 100 9961 9961 - -
Quippo Energy Pvt. Ltd.,
0.1% Non-convertible Cumulative Redeemable
Preference Shares, 2019 100 2353 2353 - -
Total II - -
III. Interest in a Beneficiary Trust
Srei Growth Trust (represented by Trustees) - - - 1,851.50 1,851.50
Total III 1,851.50 1,851.50
10 Lakh is equal to 1 Million

126
Srei Infrastructure Finance Limited
SIGNIFICANT ACCOUNTING POLICIES AND NOTES TO FINANCIAL STATEMENTS (Contd.)
Quantity ` in lakh
ParticularsFace As at 31st As at 31st As at 31st As at 31st
value March, March, March, March,
(`) 2012 2011 2012 2011
IV. In Units of Trusts and Schemes of Venture Funds
India Global Competitive Fund 100 3875000 3875000 3,875.00 3,875.00
Infrastructure Project Development Fund 100 13589900 13319900 13,589.90 13,319.90
Infrastructure Project Development Capital 100 22208130 17182130 22,208.13 17,182.13
Medium and Small Infrastructure Fund 100 280000 280000 280.00 280.00
Prithvi Infrastructure Fund 100 11705910 11499000 11,705.91 11,499.00
Infra Construction Fund 100 11615800 11456800 11,615.80 11,456.80
Total IV 63,274.74 57,612.83
Total A (Trade Investments) (I+II+III+IV) 259,660.97 247,998.46
B. Other Investments - at cost unless otherwise stated
V. In Equity Instruments (Quoted)
New Era Urban Amenities Ltd.
(Net of provision for other than temporary diminution
aggregating ` 0.01 lakh (31st March, 2011: ` 0.01 lakh)) 10 100 100 - -
Alpic Finance Ltd.
(Net of provision for other than temporary diminution
aggregating ` 0.01 lakh (31st March, 2011: ` 0.01 lakh)) 10 100 100 - -
Apple Finance Ltd.
(Net of provision for other than temporary diminution
aggregating ` 0.02 lakh (31st March, 2011: ` 0.02 lakh)) 10 100 100 - -
HDFC Bank Ltd. 2 2010 402 1.00 1.00
CRISIL Ltd. 1 2000 200 0.10 0.10
Hotline Glass Ltd.
(Net of provision for other than temporary diminution
aggregating ` 218.35 lakh (31st March, 2011: ` 218.35 lakh)) 10 8006030 8006030 - -
Indian Metal & Ferro Alloys Ltd. 10 119615 119615 167.42 167.42
IDFC Ltd. 10 91000 91000 183.35 183.35
Kotak Mahindra Bank Ltd. 10 500 500 0.02 0.02
Power Grid Corporation of India Ltd. 10 8000 8000 9.44 9.44
Tata Steel Ltd. 10 3500 3500 24.83 24.83
Total V 386.16 386.16
10 Lakh is equal to 1 Million

127
Annual Report 2011-12
Srei Infrastructure Finance Limited
SIGNIFICANT ACCOUNTING POLICIES AND NOTES TO FINANCIAL STATEMENTS (Contd.)
Quantity ` in lakh
ParticularsFace As at 31st As at 31st As at 31st As at 31st
value March, March, March, March,
(`) 2012 2011 2012 2011
VI. In Equity Instruments (Unquoted)
New India Co-operative Bank Ltd. 10 573 573 0.06 0.06
National Stock Exchange of India Ltd. 10 57200 57200 2,062.06 2,062.06
ABG Kolkata Container Terminal Pvt. Ltd. 10 1200 1200 0.10 0.10
Total VI 2,062.22 2,062.22
VII. In Government or Trust securities (Quoted)
7.77% Karnataka State Development Loan, 2015 100 57500 57500 58.36 58.36
7.77% Tamilnadu State Development Loan, 2015 100 16020 16020 16.26 16.26
8.40% Transmission Corporation of
Andhra Pradesh Ltd., 2014 1,000,000 1 1 9.92 9.92
9.10% West Bengal Infrastructure Development
Finance Corporation Ltd., 2016 1,000,000 2 2 20.45 20.45
104.99 104.99
Less: Amortisation of premium / discount on
Government securities (1.47) (1.47)
Total VII 103.52 103.52
VIII. In Government or Trust securities (Unquoted)
National Savings Certificate (Lodged with Sales Tax Authorities) 15000 0.15 0.15
Total VIII 0.15 0.15
IX. In Mutual Funds (Quoted)
Morgan Stanley Mutual Fund 10 2000 2000 0.20 0.20
Unit Trust of India 10 400 400 0.04 0.04
Total IX 0.24 0.24
Total B (Other Investments) (V+VI+VII+VIII+IX) 2,552.29 2,552.29
Total Non-current Investments (A+B) 262,213.26 250,550.75
Aggregate amount of quoted non-current investments 489.92 489.92
Aggregate market value of quoted non-current investments 658.85 1,009.43
Aggregate amount of unquoted non-current investments 261,723.34 250,060.83
Aggregate provision for diminution in value of
non-current investments 268.39 268.39
** There is no system of issuance of distinctive shares in the country of registration.
All the Investments mentioned above are fully paid-up
10 Lakh is equal to 1 Million
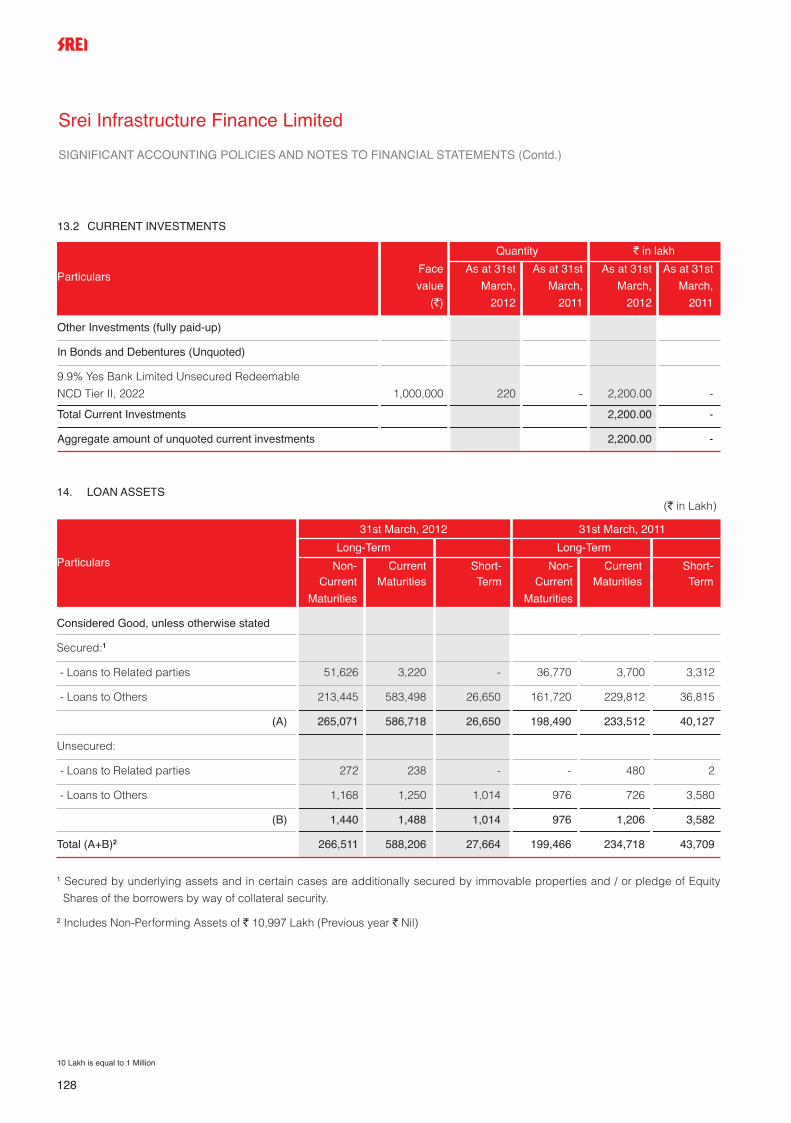
128
Srei Infrastructure Finance Limited
SIGNIFICANT ACCOUNTING POLICIES AND NOTES TO FINANCIAL STATEMENTS (Contd.)
13.2 CURRENT INVESTMENTS
Quantity ` in lakh
ParticularsFace As at 31st As at 31st As at 31st As at 31st
value March, March, March, March,
(`) 2012 2011 2012 2011
Other Investments (fully paid-up)
In Bonds and Debentures (Unquoted)
9.9% Yes Bank Limited Unsecured Redeemable
NCD Tier II, 2022 1,000,000 220 - 2,200.00 -
Total Current Investments 2,200.00 -
Aggregate amount of unquoted current investments 2,200.00 -
14. LOAN ASSETS(` in Lakh)
Particulars
31st March, 2012 31st March, 2011
Long-Term Long-Term
Non- Current Short- Non- Current Short-Current Maturities Term Current Maturities Term
Maturities Maturities
Considered Good, unless otherwise stated
Secured:1
- Loans to Related parties 51,626 3,220 - 36,770 3,700 3,312
- Loans to Others 213,445 583,498 26,650 161,720 229,812 36,815
(A) 265,071 586,718 26,650 198,490 233,512 40,127
Unsecured:
- Loans to Related parties 272 238 - - 480 2
- Loans to Others 1,168 1,250 1,014 976 726 3,580
(B) 1,440 1,488 1,014 976 1,206 3,582
Total (A+B)2 266,511 588,206 27,664 199,466 234,718 43,709
1 Secured by underlying assets and in certain cases are additionally secured by immovable properties and / or pledge of Equity
Shares of the borrowers by way of collateral security.
2 Includes Non-Performing Assets of ` 10,997 Lakh (Previous year ` Nil)
10 Lakh is equal to 1 Million

129
Annual Report 2011-12
Srei Infrastructure Finance Limited
SIGNIFICANT ACCOUNTING POLICIES AND NOTES TO FINANCIAL STATEMENTS (Contd.)
15. OTHER LONG-TERM ADVANCES(` in Lakh)
Particulars 31st March, 2012 31st March, 2011
Unsecured, Considered Good
Advances
- Capital Advances 285 41
- Advance to Vendors for Operating Expenses 40 1
- Employee Advances 43 80
- Advance against investments - 1
Security Deposits
- To Related parties (refer note 35) 2,400 2,400
- To Others 16 64
Share Application Money - 380
Contribution to Corpus of Trusts (Related Parties) (refer note 35) 1 1
Prepaid Expenses 79 63
Total 2,864 3,031
16. OTHER NON-CURRENT ASSETS(` in Lakh)
Particulars 31st March, 2012 31st March, 2011
Unsecured, Considered Good
Fixed Deposit Account with original maturity of
more than twelve months (Under Lien) 98 250
Unamortised Ancillary Borrowing Costs 5,911 4,164
Interest Accrued but not due 3 3,676
Income Accrued but not due 353 290
Total 6,365 8,380
10 Lakh is equal to 1 Million

130
Srei Infrastructure Finance Limited
SIGNIFICANT ACCOUNTING POLICIES AND NOTES TO FINANCIAL STATEMENTS (Contd.)
17. TRADE RECEIVABLES(` in Lakh)
Particulars 31st March, 2012 31st March, 2011
Sundry Debtors (Unsecured)
Outstanding for more than Six Months
- Considered Good - 1,274
- Considered Doubtful 245 -
Less: Provision for Doubtful Debts (37) -
(A) 208 1,274
Other Debts
- Considered Good 3,147 3,367
(B) 3,147 3,367
Total (A+B) 3,355 4,641
18. CASH AND BANK BALANCES(` in Lakh)
Particulars 31st March, 2012 31st March, 2011
A. Cash and Cash Equivalents:
Cash on Hand 5 2
Balances with Banks - in Current Account 5,442 132
Cheques on Hand1 6,774 -
Fixed Deposits with banks (having original maturity of 3 months or less)2 331 545
Unclaimed Dividend Account 39 37
(A) 12,591 716
B. Other Bank Balances :
Fixed Deposits with banks (having original maturity of
more than 3 months)3 2,443 1,799
Less: Non-current portion of other bank balances disclosed
separately under 'Other Non-Current Assets' (98) (250)
(B) 2,345 1,549
Total (A+B) 14,936 2,265
1 Cheques on Hand as at 31st March, 2012 have been realised subsequently.
2 At 31st March, 2012, it includes deposits under lien with banks as security amounting to ` 331 lakh (Previous year ` 545 lakh)
3 At 31st March, 2012, it includes deposits under lien with banks as security amounting to ` 2,345 lakh (Previous year ` 1,549 lakh)
10 Lakh is equal to 1 Million

131
Annual Report 2011-12
Srei Infrastructure Finance Limited
SIGNIFICANT ACCOUNTING POLICIES AND NOTES TO FINANCIAL STATEMENTS (Contd.)
19. OTHER SHORT-TERM ADVANCES
(` in Lakh)
Particulars 31st March, 2012 31st March, 2011
Unsecured, Considered Good
Advances
- Advance to Vendors for Operating Expenses 679 396
- Employee Advances 35 69
- Advance to Related parties 438 -
Security Deposits
- To Others 12,167 11,825
Share Application Money - 3
Prepaid Expenses 83 245
MAT Credit Entitlement 49 2,401
Advance Tax [(net of provision for tax ` 9,668 lakh)
(Previous year ` 7,878 lakh)] 8,347 -
Total 21,798 14,939
20. OTHER CURRENT ASSETS(` in Lakh)
Particulars 31st March, 2012 31st March, 2011
Unamortised Ancillary Borrowing Costs 2,259 1,731
Interest Accrued but not due 17,281 1,871
Income Accrued but not due 51 47
Stock for Trade (refer Annexure I to Notes to Financial Statements) 246 262
Gains receivable on Derivative Contracts 4,507 -
Total 24,344 3,911
10 Lakh is equal to 1 Million

132
Srei Infrastructure Finance Limited
SIGNIFICANT ACCOUNTING POLICIES AND NOTES TO FINANCIAL STATEMENTS (Contd.)
21. REVENUE FROM OPERATIONS(` in Lakh)
Particulars 2011 - 12 2010 - 11
Income from Loans 103,609 60,273
Income from Leases 4,433 2,428
Fee Based Income 6,661 10,542
Assignment Income 2,670 -
Income from Long-Term Trade Investments - 28
Profit on Sale of Long-Term Trade Investments (net) - 70
Profit on Sale of Stock for Trade (net) - 995
Interest from Stock for Trade 2 26
Dividend Income 28 40
Interest received from Govt. Securities / Banks 275 168
Total 117,678 74,570
22. OTHER INCOME(` in Lakh)
Particulars 2011 - 12 2010 - 11
Liabilities No Longer Required Written Back - 44
Other Non-Operating Income 391 10
Total 391 54
10 Lakh is equal to 1 Million

133
Annual Report 2011-12
Srei Infrastructure Finance Limited
SIGNIFICANT ACCOUNTING POLICIES AND NOTES TO FINANCIAL STATEMENTS (Contd.)
23. FINANCE COST(` in Lakh)
Particulars 2011 - 12 2010 - 11
Interest Expense:
Interest on Bonds & Debentures 6,962 5,625
Interest on Term Loans 32,021 24,770
Interest on Public Deposits 3 23
Interest on Working Capital Facilities 33,460 8,530
Finance charges on Commercial Papers 12,342 2,327
Other Interest 1,134 793
Other Borrowing Costs:
Amortisation of ancillary Borrowing costs 2,687 2,281
Amortisation of Premium on Unsecured subordinated bonds 88 88
Other Finance Charges 589 428
Applicable net (gain) / loss on foreign currency transactions and translations 5,514 (1,360)
Total 94,800 43,505
24. EMPLOYEE BENEFIT EXPENSES(` in Lakh)
Particulars 2011 - 12 2010 - 11
Salaries, Allowances, Commission & Bonus 3,846 2,753
Contribution to Provident and Other Funds 263 228
Staff Welfare Expenses 67 41
Total 4,176 3,022
10 Lakh is equal to 1 Million

134
Srei Infrastructure Finance Limited
SIGNIFICANT ACCOUNTING POLICIES AND NOTES TO FINANCIAL STATEMENTS (Contd.)
25. ADMINISTRATIVE & OTHER EXPENSES(` in Lakh)
Particulars 2011 - 12 2010 - 11
Communication Expenses 86 69
Legal & Professional Fees 1,319 1,320
Electricity Charges 114 91
Rent 602 687
Rates and Taxes 146 154
Brokerage and Service Charges 11 1
Auditors' Remuneration (refer note 25.1) 57 50
Repairs - Building 79 35
- Machinery 238 111
- Others 280 129
Travelling and Conveyance 836 645
Directors' Fees 15 7
Insurance 49 16
Printing and Stationery 82 79
Advertisement, Subscription and Donation 429 348
Provision for Diminution in value of Stock for Trade 16 90
Loss on sale of Fixed Assets 53 -
Miscellaneous Expenses 89 46
Total 4,501 3,878
25.1 Auditors' Remuneration(` in Lakh)
Particulars 2011 - 12* 2010 - 11
As Auditor 40 30
For Other Services 16 18
For Reimbursement of Expenses 1 2
Total 57 50
* Includes Service Tax
26. EARNINGS PER EQUITY SHARE(` in Lakh)
Particulars 2011 - 12 2010 - 11
Profit after tax attributable to Equity Shareholders (` in lakh) 5,796 13,430
Weighted average number of Equity Shares (Basic) 503,086,333 231,616,033
Weighted average number of Potential Equity Shares - -
Weighted average number of Equity Shares (Diluted) 503,086,333 231,616,033
Nominal Value of Equity per share (`) 10 10
Basic Earnings per share (`) 1.15 5.80
Diluted Earnings per share (`) 1.15 5.80
10 Lakh is equal to 1 Million

135
Annual Report 2011-12
Srei Infrastructure Finance Limited
SIGNIFICANT ACCOUNTING POLICIES AND NOTES TO FINANCIAL STATEMENTS (Contd.)
Commitments
Estimated amount of capital contracts remaining to be executed and not
provided for (Net of advances) 2,782 1,010
Uncalled liability on partly paid-up shares, held as Stock for Trade - 1
Other Commitments (refer note 28)
1 Includes ` 892 lakh (31st March, 2011: ` 1,017 lakh) issued on Company’s behalf by a Joint Venture Company.
2 Certain Assessment Orders disallowing Special Reserve (created as per Section 45-IC of the RBI Act, 1934) and Debt Redemption
Reserve for the purpose of determining tax liability as per the provision of Section 115JB, Disallowances under section 14A,
Disallowance of Provision for NPA, Disallowance of Provision for earned leave encashment, matters relating to deduction u/s 36(i)(viii),
Upfront Fees on Borrowings and Long-Term Capital Gain arising out of transaction under a Scheme of Arrangement sanctioned by
the Hon'ble Calcutta High Court on 28.01.08 have been challenged by the company before the appropriate authorities. Pending
disposal of the cases filed, the Company has not provided for the Income Tax liabilities arising out of the same.
3 The Company has challenged the constitutional validity of Fringe Benefit Tax (FBT) before the Hon’ble High Court at Calcutta and
the Hon’ble Court has granted interim stay on levy of such FBT on the Company. In view of this, the Company has not provided for
any liability against FBT since its inception upto the date of its abolition i.e., 31st March, 2009.
27. Contingent Liabilities And Commitments (to the extent not provided for)(` in Lakh)
Particulars 31st March, 2012 31st March, 2011
Contingent Liabilities
Bank Guarantees1 1,707 1,929
Corporate Guarantee to Banks 13,815 4,795
Disputed Income Tax2 3,654 2,364
Fringe Benefit Tax3 226 226
Total 19,402 9,314
28. The Company has entered into Options / Swaps / Forward contracts (being derivative instruments) which are not intended for
trading or speculation, for the purpose of hedging currency and interest rate related risks. Options, Swaps and Forward contracts
outstanding as at year end are as follows:
(` in Lakh)
31st March, 2012 31st March, 2011
Category Currency No. of Contracts Amount in No. of Contracts Amount inForeign Currency Foreign Currency
Options / Swaps USD / INR 7 USD 967.6 7 USD 1207.2
Options / Swaps EUR / INR 1 EUR 150 - -
Options / Swaps JPY / USD 1 JPY 8020 - -
Forwards USD / INR 4 USD 32 1 USD 0.59
Forwards EUR / INR - - 1 EUR 5.4
Interest Rate Swaps USD / INR 6 USD 981.8 - -
Foreign currency exposures, which are not hedged by derivative instruments, amount to ` 44,253 lakh as at 31st March, 2012
(31st March, 2011: ` 48,267 lakh).
29. C.I.F. Value Of Imports(` in Lakh)
Particulars 2011 - 12 2010 - 11
Operating Lease Assets 1,254 535
Total 1,254 535
10 Lakh is equal to 1 Million
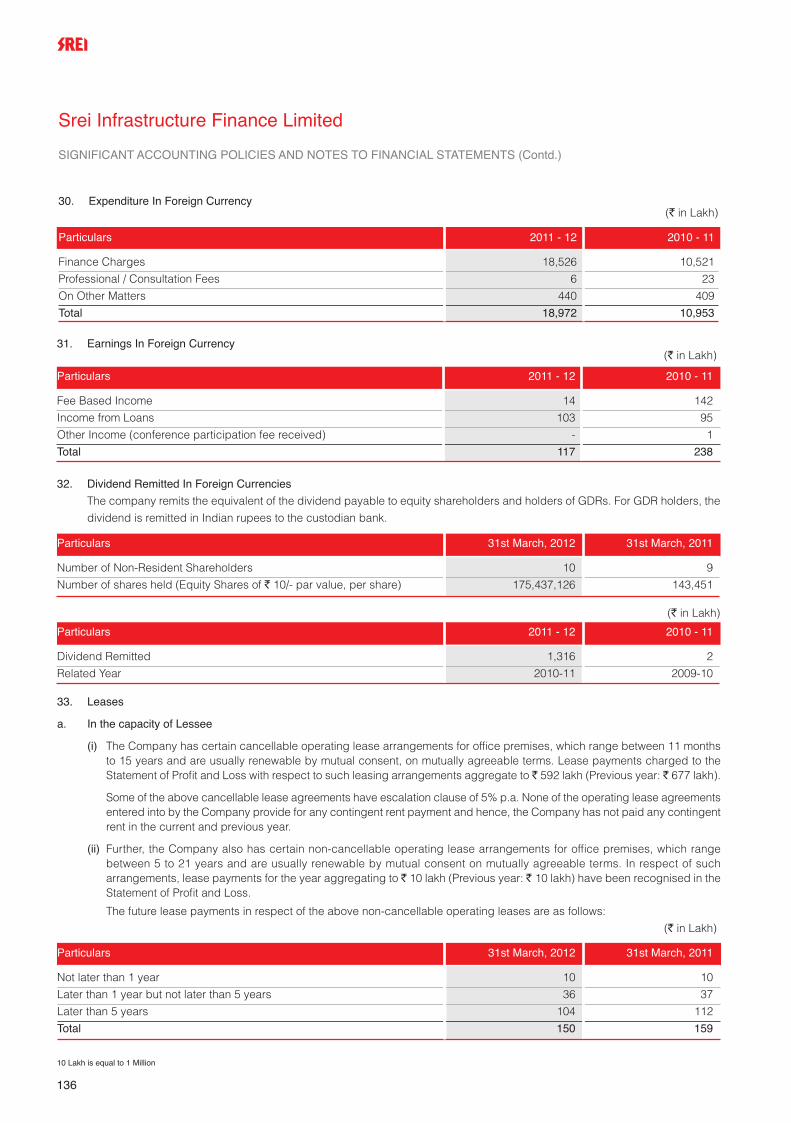
136
Srei Infrastructure Finance Limited
SIGNIFICANT ACCOUNTING POLICIES AND NOTES TO FINANCIAL STATEMENTS (Contd.)
30. Expenditure In Foreign Currency(` in Lakh)
Particulars 2011 - 12 2010 - 11
Finance Charges 18,526 10,521
Professional / Consultation Fees 6 23
On Other Matters 440 409
Total 18,972 10,953
33. Leases
a. In the capacity of Lessee
(i) The Company has certain cancellable operating lease arrangements for office premises, which range between 11 monthsto 15 years and are usually renewable by mutual consent, on mutually agreeable terms. Lease payments charged to theStatement of Profit and Loss with respect to such leasing arrangements aggregate to ` 592 lakh (Previous year: ` 677 lakh).
Some of the above cancellable lease agreements have escalation clause of 5% p.a. None of the operating lease agreementsentered into by the Company provide for any contingent rent payment and hence, the Company has not paid any contingentrent in the current and previous year.
(ii) Further, the Company also has certain non-cancellable operating lease arrangements for office premises, which rangebetween 5 to 21 years and are usually renewable by mutual consent on mutually agreeable terms. In respect of sucharrangements, lease payments for the year aggregating to ` 10 lakh (Previous year: ` 10 lakh) have been recognised in theStatement of Profit and Loss.
The future lease payments in respect of the above non-cancellable operating leases are as follows:
(` in Lakh)
Particulars 31st March, 2012 31st March, 2011
Not later than 1 year 10 10
Later than 1 year but not later than 5 years 36 37
Later than 5 years 104 112
Total 150 159
31. Earnings In Foreign Currency(` in Lakh)
Particulars 2011 - 12 2010 - 11
Fee Based Income 14 142
Income from Loans 103 95
Other Income (conference participation fee received) - 1
Total 117 238
32. Dividend Remitted In Foreign Currencies
The company remits the equivalent of the dividend payable to equity shareholders and holders of GDRs. For GDR holders, the
dividend is remitted in Indian rupees to the custodian bank.
Particulars 31st March, 2012 31st March, 2011
Number of Non-Resident Shareholders 10 9
Number of shares held (Equity Shares of ` 10/- par value, per share) 175,437,126 143,451
P
Particulars 2011 - 12 2010 - 11
Dividend Remitted 1,316 2
Related Year 2010-11 2009-10
(` in Lakh)
10 Lakh is equal to 1 Million

137
Annual Report 2011-12
Srei Infrastructure Finance Limited
SIGNIFICANT ACCOUNTING POLICIES AND NOTES TO FINANCIAL STATEMENTS (Contd.)
(iii) Sub lease payments received (or receivable) recognised in the Statement of Profit and Loss for the year is ` 1,701 lakh(Previous year: ` 1,451 lakh). Future minimum sublease payments expected to be received under non-cancellablesubleases as at 31st March, 2012 is ` 887 lakh (31st March, 2011: ` 1,327 lakh).
b. In the capacity of Lessor
The Company has given assets on Operating lease (refer note 12) for periods ranging between 5 to 15 years. Some of theselease agreements stipulate rental computation on the basis of earnings of the Lessee. Such contingent rent recognised duringthe year is ` 1,514 lakh (Previous year ` Nil).
The future minimum lease receivables in respect of non-cancellable operating leases are as follows:
(` in Lakh)
Particulars 31st March, 2012 31st March, 2011
Not later than 1 year 680 2,180Later than 1 year but not later than 5 years 966 13,107Later than 5 years - 30,000Total 1,646 45,287
34. Disclosure pursuant to Accounting Standard (AS) 15 (Revised) - Employee Benefits
The trustees of the gratuity scheme for the employees of the Company have entrusted the administration of the scheme to the
Life Insurance Corporation of India (LIC).
(a) Expenses recognised in the Statement of Profit and Loss are as follows: (` in Lakh)
ParticularsGratuity Leave
31st March, 2012 31st March, 2011 31st March, 2012 31st March, 2011
Current service cost 57 41 79 107Interest cost 15 9 8 6Expected return on plan assets (9) (7) - -Past Service Cost - 10 - -Net actuarial losses / (gains) (2) 30 41 25Net benefit expense 61 83 128 138Actual return on plan assets 9.15% 9.15% N.A. N.A.
(b) Net Liability recognised in the Balance Sheet is as follows: (` in Lakh)
ParticularsGratuity Leave
31st March, 2012 31st March, 2011 31st March, 2012 31st March, 2011
Defined benefit obligation 228 190 255 183Fair value of plan assets (108) (101) - -Net liability 120 89 255 183- Non-Current 120 89 215 160- Current - - 40 23
(c) Changes in the present value of the defined benefit obligations are as follows: (` in Lakh)
ParticularsGratuity Leave
31st March, 2012 31st March, 2011 31st March, 2012 31st March, 2011
Opening defined benefit obligation 190 100 183 104Interest cost 15 9 8 6Current service cost 57 41 79 107Benefit paid (32) - (56) (59)Actuarial losses / (gains) (2) 30 41 25Plan Amendments - 10 - -Closing defined benefit obligation 228 190 255 183
10 Lakh is equal to 1 Million

138
Srei Infrastructure Finance Limited
SIGNIFICANT ACCOUNTING POLICIES AND NOTES TO FINANCIAL STATEMENTS (Contd.)
(d) The details of fair value of plan assets at the Balance Sheet date are as follows: (` in Lakh)
ParticularsGratuity
31st March, 2012 31st March, 2011
Opening fair value of plan assets 101 69
Expected return on plan assets* 9 7
Contribution by the Company 30 25
Benefits paid (32) -
Actuarial (losses) / gains (0) 0
Closing fair value of plan assets 108 101
* Determined based on government bond rate
(e) The principal assumptions used in determining the gratuity and leave liability are as shown below:
Particulars 31st March, 2012 31st March, 2011
Discount rate (%) 8.70% 8.40%
Return on Plan Assets (Gratuity Scheme) 9.15% 9.15%
Mortality Rate LIC (1994-96) Ultimate LIC (1994-96) Ultimate
(f) The amounts for the current and previous years are as follows: (` in Lakh)
ParticularsGratuity Leave
31st March, 31st March, 31st March, 31st March, 31st March, 31st March, 31st March,2012 2011 2010 2009 2008 2012 2011
Defined benefit obligation 228 190 100 59 36 255 183
Fair value of plan assets 108 101 69 41 15 - -
Deficit 120 89 31 18 21 255 183
Experience adjustments
on plan liabilities – gain / (loss) (6) (32) 0 0 (22) (47) (26)
Experience adjustments
on plan assets – gain / (loss) (0) 0 (1) (1) (6) - -
Actuarial gain / (loss) due
to change on assumptions 9 2 4 5 5 5 1
(g) The estimate of future salary increase, considered in actuarial valuation, takes account of inflation, seniority, promotion and
other relevant factors such as supply and demand in the employee market.
(h) The amount provided for defined contribution plan is as follows: (` in Lakh)
Particulars 31st March, 2012 31st March, 2011
Provident fund 200 143
Employee state insurance 1 1
Total 201 144
10 Lakh is equal to 1 Million

139
Annual Report 2011-12
Srei Infrastructure Finance Limited
SIGNIFICANT ACCOUNTING POLICIES AND NOTES TO FINANCIAL STATEMENTS (Contd.)
35. Related Party Disclosures
Related Parties:
Subsidiaries & Step-down Subsidiaries: Country of Origin
Srei Capital Markets Limited IndiaSrei Venture Capital Limited IndiaSrei Infrastructure Advisors Limited IndiaGlobal Investment Trust Limited IndiaControlla Electrotech Private Limited IndiaSrei Mutual Fund Asset Management Private Limited IndiaSrei Mutual Fund Trust Private Limited IndiaIIS International Infrastructure Services GmbH, Germany GermanySrei Forex Limited IndiaSrei Insurance Broking Private Limited (Subsidiary w.e.f. 31.03.2012) IndiaSrei Sahaj e-Village Limited IndiaBengal Srei Infrastructure Development Limited (Subsidiary of Srei Infrastructure Advisors Limited) IndiaQuippo Infocomm Limited (ceased to be a subsidiary of Srei Infrastructure Advisors Limited w.e.f 16.07.2011) IndiaHyderabad Information Technology Venture Enterprises Limited (Subsidiary of Srei Venture Capital Limited) IndiaCyberabad Trustee Company Pvt. Limited (Subsidiary of Srei Venture Capital Limited) IndiaZAO Srei Leasing, Russia (Subsidiary of IIS International Infrastructure Services GmbH, Germany) RussiaSrei Advisors Pte Limited, Singapore (Subsidiary of IIS International Infrastructure Services GmbH, Germany) SingaporeQuippo Valuers and Auctioneers Private Limited IndiaQuippo Oil & Gas Infrastructure Limited IndiaQuippo Energy Private Limited India Quippo Construction Equipment Limited India Mumbai Futuristic Economic Zone Private Limited India Quippo Prakash Marine Holdings Pte. Limited (Subsidiary of Quippo Oil & Gas Infrastructure Limited) Singapore Quippo Prakash Pte. Limited (Subsidiary of Quippo Prakash Marine Holdings Pte. Limited) Singapore Quippo Holding Cooperatief U.A. (Subsidiary of Quippo Oil & Gas Infrastructure Limited, liquidated on 13.02.2012) Netherlands Quippo International B.V. (Subsidiary of Quippo Holding Cooperatief U.A., liquidated on 13.02.2012) Netherlands Quippo Energy Middle East Limited (Subsidiary of Quippo Energy Private Limited) Dubai Quippo Energy Yemen Limited (Subsidiary of Quippo Energy Private Limited) Yemen Kasco Steel Limited(ceased to be a subsidiary of Quippo Construction Equipment Limited w.e.f. 22.09.2011) India Quippo Mara Infrastructure Limited (Subsidiary of Quippo International B.V., Ceased to be Sub-subsidiary w.e.f. 13.02.2012 on account of liquidation of its holding company) British Virgin IslandsQuippo Mauritius Private Limited (Subsidiary of Quippo Energy Private Limited w.e.f. 05.03.2012) MauritiusQuippo Energy Nigeria Private Limited (Subsidiary of Quippo Mauritius Private Limited w.e.f. 22.03.2012) Nigeria
Joint Venture: Country of Origin
Srei Equipment Finance Private Limited India
Trusts: Country of Origin
Srei Mutual Fund Trust India
Srei Growth Trust India
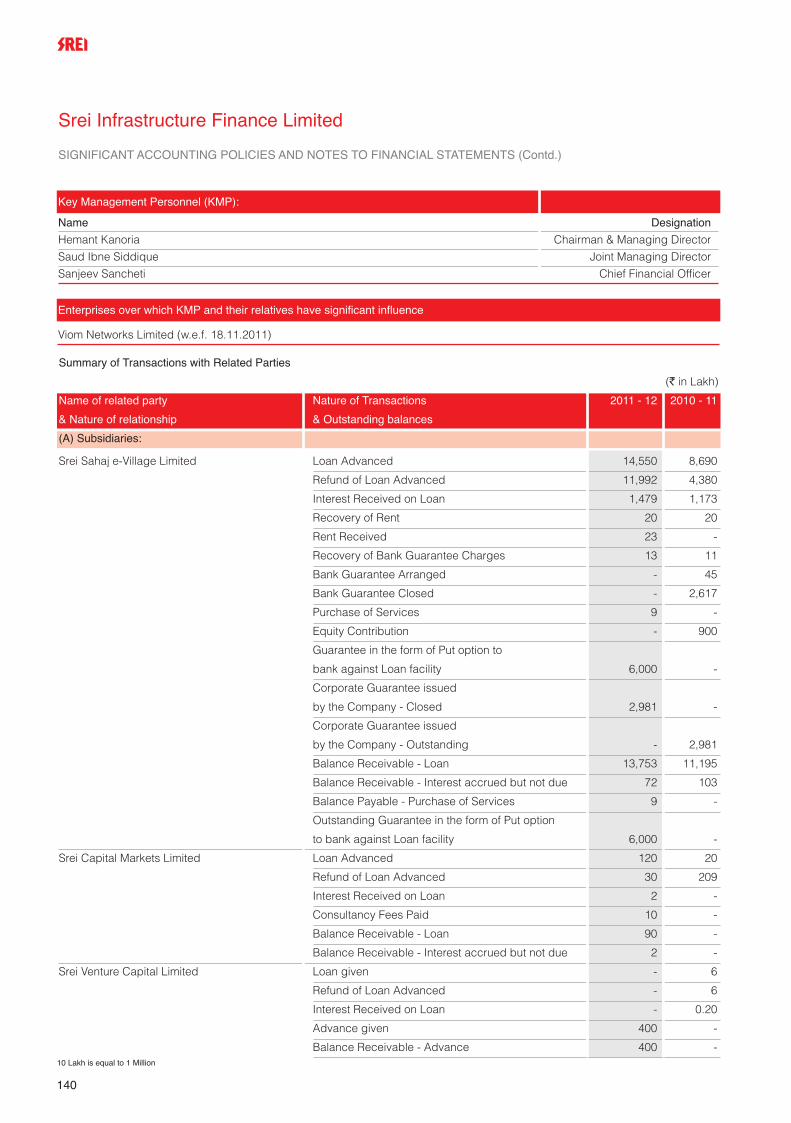
140
Srei Infrastructure Finance Limited
SIGNIFICANT ACCOUNTING POLICIES AND NOTES TO FINANCIAL STATEMENTS (Contd.)
Key Management Personnel (KMP):
Name Designation
Hemant Kanoria Chairman & Managing Director
Saud Ibne Siddique Joint Managing Director
Sanjeev Sancheti Chief Financial Officer
Summary of Transactions with Related Parties
(` in Lakh)
Name of related party Nature of Transactions 2011 - 12 2010 - 11
& Nature of relationship & Outstanding balances
(A) Subsidiaries:
Srei Sahaj e-Village Limited Loan Advanced 14,550 8,690
Refund of Loan Advanced 11,992 4,380
Interest Received on Loan 1,479 1,173
Recovery of Rent 20 20
Rent Received 23 -
Recovery of Bank Guarantee Charges 13 11
Bank Guarantee Arranged - 45
Bank Guarantee Closed - 2,617
Purchase of Services 9 -
Equity Contribution - 900
Guarantee in the form of Put option to
bank against Loan facility 6,000 -
Corporate Guarantee issued
by the Company - Closed 2,981 -
Corporate Guarantee issued
by the Company - Outstanding - 2,981
Balance Receivable - Loan 13,753 11,195
Balance Receivable - Interest accrued but not due 72 103
Balance Payable - Purchase of Services 9 -
Outstanding Guarantee in the form of Put option
to bank against Loan facility 6,000 -
Srei Capital Markets Limited Loan Advanced 120 20
Refund of Loan Advanced 30 209
Interest Received on Loan 2 -
Consultancy Fees Paid 10 -
Balance Receivable - Loan 90 -
Balance Receivable - Interest accrued but not due 2 -
Srei Venture Capital Limited Loan given - 6
Refund of Loan Advanced - 6
Interest Received on Loan - 0.20
Advance given 400 -
Balance Receivable - Advance 400 -
Enterprises over which KMP and their relatives have significant influence
Viom Networks Limited (w.e.f. 18.11.2011)
10 Lakh is equal to 1 Million

141
Annual Report 2011-12
Srei Infrastructure Finance Limited
SIGNIFICANT ACCOUNTING POLICIES AND NOTES TO FINANCIAL STATEMENTS (Contd.)
(` in Lakh)
Name of related party Nature of Transactions 2011 - 12 2010 - 11
& Nature of relationship & Outstanding balances
Balance Receivable - Others 23 -
Purchase of units of Trust 270 -
Srei Infrastructure Advisors Limited Loan advanced - 1
Refund of Loan Advanced 2 8
Interest Received on Loan 0.11 0.25
Business Auxiliary Services rendered 0.12 1
Balance Receivable - Loan - 2
Bengal Srei Infrastructure Loan advanced 182 33
Development Limited Refund of Loan Advanced 150 -
Interest Received on Loan 22 18
Balance Receivable - Loan 182 150
Balance Receivable - Interest accrued but not due 17 -
Srei Forex Limited Loan advanced 0.20 0.20
Business Auxiliary Services rendered 0.05 0.05
Loan write off 0.20 0.20
Srei Mutual Fund Asset Management Subscription to Equity Shares 200 1,090
Private Limited Deposit Received 395 1,000
Deposit Refunded 265 40
Interest on Deposit Paid 85 52
Balance Payable - Deposit 1,090 960
Balance Payable - Interest accrued but not due 6 -
Controlla Electrotech Private Limited Security deposit Refund received - 11
Rent Paid 8 8
Business Auxiliary Services rendered 0.05 0.05
Balance Receivable - Deposit 2,400 2,400
Corporate Guarantee issued by
Subsidiary - Outstanding 2,500 -
Quippo Infocomm Limited Loan advanced 100 235
(ceased to be a subsidiary of Interest Received on Loan 10 14
Srei Infrastructure Advisors Balance Receivable - Loan - 235
Limited w.e.f 16.07.2011) Balance Receivable - Interest accrued but not due - 13
Quippo Energy Private Limited Deposit Received 480 55
Deposit Refunded 1,145 -
Rent Received 246 31
Balance Received - Others 17 -
Interest on Deposit 9 15
Buyers Credit on LC facility arranged
by the Company 1,917 1,081
Buyers Credit Facility Charges 22 4
Suppliers Credit on LC facility arranged by
the Company - Closed 1,847 -
10 Lakh is equal to 1 Million

142
(` in Lakh)
Name of related party Nature of Transactions 2011 - 12 2010 - 11& Nature of relationship & Outstanding balances
Srei Infrastructure Finance Limited
SIGNIFICANT ACCOUNTING POLICIES AND NOTES TO FINANCIAL STATEMENTS (Contd.)
Balance Payable - Deposit 165 830
Balance Payable - Interest accrued but not due - 13
Buyers Credit outstanding on LC facility arranged
by the Company 3,217 1,081
Suppliers Credit outstanding on LC facility
arranged by the Company - 1,847
Corporate Guarantee issued by the Company -
Outstanding 5,495 5,495
Balance Receivable - 17
Quippo Oil & Gas Infrastructure Limited Loan advanced 4,425 100
Refund of Loan Advanced 500 97
Rent Received 1,514 -
Interest Received on Loan 773 362
Guarantee in the form of Put Option to
Bank against loan facility 4,000 -
Bank Guarantee Closed 308 -
Balance Receivable - Loan 8,835 4,910
Balance Receivable - Others 132 -
Bank Guarantee Outstanding - 308
Corporate Guarantee issued by the Company -
Outstanding 1,900 1,900
Outstanding Guarantee in the form of Put option
to bank against Loan facility 4,000 -
Quippo Construction Equipment Limited Loan advanced 5,850 350
Refund of Loan Advanced 5,411 -
Interest Received on Loan 1,994 1,651
LC facility charges 23 -
Suppliers Credit on LC facility arranged by
the Company 15,545 -
Suppliers Credit on LC facility arranged by the
Company closed during the year 8,174 -
Suppliers Credit outstanding on LC facility
arranged by the Company 7,096 -
Balance Receivable - Loan 17,052 16,579
Balance Payable - Interest accrued but not due - 325
Corporate Guarantee issued by the Company -
Outstanding at year end 3,006 -
Quippo Valuers and Auctioneers Deposit Received 50 -
Private Limited Deposit Refunded 200 -
10 Lakh is equal to 1 Million

143
Annual Report 2011-12
Srei Infrastructure Finance Limited
SIGNIFICANT ACCOUNTING POLICIES AND NOTES TO FINANCIAL STATEMENTS (Contd.)
(` in Lakh)
Name of related party Nature of Transactions 2011 - 12 2010 - 11
& Nature of relationship & Outstanding balances
Interest on Deposit Paid 16 14
Business Auxiliary Services rendered 60 -
Balance Payable - Deposit - 150
Mumbai Futuristic Economic Zone Deposit Received 145 -
Private Limited Deposit Refunded 145 -
Loan advanced 1,894 4,303
Interest on Deposit Paid 1 -
Interest Received on Loan 1,550 619
Balance Receivable - Loan 11,989 10,095
Balance Receivable - Interest accrued but not due 75 52
IIS International Infrastructure Loan advanced 462 -
Services GmbH Refund of Loan Advanced 229 -
Interest Received on Loan 12 -
Balance Receivable - Loan 238 -
Balance Receivable - Interest accrued but not due 2 -
Balance Receivable - Others 38 -
Hyderabad Information Technology Consultancy Fees Received 2 -
Venture Enterprises Limited
(B) Joint Venture:
Srei Equipment Finance Private Limited Security Deposit received 54 669
Security Deposit paid - 7
Security Deposit refund received 50 96
Security Deposit refunded 7 -
Advance paid - 270
Refund of advance received - 270
Rent paid - 211
Rent received 1,388 999
Balance Payable - Security Deposit 1,425 1,421
Balance Receivable - Security Deposit - 7
Equity Contribution 4,991 -
Purchase of Investment 143 -
10 Lakh is equal to 1 Million

144
Schedules to the Balance Sheet and Profit and Loss Account
SIGNIFICANT ACCOUNTING POLICIES AND NOTES TO FINANCIAL STATEMENTS (Contd.)
Summary of Transactions with Related Parties
(` in Lakh)
Name of related party Nature of Transactions 2011 - 12 2010 - 11
& Nature of relationship & Outstanding balances
(C) Trusts:
Srei Growth Trust Contribution to corpus 0.25 0.25Income Received 364 -Dividend Paid 364 -
Srei Mutual Fund Trust Contribution to corpus 1 1
(D) Key Management Personnel:
Hemant Kanoria Remuneration 163 178Commission 60 60Dividend paid 3 3
Saud Ibne Siddique Remuneration 339 325Kishore Kumar Mohanty Remuneration - 76(Upto 31.01.2011) Dividend paid - 2Sanjeev Sancheti Remuneration 73 66
Loan advanced 5 - Refund of Loan Advanced 4 -Interest received on Loan 0.21 -Balance Receivable - Loan 1 -
(E) Enterprises over which KMPs and their relatives have significant influence:
Viom Networks Limited Deposit Received 76 -(w.e.f. 18.11.2011) Rent received 306 -
Balance Receivable - Others 6 -Balance Payable - Deposit 660 -
36. Assets for Operating lease include gross value of assets pending to be leased out, amounting to ` Nil (Previous year ` 6,487
lakh).
37. Loans & Advances include Loan of ` 3,175 lakh (Previous year ` 1,199 lakh) due from a private company having at least one
common director with the Company.
38. Details of loans / advances to Subsidiary Companies:
Name of the CompanyMaximum Amount Amount Outstanding Outstanding during as at 31st March,
2011 - 12 2010 - 11 2012* 2011
Srei Capital Markets Limited 90 216 90 -Srei Sahaj e-Village Limited 14,324 11,356 13,753 11,195Srei Infrastructure Advisors Limited 2 9 - 2Bengal Srei Infrastructure Development Limited 182 150 182 150Controlla Electrotech Private Limited 2,400 2,411 2,400 2,400Srei Forex Limited 0.20 0.20 - -Srei Venture Capital Limited 423 6 423 -Quippo Energy Private Limited 3,217 1,098 3,217 1,098Quippo Infocomm Limited 335 235 - 235Quippo Oil & Gas Infrastructure Limited 8,967 5,007 8,967 4,910Quippo Construction Equipment Limited 18,401 16,604 17,052 16,579Mumbai Futuristic Economic Zone Private Limited 13,508 10,095 11,989 10,095IIS International Infrastructure Services GmbH 481 - 276 -
* Refer Note 35
The outstanding Loans and Advances are interest bearing except that of Controlla Electrotech Private Limited and Srei Venture CapitalLimited.
10 Lakh is equal to 1 Million
(` in Lakh)

145
Annual Report 2011-12
Schedules to the Balance Sheet and Profit and Loss Account
SIGNIFICANT ACCOUNTING POLICIES AND NOTES TO FINANCIAL STATEMENTS (Contd.)
39. Disclosure in respect of Company’s Joint Venture in India pursuant to Accounting Standard 27 ‘Financial Reporting of Interest
in Joint Ventures’ :
Name of the Venture Country of Incorporation Proportion of Ownership Interest
Srei Equipment Finance Private Ltd. India 50%
The aggregate of the Company’s share in the above venture is:(` in Lakh)
Particulars 31st March, 2012 31st March, 2011
Current & Non-Current Liabilities 574,106 435,940
Current & Non-Current Assets 644,187 491,183
Contingent Liabilities 9,583 12,090
Capital Commitments (Net of Advances) 2,091 3,530
Particulars 2011 - 12 2010 - 11
Income 91,058 62,086
Expenses (Including Depreciation & Taxation) 81,210 55,541
40. Information as required by Non-Banking Financial (Non-Deposit Accepting or Holding) Companies Prudential Norms (Reserve
Bank) Directions, 2007 is furnished vide Annexure – II and III attached herewith.
41. As notified by the Ministry of Corporate Affairs of the Government of India, revised Schedule VI under the Companies Act, 1956
is applicable to all financial statements for the financial year commencing on or after 1st April, 2011. Accordingly, the financial
statements for the year ended 31st March, 2012 are prepared in accordance with the aforesaid revised Schedule VI.
42. Figures pertaining to the previous year have been rearranged / regrouped, reclassified and restated, wherever necessary, to
make them comparable with those of current year.
Signatories to Notes 1 to 42
For Haribhakti & Co. On behalf of the Board of DirectorsChartered Accountants(Firm's Registration No. 103523W)
Anand Kumar Jhunjhunwala Hemant Kanoria Salil K. GuptaPartner Chairman & Managing Director Chief Mentor & DirectorMembership No. 056613
Place : Kolkata Sandeep LakhotiaDate : 14th May, 2012 Company Secretary
10 Lakh is equal to 1 Million

146
ANNEXURE I TO NOTES TO FINANCIAL STATEMENTS
Stock for Trade as at 31st March, 2012
Equity Shares: TradeFace Value Quantity Cost Value
(`) (Nos.) (` in Lakh)
Bala Techno Industries Ltd. 10 5000 1 -
Hotline Glass Ltd. 10 110609 12 -
Kamala Tea Co. Ltd. 10 25000 11 11
Shanghi Polyesters Ltd. 10 2000 0@ -
IDBI Bank 10 60000 104 63
Karur Vysya Bank 10 6259 26 23
Can Fin Homes Ltd. 10 132201 211 149
Quippo Telecom Infrastructure Ltd. 10 25929041 0* 0#
L.D.Textile Industries Ltd. 10 42000 0* 0#
Shentracon Chemicals Ltd. 10 99400 0* 0#
India Lead Ltd. 10 418668 0* 0#
Mega Marketshare Resources Ltd. 10 6000 0* 0#
PAAM Pharmaceuticals (Delhi) Ltd. 10 1210 0* 0#
Standard Chrome Limited 10 300 0* 0#
Kanel Oil & Export Ltd. 10 3100 0* 0#
Kesoram Textiles Ltd. 10 20 0* 0#
NEPC Agro Foods Ltd. 10 1333 0* 0#
365 246
Less: Provision for diminution 119
Total 246
@ Book value ` 19,800;
* Book value ` 1; # Valued at ` 1
10 Lakh is equal to 1 Million

147
Annual Report 2011-12
ANNEXURE II TO NOTES TO FINANCIAL STATEMENTS (Refer Note 40)
Disclosure of details as required in terms of paragraph 10 of Non Banking Financial (Non-Deposit Accepting or Holding)Companies Prudential Norms (Reserve Bank) Directions, 2007
1. Capital to Risk Assets Ratio (CRAR)
2. Exposure to Real Estate Sector (` in Lakh)
3 Asset Liability Management
Maturity pattern of certain items of assets and liabilities as at 31st March, 2012 are as follows;(` in Lakh)
Particulars
1 day to Over 1 Over 2 Over 3 Over 6 Over 1 Over 3 Over 5
Total30 / 31 month to months to months to months to year to years to years
days 2 months 3 months 6 months 1 year 3 years 5 years(one
month)LiabilitiesBorrowings from Banks 78,864 13,941 73,068 153,401 155,877 156,693 101,231 39,717 772,792Market Borrowings 223 2,436 1 2,664 17,875 42,203 65,273 15,738 146,413AssetsAdvances (refer note - 2 below) 74,745 19,438 74,874 242,453 205,112 149,266 101,515 45,912 913,315Investments (including Current Investments & Stock for trade) 2,446 - - - - 490 - 261,723 264,659
Notes: 1 The borrowings indicated above do not include unsecured subordinated bonds amounting to ` 65,527 lakh, since the
same forms a part of Tier II Capital.2 Advances represent the maturity pattern of loan assets and rentals on operating lease assets.3 The maturity pattern of working capital facilities sanctioned by the banks has been apportioned in ratio to the maturity
pattern of Advances.
Category 31st March, 2012 31st March, 2011
a) Direct exposurei) Residential Mortgages -
Lending fully secured by mortgages on residential property that is or will beoccupied by the borrower or that is rented; (Individual housing loans up to` 15 lakh may be shown separately) - -
ii) Commercial Real Estate -Lending secured by mortgages on commercial real estates (office buildings,retail space, multipurpose commercial premises, multi-family residentialbuildings, multi-tenanted commercial premises, industrial or warehousespace, hotels, land acquisition, development and construction, etc.).Exposure would also include non- fund based (NFB) limits; - -
iii) Investments in Mortgage Backed Securities (MBS) and other securitisedexposures - a) Residential - -b) Commercial Real Estate - -
b) Indirect exposureFund based and non-fund based exposures on National Housing Bank (NHB) and Housing Finance Companies (HFCs). - -
Sl. No. Item 31st March, 2012 31st March, 2011
i) CRAR (%) 20.17 29.36
ii) CRAR – Tier I Capital (%) 14.59 25.13
iii) CRAR – Tier II Capital (%) 5.58 4.23
10 Lakh is equal to 1 Million

148
ANNEXURE III TO NOTES TO FINANCIAL STATEMENTS (Refer Note 40)
Disclosure of details as required in terms of paragraph 13 of Non Banking Financial (Non-Deposit Accepting or Holding)Companies Prudential Norms (Reserve Bank) Directions, 2007
(` in Lakh)
Particulars Amount Amount
Liabilities Side: Outstanding Overdue
1 Loans and advances availed by the non - banking financial company
inclusive of interest accrued thereon but not paid:
(a) Debentures / Bonds:
Secured 72,061 -
Unsecured (Other than falling within the meaning of public deposit) 66,519 -
(b) Deferred Credits - -
(c) Term Loans 324,093 -
(d) Inter - corporate loans and borrowing 16,635 -
(e) Commercial Papers 65,758 -
(f) Other Loans:
Working capital facility 446,519 -
Public Deposit 57 38
(` in Lakh)
Assets Side: Amount
Outstanding
2 Break-up of Loans and Advances including bills receivables [other than those included in (3) below]:(a) Secured 878,439(b) Unsecured 59,313
3 Break-up of Leased Assets and Stock on Hire and other assets counting towards AFC activities(a) Financial assets -(b) Assets and advance for Operating Lease -(c) Repossessed Assets -
4 Break up of InvestmentsCurrent Investments*1 Quoted:(i) Shares: Equity 235(ii) Debentures and bonds -(iii) Units of mutual funds -(iv) Government Securities -(v) Others -
2 Unquoted: (i) Shares: Equity 11(ii) Debentures and bonds 2,200(iii) Units of mutual funds -(iv) Government Securities -(v) Others -
Long-Term investments1 Quoted: (i) Shares: Equity 386(ii) Debentures and bonds -(iii) Units of mutual funds 0.24(iv) Government Securities 104(v) Others -
* Including Stock for Trade
10 Lakh is equal to 1 Million

149
Annual Report 2011-12
ANNEXURE III TO NOTES TO FINANCIAL STATEMENTS (Refer Note 40)Disclosure of details as required in terms of paragraph 13 of Non Banking Financial (Non-Deposit Accepting or Holding)Companies Prudential Norms (Reserve Bank) Directions, 2007
5 Borrower group-wise classification of assets financed as in (2) and (3) above:(` in Lakh)
Amount net of provisionsCategory
Secured Unsecured Total
1 Related Parties
(a) Subsidiaries 54,846 3,349 58,195
(b) Companies in the same group - - -
(c) Other related parties - - -
2 Other than related parties 823,593 55,964 879,557
Total 878,439 59,313 937,752
(` in Lakh)
Assets Side:Amount
Outstanding
2 Unquoted:
(i) Shares: (a) Equity 196,597
(b) Preference -
(ii) Debentures, bonds / units
(iii) Units of mutual funds -
(iv) Government Securities 0.15
(v) Others (Investment in Funds & Trust) 65,126
6 Investor group wise classification of all investments (current and long-term) in shares and securities
(both quoted and unquoted): (` in Lakh)
Category Market Value / Break up or fair value or NAV Book Value (net of provisions)
1 Related Parties
(a) Subsidiaries 46,067 46,067
(b) Companies in the same group 7,491 7,491
(c) Other related parties 140,329 140,329
2 Other than related parties 70,941 70,772
Total 264,828 264,659
7 Other Information:(` in Lakh)
Particulars Amount
i. Gross Non-Performing Assets
(a) Related Parties -
(b) Other than related Parties 10,997
ii. Net Non-Performing Assets
(a) Related Parties -
(b) Other than related Parties 9,897
iii. Assets acquired in satisfaction of debt -
10 Lakh is equal to 1 Million

150
Consolidated Financial StatementsAuditorsʼ Report
To the Board of Directors of
Srei Infrastructure Finance Limited
1. We have audited the attached Consolidated Balance
Sheet of SREI INFRASTRUCTURE FINANCE LIMITED
(“the Company”), it’s subsidiaries (including their
subsidiaries, associate and joint ventures), trusts, and
jointly controlled entity (including its subsidiary) [the
Company, it’s subsidiaries, associate, trusts and jointly
controlled entity collectively referred to as “the Group”]
as at 31st March, 2012, the Consolidated Statement of
Profit and Loss and the Consolidated Cash Flow
Statement of the Group for the year ended on that date,
both annexed thereto. These Consolidated Financial
Statements are the responsibility of the Company’s
Management and have been prepared by the
management on the basis of the separate financial
statements and other financial information regarding
components. Our responsibility is to express an opinion
on these Consolidated Financial Statements based on
our audit.
2. We conducted our audit in accordance with the
auditing standards generally accepted in India. Those
Standards require that we plan and perform the audit to
obtain reasonable assurance about whether the
financial statements are free of material misstatements.
An audit includes examining, on a test basis, evidence
supporting the amounts and disclosures in the financial
statements. An audit also includes assessing the
accounting principles used and the significant
estimates made by the Management, as well as
evaluating the overall financial statement presentation.
We believe that our audit provides a reasonable basis
for our opinion.
3. We did not audit the financial statements of certain
subsidiaries (including their subsidiaries, associate and
joint ventures) and trusts whose financial statements
reflect total net assets of ` 83,629 lakhs as at 31st
March, 2012, total net revenues of ` 27,268 lakhs and
net cash outflows of ` 2,111 lakhs, for the year ended
on that date, as considered in the Consolidated
Financial Statements. We also did not audit the financial
statements of the jointly controlled entity (including it’s
subsidiary) in whose financial statements the Group’s
share of profit is ` 9,862 lakhs, for the year ended on
that date, as considered in the Consolidated Financial
Statements. These financial statements have been
audited by other auditors whose reports have been
furnished to us and our opinion, in so far as it relates to
the amounts included in respect of these subsidiaries
(including their subsidiaries, associate and joint
ventures), trusts and the jointly controlled entity
(including it’s subsidiary), is based solely on the reports
of the other auditors except for in case of two foreign
sub-subsidiaries where reliance has been placed on
the management accounts for the 3 month period
ended 31st March, 2012, in case of three joint ventures
of subsidiaries, two trusts, two sub-subsidiaries
(ceased with effect from 16th July, 2011 and 22nd
September, 2011 respectively) and two sub-
subsidiaries where reliance has been placed on the
management accounts.

151
Annual Report 2011-12
For Haribhakti & Co.
Chartered Accountants
(Firm’s Registration No.103523W)
Anand Kumar Jhunjhunwala
Place : Kolkata Partner
Date : 14th May, 2012 Membership No. 056613
4. We report that the Consolidated Financial Statements
have been prepared by the Company’s Management in
accordance with the requirements of Accounting
Standard 21 (Consolidated Financial Statements),
Accounting Standard 23, (Accounting for Investments
in Associates in Consolidated Financial Statements) and
Accounting Standard 27 (Financial Reporting of
Interests in Joint Ventures) as notified under the
Companies (Accounting Standards) Rules, 2006.
5. Based on our audit and on consideration of the
separate audit reports on individual financial statements
of the Company, it’s aforesaid subsidiaries (including
their subsidiaries, associate and joint ventures), trusts
and jointly controlled entity (including it’s subsidiary),
the other financial information of the components and
to the best of our information and according to the
explanations given to us, we are of the opinion that the
attached Consolidated Financial Statements give a true
and fair view in conformity with the accounting
principles generally accepted in India:
(a) in the case of the Consolidated Balance Sheet, of the
state of affairs of the Group as at 31st March, 2012;
(b) in the case of the Consolidated Statement of Profit and
Loss, of the profit of the Group for the year ended on
that date; and
(c) in the case of the Consolidated Cash Flow Statement, of
the cash flows of the Group for the year ended on that
date.

152
Consolidated Balance Sheet as at 31st March, 2012
(` in Lakh)
Note As at 31st March, 2012 As at 31st March, 2011
EQUITY AND LIABILITIESShareholdersʼ FundsShare Capital 2 50,324 50,324 Reserves and Surplus 3 267,543 256,482
317,867 306,806 Minority Interests 9,128 7,379 Non-Current LiabilitiesLong-Term Borrowings 4 572,758 423,601 Deferred Tax Liabilities (Net) 14,053 10,150 Other Long-Term Liabilities 5 7,141 4,397 Long-Term Provisions 6 12,391 9,423
606,343 447,571 Current LiabilitiesShort-Term Borrowings 7 821,218 407,149 Trade Payables 8 43,849 29,173 Other Current Liabilities- Current Maturities of Long-Term Borrowings 4 197,609 168,634 - Others 9 21,037 17,185 Short-Term Provisions 10 3,326 7,840
1,087,039 629,981 2,020,377 1,391,737
ASSETS Non-Current AssetsFixed Assets 11- Tangible Assets 186,911 144,587 - Intangible Assets 1,594 1,591 - Capital work in Progress 19,021 7,762 Goodwill 43,988 42,534 Deferred Tax Assets (Net) 3,183 3,583 Non-Current Investments 12.1 210,051 203,144 Long-Term Loans and Advances- Financial Assets 13 307,896 246,231 - Loan Assets 14 223,457 168,655 - Other Long-Term Advances 15 9,984 22,803 Other Non-Current Assets 16 46,474 25,726
1,052,559 866,616 Current AssetsInventories 1,318 1,692 Current Investments 12.2 2,200 -Trade Receivables 17 34,691 23,361Cash and Bank Balances 18 40,877 16,898 Short-Term Loans and Advances- Financial Assets 13 40,544 46,565 - Loan Assets 14 44,463 53,714 - Other Advances 19 28,939 8,894 Other Current Assets- Current Maturities of Long-Term Financial Assets 13 158,807 136,398 - Current Maturities of Long-Term Loan Assets 14 584,748 232,056 - Other Current Assets 20 31,231 5,543
967,818 525,121 2,020,377 1,391,737
Significant Accounting Policies and Notes to Consolidated Financial Statements 1 to 35
The Notes referred to above form an integral part of the Balance Sheet
This is the Balance Sheet referred to in our report of even date.
For Haribhakti & Co. On behalf of the Board of Directors
Chartered Accountants(Firm's Registration No. 103523W)
Anand Kumar Jhunjhunwala Hemant Kanoria Salil K. GuptaPartner Chairman & Managing Director Chief Mentor & DirectorMembership No. 056613
Sandeep LakhotiaPlace : Kolkata Company SecretaryDate : 14th May, 2012
10 Lakh is equal to 1 Million

153
Annual Report 2011-12
Consolidated Statement of Profit and Loss for the year ended 31st March, 2012
For Haribhakti & Co. On behalf of the Board of Directors
Chartered Accountants(Firm's Registration No. 103523W)
Anand Kumar Jhunjhunwala Hemant Kanoria Salil K. GuptaPartner Chairman & Managing Director Chief Mentor & DirectorMembership No. 056613
Sandeep LakhotiaPlace : Kolkata Company SecretaryDate : 14th May, 2012
10 Lakh is equal to 1 Million
(` in Lakh)
NoteYear ended Year ended
31st March, 2012 31st March, 2011
INCOMERevenue from Operations 21 243,390 163,167 Other Income 22 1,243 642 Total 244,633 163,809 EXPENSESFinance Cost 23 156,503 83,008 Employee Benefit Expenses 24 17,180 12,344 Administrative and Other Expenses 25 22,318 19,311 Depreciation / Amortisation and Impairment Expense 11 16,503 12,409 Total 212,504 127,072 Profit before Bad Debts, Provisions & Tax 32,129 36,737 Bad Debts / Advances written off (net of recovery) 5,121 3,507 Provision for Bad & Doubtful Debts 367 485 Provision for Non-Performing Assets 1,795 1,612 Contingent Provisions against Standard Assets 1,169 2,236
8,452 7,840 Profit Before Tax 23,677 28,897 Tax Expense :- Current Tax 5,466 8,267 - MAT Credit Entitlement (189) (94)- Deferred Tax 3,674 (203)Total Tax for current year 8,951 7,970 Profit After Tax for current year 14,726 20,927 Income tax in respect of earlier years 2,411 1,309 Profit After Tax Before Minority Interests 12,315 19,618 Minority Interests 1,134 1,694 Net Profit 11,181 17,924 Pre Acquisition Profit / (Loss) - 474 Minority Interest of Pre Acquisition Profit / (Loss) (39) (474)Profit After Tax After Adjustment Of Minority Interests 11,142 17,924 Earnings per Equity Share (Basic and Diluted) (in `) 26 2.22 7.74(Par Value ` 10/- per Equity Share)
Significant Accounting Policies and Notes to Consolidated Financial Statements 1 to 35
The Notes referred to above form an integral part of the Statement of Profit and Loss
This is the Statement of Profit and Loss referred to in our report of even date.

154
Consolidated Cash Flow Statement for the year ended 31st March, 2012(` in Lakh)
31st March, 2012 31st March, 2011
A. Cash Flows from Operating ActivitiesNet Profit Before Tax 23,677 28,897 Adjustment for:Depreciation / Amortisation and Impairment 16,503 12,409 Bad Debts / Advances written off (net of recovery) 5,121 3,507 Provision for Bad & doubtful debts 367 485 Contingent Provision against Standard Assets 1,169 2,236 Provision for Non-Performing Assets 1,795 1,612 Provision for Premium on Unsecured Subordinated Bonds 88 88 Loss on sale of Fixed Assets (net) 556 943 Finance Cost 156,503 82,920 Income from Trade Investments - (70)Miscellaneous Expenditure written off 43 228 Liabilities No Longer Required written back 229 (113)Investment written off 12 - Fixed Assets written off 3 - Dividend Income (48) (46)Provision for Diminution in value of Stock for Trade 16 90 Provision for Diminution in value of Investments - 45 Operating Profit before Working Capital Changes 206,034 133,231 Adjustments for:(Increase) / Decrease in Receivables / Others (463,900) (116,925)(Increase) / Decrease in Stock for Trade 374 (583)(Increase) / Decrease in Financial & Loan Assets (61,666) (106,058)(Increase) / Decrease in Fixed Deposit (Deposit with original maturity period of more than three months) (26,860) (4,722)(Decrease) / Increase in Trade Payables 16,374 (4,866)Cash Generated from Operations (329,644) (99,923)Interest Paid (151,490) (80,515)Direct Taxes Paid (14,357) (5,809)Net Cash (Used in) / Generated from Operating Activities (495,491) (186,247)
B. Cash Flows from Investing ActivitiesPurchase of Fixed Assets (71,671) (56,989)Proceeds from Sale of Fixed Assets 1,023 948 (Increase) / Decrease in Investments (net) (8,421) (14,242)Income from Trade Investments - 70 Dividend Received 48 46 Net Cash (Used) / Generated in Investing Activities (79,021) (70,167)
C. Cash Flows from Financing ActivitiesIncrease / (Decrease) in Debentures (net) 125,335 2,960 Increase / (Decrease) in Working Capital facilities (net) 340,692 212,612 Increase / (Decrease) in Other Loans (net) 126,612 37,902 Dividend Paid (3,745) (1,393)Dividend Tax Paid (613) (232)Net Cash (Used) / Generated in Financing Activities 588,281 251,849 Net Increase / (Decrease) in Cash & Cash Equivalents 13,769 (4,565)Cash & Cash Equivalents at the beginning of the year 10,647 12,701 Add: Cash & Cash Equivalents acquired on Amalgamation - 2,511 Cash & Cash Equivalents at the end of the year 24,416 10,647
Explanations: -1. The above Cash Flow Statement has been prepared under the Indirect Method as set out in the Accounting Standard 3 (AS 3)
'Cash Flow Statements' notified by the Central Government under Companies (Accounting Standards) Rules, 20062. Previous year's figures have been regrouped / reclassified wherever necessary to conform to the current year's classification.
This is the Cash Flow Statement referred to in our report of even date.
10 Lakh is equal to 1 Million
For Haribhakti & Co. On behalf of the Board of Directors
Chartered Accountants(Firm's Registration No. 103523W)
Anand Kumar Jhunjhunwala Hemant Kanoria Salil K. GuptaPartner Chairman & Managing Director Chief Mentor & DirectorMembership No. 056613
Sandeep LakhotiaPlace : Kolkata Company SecretaryDate : 14th May, 2012
155
Annual Report 2011-12
Srei Infrastructure Finance Limited
SIGNIFICANT ACCOUNTING POLICIES AND NOTES TO THE CONSOLIDATED FINANCIAL STATEMENTS
1 Significant Accounting Policies
1.1 Basis of Preparation
The consolidated financial statements have been prepared in conformity with Generally Accepted Accounting Principles in
India, to comply in all material respects with the notified Accounting Standards (‘AS’) under the Companies Accounting Standard
Rules, 2006, the relevant provisions of the Companies Act, 1956 (‘the Act’) and the guidelines issued by the Reserve Bank of
India (‘RBI’) as applicable to a Non Banking Finance Company (‘NBFC’). The consolidated financial statements have been
prepared under the historical cost convention, on accrual basis. The accounting policies applied by the Company are consistent
with those applied in the previous year except as otherwise stated elsewhere.
Presentation and disclosure in Consolidated Financial Statements
During the year ended 31st March, 2012, the revised Schedule VI notified under the Companies Act, 1956 has become
applicable to the Company for preparation and presentation of its financial statements. Except accounting for dividend on
investment in subsidiary, the adoption of new Schedule VI does not impact recognition and measurement principles followed
for preparation of financial statements. However, it has significant impact on presentation and disclosures made in the financial
statements. The Company has also reclassified the previous year figures in accordance with the requirements applicable in the
current year.
Operating Cycle
As per the revised Schedule VI, "An operating cycle is the time between the acquisition of assets for processing and their
realisation in cash or cash equivalents".
For the company, there is generally no clearly identifiable normal operating cycle and hence the normal operating cycle for the
company is assumed to have a duration of 12 months.
Current and Non-Current Asset
An asset is classified as ‘current’ when it satisfies any of the following criteria:
- it is expected to be realised in, or is intended for sale or consumption in, the Company’s normal operating cycle; or
- it is held primarily for the purpose of being traded; or
- it is expected to be realised within twelve months after the reporting date; or
- it is cash or cash equivalent unless it is restricted from being exchanged or used to settle a liability for at least twelve
months after the reporting date.
All other assets are classified as ‘non-current’.
Current and Non-Current Liability
A liability is classified as ‘current’ when it satisfies any of the following criteria:
- it is expected to be settled in the Company’s normal operating cycles; or
- it is held primarily for the purpose of being traded; or
- it is due to be settled within twelve months after the reporting date; or
- the company does not have an unconditional right to defer settlement of the liability for at least twelve months after the
reporting date.
All other liabilities are classified as ‘non-current’.
1.2 Use of estimates
The preparation of consolidated financial statements requires the management to make estimates and assumptions which are
considered to arrive at the reported amounts of assets and liabilities and disclosure of contingent liabilities as on the date of
the financial statements and the reported income and expenses during the reporting year. Although these estimates are based
upon the management’s best knowledge of current events and actions, actual results could differ from these estimates. Any

revision to the accounting estimates are recognised prospectively in the current and future years.
1.3 Principles of Consolidation
Srei Infrastructure Finance Limited (the Holding Company) and its subsidiaries (including their subsidiaries, associate and joint
ventures), trusts and Joint Venture (including its subsidiary) are collectively referred to as ‘the Group’. The consolidated financial
statements of the Group have been prepared in accordance with Accounting Standard 21 (AS-21) “Consolidated Financial
Statements”, Accounting Standard 23 (AS-23) “Accounting for Investments in Associates in Consolidated Financial Statements”
and Accounting Standard 27 (AS-27) “Financial Reporting of Interests in Joint Ventures” notified by the Central Government
under the Companies (Accounting Standards) Rules, 2006. The consolidated financial statements have been prepared on the
following basis:
a) The financial statements of the Holding Company and its subsidiary companies have been combined on line by line
basis by adding together the book value of like items of Assets, Liabilities, Income and Expenses after eliminating intra-
group balances and intra-group transactions resulting in unrealised profits or losses.
b) In case of investments in subsidiaries, where the shareholding is less than 100%, minority interest in the net assets of
consolidated subsidiaries consist of:
i) The amount of equity attributable to minorities at the date on which Investment in the subsidiary is made.
ii) The minorities’ share of movements in equity since the date the holding subsidiary relationship came into existence.
c) Foreign subsidiaries representing non integral foreign operations are translated for the purpose of consolidation, as
follows (in accordance with AS – 11):
i) The assets and liabilities, both monetary and non-monetary, are translated at closing rate.
ii) Income and expense items are translated at average rate for the period.
iii) All resulting exchange differences are accumulated in foreign currency translation reserve until disposal of the net
investment.
d) Uniform accounting policies for like transactions and other events in similar circumstances have been adopted and
presented, to the extent possible, in the same manner as the Holding Company’s separate financial statements.
e) The excess of cost of the Holding Company of its investment in the subsidiary over the Holding Company’s portion of
equity of the subsidiary as at the date of investment is recognised in the consolidated financial statements as Goodwill.
It is tested for impairment on a periodic basis and written-off if found impaired.
f) The excess of Holding Company’s portion of equity of the Subsidiary, over cost as at the date of investment, is treated
as Capital Reserve.
g) Investment in associate is accounted using the equity method and disclosed separately in the Consolidated Balance
Sheet.
h) Interests in Joint Ventures have been accounted by using the proportionate consolidation method as per Accounting
Standard 27 – “Financial Reporting of Interests in Joint Ventures” notified by the Central Government under the Companies
(Accounting Standards) Rules, 2006.
1.4 Fixed Assets, Depreciation / Amortisation and Impairment
i) Fixed Assets
Fixed Assets are carried at cost less accumulated depreciation / amortisation and impairment losses, if any. Cost comprises
of the purchase price and any directly attributable cost of bringing the asset to its working condition for its intended use.
Borrowing costs relating to acquisition of fixed assets, which take substantial period of time to get ready for their intended use,
are also capitalised to the extent they relate to the period till such assets are ready to put to use.
Intangible Assets expected to provide future enduring economic benefits are carried at cost less accumulated amortisation and
impairment losses, if any. Cost comprises of purchase price and directly attributable expenditure on making the asset ready
for its intended use.
ii) Depreciation / Amortisation
Depreciation / Amortisation is provided on Straight Line Method (‘SLM’), which reflects the management’s estimate of the useful
lives of the respective fixed assets and the rates derived from such useful lives thereof are greater than or equal to the
156
SIGNIFICANT ACCOUNTING POLICIES AND NOTES TO THE CONSOLIDATED FINANCIAL STATEMENTS (Contd.)

157
Annual Report 2011-12
Fixed Assets costing up to ` 5,000/- are depreciated fully over a period of 12 months from the date of purchase.
Depreciation / Amortisation on assets purchased / sold during the reporting period is recognised on pro-rata basis
Lease-hold assets including improvements are amortised over the period of the lease or the estimated useful life of the asset,
whichever is lower.
iii) Impairment of Fixed Assets
The carrying amount of assets is reviewed at each balance sheet date to determine if there is any indication of impairment, based
on internal / external factors. An impairment loss is recognised wherever the carrying amount of an asset exceeds its recoverable
amount.
After impairment, depreciation is provided on the revised carrying amount of the asset over its remaining useful life.
A previously recognised impairment loss is increased or reversed depending on changes in circumstances. However, the
carrying value after reversal is not increased beyond the carrying value that would have prevailed by charging usual
depreciation, if there was no impairment.
1.5 Capital Work in Progress / Advance for Operating Lease
Capital work in progress / advance for operating lease is stated at cost and includes development and other expenses, including
interest during construction period.
1.6 Borrowing Costs
Borrowing costs relating to the acquisition / construction of qualifying assets are capitalised until the time all substantial activities
necessary to prepare the qualifying assets for their intended use are complete. A qualifying asset is one that necessarily takes
substantial period of time to get ready for its intended use.
The ancillary costs incurred in connection with the arrangement of borrowings are amortised over the life of underlying
borrowings. Premium payable on redemption of bonds is amortised over the tenure of the bonds. These form part of the
borrowing costs.
Borrowing costs also include exchange differences arising from Foreign currency borrowings, to the extent they are regarded
as an adjustment to the borrowing costs.
All other costs related to borrowings are recognised as expense in the period in which they are incurred.
1.7 Operating Leases
Assets given on operating leases are included in fixed assets. Initial direct costs incurred before the asset is ready to be put to
use, are included in the cost of the asset and those incurred afterwards, are recognised in the Statement of Profit and Loss as
they are incurred.
corresponding rates prescribed in Schedule XIV of the Act. The details of estimated useful life for each category of assets are
as under:
Asset category Estimated Useful Life
I Assets for Own Use
i) Buildings 45 - 61 years
ii) Furniture & Fixture 5 - 16 years
iii) Motor Vehicles 11 years
iv) Computers 4 - 6 years
v) General Plant & Machinery 9 - 24 years
vi) Equipments 6 - 25 years
vii) Intangible Assets 3 - 6 years
II Assets for Operating Lease
viii) Aircrafts 9 - 18 years
ix) Earthmoving Equipment 3 - 9 years
x) Motor Vehicles 3 - 6 years
xi) Plant & Machinery 10 - 30 years
xii) Computers 3 - 6 years
xiii) Furniture & Fixture 3 - 16 years
SIGNIFICANT ACCOUNTING POLICIES AND NOTES TO THE CONSOLIDATED FINANCIAL STATEMENTS (Contd.)
158
1.8 Investments
Investments that are intended to be held for not more than a year are classified as current investments. All other investmentsare classified as non-current investments. Current investments are carried at lower of cost and market price determined category-wise. All non-current investments including investments in Subsidiary Companies, are carried at cost. However, provision fordiminution in value, other than temporary in nature, is made to recognise a decline, on an individual basis. The cost ofInvestments acquired on amalgamations is determined as per the terms of the scheme of amalgamation.
Cost is arrived at on weighted average method for the purpose of valuation of investment.
1.9 Stock for Trade
Stock for trade is carried at lower of cost and market price, determined category-wise.
1.10 Financial Assets
Financial Assets include assets under Loan / Hypothecation facility. These are shown net of assets securitised
Financial Assets are valued at net investment amount including instalments fallen due and are net of unmatured / unearnedfinance charges etc. and assets acquired in satisfaction of debt.
1.11 Loan Assets
Loan Assets include loans advanced by the Company, secured by collateral offered by the customers, if applicable. These areshown net of assets securitised.
Loan assets are carried at net investment amount including instalments fallen due and are net of unmatured / unearned financecharges, amounts received, assets not paid for, etc.
1.12 Provisioning / Write-off of assets
The Company makes provision for Standard and Non-Performing Assets as per the Non-Banking Financial (Non-DepositAccepting or Holding) Companies Prudential Norms (Reserve Bank) Directions, 2007, as amended from time to time. TheCompany also makes additional provision towards loan assets, to the extent considered necessary, based on the management’sbest estimate. Provision for doubtful debtors towards fee based income is also made on similar basis.
Loan assets overdue for more than four years, as well as those, which, as per the management are not likely to be recovered,are considered as bad debts and written off.
In the financial statements of a foreign sub-subsidiary, provision for doubtful debtors has been determined based on specificcustomer identification, customer payment trends, subsequent receipts and settlements and analysis of expected future cashflows.
1.13 Foreign Currency Transactions
The reporting currency of the Company is the Indian Rupee (`).
i) Initial Recognition
Foreign currency transactions are recorded in the reporting currency by applying to the foreign currency amount the prevailingexchange rate between the reporting currency and the foreign currency, as on the date of the transaction.
ii) Conversion
Year end foreign currency monetary items are reported using the year end rate. Non-monetary items which are carried in termsof historical cost denominated in a foreign currency are reported using the exchange rate at the date of the transaction. Non-monetary items which are carried at fair value or other similar valuation denominated in a foreign currency are reported usingthe exchange rates prevailing at the date when the values were determined.
iii) Exchange Differences
Exchange differences arising on the settlement or reporting of monetary items, at rates different from those at which they wereinitially recorded during the year or reported in previous consolidated financial statements and / or on conversion of monetaryitems, are recognised as income or expense in the year in which they arise. Exchange differences arising out of foreign currencyborrowings are considered as an adjustment to interest cost and recognised in accordance to para 1.6 above.
iv) Forward Exchange Contracts (not intended for trading or speculation purpose)
The premium or discount arising at the inception of forward exchange contracts is amortised as expense or income over thelife of the respective contracts. Exchange differences on such contracts are recognised in the Statement of Profit and Loss inthe year in which the exchange rates change. Any profit or loss arising on cancellation or renewal of forward exchange contractis recognised as income or expense in the year in which it is cancelled or renewed.
SIGNIFICANT ACCOUNTING POLICIES AND NOTES TO THE CONSOLIDATED FINANCIAL STATEMENTS (Contd.)
159
Annual Report 2011-12
v) Derivatives and Hedges
In terms of the announcement made by The Institute of Chartered Accountants of India, the accounting for derivative contracts(other than those covered under AS-11) is done based on the “marked to market” principle, on a portfolio basis and the net loss,after considering the offsetting effect on the underlying hedged item, is charged to the Statement of Profit and Loss. Net gainsare ignored as a matter of prudence.
1.14 Revenue Recognition
Revenue is recognised to the extent it is probable that the economic benefits will flow to the Company and the revenue can bereliably measured.
i) Income from Financial Assets, Loans and Leases:
Income from Financial assets, Loans and Leases are recognised in the Statement of Profit and Loss on accrual basis as statedherein below, except in the case of non-performing assets where it is recognised, upon realisation, as per the Prudential Norms/ Directions of RBI, applicable to NBFCs.
a) Interest income from financial and loan assets is recognised based on the internal rate of return, to provide a constantperiodic rate of return on the net investment outstanding over the period of the contract, or as per the terms of the contract.
b) Income from operating lease is recognised on straight line basis over the lease term or other systematic basis which ismore representative of the time pattern of the users benefit.
c) Fees on processing of loans are recognised when a binding obligation for granting loan has been entered into.
d) Delayed payment interest / incremental in interest pursuant to upward revision in benchmark interest rate is accrued, dueto uncertainty of realisation, only to the extent of probable recovery, as per the best estimate of the management.
e) Gains arising on securitisation / assignment of assets, if any, are recognised over the tenure of agreements as per guidelineon securitisation of standard assets issued by RBI, while loss, if any is recognised upfront. These are considered asincome from financial / loan assets under the head 'Revenue from Operations'.
ii) Income from IT Infrastructure and CSC Services
Income from IT Infrastructure is recognised on despatch of goods to customers, when all significant risks and rewards ofownership are transferred to the buyer as per the terms of sale and is accounted for as net of returns. Income, as disclosed, isexclusive of value added tax.
Receipts on account of CSC Services are accounted for in accordance with the terms of the relevant underlying agreementswith the Village Level Entrepreneurs (VLE) and service providers.
iii) Government Support
Government support is recognised on the basis of claims raised arising out of reasonable assurance that the Company willcomply with the conditions attached with them and there is reasonable certainty of collection of the grants.
iv) Income from Equipment Rental
Revenue is recognised in accordance with Accounting Standard (AS-9) “Revenue Recognition” on the basis of rendering ofservices to customers on a proportionate time basis, in accordance with the respective Contracts / Agreements.
v) Fee Based Income
Fees for advisory services are accounted based on the stage of completion of assignments, when there is reasonable certaintyof its ultimate realisation / collection.
Other fee based income is accounted for on accrual basis.
vi) Other Operating Income
a) Income from Dividend of shares of corporate bodies is accounted when the Company's right to receive the dividend isestablished.
b) Income from investment in units of Funds is recognised on cash basis as per the Prudential Norms of RBI.
c) Interest income on fixed deposits / margin money is recognised on time proportion basis taking into account theamount outstanding and the rate applicable.
d) Profit or Loss on sale of non-current and current investments are recognised when a binding obligation has beenentered into.
e) Claims lodged with the insurance companies are accounted for on accrual basis, to the extent these are measurable andultimate collection is reasonably certain.
f) All other operating income is accounted for on accrual basis.
SIGNIFICANT ACCOUNTING POLICIES AND NOTES TO THE CONSOLIDATED FINANCIAL STATEMENTS (Contd.)

160
1.15 Retirement and Other Employee Benefits
a) Retirement and employee benefits in the form of Provident Fund and Employee State Insurance are defined contribution
plans and the Company’s contributions, paid or payable during the reporting period, are charged to the Statement of
Profit and Loss.
b) Gratuity liability is a defined benefit plan and is provided for on the basis of actuarial valuation on projected unit credit
method at the Balance Sheet date.
c) Long-Term compensated absences are provided for based on actuarial valuation as per projected unit credit method at
the Balance Sheet date.
d) Actuarial gains / losses are charged to the Statement of Profit and Loss and are not deferred.
1.16 Taxes on Income
Tax expense comprises of current tax [(net of Minimum Alternate Tax (MAT) credit entitlement)] and deferred tax.
Current tax is the amount of tax payable on the taxable income for the year determined in accordance with the provisions of the
Income Tax Act, 1961.
Deferred tax reflects the impact of current year timing differences between taxable income and accounting income for the year
and reversal of timing differences of earlier years.
Deferred tax is measured based on the tax rates and the tax laws enacted or substantively enacted at the Balance Sheet date.
Deferred tax assets and deferred tax liabilities are offset, if a legally enforceable right exists to set off current tax assets against
current tax liabilities. The deferred tax assets and deferred tax liabilities relate to the taxes on income levied by the same
governing taxation laws. Deferred tax assets are recognised only to the extent that there is reasonable certainty that sufficient
future taxable income will be available against which such deferred tax assets can be realised. In situations where the company
has unabsorbed depreciation or carry forward tax losses, all deferred tax assets are recognised only if there is virtual certainty
supported by convincing evidence that they can be realised against future taxable profits.
At each Balance Sheet date, the Company re-assesses unrecognised deferred tax assets. It recognises unrecognised deferred
tax assets to the extent that it has become reasonably certain or virtually certain, as the case may be, that sufficient future
taxable income will be available against which such deferred tax assets can be realised.
MAT credit is recognised as an asset only when and to the extent there is convincing evidence that the company will pay normal
income tax during the specified period. In the year in which the MAT credit becomes eligible to be recognised as an asset in
accordance with the recommendations contained in guidance note issued by The Institute of Chartered Accountants of India,
the said asset is created by way of a credit to the Statement of Profit and Loss and shown as MAT Credit Entitlement. The
Company reviews the same at each Balance Sheet date and writes down the carrying amount of MAT Credit Entitlement to the
extent there is no longer convincing evidence to the effect that the Company will pay normal income tax during the specified
period.
1.17 Segment Reporting
Based on the risks and returns associated with business operations and in terms of Accounting Standard-17 (Segment
Reporting), the Group is predominantly engaged in ‘Financial Services’ and ‘Infrastructure Equipment Services’ as primary
reportable segments.
1.18 Provision, Contingent Liabilities and Contingent Assets
A provision is recognised when the company has a present obligation as a result of past event and it is probable that outflow
of resources will be required to settle the obligation, in respect of which a reliable estimate can be made. Provisions are not
discounted to their present value and are determined based on best estimate required to settle the obligation at the Balance
Sheet date. These are reviewed at each Balance Sheet date and adjusted to reflect the current best estimates. Contingent
Liabilities are not recognised but are disclosed in the notes to financial statements. Contingent Assets are neither recognised
nor disclosed in the consolidated financial statements.
1.19 Cash and Cash Equivalents
Cash and cash equivalents in the Cash Flow Statement comprises of cash on hand, cash at Bank, demand deposits with banks,
cheques on hand, remittances in transit and short-term highly liquid investments with an original maturity of three months or less.
1.20 Earnings Per Share (EPS)
Basic EPS is calculated by dividing the net profit or loss for the period attributable to equity shareholders by the weighted
average number of equity shares outstanding during the year.
SIGNIFICANT ACCOUNTING POLICIES AND NOTES TO THE CONSOLIDATED FINANCIAL STATEMENTS (Contd.)

161
Annual Report 2011-12
For the purpose of calculating diluted EPS, the net profit or loss for the period attributable to equity shareholders and the
weighted average number of shares outstanding during the period are adjusted for the effects of all dilutive potential Equity
Shares.
1.21 Assets under Management
Contracts securitised, assigned or co-branded are derecognised from the books of accounts. Contingent liabilities thereof, if
any, are disclosed separately in the notes to consolidated financial statements.
1.22 Prior Period and Extra Ordinary Items
Prior Period and Extra Ordinary items having material impact on the financial affairs of the Company are disclosed separately.
1.23 Inventories
Inventories are valued at the lower of cost and net realisable value.
Cost of inventory is determined using the ‘weighted average’ basis and includes all costs incurred in bringing the goods to
their present location and condition.
The Company provides for obsolete, slow-moving and damaged inventory based on management estimates of the usability of
such inventory.
1.24 Miscellaneous Expenditure
The expenses incurred on issue of Equity Shares, Global Depository Receipts (GDRs), Long-Term Bonds and Debentures are
amortised as follows:-
i) Expenses on issue of Equity Shares and GDRs are amortised over a period of ten years.
ii) Expenses on issue of Bonds and Debentures are amortised over the tenure of the respective Bonds and Debentures.
Preliminary expenses are written off in the year of incurrence.
2. SHARE CAPITAL
(` in Lakh)
Particulars 31st March, 2012 31st March, 2011
Authorised
Equity Shares, ` 10/- par value per share
710,000,000 (31st March, 2011: 710,000,000) Equity Shares 71,000 71,000
Preference Shares, ` 100/- par value per share
10,000,000 (31st March, 2011: 10,000,000) Preference Shares 10,000 10,000
81,000 81,000
Issued and Subscribed
Equity Shares, ` 10/- par value per share
503,559,160 (31st March, 2011: 503,559,160) Equity Shares 50,356 50,356
Fully Paid-up
Equity Shares, ` 10/- par value per share
503,086,3331 (31st March, 2011: 503,086,333) Equity Shares 50,309 50,309
Forfeited Shares (472,827 Equity Shares) 15 15
50,324 50,324
1 Includes 21,600 shares represented by 5,400 Global Depository Receipts (GDRs) issued vide Prospectus dated 18.04.2005.
Notes To Consolidated Financial Statements
10 Lakh is equal to 1 Million
SIGNIFICANT ACCOUNTING POLICIES AND NOTES TO THE CONSOLIDATED FINANCIAL STATEMENTS (Contd.)

162
3. RESERVES AND SURPLUS
(` in Lakh)
Particulars 31st March, 2012 31st March, 2011
Capital Reserves
Opening balance 2,104 1,979
Add: Addition during the year 36 125
Closing balance 2,140 2,104
Securities Premium Reserve
Opening balance 60,309 69,574
Add: Addition during the year 1,275 27
Less: Issuance of Bonus shares - (9,292)
Closing balance 61,584 60,309
Bond / Debt Redemption Reserve:
Opening balance 10,531 6,303
Add: Addition during the year 7,934 5,323
Less: Transfer to Surplus, on repayment of Bond / Debt (1,108) (1,095)
Closing balance 17,357 10,531
Special Reserve (Reserve Fund as per Section 45-IC of the
Reserve Bank of India Act, 1934)
Opening balance 16,461 12,463
Add: Addition during the year 3,139 3,998
Closing balance 19,600 16,461
General reserve
Opening balance 136,803 1,737
Add: Addition on account of Amalgamation - 137,870
Add: Addition during the year - 2
Add / (Less): Adjusted during the year 4 (2,806)
Closing balance 136,807 136,803
Foreign Currency Translation Reserve
Opening balance (65) (336)
Add: Addition during the year 1,195 271
Closing balance 1,130 (65)
Surplus
Opening balance 30,339 25,618
Add: Net profit after tax transferred from Statement of Profit and Loss 11,142 17,924
Less: Adjustment on account of Amalgamation - (570)
Amount available for appropriation 41,481 42,972
Appropriations:
Proposed dividend 2,515 3,778
Corporate dividend tax on proposed dividend 393 628
Bond / Debt Redemption Reserve (net) 6,826 4,228
Special Reserve 3,139 3,997
General Reserve - 2
Profit on sale of Investment in Subsidiaries (312) -
Profit on sale of Investment in Associate (5) -
Closing balance 28,925 30,339
Total Reserves and Surplus 267,543 256,482
10 Lakh is equal to 1 Million
SIGNIFICANT ACCOUNTING POLICIES AND NOTES TO THE CONSOLIDATED FINANCIAL STATEMENTS (Contd.)

163
Annual Report 2011-12
4. LONG-TERM BORROWINGS
(` in Lakh)
Particulars
31st March, 2012 31st March, 2011
Non- Current Total Non- Current Total
Current Maturities Current Maturities Maturities Maturities
A. Secured Bonds / Debentures:Long-Term Infrastructure Bonds (refer note 4.1) 2,489 - 2,489 - - -Foreign Guaranteed Local:Currency Bonds - - - - 188 188 Non-Convertible Debentures 93,597 31,269 124,866 41,751 12,165 53,916 Term Loans:From Banks - Rupee Loans 165,252 113,930 279,182 141,384 88,065 229,449 - Foreign Currency Loans 125,156 38,197 163,353 102,512 49,752 152,264
From Other Financial Institutions- Rupee Loans 3,307 1,152 4,459 4,443 1,873 6,316 - Foreign Currency Loans 64,509 7,693 72,202 63,518 5,335 68,853
Deposits:Public Deposits - - - 16 29 45 Other Loans:Buyer’s Credit from Banks - Foreign Currency Loans 2,203 3,320 5,523 4,512 48 4,560
(A) 456,513 195,561 652,074 358,136 157,455 515,591 B. UnsecuredBonds / Debentures:Non-Convertible Debentures - - - - 4,300 4,300 Subordinated Perpetual debentures (Tier I Capital) 1,875 - 1,875 - - - Subordinated bonds / debentures (Tier II Capital) 90,900 527 91,427 51,776 790 52,566 Zero Coupon Redeemable Convertible Bonds 2,252 - 2,252 1,795 - 1,795 0.1% Non-Convertible Cumulative Redeemable Preference Shares 73 - 73 73 - 73 Term Loans:From Banks:Rupee Loans- Subordinated loans from banks (Tier II Capital) 12,500 - 12,500 - - - - Other term loans from banks 2,750 1,000 3,750 6,250 251 6,501
Foreign Currency Loans- Other term loans from banks - - - 2,019 - 2,019
From Other Parties:Rupee Loans:- Other term loans from financial institution - - - - 5,000 5,000
Foreign Currency Loans:- Other term loans from financial institution 2,278 215 2,493 727 568 1,295
Loans Repayable on DemandOthers- Foreign Currency Loans 3,528 306 3,834 2,825 270 3,095
DepositsInter-Corporate Deposits 89 - 89 - - -
(B) 116,245 2,048 118,293 65,465 11,179 76,644
Total (A+B) 572,758 197,609 770,367 423,601 168,634 592,235
4.1 Long-Term Infrastructure Bonds – Secured, Redeemable, Non-convertible Debentures During the year, the Company has raised ` 2,489 lakh (Previous year: ` Nil) through public issue of Long-Term InfrastructureBonds in the nature of Secured, Redeemable Non-Convertible Debentures, eligible for deduction under section 80 CCF of theIncome-Tax Act, 1961. Fund raised has been utilised for the purposes of infrastructure lending as per the terms of the issue.
10 Lakh is equal to 1 Million
SIGNIFICANT ACCOUNTING POLICIES AND NOTES TO THE CONSOLIDATED FINANCIAL STATEMENTS (Contd.)

164
5. OTHER LONG-TERM LIABILITIES
(` in Lakh)
Particulars 31st March, 2012 31st March, 2011
Acceptances 486 1,547 Interest Accrued but not due on Borrowings 5 2 Capital Advances 9 75 Security Deposits & Retentions 6,485 2,468 Loss payable on Derivative Contracts 156 305 Total 7,141 4,397
(` in Lakh)
Particulars 31st March, 2012 31st March, 2011
Provision for Employee Benefits (Non-Current Portion)Gratuity 345 272 Unavailed leave 678 482
(A) 1,023 754 OthersProvision for Non-Performing Assets 7,964 6,413 Contingent Provision against Standard Assets 3,404 2,236 Provision for Premium on Unsecured Subordinated Bonds - 20
(B) 11,368 8,669 Total (A+B) 12,391 9,423
(` in Lakh)
Particulars 31st March, 2012 31st March, 2011
A. Secured Bond / Debentures:Non-convertible Debentures - 5,000 Term loans:From Banks- Rupee Loans 52,366 20,286 - Foreign Currency Loans 5,087 3,206
From Other Financial Institutions- Foreign Currency Loans - 2,545
Loans Repayable on Demand:Working Capital Facilities from banks - Rupee Loans 279,855 193,959
Cash Credit- Rupee Loans 315 196
DepositsPublic Deposits 16 1 Other LoansWorking Capital Facilities from banks 368,817 130,439 Buyer’s Credit from Banks - Foreign Currency Loan 13,137 2,361
(A) 719,593 357,993 B. UnsecuredBond / Debentures:Non-convertible Debentures - 4,450 Term Loans:From Banks- Foreign Currency Loans
- Other term loans from banks - 28 Deposits:Inter Corporate Deposits from Others 15,068 6,394 Other Loans:Rupee Loan from Banks 15,000 12,500 Commercial Papers 71,557 25,784
(B) 101,625 49,156 Total (A+B) 821,218 407,149
10 Lakh is equal to 1 Million
6. LONG-TERM PROVISIONS
7. SHORT-TERM BORROWINGS
SIGNIFICANT ACCOUNTING POLICIES AND NOTES TO THE CONSOLIDATED FINANCIAL STATEMENTS (Contd.)

165
Annual Report 2011-12
Trade PayablesFor Services 33,084 23,319 Acceptances 9,681 5,479 OthersOperating Lease 74 161 Employees 1,010 214 Total 43,849 29,173
(` in Lakh)
Particulars 31st March, 2012 31st March, 2011
Interest Accrued but not due on Borrowings 11,310 6,268 For Capital Goods 2,093 - Advance from Customers 1,035 1,732 Statutory Liabilities 1,487 3,057 Security Deposits & Retentions 734 1,682 Payable to Employees 226 161 Forward Contract Payable 483 95 Commission Payable to Directors 208 175 Unclaimed Dividend 39 37 Unclaimed Matured Public Deposits and Interest Accrued thereon 38 50 Liability for Operating Expenses 3,028 3,574 Bank Overdraft 25 58 Advance from parties 312 - Interest Swap 19 130 Loss payable on Derivative Contracts - 166 Total 21,037 17,185
(` in Lakh)
Particulars 31st March, 2012 31st March, 2011t
Provision for Employee Benefits (Current Portion)Unavailed leave 116 126 Gratuity 51 78
(A) 167 204 OthersProposed Dividend 2,515 3,778 Provision for Corporate Dividend Tax 408 628 Provision towards Customer Claims - 308 Provision for Doubtful Vendor Advances 128 7 Provision for Premium on Unsecured Subordinated Bonds 108 158 Provision for Taxation (net of Advance tax / Tax deducted at source) - 2,757
(B) 3,159 7,636 Total 3,326 7,840
(` in Lakh)
Particulars 31st March, 2012 31st March, 2011
10 Lakh is equal to 1 Million
8. TRADE PAYABLES
9. OTHER CURRENT LIABILITIES - OTHERS
10. SHORT-TERM PROVISIONS
SIGNIFICANT ACCOUNTING POLICIES AND NOTES TO THE CONSOLIDATED FINANCIAL STATEMENTS (Contd.)

166
11. F
IXE
D A
SS
ET
S
(`in
Lak
h)
Gro
ss B
lock
/ O
rigin
al C
ost
Dep
reci
atio
n / A
mor
tisat
ion
and
Impa
irmen
tN
et C
arry
ing
Val
ue
Par
ticul
ars
As
at
Add
ition
s /
Dis
posa
ls /
As
atA
s at
Im
pairm
ent
Dis
posa
ls /
As
at
As
at
As
at
Apr
il 01
, ad
just
men
tsad
just
men
ts
Mar
ch 3
1,
Apr
il 01
,F
or th
e ye
ardu
ring
the
adju
stm
ents
Mar
ch 3
1,M
arch
31
Mar
ch 3
1,
2011
durin
g du
ring
2012
2011
perio
ddu
ring
2012
2012
2011
the
year
the
year
the
year
I. Ta
ngib
le a
sset
s:A
sset
s fo
r O
wn
use
Land
- Fr
eeho
ld2,
490
-
321
2,16
9 -
-
-
-
-
2,
169
2,49
0 La
nd -
Lea
seho
ld14
7 -
-
14
7 1
-
-
-
1 14
6 14
6 B
uild
ing
s14
,689
17
5 -
14
,864
27
4 27
2 -
-
54
6 14
,318
14
,415
Le
aseh
old
Imp
rove
men
ts
1,30
9 96
2 -
2,
271
90
141
-
-
231
2,04
0 1,
219
Furn
iture
and
Fix
ture
s2,
269
636
40
2,86
5 46
5 23
0 -
27
66
8 2,
197
1,80
4 M
otor
Veh
icle
s18
5 65
2 9
828
56
53
-
1 10
8 72
0 12
9 M
achi
nery
12,6
45
503
-
13,1
48
4,34
0 32
1 -
-
4,
661
8,48
7 8,
305
Eq
uip
men
t 80
,352
9,
061
2,95
7 86
,456
14
,527
6,
024
-
1,81
0 18
,741
67
,715
65
,825
C
omp
uter
1,
576
220
-
1,79
6 54
9 32
5 -
2
872
924
1,02
7 O
ffice
Eq
uip
men
t1,
206
314
18
1,50
2 26
0 14
2 -
8
394
1,10
8 94
6 (A
)11
6,86
8 12
,523
3,
345
126,
046
20,5
62
7,50
8 -
1,
848
26,2
22
99,8
24
96,3
06
Ass
ets
give
n on
Ope
ratin
g Le
ase
Airc
rafts
2,39
0 -
-
2,
390
759
249
-
-
1,00
8 1,
382
1,63
1 E
arth
mov
ing
Eq
uip
men
ts4,
326
8,11
5 41
12
,400
1,
462
1,04
5 59
6 26
3,
077
9,32
3 2,
864
Mot
or V
ehic
les
10,3
62
13,0
79
6 23
,435
4,
892
2,46
2 46
2 6
7,81
0 15
,625
5,
470
Pla
nt &
Mac
hine
ry37
,812
20
,993
-
58
,805
4,
636
1,93
4 40
2 -
6,
972
51,8
33
33,1
76
Com
put
ers
4,84
8 4,
662
91
9,41
9 59
3 1,
130
15
24
1,71
4 7,
705
4,25
5 Fu
rnitu
re a
nd F
ixtu
res
1,03
4 45
2 -
1,
486
149
112
6 -
26
7 1,
219
885
(B)
60,7
72
47,3
01
138
107,
935
12,4
91
6,93
2 1,
481
56
20,8
48
87,0
87
48,2
81
Tota
l (I)
= (
A+
B)
177,
640
59,8
24
3,48
3 23
3,98
1 33
,053
14
,440
1,
481
1,90
4 47
,070
18
6,91
1 14
4,58
7
II. In
tang
ible
ass
ets:
Ass
ets
for
Ow
n us
eC
omp
uter
Sof
twar
es1,
352
380
-
1,73
2 50
2 35
7 -
-
85
9 87
3 85
0 Te
nanc
y R
ight
s4
-
-
4 3
1 -
-
4
-
1 (C
)1,
356
380
-
1,73
6 50
5 35
8 -
-
86
3 87
3 85
1
Ass
ets
give
n on
Ope
ratin
g le
ase
Sof
twar
es96
6 20
5 -
1,
171
226
224
-
-
450
721
740
(D)
966
205
-
1,17
1 22
6 22
4 -
-
45
0 72
1 74
0
Tota
l (II)
= (
C+
D)
2,32
2 58
5 -
2,
907
731
582
-
-
1,31
3 1,
594
1,59
1
Tota
l Fix
ed A
sset
s To
tal =
(I +
II)
179,
962
60,4
09
3,48
3 23
6,88
8 33
,784
15
,022
1,
481
1,90
4 48
,383
18
8,50
5 14
6,17
8 P
revi
ous
year
83,0
97
100,
171
3,30
6 17
9,96
2 22
,790
12
,409
-
1,
415
33,7
84
146,
178
III. C
apita
l wor
k in
Pro
gres
s7,
762
11,2
59
-
19,0
21
-
-
-
-
-
19,0
21
7,76
2
10 L
akh
is e
qual
to 1
Mill
ion
SIGNIFICANT ACCOUNTING POLICIES AND NOTES TO THE CONSOLIDATED FINANCIAL STATEMENTS (Contd.)

167
Annual Report 2011-12
12.1 NON-CURRENT INVESTMENTS
(` in Lakh)
Particulars 31st March, 2012 31st March, 2011
In Government Guaranteed Securities, Bonds & Units 104 105 In Other Securities 209,947 203,039 Total 210,051 203,144
12.2 CURRENT INVESTMENTS(` in Lakh)
In Bonds and Debentures (Unquoted) 2,200 - Total 2,200 -
Particulars 31st March, 2012 31st March, 2011
(` in Lakh)
Particulars
31st March, 2012 31st March, 2011
Long-Term Long-Term
Non- Current Short-Term Non- Current Short-Term
Current Maturities Current Maturities
Maturities Maturities
Secured, Considered Good 307,896 158,807 40,544 246,231 136,398 46,565
Total 307,896 158,807 40,544 246,231 136,398 46,565
(` in Lakh)
Particulars
31st March, 2012 31st March, 2011
Long-Term Long-Term
Non- Current Short-Term Non- Current Short-Term
Current Maturities Current Maturities
Maturities Maturities
Secured, Considered Good 222,288 583,498 43,449 167,679 231,330 50,134
(A) 222,288 583,498 43,449 167,679 231,330 50,134
Unsecured 1,169 1,250 1,014 976 726 3,580
(B) 1,169 1,250 1,014 976 726 3,580
Total (A+B) 223,457 584,748 44,463 168,655 232,056 53,714
(` in Lakh)
Particulars 31st March, 2012 31st March, 2011
Unsecured, Considered good:
Advances
- Capital Advances 7,029 7,179
- Advance to Vendors for Operating Expenses 39 1
- Employee Advance 59 102
- Advance against investments 23 24
Statutory Liabilities 10 185
Security Deposits - to Others 342 12,238
Share Application Money - 380
Contribution to Corpus of Trusts (Related Parties) 2 2
Prepaid Expenses 2,319 2,650
Other Advances 161 42
Total 9,984 22,803
10 Lakh is equal to 1 Million
13. FINANCIAL ASSETS
14. LOAN ASSETS
15. OTHER LONG-TERM ADVANCES
SIGNIFICANT ACCOUNTING POLICIES AND NOTES TO THE CONSOLIDATED FINANCIAL STATEMENTS (Contd.)

168
16. OTHER NON-CURRENT ASSETS(` in Lakh)
Particulars 31st March, 2012 31st March, 2011
Unsecured, Considered Good:Fixed Deposit Account with original maturity of more than twelve months 31,518 14,868 Unamortised Ancillary Borrowing Costs 5,911 4,164 Interest Accrued but not due 13 3,577 Income Accrued but not due 353 289 Miscellaneous Expenditure to the extent not written off or adjusted 56 98 Gains receivable on Derivative Contracts 8,623 2,730 Total 46,474 25,726
Sundry Debtors (Unsecured)Outstanding for more than Six Months- Considered Good 14,787 11,234 - Considered Doubtful 597 408 Less: Provision for Doubtful Debts (351) (403)
(A) 15,033 11,239 Other Debts- Considered Good 19,658 12,122
(B) 19,658 12,122 Total (A+B) 34,691 23,361
(` in Lakh)
Particulars 31st March, 2012 31st March, 2011
A. Cash and Cash Equivalents:Cash on Hand 134 96 Balances with Banks - in Current Account 16,142 8,188 Cheques on Hand 6,774 671 Fixed Deposits with banks (having original maturity of 3 months or less) 1,327 1,655 Unclaimed Dividend Account 39 37
(A) 24,416 10,647 B. Other Bank Balances : Fixed Deposits with banks (having original maturity of more than 3 months and less than 12 months) 4,652 5,767 Fixed Deposits with banks (having original maturity of more than 12 months) 11,809 484
(B) 16,461 6,251 Total (A+B) 40,877 16,898
(` in Lakh)
Particulars 31st March, 2012 31st March, 2011
(` in Lakh)
Particulars 31st March, 2012 31st March, 2011
Unsecured, Considered goodAdvances- Advance to Vendors for Operating Expenses 1,368 820 - Employee Advance 330 267 - Advance against Insurance 1 - Security Deposits - to Others 12,825 323 Share Application Money - 3 Others 7 -Gratuity Fund - 8 Prepaid Expenses 2,010 2,581 Balance with Revenue Authorities 11,542 2,233 MAT Credit Entitlement 309 2,618 Other Advances 547 41 Total 28,939 8,894 10 Lakh is equal to 1 Million
17. TRADE RECEIVABLES
18. CASH AND BANK BALANCES
19. OTHER SHORT-TERM ADVANCES
SIGNIFICANT ACCOUNTING POLICIES AND NOTES TO THE CONSOLIDATED FINANCIAL STATEMENTS (Contd.)

169
Annual Report 2011-12
20. OTHER CURRENT ASSETS
(` in Lakh)
Particulars 31st March, 2012 31st March, 2011
Unsecured, Considered Good
Unamortised Ancillary Borrowing Costs 2,259 1,731
Interest Accrued but not due 17,365 1,963
Income Accrued but not due 81 82
Stock for Trade 246 262
Gains receivable on Forward Exchange Contracts 7,745 -
Derivative Asset Forward 2,224 41
Other Receivables 1,269 1,421
Miscellaneous Expenditure to the extent not written off or adjusted 42 43
Total 31,231 5,543
(` in Lakh)
Particulars 2011 - 12 2010 - 11
Income from Loans / Financial Assets 181,141 112,505
Income from Leases 13,117 7,692
Income from IT Infrastructure and CSC Services 6,173 5,426
Fee Based Income 7,895 12,100
Income from Equipment Rental 29,456 23,215
Assignment Income 2,670 -
Income from Long-term Trade Investments - 28
Income from Stock for Trade 2 26
Profit on Sale of Long-term Trade Investments (net) - 70
Profit on Sale of Stock for Trade (net) - 995
Dividend Income 48 46
Interest received from Govt. Securities / Banks 2,888 1,064
Total 243,390 163,167
(` in Lakh)
Particulars 2011 - 12 2010 - 11
Liabilities No Longer Required Written Back 229 113
Other Non-Operating Income 1,014 529
Total 1,243 642
(` in Lakh)
Particulars 2011 - 12 2010 - 11
Interest Expense:
Interest on Bonds & Debentures 12,827 12,664
Interest on Term Loans 65,030 46,904
Interest on Public Deposits 3 23
Interest on Working Capital Facilities 47,563 14,463
Finance Charges on Commercial Papers 17,296 3,352
Other Interest 1,044 776
Other Borrowing Costs:
Other Finance Charges 6,172 6,091
Applicable net (gain) / loss on foreign currency
transactions and translations 6,480 (1,353)
Amortisation of Premium on Unsecured subordinated bonds 88 88
Total 156,503 83,008
10 Lakh is equal to 1 Million
21. REVENUE FROM OPERATIONS
22. OTHER INCOME
23. FINANCE COST
SIGNIFICANT ACCOUNTING POLICIES AND NOTES TO THE CONSOLIDATED FINANCIAL STATEMENTS (Contd.)
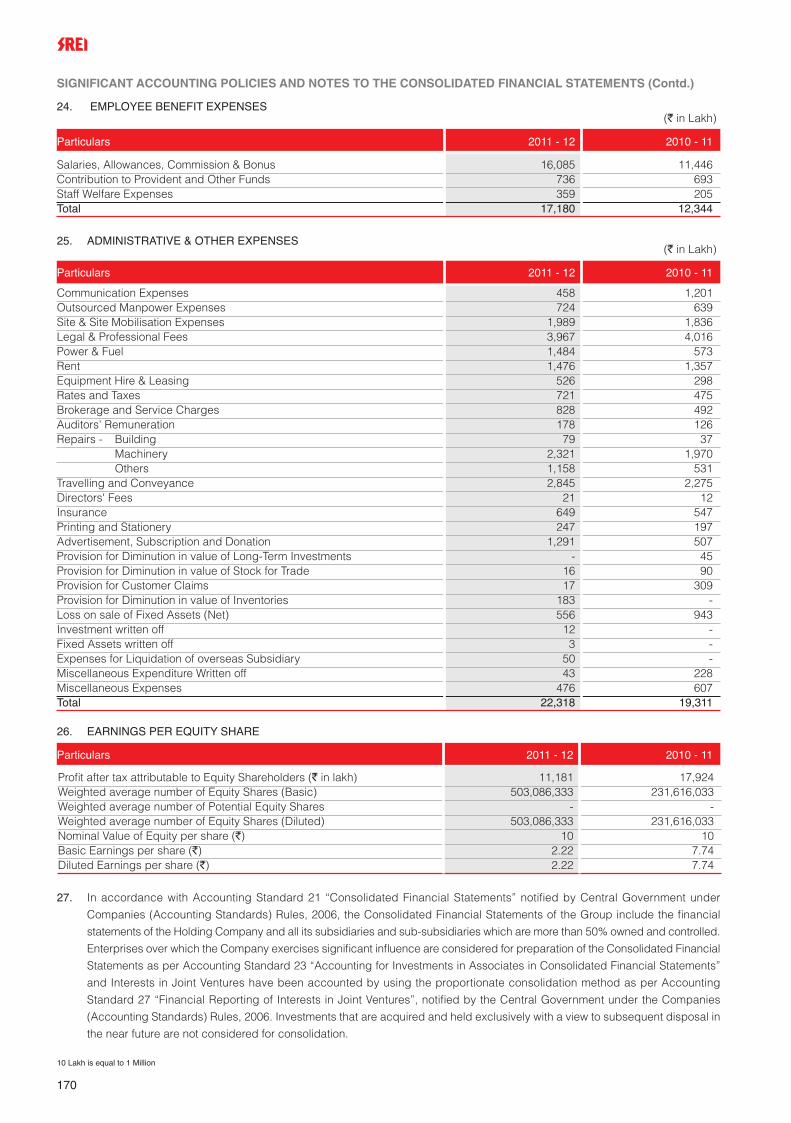
170
24. EMPLOYEE BENEFIT EXPENSES(` in Lakh)
Particulars 2011 - 12 2010 - 11
(` in Lakh)
Particulars 2011 - 12 2010 - 11
26. EARNINGS PER EQUITY SHARE
Particulars 2011 - 12 2010 - 11
Salaries, Allowances, Commission & Bonus 16,085 11,446 Contribution to Provident and Other Funds 736 693 Staff Welfare Expenses 359 205 Total 17,180 12,344
Profit after tax attributable to Equity Shareholders (` in lakh) 11,181 17,924 Weighted average number of Equity Shares (Basic) 503,086,333 231,616,033 Weighted average number of Potential Equity Shares - - Weighted average number of Equity Shares (Diluted) 503,086,333 231,616,033 Nominal Value of Equity per share (`) 10 10Basic Earnings per share (`) 2.22 7.74 Diluted Earnings per share (`) 2.22 7.74
27. In accordance with Accounting Standard 21 “Consolidated Financial Statements” notified by Central Government under
Companies (Accounting Standards) Rules, 2006, the Consolidated Financial Statements of the Group include the financial
statements of the Holding Company and all its subsidiaries and sub-subsidiaries which are more than 50% owned and controlled.
Enterprises over which the Company exercises significant influence are considered for preparation of the Consolidated Financial
Statements as per Accounting Standard 23 “Accounting for Investments in Associates in Consolidated Financial Statements”
and Interests in Joint Ventures have been accounted by using the proportionate consolidation method as per Accounting
Standard 27 “Financial Reporting of Interests in Joint Ventures”, notified by the Central Government under the Companies
(Accounting Standards) Rules, 2006. Investments that are acquired and held exclusively with a view to subsequent disposal in
the near future are not considered for consolidation.
10 Lakh is equal to 1 Million
25. ADMINISTRATIVE & OTHER EXPENSES
Communication Expenses 458 1,201 Outsourced Manpower Expenses 724 639 Site & Site Mobilisation Expenses 1,989 1,836 Legal & Professional Fees 3,967 4,016 Power & Fuel 1,484 573 Rent 1,476 1,357 Equipment Hire & Leasing 526 298 Rates and Taxes 721 475 Brokerage and Service Charges 828 492 Auditors' Remuneration 178 126 Repairs - Building 79 37
Machinery 2,321 1,970 Others 1,158 531
Travelling and Conveyance 2,845 2,275 Directors' Fees 21 12 Insurance 649 547 Printing and Stationery 247 197 Advertisement, Subscription and Donation 1,291 507 Provision for Diminution in value of Long-Term Investments - 45 Provision for Diminution in value of Stock for Trade 16 90 Provision for Customer Claims 17 309 Provision for Diminution in value of Inventories 183 - Loss on sale of Fixed Assets (Net) 556 943 Investment written off 12 - Fixed Assets written off 3 - Expenses for Liquidation of overseas Subsidiary 50 - Miscellaneous Expenditure Written off 43 228 Miscellaneous Expenses 476 607 Total 22,318 19,311
SIGNIFICANT ACCOUNTING POLICIES AND NOTES TO THE CONSOLIDATED FINANCIAL STATEMENTS (Contd.)

171
Annual Report 2011-12
28. The details of subsidiaries (including their subsidiaries and joint ventures), associates and joint venture (including itssubsidiary) are as follows:–
% Holding % HoldingName of the Company Country of 31st March, 31st March,
incorporation 2012 2011
SubsidiariesSrei Capital Markets Limited India 100 100Srei Venture Capital Limited India 100 100Srei Infrastructure Advisors Limited India 100 100Global Investment Trust Limited India 100 100Controlla Electrotech Private Limited India 100 100Srei Mutual Fund Asset Management Private Limited India 100 100Srei Mutual Fund Trust Private Limited India 100 100IIS International Infrastructure Services GmbH Germany 92.54 92.54Srei Forex Limited India 100 100Srei Insurance Broking Private Limited (w.e.f. 31.03.2012) India 51 -Srei Sahaj e-Village Limited India 95.10 95.10Quippo Valuers and Auctioneers Private Limited India 100 100Quippo Oil & Gas Infrastructure Limited India 99.90 99.80Quippo Energy Private Limited India 100 100Quippo Construction Equipment Limited India 100 100Mumbai Futuristic Economic Zone Private Limited India 100 100Sub-SubsidiariesQuippo Infocomm Limited (ceased to be a Subsidiary of Srei Infrastructure Advisors Limited w.e.f. 16.07.2011) India - 100Bengal Srei Infrastructure Development Limited (Subsidiary of Srei Infrastructure Advisors Limited) India 51 51Hyderabad Information Technology Venture Enterprises Limited (Subsidiary of Srei Venture Capital Limited) India 51 51Cyberabad Trustee Company Pvt. Limited (Subsidiary of Srei Venture Capital Limited) India 51 51ZAO Srei Leasing (Subsidiary of IIS International Infrastructure Services GmbH) Russia 64.20 57.14Srei Advisors Pte Limited (Subsidiary of IIS International Infrastructure Services GmbH) Singapore 100 100Quippo Prakash Marine Holdings Pte. Limited (Subsidiary of Quippo Oil & Gas Infrastructure Limited) Singapore 51 51Quippo Prakash Pte. Limited (Subsidiary of Quippo Prakash Marine Holdings Pte. Limited) Singapore 73.90 73.90Quippo Holding Cooperatief U.A. (Subsidiary of Quippo Oil & Gas Infrastructure Limited, Liquidated on 13.02.2012) Netherlands - 91Quippo International B.V. (Subsidiary of Quippo Holding Cooperatief U.A., Liquidated on 13.02.2012) Netherlands - 100Quippo Mara Infrastructure Limited (Subsidiary of Quippo International B.V., Ceased to be a Sub-subsidiary w.e.f. 13.02.2012 on account of liquidation of its holding company) British Virgin Islands - 50.10Quippo Energy Middle East Limited (Subsidiary of Quippo Energy Private Limited) Dubai 100 100Quippo Energy Yemen Limited (Subsidiary of Quippo Energy Private Limited) Yemen 100 100Kasco Steel Limited (Ceased to be a subsidiary of Quippo Construction Equipment Limited w.e.f. 22.09.2011) India - 68Quippo Mauritius Private Limited (Subsidiary of Quippo Energy Private Limited w.e.f. 05.03.2012) Mauritius 100 -Quippo Energy Nigeria Private Limited (Subsidiary of Quippo Mauritius Private Limited w.e.f. 22.03.2012) Nigeria 100 -
SIGNIFICANT ACCOUNTING POLICIES AND NOTES TO THE CONSOLIDATED FINANCIAL STATEMENTS (Contd.)
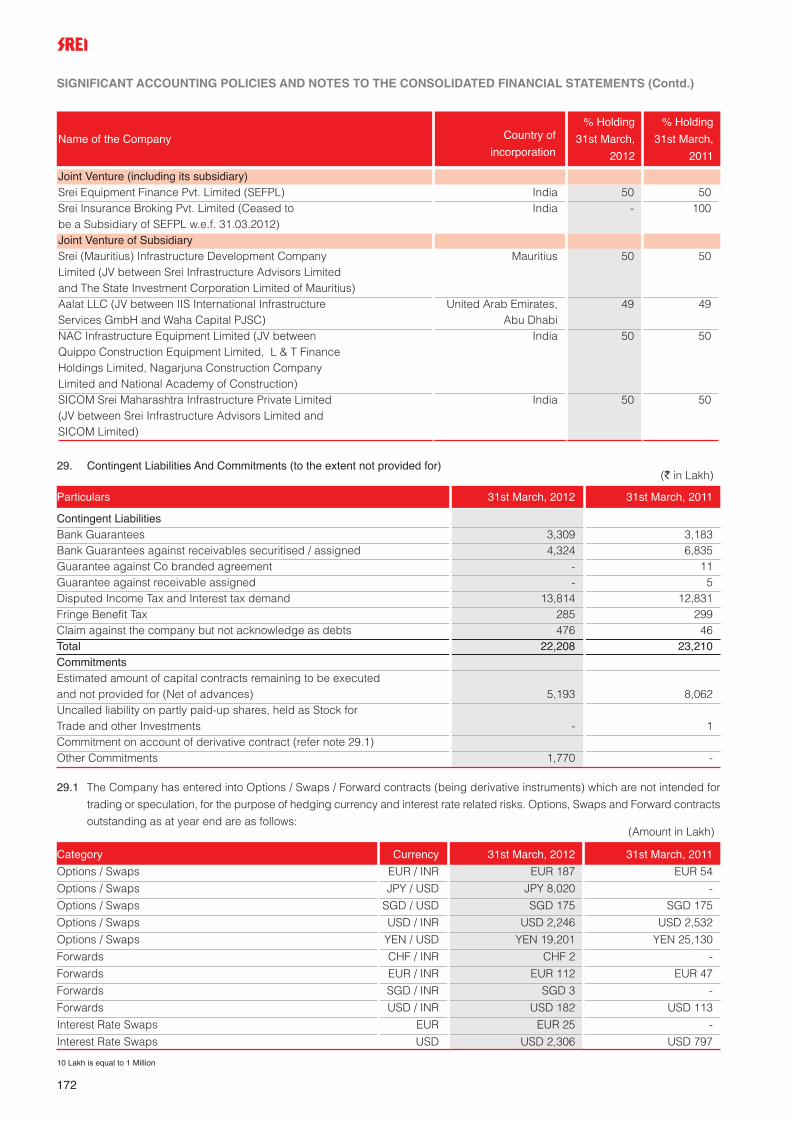
172
% Holding % Holding
Name of the Company Country of 31st March, 31st March,incorporation 2012 2011
Joint Venture (including its subsidiary)Srei Equipment Finance Pvt. Limited (SEFPL) India 50 50Srei Insurance Broking Pvt. Limited (Ceased to India - 100be a Subsidiary of SEFPL w.e.f. 31.03.2012)Joint Venture of SubsidiarySrei (Mauritius) Infrastructure Development Company Mauritius 50 50Limited (JV between Srei Infrastructure Advisors Limited and The State Investment Corporation Limited of Mauritius)Aalat LLC (JV between IIS International Infrastructure United Arab Emirates, 49 49Services GmbH and Waha Capital PJSC) Abu DhabiNAC Infrastructure Equipment Limited (JV between India 50 50Quippo Construction Equipment Limited, L & T Finance Holdings Limited, Nagarjuna Construction Company Limited and National Academy of Construction)SICOM Srei Maharashtra Infrastructure Private Limited India 50 50(JV between Srei Infrastructure Advisors Limited and SICOM Limited)
29.1 The Company has entered into Options / Swaps / Forward contracts (being derivative instruments) which are not intended for
trading or speculation, for the purpose of hedging currency and interest rate related risks. Options, Swaps and Forward contracts
outstanding as at year end are as follows:(Amount in Lakh)
Category Currency 31st March, 2012 31st March, 2011
Options / Swaps EUR / INR EUR 187 EUR 54
Options / Swaps JPY / USD JPY 8,020 -
Options / Swaps SGD / USD SGD 175 SGD 175
Options / Swaps USD / INR USD 2,246 USD 2,532
Options / Swaps YEN / USD YEN 19,201 YEN 25,130
Forwards CHF / INR CHF 2 -
Forwards EUR / INR EUR 112 EUR 47
Forwards SGD / INR SGD 3 -
Forwards USD / INR USD 182 USD 113
Interest Rate Swaps EUR EUR 25 -
Interest Rate Swaps USD USD 2,306 USD 797
10 Lakh is equal to 1 Million
29. Contingent Liabilities And Commitments (to the extent not provided for)(` in Lakh)
Particulars 31st March, 2012 31st March, 2011
Contingent LiabilitiesBank Guarantees 3,309 3,183Bank Guarantees against receivables securitised / assigned 4,324 6,835Guarantee against Co branded agreement - 11Guarantee against receivable assigned - 5Disputed Income Tax and Interest tax demand 13,814 12,831Fringe Benefit Tax 285 299Claim against the company but not acknowledge as debts 476 46Total 22,208 23,210CommitmentsEstimated amount of capital contracts remaining to be executed and not provided for (Net of advances) 5,193 8,062Uncalled liability on partly paid-up shares, held as Stock for Trade and other Investments - 1Commitment on account of derivative contract (refer note 29.1)Other Commitments 1,770 -
SIGNIFICANT ACCOUNTING POLICIES AND NOTES TO THE CONSOLIDATED FINANCIAL STATEMENTS (Contd.)

173
Annual Report 2011-12
30. The audited financial statements of IIS International Infrastructure Services GmbH (IIS), Quippo Prakash Marine Holdings Pte.
Ltd., Quippo Energy Middle East Limited and management accounts of Srei (Mauritius) Infrastructure Development Corporation
Ltd., Quippo Energy Yemen Limited, Quippo Prakash Pte. Limited and Aalat LLC up to 31st March, 2012 have been prepared
in accordance with International Financial Reporting Standards, generally followed in the country of their incorporation.
Differences in accounting policies arising there from are not material.
The audited financial statements of ZAO Srei Leasing (ZAO) and Srei Advisors Pte Ltd. subsidiaries of IIS is prepared upto 31st
December every year. Management accounts for the period 1st January, 2011 to 31st March, 2011 and 1st January, 2012 to
31st March, 2012 have been used for consolidation with IIS. The audited financial statements of ZAO have been prepared in
accordance with International Financial Reporting Standards, generally followed in the country of their incorporation. Differences
in accounting policies arising there from are not material.
Quippo Mauritius Private Ltd. (subsidiary of Quippo Energy Private Ltd.) and Quippo Energy Nigeria Private Ltd. (subsidiary of
Quippo Mauritius Private Ltd.) was formed during the year without any receipt of Equity Contribution as per the law applicable
in the country of its incorporation. Upto 31st March 2012, both the Companies were yet to start its operations and there were
no transactions in the Company during the year ended on that date. Therefore, no financial statement of these Companies were
available for consolidation
31. The Share Capital of Srei Mutual Fund Asset Management Private Limited, a wholly owned subsidiary of the Company has been
increased to ` 1,300 lakh as on March 31, 2012 consequent upon infusion of fresh capital aggregating to ` 200 lakh by the
Company.
32. The Reporting Company’s proportionate share in the assets, liabilities, income and expenses of its Joint Venture Company
included in these consolidated financial statements are given below:
SIGNIFICANT ACCOUNTING POLICIES AND NOTES TO THE CONSOLIDATED FINANCIAL STATEMENTS (Contd.)

174
(` in Lakh)
Particulars 31st March, 2012 31st March, 2011
EQUITY AND LIABILITIES
Shareholdersʼ Funds
Share capital 2,661 2,500
Reserves and surplus 67,420 52,744
70,081 55,244
Non-current liabilities
Long-term borrowings 175,699 197,367
Deferred tax liabilities (Net) 5,567 3,044
Other long-term liabilities 4,970 3,470
Long-term provisions 7,004 6,581
193,240 210,462
Current liabilities
Short-term borrowings 233,078 123,039
Trade payables 33,067 27,433
Other current liabilities
- Current maturities of long-term borrowings 106,840 68,178
- Other current liabilities 6,020 3,097
Short-term provisions 1,861 3,730
380,866 225,477
TOTAL 644,187 491,183ASSETS Non-Current AssetsFixed Assets - Tangible Assets 62,007 26,305- Intangible Assets 858 884
Long-term Loans and AdvancesFinancial Assets 307,896 246,230Other Long-term Advances 2,790 2,299Other Non-Current Assets 41,764 19,544
415,315 295,262Current AssetsTrade Receivables 1,277 268Cash and Bank Balances 21,859 9,271Short-term Loans and Advances- Financial Assets 40,544 46,565- Other Advances 346 499
Other Current Assets- Current Maturities of Long-term Financial Assets 158,807 136,398- Other Current Assets 6,039 2,920
228,872 195,921TOTAL 644,187 491,183
Particulars 2011 - 12 2010 - 11
STATEMENT OF PROFIT AND LOSSINCOMERevenue from operations 91,036 61,939Other income 22 147TOTAL 91,058 62,086
10 Lakh is equal to 1 Million
SIGNIFICANT ACCOUNTING POLICIES AND NOTES TO THE CONSOLIDATED FINANCIAL STATEMENTS (Contd.)

175
Annual Report 2011-12
33. Related Party Disclosures
List of related parties:
Joint Venture:
Srei Equipment Finance Private Limited
Key Management Personnel (KMP):
Name Designation
Hemant Kanoria Chairman & Managing Director
Saud Ibne Siddique Joint Managing Director
Sanjeev Sancheti Chief Financial Officer
Enterprises over which KMP and their relatives have significant influence
Viom Networks Limited (w.e.f. 18.11.2011)
(` in Lakh)
Particulars 2011 - 12 2010 - 11
EXPENDITURE
Employee Benefits Expense 5,124 3,362
Finance cost 52,196 32,765
Depreciation / Amortisation / Impairment 7,834 4,027
Administrative and Other expenses 5,431 3,920
Miscellaneous Expenditure written off 43 218
TOTAL 70,628 44,292
PROFIT BEFORE BAD DEBTS, PROVISIONS AND TAX 20,430 17,794
Bad debts written off (net of recovery) 4,884 5,112
Provision for Non Performing Assets 131 971
Contingent provisions against standard assets 182 1,041
PROFIT BEFORE TAX 15,233 10,670
Provision for Tax 5,384 4,126
PROFIT AFTER TAX 9,849 6,544
Proportionate Share in Reserves of Joint Venture:
Capital Reserves 16 18
Debt Redemption Reserve 7,853 4,053
Special Reserve as per Reserve Bank of India Directions 5,016 3,043
Securities Premium Account 42,330 37,500
Statement of Profit and Loss 12,205 8,130
TOTAL 67,420 52,744
Contingent Liabilities 9,583 12,090
Capital Commitments (Net of Advances) 2,091 3,530
10 Lakh is equal to 1 Million
SIGNIFICANT ACCOUNTING POLICIES AND NOTES TO THE CONSOLIDATED FINANCIAL STATEMENTS (Contd.)

176
(` in Lakh)
Name of related party and Nature of Nature of transactions and 2011 - 12 2010 - 11
relationship outstanding balances
(B) Key Management Personnel
Hemant Kanoria Remuneration 163 178
Commission 60 60
Dividend paid 3 3
Saud Ibne Siddique Remuneration 339 325
Kishore Kumar Mohanty Remuneration - 76
(Upto 31.01.2011) Dividend paid - 2
Sanjeev Sancheti Remuneration 73 66
Loan advanced 5 -
Refund of Loan Advanced 4 -
Interest received on Loan 0.21 -
Balance Receivable-Loan 1 -
(C) Enterprises over which KMPs and their
relatives have significant influence:
Viom Networks Limited (w.e.f. 18.11.2011) Deposit Received 76 -
Rent received 306 -
Balance Receivable-Others 6 -
Balance Payable-Deposit 660 -
10 Lakh is equal to 1 Million
Summary of transactions with related parties:
(` in Lakh)
Name of related party and Nature of
transactions
2011 - 12 2010 - 11
Value of Amount Value of Amount
Transaction / Considered in Transaction / Considered in
Outstanding Consolidation Outstanding Consolidation
(A) Joint venture
Srei Equipment Finance Private Limited
Security Deposit Received 54 27 669 335
Security Deposit Paid - - 7 4
Security Deposit Refund Received 50 25 96 48
Security Deposit Refunded 7 4 - -
Advance Paid - - 270 135
Refund of Advance Received - - 270 135
Rent Paid - - 211 106
Rent Received 1,388 694 999 500
Balance Payable - Security Deposit 1,425 713 1,421 711
Balance Receivable - Security Deposit - - 7 4
Equity Contribution 4,991 2,496 - -
Purchase of Investment 143 72 - -
SIGNIFICANT ACCOUNTING POLICIES AND NOTES TO THE CONSOLIDATED FINANCIAL STATEMENTS (Contd.)

177
Annual Report 2011-12
34. Segment Reporting
Segment wise details (information provided in respect of revenue items for the year ended 31st March, 2012 and in respect of
assets / liabilities as at 31st March, 2012 – denoted as “CY” below, previous year denoted as “PY”) as required by AS - 17
“Segment Reporting” notified by the Central Government under the Companies (Accounting Standards) Rules, 2006 are as
under:-
(` in Lakh)
ParticularsFinancial Services
Infrastructure OthersTotal
Equipment Services
CY PY CY PY CY PY CY PY
Segment Revenue 214,619 139,067 29,726 23,273 6,468 6,093 250,813 168,433
Segment Result before Interest
& Finance Charges 169,412 105,631 10,947 7,410 (179) (1,136) 180,180 111,905
Interest & Finance Charges 148,863 77,673 6,709 4,839 931 496 156,503 83,008
Tax Expenses - - - - - - 11,362 9,279
Net Profit After Tax - - - - - - 12,315 19,618
Segment Assets 1,870,021 1,266,342 95,779 86,401 42,851 31,905 2,008,651 1,384,648
Segment Liabilities 1,596,209 988,430 70,557 68,175 9,601 2,939 1,676,367 1,059,544
Capital Expenditures 50,347 44,815 9,702 53,854 360 1,502 60,409 100,171
Depreciation 9,423 5,861 6,587 6,117 493 431 16,503 12,409
Other non-cash expenditure 43 228 - - - - 43 228
35. Figures pertaining to the previous year have been rearranged / regrouped, reclassified and restated, wherever necessary, to
make them comparable with those of current year.
Signatories to Note 1 to 35
10 Lakh is equal to 1 Million
For Haribhakti & Co. On behalf of the Board of Directors
Chartered Accountants(Firm's Registration No. 103523W)
Anand Kumar Jhunjhunwala Hemant Kanoria Salil K. GuptaPartner Chairman & Managing Director Chief Mentor & DirectorMembership No. 056613
Sandeep LakhotiaPlace : Kolkata Company SecretaryDate : 14th May, 2012
SIGNIFICANT ACCOUNTING POLICIES AND NOTES TO THE CONSOLIDATED FINANCIAL STATEMENTS (Contd.)
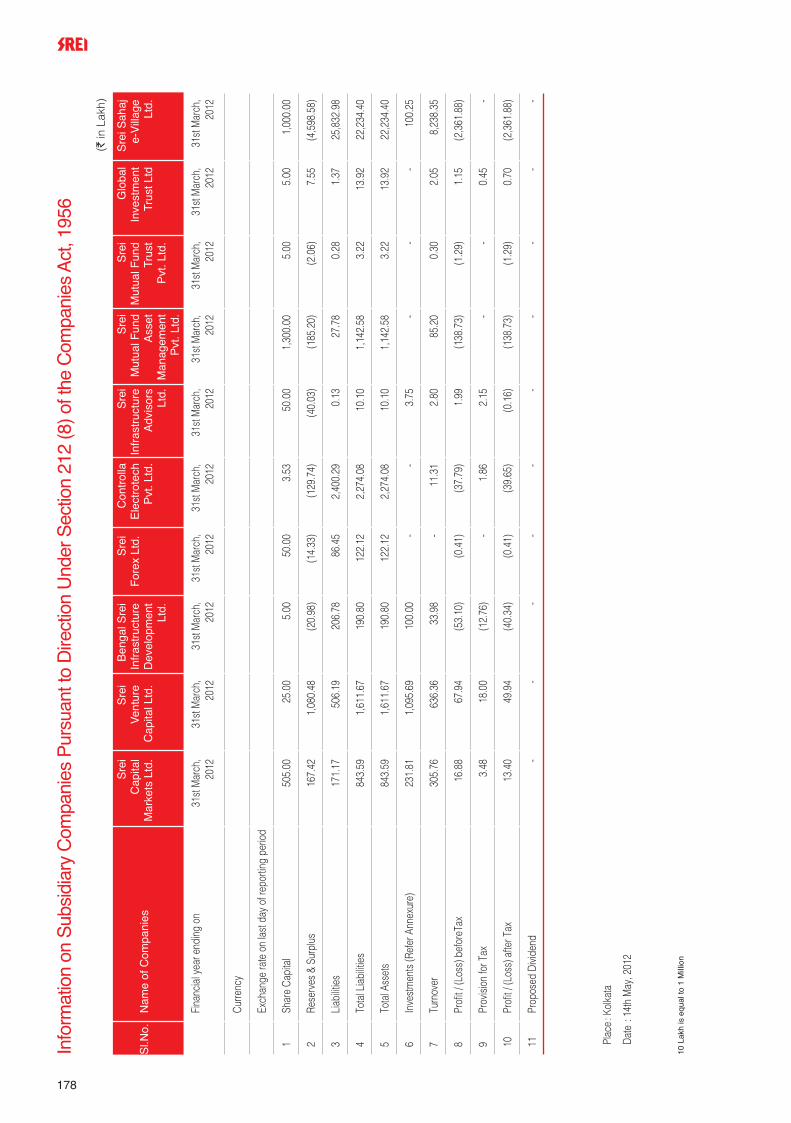
178
Info
rmat
ion
on S
ubsi
diar
y C
ompa
nies
Pur
suan
t to
Dire
ctio
n U
nder
Sec
tion
212
(8) o
f the
Com
pani
es A
ct, 1
956
(`in
Lak
h)
Sl.N
o.N
ame
of C
ompa
nies
Sre
i S
rei
B
enga
l Sre
iS
rei
Con
trol
la
Sre
i S
rei
Sre
iG
loba
lS
rei S
ahaj
Cap
ital
Ven
ture
In
fras
truc
ture
For
ex L
td.
Ele
ctro
tech
In
fras
truc
ture
M
utua
l Fun
d M
utua
l Fun
d In
vest
men
te-
Vill
age
Mar
kets
Ltd
.C
apita
l Ltd
. D
evel
opm
ent
Pvt
. Ltd
.A
dvis
ors
Ass
et
Trus
t Tr
ust L
tdLt
d.Lt
d.
Ltd.
Man
agem
ent
Pvt
. Ltd
.P
vt. L
td.
Fina
ncia
l yea
r end
ing
on31
st M
arch
, 31
st M
arch
,31
st M
arch
, 31
st M
arch
, 31
st M
arch
, 31
st M
arch
, 31
st M
arch
, 31
st M
arch
, 31
st M
arch
, 31
st M
arch
, 20
1220
1220
1220
1220
1220
1220
1220
1220
1220
12
Curre
ncy
Exch
ange
rate
on
last
day
of r
epor
ting
perio
d
1Sh
are
Capi
tal
505.
00
25.0
0 5.
00
50.0
0 3.
53
50.0
0 1,
300.
00
5.00
5.
00
1,00
0.00
2Re
serv
es &
Sur
plus
16
7.42
1,
080.
48
(20.
98)
(14.
33)
(129
.74)
(40.
03)
(185
.20)
(2.0
6)7.
55
(4,5
98.5
8)
3Li
abilit
ies
171.
17
506.
19
206.
78
86.4
5 2,
400.
29
0.13
27
.78
0.28
1.
37
25,8
32.9
8
4To
tal L
iabi
lities
84
3.59
1,
611.
67
190.
80
122.
12
2,27
4.08
10
.10
1,14
2.58
3.
22
13.9
2 22
,234
.40
5To
tal A
sset
s 84
3.59
1,
611.
67
190.
80
122.
12
2,27
4.08
10
.10
1,14
2.58
3.
22
13.9
2 22
,234
.40
6In
vest
men
ts (R
efer
Ann
exur
e)
231.
81
1,09
5.69
10
0.00
-
-
3.
75
-
-
-
100.
25
7Tu
rnov
er
305.
76
636.
36
33.9
8 -
11
.31
2.80
85
.20
0.30
2.
05
8,23
8.35
8Pr
ofit
/ (Lo
ss) b
efor
eTax
16
.88
67.9
4 (5
3.10
)(0
.41)
(37.
79)
1.99
(1
38.7
3)(1
.29)
1.15
(2
,361
.88)
9Pr
ovisi
on fo
r Tax
3.
48
18.0
0 (1
2.76
)-
1.
86
2.15
-
-
0.
45
-
10Pr
ofit
/ (Lo
ss) a
fter T
ax
13.4
0 49
.94
(40.
34)
(0.4
1)(3
9.65
)(0
.16)
(138
.73)
(1.2
9)0.
70
(2,3
61.8
8)
11Pr
opos
ed D
ivide
nd
-
-
-
-
-
-
-
-
-
-
Plac
e: K
olka
ta
Date
: 14t
h M
ay, 2
012
10 L
akh
is e
qual
to 1
Mill
ion

179
Annual Report 2011-12
Info
rmat
ion
on S
ubsi
diar
y C
ompa
nies
Pur
suan
t to
Dire
ctio
n U
nder
Sec
tion
212
(8) o
f The
Com
pani
es A
ct, 1
956
(` in
Lak
h)
Sl.N
o.N
ame
of C
ompa
nies
Hyd
erab
ad
Cyb
erab
adIIS
Inte
rnat
iona
l Z
AO
Sre
i S
rei A
dvis
ors
Q
uipp
o Q
uipp
o O
il &
Qui
ppo
Qui
ppo
Qui
ppo
Info
rmat
ion
Trus
tee
Co
Infr
astr
uctu
re
Leas
ing
P
te L
td.
Val
uers
and
Gas
Ene
rgy
Con
stru
ctio
nP
raka
shTe
chno
logy
P
rivat
e Lt
d.S
ervi
ce G
mbH
Auc
tione
ers
Infr
astr
uctu
reP
rivat
eE
quip
men
tM
arin
eV
entu
reP
rivat
e Lt
d.Li
mite
dLi
mite
dLi
mite
dH
oldi
ngs
Pte
.E
nter
pris
es L
td.
Lim
ited
Fina
ncia
l yea
r end
ing
on31
st M
arch
,31
st M
arch
,31
st M
arch
,31
st D
ecem
ber,
31st
Dec
embe
r,31
st M
arch
,31
st M
arch
,31
st M
arch
,31
st M
arch
,31
st M
arch
,
2012
2012
2012
2011
2011
2012
2012
2012
2012
2012
Curre
ncy
Euro
Rubl
esSi
ngap
ore
Dolla
rUS
D
Exch
ange
rate
on
last
day
of r
epor
ting
perio
d 67
.876
1.
649
40.9
34
50.8
70
1Sh
are
Capi
tal
25.0
0 5.
00
4,32
3.70
6,
061.
18
28.6
9 20
.00
3,00
0.00
11
3.97
64
.13
3,20
7.90
2Re
serv
es &
Sur
plus
64
.37
0.43
(1
23.7
6)85
9.29
(4
.41)
257.
04
(5,3
12.6
4)2,
426.
53
(6,3
29.4
2)1,
584.
15
3Li
abilit
ies
0.30
0.
10
553.
71
24,0
09.7
0 9.
24
51.3
8 16
,305
.44
12,4
46.7
1 26
,998
.86
4,40
3.91
4To
tal L
iabi
lities
89
.67
5.53
4,
753.
66
30,9
30.1
7 33
.52
328.
42
13,9
92.8
0 14
,987
.21
20,7
33.5
7 9,
195.
95
5To
tal A
sset
s 89
.67
5.53
4,
753.
66
30,9
30.1
7 33
.52
328.
42
13,9
92.8
0 14
,987
.21
20,7
33.5
7 9,
195.
95
6In
vest
men
ts (R
efer
Ann
exur
e)
-
-
4,70
5.91
-
-
-
4,
028.
27
35.6
8 75
0.00
26
.85
7Tu
rnov
er
9.17
0.
40
149.
00
3,85
6.34
-
36
0.23
6,
274.
73
5,23
3.88
7,
226.
78
-
8Pr
ofit
/ (Lo
ss) b
efor
eTax
(2
.46)
0.04
42
.60
365.
86
(9.8
6)37
.35
(2,3
25.4
1)22
8.81
(4
71.5
9)(3
02.5
4)
9Pr
ovisi
on fo
r Tax
1.
74
(0.0
3)6.
04
72.0
4 -
11
.38
(109
.28)
70.7
8 -
(1
.36)
10Pr
ofit
/ (Lo
ss) a
fter T
ax
(4.2
0)0.
07
36.5
6 29
3.82
(9
.86)
25.9
7 (2
,216
.13)
158.
03
(471
.59)
(301
.18)
11Pr
opos
ed D
ivide
nd
-
-
-
-
-
-
-
-
-
-
Plac
e: K
olka
ta
Date
: 1
4th
May
, 201
2
10 L
akh
is e
qual
to 1
Mill
ion

180
Info
rmat
ion
on S
ubsi
diar
y C
ompa
nies
Pur
suan
t to
Dire
ctio
n U
nder
Sec
tion
212
(8) o
f The
Com
pani
es A
ct, 1
956
(`in
Lak
h)
Sl.N
o.Na
mes
of C
ompa
nies
Qui
ppo
Qui
ppo
Qui
ppo
M
umba
iQ
uipp
oQ
uipp
oSr
eiPr
akas
h Pt
e.En
ergy
En
ergy
Fu
turls
ticM
aurit
ius
Ener
gyIn
sura
nce
Lim
ited.
Mid
dle
East
Yem
enEc
onom
icPr
ivate
Nige
riaBr
okin
gLi
mite
dLi
mite
dZo
neLi
mite
dPr
ivate
Priva
tePv
t. Lt
dLi
mite
dLi
mite
d
Fina
ncia
l yea
r end
ing
on31
st M
arch
, 31
st M
arch
,31
st M
arch
,31
st M
arch
,31
st M
arch
,31
st M
arch
,31
st M
arch
,20
123
2012
220
123
2012
2012
120
121
2012
Curre
ncy
USD
AED
USD
Exch
ange
rate
on
last
day
of r
epor
ting
perio
d 50
.870
13
.848
50
.870
1Sh
are
Capi
tal
36.3
4 13
.85
24.2
4 1.
00
250.
00
2Re
serv
es &
Sur
plus
3,
966.
28
(4.1
1)-
(2.0
6)10
1.58
3Li
abilit
ies
54,3
85.4
1 0.
21
-12
,136
.66
22.8
8
4To
tal L
iabi
lities
58
,388
.02
9.94
24
.24
12,1
35.6
0 37
4.46
5To
tal A
sset
s 58
,388
.02
9.94
24
.24
12,1
35.6
0 37
4.46
6In
vest
men
ts (R
efer
Ann
exur
e)
--
--
-
7Tu
rnov
er
11,3
59.2
6-
--
294.
47
8Pr
ofit
/ (Lo
ss) b
efor
eTax
3,
177.
94(0
.21)
-(0
.49)
100.
08
9Pr
ovisi
on fo
r Tax
89
2.87
--
--
-29
.43
10Pr
ofit
/ (Lo
ss) a
fter T
ax
2,28
5.07
(0.2
1)-
(0.4
9)70
.65
11Pr
opos
ed D
ivide
nd
--
--
-
Note
:
1 Th
e Co
mpa
nies
wer
e fo
rmed
dur
ing
the
year
with
out a
ny re
ceip
t of E
quity
Con
tribu
tion
as p
er th
e la
w ap
plic
able
in th
e co
untry
of i
ts in
corp
orat
ion.
Upt
o 31
st M
arch
, 201
2, b
oth
the
Com
pani
es w
ere
yet t
o st
art i
ts o
pera
tions
and
ther
e
were
no
trans
actio
ns in
the
Com
pany
dur
ing
the
year
end
ed o
n th
at d
ate.
2 Fo
r the
per
iod
1st O
ctob
er, 2
011
to 3
1st M
arch
, 201
2
3 Ba
sed
on u
naud
ited
finan
cial
sta
tem
ent.
On
beha
lf of
the
Boa
rd o
f Dire
ctor
s
Plac
e: K
olka
taHe
man
t Kan
oria
Salil
K. G
upta
Sand
eep
Lakh
otia
Dat
e :1
4th
May
, 201
2C
hairm
an &
Man
agin
g D
irect
orC
hief
Men
tor
& D
irect
orC
omp
any
Sec
reta
ry
10 L
akh
is e
qual
to 1
Mill
ion

181
Annual Report 2011-12
Annexure to Information on Subsidiary Companies Pursuant to Direction UnderSection 212 (8) of The Companies Act, 1956
Sl No. Name of the Company
No. of Currency Face Book value Quoted
shares / Value (` in Lakh) Unquoted
units / bonds
1 Srei Capital Markets LimitedLong Term Investments (at cost)In Equity SharesAndhra Bank Limited 100 Indian Rupees 10 0.01 QuotedBank of Baroda Limited 100 Indian Rupees 10 0.07 QuotedBank of India Limited 100 Indian Rupees 10 0.02 QuotedCorporation Bank Limited 100 Indian Rupees 10 0.13 QuotedHDFC Bank Limited 100 Indian Rupees 10 0.25 QuotedICICI Bank Limited 100 Indian Rupees 10 0.19 QuotedIDBI Bank Limited 120 Indian Rupees 10 0.04 QuotedING Vysya Bank Limited 415 Indian Rupees 10 0.26 QuotedOriental Bank of Commerce Limited 100 Indian Rupees 10 0.04 QuotedState Bank of India Limited 134 Indian Rupees 10 0.80 QuotedIn Bonds / Debentures / Units:Infrastructure Project Development Fund 230000 Indian Rupees 100 230.00 UnquotedTOTAL 231.81
2 Srei Venture Capital LimitedLong Term Investments (at cost)In Subsidiary Company - Equity Shares:Cyberabad Trustee Company Private Limited 25500 Indian Rupees 10 2.55 UnquotedHyderabad Information Technology Venture Enterprises Limited 127500 Indian Rupees 10 46.74 UnquotedIn Equity Shares:Reliance Power Limited 5115 Indian Rupees 10 14.39 QuotedPilani Investments & Industries Corporation Limited 3000 Indian Rupees 10 108.00 UnquotedViolet Arch Capital Advisors Private Limited 1774800 Indian Rupees 10 900.01 UnquotedIn Bonds / Debentures / Units:Medium & Small Infrastructure Fund (Class A) 22000 Indian Rupees 100 22.00 UnquotedMedium & Small Infrastructure Fund (Class B) 2000 Indian Rupees 100 2.00 UnquotedTOTAL 1,095.69
3 Bengal Srei Infrastructure Development LimitedLong Term Investment (at cost)In Equity Share:Bengal Integrated Auto Industrial Park Private Limited 1000000 Indian Rupees 10 100.00 UnquotedTOTAL 100.00
4 Srei Infrastructure Advisors LimitedLong Term Investment (at cost)In Subsidiary Company - Equity Shares:Bengal Srei Infrastructure Development Limited 25500 Indian Rupees 10 2.55 UnquotedIn Equity Shares:Quippo Infocomm Limited 7000 Indian Rupees 10 0.70 UnquotedIn Joint Venture - Equity Shares:Srei (Mauritius) Infrastructure Development Company Limited 292800 Maurititus Rupees 10 - Unquoted
10 Lakh is equal to 1 Million

182
Annexure to Information on Subsidiary Companies Pursuant to Direction UnderSection 212 (8) of The Companies Act, 1956
SICOM Srei Maharashtra Infrastructure Private Limited 5000 Indian Rupees 10 0.50 UnquotedTOTAL 3.75
5 Srei Sahaj e-Village LimitedLong Term Investment (at cost)In Equity Share:Maharashtra Border Checkpost Network Limited 2500 Indian Rupees 10 0.25 UnquotedCSC e-Governance Services India Limited 10000 Indian Rupees 1000 100.00 UnquotedTOTAL 100.25
6 IIS International Infrastructure Services GmbHLong Term Investment (at cost)In Subsidiary Company - Equity Shares:ZAO Srei Leasing 235950 Rubles 1000 4,662.42 UnquotedSrei Advisors Pte Limited 70100 SGD 1 26.44 UnquotedIn Joint Venture - Equity Shares:Aalat LLC @ @ 17.05 UnquotedTOTAL 4,705.91
7 Quippo Oil and Gas Infrastructure LimitedLong Term Investment (at cost)In Subsidiary Company & Fellow Subsidiaries- Equity Shares:Quippo Prakash Marine Holdings Pte Limited 51000 SGD 1 14.90 UnquotedQuippo Prakash Marine Holdings Pte Limited 1045500 USD 5 2,433.41 UnquotedQuippo Prakash Pte Limited 51 SGD 1 0.02 UnquotedIn Subsidiary Company - Unsecured Reedemable Convertible BondQuippo Prakash Marine Holdings Pte Limited 3981502 USD 1 1,579.94 UnquotedTOTAL 4,028.27
8 Quippo Energy Private Limited Long Term Investment (at cost)In Subsidiary Company - Equity Shares:Quippo Energy Middle East Limited 100 AED 1000 12.63 UnquotedQuippo Energy Yemen Limited 10200 YER 1000 23.05 UnquotedTOTAL 35.68
9 Quippo Construction Equipment LimitedLong Term Investment (at cost)In Joint Venture - Equity SharesNAC Infrastructure Equipment Limited 7500000 Indian Rupees 10 750.00 UnquotedTOTAL 750.00
10 Quippo Prakash Marine Holdings Pte LimitedLong Term Investment (at cost)In Subsidiary Company - Equity Shares:Quippo Prakash Pte Limited 73900 SGD 1 26.85 UnquotedTOTAL 26.85
@ There is no system of issuance of distinctive shares in the country of registration
Sl No. Name of the Company
No. of Currency Face Book value Quoted
shares / Value (` Lakh) Unquoted
units / bonds
10 Lakh is equal to 1 Million

183
Annual Report 2011-12
Notes

184
Notes
Board of Directors
Salil K. GuptaChief Mentor
Hemant KanoriaChairman & Managing Director
Sunil KanoriaVice Chairman
Saud Ibne SiddiqueJoint Managing Director
V. H. Pandya
S. Rajagopal
Satish C. Jha
Shyamalendu Chatterjee
Sujitendra Krishna Deb
Chief Financial Officer
Sanjeev Sancheti
Company Secretary
Sandeep Lakhotia
Auditors
Messrs Haribhakti & Co.Chartered Accountants
Principal Banker
Axis Bank Limited
Audit Committee
Salil K. GuptaChairman
V. H. Pandya
S. Rajagopal
Sujitendra Krishna Deb
Shyamalendu Chatterjee
Sunil Kanoria
Sandeep LakhotiaSecretary
Compensation Committee
Salil K. GuptaChairman
Shyamalendu Chatterjee
Sujitendra Krishna Deb
Sunil Kanoria
Sandeep LakhotiaSecretary
Committee of Directors
Hemant KanoriaChairman
Sunil Kanoria
Saud Ibne Siddique
Sandeep LakhotiaSecretary
Share Transfer andInvestors’ RelationsCommittee
Salil K. GuptaChairman
Hemant Kanoria
Sunil Kanoria
Sandeep LakhotiaSecretary
Asset Liability ManagementCommittee
Sunil KanoriaChairman
Saud Ibne Siddique
Shyamalendu Chatterjee
Sanjeev Sancheti
Sandeep Lakhotia
S. B. TiwariSecretary
Central Credit and InvestmentCommittee
Hemant KanoriaChairman
Sunil Kanoria
Saud Ibne Siddique
Ganesh P. BagreeSecretary
Risk Committee
Shyamalendu ChatterjeeChairman
Saud Ibne Siddique
Sujitendra Krishna Deb
Ashwini Kumar Secretary
Registered Office
“Vishwakarma”
86C, Topsia Road (South)
Kolkata - 700 046
Tel: +91 33 6160 7734
Fax: +91 33 2285 7542 / 8501
Email: [email protected]
Website: www.srei.com
Contents
Corporate identity 04 CMD’s message 06 Vice Chairman’s message 10 Present everywhere 14 Protective action 16
Visible difference 18 Touch of growth 20 Adequate protection 22 Making people grow 24 Preferred partner 26
Touching lives. Reaching out 28 Group structure 30 Infrastructure report 31 Analysis of financial statements 40
Risk management 46 Directors’ profile 50 Directors’ report 52 Report on corporate governance 82
Shareholders’ information 91 Auditor’s report and financial statements 101 Consolidated financial statements 150
1 billion = 100 crore, 1 million = 10 lakh
All figures attributed to Srei are figures of Srei Consolidated unless otherwise stated.
Cautionary Statement
This report contains forward-looking statements, which may be identified by their use of words like ‘plans’, ‘expects’, ‘will’,
‘anticipates’, ‘believes’, ‘intends’, ‘projects’, ‘estimates’ or other words of similar meaning. All statements that address
expectations or projections about the future, including but not limited to statements about the Company’s strategy for
growth, product development, market position, expenditures and financial results, are forward looking statements.
Forward-looking statements are based on certain assumptions and expectations of future events. The Company cannot
guarantee that these assumptions and expectations are accurate or will be realised. The Company’s actual results,
performance or achievements could thus differ materially from those projected in any such forward looking statements.
The Company assumes no responsibility to publicly amend, modify or revise any forward looking statements, on the basis
of any subsequent developments, information or events.
Concept, content and design at [email protected]
print anderson 9831778971

Srei Infrastructure Finance Limited
Annual Report 2011-12
Invisible hand
Srei Infrastructure Finance Limited
Registered Office:
‘Vishwakarma’, 86C, Topsia Road (South)
Kolkata - 700 046
www.srei.com
Sre
i Infra
stru
ctu
re F
inance L
imite
dA
nnual R
ep
ort 2
011-1
2


