Download - Hyperlocal Election Mapping Made Easy

Hyperlocal Election Mapping Made Easy
Timothy Goddard, Depiction, Inc.
Election Results by Precinct
+ Precinct maps _
Election Maps

• Finding the data
• Preparing the data
• Merging the data
• Colorizing the data
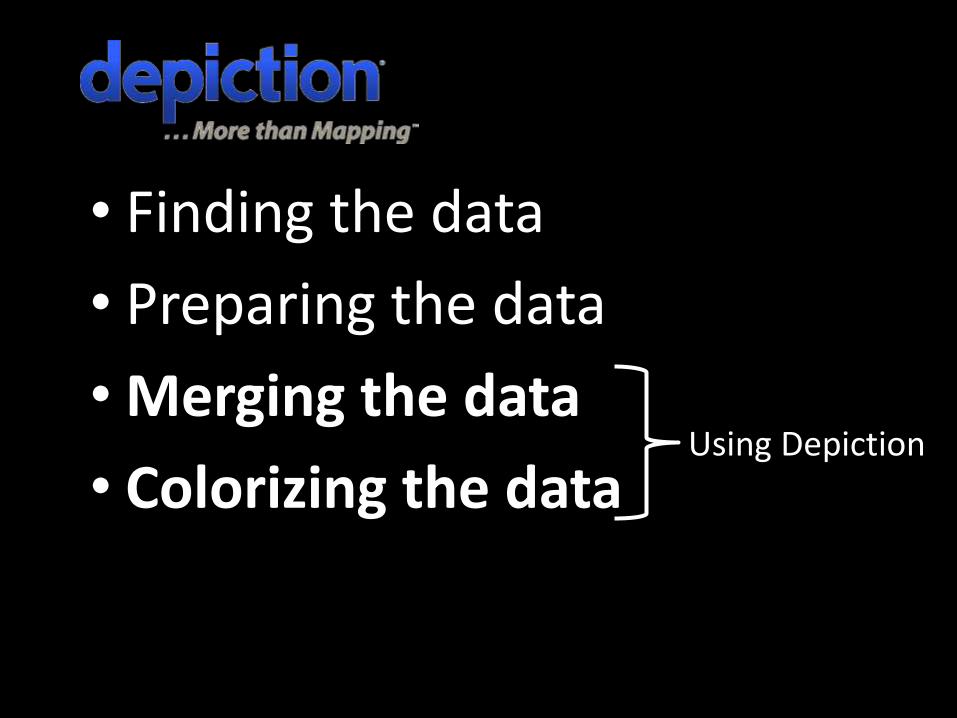
• Finding the data
• Preparing the data
• Merging the data
• Colorizing the dataUsing Depiction

What is Depiction?
• Mapping, Simulation & Collaboration Software
• Bringing expert-level capabilities (like election mapping) to everyday people
• Used in emergency management, real estate, small business and more.
• Finding the data
–This is the hard part!
–Two data types:
•Map/GIS Data
•Election Results

Finding the Data
• Map/GIS Data
– “Precincts” or “Voting Districts”
– Accessible at the Statewide or County level
– Shapefile format
– If not available online, try calling

• Statewide:
• County:

Finding the Data
• Election data– Precinct level results
– From different agencies• Statewide
– Secretary of state, board of elections
• County level– Auditor, clerk, registrar, elections division
– Usually not in a spreadsheet format• Which it needs to be!
• Best option—call & ask for a spreadsheet or similar document

• Preparing the data
–Turn it into a spreadsheet
–Save it as CSV
–Different types take different methods

Preparing Data
• Election Result Data Types
– Spreadsheets
• These are great & easy!

Preparing Data
• Election Result Data Types
– Delimited
– Paste into Excel
– ‘Text to Columns’
Semicolon:

Preparing Data
• Election Result Data Types
– HTML Tables
• Easiest tool: TableTools extension for FireFox
• Copy as tab-delimited text
• Paste into Excel

Preparing Data
• Election Result Data Types
– More difficult types
• Straight Text
• Multiple HTML Tables
– Copy/Paste the whole thinginto Excel
– “Slice & Dice” the data

• Slicing & Dicing
– Filtering
• To separate out columns
• Paste into new sheet

• Slicing & Dicing
– Search & Replace
• To remove extraneous information

• Slicing & Dicing
– Text to Columns
• To split off extraneous informationthat isn’t all identical

• Slicing & Dicing
– Do this column by column to build your spreadsheet
• Keep everything in its original order!
• If necessary, split the precinct number into itsown column

Preparing Data
• Preparing GIS Data
– Create a new Depiction file
– Set the area you want
– Import the Shapefile into Depiction
• (just drag & drop!)

• Finishing election data preparation
– Be sure to include the precinct number or other unique identifier as a column
– Name the unique identifier column “EID”
– The EID, or ‘Element ID’ is what will match the precinct shapes to the election information.

• Add vote percentage columns– Add a column for the one candidate percentages.
– Add a formula that calculates the percentage—something like: =B2/(B2+C2)
– ‘Fill down’ the entire column
– Do the same for the second candidate. Something like: =C2/(B2+C2)
– Set the decimal places to desired number (2-4, probably)
– Save as CSV and close it.
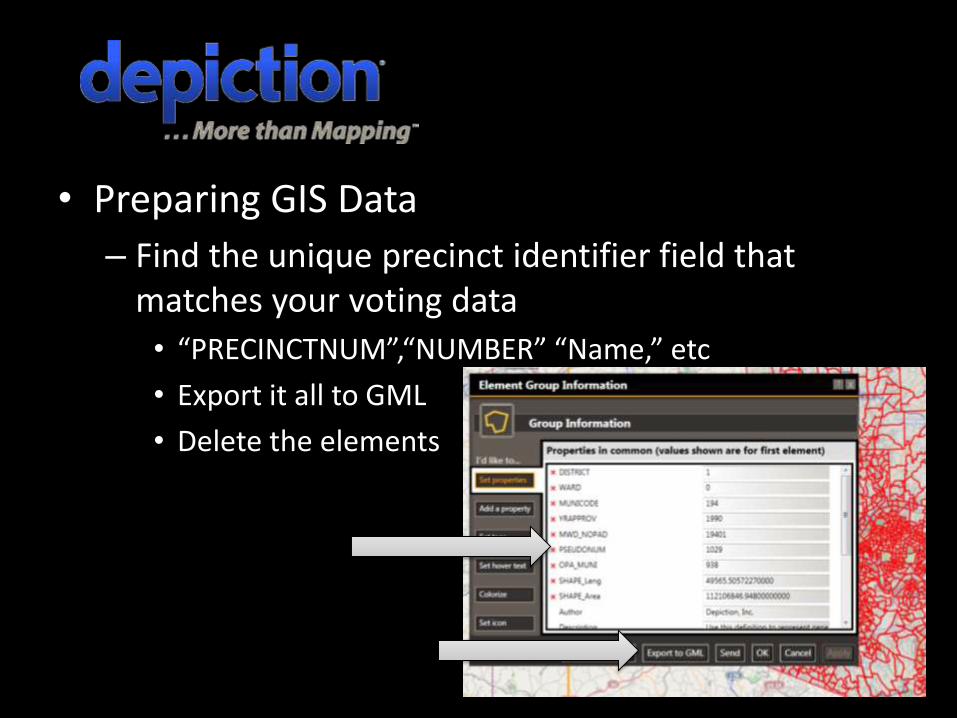
• Preparing GIS Data
– Find the unique precinct identifier field that matches your voting data
• “PRECINCTNUM”,“NUMBER” “Name,” etc
• Export it all to GML
• Delete the elements
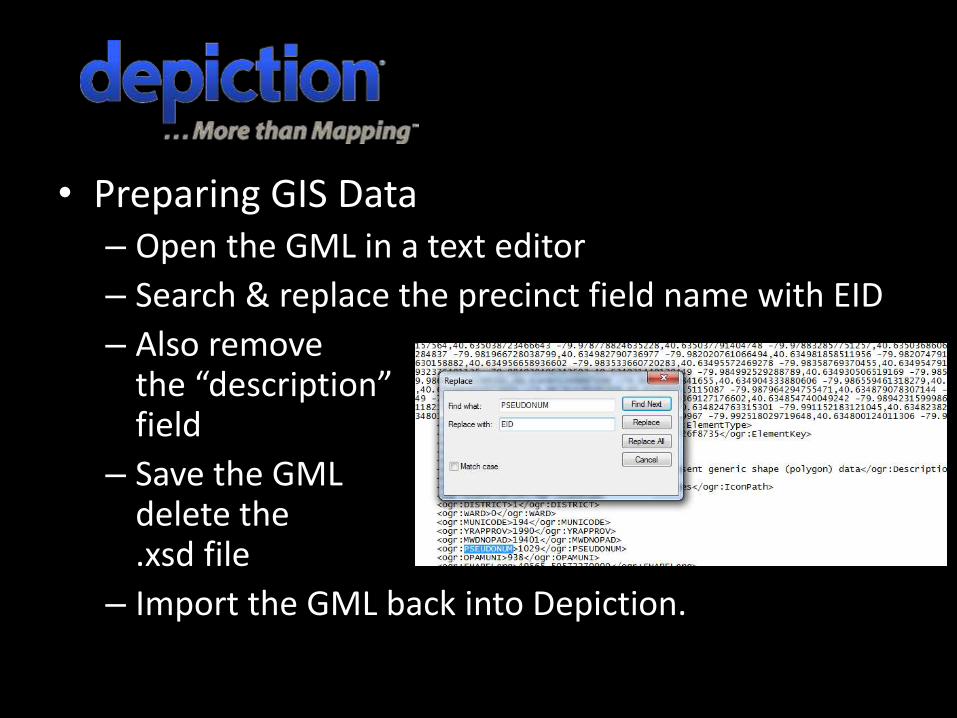
• Preparing GIS Data– Open the GML in a text editor
– Search & replace the precinct field name with EID
– Also removethe “description”field
– Save the GMLdelete the.xsd file
– Import the GML back into Depiction.

Merging the Data
• Import the CSV
– Just drag, drop, and click ‘import’
Merging the data
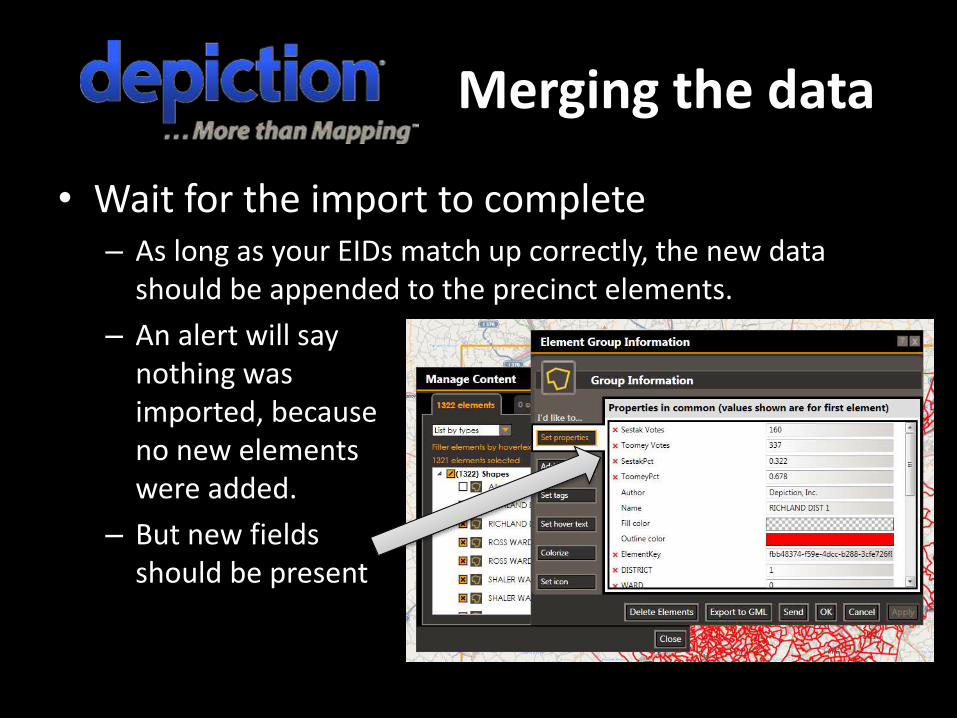
• Wait for the import to complete– As long as your EIDs match up correctly, the new data
should be appended to the precinct elements.
– An alert will saynothing was imported, because no new elements were added.
– But new fields should be present

Colorizing the Data
• Click “Colorize”
• Select “thematic mapping”
• Choose one of the percent fields as the property value.
• Set the colors, click OK.
• You can also use a “Manual range selection”
– 0 – 1 for absolute coloring
– .499 - .501 for binary “red/blue” coloring
– .25 - .75 for more distinct absolute coloring

Tada!
Allegheny Co,Pennsylvania
2010 Senate Election

Tips & Tricks
• Be sure your precinct data is up to date• Be patient when dealing with hundreds or
thousands of precincts• Do spot checks to be sure your data is correct
– Between original election data & final CSV– Between original election data & final depiction
• Set hovertext for the precincts to name and both candidate percentages & total votes
• To compare multiple elections, delete the EID field, re-import the GML and repeat merge w/ new data

For more information:
www.depiction.com


