Hyosung Corporation and SubsidiariesConsolidated Financial StatementsDecember 31, 2011
Hyosung Corporation and SubsidiariesIndexDecember 31, 2011
Page(s)
Report of Independent Auditors ..................................................................................................... 1 - 2
Consolidated Financial Statements
Consolidated Statements of Financial Position....................................................................................... 3
Consolidated Statements of Income ....................................................................................................... 4
Consolidated Statements of Comprehensive Income.............................................................................. 5
Consolidated Statements of Changes in Equity...................................................................................... 6
Consolidated Statements of Cash Flows ................................................................................................ 7
Notes to Consolidated Financial Statements .................................................................................. 8 - 95
LS Yongsan Tower, 191, Hangangno 2-ga, Yongsan
Samil PricewaterhouseCoopers is the Korean network firm of PricewaterhouseCoopers International Limited (PwCIL). "Pricewaterhto the network of member firms of PwCIL. Each member firm is a separate legal entity an
Report of Independent Auditors
To the Board of Directors and Shareholders of
Hyosung Corporation
We have audited the accompanying consolidated statement of financial position of Hyosung
Corporation and its subsidiaries (
statement of income, comprehensive income, change
ended, expressed in Korean won. These financial statements are the responsibility of the Group's
management. Our responsibility is to express an opinion on these financial statements based on our
audit. We did not audit the financial sta
subsidiaries, whose financial statements represent 47.04% of the
of December 31, 2011, and 40.7
These statements were audited by other auditors whose reports have been furnished us and our
opinion, insofar as it relates to the amounts included for Hyosung Capital and certain other
consolidated subsidiaries, is based solely on the reports of the oth
statements of the Group as of and for the year ended December 31, 2010, were audited by us as per
our audit report dated March 10, 2011, where we expressed an unqualified opinion on those
statements. The financial statements on w
adjustments as described in Note 42 as required by the International Financial Reporting Standards
adopted by the Republic of Korea (“Korean
herein for comparative purposes
We conducted our audit in accordance with auditing standards generally accepted in the Republic of
Korea. Those standards require that we plan and perform the audit t
about whether the financial statements are free of material misstatement. An audit includes examining,
on a test basis, evidence supporting the amounts and disclosures in the financial statements. An audit
also includes assessing the accounting principles used and significant estimates made by
management, as well as evaluating the overall financial statement presentation. We believe that our
audit provides a reasonable basis for our opinion.
ga, Yongsan-gu, Seoul 140-702, Korea (Yongsan P.O Box 266, 140-600) www.samil.com
Samil PricewaterhouseCoopers is the Korean network firm of PricewaterhouseCoopers International Limited (PwCIL). "Pricewaterhto the network of member firms of PwCIL. Each member firm is a separate legal entity and does not act as an agent of PwCIL or any other member firm.
Report of Independent Auditors
To the Board of Directors and Shareholders of
accompanying consolidated statement of financial position of Hyosung
Corporation and its subsidiaries (the “Group”) as of December 31, 2011, and the related consolidated
comprehensive income, changes in equity and cash flows for the year then
ended, expressed in Korean won. These financial statements are the responsibility of the Group's
management. Our responsibility is to express an opinion on these financial statements based on our
audit. We did not audit the financial statements of Hyosung Capital and certain other consolidated
subsidiaries, whose financial statements represent 47.04% of the Group's consolidated total assets as
of December 31, 2011, and 40.70% of the Group's consolidated total sales for the year then ended
These statements were audited by other auditors whose reports have been furnished us and our
opinion, insofar as it relates to the amounts included for Hyosung Capital and certain other
consolidated subsidiaries, is based solely on the reports of the other auditors. The financial
as of and for the year ended December 31, 2010, were audited by us as per
our audit report dated March 10, 2011, where we expressed an unqualified opinion on those
statements. The financial statements on which we expressed an unqualified opinion do not reflect the
adjustments as described in Note 42 as required by the International Financial Reporting Standards
adopted by the Republic of Korea (“Korean IFRS”). However, the financial statements
erein for comparative purposes, reflect such adjustments in accordance with Korean
We conducted our audit in accordance with auditing standards generally accepted in the Republic of
Korea. Those standards require that we plan and perform the audit to obtain reasonable assurance
about whether the financial statements are free of material misstatement. An audit includes examining,
on a test basis, evidence supporting the amounts and disclosures in the financial statements. An audit
ing the accounting principles used and significant estimates made by
management, as well as evaluating the overall financial statement presentation. We believe that our
audit provides a reasonable basis for our opinion.
www.samil.com
Samil PricewaterhouseCoopers is the Korean network firm of PricewaterhouseCoopers International Limited (PwCIL). "PricewaterhouseCoopers" and "PwC" referd does not act as an agent of PwCIL or any other member firm.
accompanying consolidated statement of financial position of Hyosung
) as of December 31, 2011, and the related consolidated
for the year then
ended, expressed in Korean won. These financial statements are the responsibility of the Group's
management. Our responsibility is to express an opinion on these financial statements based on our
tements of Hyosung Capital and certain other consolidated
's consolidated total assets as
's consolidated total sales for the year then ended.
These statements were audited by other auditors whose reports have been furnished us and our
opinion, insofar as it relates to the amounts included for Hyosung Capital and certain other
The financial
as of and for the year ended December 31, 2010, were audited by us as per
our audit report dated March 10, 2011, where we expressed an unqualified opinion on those
hich we expressed an unqualified opinion do not reflect the
adjustments as described in Note 42 as required by the International Financial Reporting Standards
IFRS”). However, the financial statements, presented
ments in accordance with Korean IFRS.
We conducted our audit in accordance with auditing standards generally accepted in the Republic of
o obtain reasonable assurance
about whether the financial statements are free of material misstatement. An audit includes examining,
on a test basis, evidence supporting the amounts and disclosures in the financial statements. An audit
ing the accounting principles used and significant estimates made by
management, as well as evaluating the overall financial statement presentation. We believe that our
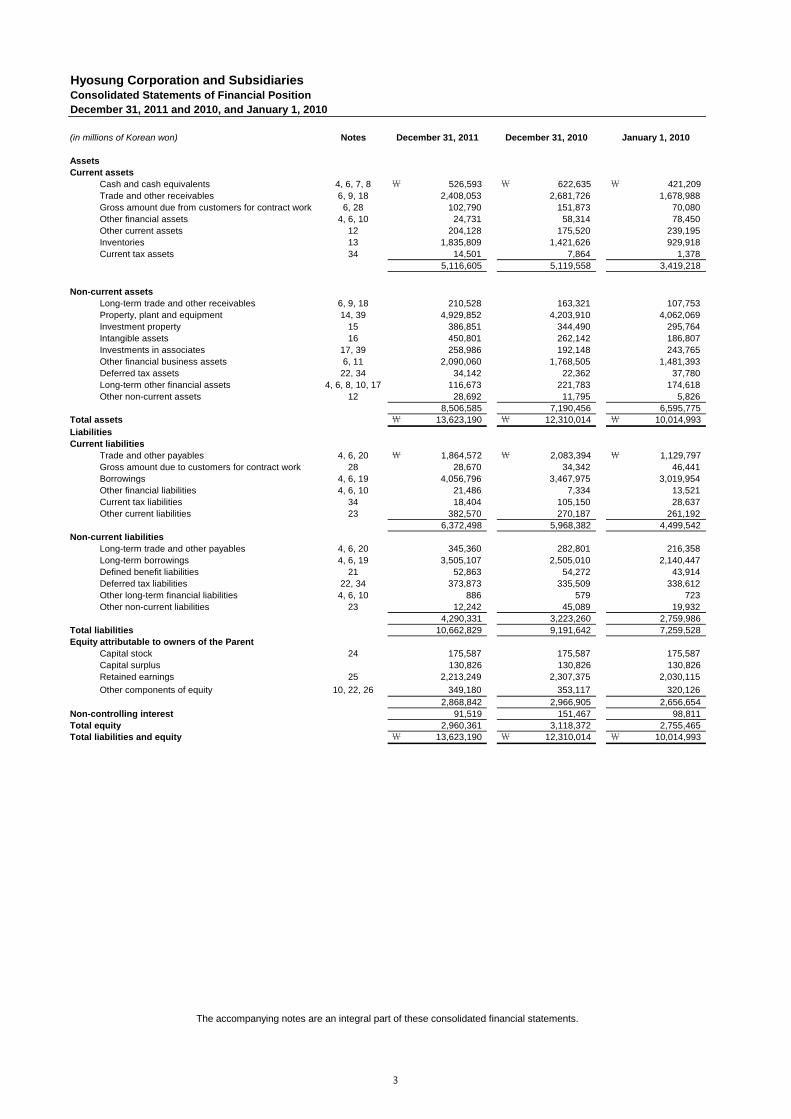
Hyosung Corporation and SubsidiariesConsolidated Statements of Financial Position
December 31, 2011 and 2010, and January 1, 2010
(in millions of Korean won) Notes
Assets
Current assets
Cash and cash equivalents 4, 6, 7, 8 \ 526,593 \ 622,635 \ 421,209
Trade and other receivables 6, 9, 18 2,408,053 2,681,726 1,678,988
Gross amount due from customers for contract work 6, 28 102,790 151,873 70,080
Other financial assets 4, 6, 10 24,731 58,314 78,450
Other current assets 12 204,128 175,520 239,195
Inventories 13 1,835,809 1,421,626 929,918
Current tax assets 34 14,501 7,864 1,378
5,116,605 5,119,558 3,419,218
Non-current assets
Long-term trade and other receivables 6, 9, 18 210,528 163,321 107,753
Property, plant and equipment 14, 39 4,929,852 4,203,910 4,062,069
Investment property 15 386,851 344,490 295,764
Intangible assets 16 450,801 262,142 186,807
Investments in associates 17, 39 258,986 192,148 243,765
Other financial business assets 6, 11 2,090,060 1,768,505 1,481,393
Deferred tax assets 22, 34 34,142 22,362 37,780
Long-term other financial assets 4, 6, 8, 10, 17 116,673 221,783 174,618
Other non-current assets 12 28,692 11,795 5,826
8,506,585 7,190,456 6,595,775
Total assets \ 13,623,190 \ 12,310,014 \ 10,014,993
Liabilities
Current liabilities
Trade and other payables 4, 6, 20 \ 1,864,572 \ 2,083,394 \ 1,129,797
Gross amount due to customers for contract work 28 28,670 34,342 46,441
Borrowings 4, 6, 19 4,056,796 3,467,975 3,019,954
Other financial liabilities 4, 6, 10 21,486 7,334 13,521
Current tax liabilities 34 18,404 105,150 28,637
Other current liabilities 23 382,570 270,187 261,192
6,372,498 5,968,382 4,499,542
Non-current liabilities
Long-term trade and other payables 4, 6, 20 345,360 282,801 216,358
Long-term borrowings 4, 6, 19 3,505,107 2,505,010 2,140,447
Defined benefit liabilities 21 52,863 54,272 43,914
Deferred tax liabilities 22, 34 373,873 335,509 338,612
Other long-term financial liabilities 4, 6, 10 886 579 723
Other non-current liabilities 23 12,242 45,089 19,932
4,290,331 3,223,260 2,759,986
Total liabilities 10,662,829 9,191,642 7,259,528
Equity attributable to owners of the Parent
Capital stock 24 175,587 175,587 175,587
Capital surplus 130,826 130,826 130,826
Retained earnings 25 2,213,249 2,307,375 2,030,115
Other components of equity 10, 22, 26 349,180 353,117 320,126
2,868,842 2,966,905 2,656,654
Non-controlling interest 91,519 151,467 98,811
Total equity 2,960,361 3,118,372 2,755,465
Total liabilities and equity \ 13,623,190 \ 12,310,014 \ 10,014,993
The accompanying notes are an integral part of these consolidated financial statements.
December 31, 2011 December 31, 2010 January 1, 2010
3
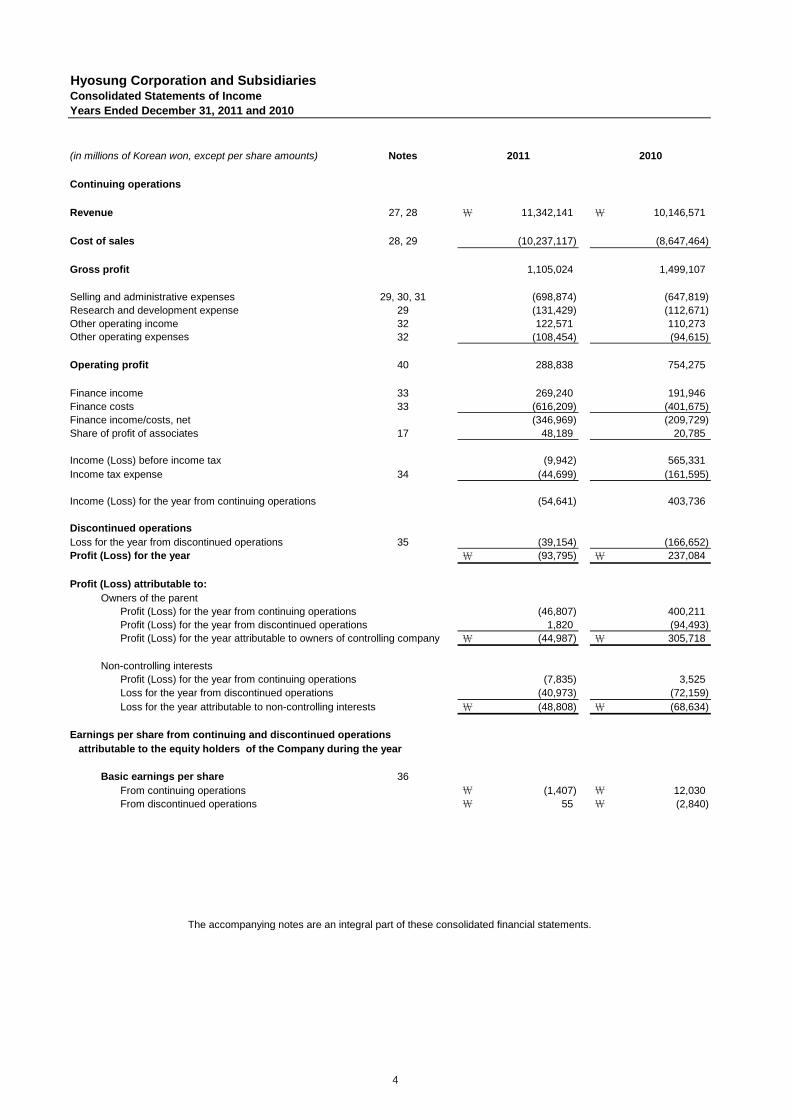
Hyosung Corporation and SubsidiariesConsolidated Statements of Income
Years Ended December 31, 2011 and 2010
Notes
Continuing operations
Revenue 27, 28 \ 11,342,141 \ 10,146,571
Cost of sales 28, 29 (10,237,117) (8,647,464)
Gross profit 1,105,024 1,499,107
Selling and administrative expenses 29, 30, 31 (698,874) (647,819)
Research and development expense 29 (131,429) (112,671)
Other operating income 32 122,571 110,273
Other operating expenses 32 (108,454) (94,615)
Operating profit 40 288,838 754,275
Finance income 33 269,240 191,946
Finance costs 33 (616,209) (401,675)
Finance income/costs, net (346,969) (209,729)
Share of profit of associates 17 48,189 20,785
Income (Loss) before income tax (9,942) 565,331
Income tax expense 34 (44,699) (161,595)
Income (Loss) for the year from continuing operations (54,641) 403,736
Discontinued operations
Loss for the year from discontinued operations 35 (39,154) (166,652)
Profit (Loss) for the year \ (93,795) \ 237,084
Profit (Loss) attributable to:
Owners of the parent
Profit (Loss) for the year from continuing operations (46,807) 400,211
Profit (Loss) for the year from discontinued operations 1,820 (94,493)
Profit (Loss) for the year attributable to owners of controlling company \ (44,987) \ 305,718
Non-controlling interests
Profit (Loss) for the year from continuing operations (7,835) 3,525
Loss for the year from discontinued operations (40,973) (72,159)
Loss for the year attributable to non-controlling interests \ (48,808) \ (68,634)
Earnings per share from continuing and discontinued operations
attributable to the equity holders of the Company during the year
Basic earnings per share 36
From continuing operations \ (1,407) \ 12,030
From discontinued operations \ 55 \ (2,840)
The accompanying notes are an integral part of these consolidated financial statements.
(in millions of Korean won, except per share amounts) 2011 2010
4
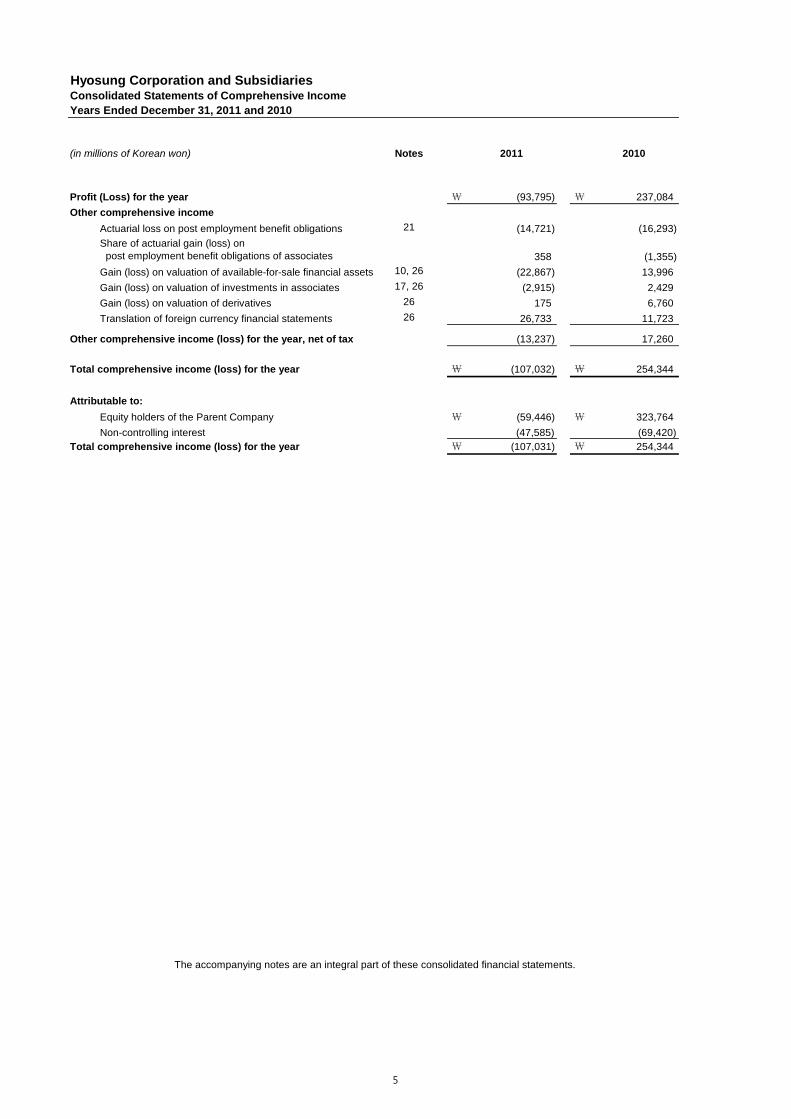
Hyosung Corporation and SubsidiariesConsolidated Statements of Comprehensive Income
Years Ended December 31, 2011 and 2010
Notes 2011 2010
Profit (Loss) for the year \ (93,795) \ 237,084
Other comprehensive income
Actuarial loss on post employment benefit obligations 21 (14,721) (16,293)
358 (1,355)
Gain (loss) on valuation of available-for-sale financial assets 10, 26 (22,867) 13,996
Gain (loss) on valuation of investments in associates 17, 26 (2,915) 2,429
Gain (loss) on valuation of derivatives 26 175 6,760
Translation of foreign currency financial statements 26 26,733 11,723
Other comprehensive income (loss) for the year, net of tax (13,237) 17,260
Total comprehensive income (loss) for the year \ (107,032) \ 254,344
Attributable to:
Equity holders of the Parent Company \ (59,446) \ 323,764
Non-controlling interest (47,585) (69,420)
Total comprehensive income (loss) for the year \ (107,031) \ 254,344
The accompanying notes are an integral part of these consolidated financial statements.
(in millions of Korean won)
Share of actuarial gain (loss) onpost employment benefit obligations of associates
5
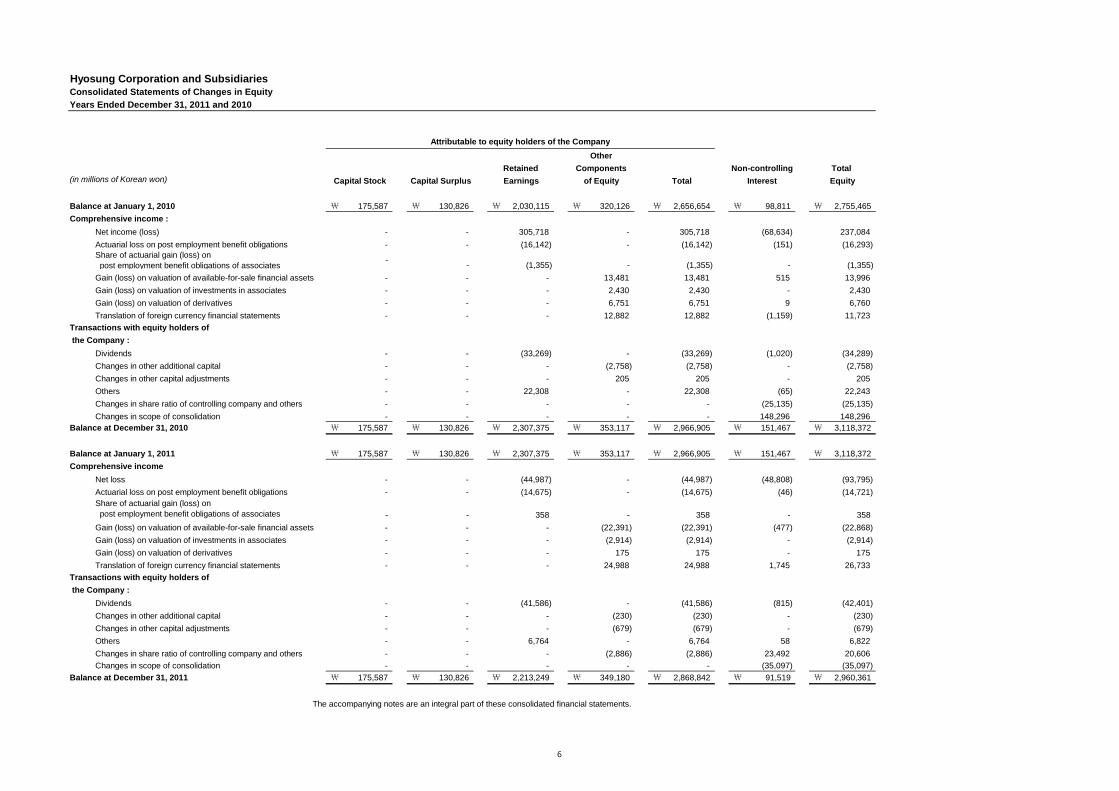
Hyosung Corporation and SubsidiariesConsolidated Statements of Changes in Equity
Years Ended December 31, 2011 and 2010
(in millions of Korean won)
Balance at January 1, 2010 \ 175,587 \ 130,826 \ 2,030,115 \ 320,126 \ 2,656,654 \ 98,811 \ 2,755,465
Comprehensive income :
Net income (loss) - - 305,718 - 305,718 (68,634) 237,084
Actuarial loss on post employment benefit obligations - - (16,142) - (16,142) (151) (16,293)
Share of actuarial gain (loss) on
post employment benefit obligations of associates-
- (1,355) - (1,355) - (1,355)
Gain (loss) on valuation of available-for-sale financial assets - - - 13,481 13,481 515 13,996
Gain (loss) on valuation of investments in associates - - - 2,430 2,430 - 2,430
Gain (loss) on valuation of derivatives - - - 6,751 6,751 9 6,760
Translation of foreign currency financial statements - - - 12,882 12,882 (1,159) 11,723
Transactions with equity holders of
the Company :
Dividends - - (33,269) - (33,269) (1,020) (34,289)
Changes in other additional capital - - - (2,758) (2,758) - (2,758)
Changes in other capital adjustments - - - 205 205 - 205
Others - - 22,308 - 22,308 (65) 22,243
Changes in share ratio of controlling company and others - - - - - (25,135) (25,135)
Changes in scope of consolidation - - - - - 148,296 148,296
Balance at December 31, 2010 \ 175,587 \ 130,826 \ 2,307,375 \ 353,117 \ 2,966,905 \ 151,467 \ 3,118,372
Balance at January 1, 2011 \ 175,587 \ 130,826 \ 2,307,375 \ 353,117 \ 2,966,905 \ 151,467 \ 3,118,372
Comprehensive income
Net loss - - (44,987) - (44,987) (48,808) (93,795)
Actuarial loss on post employment benefit obligations - - (14,675) - (14,675) (46) (14,721)
Share of actuarial gain (loss) on
post employment benefit obligations of associates - - 358 - 358 - 358
Gain (loss) on valuation of available-for-sale financial assets - - - (22,391) (22,391) (477) (22,868)
Gain (loss) on valuation of investments in associates - - - (2,914) (2,914) - (2,914)
Gain (loss) on valuation of derivatives - - - 175 175 - 175
Translation of foreign currency financial statements - - - 24,988 24,988 1,745 26,733
Transactions with equity holders of
the Company :
Dividends - - (41,586) - (41,586) (815) (42,401)
Changes in other additional capital - - - (230) (230) - (230)
Changes in other capital adjustments - - - (679) (679) - (679)
Others - - 6,764 - 6,764 58 6,822
Changes in share ratio of controlling company and others - - - (2,886) (2,886) 23,492 20,606
Changes in scope of consolidation - - - - - (35,097) (35,097)
Balance at December 31, 2011 \ 175,587 \ 130,826 \ 2,213,249 \ 349,180 \ 2,868,842 \ 91,519 \ 2,960,361
Non-controlling
Interest
Total
EquityCapital SurplusCapital Stock Earnings of Equity Total
The accompanying notes are an integral part of these consolidated financial statements.
Attributable to equity holders of the Company
Other
Retained Components
6
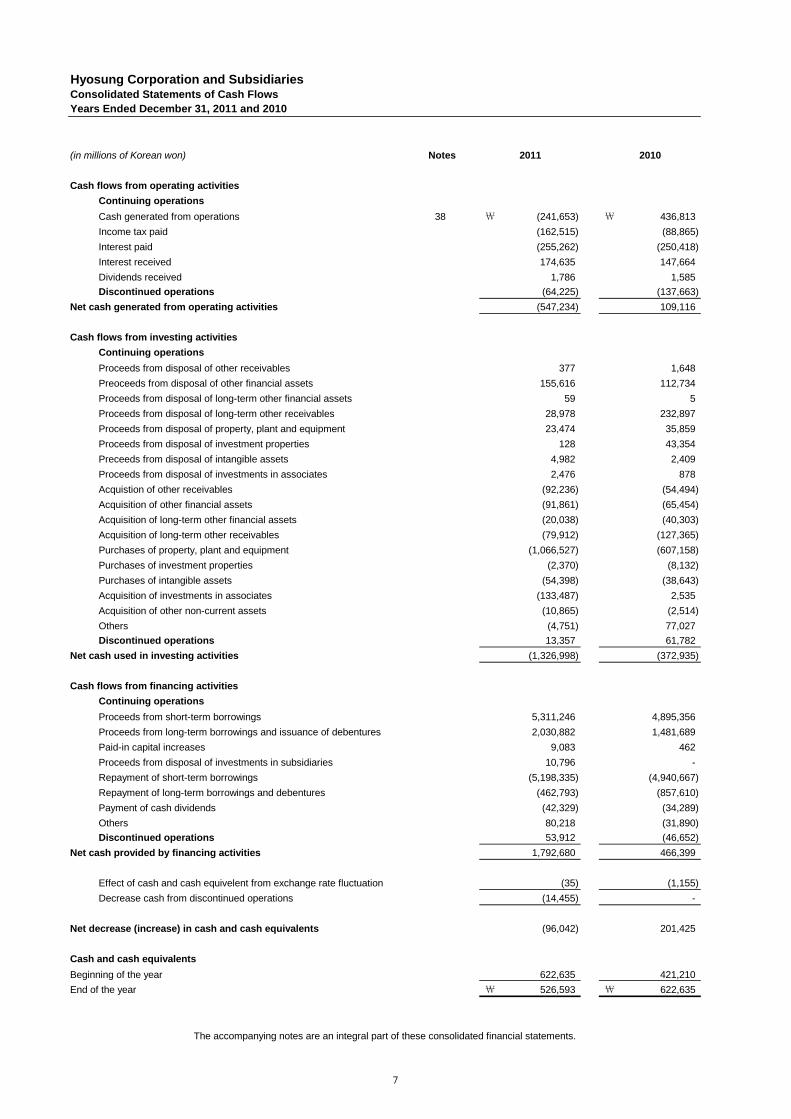
Hyosung Corporation and SubsidiariesConsolidated Statements of Cash Flows
Years Ended December 31, 2011 and 2010
(in millions of Korean won) Notes
Cash flows from operating activities
Continuing operations
Cash generated from operations 38 \ (241,653) \ 436,813
Income tax paid (162,515) (88,865)
Interest paid (255,262) (250,418)
Interest received 174,635 147,664
Dividends received 1,786 1,585
Discontinued operations (64,225) (137,663)
Net cash generated from operating activities (547,234) 109,116
Cash flows from investing activities
Continuing operations
Proceeds from disposal of other receivables 377 1,648
Preoceeds from disposal of other financial assets 155,616 112,734
Proceeds from disposal of long-term other financial assets 59 5
Proceeds from disposal of long-term other receivables 28,978 232,897
Proceeds from disposal of property, plant and equipment 23,474 35,859
Proceeds from disposal of investment properties 128 43,354
Preceeds from disposal of intangible assets 4,982 2,409
Proceeds from disposal of investments in associates 2,476 878
Acquistion of other receivables (92,236) (54,494)
Acquisition of other financial assets (91,861) (65,454)
Acquisition of long-term other financial assets (20,038) (40,303)
Acquisition of long-term other receivables (79,912) (127,365)
Purchases of property, plant and equipment (1,066,527) (607,158)
Purchases of investment properties (2,370) (8,132)
Purchases of intangible assets (54,398) (38,643)
Acquisition of investments in associates (133,487) 2,535
Acquisition of other non-current assets (10,865) (2,514)
Others (4,751) 77,027
Discontinued operations 13,357 61,782
Net cash used in investing activities (1,326,998) (372,935)
Cash flows from financing activities
Continuing operations
Proceeds from short-term borrowings 5,311,246 4,895,356
Proceeds from long-term borrowings and issuance of debentures 2,030,882 1,481,689
Paid-in capital increases 9,083 462
Proceeds from disposal of investments in subsidiaries 10,796 -
Repayment of short-term borrowings (5,198,335) (4,940,667)
Repayment of long-term borrowings and debentures (462,793) (857,610)
Payment of cash dividends (42,329) (34,289)
Others 80,218 (31,890)
Discontinued operations 53,912 (46,652)
Net cash provided by financing activities 1,792,680 466,399
Effect of cash and cash equivelent from exchange rate fluctuation (35) (1,155)
Decrease cash from discontinued operations (14,455) -
Net decrease (increase) in cash and cash equivalents (96,042) 201,425
Cash and cash equivalents
Beginning of the year 622,635 421,210
End of the year \ 526,593 \ 622,635
2011 2010
The accompanying notes are an integral part of these consolidated financial statements.
7
Hyosung Corporation and SubsidiariesNotes to Consolidated Financial StatementsDecember 31, 2011 and 2010, and January 1, 2010
8
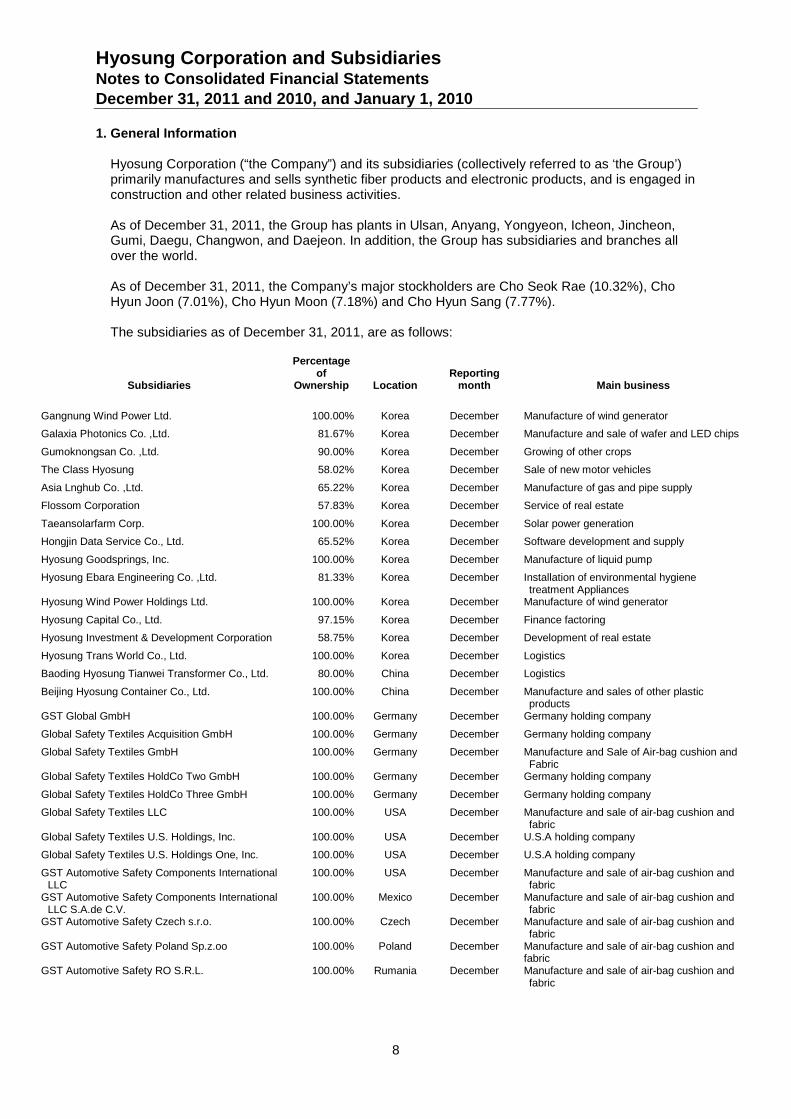
1. General Information
Hyosung Corporation (“the Company”) and its subsidiaries (collectively referred to as ‘the Group’)primarily manufactures and sells synthetic fiber products and electronic products, and is engaged inconstruction and other related business activities.
As of December 31, 2011, the Group has plants in Ulsan, Anyang, Yongyeon, Icheon, Jincheon,Gumi, Daegu, Changwon, and Daejeon. In addition, the Group has subsidiaries and branches allover the world.
As of December 31, 2011, the Company’s major stockholders are Cho Seok Rae (10.32%), ChoHyun Joon (7.01%), Cho Hyun Moon (7.18%) and Cho Hyun Sang (7.77%).
The subsidiaries as of December 31, 2011, are as follows:
Subsidiaries
Percentageof
Ownership LocationReporting
month Main business
Gangnung Wind Power Ltd. 100.00% Korea December Manufacture of wind generator
Galaxia Photonics Co. ,Ltd. 81.67% Korea December Manufacture and sale of wafer and LED chips
Gumoknongsan Co. ,Ltd. 90.00% Korea December Growing of other crops
The Class Hyosung 58.02% Korea December Sale of new motor vehicles
Asia Lnghub Co. ,Ltd. 65.22% Korea December Manufacture of gas and pipe supply
Flossom Corporation 57.83% Korea December Service of real estate
Taeansolarfarm Corp. 100.00% Korea December Solar power generation
Hongjin Data Service Co., Ltd. 65.52% Korea December Software development and supply
Hyosung Goodsprings, Inc. 100.00% Korea December Manufacture of liquid pump
Hyosung Ebara Engineering Co. ,Ltd. 81.33% Korea December Installation of environmental hygienetreatment Appliances
Hyosung Wind Power Holdings Ltd. 100.00% Korea December Manufacture of wind generator
Hyosung Capital Co., Ltd. 97.15% Korea December Finance factoring
Hyosung Investment & Development Corporation 58.75% Korea December Development of real estate
Hyosung Trans World Co., Ltd. 100.00% Korea December Logistics
Baoding Hyosung Tianwei Transformer Co., Ltd. 80.00% China December Logistics
Beijing Hyosung Container Co., Ltd. 100.00% China December Manufacture and sales of other plasticproducts
GST Global GmbH 100.00% Germany December Germany holding company
Global Safety Textiles Acquisition GmbH 100.00% Germany December Germany holding company
Global Safety Textiles GmbH 100.00% Germany December Manufacture and Sale of Air-bag cushion andFabric
Global Safety Textiles HoldCo Two GmbH 100.00% Germany December Germany holding company
Global Safety Textiles HoldCo Three GmbH 100.00% Germany December Germany holding company
Global Safety Textiles LLC 100.00% USA December Manufacture and sale of air-bag cushion andfabric
Global Safety Textiles U.S. Holdings, Inc. 100.00% USA December U.S.A holding company
Global Safety Textiles U.S. Holdings One, Inc. 100.00% USA December U.S.A holding company
GST Automotive Safety Components InternationalLLC
100.00% USA December Manufacture and sale of air-bag cushion andfabric
GST Automotive Safety Components InternationalLLC S.A.de C.V.
100.00% Mexico December Manufacture and sale of air-bag cushion andfabric
GST Automotive Safety Czech s.r.o. 100.00% Czech December Manufacture and sale of air-bag cushion andfabric
GST Automotive Safety Poland Sp.z.oo 100.00% Poland December Manufacture and sale of air-bag cushion andfabric
GST Automotive Safety RO S.R.L. 100.00% Rumania December Manufacture and sale of air-bag cushion andfabric
Hyosung Corporation and SubsidiariesNotes to Consolidated Financial StatementsDecember 31, 2011 and 2010, and January 1, 2010
9
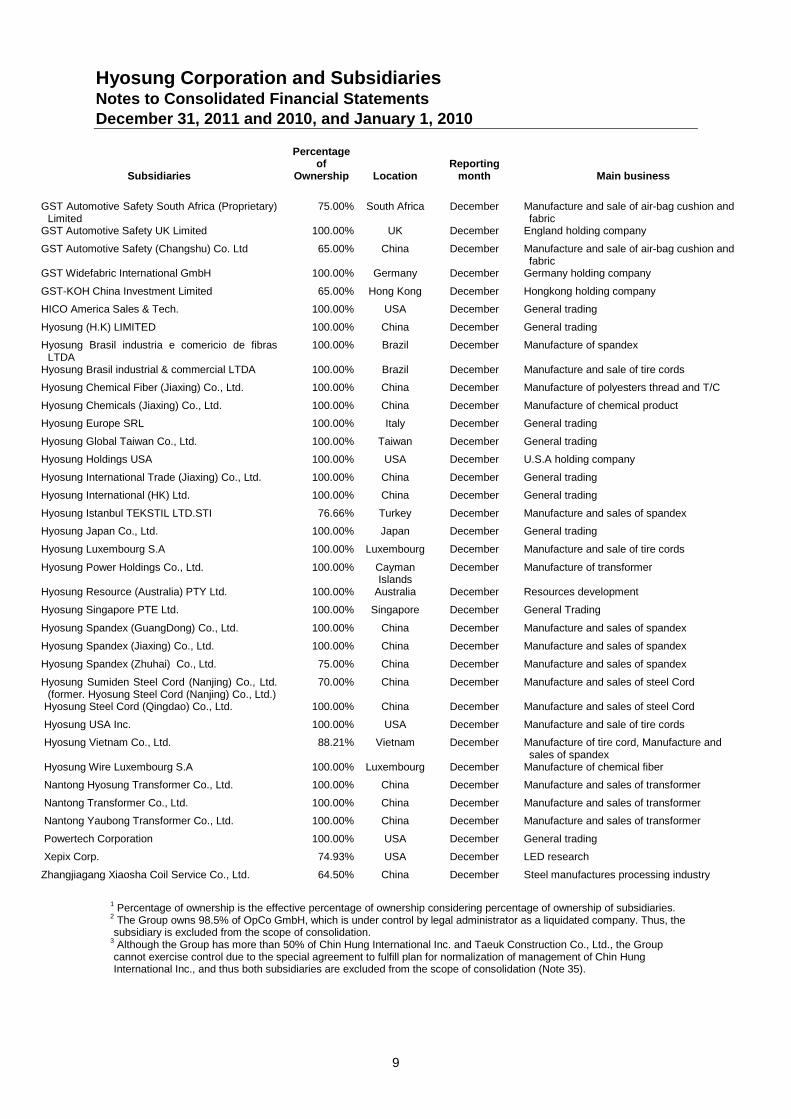
Subsidiaries
Percentageof
Ownership LocationReporting
month Main business
GST Automotive Safety South Africa (Proprietary)Limited
75.00% South Africa December Manufacture and sale of air-bag cushion andfabric
GST Automotive Safety UK Limited 100.00% UK December England holding company
GST Automotive Safety (Changshu) Co. Ltd 65.00% China December Manufacture and sale of air-bag cushion andfabric
GST Widefabric International GmbH 100.00% Germany December Germany holding company
GST-KOH China Investment Limited 65.00% Hong Kong December Hongkong holding company
HICO America Sales & Tech. 100.00% USA December General trading
Hyosung (H.K) LIMITED 100.00% China December General trading
Hyosung Brasil industria e comericio de fibrasLTDA
100.00% Brazil December Manufacture of spandex
Hyosung Brasil industrial & commercial LTDA 100.00% Brazil December Manufacture and sale of tire cords
Hyosung Chemical Fiber (Jiaxing) Co., Ltd. 100.00% China December Manufacture of polyesters thread and T/C
Hyosung Chemicals (Jiaxing) Co., Ltd. 100.00% China December Manufacture of chemical product
Hyosung Europe SRL 100.00% Italy December General trading
Hyosung Global Taiwan Co., Ltd. 100.00% Taiwan December General trading
Hyosung Holdings USA 100.00% USA December U.S.A holding company
Hyosung International Trade (Jiaxing) Co., Ltd. 100.00% China December General trading
Hyosung International (HK) Ltd. 100.00% China December General trading
Hyosung Istanbul TEKSTIL LTD.STI 76.66% Turkey December Manufacture and sales of spandex
Hyosung Japan Co., Ltd. 100.00% Japan December General trading
Hyosung Luxembourg S.A 100.00% Luxembourg December Manufacture and sale of tire cords
Hyosung Power Holdings Co., Ltd. 100.00% CaymanIslands
December Manufacture of transformer
Hyosung Resource (Australia) PTY Ltd. 100.00% Australia December Resources development
Hyosung Singapore PTE Ltd. 100.00% Singapore December General Trading
Hyosung Spandex (GuangDong) Co., Ltd. 100.00% China December Manufacture and sales of spandex
Hyosung Spandex (Jiaxing) Co., Ltd. 100.00% China December Manufacture and sales of spandex
Hyosung Spandex (Zhuhai) Co., Ltd. 75.00% China December Manufacture and sales of spandex
Hyosung Sumiden Steel Cord (Nanjing) Co., Ltd.(former. Hyosung Steel Cord (Nanjing) Co., Ltd.)
70.00% China December Manufacture and sales of steel Cord
Hyosung Steel Cord (Qingdao) Co., Ltd. 100.00% China December Manufacture and sales of steel Cord
Hyosung USA Inc. 100.00% USA December Manufacture and sale of tire cords
Hyosung Vietnam Co., Ltd. 88.21% Vietnam December Manufacture of tire cord, Manufacture andsales of spandex
Hyosung Wire Luxembourg S.A 100.00% Luxembourg December Manufacture of chemical fiber
Nantong Hyosung Transformer Co., Ltd. 100.00% China December Manufacture and sales of transformer
Nantong Transformer Co., Ltd. 100.00% China December Manufacture and sales of transformer
Nantong Yaubong Transformer Co., Ltd. 100.00% China December Manufacture and sales of transformer
Powertech Corporation 100.00% USA December General trading
Xepix Corp. 74.93% USA December LED research
Zhangjiagang Xiaosha Coil Service Co., Ltd. 64.50% China December Steel manufactures processing industry
1 Percentage of ownership is the effective percentage of ownership considering percentage of ownership of subsidiaries.2 The Group owns 98.5% of OpCo GmbH, which is under control by legal administrator as a liquidated company. Thus, thesubsidiary is excluded from the scope of consolidation.
3 Although the Group has more than 50% of Chin Hung International Inc. and Taeuk Construction Co., Ltd., the Groupcannot exercise control due to the special agreement to fulfill plan for normalization of management of Chin HungInternational Inc., and thus both subsidiaries are excluded from the scope of consolidation (Note 35).
Hyosung Corporation and SubsidiariesNotes to Consolidated Financial StatementsDecember 31, 2011 and 2010, and January 1, 2010
10
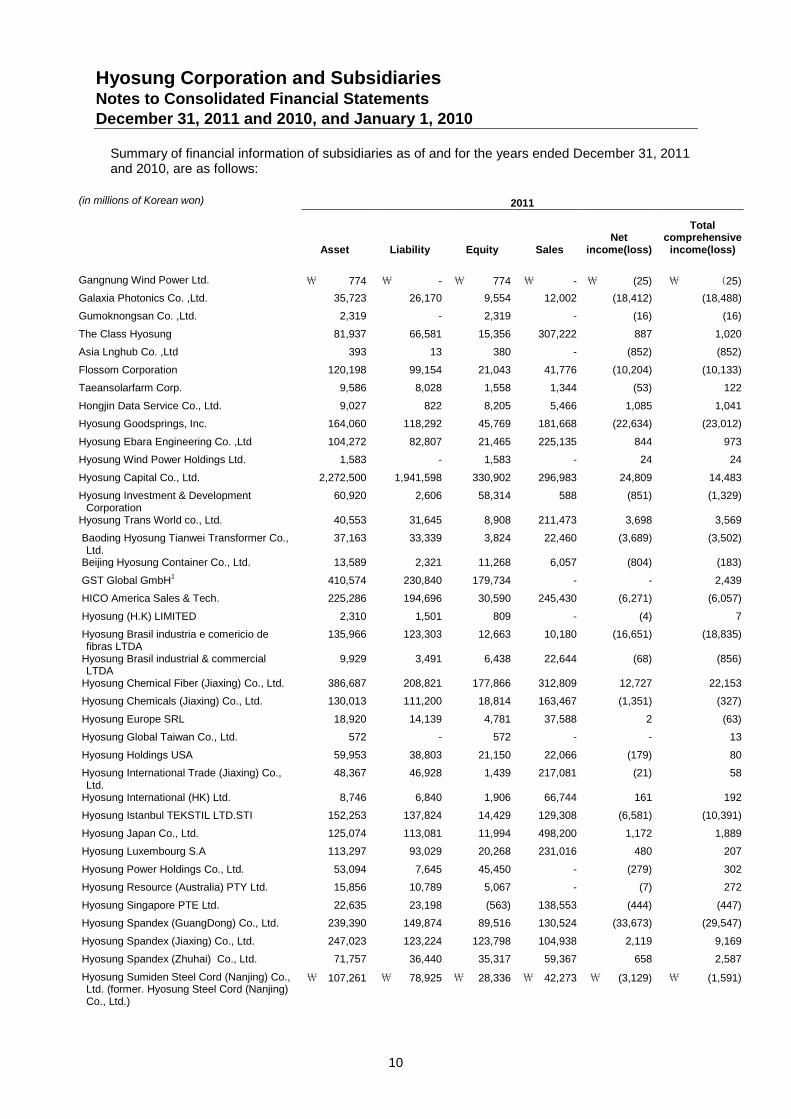
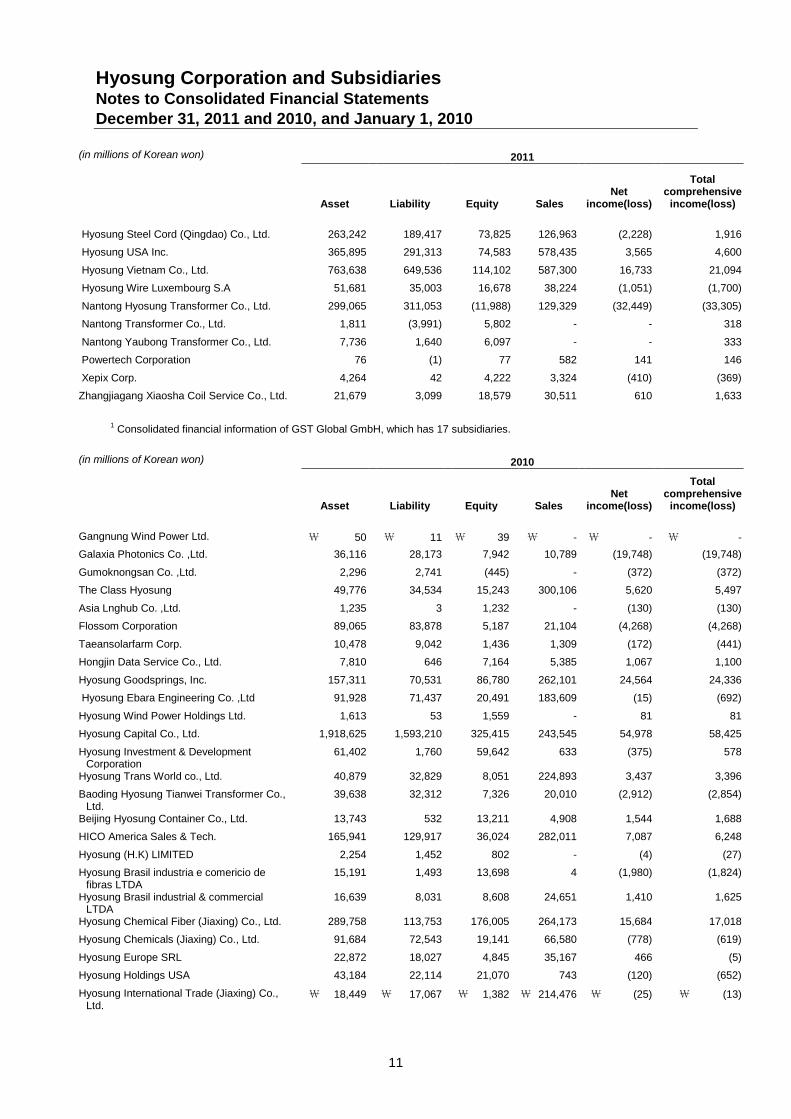
Summary of financial information of subsidiaries as of and for the years ended December 31, 2011and 2010, are as follows:
(in millions of Korean won) 2011
Asset Liability Equity SalesNet
income(loss)
Totalcomprehensive
income(loss)
Gangnung Wind Power Ltd. \ 774 \ - \ 774 \ - \ (25) \ (25)
Galaxia Photonics Co. ,Ltd. 35,723 26,170 9,554 12,002 (18,412) (18,488)
Gumoknongsan Co. ,Ltd. 2,319 - 2,319 - (16) (16)
The Class Hyosung 81,937 66,581 15,356 307,222 887 1,020
Asia Lnghub Co. ,Ltd 393 13 380 - (852) (852)
Flossom Corporation 120,198 99,154 21,043 41,776 (10,204) (10,133)
Taeansolarfarm Corp. 9,586 8,028 1,558 1,344 (53) 122
Hongjin Data Service Co., Ltd. 9,027 822 8,205 5,466 1,085 1,041
Hyosung Goodsprings, Inc. 164,060 118,292 45,769 181,668 (22,634) (23,012)
Hyosung Ebara Engineering Co. ,Ltd 104,272 82,807 21,465 225,135 844 973
Hyosung Wind Power Holdings Ltd. 1,583 - 1,583 - 24 24
Hyosung Capital Co., Ltd. 2,272,500 1,941,598 330,902 296,983 24,809 14,483
Hyosung Investment & DevelopmentCorporation
60,920 2,606 58,314 588 (851) (1,329)
Hyosung Trans World co., Ltd. 40,553 31,645 8,908 211,473 3,698 3,569
Baoding Hyosung Tianwei Transformer Co.,Ltd.
37,163 33,339 3,824 22,460 (3,689) (3,502)
Beijing Hyosung Container Co., Ltd. 13,589 2,321 11,268 6,057 (804) (183)
GST Global GmbH1 410,574 230,840 179,734 - - 2,439
HICO America Sales & Tech. 225,286 194,696 30,590 245,430 (6,271) (6,057)
Hyosung (H.K) LIMITED 2,310 1,501 809 - (4) 7
Hyosung Brasil industria e comericio defibras LTDA
135,966 123,303 12,663 10,180 (16,651) (18,835)
Hyosung Brasil industrial & commercialLTDA
9,929 3,491 6,438 22,644 (68) (856)
Hyosung Chemical Fiber (Jiaxing) Co., Ltd. 386,687 208,821 177,866 312,809 12,727 22,153
Hyosung Chemicals (Jiaxing) Co., Ltd. 130,013 111,200 18,814 163,467 (1,351) (327)
Hyosung Europe SRL 18,920 14,139 4,781 37,588 2 (63)
Hyosung Global Taiwan Co., Ltd. 572 - 572 - - 13
Hyosung Holdings USA 59,953 38,803 21,150 22,066 (179) 80
Hyosung International Trade (Jiaxing) Co.,Ltd.
48,367 46,928 1,439 217,081 (21) 58
Hyosung International (HK) Ltd. 8,746 6,840 1,906 66,744 161 192
Hyosung Istanbul TEKSTIL LTD.STI 152,253 137,824 14,429 129,308 (6,581) (10,391)
Hyosung Japan Co., Ltd. 125,074 113,081 11,994 498,200 1,172 1,889
Hyosung Luxembourg S.A 113,297 93,029 20,268 231,016 480 207
Hyosung Power Holdings Co., Ltd. 53,094 7,645 45,450 - (279) 302
Hyosung Resource (Australia) PTY Ltd. 15,856 10,789 5,067 - (7) 272
Hyosung Singapore PTE Ltd. 22,635 23,198 (563) 138,553 (444) (447)
Hyosung Spandex (GuangDong) Co., Ltd. 239,390 149,874 89,516 130,524 (33,673) (29,547)
Hyosung Spandex (Jiaxing) Co., Ltd. 247,023 123,224 123,798 104,938 2,119 9,169
Hyosung Spandex (Zhuhai) Co., Ltd. 71,757 36,440 35,317 59,367 658 2,587
Hyosung Sumiden Steel Cord (Nanjing) Co.,Ltd. (former. Hyosung Steel Cord (Nanjing)Co., Ltd.)
\ 107,261 \ 78,925 \ 28,336 \ 42,273 \ (3,129) \ (1,591)
Hyosung Corporation and SubsidiariesNotes to Consolidated Financial StatementsDecember 31, 2011 and 2010, and January 1, 2010
11
(in millions of Korean won) 2011
Asset Liability Equity SalesNet
income(loss)
Totalcomprehensive
income(loss)
Hyosung Steel Cord (Qingdao) Co., Ltd. 263,242 189,417 73,825 126,963 (2,228) 1,916
Hyosung USA Inc. 365,895 291,313 74,583 578,435 3,565 4,600
Hyosung Vietnam Co., Ltd. 763,638 649,536 114,102 587,300 16,733 21,094
Hyosung Wire Luxembourg S.A 51,681 35,003 16,678 38,224 (1,051) (1,700)
Nantong Hyosung Transformer Co., Ltd. 299,065 311,053 (11,988) 129,329 (32,449) (33,305)
Nantong Transformer Co., Ltd. 1,811 (3,991) 5,802 - - 318
Nantong Yaubong Transformer Co., Ltd. 7,736 1,640 6,097 - - 333
Powertech Corporation 76 (1) 77 582 141 146
Xepix Corp. 4,264 42 4,222 3,324 (410) (369)
Zhangjiagang Xiaosha Coil Service Co., Ltd. 21,679 3,099 18,579 30,511 610 1,633
1 Consolidated financial information of GST Global GmbH, which has 17 subsidiaries.
(in millions of Korean won) 2010
Asset Liability Equity SalesNet
income(loss)
Totalcomprehensive
income(loss)
Gangnung Wind Power Ltd. \ 50 \ 11 \ 39 \ - \ - \ -
Galaxia Photonics Co. ,Ltd. 36,116 28,173 7,942 10,789 (19,748) (19,748)
Gumoknongsan Co. ,Ltd. 2,296 2,741 (445) - (372) (372)
The Class Hyosung 49,776 34,534 15,243 300,106 5,620 5,497
Asia Lnghub Co. ,Ltd. 1,235 3 1,232 - (130) (130)
Flossom Corporation 89,065 83,878 5,187 21,104 (4,268) (4,268)
Taeansolarfarm Corp. 10,478 9,042 1,436 1,309 (172) (441)
Hongjin Data Service Co., Ltd. 7,810 646 7,164 5,385 1,067 1,100
Hyosung Goodsprings, Inc. 157,311 70,531 86,780 262,101 24,564 24,336
Hyosung Ebara Engineering Co. ,Ltd 91,928 71,437 20,491 183,609 (15) (692)
Hyosung Wind Power Holdings Ltd. 1,613 53 1,559 - 81 81
Hyosung Capital Co., Ltd. 1,918,625 1,593,210 325,415 243,545 54,978 58,425
Hyosung Investment & DevelopmentCorporation
61,402 1,760 59,642 633 (375) 578
Hyosung Trans World co., Ltd. 40,879 32,829 8,051 224,893 3,437 3,396
Baoding Hyosung Tianwei Transformer Co.,Ltd.
39,638 32,312 7,326 20,010 (2,912) (2,854)
Beijing Hyosung Container Co., Ltd. 13,743 532 13,211 4,908 1,544 1,688
HICO America Sales & Tech. 165,941 129,917 36,024 282,011 7,087 6,248
Hyosung (H.K) LIMITED 2,254 1,452 802 - (4) (27)
Hyosung Brasil industria e comericio defibras LTDA
15,191 1,493 13,698 4 (1,980) (1,824)
Hyosung Brasil industrial & commercialLTDA
16,639 8,031 8,608 24,651 1,410 1,625
Hyosung Chemical Fiber (Jiaxing) Co., Ltd. 289,758 113,753 176,005 264,173 15,684 17,018
Hyosung Chemicals (Jiaxing) Co., Ltd. 91,684 72,543 19,141 66,580 (778) (619)
Hyosung Europe SRL 22,872 18,027 4,845 35,167 466 (5)
Hyosung Holdings USA 43,184 22,114 21,070 743 (120) (652)
Hyosung International Trade (Jiaxing) Co.,Ltd.
\ 18,449 \ 17,067 \ 1,382 \ 214,476 \ (25) \ (13)
Hyosung Corporation and SubsidiariesNotes to Consolidated Financial StatementsDecember 31, 2011 and 2010, and January 1, 2010
12
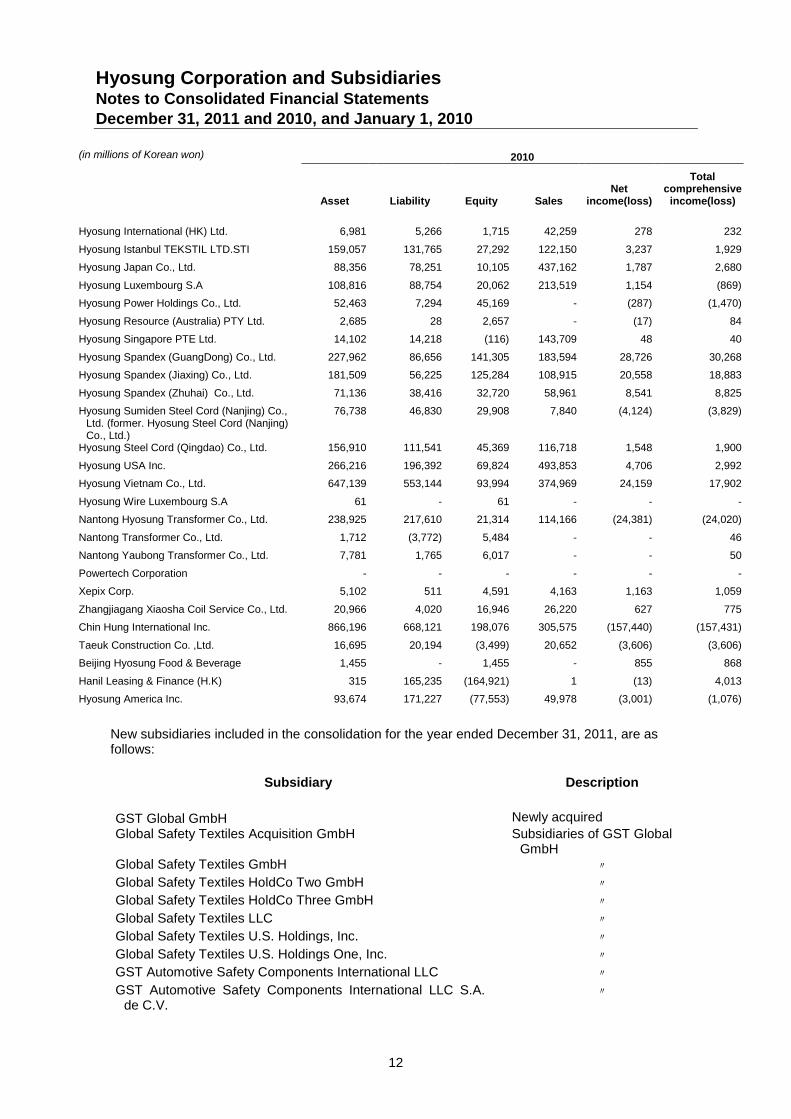
(in millions of Korean won) 2010
Asset Liability Equity SalesNet
income(loss)
Totalcomprehensive
income(loss)
Hyosung International (HK) Ltd. 6,981 5,266 1,715 42,259 278 232
Hyosung Istanbul TEKSTIL LTD.STI 159,057 131,765 27,292 122,150 3,237 1,929
Hyosung Japan Co., Ltd. 88,356 78,251 10,105 437,162 1,787 2,680
Hyosung Luxembourg S.A 108,816 88,754 20,062 213,519 1,154 (869)
Hyosung Power Holdings Co., Ltd. 52,463 7,294 45,169 - (287) (1,470)
Hyosung Resource (Australia) PTY Ltd. 2,685 28 2,657 - (17) 84
Hyosung Singapore PTE Ltd. 14,102 14,218 (116) 143,709 48 40
Hyosung Spandex (GuangDong) Co., Ltd. 227,962 86,656 141,305 183,594 28,726 30,268
Hyosung Spandex (Jiaxing) Co., Ltd. 181,509 56,225 125,284 108,915 20,558 18,883
Hyosung Spandex (Zhuhai) Co., Ltd. 71,136 38,416 32,720 58,961 8,541 8,825
Hyosung Sumiden Steel Cord (Nanjing) Co.,Ltd. (former. Hyosung Steel Cord (Nanjing)Co., Ltd.)
76,738 46,830 29,908 7,840 (4,124) (3,829)
Hyosung Steel Cord (Qingdao) Co., Ltd. 156,910 111,541 45,369 116,718 1,548 1,900
Hyosung USA Inc. 266,216 196,392 69,824 493,853 4,706 2,992
Hyosung Vietnam Co., Ltd. 647,139 553,144 93,994 374,969 24,159 17,902
Hyosung Wire Luxembourg S.A 61 - 61 - - -
Nantong Hyosung Transformer Co., Ltd. 238,925 217,610 21,314 114,166 (24,381) (24,020)
Nantong Transformer Co., Ltd. 1,712 (3,772) 5,484 - - 46
Nantong Yaubong Transformer Co., Ltd. 7,781 1,765 6,017 - - 50
Powertech Corporation - - - - - -
Xepix Corp. 5,102 511 4,591 4,163 1,163 1,059
Zhangjiagang Xiaosha Coil Service Co., Ltd. 20,966 4,020 16,946 26,220 627 775
Chin Hung International Inc. 866,196 668,121 198,076 305,575 (157,440) (157,431)
Taeuk Construction Co. ,Ltd. 16,695 20,194 (3,499) 20,652 (3,606) (3,606)
Beijing Hyosung Food & Beverage 1,455 - 1,455 - 855 868
Hanil Leasing & Finance (H.K) 315 165,235 (164,921) 1 (13) 4,013
Hyosung America Inc. 93,674 171,227 (77,553) 49,978 (3,001) (1,076)
New subsidiaries included in the consolidation for the year ended December 31, 2011, are asfollows:
Subsidiary Description
GST Global GmbH Newly acquired
Global Safety Textiles Acquisition GmbH Subsidiaries of GST GlobalGmbH
Global Safety Textiles GmbH 〃
Global Safety Textiles HoldCo Two GmbH 〃
Global Safety Textiles HoldCo Three GmbH 〃
Global Safety Textiles LLC 〃
Global Safety Textiles U.S. Holdings, Inc. 〃
Global Safety Textiles U.S. Holdings One, Inc. 〃
GST Automotive Safety Components International LLC 〃
GST Automotive Safety Components International LLC S.A.de C.V.
〃
Hyosung Corporation and SubsidiariesNotes to Consolidated Financial StatementsDecember 31, 2011 and 2010, and January 1, 2010
13
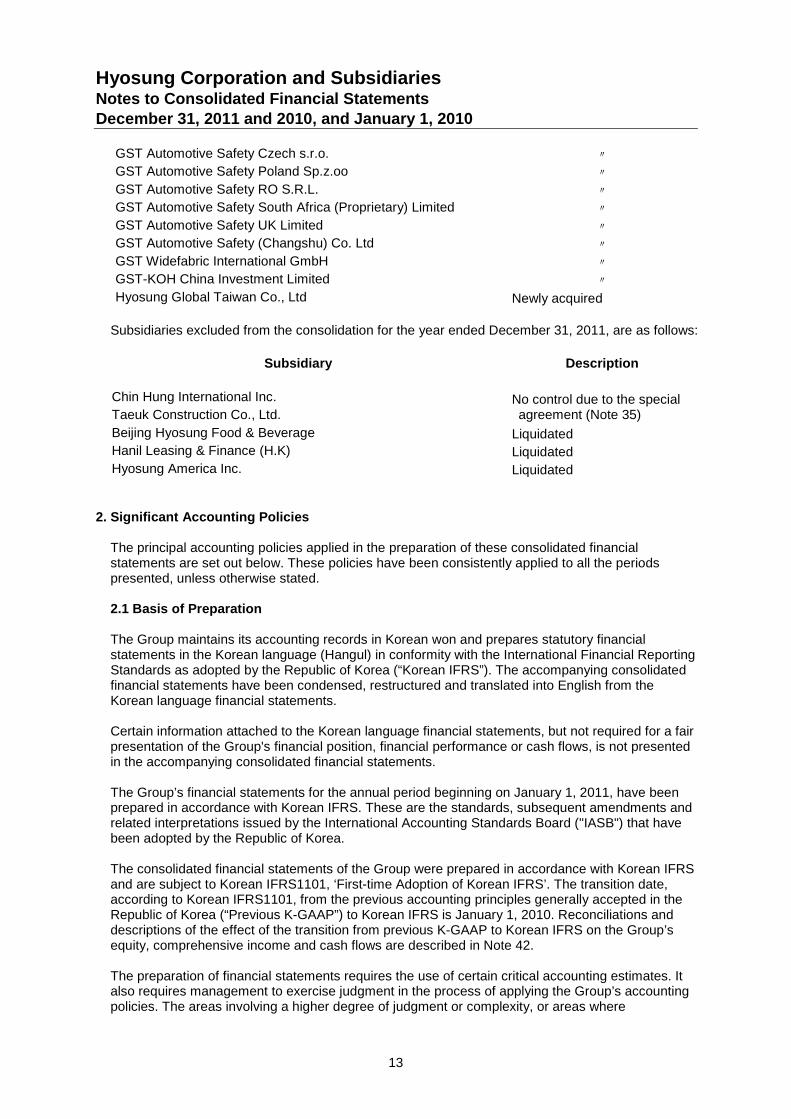
GST Automotive Safety Czech s.r.o. 〃
GST Automotive Safety Poland Sp.z.oo 〃
GST Automotive Safety RO S.R.L. 〃
GST Automotive Safety South Africa (Proprietary) Limited 〃
GST Automotive Safety UK Limited 〃
GST Automotive Safety (Changshu) Co. Ltd 〃
GST Widefabric International GmbH 〃
GST-KOH China Investment Limited 〃
Hyosung Global Taiwan Co., Ltd Newly acquired
Subsidiaries excluded from the consolidation for the year ended December 31, 2011, are as follows:
Subsidiary Description
Chin Hung International Inc. No control due to the specialagreement (Note 35)Taeuk Construction Co., Ltd.
Beijing Hyosung Food & Beverage Liquidated
Hanil Leasing & Finance (H.K) Liquidated
Hyosung America Inc. Liquidated
2. Significant Accounting Policies
The principal accounting policies applied in the preparation of these consolidated financialstatements are set out below. These policies have been consistently applied to all the periodspresented, unless otherwise stated.
2.1 Basis of Preparation
The Group maintains its accounting records in Korean won and prepares statutory financialstatements in the Korean language (Hangul) in conformity with the International Financial ReportingStandards as adopted by the Republic of Korea (“Korean IFRS”). The accompanying consolidatedfinancial statements have been condensed, restructured and translated into English from theKorean language financial statements.
Certain information attached to the Korean language financial statements, but not required for a fairpresentation of the Group's financial position, financial performance or cash flows, is not presentedin the accompanying consolidated financial statements.
The Group’s financial statements for the annual period beginning on January 1, 2011, have beenprepared in accordance with Korean IFRS. These are the standards, subsequent amendments andrelated interpretations issued by the International Accounting Standards Board ("IASB") that havebeen adopted by the Republic of Korea.
The consolidated financial statements of the Group were prepared in accordance with Korean IFRSand are subject to Korean IFRS1101, ‘First-time Adoption of Korean IFRS’. The transition date,according to Korean IFRS1101, from the previous accounting principles generally accepted in theRepublic of Korea (“Previous K-GAAP”) to Korean IFRS is January 1, 2010. Reconciliations anddescriptions of the effect of the transition from previous K-GAAP to Korean IFRS on the Group’sequity, comprehensive income and cash flows are described in Note 42.
The preparation of financial statements requires the use of certain critical accounting estimates. Italso requires management to exercise judgment in the process of applying the Group’s accountingpolicies. The areas involving a higher degree of judgment or complexity, or areas where
Hyosung Corporation and SubsidiariesNotes to Consolidated Financial StatementsDecember 31, 2011 and 2010, and January 1, 2010
14
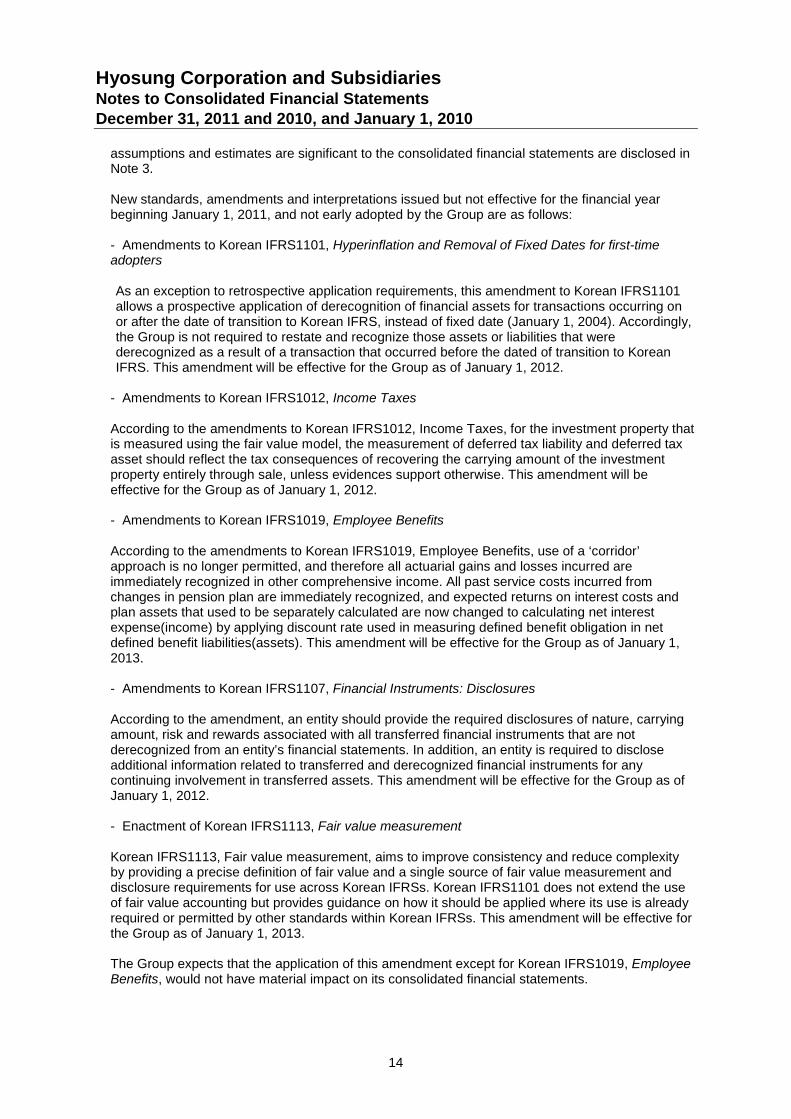
assumptions and estimates are significant to the consolidated financial statements are disclosed inNote 3.
New standards, amendments and interpretations issued but not effective for the financial yearbeginning January 1, 2011, and not early adopted by the Group are as follows:
- Amendments to Korean IFRS1101, Hyperinflation and Removal of Fixed Dates for first-timeadopters
As an exception to retrospective application requirements, this amendment to Korean IFRS1101allows a prospective application of derecognition of financial assets for transactions occurring onor after the date of transition to Korean IFRS, instead of fixed date (January 1, 2004). Accordingly,the Group is not required to restate and recognize those assets or liabilities that werederecognized as a result of a transaction that occurred before the dated of transition to KoreanIFRS. This amendment will be effective for the Group as of January 1, 2012.
- Amendments to Korean IFRS1012, Income Taxes
According to the amendments to Korean IFRS1012, Income Taxes, for the investment property thatis measured using the fair value model, the measurement of deferred tax liability and deferred taxasset should reflect the tax consequences of recovering the carrying amount of the investmentproperty entirely through sale, unless evidences support otherwise. This amendment will beeffective for the Group as of January 1, 2012.
- Amendments to Korean IFRS1019, Employee Benefits
According to the amendments to Korean IFRS1019, Employee Benefits, use of a ‘corridor’approach is no longer permitted, and therefore all actuarial gains and losses incurred areimmediately recognized in other comprehensive income. All past service costs incurred fromchanges in pension plan are immediately recognized, and expected returns on interest costs andplan assets that used to be separately calculated are now changed to calculating net interestexpense(income) by applying discount rate used in measuring defined benefit obligation in netdefined benefit liabilities(assets). This amendment will be effective for the Group as of January 1,2013.
- Amendments to Korean IFRS1107, Financial Instruments: Disclosures
According to the amendment, an entity should provide the required disclosures of nature, carryingamount, risk and rewards associated with all transferred financial instruments that are notderecognized from an entity’s financial statements. In addition, an entity is required to discloseadditional information related to transferred and derecognized financial instruments for anycontinuing involvement in transferred assets. This amendment will be effective for the Group as ofJanuary 1, 2012.
- Enactment of Korean IFRS1113, Fair value measurement
Korean IFRS1113, Fair value measurement, aims to improve consistency and reduce complexityby providing a precise definition of fair value and a single source of fair value measurement anddisclosure requirements for use across Korean IFRSs. Korean IFRS1101 does not extend the useof fair value accounting but provides guidance on how it should be applied where its use is alreadyrequired or permitted by other standards within Korean IFRSs. This amendment will be effective forthe Group as of January 1, 2013.
The Group expects that the application of this amendment except for Korean IFRS1019, EmployeeBenefits, would not have material impact on its consolidated financial statements.
Hyosung Corporation and SubsidiariesNotes to Consolidated Financial StatementsDecember 31, 2011 and 2010, and January 1, 2010
15
2.2 Consolidation
The Group has prepared the consolidated financial statements in accordance with KoreanIFRS1027, Consolidated and Separate Financial Statements.
(a) Subsidiaries
Subsidiaries are all entities (including special purpose entities) over which the Group has the powerto govern the financial and operating policies generally accompanying a shareholding of more thanone-half of the voting rights. The existence and effect of potential voting rights that are currentlyexercisable or convertible are considered when assessing whether the Group controls anotherentity. Subsidiaries are fully consolidated from the date on which control is transferred to the Group.They are de-consolidated from the date that control ceases.
The Group applies the acquisition method to account for business combinations. The considerationtransferred for the acquisition of a subsidiary is measured as the fair values of the assetstransferred, the liabilities incurred to the former owners of the acquiree and the equity interestsissued by the Group. The consideration transferred includes the fair value of any asset or liabilityresulting from a contingent consideration arrangement. Identifiable assets acquired and liabilitiesand contingent liabilities assumed in a business combination are measured initially at their fairvalues at the acquisition date. The Group recognizes any non-controlling interest in the acquiree onan acquisition- by-acquisition basis, either at fair value or at the non-controlling interest’sproportionate share of the recognized amounts of acquiree’s identifiable net assets.
Acquisition-related costs are expensed as incurred.If the business combination is achieved in stages, the acquisition date fair value of the acquirer’spreviously held equity interest in the acquiree is remeasured to fair value at the acquisition date andthe resulting gain or loss is recognized in profit or loss.
Any contingent consideration to be transferred by the Group is recognized at fair value at theacquisition date. Subsequent changes to the fair value of the contingent consideration that isdeemed to be an asset or liability is recognized in accordance with Korean IFRS1039, either inprofit or loss or as a change to other comprehensive income. Contingent consideration that isclassified as equity is not remeasured, and its subsequent settlement is accounted for within equity.
Goodwill is initially measured as the excess of the aggregate of the consideration transferred andthe fair value of non-controlling interest over the net identifiable assets acquired and liabilitiesassumed. If this consideration is lower than the fair value of the net assets of the subsidiaryacquired, the difference is recognized in profit or loss.
Intercompany transactions, balances, income and expenses on transactions between the Groupcompanies are eliminated. Unrealized losses are also eliminated after recognizing impairment oftransferred assets. Accounting policies of subsidiaries have been changed where necessary toensure consistency with the policies adopted by the Group.
(b) Changes in ownership interests in subsidiaries without change of control
Transactions with non-controlling interests that do not result in loss of control are accounted for asequity transactions; that is, as transactions with the owners in their capacity as owners. Thedifference between fair value of any consideration paid and the relevant share acquired of thecarrying value of net assets of the subsidiary is recorded in equity. Gains or losses on disposals tonon-controlling interests are also recorded in equity.
(c) Associates
Associates are all entities over which the Group has significant influence but not control, generallyaccompanying a shareholding of between 20% and 50% of the voting rights. Investments in
Hyosung Corporation and SubsidiariesNotes to Consolidated Financial StatementsDecember 31, 2011 and 2010, and January 1, 2010
16
associates are accounted for using the equity method of accounting. Under the equity method, theinvestment is initially recognized at cost, and the carrying amount is increased or decreased torecognize the investor’s share of the profit or loss of the investee after the date of acquisition. TheGroup’s investment in associates includes goodwill identified on acquisition, net of anyaccumulated impairment loss.
If the ownership interest in an associate is reduced but significant influence is retained, only aproportionate share of the amounts previously recognized in other comprehensive income isreclassified to profit or loss where appropriate.
The Group’s share of post-acquisition profit or loss is recognized in the income statement, and itsshare of post-acquisition movements in other comprehensive income is recognized in othercomprehensive income with a corresponding adjustment to the carrying amount of the investment.When the Group’s share of losses in an associate equals or exceeds its interest in the associate,including any other unsecured receivables, the Group does not recognize further losses, unless ithas incurred legal or constructive obligations or made payments on behalf of the associate.
The Group determines at each reporting date whether there is any objective evidence that theinvestment in the associate is impaired. If this is the case, the Group calculates the amount ofimpairment as the difference between the recoverable amount of the associate and its carryingvalue and recognizes the amount as ‘impairment loss on investment in an associate’ in the incomestatement.
Unrealized gains on transactions between the Group and its associates are eliminated to the extentof the Group’s interest in the associates. Unrealized losses are also eliminated unless thetransaction provides evidence of an impairment of the asset transferred. Accounting policies ofassociates have been changed where necessary to ensure consistency with the policies adoptedby the Group. Dilution gains and losses arising in investments in associates are recognized in theincome statement.
2.3 Segment Reporting
Operating segments are reported in a manner consistent with the internal reporting provided to thechief operating decision-maker (Note 5).
2.4 Foreign Currency Translation
(a) Functional and presentation currency
Items included in the financial statements of each of the Group’s entities are measured using thecurrency of the primary economic environment in which the entity operates (“the functionalcurrency”). The consolidated financial statements are presented in Korean won, which is thecontrolling entity’s functional and presentation currency.
(b) Transactions and balances
Foreign currency transactions are translated into the functional currency using the exchange ratesprevailing at the dates of the transactions or valuation where items are re-measured. Foreignexchange gains and losses resulting from the settlement of such transactions and from thetranslation at year-end exchange rates of monetary assets and liabilities denominated in foreigncurrencies are recognized in the income statement, except when deferred in other comprehensiveincome as qualifying cash flow hedges and qualifying net investment hedges.
Foreign exchange gains and losses that relate to borrowings and cash and cash equivalents arepresented in the income statement within ‘financial income or costs’.
Hyosung Corporation and SubsidiariesNotes to Consolidated Financial StatementsDecember 31, 2011 and 2010, and January 1, 2010
17
(c) Translation to presentation currency
The results and financial position of all Group entities that have a functional currency different fromthe presentation currency are translated into the presentation currency as follows:
assets and liabilities for each statement of financial position presented are translated atthe closing rate at the end of the reporting period;
income and expenses for each income statement are translated at average exchangerates; and
all resulting exchange differences are recognized in other comprehensive income.
Exchange differences arising from the translation of borrowings designated for hedging theinvestment and other currency instruments are recognized in other comprehensive income. Whenforeign operations are wholly or partially sold, exchange differences recognized in equity aretransferred to profit or loss in the income statement. When the Group ceases to control thesubsidiary, exchange differences that were recorded in equity are recognized in the incomestatement as part of the gain or loss on sale.
Goodwill and fair value adjustments arising on the acquisition of a foreign entity are treated asassets and liabilities of the foreign entity and translated at the closing rate.
2.5 Cash and Cash Equivalents
Cash and cash equivalents include cash in hand, deposits held at call with banks, and other short-term highly liquid investments with original maturities of three months or less.
2.6 Financial Assets
2.6.1 Classification
The Group classifies its financial assets in the following categories: at fair value through profit orloss, loans and receivables, available-for-sale, and held-to-maturity. The classification depends onthe purpose for which the financial assets were acquired. Management determines theclassification of its financial assets at initial recognition.
(a) Financial assets at fair value through profit or loss
Financial assets at fair value through profit or loss are financial assets held for trading. A financialasset is classified in this category if acquired principally for the purpose of selling in the short term.Derivatives or embedded derivatives are also categorized as held for trading unless they aredesignated as hedges. Assets in this category are classified as ‘other financial assets’ and ‘long-term other financial assets’ in the statement of financial position.
(b) Loans and receivables
Loans and receivables are non-derivative financial assets with fixed or determinable payments thatare not quoted in an active market. They are included in current assets, except for maturitiesgreater than 12 months after the end of the reporting period. These are classified as non-currentassets. The Group’s loans and receivables comprise ‘cash and cash equivalents’, ‘trade and otherreceivables’, ‘ long-term trade and other receivables’ and ‘gross amount due from customers forcontract work’ in the statement of financial position.
(c) Held-to-maturity investments
Held-to-maturity investments are non-derivative financial assets with fixed or determinablepayments and fixed maturities that the Group intends and is able to hold to maturity and areclassified as ‘other financial assets’ and ‘long-term other financial assets’ in the statements of
Hyosung Corporation and SubsidiariesNotes to Consolidated Financial StatementsDecember 31, 2011 and 2010, and January 1, 2010
18
financial position. If the Group were to sell other than an insignificant amounts of held-to-maturityinvestments, the whole category would be tainted and reclassified as available-for-sale. Held-to-maturity investments are included in non-current assets, except for those with maturities of lessthan 12 months after the end of the reporting period, which are classified as current assets.
(d) Available-for-sale financial assets
Available-for-sale financial assets are non-derivatives that are either designated in this category ornot classified in any of the other categories. They are classified as ‘other financial assets’ and ‘long-term other financial assets’. They are included in non-current assets unless the investment maturesor management intends to dispose of it within 12 months after the end of the reporting period.
2.6.2 Recognition and Measurement
Regular purchases and sales of financial assets are recognized on the trade date. Investments areinitially recognized at fair value plus transaction costs for all financial assets not carried at fair valuethrough profit or loss. Financial assets carried at fair value through profit or loss are initiallyrecognized at fair value, and transaction costs are expensed in the income statement. Financialassets are derecognized when the rights to receive cash flows from the investments have expiredor have been transferred and the Group has transferred substantially all risks and rewards ofownership. Available-for-sale financial assets and financial assets at fair value through profit or lossare subsequently carried at fair value. Loans and receivables are subsequently carried at amortizedcost using the effective interest rate method.
Gains or losses arising from changes in the fair value of the financial assets carried at fair valuethrough profit or loss are presented in the income statement within ‘other operating income or otheroperating expenses’ in the period in which they arise. Dividend income from financial assets at fairvalue through profit or loss is recognized in the income statement as part of ‘other operating income’when the Group’s right to receive dividend payments is established.
When securities classified as available-for-sale are sold or impaired, the accumulated fair valueadjustments recognized in equity are included in the income statement as ‘other operating incomeor other operating expenses’.
Interest on available-for-sale securities calculated using the effective interest method is recognizedin the income statement as part of ‘financial income’. Dividends on available-for-sale equityinstruments are recognized in the income statement as part of ‘other operating income’ when theGroup’s right to receive dividend payments is established.
2.6.3 Derecognition
Financial assets are derecognized when the contractual rights to receive cash flows from theinvestments have expired or have been transferred and the Group has substantially transferred allrisks and rewards of ownership. If the risk and rewards of ownership of transferred assets have notbeen substantially transferred, the Group reviews the level of control retained over that asset andthe extent of its continuing involvement to determine if transfers do not qualify for derecognition.
Collaterals (trade receivables and other) provided in transactions of discount and factoring of tradereceivables do not meet the requirements for asset derecognition if risks and rewards do notsubstantially transfer in the event the debtor defaults. Financial liabilities recognized in relation tothese transactions are included as borrowings in the Group’s statement of financial position.
Hyosung Corporation and SubsidiariesNotes to Consolidated Financial StatementsDecember 31, 2011 and 2010, and January 1, 2010
19
2.7 Impairment of Financial Assets
(a) Assets carried at amortized cost
The Group assesses at the end of each reporting period whether there is objective evidence that afinancial asset or a group of financial assets is impaired. A financial asset or a group of financialassets is impaired and impairment losses are incurred only if there is objective evidence ofimpairment as a result of one or more events that occurred after the initial recognition of the asset(a ‘loss event’) and that loss event (or events) has an impact on the estimated future cash flows ofthe financial asset or a group of financial assets that can be reliably estimated.
The criteria that the Group uses to determine that there is objective evidence of an impairment lossinclude:
Significant financial difficulty of the issuer or obligor; Delinquency in interest or principal payments; For economic or legal reasons relating to the borrower’s financial difficulty, granting to the
borrower a concession that the lender would not otherwise consider; It becomes probable that the borrower will enter bankruptcy or other financial
reorganization; The disappearance of an active market for that financial asset because of financial
difficulties; Observable data suggesting that there is a measurable decrease in the estimated future
cash flows from a portfolio of financial assets since the initial recognition of those assets,even though the decrease cannot be identified with respect to individual financial assets inthe portfolio, such as:
(i) adverse changes in the payment status of borrowers in the portfolio;(ii) national or local economic conditions that correlate with defaults on the assets in the
portfolio.
Impairment loss is measured as the difference between the assets’ carrying amount and thepresent value of estimated future cash flows (excluding future credit losses that have not beenincurred) discounted using the initial effective interest rate. The carrying amount of the asset isreduced by the impairment loss amount and the amount of the loss is recognized in the incomestatement. In practice, the Group may measure impairment loss based on the fair value of financialasset using an observable market price.
If, in a subsequent period, the amount of impairment loss decreases and the decrease can berelated objectively to an event occurring after the impairment was recognized, the reversal of thepreviously recognized impairment loss is recognized in the income statement.
(b) Assets classified as available-for-sale
The Group assesses at the end of each reporting period whether there is objective evidence that afinancial asset or a group of financial assets is impaired. For debt securities, the Group uses thecriteria refer to in (a) above. In the case of equity investments classified as available-for-sale, asignificant or prolonged decline in the fair value of the security below its cost, for example decreasein fair value of the investments below its cost intentionally and consistently, is also evidence thatthe asset is impaired. If any such evidence exists for available-for-sale financial assets, thecumulative loss – measured as the difference between the acquisition cost and the current fairvalue, less any impairment loss on that financial asset previously recognized in profit or loss – isremoved from equity and recognized in the income statement. Impairment losses recognized in theconsolidated income statement on equity instruments are not reversed through the incomestatement. If, in a subsequent period, the fair value of a debt instrument classified as available-for-sale increases and the increase can be objectively related to an event occurring after theimpairment loss was recognized in profit or loss, the impairment loss is reversed through theincome statement.
Hyosung Corporation and SubsidiariesNotes to Consolidated Financial StatementsDecember 31, 2011 and 2010, and January 1, 2010
20
2.8 Derivative Financial Instruments and Hedging Activities
Derivatives are initially recognized at fair value on the date a derivative contract is entered into andare subsequently re-measured at their fair value. The method of recognizing the resulting gain orloss depends on whether the derivative is designated as a hedging instrument, and if so, the natureof the item being hedged. The resulting gain or loss is recognized in ' other operating income orother operating expenses ' according to the nature of transactions.
The Group designates certain derivatives as either:
hedges of the fair value of recognized assets or liabilities or a firm commitment (fair valuehedge);
hedges of a particular risk associated with a recognized asset or liability or a highlyprobable forecast transaction (cash flow hedge);
The Group documents at the inception of the transaction the relationship between hedginginstruments and hedged items, as well as its risk management objectives and strategy forundertaking various hedging transactions. The Group also documents its assessment, both athedge inception and on an ongoing basis, of whether the derivatives that are used in hedgingtransactions are highly effective in offsetting changes in fair values or cash flows of hedged items.
The fair values of various derivative instruments used for hedging purposes are disclosed in Note10. The full fair value of a hedging derivative is classified as a non-current asset or liability when theremaining hedged item is more than 12 months, and as a current asset or liability when theremaining maturity of the hedged item is less than 12 months. Trading derivatives are classified asa current asset or liability.
2.9 Trade Receivables
Trade receivables are amounts due from customers for merchandises and finished goods sold orservices performed in the ordinary course of business. If collection is expected in one year or less,they are classified as current assets. If not, they are presented as non-current assets. Tradereceivables are recognized initially at fair value and subsequently measured at amortized costusing the effective interest method, less provision for impairment.
2.10 Inventories
Inventories are stated at the lower of cost and net realizable value. Cost is determined using themoving-weighted average method (the gross-weighted average method or the first-in, first-out(FIFO) method in some subsidiaries) except for in-transit inventories which are determined usingthe specific identification method. The cost of finished goods and work in progress consists of theraw materials, direct labor, other direct costs and related production overheads (based on normaloperating capacity). It excludes borrowing costs. Net realizable value is the estimated selling pricein the ordinary course of business, less applicable variable selling expenses.
2.11 Property, Plant and Equipment
All property, plant and equipment are stated at historical cost less depreciation and accumulatedimpairment loss. Historical cost includes expenditures directly attribute to the acquisition of theitems.
Subsequent costs are included in the asset’s carrying amount or recognized as a separate asset,as appropriate, only when it is probable that future economic benefits associated with the item willflow to the Group and the cost of the item can be measured reliably. The carrying amount of thereplaced part is derecognized. All other repairs and maintenance are charged to the incomestatement during the financial period in which they are incurred.
Hyosung Corporation and SubsidiariesNotes to Consolidated Financial StatementsDecember 31, 2011 and 2010, and January 1, 2010
21
Land is not depreciated. Depreciation on other assets is calculated using the straight-line method toallocate the difference between their cost and their residual values over their estimated useful lives,as follows:
Estimated Useful Lives
Buildings 20 - 60 years
Structures 5 - 40 years
Machinery 3 - 25 years
Vehicles 3 - 10 years
Tools and equipment 3 - 15 years
Others 2 - 10 years
The assets’ residual values and useful lives are reviewed, and adjusted if appropriate, at the end ofeach reporting period. An asset’s carrying amount is written down immediately to its recoverableamount if the asset’s carrying amount is greater than its estimated recoverable amount. Gains andlosses on disposals are determined by comparing the proceeds with the carrying amount and arerecognized within ‘other operating income or other operating expenses’ in the income statement.
2.12 Borrowing Costs
General and specific borrowing costs directly attributable to the acquisition, construction orproduction of qualifying assets, which are assets that necessarily take a substantial period of timeto get ready for their intended use or sale, are added to the cost of those assets, until such time asthe assets are substantially ready for their intended use or sale. Investment income earned on thetemporary investment of specific borrowings pending their expenditure on qualifying assets isdeducted from the borrowing costs eligible for capitalization. All other borrowing costs arerecognized in profit or loss in the period in which they are incurred.
2.13 Government Grants
Grants from a government are recognized at their fair value where there is a reasonable assurancethat the grant will be received and the Group will comply with all attached conditions.
Government grants relating to costs are deferred and recognized in the income statement over theperiod necessary to match them with the costs that they are intended to compensate.
2.14 Intangible Assets
(a) Industrial property
Acquired industrial property is shown at historical cost. Industrial property has a finite useful life andis carried at cost less accumulated amortization. Amortization is calculated using the straight-linemethod to allocate the cost of industrial property over their estimated useful lives of five to ten years.
(b) Other intangible assets
Other intangible assets which meet the definition of an intangible asset are amortized using thestraight-line method over their estimated useful lives of 5~25 years when the asset is available foruse. Membership rights are regarded as intangible assets with indefinite useful life and notamortized because there is no foreseeable limit to the period over which the asset is expected togenerate net cash inflows for the entity. All membership rights are tested annually for impairmentand stated at cost less accumulated impairment. Impairment losses are not reversed.
Hyosung Corporation and SubsidiariesNotes to Consolidated Financial StatementsDecember 31, 2011 and 2010, and January 1, 2010
22
(c) Research and development costs
Development costs are recognized as expenses when they are incurred. Development costs whichare individually identifiable and directly related to a new technology or to new products which carryprobable future benefits are capitalized as intangible assets.
It is technically feasible to complete the intangible asset so that it will be available for use;
Management intends to complete the intangible asset and use or sell it;
There is the ability to use or sell the intangible asset;
It can be demonstrated how the intangible asset will generate probable future economic
benefits;
Adequate technical, financial and other resources to complete the development and to use
or sell the intangible asset are available; and
The expenditure attributable to the intangible asset during its development can be reliably
measured.
Other development expenditures that do not meet these criteria are recognized as an expense asincurred. Development costs previously recognized as an expense are not recognized as an assetin a subsequent period. Amortization of capitalized development costs is computed using thestraight-line method over useful lives from the commencement of the commercial production of therelated products or use of the related technology. Such costs are subject to periodic review of theirrecoverability.
There is no development costs capitalized as assets as of December 31, 2011.
2.15 Investment Property
Investment property is held to earn rentals or for capital appreciation or both. Investment propertyalso includes property that is being constructed or developed for future use as investment property.Investment property is measured initially at its cost including transaction costs incurred in acquiringthe asset. After recognition as an asset, investment property is carried at cost less accumulateddepreciation and impairment losses.
Subsequent costs are included in the asset’s carrying amount or recognized as a separate asset,only when it is probable that future economic benefits associated with the item will flow to TheGroup and the cost of the item can be measured reliably. The carrying amount of the replaced partis derecognized. All other repairs and maintenance are charged to the income statement during thefinancial period in which they are incurred.
Land held for investment is not depreciated. Investment property, except for land, is depreciatedusing straight-line method over their useful lives for 40 years.
The depreciation method, the residual value and the useful life of an asset are reviewed at the endof each financial year and, if management judges that previous estimates should be adjusted, thechange is accounted for as a change in an accounting estimate.
Gains and losses on disposals are determined by comparing the proceeds with the carrying amountand are recognized within ‘other operating income or other operating expenses’ in the incomestatements.
2.16 Impairment of Non-financial Assets
Goodwill or intangible assets with indefinite useful lives are not subject to amortization and aretested annually for impairment. Assets that are subject to amortization are reviewed for impairmentwhenever events or changes in circumstances indicate that the carrying amount may not be
Hyosung Corporation and SubsidiariesNotes to Consolidated Financial StatementsDecember 31, 2011 and 2010, and January 1, 2010
23
recoverable. An impairment loss is recognized for the amount by which the asset’s carrying amountexceeds its recoverable amount. The recoverable amount is the higher of an asset’s fair value lesscosts to sell and value in use. For the purposes of assessing impairment, assets are grouped at thelowest levels for which there are separately identifiable cash flows (cash-generating units). Non-financial assets, other than goodwill, that suffered an impairment are reviewed for possible reversalof the impairment at each reporting date.
2.17 Financial Liabilities
(a) Financial liabilities at fair value through profit or loss
Financial liabilities at fair value through profit or loss are financial instruments held for trading.Financial liabilities are classified as financial liabilities at fair value through profit or loss whenincurred principally for the purpose of repurchasing it in the near term. Derivatives or embeddedderivatives are also categorized as this category unless they are designated as hedges.
(b) Financial liabilities carried at amortized cost
The Group classifies non-derivative financial liabilities, except for financial liabilities at fair valuethrough profit or loss and financial liabilities that arise when a transfer of a financial asset does notqualify for derecognition, as financial liabilities carried at amortized cost and as ‘trade payables’,‘borrowings’, and ‘other financial liabilities’ in the statement of financial position. In case when atransfer of a financial asset does not qualify for derecognition, the transferred asset is continuouslyrecognized as asset and the consideration received is recognized as financial liabilities. Financialliabilities carried at amortized cost are included in non-current liabilities, except for liabilities withmaturities less than 12 months after the end of the reporting period, which are classified as currentliabilities.
2.18 Trade Payables
Trade payables are obligations to pay for goods or services that have been acquired in the ordinarycourse of business from suppliers. Trade payables are classified as current liabilities if payment isdue within one year or less. If not, they are presented as non-current liabilities. Trade payables arerecognized initially at fair value and subsequently measured at amortized cost using the effectiveinterest method.
2.19 Financial Guarantee Contract
Financial guarantee contracts are contracts that require the issuer to make specified payments toreimburse the holder for a loss it incurs because a specified debtor fails to make payments whendue, in accordance with the terms of a debt instrument.
Financial guarantees are initially recognized in the financial statements at fair value on the date theguarantee was given. Subsequent to initial recognition, the Group’s liabilities under suchguarantees are measured at the higher of the amounts below. Any increase in the liability relatingto guarantees is reported as other financial liabilities.
amount calculated in accordance with Korean IFRS 1037, Provisions, ContingentLiabilities and Contingent Assets; or
the initial amount, less accumulated amortization recognized in accordance with KoreanIFRS1018, Revenue.
2.20 Borrowings
Borrowings are recognized initially at fair value, net of transaction costs incurred. Borrowings aresubsequently carried at amortized cost; any difference between the proceeds (net of transactioncosts) and the redemption value is recognized in the income statement over the period of the
Hyosung Corporation and SubsidiariesNotes to Consolidated Financial StatementsDecember 31, 2011 and 2010, and January 1, 2010
24
borrowings using the effective interest method. The Group recognizes borrowings as current assetsunless it has an unconditional right to delay the settlement of the borrowing. The condition forliability which can be paid by issuing equity depending on the choice of other party of contract doesnot affect the classification of current liability.
2.21 Provisions
Provisions are recognized when: The Group has a present legal or constructive obligation as aresult of past events; it is probable that an outflow of resources will be required to settle theobligation; and the amount has been reliably estimated. Provisions are not recognized for futureoperating losses.
Provisions are measured at the present value of the expenditures expected to be required to settlethe obligation using a pre-tax rate that reflects current market assessments of the time value ofmoney and the risks specific to the obligation. The increase in the provision due to passage of timeis recognized as interest expense.
2.22 Current and Deferred Income Tax
The tax expense for the period comprises current and deferred tax. Tax is recognized in the incomestatement, except to the extent that it relates to items recognized in other comprehensive income ordirectly in equity. In this case, the tax is also recognized in other comprehensive income or directlyin equity.
The current income tax charge is calculated on the basis of the tax laws enacted or substantivelyenacted at the statement of financial position date in the countries where the Group operates andgenerates taxable income. Management periodically evaluates positions taken in tax returns withrespect to situations in which applicable tax regulation is subject to interpretation. It establishesprovisions where appropriate on the basis of amounts expected to be paid to the tax authorities.Deferred income tax is recognized, using the liability method, on temporary differences arisingbetween the tax bases of assets and liabilities and their carrying amounts in the consolidatedfinancial statements. However, deferred tax assets and liabilities are not recognized if they arisefrom initial recognition of an asset or liability in a transaction other than a business combination thatat the time of the transaction affects neither accounting nor taxable profit or loss. Deferred incometax is determined using tax rates and laws that have been enacted or substantially enacted by thestatement of financial position date and are expected to apply when the related deferred income taxasset is realized or the deferred income tax liability is settled.
Deferred income tax assets are recognized only to the extent that it is probable that future taxableprofit will be available against which the temporary differences can be utilized.
Deferred income tax is provided on temporary differences arising on investments in subsidiariesand associates, except for deferred income tax liability where the timing of the reversal of thetemporary difference is controlled by the Group and it is probable that the temporary difference willnot reverse in the foreseeable future.
Deferred income tax assets and liabilities are offset when there is a legally enforceable right tooffset current tax assets against current tax liabilities and when the deferred income taxes assetsand liabilities relate to income taxes levied by the same taxation authority on either the sametaxable entity or different taxable entities where there is an intention to settle the balances on a netbasis.
Hyosung Corporation and SubsidiariesNotes to Consolidated Financial StatementsDecember 31, 2011 and 2010, and January 1, 2010
25
2.23 Employee Benefits
(a) Defined benefit liability
Group companies operate various pension schemes. The schemes are generally funded throughpayments to insurance companies or trustee-administered funds, determined by periodic actuarialcalculations. The Group has both defined benefit and defined contribution plans.
A defined contribution plan is a pension plan under which the Group pays fixed contributions into aseparate entity. The Group has no legal or constructive obligations to pay further contributions if thefund does not hold sufficient assets to pay all employees the benefits relating to employee servicein the current and prior periods. For defined contribution plans, the Group pays contributions topublicly or privately administered pension insurance plans on a mandatory, contractual or voluntarybasis. The Group has no further payment obligations once the contributions have been paid. Thecontributions are recognized as employee benefit expense when they are due. Prepaidcontributions are recognized as an asset to the extent that a cash refund or a reduction in the futurepayments is available.
A defined benefit plan is a pension plan that is not a defined contribution plan. Typically definedbenefit plans define an amount of pension benefit that an employee will receive on retirement,usually dependent on one or more factors such as age, years of service and compensation. Theliability recognized in the statement of financial position in respect of defined benefit pension plansis the present value of the defined benefit obligation at the end of the reporting period less the fairvalue of plan assets, together with adjustments for unrecognized past-service costs. The definedbenefit obligation is calculated annually by independent actuaries using the projected unit creditmethod. The present value of the defined benefit obligation is determined by discounting theestimated future cash outflows using interest rates of high-quality corporate bonds that aredenominated in the currency in which the benefits will be paid, and that have terms to maturityapproximating to the terms of the related pension obligation.
Actuarial gains and losses arising from experience adjustments and changes in actuarialassumptions are charged or credited to equity in other comprehensive income in the period inwhich they arise. Past-service costs are recognized immediately in income, while costs areamortized over the vesting period.
2.24 Share Capital
Where the Company purchases its own equity share capital (treasury shares), the considerationpaid, including any directly attributable incremental costs is deducted from equity attributable to theCompany’s equity holders until the shares are cancelled or reissued. Where such ordinary sharesare subsequently reissued, any consideration received is included in equity attributable to theCompany’s equity holders.
2.25 Revenue Recognition
Revenue is measured at the fair value of the consideration received or receivable, and representsamounts receivable for goods and services supplied, stated net of discounts, returns and valueadded taxes, after elimination of intra-company transactions.
The Group recognizes revenue when the amount of revenue can be reliably measured; when it isprobable that future economic benefits will flow to the entity; and when specific criteria have beenmet for each of the Group’s activities, as described below. The revenue can be reliably measuredonly when any contingency related to sales is resolved. The Group bases its estimate on historicalresults, taking into consideration the type of customer, the type of transaction and the specifics ofeach arrangement.
Hyosung Corporation and SubsidiariesNotes to Consolidated Financial StatementsDecember 31, 2011 and 2010, and January 1, 2010
26
(a) Sales of goods
Sales of goods are recognized when products are delivered to the purchaser. Delivery does notoccur until the products have been shipped to the specified location, the risks of obsolescence andloss have been transferred to the wholesaler, and either the purchaser has accepted the productsin accordance with the sales contract, the acceptance provisions have lapsed or the Group hasobjective evidence that all criteria for acceptance have been satisfied.
Provisions for product discount and returns are made based on historic trends and specificknowledge of any customer’s intent to return products.
(b) Rendering of services
Normally, if the contract is based on time and materials related to rendering services, revenue isrecognized according to the percentage of completion and a fixed ratio in the terms of the contractis used. If the contract is based on time, the percentage of completion is measured as the timeprovided over the total estimated time to be provided, and if the contract is based on materials, thepercentage of completion is measured as the costs to date over the total estimated costs.
(c) Royalty income
Royalty income is recognized on an accrual basis in accordance with the substance of the relevantagreements.
(d) Interest income
Interest income is recognized using the effective interest method according to the time passed.When a loan and receivable is impaired, the Group reduces the carrying amount to its recoverableamount and continues unwinding the discount as interest income. Interest income on impaired loanand receivables is recognized using the original effective interest rate.
(e) Dividend income
Dividend income is recognized when the right to receive payment is established.
2.26 Construction Contracts
Construction contract is defined in Korean IFRS 1011, Construction contracts, as a contractspecifically negotiated for the construction of an asset.
Contract costs are recognized as expenses. When the outcome of a construction contract cannotbe estimated reliably, contract revenue is recognized only to the extent of contract costs incurredthat are likely to be recoverable. When the outcome of a construction contract can be estimatedreliably and it is probable that the contract will be profitable, contract revenue is recognized over theperiod of the contract by reference to the stage of completion. Variations in contract work, claimsand incentive payments are included in contract revenue to the extent that may have been agreedwith the customer and are capable of being reliably measured.
When it is probable that total contract costs will exceed total contract revenue, the expected loss isrecognized as an expense immediately.
The Group uses the ‘percentage-of-completion method’ to determine the appropriate amount torecognize in a given period. The stage of completion is measured by reference to the contract costsincurred up to the end of the reporting period as a percentage of total estimated costs for eachcontract. Costs incurred in the year in connection with future activity on a contract are excludedfrom contract costs in determining the stage of completion. These amounts are recognized asinventory, advance payments or other assets.
Hyosung Corporation and SubsidiariesNotes to Consolidated Financial StatementsDecember 31, 2011 and 2010, and January 1, 2010
27
In cases where the aggregate amount of costs incurred and recognized profits (less recognizedlosses) exceeds progress billings, the total cost incurred plus recognized profits(less recognizedlosses and progress billings), represents an asset(unbilled amount). The progress billed amountsare included in ‘Trade and other receivables’.
In cases where progress billing exceeds the aggregate amount of costs incurred and recognizedprofits (less recognized losses), the aggregate amount of recognized losses plus progressbilling(less cost incurred and recognized profits) represents a liability (overbilled amount).
The Group applies the percentage of completion method on recognition of sales-real estate basedon the Korea Accounting Institute Opinion “2011 - I – KQA”. This application is effective pursuant tothe Acts on Article 13.1.1 Korean International Financial Reporting Standards (K-IFRS) on ExternalAudit for Stock Companies in Korea
2.27 Earnings per Share
Basic earnings per share is calculated by dividing the profit attributable to equity holders of theCompany by the weighted average number of ordinary shares in issue during the year.
2.28 Approval of Issuance of the Financial Statement
The issuance of the December 31, 2011 consolidated financial statements of the Group wasapproved by the Board of Directors on February 17, 2012.
3. Critical Accounting Estimates and Judgments
The Group makes estimates and assumptions concerning the future. The resulting accountingestimates will, by definition, seldom equal the related actual results. Estimations and assumptionsare continuously evaluated with consideration to factors such as events reasonably predictable inthe foreseeable future within the present circumstance according to historical experience. Theestimates and assumptions that have a significant risk of causing a material adjustment to thecarrying amounts of assets and liabilities within the next financial year are addressed below.
(a) Income taxes
The Group is operating in numerous countries and the income generated from these operations issubject to income taxes based on tax laws and interpretations of tax authorities in numerousjurisdictions. There are many transactions and calculations for which the ultimate tax determinationis uncertain. The Group recorded, based on its best estimate, current taxes and deferred taxes thatThe Group will be liable in the future for the operating results as of the financial year end. However,the final tax outcome in the future may be different from the amounts that were initially recorded.Such differences will impact the current and deferred income tax assets and liabilities in the periodin which such determination is made.
(b) Fair value of financial instruments
The fair value of financial instruments that are not traded in an active market is determined by usingvaluation techniques. The Group uses its judgment to select a variety of methods and makeassumptions that are mainly based on market conditions existing at the end of each reportingperiod.
(c) Provisions
As described in Note 23, the Group recognizes provisions for warranties, repairs and estimatedreturns as of the reporting date. The amounts are estimated based on historical data.
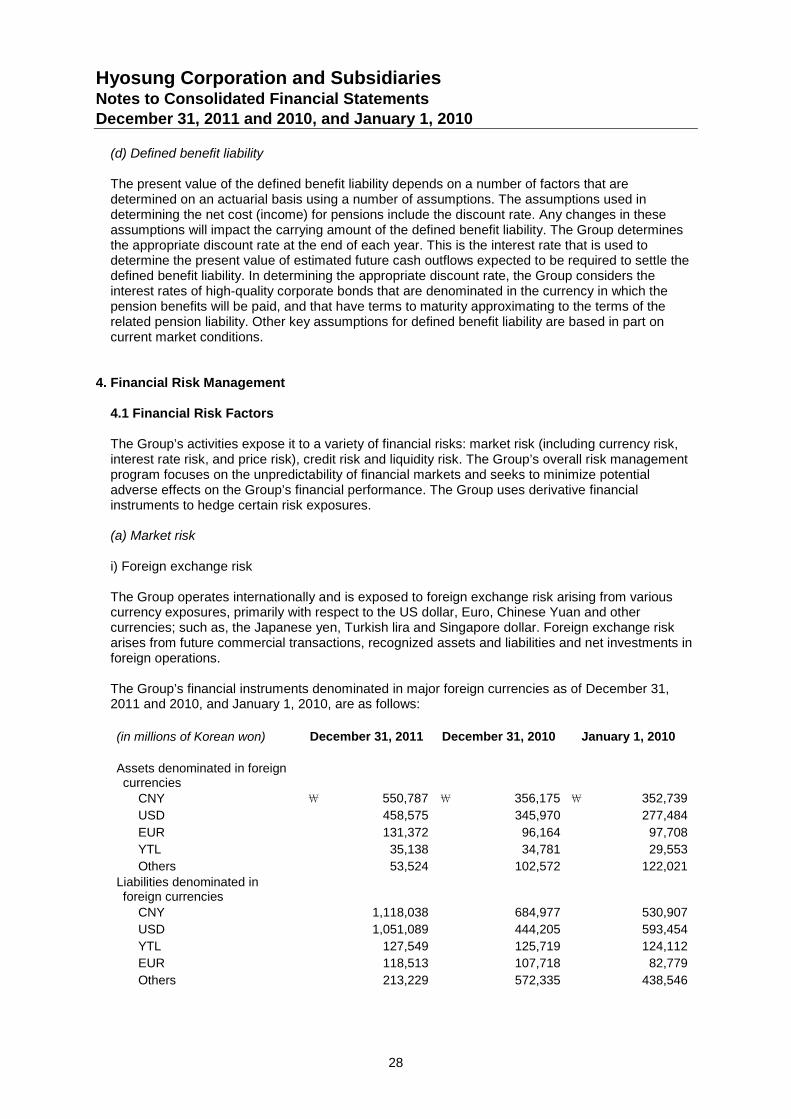
Hyosung Corporation and SubsidiariesNotes to Consolidated Financial StatementsDecember 31, 2011 and 2010, and January 1, 2010
28
(d) Defined benefit liability
The present value of the defined benefit liability depends on a number of factors that aredetermined on an actuarial basis using a number of assumptions. The assumptions used indetermining the net cost (income) for pensions include the discount rate. Any changes in theseassumptions will impact the carrying amount of the defined benefit liability. The Group determinesthe appropriate discount rate at the end of each year. This is the interest rate that is used todetermine the present value of estimated future cash outflows expected to be required to settle thedefined benefit liability. In determining the appropriate discount rate, the Group considers theinterest rates of high-quality corporate bonds that are denominated in the currency in which thepension benefits will be paid, and that have terms to maturity approximating to the terms of therelated pension liability. Other key assumptions for defined benefit liability are based in part oncurrent market conditions.
4. Financial Risk Management
4.1 Financial Risk Factors
The Group’s activities expose it to a variety of financial risks: market risk (including currency risk,interest rate risk, and price risk), credit risk and liquidity risk. The Group’s overall risk managementprogram focuses on the unpredictability of financial markets and seeks to minimize potentialadverse effects on the Group’s financial performance. The Group uses derivative financialinstruments to hedge certain risk exposures.
(a) Market risk
i) Foreign exchange risk
The Group operates internationally and is exposed to foreign exchange risk arising from variouscurrency exposures, primarily with respect to the US dollar, Euro, Chinese Yuan and othercurrencies; such as, the Japanese yen, Turkish lira and Singapore dollar. Foreign exchange riskarises from future commercial transactions, recognized assets and liabilities and net investments inforeign operations.
The Group’s financial instruments denominated in major foreign currencies as of December 31,2011 and 2010, and January 1, 2010, are as follows:
(in millions of Korean won) December 31, 2011 December 31, 2010 January 1, 2010
Assets denominated in foreigncurrencies
CNY \ 550,787 \ 356,175 \ 352,739
USD 458,575 345,970 277,484
EUR 131,372 96,164 97,708
YTL 35,138 34,781 29,553
Others 53,524 102,572 122,021
Liabilities denominated inforeign currencies
CNY 1,118,038 684,977 530,907
USD 1,051,089 444,205 593,454
YTL 127,549 125,719 124,112
EUR 118,513 107,718 82,779
Others 213,229 572,335 438,546
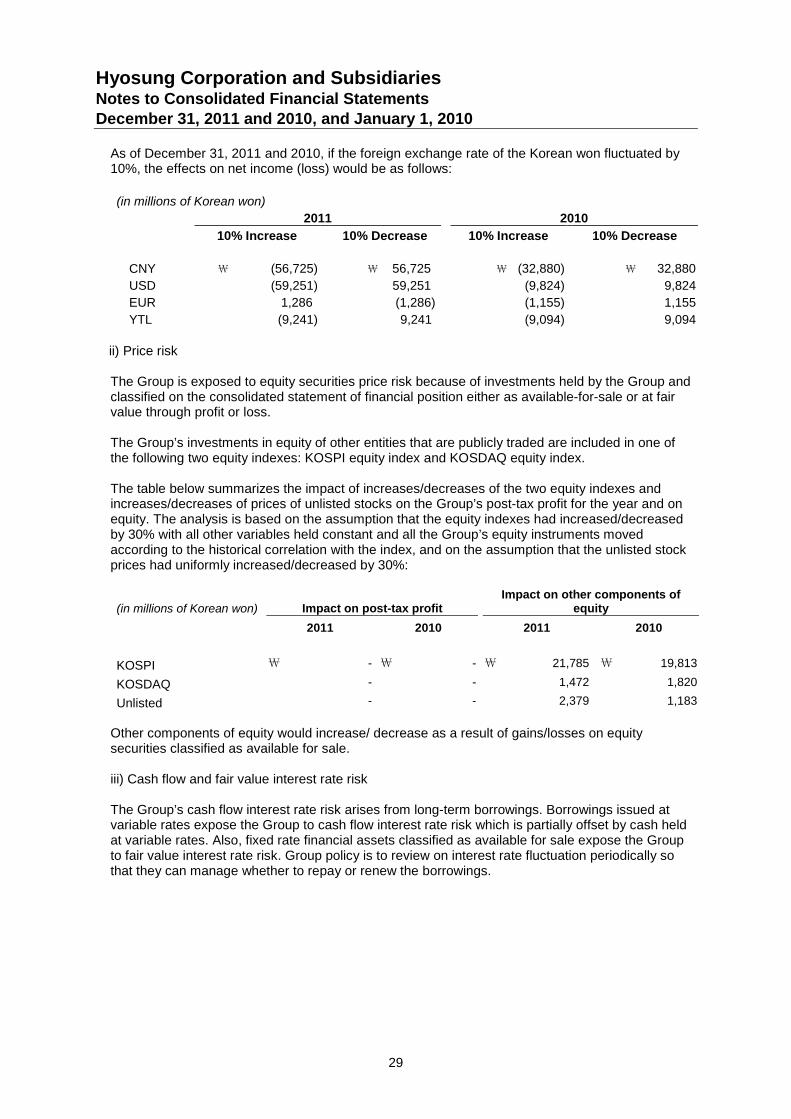
Hyosung Corporation and SubsidiariesNotes to Consolidated Financial StatementsDecember 31, 2011 and 2010, and January 1, 2010
29
As of December 31, 2011 and 2010, if the foreign exchange rate of the Korean won fluctuated by10%, the effects on net income (loss) would be as follows:
(in millions of Korean won)
2011 2010
10% Increase 10% Decrease 10% Increase 10% Decrease
CNY \ (56,725) \ 56,725 \ (32,880) \ 32,880
USD (59,251) 59,251 (9,824) 9,824
EUR 1,286 (1,286) (1,155) 1,155
YTL (9,241) 9,241 (9,094) 9,094
ii) Price risk
The Group is exposed to equity securities price risk because of investments held by the Group andclassified on the consolidated statement of financial position either as available-for-sale or at fairvalue through profit or loss.
The Group’s investments in equity of other entities that are publicly traded are included in one ofthe following two equity indexes: KOSPI equity index and KOSDAQ equity index.
The table below summarizes the impact of increases/decreases of the two equity indexes andincreases/decreases of prices of unlisted stocks on the Group’s post-tax profit for the year and onequity. The analysis is based on the assumption that the equity indexes had increased/decreasedby 30% with all other variables held constant and all the Group’s equity instruments movedaccording to the historical correlation with the index, and on the assumption that the unlisted stockprices had uniformly increased/decreased by 30%:
(in millions of Korean won) Impact on post-tax profitImpact on other components of
equity
2011 2010 2011 2010
KOSPI \ - \ - \ 21,785 \ 19,813
KOSDAQ - - 1,472 1,820
Unlisted - - 2,379 1,183
Other components of equity would increase/ decrease as a result of gains/losses on equitysecurities classified as available for sale.
iii) Cash flow and fair value interest rate risk
The Group’s cash flow interest rate risk arises from long-term borrowings. Borrowings issued atvariable rates expose the Group to cash flow interest rate risk which is partially offset by cash heldat variable rates. Also, fixed rate financial assets classified as available for sale expose the Groupto fair value interest rate risk. Group policy is to review on interest rate fluctuation periodically sothat they can manage whether to repay or renew the borrowings.
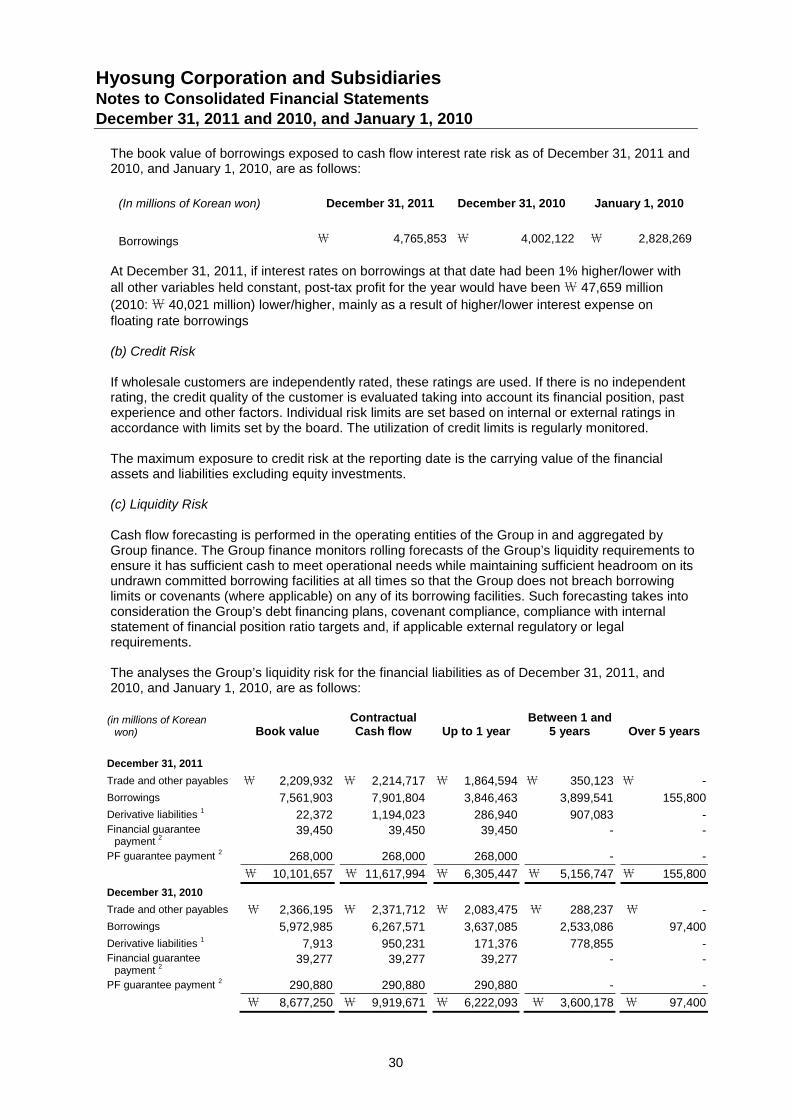
Hyosung Corporation and SubsidiariesNotes to Consolidated Financial StatementsDecember 31, 2011 and 2010, and January 1, 2010
30
The book value of borrowings exposed to cash flow interest rate risk as of December 31, 2011 and2010, and January 1, 2010, are as follows:
(In millions of Korean won) December 31, 2011 December 31, 2010 January 1, 2010
Borrowings \ 4,765,853 \ 4,002,122 \ 2,828,269
At December 31, 2011, if interest rates on borrowings at that date had been 1% higher/lower withall other variables held constant, post-tax profit for the year would have been\ 47,659 million
(2010:\ 40,021 million) lower/higher, mainly as a result of higher/lower interest expense onfloating rate borrowings
(b) Credit Risk
If wholesale customers are independently rated, these ratings are used. If there is no independentrating, the credit quality of the customer is evaluated taking into account its financial position, pastexperience and other factors. Individual risk limits are set based on internal or external ratings inaccordance with limits set by the board. The utilization of credit limits is regularly monitored.
The maximum exposure to credit risk at the reporting date is the carrying value of the financialassets and liabilities excluding equity investments.
(c) Liquidity Risk
Cash flow forecasting is performed in the operating entities of the Group in and aggregated byGroup finance. The Group finance monitors rolling forecasts of the Group’s liquidity requirements toensure it has sufficient cash to meet operational needs while maintaining sufficient headroom on itsundrawn committed borrowing facilities at all times so that the Group does not breach borrowinglimits or covenants (where applicable) on any of its borrowing facilities. Such forecasting takes intoconsideration the Group’s debt financing plans, covenant compliance, compliance with internalstatement of financial position ratio targets and, if applicable external regulatory or legalrequirements.
The analyses the Group’s liquidity risk for the financial liabilities as of December 31, 2011, and2010, and January 1, 2010, are as follows:
(in millions of Koreanwon) Book value
ContractualCash flow Up to 1 year
Between 1 and5 years Over 5 years
December 31, 2011
Trade and other payables \ 2,209,932 \ 2,214,717 \ 1,864,594 \ 350,123 \ -
Borrowings 7,561,903 7,901,804 3,846,463 3,899,541 155,800
Derivative liabilities 1 22,372 1,194,023 286,940 907,083 -Financial guarantee
payment 239,450 39,450 39,450 - -
PF guarantee payment 2 268,000 268,000 268,000 - -
\ 10,101,657 \ 11,617,994 \ 6,305,447 \ 5,156,747 \ 155,800
December 31, 2010
Trade and other payables \ 2,366,195 \ 2,371,712 \ 2,083,475 \ 288,237 \ -
Borrowings 5,972,985 6,267,571 3,637,085 2,533,086 97,400
Derivative liabilities 1 7,913 950,231 171,376 778,855 -Financial guarantee
payment 239,277 39,277 39,277 - -
PF guarantee payment 2 290,880 290,880 290,880 - -
\ 8,677,250 \ 9,919,671 \ 6,222,093 \ 3,600,178 \ 97,400
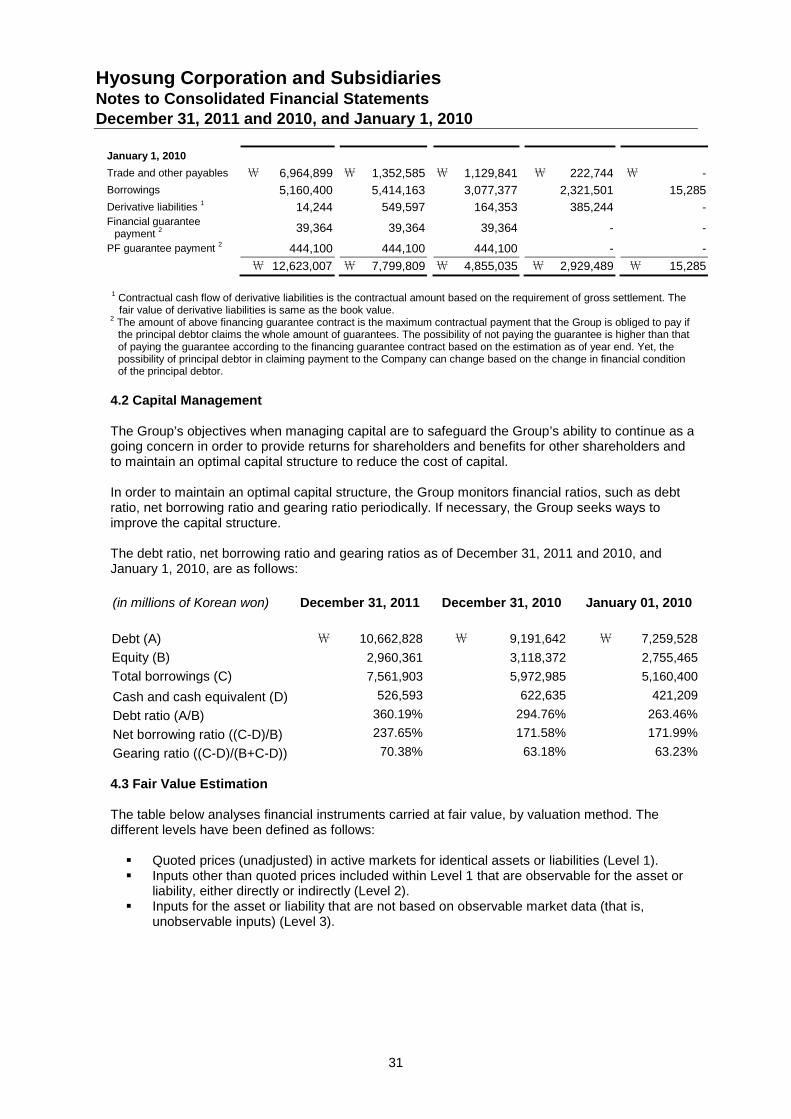
Hyosung Corporation and SubsidiariesNotes to Consolidated Financial StatementsDecember 31, 2011 and 2010, and January 1, 2010
31
January 1, 2010
Trade and other payables \ 6,964,899 \ 1,352,585 \ 1,129,841 \ 222,744 \ -
Borrowings 5,160,400 5,414,163 3,077,377 2,321,501 15,285
Derivative liabilities 1 14,244 549,597 164,353 385,244 -Financial guarantee
payment 2 39,364 39,364 39,364 - -
PF guarantee payment 2 444,100 444,100 444,100 - -
\ 12,623,007 \ 7,799,809 \ 4,855,035 \ 2,929,489 \ 15,285
1 Contractual cash flow of derivative liabilities is the contractual amount based on the requirement of gross settlement. Thefair value of derivative liabilities is same as the book value.
2 The amount of above financing guarantee contract is the maximum contractual payment that the Group is obliged to pay ifthe principal debtor claims the whole amount of guarantees. The possibility of not paying the guarantee is higher than thatof paying the guarantee according to the financing guarantee contract based on the estimation as of year end. Yet, thepossibility of principal debtor in claiming payment to the Company can change based on the change in financial conditionof the principal debtor.
4.2 Capital Management
The Group’s objectives when managing capital are to safeguard the Group’s ability to continue as agoing concern in order to provide returns for shareholders and benefits for other shareholders andto maintain an optimal capital structure to reduce the cost of capital.
In order to maintain an optimal capital structure, the Group monitors financial ratios, such as debtratio, net borrowing ratio and gearing ratio periodically. If necessary, the Group seeks ways toimprove the capital structure.
The debt ratio, net borrowing ratio and gearing ratios as of December 31, 2011 and 2010, andJanuary 1, 2010, are as follows:
(in millions of Korean won) December 31, 2011 December 31, 2010 January 01, 2010
Debt (A) \ 10,662,828 \ 9,191,642 \ 7,259,528
Equity (B) 2,960,361 3,118,372 2,755,465
Total borrowings (C) 7,561,903 5,972,985 5,160,400
Cash and cash equivalent (D) 526,593 622,635 421,209
Debt ratio (A/B) 360.19% 294.76% 263.46%
Net borrowing ratio ((C-D)/B) 237.65% 171.58% 171.99%
Gearing ratio ((C-D)/(B+C-D)) 70.38% 63.18% 63.23%
4.3 Fair Value Estimation
The table below analyses financial instruments carried at fair value, by valuation method. Thedifferent levels have been defined as follows:
Quoted prices (unadjusted) in active markets for identical assets or liabilities (Level 1). Inputs other than quoted prices included within Level 1 that are observable for the asset or
liability, either directly or indirectly (Level 2). Inputs for the asset or liability that are not based on observable market data (that is,
unobservable inputs) (Level 3).
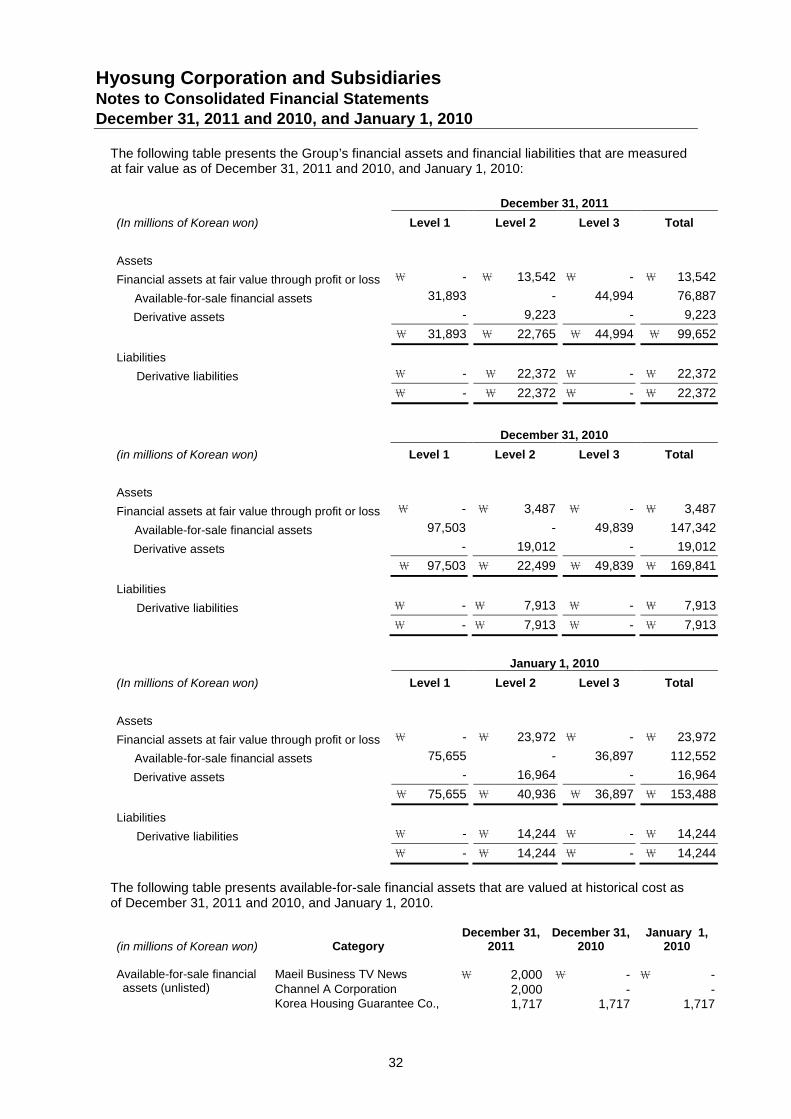
Hyosung Corporation and SubsidiariesNotes to Consolidated Financial StatementsDecember 31, 2011 and 2010, and January 1, 2010
32
The following table presents the Group’s financial assets and financial liabilities that are measuredat fair value as of December 31, 2011 and 2010, and January 1, 2010:
December 31, 2011
(In millions of Korean won) Level 1 Level 2 Level 3 Total
Assets
Financial assets at fair value through profit or loss \ - \ 13,542 \ - \ 13,542
Available-for-sale financial assets 31,893 - 44,994 76,887
Derivative assets - 9,223 - 9,223
\ 31,893 \ 22,765 \ 44,994 \ 99,652
Liabilities
Derivative liabilities \ - \ 22,372 \ - \ 22,372
\ - \ 22,372 \ - \ 22,372
December 31, 2010
(in millions of Korean won) Level 1 Level 2 Level 3 Total
Assets
Financial assets at fair value through profit or loss \ - \ 3,487 \ - \ 3,487
Available-for-sale financial assets 97,503 - 49,839 147,342
Derivative assets - 19,012 - 19,012
\ 97,503 \ 22,499 \ 49,839 \ 169,841
Liabilities
Derivative liabilities \ - \ 7,913 \ - \ 7,913
\ - \ 7,913 \ - \ 7,913
January 1, 2010
(In millions of Korean won) Level 1 Level 2 Level 3 Total
Assets
Financial assets at fair value through profit or loss \ - \ 23,972 \ - \ 23,972
Available-for-sale financial assets 75,655 - 36,897 112,552
Derivative assets - 16,964 - 16,964
\ 75,655 \ 40,936 \ 36,897 \ 153,488
Liabilities
Derivative liabilities \ - \ 14,244 \ - \ 14,244
\ - \ 14,244 \ - \ 14,244
The following table presents available-for-sale financial assets that are valued at historical cost asof December 31, 2011 and 2010, and January 1, 2010.
(in millions of Korean won) CategoryDecember 31,
2011December 31,
2010January 1,
2010
Available-for-sale financialassets (unlisted)
Maeil Business TV News \ 2,000 \ - \ -Channel A Corporation 2,000 - -Korea Housing Guarantee Co., 1,717 1,717 1,717
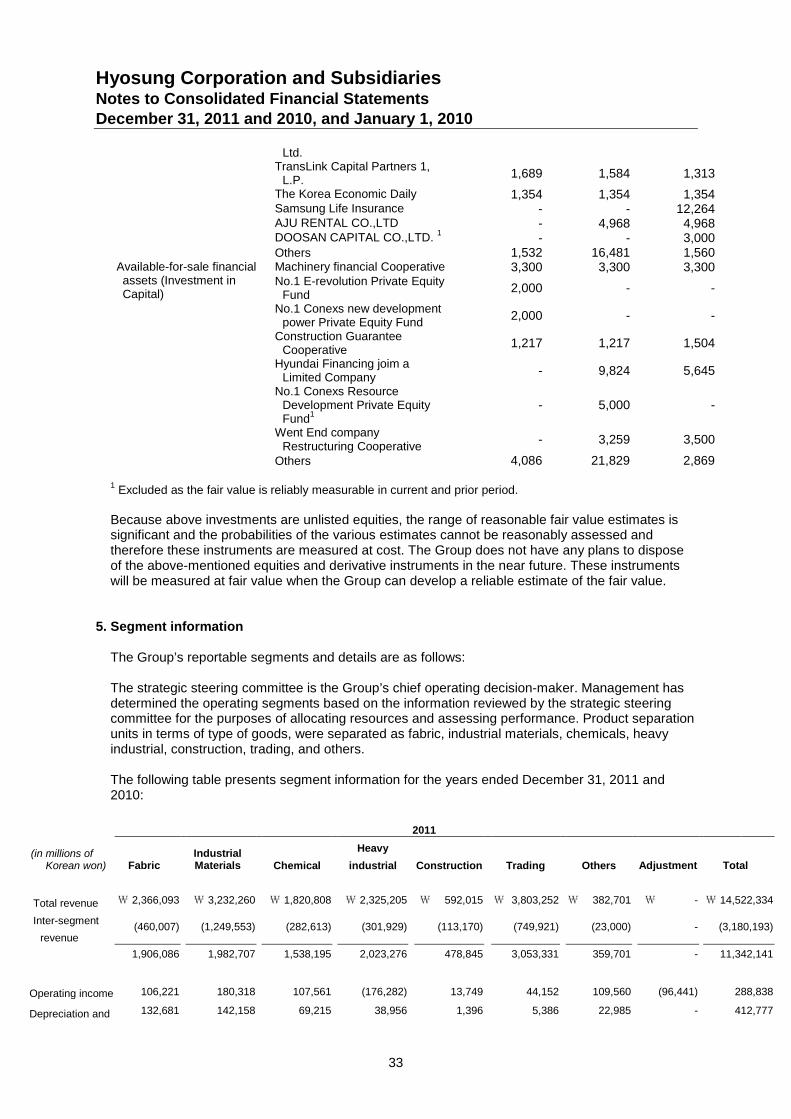
Hyosung Corporation and SubsidiariesNotes to Consolidated Financial StatementsDecember 31, 2011 and 2010, and January 1, 2010
33
Ltd.TransLink Capital Partners 1,
L.P.1,689 1,584 1,313
The Korea Economic Daily 1,354 1,354 1,354Samsung Life Insurance - - 12,264AJU RENTAL CO.,LTD - 4,968 4,968DOOSAN CAPITAL CO.,LTD.
1- - 3,000
Others 1,532 16,481 1,560Available-for-sale financialassets (Investment inCapital)
Machinery financial Cooperative 3,300 3,300 3,300No.1 E-revolution Private Equity
Fund2,000 - -
No.1 Conexs new developmentpower Private Equity Fund
2,000 - -
Construction GuaranteeCooperative
1,217 1,217 1,504
Hyundai Financing joim aLimited Company
- 9,824 5,645
No.1 Conexs ResourceDevelopment Private EquityFund
1- 5,000 -
Went End companyRestructuring Cooperative
- 3,259 3,500
Others 4,086 21,829 2,869
1Excluded as the fair value is reliably measurable in current and prior period.
Because above investments are unlisted equities, the range of reasonable fair value estimates issignificant and the probabilities of the various estimates cannot be reasonably assessed andtherefore these instruments are measured at cost. The Group does not have any plans to disposeof the above-mentioned equities and derivative instruments in the near future. These instrumentswill be measured at fair value when the Group can develop a reliable estimate of the fair value.
5. Segment information
The Group’s reportable segments and details are as follows:
The strategic steering committee is the Group’s chief operating decision-maker. Management hasdetermined the operating segments based on the information reviewed by the strategic steeringcommittee for the purposes of allocating resources and assessing performance. Product separationunits in terms of type of goods, were separated as fabric, industrial materials, chemicals, heavyindustrial, construction, trading, and others.
The following table presents segment information for the years ended December 31, 2011 and2010:
2011
(in millions ofKorean won) Fabric
IndustrialMaterials Chemical
Heavy
industrial Construction Trading Others Adjustment Total
Total revenue \ 2,366,093 \ 3,232,260 \ 1,820,808 \ 2,325,205 \ 592,015 \ 3,803,252 \ 382,701 \ - \ 14,522,334
Inter-segment
revenue(460,007) (1,249,553) (282,613) (301,929) (113,170) (749,921) (23,000) - (3,180,193)
1,906,086 1,982,707 1,538,195 2,023,276 478,845 3,053,331 359,701 - 11,342,141
Operating income 106,221 180,318 107,561 (176,282) 13,749 44,152 109,560 (96,441) 288,838
Depreciation and 132,681 142,158 69,215 38,956 1,396 5,386 22,985 - 412,777
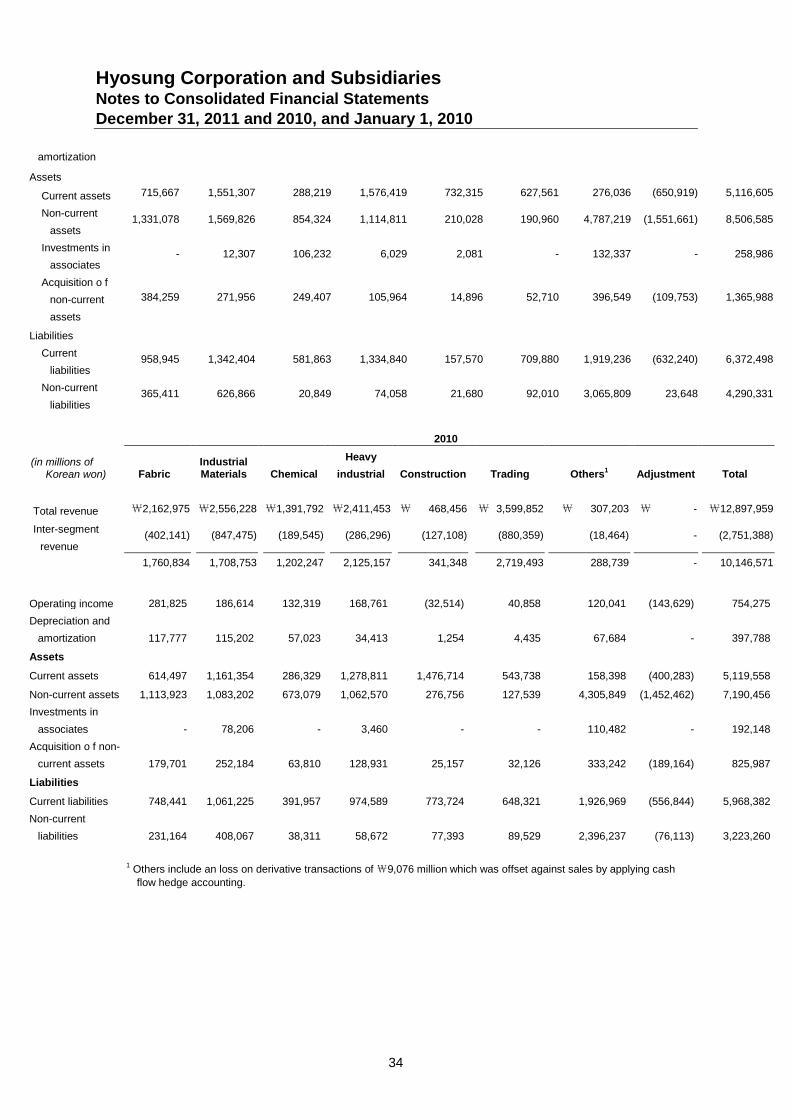
Hyosung Corporation and SubsidiariesNotes to Consolidated Financial StatementsDecember 31, 2011 and 2010, and January 1, 2010
34
amortization
Assets
Current assets 715,667 1,551,307 288,219 1,576,419 732,315 627,561 276,036 (650,919) 5,116,605
Non-current
assets1,331,078 1,569,826 854,324 1,114,811 210,028 190,960 4,787,219 (1,551,661) 8,506,585
Investments in
associates- 12,307 106,232 6,029 2,081 - 132,337 - 258,986
Acquisition o f
non-current
assets
384,259 271,956 249,407 105,964 14,896 52,710 396,549 (109,753) 1,365,988
Liabilities
Current
liabilities958,945 1,342,404 581,863 1,334,840 157,570 709,880 1,919,236 (632,240) 6,372,498
Non-current
liabilities365,411 626,866 20,849 74,058 21,680 92,010 3,065,809 23,648 4,290,331
2010
(in millions ofKorean won) Fabric
IndustrialMaterials Chemical
Heavy
industrial Construction Trading Others1 Adjustment Total
Total revenue \2,162,975 \2,556,228 \1,391,792 \2,411,453 \ 468,456 \ 3,599,852 \ 307,203 \ - \12,897,959
Inter-segment
revenue(402,141) (847,475) (189,545) (286,296) (127,108) (880,359) (18,464) - (2,751,388)
1,760,834 1,708,753 1,202,247 2,125,157 341,348 2,719,493 288,739 - 10,146,571
Operating income 281,825 186,614 132,319 168,761 (32,514) 40,858 120,041 (143,629) 754,275
Depreciation and
amortization 117,777 115,202 57,023 34,413 1,254 4,435 67,684 - 397,788
Assets
Current assets 614,497 1,161,354 286,329 1,278,811 1,476,714 543,738 158,398 (400,283) 5,119,558
Non-current assets 1,113,923 1,083,202 673,079 1,062,570 276,756 127,539 4,305,849 (1,452,462) 7,190,456
Investments in
associates - 78,206 - 3,460 - - 110,482 - 192,148
Acquisition o f non-
current assets 179,701 252,184 63,810 128,931 25,157 32,126 333,242 (189,164) 825,987
Liabilities
Current liabilities 748,441 1,061,225 391,957 974,589 773,724 648,321 1,926,969 (556,844) 5,968,382
Non-current
liabilities 231,164 408,067 38,311 58,672 77,393 89,529 2,396,237 (76,113) 3,223,260
1 Others include an loss on derivative transactions of₩9,076 million which was offset against sales by applying cash
flow hedge accounting.
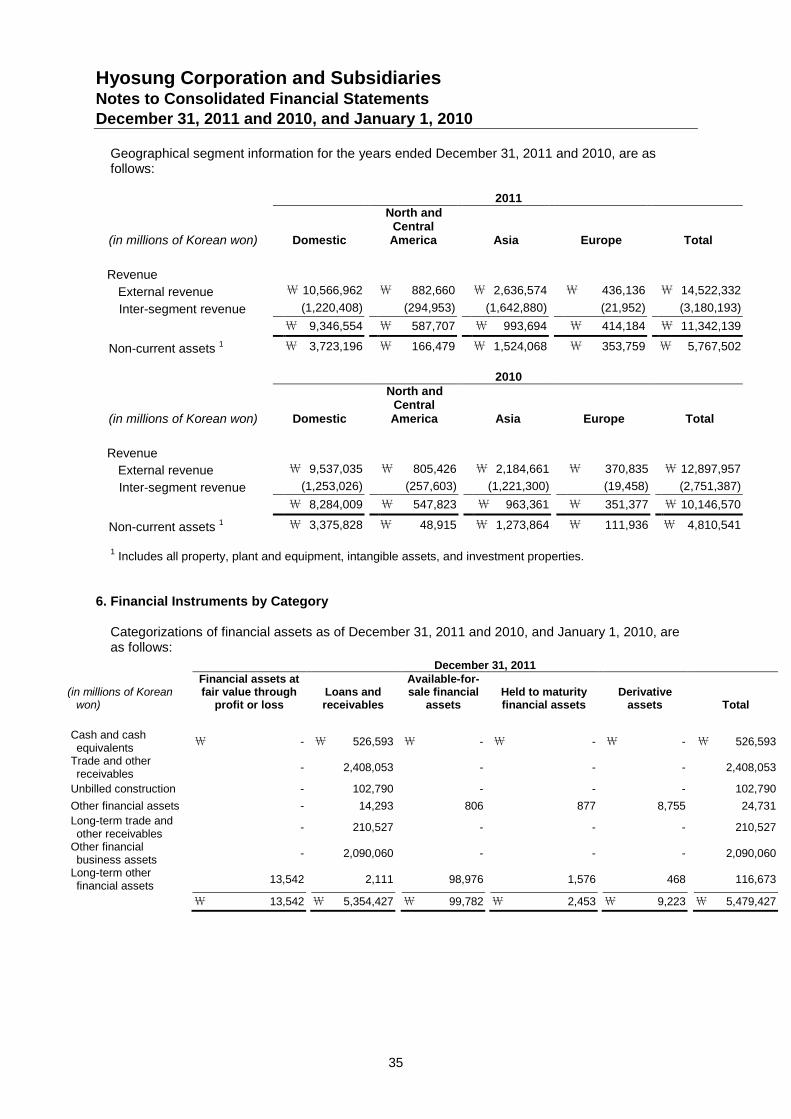
Hyosung Corporation and SubsidiariesNotes to Consolidated Financial StatementsDecember 31, 2011 and 2010, and January 1, 2010
35
Geographical segment information for the years ended December 31, 2011 and 2010, are asfollows:
2011
(in millions of Korean won) Domestic
North andCentralAmerica Asia Europe Total
Revenue
External revenue \ 10,566,962 \ 882,660 \ 2,636,574 \ 436,136 \ 14,522,332
Inter-segment revenue (1,220,408) (294,953) (1,642,880) (21,952) (3,180,193)
\ 9,346,554 \ 587,707 \ 993,694 \ 414,184 \ 11,342,139
Non-current assets 1 \ 3,723,196 \ 166,479 \ 1,524,068 \ 353,759 \ 5,767,502
2010
(in millions of Korean won) Domestic
North andCentralAmerica Asia Europe Total
Revenue
External revenue \ 9,537,035 \ 805,426 \ 2,184,661 \ 370,835 \ 12,897,957
Inter-segment revenue (1,253,026) (257,603) (1,221,300) (19,458) (2,751,387)
\ 8,284,009 \ 547,823 \ 963,361 \ 351,377 \ 10,146,570
Non-current assets 1 \ 3,375,828 \ 48,915 \ 1,273,864 \ 111,936 \ 4,810,541
1Includes all property, plant and equipment, intangible assets, and investment properties.
6. Financial Instruments by Category
Categorizations of financial assets as of December 31, 2011 and 2010, and January 1, 2010, areas follows:
December 31, 2011
(in millions of Koreanwon)
Financial assets atfair value through
profit or lossLoans andreceivables
Available-for-sale financial
assetsHeld to maturityfinancial assets
Derivativeassets Total
Cash and cashequivalents
\ - \ 526,593 \ - \ - \ - \ 526,593
Trade and otherreceivables
- 2,408,053 - - - 2,408,053
Unbilled construction - 102,790 - - - 102,790
Other financial assets - 14,293 806 877 8,755 24,731
Long-term trade andother receivables
- 210,527 - - - 210,527
Other financialbusiness assets
- 2,090,060 - - - 2,090,060
Long-term otherfinancial assets
13,542 2,111 98,976 1,576 468 116,673
\ 13,542 \ 5,354,427 \ 99,782 \ 2,453 \ 9,223 \ 5,479,427
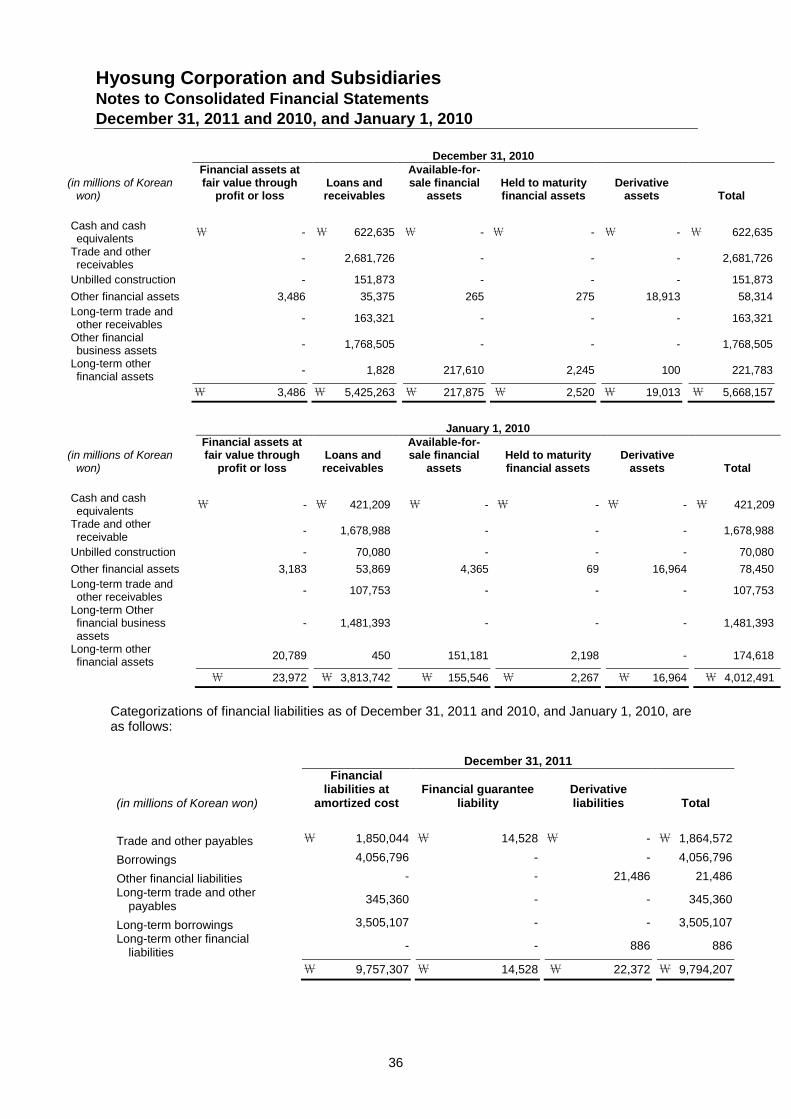
Hyosung Corporation and SubsidiariesNotes to Consolidated Financial StatementsDecember 31, 2011 and 2010, and January 1, 2010
36
December 31, 2010
(in millions of Koreanwon)
Financial assets atfair value through
profit or lossLoans andreceivables
Available-for-sale financial
assetsHeld to maturityfinancial assets
Derivativeassets Total
Cash and cashequivalents
\ - \ 622,635 \ - \ - \ - \ 622,635
Trade and otherreceivables
- 2,681,726 - - - 2,681,726
Unbilled construction - 151,873 - - - 151,873
Other financial assets 3,486 35,375 265 275 18,913 58,314
Long-term trade andother receivables
- 163,321 - - - 163,321
Other financialbusiness assets
- 1,768,505 - - - 1,768,505
Long-term otherfinancial assets
- 1,828 217,610 2,245 100 221,783
\ 3,486 \ 5,425,263 \ 217,875 \ 2,520 \ 19,013 \ 5,668,157
January 1, 2010
(in millions of Koreanwon)
Financial assets atfair value through
profit or lossLoans andreceivables
Available-for-sale financial
assetsHeld to maturityfinancial assets
Derivativeassets Total
Cash and cashequivalents
\ - \ 421,209 \ - \ - \ - \ 421,209
Trade and otherreceivable
- 1,678,988 - - - 1,678,988
Unbilled construction - 70,080 - - - 70,080
Other financial assets 3,183 53,869 4,365 69 16,964 78,450
Long-term trade andother receivables
- 107,753 - - - 107,753
Long-term Otherfinancial businessassets
- 1,481,393 - - - 1,481,393
Long-term otherfinancial assets
20,789 450 151,181 2,198 - 174,618
\ 23,972 \ 3,813,742 \ 155,546 \ 2,267 \ 16,964 \ 4,012,491
Categorizations of financial liabilities as of December 31, 2011 and 2010, and January 1, 2010, areas follows:
December 31, 2011
(in millions of Korean won)
Financialliabilities at
amortized costFinancial guarantee
liabilityDerivativeliabilities Total
Trade and other payables \ 1,850,044 \ 14,528 \ - \ 1,864,572
Borrowings 4,056,796 - - 4,056,796
Other financial liabilities - - 21,486 21,486
Long-term trade and otherpayables
345,360 - - 345,360
Long-term borrowings 3,505,107 - - 3,505,107
Long-term other financialliabilities
- - 886 886
\ 9,757,307 \ 14,528 \ 22,372 \ 9,794,207
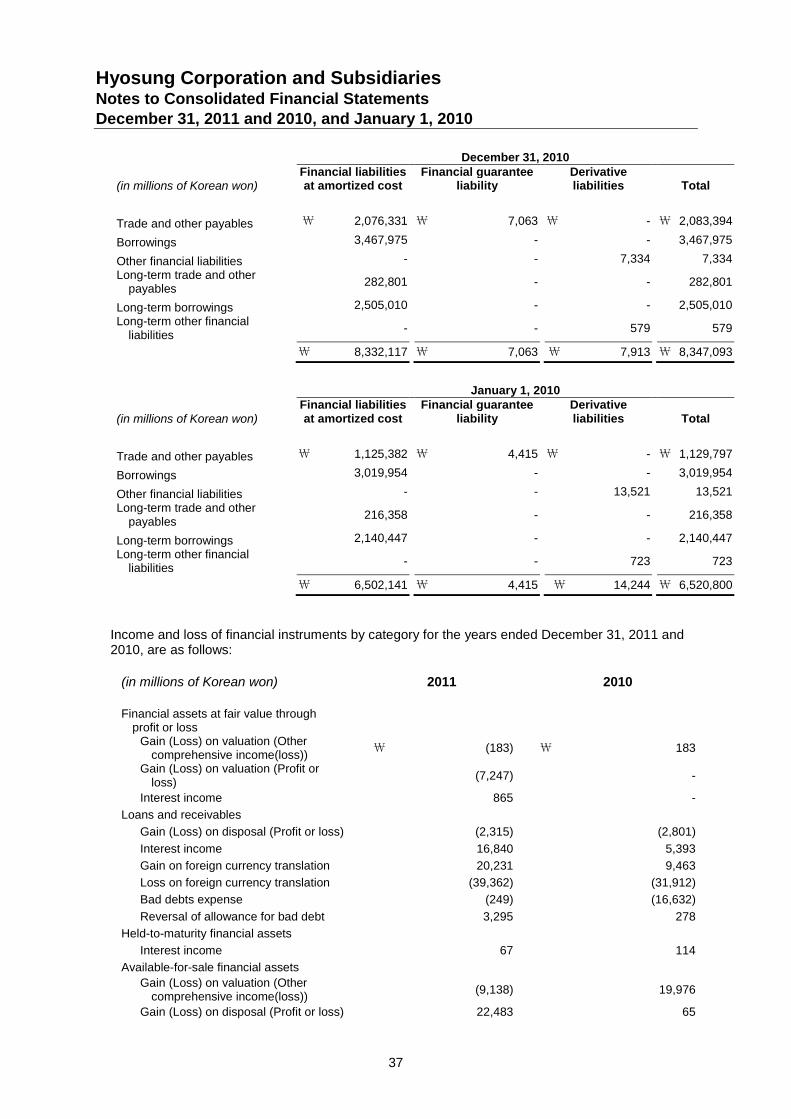
Hyosung Corporation and SubsidiariesNotes to Consolidated Financial StatementsDecember 31, 2011 and 2010, and January 1, 2010
37
December 31, 2010
(in millions of Korean won)Financial liabilitiesat amortized cost
Financial guaranteeliability
Derivativeliabilities Total
Trade and other payables \ 2,076,331 \ 7,063 \ - \ 2,083,394
Borrowings 3,467,975 - - 3,467,975
Other financial liabilities - - 7,334 7,334
Long-term trade and otherpayables
282,801 - - 282,801
Long-term borrowings 2,505,010 - - 2,505,010
Long-term other financialliabilities
- - 579 579
\ 8,332,117 \ 7,063 \ 7,913 \ 8,347,093
January 1, 2010
(in millions of Korean won)Financial liabilitiesat amortized cost
Financial guaranteeliability
Derivativeliabilities Total
Trade and other payables \ 1,125,382 \ 4,415 \ - \ 1,129,797
Borrowings 3,019,954 - - 3,019,954
Other financial liabilities - - 13,521 13,521
Long-term trade and otherpayables
216,358 - - 216,358
Long-term borrowings 2,140,447 - - 2,140,447
Long-term other financialliabilities
- - 723 723
\ 6,502,141 \ 4,415 \ 14,244 \ 6,520,800
Income and loss of financial instruments by category for the years ended December 31, 2011 and2010, are as follows:
(in millions of Korean won) 2011 2010
Financial assets at fair value throughprofit or loss
Gain (Loss) on valuation (Othercomprehensive income(loss))
\ (183) \ 183
Gain (Loss) on valuation (Profit orloss)
(7,247) -
Interest income 865 -
Loans and receivables
Gain (Loss) on disposal (Profit or loss) (2,315) (2,801)
Interest income 16,840 5,393
Gain on foreign currency translation 20,231 9,463
Loss on foreign currency translation (39,362) (31,912)
Bad debts expense (249) (16,632)
Reversal of allowance for bad debt 3,295 278
Held-to-maturity financial assets
Interest income 67 114
Available-for-sale financial assets
Gain (Loss) on valuation (Othercomprehensive income(loss))
(9,138) 19,976
Gain (Loss) on disposal (Profit or loss) 22,483 65
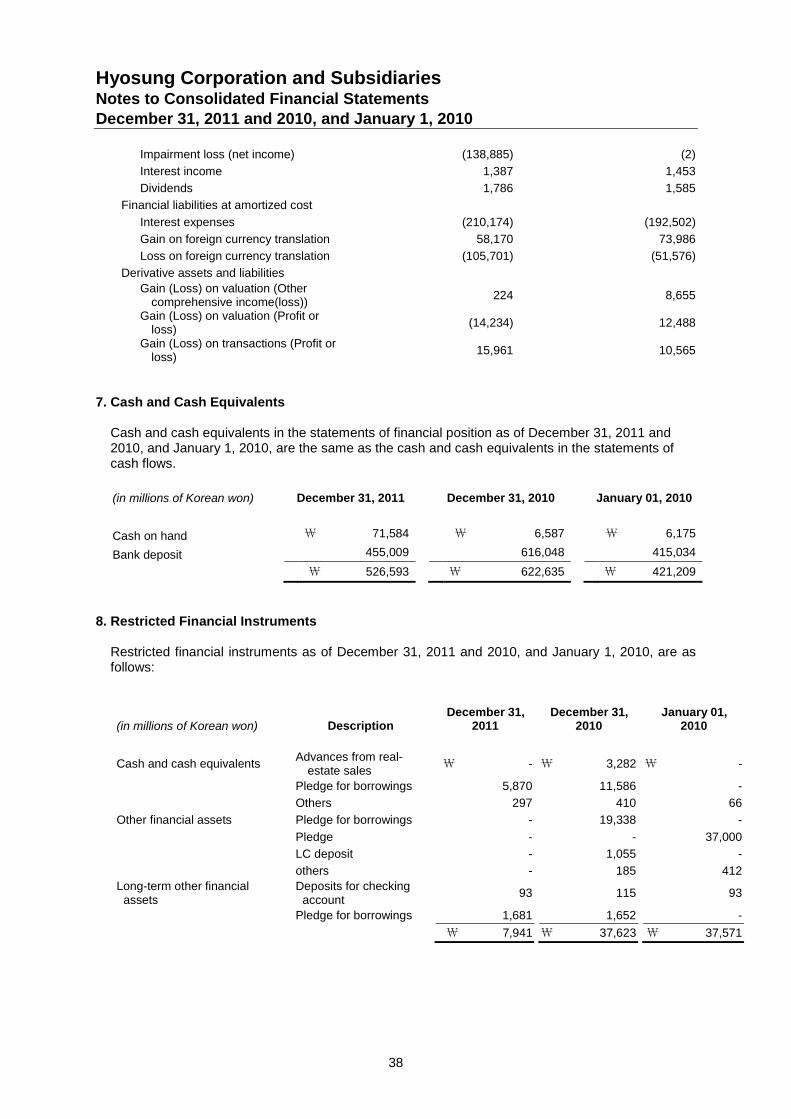
Hyosung Corporation and SubsidiariesNotes to Consolidated Financial StatementsDecember 31, 2011 and 2010, and January 1, 2010
38
Impairment loss (net income) (138,885) (2)
Interest income 1,387 1,453
Dividends 1,786 1,585
Financial liabilities at amortized cost
Interest expenses (210,174) (192,502)
Gain on foreign currency translation 58,170 73,986
Loss on foreign currency translation (105,701) (51,576)
Derivative assets and liabilities
Gain (Loss) on valuation (Othercomprehensive income(loss))
224 8,655
Gain (Loss) on valuation (Profit orloss)
(14,234) 12,488
Gain (Loss) on transactions (Profit orloss)
15,961 10,565
7. Cash and Cash Equivalents
Cash and cash equivalents in the statements of financial position as of December 31, 2011 and2010, and January 1, 2010, are the same as the cash and cash equivalents in the statements ofcash flows.
(in millions of Korean won) December 31, 2011 December 31, 2010 January 01, 2010
Cash on hand \ 71,584 \ 6,587 \ 6,175
Bank deposit 455,009 616,048 415,034
\ 526,593 \ 622,635 \ 421,209
8. Restricted Financial Instruments
Restricted financial instruments as of December 31, 2011 and 2010, and January 1, 2010, are asfollows:
(in millions of Korean won) DescriptionDecember 31,
2011December 31,
2010January 01,
2010
Cash and cash equivalentsAdvances from real-
estate sales\ - \ 3,282 \ -
Pledge for borrowings 5,870 11,586 -
Others 297 410 66
Other financial assets Pledge for borrowings - 19,338 -
Pledge - - 37,000
LC deposit - 1,055 -
others - 185 412
Long-term other financialassets
Deposits for checkingaccount
93 115 93
Pledge for borrowings 1,681 1,652 -
\ 7,941 \ 37,623 \ 37,571
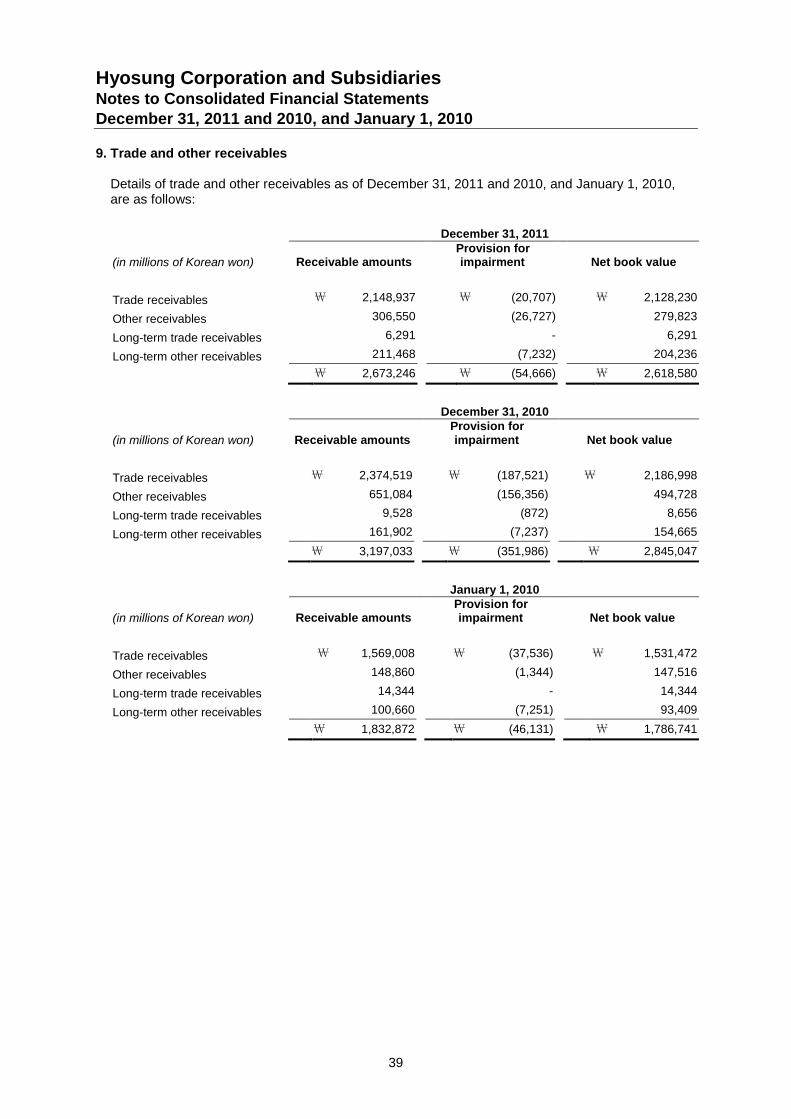
Hyosung Corporation and SubsidiariesNotes to Consolidated Financial StatementsDecember 31, 2011 and 2010, and January 1, 2010
39
9. Trade and other receivables
Details of trade and other receivables as of December 31, 2011 and 2010, and January 1, 2010,are as follows:
December 31, 2011
(in millions of Korean won) Receivable amountsProvision forimpairment Net book value
Trade receivables \ 2,148,937 \ (20,707) \ 2,128,230
Other receivables 306,550 (26,727) 279,823
Long-term trade receivables 6,291 - 6,291
Long-term other receivables 211,468 (7,232) 204,236
\ 2,673,246 \ (54,666) \ 2,618,580
December 31, 2010
(in millions of Korean won) Receivable amountsProvision forimpairment Net book value
Trade receivables \ 2,374,519 \ (187,521) \ 2,186,998
Other receivables 651,084 (156,356) 494,728
Long-term trade receivables 9,528 (872) 8,656
Long-term other receivables 161,902 (7,237) 154,665
\ 3,197,033 \ (351,986) \ 2,845,047
January 1, 2010
(in millions of Korean won) Receivable amountsProvision forimpairment Net book value
Trade receivables \ 1,569,008 \ (37,536) \ 1,531,472
Other receivables 148,860 (1,344) 147,516
Long-term trade receivables 14,344 - 14,344
Long-term other receivables 100,660 (7,251) 93,409
\ 1,832,872 \ (46,131) \ 1,786,741
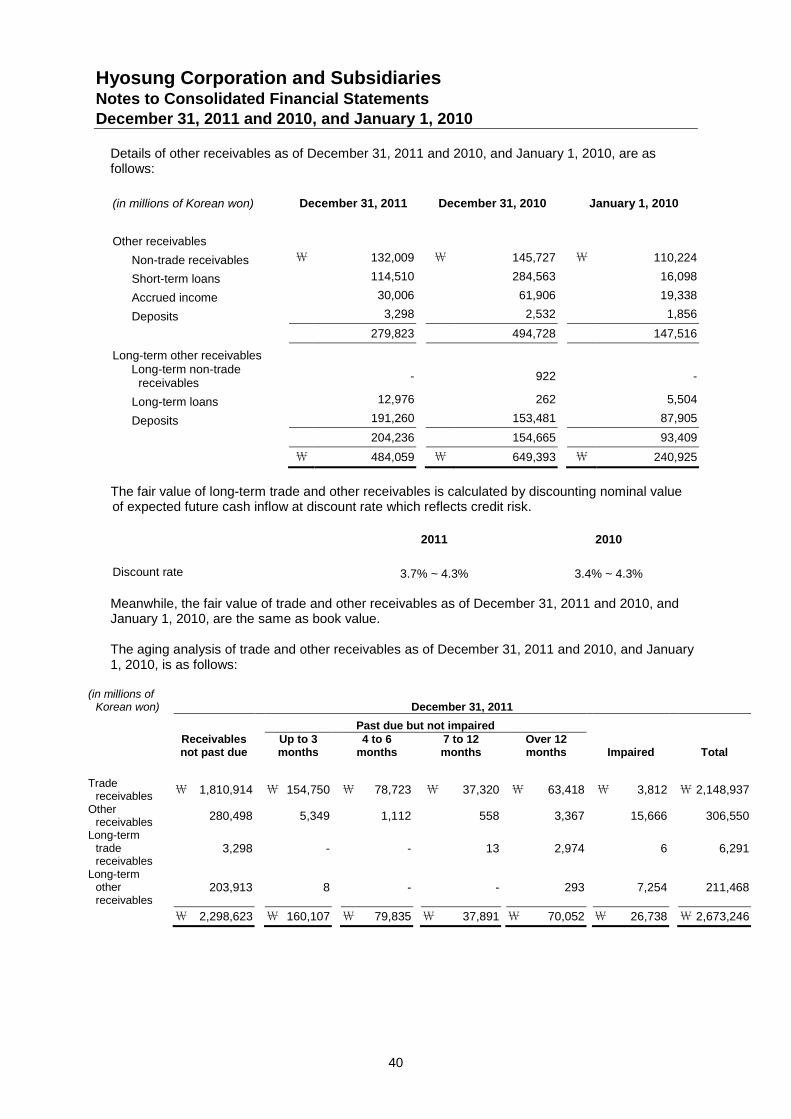
Hyosung Corporation and SubsidiariesNotes to Consolidated Financial StatementsDecember 31, 2011 and 2010, and January 1, 2010
40
Details of other receivables as of December 31, 2011 and 2010, and January 1, 2010, are asfollows:
(in millions of Korean won) December 31, 2011 December 31, 2010 January 1, 2010
Other receivables
Non-trade receivables \ 132,009 \ 145,727 \ 110,224
Short-term loans 114,510 284,563 16,098
Accrued income 30,006 61,906 19,338
Deposits 3,298 2,532 1,856
279,823 494,728 147,516
Long-term other receivablesLong-term non-trade
receivables- 922 -
Long-term loans 12,976 262 5,504
Deposits 191,260 153,481 87,905
204,236 154,665 93,409
\ 484,059 \ 649,393 \ 240,925
The fair value of long-term trade and other receivables is calculated by discounting nominal valueof expected future cash inflow at discount rate which reflects credit risk.
2011 2010
Discount rate 3.7% ~ 4.3% 3.4% ~ 4.3%
Meanwhile, the fair value of trade and other receivables as of December 31, 2011 and 2010, andJanuary 1, 2010, are the same as book value.
The aging analysis of trade and other receivables as of December 31, 2011 and 2010, and January1, 2010, is as follows:
(in millions ofKorean won) December 31, 2011
Past due but not impairedReceivablesnot past due
Up to 3months
4 to 6months
7 to 12months
Over 12months Impaired Total
Tradereceivables
\ 1,810,914 \ 154,750 \ 78,723 \ 37,320 \ 63,418 \ 3,812 \ 2,148,937
Otherreceivables
280,498 5,349 1,112 558 3,367 15,666 306,550
Long-termtradereceivables
3,298 - - 13 2,974 6 6,291
Long-termotherreceivables
203,913 8 - - 293 7,254 211,468
\ 2,298,623 \ 160,107 \ 79,835 \ 37,891 \ 70,052 \ 26,738 \ 2,673,246
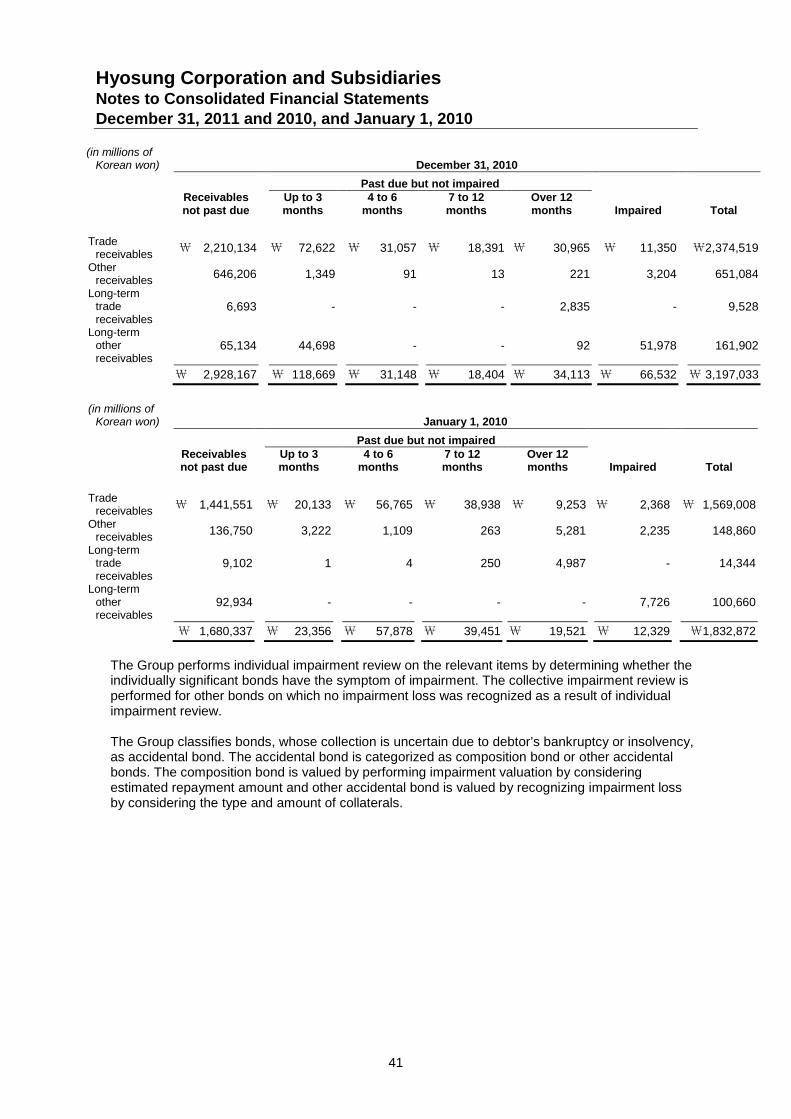
Hyosung Corporation and SubsidiariesNotes to Consolidated Financial StatementsDecember 31, 2011 and 2010, and January 1, 2010
41
(in millions ofKorean won) December 31, 2010
Past due but not impairedReceivablesnot past due
Up to 3months
4 to 6months
7 to 12months
Over 12months Impaired Total
Tradereceivables
\ 2,210,134 \ 72,622 \ 31,057 \ 18,391 \ 30,965 \ 11,350 \2,374,519
Otherreceivables
646,206 1,349 91 13 221 3,204 651,084
Long-termtradereceivables
6,693 - - - 2,835 - 9,528
Long-termotherreceivables
65,134 44,698 - - 92 51,978 161,902
\ 2,928,167 \ 118,669 \ 31,148 \ 18,404 \ 34,113 \ 66,532 \ 3,197,033
(in millions ofKorean won) January 1, 2010
Past due but not impairedReceivablesnot past due
Up to 3months
4 to 6months
7 to 12months
Over 12months Impaired Total
Tradereceivables
\ 1,441,551 \ 20,133 \ 56,765 \ 38,938 \ 9,253 \ 2,368 \ 1,569,008
Otherreceivables
136,750 3,222 1,109 263 5,281 2,235 148,860
Long-termtradereceivables
9,102 1 4 250 4,987 - 14,344
Long-termotherreceivables
92,934 - - - - 7,726 100,660
\ 1,680,337 \ 23,356 \ 57,878 \ 39,451 \ 19,521 \ 12,329 \1,832,872
The Group performs individual impairment review on the relevant items by determining whether theindividually significant bonds have the symptom of impairment. The collective impairment review isperformed for other bonds on which no impairment loss was recognized as a result of individualimpairment review.
The Group classifies bonds, whose collection is uncertain due to debtor’s bankruptcy or insolvency,as accidental bond. The accidental bond is categorized as composition bond or other accidentalbonds. The composition bond is valued by performing impairment valuation by consideringestimated repayment amount and other accidental bond is valued by recognizing impairment lossby considering the type and amount of collaterals.
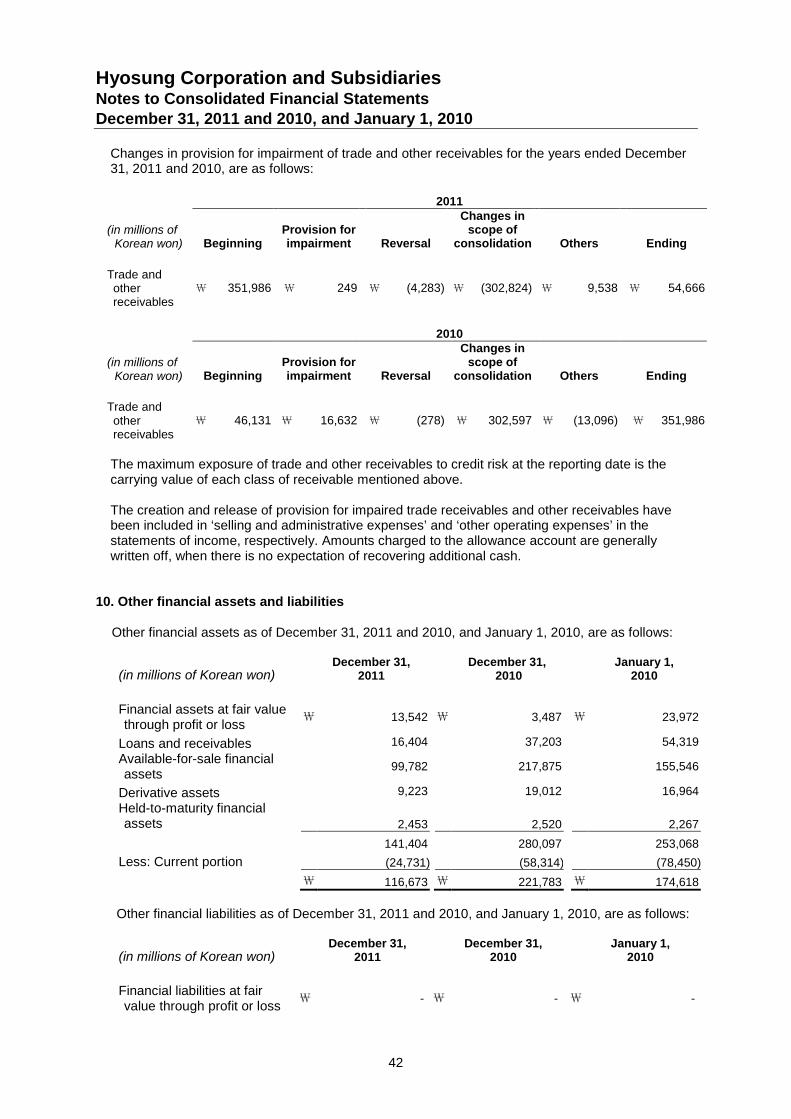
Hyosung Corporation and SubsidiariesNotes to Consolidated Financial StatementsDecember 31, 2011 and 2010, and January 1, 2010
42
Changes in provision for impairment of trade and other receivables for the years ended December31, 2011 and 2010, are as follows:
2011
(in millions ofKorean won) Beginning
Provision forimpairment Reversal
Changes inscope of
consolidation Others Ending
Trade andotherreceivables
\ 351,986 \ 249 \ (4,283) \ (302,824) \ 9,538 \ 54,666
2010
(in millions ofKorean won) Beginning
Provision forimpairment Reversal
Changes inscope of
consolidation Others Ending
Trade andotherreceivables
\ 46,131 \ 16,632 \ (278) \ 302,597 \ (13,096) \ 351,986
The maximum exposure of trade and other receivables to credit risk at the reporting date is thecarrying value of each class of receivable mentioned above.
The creation and release of provision for impaired trade receivables and other receivables havebeen included in ‘selling and administrative expenses’ and ‘other operating expenses’ in thestatements of income, respectively. Amounts charged to the allowance account are generallywritten off, when there is no expectation of recovering additional cash.
10. Other financial assets and liabilities
Other financial assets as of December 31, 2011 and 2010, and January 1, 2010, are as follows:
(in millions of Korean won)December 31,
2011December 31,
2010January 1,
2010
Financial assets at fair valuethrough profit or loss
₩ 13,542 ₩ 3,487 ₩ 23,972
Loans and receivables 16,404 37,203 54,319
Available-for-sale financialassets
99,782 217,875 155,546
Derivative assets 9,223 19,012 16,964
Held-to-maturity financialassets 2,453 2,520 2,267
141,404 280,097 253,068
Less: Current portion (24,731) (58,314) (78,450)
₩ 116,673 ₩ 221,783 ₩ 174,618
Other financial liabilities as of December 31, 2011 and 2010, and January 1, 2010, are as follows:
(in millions of Korean won)December 31,
2011December 31,
2010January 1,
2010
Financial liabilities at fairvalue through profit or loss
₩ - ₩ - ₩ -
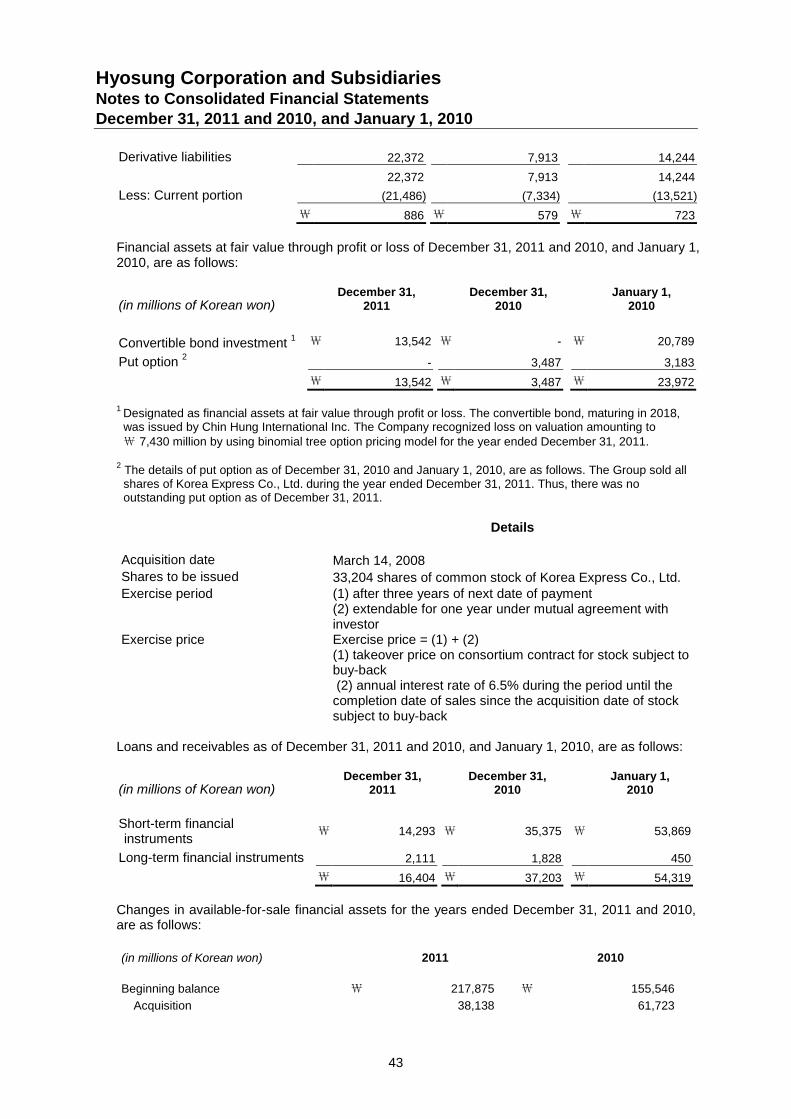
Hyosung Corporation and SubsidiariesNotes to Consolidated Financial StatementsDecember 31, 2011 and 2010, and January 1, 2010
43
Derivative liabilities 22,372 7,913 14,244
22,372 7,913 14,244
Less: Current portion (21,486) (7,334) (13,521)
₩ 886 ₩ 579 ₩ 723
Financial assets at fair value through profit or loss of December 31, 2011 and 2010, and January 1,2010, are as follows:
(in millions of Korean won)December 31,
2011December 31,
2010January 1,
2010
Convertible bond investment1 ₩ 13,542 ₩ - ₩ 20,789
Put option2
- 3,487 3,183
₩ 13,542 ₩ 3,487 ₩ 23,972
1Designated as financial assets at fair value through profit or loss. The convertible bond, maturing in 2018,was issued by Chin Hung International Inc. The Company recognized loss on valuation amounting to₩ 7,430 million by using binomial tree option pricing model for the year ended December 31, 2011.
2The details of put option as of December 31, 2010 and January 1, 2010, are as follows. The Group sold allshares of Korea Express Co., Ltd. during the year ended December 31, 2011. Thus, there was nooutstanding put option as of December 31, 2011.
Details
Acquisition date March 14, 2008Shares to be issued 33,204 shares of common stock of Korea Express Co., Ltd.Exercise period (1) after three years of next date of payment
(2) extendable for one year under mutual agreement withinvestor
Exercise price Exercise price = (1) + (2)(1) takeover price on consortium contract for stock subject tobuy-back(2) annual interest rate of 6.5% during the period until thecompletion date of sales since the acquisition date of stocksubject to buy-back
Loans and receivables as of December 31, 2011 and 2010, and January 1, 2010, are as follows:
(in millions of Korean won)December 31,
2011December 31,
2010January 1,
2010
Short-term financialinstruments
₩ 14,293 ₩ 35,375 ₩ 53,869
Long-term financial instruments 2,111 1,828 450
₩ 16,404 ₩ 37,203 ₩ 54,319
Changes in available-for-sale financial assets for the years ended December 31, 2011 and 2010,are as follows:
(in millions of Korean won) 2011 2010
Beginning balance ₩ 217,875 ₩ 155,546
Acquisition 38,138 61,723
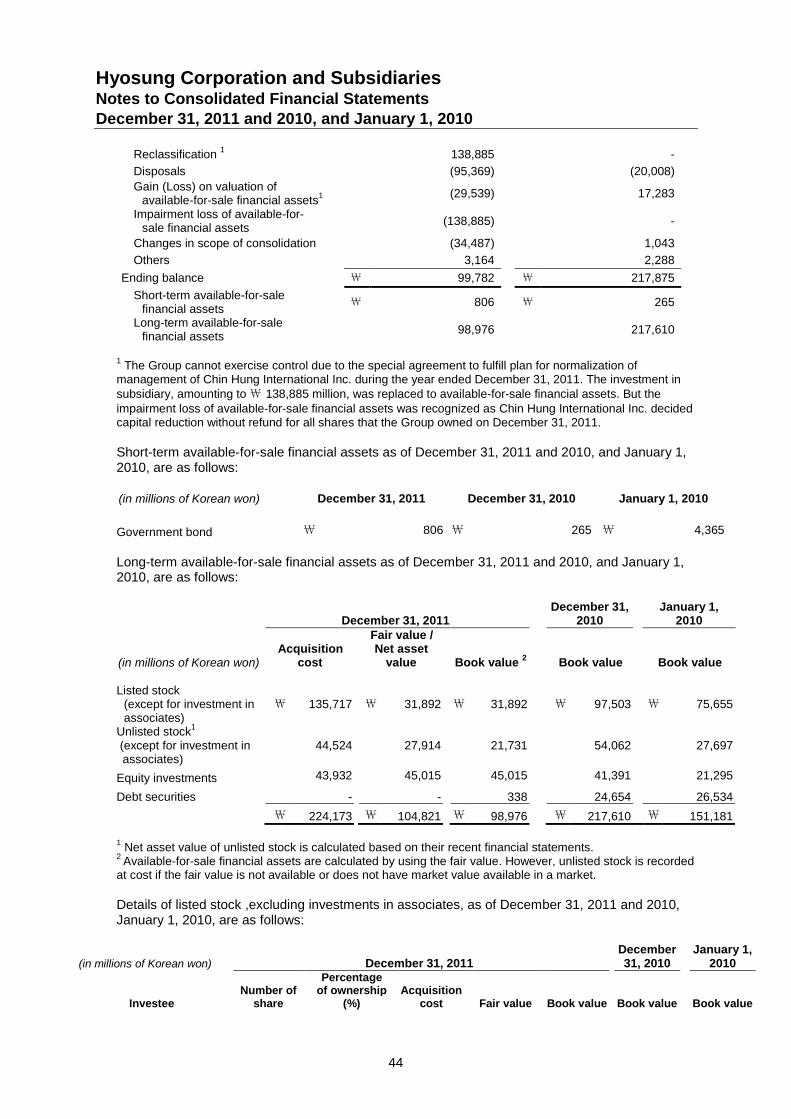
Hyosung Corporation and SubsidiariesNotes to Consolidated Financial StatementsDecember 31, 2011 and 2010, and January 1, 2010
44
Reclassification1
138,885 -
Disposals (95,369) (20,008)
Gain (Loss) on valuation ofavailable-for-sale financial assets
1 (29,539) 17,283
Impairment loss of available-for-sale financial assets
(138,885) -
Changes in scope of consolidation (34,487) 1,043
Others 3,164 2,288
Ending balance \ 99,782 \ 217,875
Short-term available-for-salefinancial assets
\ 806 \ 265
Long-term available-for-salefinancial assets
98,976 217,610
1The Group cannot exercise control due to the special agreement to fulfill plan for normalization of
management of Chin Hung International Inc. during the year ended December 31, 2011. The investment insubsidiary, amounting to₩ 138,885 million, was replaced to available-for-sale financial assets. But theimpairment loss of available-for-sale financial assets was recognized as Chin Hung International Inc. decidedcapital reduction without refund for all shares that the Group owned on December 31, 2011.
Short-term available-for-sale financial assets as of December 31, 2011 and 2010, and January 1,2010, are as follows:
(in millions of Korean won) December 31, 2011 December 31, 2010 January 1, 2010
Government bond \ 806 \ 265 \ 4,365
Long-term available-for-sale financial assets as of December 31, 2011 and 2010, and January 1,2010, are as follows:
December 31, 2011December 31,
2010January 1,
2010
(in millions of Korean won)Acquisition
cost
Fair value /Net asset
value Book value2
Book value Book value
Listed stock(except for investment inassociates)
₩ 135,717 ₩ 31,892 ₩ 31,892 ₩ 97,503 ₩ 75,655
Unlisted stock1
(except for investment inassociates)
44,524 27,914 21,731 54,062 27,697
Equity investments 43,932 45,015 45,015 41,391 21,295
Debt securities - - 338 24,654 26,534
₩ 224,173 ₩ 104,821 ₩ 98,976 ₩ 217,610 ₩ 151,181
1Net asset value of unlisted stock is calculated based on their recent financial statements.
2Available-for-sale financial assets are calculated by using the fair value. However, unlisted stock is recorded
at cost if the fair value is not available or does not have market value available in a market.
Details of listed stock ,excluding investments in associates, as of December 31, 2011 and 2010,January 1, 2010, are as follows:
(in millions of Korean won) December 31, 2011December31, 2010
January 1,2010
InvesteeNumber of
share
Percentageof ownership
(%)Acquisition
cost Fair value Book value Book value Book value
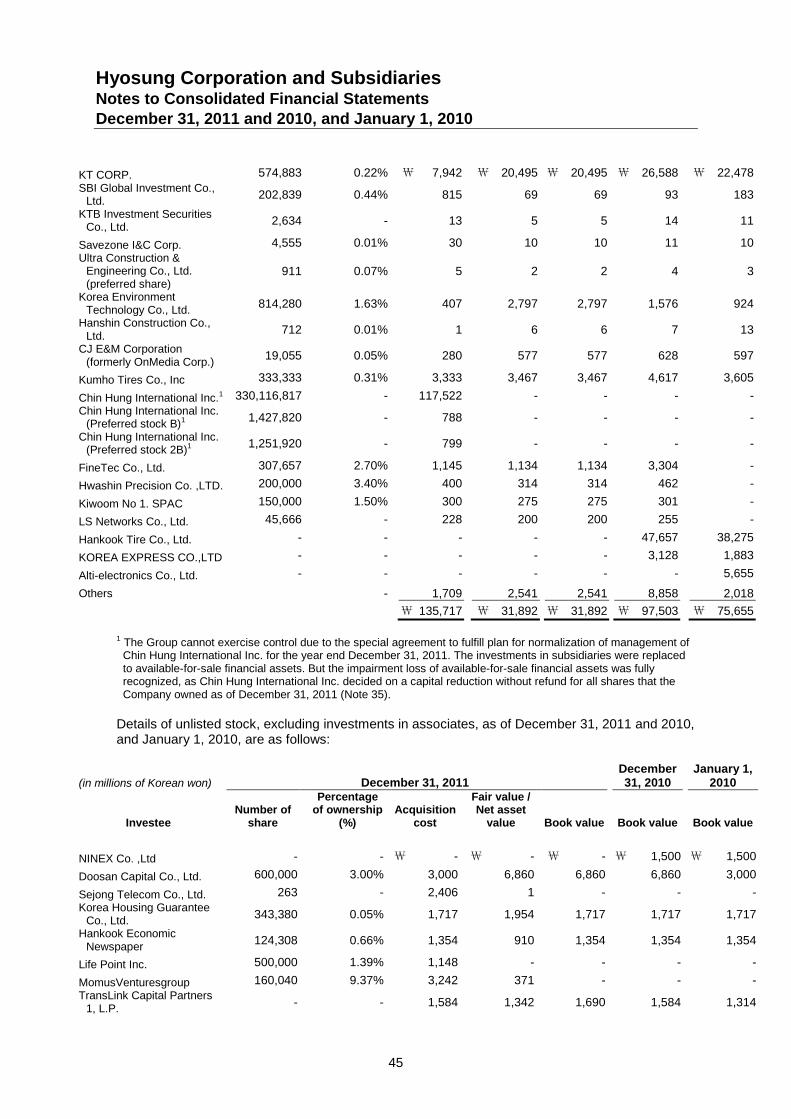
Hyosung Corporation and SubsidiariesNotes to Consolidated Financial StatementsDecember 31, 2011 and 2010, and January 1, 2010
45
KT CORP. 574,883 0.22% ₩ 7,942 ₩ 20,495 ₩ 20,495 ₩ 26,588 ₩ 22,478
SBI Global Investment Co.,Ltd.
202,839 0.44% 815 69 69 93 183
KTB Investment SecuritiesCo., Ltd.
2,634 - 13 5 5 14 11
Savezone I&C Corp. 4,555 0.01% 30 10 10 11 10
Ultra Construction &Engineering Co., Ltd.(preferred share)
911 0.07% 5 2 2 4 3
Korea EnvironmentTechnology Co., Ltd.
814,280 1.63% 407 2,797 2,797 1,576 924
Hanshin Construction Co.,Ltd.
712 0.01% 1 6 6 7 13
CJ E&M Corporation(formerly OnMedia Corp.)
19,055 0.05% 280 577 577 628 597
Kumho Tires Co., Inc 333,333 0.31% 3,333 3,467 3,467 4,617 3,605
Chin Hung International Inc.1 330,116,817 - 117,522 - - - -
Chin Hung International Inc.(Preferred stock B)1 1,427,820 - 788 - - - -
Chin Hung International Inc.(Preferred stock 2B)1 1,251,920 - 799 - - - -
FineTec Co., Ltd. 307,657 2.70% 1,145 1,134 1,134 3,304 -
Hwashin Precision Co. ,LTD. 200,000 3.40% 400 314 314 462 -
Kiwoom No 1. SPAC 150,000 1.50% 300 275 275 301 -
LS Networks Co., Ltd. 45,666 - 228 200 200 255 -
Hankook Tire Co., Ltd. - - - - - 47,657 38,275
KOREA EXPRESS CO.,LTD - - - - - 3,128 1,883
Alti-electronics Co., Ltd. - - - - - - 5,655
Others - 1,709 2,541 2,541 8,858 2,018
₩ 135,717 ₩ 31,892 ₩ 31,892 ₩ 97,503 ₩ 75,655
1 The Group cannot exercise control due to the special agreement to fulfill plan for normalization of management ofChin Hung International Inc. for the year end December 31, 2011. The investments in subsidiaries were replacedto available-for-sale financial assets. But the impairment loss of available-for-sale financial assets was fullyrecognized, as Chin Hung International Inc. decided on a capital reduction without refund for all shares that theCompany owned as of December 31, 2011 (Note 35).
Details of unlisted stock, excluding investments in associates, as of December 31, 2011 and 2010,and January 1, 2010, are as follows:
(in millions of Korean won) December 31, 2011December31, 2010
January 1,2010
InvesteeNumber of
share
Percentageof ownership
(%)Acquisition
cost
Fair value /Net asset
value Book value Book value Book value
NINEX Co. ,Ltd - - ₩ - ₩ - ₩ - ₩ 1,500 ₩ 1,500
Doosan Capital Co., Ltd. 600,000 3.00% 3,000 6,860 6,860 6,860 3,000
Sejong Telecom Co., Ltd. 263 - 2,406 1 - - -
Korea Housing GuaranteeCo., Ltd.
343,380 0.05% 1,717 1,954 1,717 1,717 1,717
Hankook EconomicNewspaper
124,308 0.66% 1,354 910 1,354 1,354 1,354
Life Point Inc. 500,000 1.39% 1,148 - - - -
MomusVenturesgroup 160,040 9.37% 3,242 371 - - -
TransLink Capital Partners1, L.P.
- - 1,584 1,342 1,690 1,584 1,314
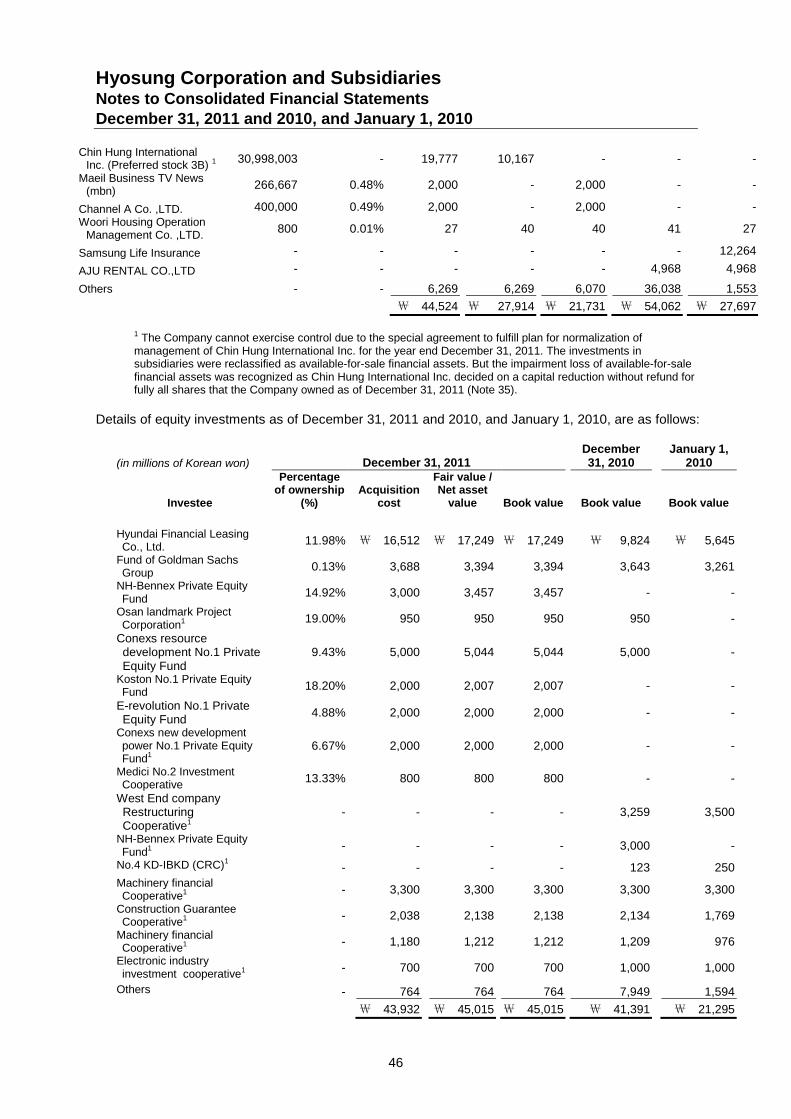
Hyosung Corporation and SubsidiariesNotes to Consolidated Financial StatementsDecember 31, 2011 and 2010, and January 1, 2010
46
Chin Hung InternationalInc. (Preferred stock 3B) 1 30,998,003 - 19,777 10,167 - - -
Maeil Business TV News(mbn)
266,667 0.48% 2,000 - 2,000 - -
Channel A Co. ,LTD. 400,000 0.49% 2,000 - 2,000 - -
Woori Housing OperationManagement Co. ,LTD.
800 0.01% 27 40 40 41 27
Samsung Life Insurance - - - - - - 12,264
AJU RENTAL CO.,LTD - - - - - 4,968 4,968
Others - - 6,269 6,269 6,070 36,038 1,553
₩ 44,524 ₩ 27,914 ₩ 21,731 ₩ 54,062 ₩ 27,697
1 The Company cannot exercise control due to the special agreement to fulfill plan for normalization ofmanagement of Chin Hung International Inc. for the year end December 31, 2011. The investments insubsidiaries were reclassified as available-for-sale financial assets. But the impairment loss of available-for-salefinancial assets was recognized as Chin Hung International Inc. decided on a capital reduction without refund forfully all shares that the Company owned as of December 31, 2011 (Note 35).
Details of equity investments as of December 31, 2011 and 2010, and January 1, 2010, are as follows:
(in millions of Korean won) December 31, 2011December31, 2010
January 1,2010
Investee
Percentageof ownership
(%)Acquisition
cost
Fair value /Net asset
value Book value Book value Book value
Hyundai Financial LeasingCo., Ltd.
11.98% ₩ 16,512 ₩ 17,249 ₩ 17,249 ₩ 9,824 ₩ 5,645
Fund of Goldman SachsGroup
0.13% 3,688 3,394 3,394 3,643 3,261
NH-Bennex Private EquityFund
14.92% 3,000 3,457 3,457 - -
Osan landmark ProjectCorporation1 19.00% 950 950 950 950 -
Conexs resourcedevelopment No.1 PrivateEquity Fund
9.43% 5,000 5,044 5,044 5,000 -
Koston No.1 Private EquityFund
18.20% 2,000 2,007 2,007 - -
E-revolution No.1 PrivateEquity Fund
4.88% 2,000 2,000 2,000 - -
Conexs new developmentpower No.1 Private EquityFund1
6.67% 2,000 2,000 2,000 - -
Medici No.2 InvestmentCooperative
13.33% 800 800 800 - -
West End companyRestructuringCooperative1
- - - - 3,259 3,500
NH-Bennex Private EquityFund1 - - - - 3,000 -
No.4 KD-IBKD (CRC)1- - - - 123 250
Machinery financialCooperative1 - 3,300 3,300 3,300 3,300 3,300
Construction GuaranteeCooperative1 - 2,038 2,138 2,138 2,134 1,769
Machinery financialCooperative1 - 1,180 1,212 1,212 1,209 976
Electronic industryinvestment cooperative1 - 700 700 700 1,000 1,000
Others - 764 764 764 7,949 1,594
₩ 43,932 ₩ 45,015 ₩ 45,015 ₩ 41,391 ₩ 21,295
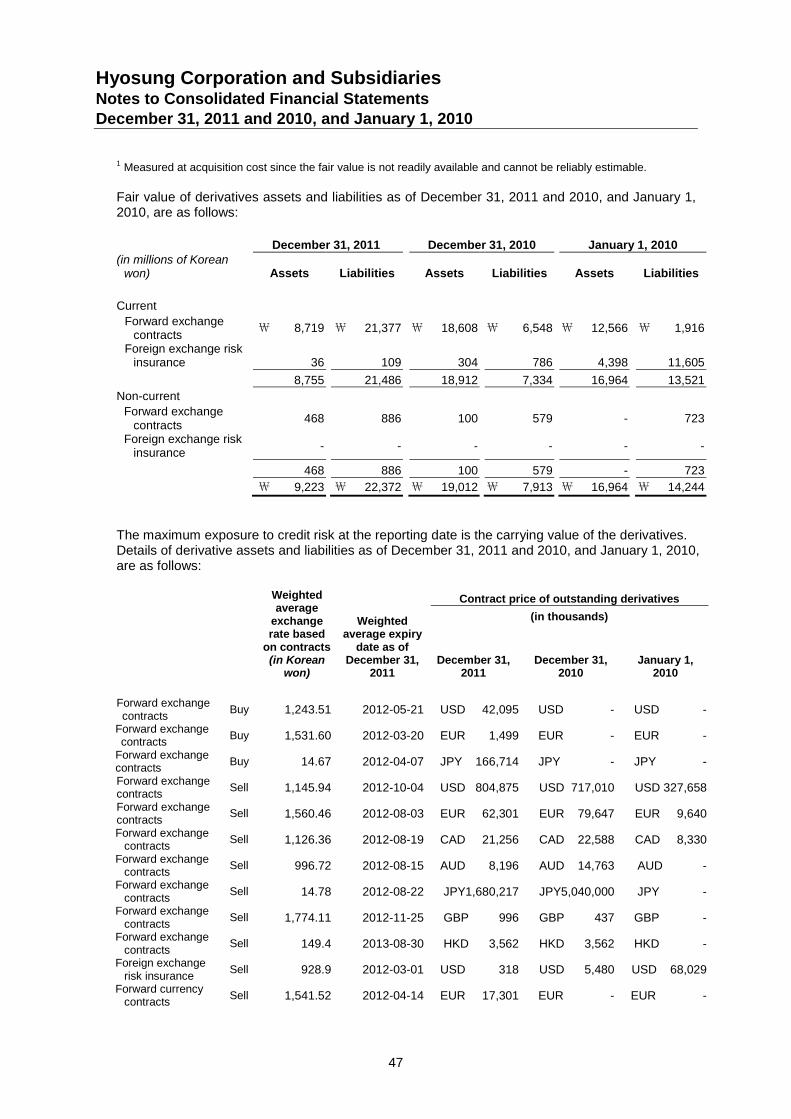
Hyosung Corporation and SubsidiariesNotes to Consolidated Financial StatementsDecember 31, 2011 and 2010, and January 1, 2010
47
1 Measured at acquisition cost since the fair value is not readily available and cannot be reliably estimable.
Fair value of derivatives assets and liabilities as of December 31, 2011 and 2010, and January 1,2010, are as follows:
December 31, 2011 December 31, 2010 January 1, 2010(in millions of Korean
won) Assets Liabilities Assets Liabilities Assets Liabilities
Current
Forward exchangecontracts
₩ 8,719 ₩ 21,377 ₩ 18,608 ₩ 6,548 ₩ 12,566 ₩ 1,916
Foreign exchange riskinsurance 36 109 304 786 4,398 11,605
8,755 21,486 18,912 7,334 16,964 13,521
Non-current
Forward exchangecontracts
468 886 100 579 - 723
Foreign exchange riskinsurance
- - - - - -
468 886 100 579 - 723
₩ 9,223 ₩ 22,372 ₩ 19,012 ₩ 7,913 ₩ 16,964 ₩ 14,244
The maximum exposure to credit risk at the reporting date is the carrying value of the derivatives.Details of derivative assets and liabilities as of December 31, 2011 and 2010, and January 1, 2010,are as follows:
Weightedaverage
exchangerate based
on contracts(in Korean
won)
Weightedaverage expiry
date as ofDecember 31,
2011
Contract price of outstanding derivatives
(in thousands)
December 31,2011
December 31,2010
January 1,2010
Forward exchangecontracts
Buy 1,243.51 2012-05-21 USD 42,095 USD - USD -
Forward exchangecontracts
Buy 1,531.60 2012-03-20 EUR 1,499 EUR - EUR -
Forward exchangecontracts
Buy 14.67 2012-04-07 JPY 166,714 JPY - JPY -
Forward exchangecontracts
Sell 1,145.94 2012-10-04 USD 804,875 USD 717,010 USD 327,658
Forward exchangecontracts
Sell 1,560.46 2012-08-03 EUR 62,301 EUR 79,647 EUR 9,640
Forward exchangecontracts
Sell 1,126.36 2012-08-19 CAD 21,256 CAD 22,588 CAD 8,330
Forward exchangecontracts
Sell 996.72 2012-08-15 AUD 8,196 AUD 14,763 AUD -
Forward exchangecontracts
Sell 14.78 2012-08-22 JPY1,680,217 JPY5,040,000 JPY -
Forward exchangecontracts
Sell 1,774.11 2012-11-25 GBP 996 GBP 437 GBP -
Forward exchangecontracts
Sell 149.4 2013-08-30 HKD 3,562 HKD 3,562 HKD -
Foreign exchangerisk insurance
Sell 928.9 2012-03-01 USD 318 USD 5,480 USD 68,029
Forward currencycontracts
Sell 1,541.52 2012-04-14 EUR 17,301 EUR - EUR -
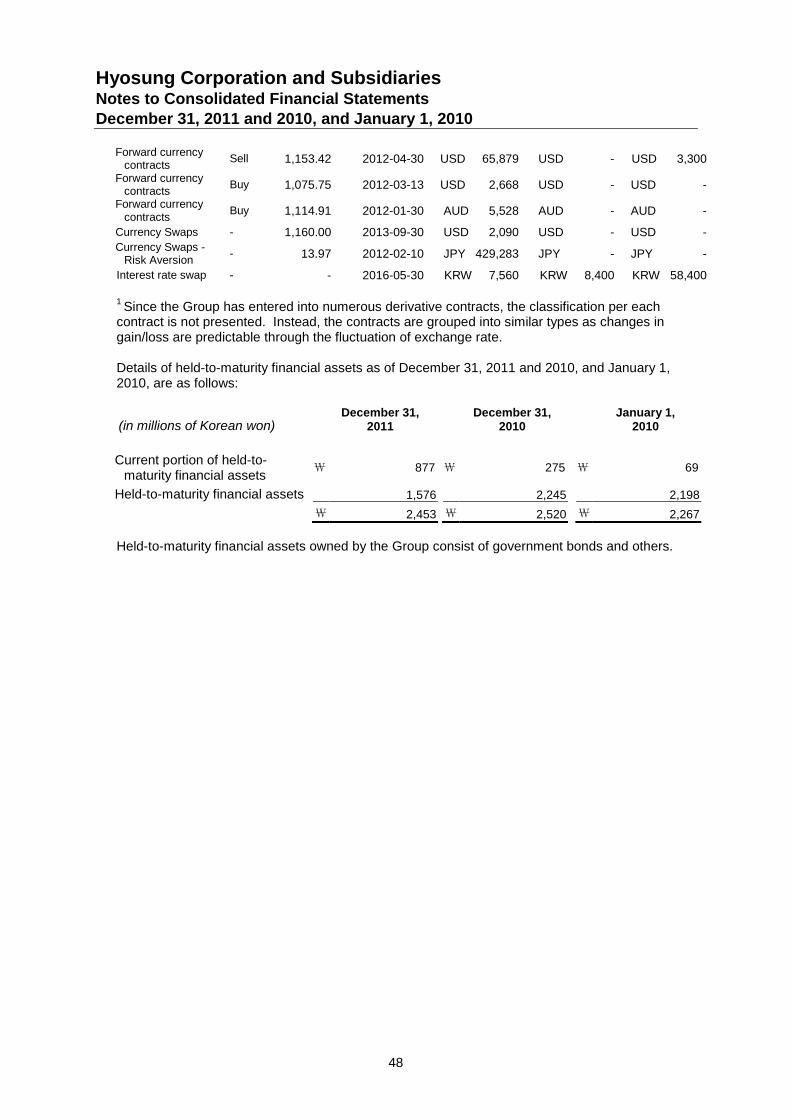
Hyosung Corporation and SubsidiariesNotes to Consolidated Financial StatementsDecember 31, 2011 and 2010, and January 1, 2010
48
Forward currencycontracts
Sell 1,153.42 2012-04-30 USD 65,879 USD - USD 3,300
Forward currencycontracts
Buy 1,075.75 2012-03-13 USD 2,668 USD - USD -
Forward currencycontracts
Buy 1,114.91 2012-01-30 AUD 5,528 AUD - AUD -
Currency Swaps - 1,160.00 2013-09-30 USD 2,090 USD - USD -Currency Swaps -
Risk Aversion- 13.97 2012-02-10 JPY 429,283 JPY - JPY -
Interest rate swap - - 2016-05-30 KRW 7,560 KRW 8,400 KRW 58,400
1Since the Group has entered into numerous derivative contracts, the classification per each
contract is not presented. Instead, the contracts are grouped into similar types as changes ingain/loss are predictable through the fluctuation of exchange rate.
Details of held-to-maturity financial assets as of December 31, 2011 and 2010, and January 1,2010, are as follows:
(in millions of Korean won)December 31,
2011December 31,
2010January 1,
2010
Current portion of held-to-maturity financial assets
₩ 877 ₩ 275 ₩ 69
Held-to-maturity financial assets 1,576 2,245 2,198
₩ 2,453 ₩ 2,520 ₩ 2,267
Held-to-maturity financial assets owned by the Group consist of government bonds and others.
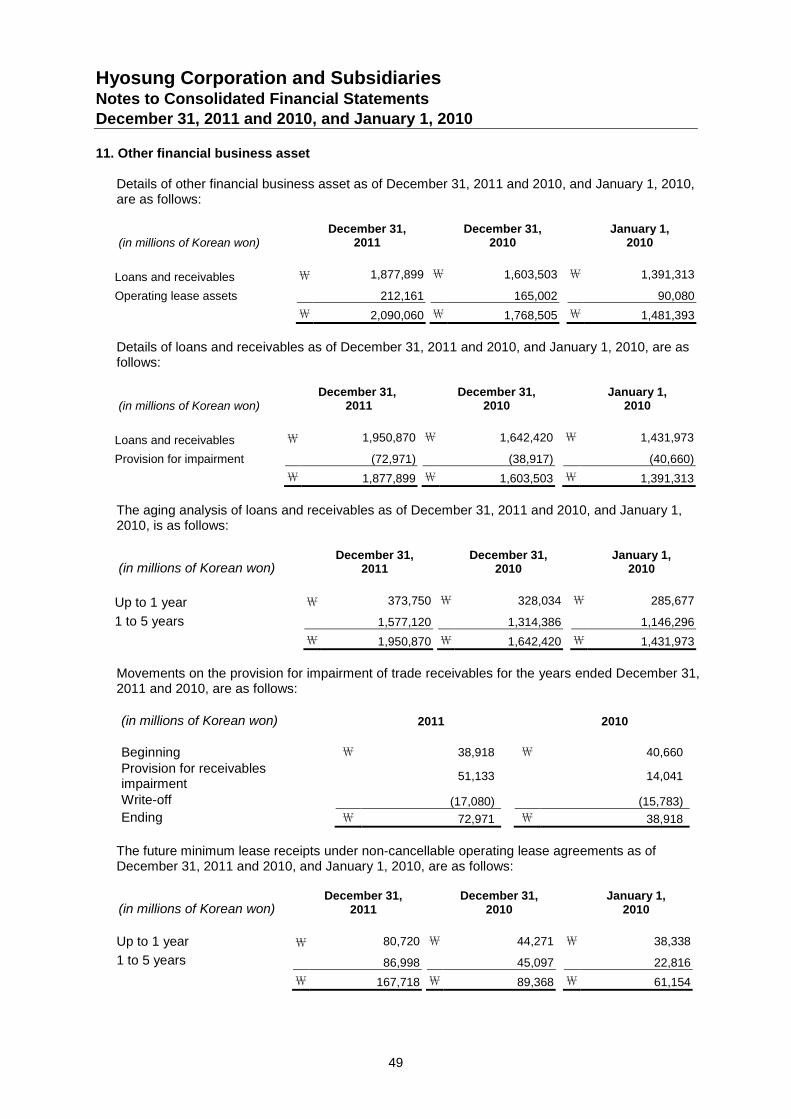
Hyosung Corporation and SubsidiariesNotes to Consolidated Financial StatementsDecember 31, 2011 and 2010, and January 1, 2010
49
11. Other financial business asset
Details of other financial business asset as of December 31, 2011 and 2010, and January 1, 2010,are as follows:
(in millions of Korean won)December 31,
2011December 31,
2010January 1,
2010
Loans and receivables ₩ 1,877,899 ₩ 1,603,503 ₩ 1,391,313
Operating lease assets 212,161 165,002 90,080
₩ 2,090,060 ₩ 1,768,505 ₩ 1,481,393
Details of loans and receivables as of December 31, 2011 and 2010, and January 1, 2010, are asfollows:
(in millions of Korean won)December 31,
2011December 31,
2010January 1,
2010
Loans and receivables ₩ 1,950,870 ₩ 1,642,420 ₩ 1,431,973
Provision for impairment (72,971) (38,917) (40,660)
₩ 1,877,899 ₩ 1,603,503 ₩ 1,391,313
The aging analysis of loans and receivables as of December 31, 2011 and 2010, and January 1,2010, is as follows:
(in millions of Korean won)December 31,
2011December 31,
2010January 1,
2010
Up to 1 year ₩ 373,750 ₩ 328,034 ₩ 285,677
1 to 5 years 1,577,120 1,314,386 1,146,296
₩ 1,950,870 ₩ 1,642,420 ₩ 1,431,973
Movements on the provision for impairment of trade receivables for the years ended December 31,2011 and 2010, are as follows:
(in millions of Korean won) 2011 2010
Beginning ₩ 38,918 ₩ 40,660
Provision for receivablesimpairment
51,133 14,041
Write-off (17,080) (15,783)
Ending ₩ 72,971 ₩ 38,918
The future minimum lease receipts under non-cancellable operating lease agreements as ofDecember 31, 2011 and 2010, and January 1, 2010, are as follows:
(in millions of Korean won)December 31,
2011December 31,
2010January 1,
2010
Up to 1 year ₩ 80,720 ₩ 44,271 ₩ 38,338
1 to 5 years 86,998 45,097 22,816
₩ 167,718 ₩ 89,368 ₩ 61,154
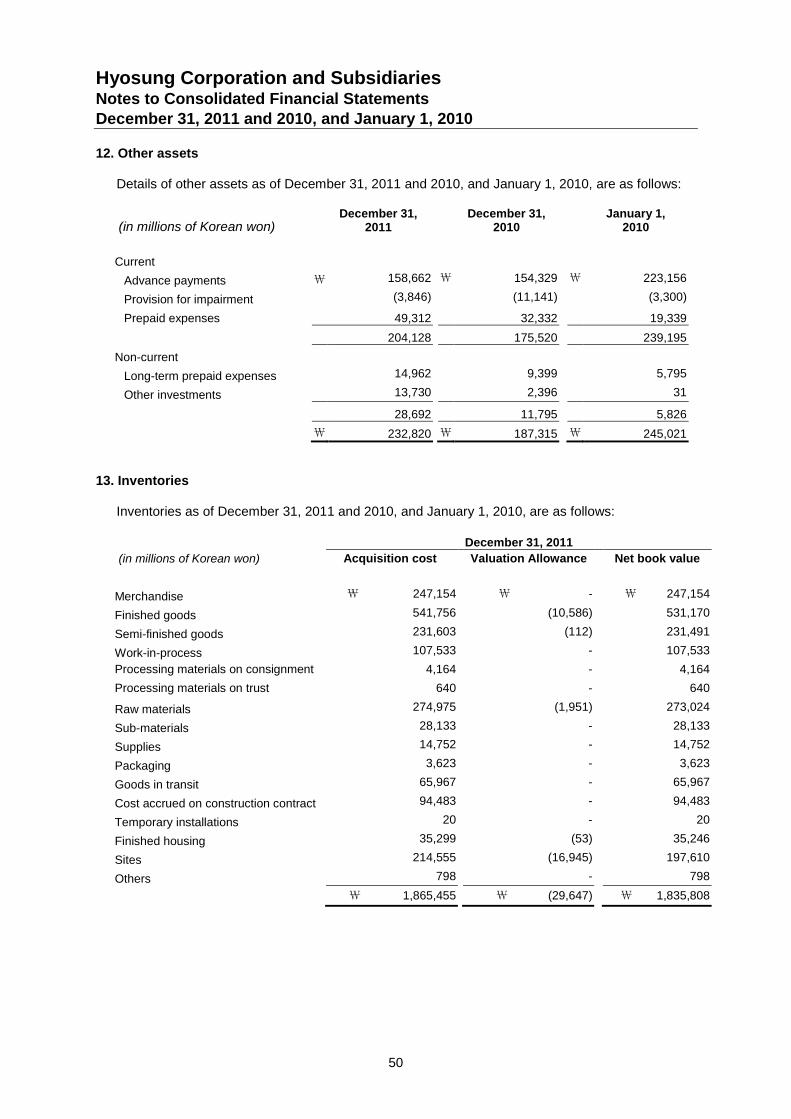
Hyosung Corporation and SubsidiariesNotes to Consolidated Financial StatementsDecember 31, 2011 and 2010, and January 1, 2010
50
12. Other assets
Details of other assets as of December 31, 2011 and 2010, and January 1, 2010, are as follows:
(in millions of Korean won)December 31,
2011December 31,
2010January 1,
2010
Current
Advance payments ₩ 158,662 ₩ 154,329 ₩ 223,156
Provision for impairment (3,846) (11,141) (3,300)
Prepaid expenses 49,312 32,332 19,339
204,128 175,520 239,195
Non-current
Long-term prepaid expenses 14,962 9,399 5,795
Other investments 13,730 2,396 31
28,692 11,795 5,826
₩ 232,820 ₩ 187,315 ₩ 245,021
13. Inventories
Inventories as of December 31, 2011 and 2010, and January 1, 2010, are as follows:
December 31, 2011
(in millions of Korean won) Acquisition cost Valuation Allowance Net book value
Merchandise ₩ 247,154 ₩ - ₩ 247,154
Finished goods 541,756 (10,586) 531,170
Semi-finished goods 231,603 (112) 231,491
Work-in-process 107,533 - 107,533
Processing materials on consignment 4,164 - 4,164
Processing materials on trust 640 - 640
Raw materials 274,975 (1,951) 273,024
Sub-materials 28,133 - 28,133
Supplies 14,752 - 14,752
Packaging 3,623 - 3,623
Goods in transit 65,967 - 65,967
Cost accrued on construction contract 94,483 - 94,483
Temporary installations 20 - 20
Finished housing 35,299 (53) 35,246
Sites 214,555 (16,945) 197,610
Others 798 - 798
₩ 1,865,455 ₩ (29,647) ₩ 1,835,808
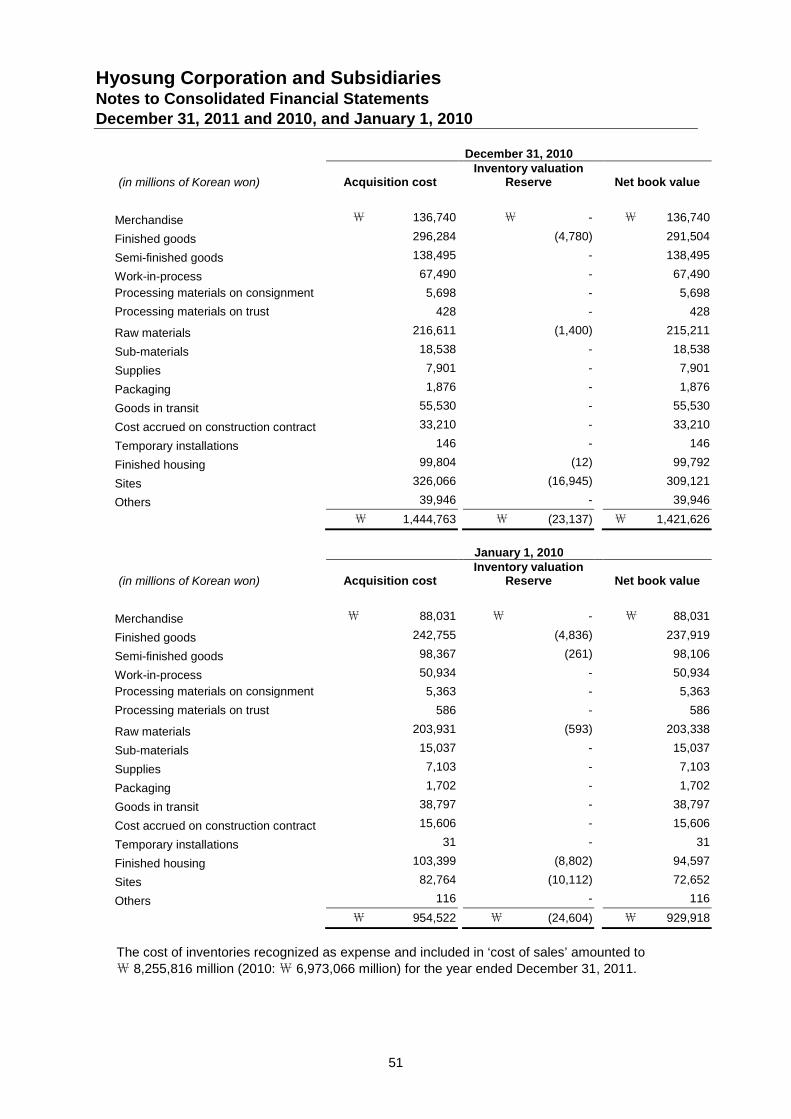
Hyosung Corporation and SubsidiariesNotes to Consolidated Financial StatementsDecember 31, 2011 and 2010, and January 1, 2010
51
December 31, 2010
(in millions of Korean won) Acquisition costInventory valuation
Reserve Net book value
Merchandise ₩ 136,740 ₩ - ₩ 136,740
Finished goods 296,284 (4,780) 291,504
Semi-finished goods 138,495 - 138,495
Work-in-process 67,490 - 67,490
Processing materials on consignment 5,698 - 5,698
Processing materials on trust 428 - 428
Raw materials 216,611 (1,400) 215,211
Sub-materials 18,538 - 18,538
Supplies 7,901 - 7,901
Packaging 1,876 - 1,876
Goods in transit 55,530 - 55,530
Cost accrued on construction contract 33,210 - 33,210
Temporary installations 146 - 146
Finished housing 99,804 (12) 99,792
Sites 326,066 (16,945) 309,121
Others 39,946 - 39,946
₩ 1,444,763 ₩ (23,137) ₩ 1,421,626
January 1, 2010
(in millions of Korean won) Acquisition costInventory valuation
Reserve Net book value
Merchandise ₩ 88,031 ₩ - ₩ 88,031
Finished goods 242,755 (4,836) 237,919
Semi-finished goods 98,367 (261) 98,106
Work-in-process 50,934 - 50,934
Processing materials on consignment 5,363 - 5,363
Processing materials on trust 586 - 586
Raw materials 203,931 (593) 203,338
Sub-materials 15,037 - 15,037
Supplies 7,103 - 7,103
Packaging 1,702 - 1,702
Goods in transit 38,797 - 38,797
Cost accrued on construction contract 15,606 - 15,606
Temporary installations 31 - 31
Finished housing 103,399 (8,802) 94,597
Sites 82,764 (10,112) 72,652
Others 116 - 116
₩ 954,522 ₩ (24,604) ₩ 929,918
The cost of inventories recognized as expense and included in ‘cost of sales’ amounted to₩ 8,255,816 million (2010:₩ 6,973,066 million) for the year ended December 31, 2011.
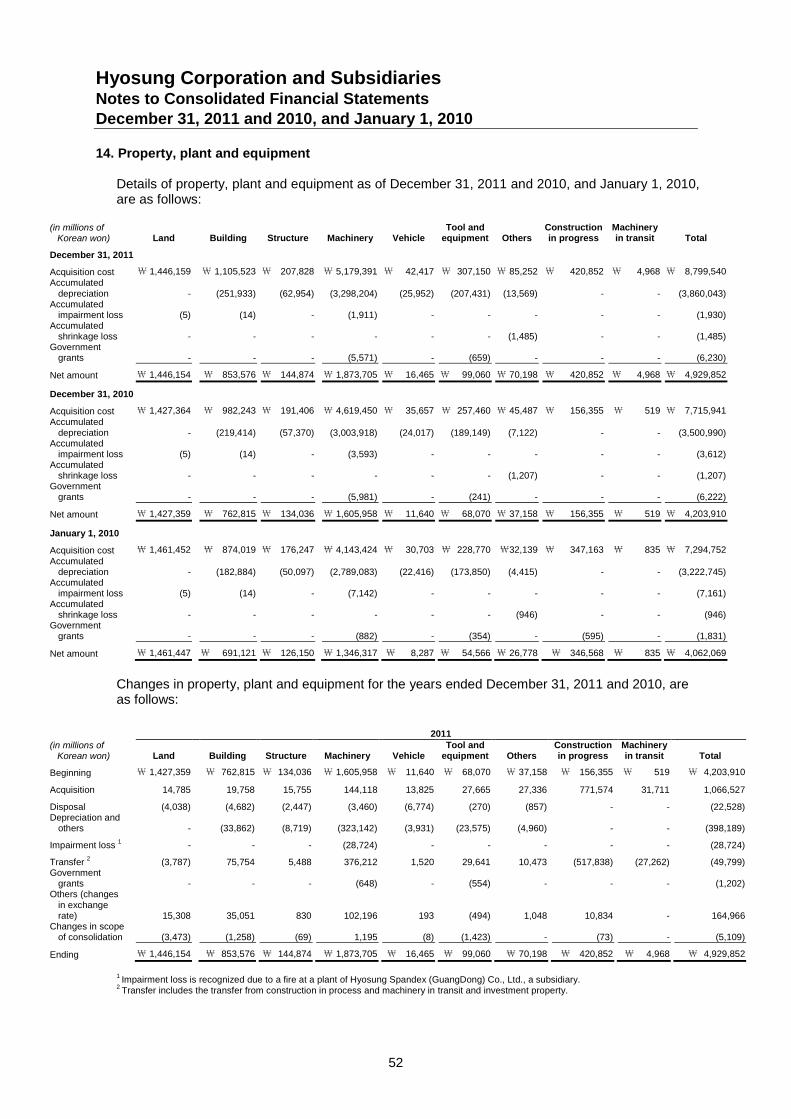
Hyosung Corporation and SubsidiariesNotes to Consolidated Financial StatementsDecember 31, 2011 and 2010, and January 1, 2010
52
14. Property, plant and equipment
Details of property, plant and equipment as of December 31, 2011 and 2010, and January 1, 2010,are as follows:
(in millions ofKorean won) Land Building Structure Machinery Vehicle
Tool andequipment Others
Constructionin progress
Machineryin transit Total
December 31, 2011
Acquisition cost \ 1,446,159 \ 1,105,523 \ 207,828 \ 5,179,391 \ 42,417 \ 307,150 \ 85,252 \ 420,852 \ 4,968 \ 8,799,540Accumulated
depreciation - (251,933) (62,954) (3,298,204) (25,952) (207,431) (13,569) - - (3,860,043)Accumulated
impairment loss (5) (14) - (1,911) - - - - - (1,930)Accumulated
shrinkage loss - - - - - - (1,485) - - (1,485)Government
grants - - - (5,571) - (659) - - - (6,230)
Net amount \ 1,446,154 \ 853,576 \ 144,874 \ 1,873,705 \ 16,465 \ 99,060 \ 70,198 \ 420,852 \ 4,968 \ 4,929,852
December 31, 2010
Acquisition cost \ 1,427,364 \ 982,243 \ 191,406 \ 4,619,450 \ 35,657 \ 257,460 \ 45,487 \ 156,355 \ 519 \ 7,715,941Accumulated
depreciation - (219,414) (57,370) (3,003,918) (24,017) (189,149) (7,122) - - (3,500,990)Accumulated
impairment loss (5) (14) - (3,593) - - - - - (3,612)Accumulated
shrinkage loss - - - - - - (1,207) - - (1,207)Government
grants - - - (5,981) - (241) - - - (6,222)
Net amount \ 1,427,359 \ 762,815 \ 134,036 \ 1,605,958 \ 11,640 \ 68,070 \ 37,158 \ 156,355 \ 519 \ 4,203,910
January 1, 2010
Acquisition cost \ 1,461,452 \ 874,019 \ 176,247 \ 4,143,424 \ 30,703 \ 228,770 \32,139 \ 347,163 \ 835 \ 7,294,752Accumulated
depreciation - (182,884) (50,097) (2,789,083) (22,416) (173,850) (4,415) - - (3,222,745)Accumulated
impairment loss (5) (14) - (7,142) - - - - - (7,161)Accumulated
shrinkage loss - - - - - - (946) - - (946)Government
grants - - - (882) - (354) - (595) - (1,831)
Net amount \ 1,461,447 \ 691,121 \ 126,150 \ 1,346,317 \ 8,287 \ 54,566 \ 26,778 \ 346,568 \ 835 \ 4,062,069
Changes in property, plant and equipment for the years ended December 31, 2011 and 2010, areas follows:
2011(in millions of
Korean won) Land Building Structure Machinery VehicleTool and
equipment OthersConstructionin progress
Machineryin transit Total
Beginning \ 1,427,359 \ 762,815 \ 134,036 \ 1,605,958 \ 11,640 \ 68,070 \ 37,158 \ 156,355 \ 519 \ 4,203,910
Acquisition 14,785 19,758 15,755 144,118 13,825 27,665 27,336 771,574 31,711 1,066,527
Disposal (4,038) (4,682) (2,447) (3,460) (6,774) (270) (857) - - (22,528)Depreciation and
others - (33,862) (8,719) (323,142) (3,931) (23,575) (4,960) - - (398,189)
Impairment loss1
- - - (28,724) - - - - - (28,724)
Transfer 2 (3,787) 75,754 5,488 376,212 1,520 29,641 10,473 (517,838) (27,262) (49,799)Government
grants - - - (648) - (554) - - - (1,202)Others (changes
in exchangerate) 15,308 35,051 830 102,196 193 (494) 1,048 10,834 - 164,966
Changes in scopeof consolidation (3,473) (1,258) (69) 1,195 (8) (1,423) - (73) - (5,109)
Ending \ 1,446,154 \ 853,576 \ 144,874 \ 1,873,705 \ 16,465 \ 99,060 \ 70,198 \ 420,852 \ 4,968 \ 4,929,852
1 Impairment loss is recognized due to a fire at a plant of Hyosung Spandex (GuangDong) Co., Ltd., a subsidiary.2 Transfer includes the transfer from construction in process and machinery in transit and investment property.
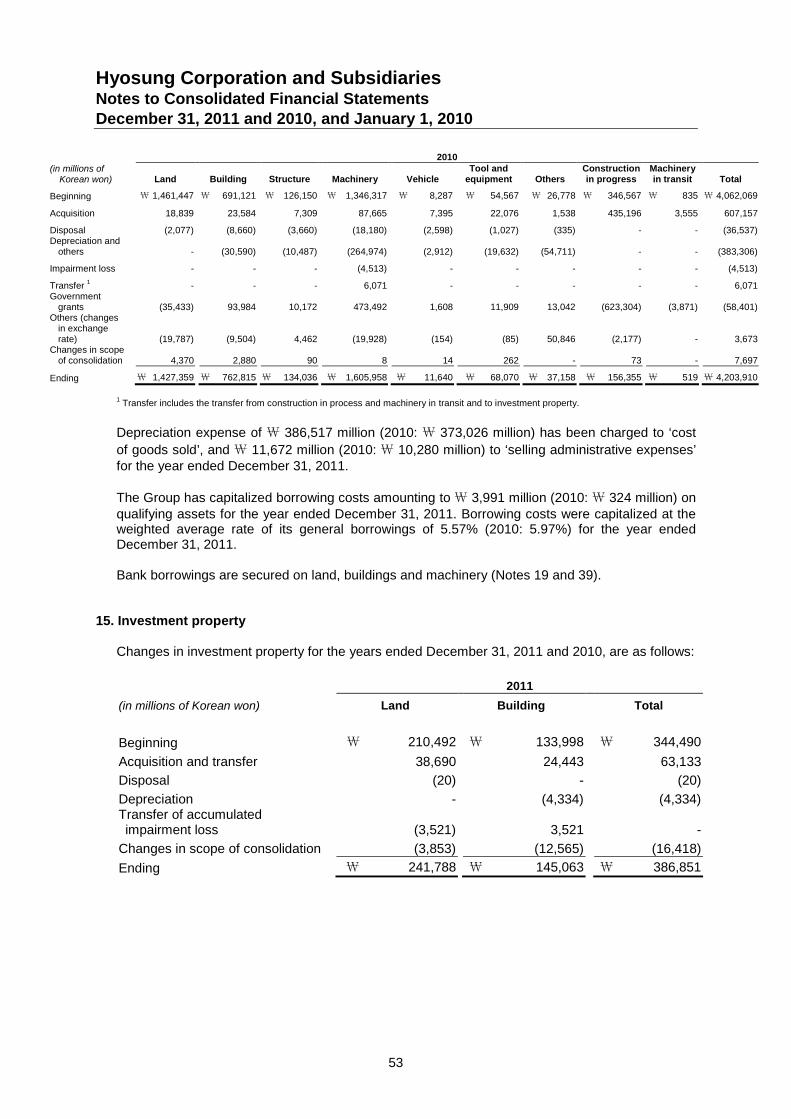
Hyosung Corporation and SubsidiariesNotes to Consolidated Financial StatementsDecember 31, 2011 and 2010, and January 1, 2010
53
2010(in millions of
Korean won) Land Building Structure Machinery VehicleTool and
equipment OthersConstructionin progress
Machineryin transit Total
Beginning \ 1,461,447 \ 691,121 \ 126,150 \ 1,346,317 \ 8,287 \ 54,567 \ 26,778 \ 346,567 \ 835 \ 4,062,069
Acquisition 18,839 23,584 7,309 87,665 7,395 22,076 1,538 435,196 3,555 607,157
Disposal (2,077) (8,660) (3,660) (18,180) (2,598) (1,027) (335) - - (36,537)Depreciation and
others - (30,590) (10,487) (264,974) (2,912) (19,632) (54,711) - - (383,306)
Impairment loss - - - (4,513) - - - - - (4,513)
Transfer 1 - - - 6,071 - - - - - 6,071Government
grants (35,433) 93,984 10,172 473,492 1,608 11,909 13,042 (623,304) (3,871) (58,401)Others (changes
in exchangerate) (19,787) (9,504) 4,462 (19,928) (154) (85) 50,846 (2,177) - 3,673
Changes in scopeof consolidation 4,370 2,880 90 8 14 262 - 73 - 7,697
Ending \ 1,427,359 \ 762,815 \ 134,036 \ 1,605,958 \ 11,640 \ 68,070 \ 37,158 \ 156,355 \ 519 \ 4,203,910
1 Transfer includes the transfer from construction in process and machinery in transit and to investment property.
Depreciation expense of \ 386,517 million (2010: \ 373,026 million) has been charged to ‘cost
of goods sold’, and \ 11,672 million (2010: \ 10,280 million) to ‘selling administrative expenses’for the year ended December 31, 2011.
The Group has capitalized borrowing costs amounting to\ 3,991 million (2010: \ 324 million) onqualifying assets for the year ended December 31, 2011. Borrowing costs were capitalized at theweighted average rate of its general borrowings of 5.57% (2010: 5.97%) for the year endedDecember 31, 2011.
Bank borrowings are secured on land, buildings and machinery (Notes 19 and 39).
15. Investment property
Changes in investment property for the years ended December 31, 2011 and 2010, are as follows:
2011
(in millions of Korean won) Land Building Total
Beginning \ 210,492 \ 133,998 \ 344,490
Acquisition and transfer 38,690 24,443 63,133
Disposal (20) - (20)
Depreciation - (4,334) (4,334)Transfer of accumulatedimpairment loss (3,521) 3,521 -
Changes in scope of consolidation (3,853) (12,565) (16,418)
Ending \ 241,788 \ 145,063 \ 386,851
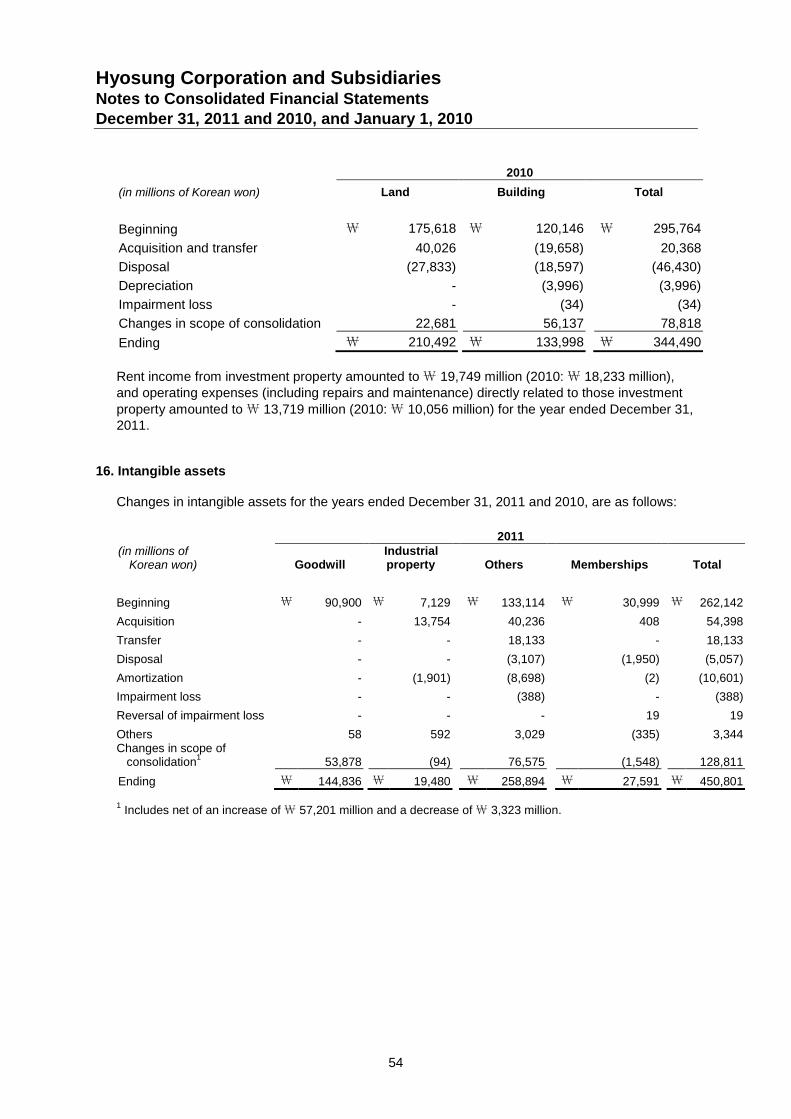
Hyosung Corporation and SubsidiariesNotes to Consolidated Financial StatementsDecember 31, 2011 and 2010, and January 1, 2010
54
2010
(in millions of Korean won) Land Building Total
Beginning \ 175,618 \ 120,146 \ 295,764
Acquisition and transfer 40,026 (19,658) 20,368
Disposal (27,833) (18,597) (46,430)
Depreciation - (3,996) (3,996)
Impairment loss - (34) (34)
Changes in scope of consolidation 22,681 56,137 78,818
Ending \ 210,492 \ 133,998 \ 344,490
Rent income from investment property amounted to\ 19,749 million (2010:\ 18,233 million),and operating expenses (including repairs and maintenance) directly related to those investmentproperty amounted to\ 13,719 million (2010:\ 10,056 million) for the year ended December 31,2011.
16. Intangible assets
Changes in intangible assets for the years ended December 31, 2011 and 2010, are as follows:
2011(in millions of
Korean won) GoodwillIndustrialproperty Others Memberships Total
Beginning \ 90,900 \ 7,129 \ 133,114 \ 30,999 \ 262,142
Acquisition - 13,754 40,236 408 54,398
Transfer - - 18,133 - 18,133
Disposal - - (3,107) (1,950) (5,057)
Amortization - (1,901) (8,698) (2) (10,601)
Impairment loss - - (388) - (388)
Reversal of impairment loss - - - 19 19
Others 58 592 3,029 (335) 3,344Changes in scope of
consolidation1
53,878 (94) 76,575 (1,548) 128,811
Ending \ 144,836 \ 19,480 \ 258,894 \ 27,591 \ 450,801
1Includes net of an increase of\ 57,201 million and a decrease of\ 3,323 million.
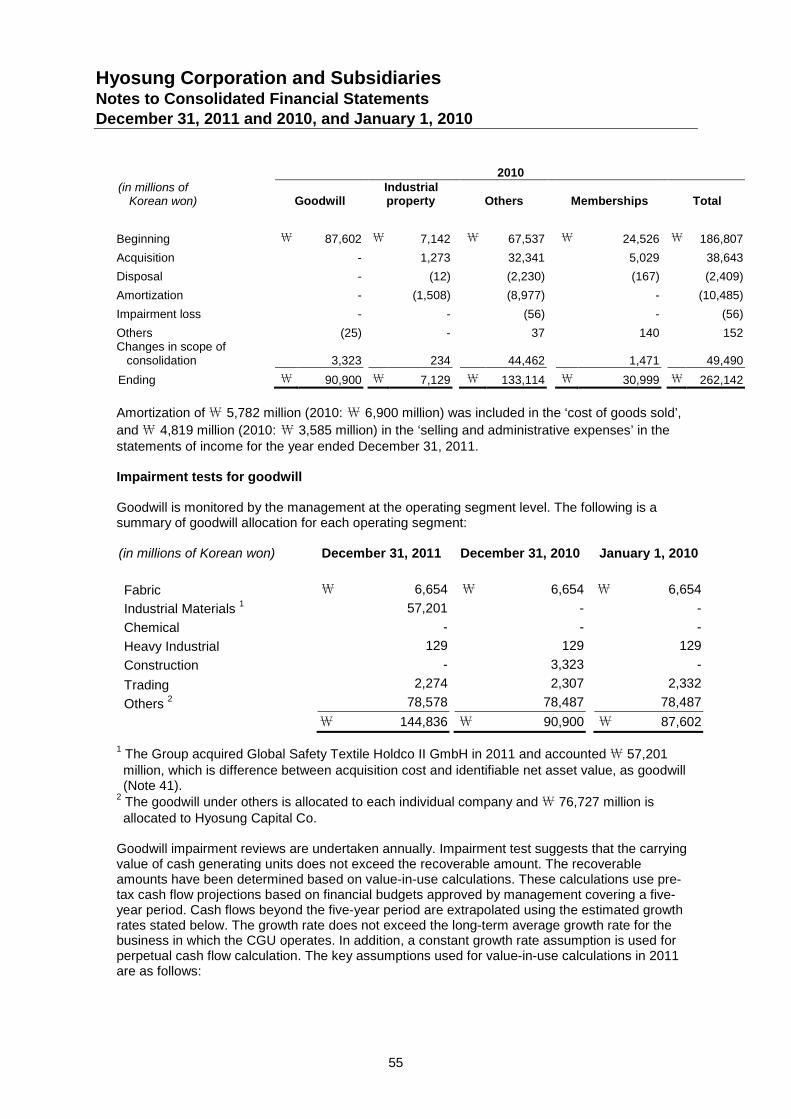
Hyosung Corporation and SubsidiariesNotes to Consolidated Financial StatementsDecember 31, 2011 and 2010, and January 1, 2010
55
2010(in millions of
Korean won) GoodwillIndustrialproperty Others Memberships Total
Beginning \ 87,602 \ 7,142 \ 67,537 \ 24,526 \ 186,807
Acquisition - 1,273 32,341 5,029 38,643
Disposal - (12) (2,230) (167) (2,409)
Amortization - (1,508) (8,977) - (10,485)
Impairment loss - - (56) - (56)
Others (25) - 37 140 152Changes in scope of
consolidation 3,323 234 44,462 1,471 49,490
Ending \ 90,900 \ 7,129 \ 133,114 \ 30,999 \ 262,142
Amortization of\ 5,782 million (2010: \ 6,900 million) was included in the ‘cost of goods sold’,
and\ 4,819 million (2010: \ 3,585 million) in the ‘selling and administrative expenses’ in thestatements of income for the year ended December 31, 2011.
Impairment tests for goodwill
Goodwill is monitored by the management at the operating segment level. The following is asummary of goodwill allocation for each operating segment:
(in millions of Korean won) December 31, 2011 December 31, 2010 January 1, 2010
Fabric \ 6,654 \ 6,654 \ 6,654
Industrial Materials1 57,201 - -
Chemical - - -
Heavy Industrial 129 129 129
Construction - 3,323 -
Trading 2,274 2,307 2,332
Others2 78,578 78,487 78,487
\ 144,836 \ 90,900 \ 87,602
1The Group acquired Global Safety Textile Holdco II GmbH in 2011 and accounted\ 57,201million, which is difference between acquisition cost and identifiable net asset value, as goodwill(Note 41).
2The goodwill under others is allocated to each individual company and\ 76,727 million isallocated to Hyosung Capital Co.
Goodwill impairment reviews are undertaken annually. Impairment test suggests that the carryingvalue of cash generating units does not exceed the recoverable amount. The recoverableamounts have been determined based on value-in-use calculations. These calculations use pre-tax cash flow projections based on financial budgets approved by management covering a five-year period. Cash flows beyond the five-year period are extrapolated using the estimated growthrates stated below. The growth rate does not exceed the long-term average growth rate for thebusiness in which the CGU operates. In addition, a constant growth rate assumption is used forperpetual cash flow calculation. The key assumptions used for value-in-use calculations in 2011are as follows:
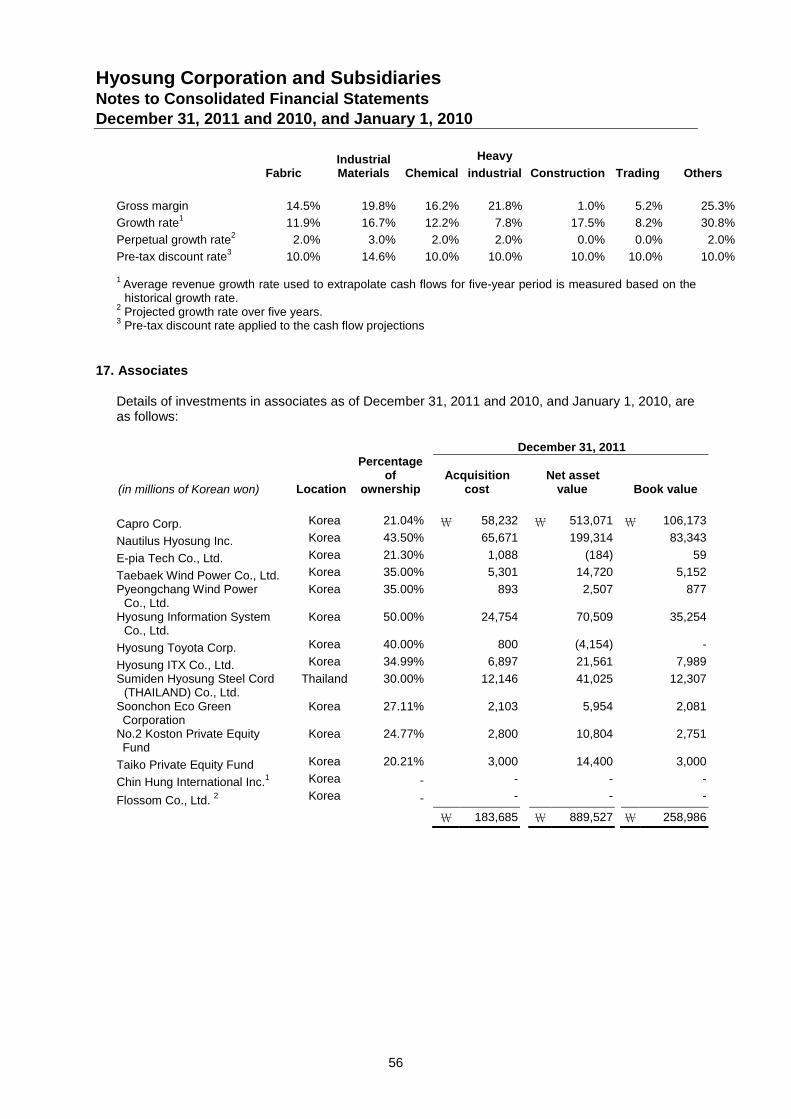
Hyosung Corporation and SubsidiariesNotes to Consolidated Financial StatementsDecember 31, 2011 and 2010, and January 1, 2010
56
FabricIndustrialMaterials Chemical
Heavy
industrial Construction Trading Others
Gross margin 14.5% 19.8% 16.2% 21.8% 1.0% 5.2% 25.3%
Growth rate1
11.9% 16.7% 12.2% 7.8% 17.5% 8.2% 30.8%
Perpetual growth rate2
2.0% 3.0% 2.0% 2.0% 0.0% 0.0% 2.0%
Pre-tax discount rate3
10.0% 14.6% 10.0% 10.0% 10.0% 10.0% 10.0%
1Average revenue growth rate used to extrapolate cash flows for five-year period is measured based on thehistorical growth rate.
2Projected growth rate over five years.
3Pre-tax discount rate applied to the cash flow projections
17. Associates
Details of investments in associates as of December 31, 2011 and 2010, and January 1, 2010, areas follows:
December 31, 2011
(in millions of Korean won) Location
Percentageof
ownershipAcquisition
costNet asset
value Book value
Capro Corp. Korea 21.04% \ 58,232 \ 513,071 \ 106,173
Nautilus Hyosung Inc. Korea 43.50% 65,671 199,314 83,343
E-pia Tech Co., Ltd. Korea 21.30% 1,088 (184) 59
Taebaek Wind Power Co., Ltd. Korea 35.00% 5,301 14,720 5,152
Pyeongchang Wind PowerCo., Ltd.
Korea 35.00% 893 2,507 877
Hyosung Information SystemCo., Ltd.
Korea 50.00% 24,754 70,509 35,254
Hyosung Toyota Corp. Korea 40.00% 800 (4,154) -
Hyosung ITX Co., Ltd. Korea 34.99% 6,897 21,561 7,989
Sumiden Hyosung Steel Cord(THAILAND) Co., Ltd.
Thailand 30.00% 12,146 41,025 12,307
Soonchon Eco GreenCorporation
Korea 27.11% 2,103 5,954 2,081
No.2 Koston Private EquityFund
Korea 24.77% 2,800 10,804 2,751
Taiko Private Equity Fund Korea 20.21% 3,000 14,400 3,000
Chin Hung International Inc.1 Korea - - - -
Flossom Co., Ltd.2 Korea - - - -
\ 183,685 \ 889,527 \ 258,986
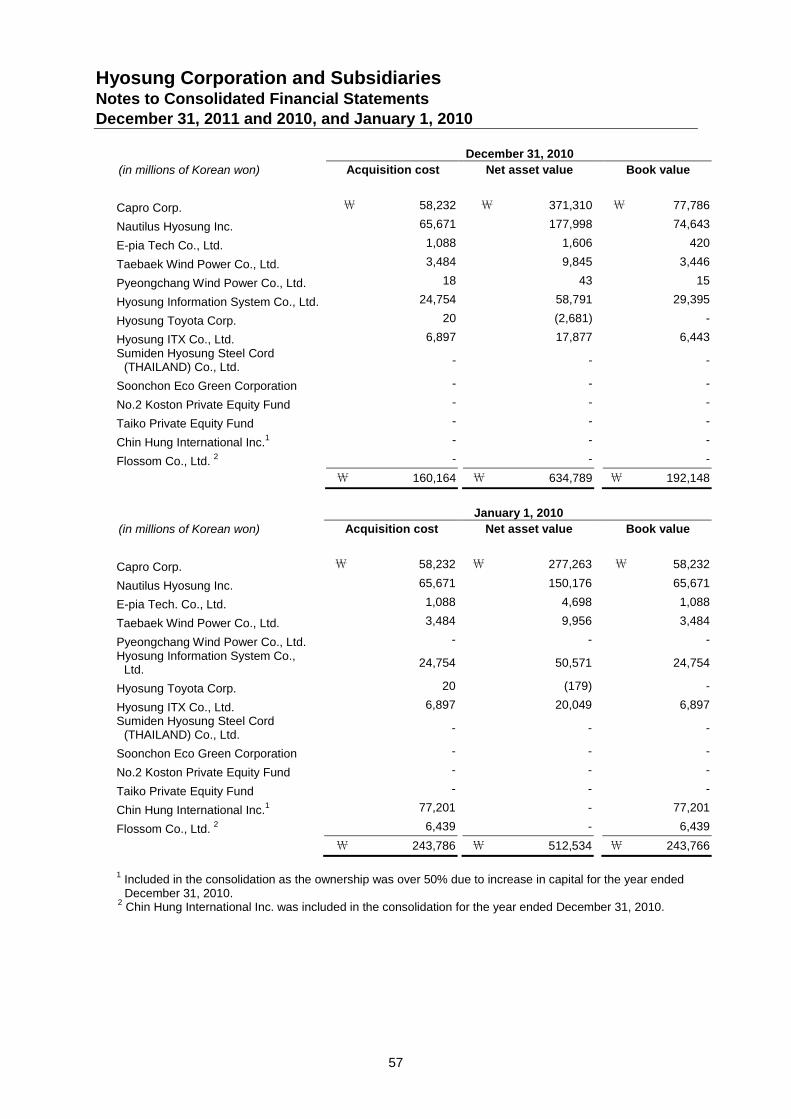
Hyosung Corporation and SubsidiariesNotes to Consolidated Financial StatementsDecember 31, 2011 and 2010, and January 1, 2010
57
December 31, 2010
(in millions of Korean won) Acquisition cost Net asset value Book value
Capro Corp. \ 58,232 \ 371,310 \ 77,786
Nautilus Hyosung Inc. 65,671 177,998 74,643
E-pia Tech Co., Ltd. 1,088 1,606 420
Taebaek Wind Power Co., Ltd. 3,484 9,845 3,446
Pyeongchang Wind Power Co., Ltd. 18 43 15
Hyosung Information System Co., Ltd. 24,754 58,791 29,395
Hyosung Toyota Corp. 20 (2,681) -
Hyosung ITX Co., Ltd. 6,897 17,877 6,443
Sumiden Hyosung Steel Cord(THAILAND) Co., Ltd.
- - -
Soonchon Eco Green Corporation - - -
No.2 Koston Private Equity Fund - - -
Taiko Private Equity Fund - - -
Chin Hung International Inc.1 - - -
Flossom Co., Ltd.2 - - -
\ 160,164 \ 634,789 \ 192,148
January 1, 2010
(in millions of Korean won) Acquisition cost Net asset value Book value
Capro Corp. \ 58,232 \ 277,263 \ 58,232
Nautilus Hyosung Inc. 65,671 150,176 65,671
E-pia Tech. Co., Ltd. 1,088 4,698 1,088
Taebaek Wind Power Co., Ltd. 3,484 9,956 3,484
Pyeongchang Wind Power Co., Ltd. - - -
Hyosung Information System Co.,Ltd.
24,754 50,571 24,754
Hyosung Toyota Corp. 20 (179) -
Hyosung ITX Co., Ltd. 6,897 20,049 6,897
Sumiden Hyosung Steel Cord(THAILAND) Co., Ltd.
- - -
Soonchon Eco Green Corporation - - -
No.2 Koston Private Equity Fund - - -
Taiko Private Equity Fund - - -
Chin Hung International Inc.1 77,201 - 77,201
Flossom Co., Ltd.2 6,439 - 6,439
\ 243,786 \ 512,534 \ 243,766
1Included in the consolidation as the ownership was over 50% due to increase in capital for the year endedDecember 31, 2010.
2Chin Hung International Inc. was included in the consolidation for the year ended December 31, 2010.
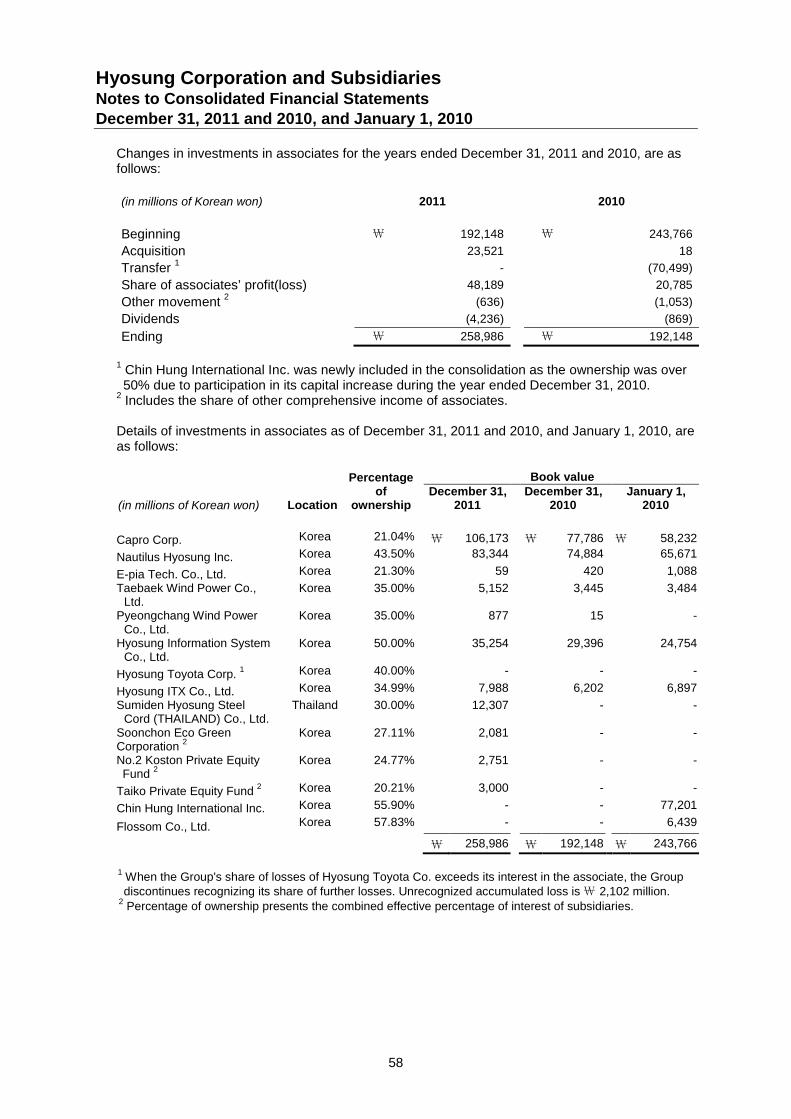
Hyosung Corporation and SubsidiariesNotes to Consolidated Financial StatementsDecember 31, 2011 and 2010, and January 1, 2010
58
Changes in investments in associates for the years ended December 31, 2011 and 2010, are asfollows:
(in millions of Korean won) 2011 2010
Beginning \ 192,148 \ 243,766
Acquisition 23,521 18
Transfer1
- (70,499)
Share of associates’ profit(loss) 48,189 20,785
Other movement2
(636) (1,053)
Dividends (4,236) (869)
Ending \ 258,986 \ 192,148
1Chin Hung International Inc. was newly included in the consolidation as the ownership was over50% due to participation in its capital increase during the year ended December 31, 2010.
2Includes the share of other comprehensive income of associates.
Details of investments in associates as of December 31, 2011 and 2010, and January 1, 2010, areas follows:
Percentageof
ownership
Book value
(in millions of Korean won) LocationDecember 31,
2011December 31,
2010January 1,
2010
Capro Corp. Korea 21.04% \ 106,173 \ 77,786 \ 58,232
Nautilus Hyosung Inc. Korea 43.50% 83,344 74,884 65,671
E-pia Tech. Co., Ltd. Korea 21.30% 59 420 1,088
Taebaek Wind Power Co.,Ltd.
Korea 35.00% 5,152 3,445 3,484
Pyeongchang Wind PowerCo., Ltd.
Korea 35.00% 877 15 -
Hyosung Information SystemCo., Ltd.
Korea 50.00% 35,254 29,396 24,754
Hyosung Toyota Corp.1 Korea 40.00% - - -
Hyosung ITX Co., Ltd. Korea 34.99% 7,988 6,202 6,897
Sumiden Hyosung SteelCord (THAILAND) Co., Ltd.
Thailand 30.00% 12,307 - -
Soonchon Eco GreenCorporation
2Korea 27.11% 2,081 - -
No.2 Koston Private EquityFund
2Korea 24.77% 2,751 - -
Taiko Private Equity Fund2 Korea 20.21% 3,000 - -
Chin Hung International Inc. Korea 55.90% - - 77,201
Flossom Co., Ltd. Korea 57.83% - - 6,439
\ 258,986 \ 192,148 \ 243,766
1When the Group's share of losses of Hyosung Toyota Co. exceeds its interest in the associate, the Groupdiscontinues recognizing its share of further losses. Unrecognized accumulated loss is\ 2,102 million.
2Percentage of ownership presents the combined effective percentage of interest of subsidiaries.
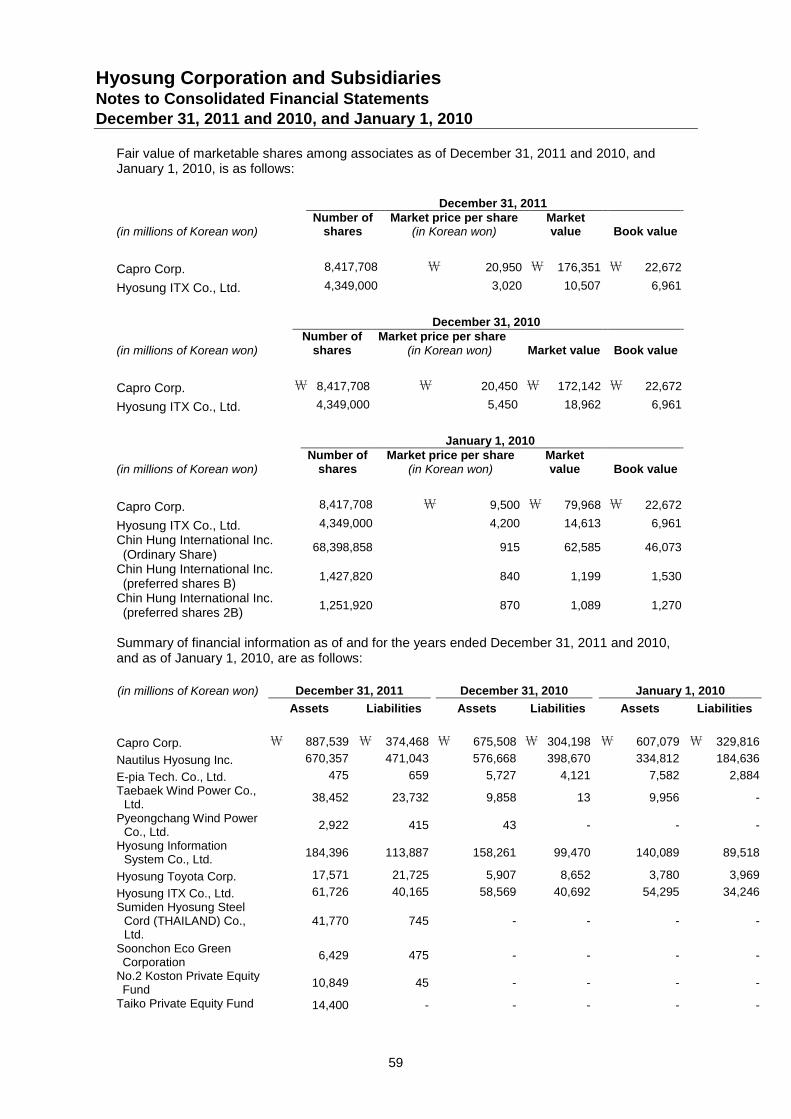
Hyosung Corporation and SubsidiariesNotes to Consolidated Financial StatementsDecember 31, 2011 and 2010, and January 1, 2010
59
Fair value of marketable shares among associates as of December 31, 2011 and 2010, andJanuary 1, 2010, is as follows:
December 31, 2011
(in millions of Korean won)Number of
sharesMarket price per share
(in Korean won)Marketvalue Book value
Capro Corp. 8,417,708 \ 20,950 \ 176,351 \ 22,672
Hyosung ITX Co., Ltd. 4,349,000 3,020 10,507 6,961
December 31, 2010
(in millions of Korean won)Number of
sharesMarket price per share
(in Korean won) Market value Book value
Capro Corp. \ 8,417,708 \ 20,450 \ 172,142 \ 22,672
Hyosung ITX Co., Ltd. 4,349,000 5,450 18,962 6,961
January 1, 2010
(in millions of Korean won)Number of
sharesMarket price per share
(in Korean won)Marketvalue Book value
Capro Corp. 8,417,708 \ 9,500 \ 79,968 \ 22,672
Hyosung ITX Co., Ltd. 4,349,000 4,200 14,613 6,961
Chin Hung International Inc.(Ordinary Share)
68,398,858 915 62,585 46,073
Chin Hung International Inc.(preferred shares B)
1,427,820 840 1,199 1,530
Chin Hung International Inc.(preferred shares 2B)
1,251,920 870 1,089 1,270
Summary of financial information as of and for the years ended December 31, 2011 and 2010,and as of January 1, 2010, are as follows:
(in millions of Korean won) December 31, 2011 December 31, 2010 January 1, 2010
Assets Liabilities Assets Liabilities Assets Liabilities
Capro Corp. \ 887,539 \ 374,468 \ 675,508 \ 304,198 \ 607,079 \ 329,816
Nautilus Hyosung Inc. 670,357 471,043 576,668 398,670 334,812 184,636
E-pia Tech. Co., Ltd. 475 659 5,727 4,121 7,582 2,884
Taebaek Wind Power Co.,Ltd.
38,452 23,732 9,858 13 9,956 -
Pyeongchang Wind PowerCo., Ltd.
2,922 415 43 - - -
Hyosung InformationSystem Co., Ltd.
184,396 113,887 158,261 99,470 140,089 89,518
Hyosung Toyota Corp. 17,571 21,725 5,907 8,652 3,780 3,969
Hyosung ITX Co., Ltd. 61,726 40,165 58,569 40,692 54,295 34,246
Sumiden Hyosung SteelCord (THAILAND) Co.,Ltd.
41,770 745 - - - -
Soonchon Eco GreenCorporation
6,429 475 - - - -
No.2 Koston Private EquityFund
10,849 45 - - - -
Taiko Private Equity Fund 14,400 - - - - -
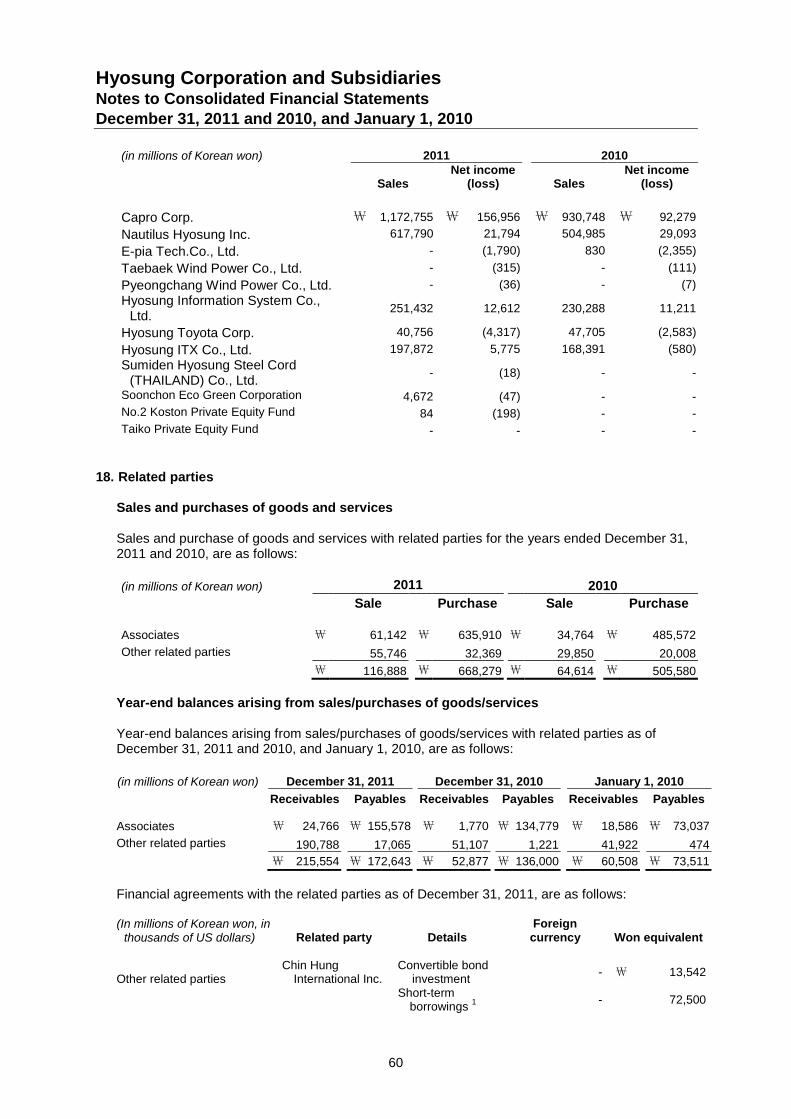
Hyosung Corporation and SubsidiariesNotes to Consolidated Financial StatementsDecember 31, 2011 and 2010, and January 1, 2010
60
(in millions of Korean won) 2011 2010
SalesNet income
(loss) SalesNet income
(loss)
Capro Corp. \ 1,172,755 \ 156,956 \ 930,748 \ 92,279
Nautilus Hyosung Inc. 617,790 21,794 504,985 29,093
E-pia Tech.Co., Ltd. - (1,790) 830 (2,355)
Taebaek Wind Power Co., Ltd. - (315) - (111)
Pyeongchang Wind Power Co., Ltd. - (36) - (7)
Hyosung Information System Co.,Ltd.
251,432 12,612 230,288 11,211
Hyosung Toyota Corp. 40,756 (4,317) 47,705 (2,583)
Hyosung ITX Co., Ltd. 197,872 5,775 168,391 (580)
Sumiden Hyosung Steel Cord(THAILAND) Co., Ltd.
- (18) - -
Soonchon Eco Green Corporation 4,672 (47) - -
No.2 Koston Private Equity Fund 84 (198) - -
Taiko Private Equity Fund - - - -
18. Related parties
Sales and purchases of goods and services
Sales and purchase of goods and services with related parties for the years ended December 31,2011 and 2010, are as follows:
(in millions of Korean won) 2011 2010
Sale Purchase Sale Purchase
Associates ₩ 61,142 ₩ 635,910 ₩ 34,764 ₩ 485,572
Other related parties 55,746 32,369 29,850 20,008
₩ 116,888 ₩ 668,279 ₩ 64,614 ₩ 505,580
Year-end balances arising from sales/purchases of goods/services
Year-end balances arising from sales/purchases of goods/services with related parties as ofDecember 31, 2011 and 2010, and January 1, 2010, are as follows:
(in millions of Korean won) December 31, 2011 December 31, 2010 January 1, 2010
Receivables Payables Receivables Payables Receivables Payables
Associates ₩ 24,766 ₩ 155,578 ₩ 1,770 ₩ 134,779 ₩ 18,586 ₩ 73,037
Other related parties 190,788 17,065 51,107 1,221 41,922 474
₩ 215,554 ₩ 172,643 ₩ 52,877 ₩ 136,000 ₩ 60,508 ₩ 73,511
Financial agreements with the related parties as of December 31, 2011, are as follows:
(In millions of Korean won, inthousands of US dollars) Related party Details
Foreigncurrency Won equivalent
Other related partiesChin Hung
International Inc.Convertible bond
investment- ₩ 13,542
Short-termborrowings
1 - 72,500
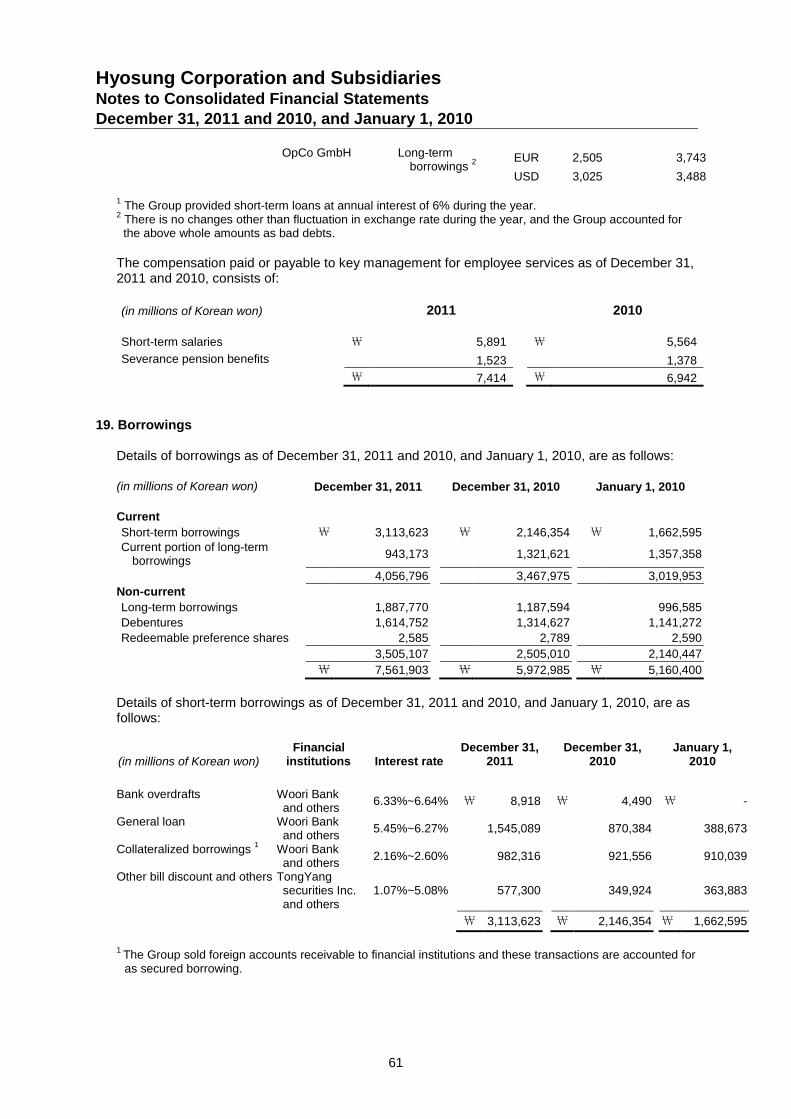
Hyosung Corporation and SubsidiariesNotes to Consolidated Financial StatementsDecember 31, 2011 and 2010, and January 1, 2010
61
OpCo GmbH Long-termborrowings
2 EUR 2,505 3,743
USD 3,025 3,488
1The Group provided short-term loans at annual interest of 6% during the year.
2There is no changes other than fluctuation in exchange rate during the year, and the Group accounted forthe above whole amounts as bad debts.
The compensation paid or payable to key management for employee services as of December 31,2011 and 2010, consists of:
(in millions of Korean won) 2011 2010
Short-term salaries ₩ 5,891 ₩ 5,564
Severance pension benefits 1,523 1,378
₩ 7,414 ₩ 6,942
19. Borrowings
Details of borrowings as of December 31, 2011 and 2010, and January 1, 2010, are as follows:
(in millions of Korean won) December 31, 2011 December 31, 2010 January 1, 2010
Current
Short-term borrowings \ 3,113,623 \ 2,146,354 \ 1,662,595Current portion of long-term
borrowings943,173 1,321,621 1,357,358
4,056,796 3,467,975 3,019,953
Non-current
Long-term borrowings 1,887,770 1,187,594 996,585
Debentures 1,614,752 1,314,627 1,141,272
Redeemable preference shares 2,585 2,789 2,590
3,505,107 2,505,010 2,140,447
\ 7,561,903 \ 5,972,985 \ 5,160,400
Details of short-term borrowings as of December 31, 2011 and 2010, and January 1, 2010, are asfollows:
(in millions of Korean won)Financial
institutions Interest rateDecember 31,
2011December 31,
2010January 1,
2010
Bank overdrafts Woori Bankand others
6.33%~6.64% \ 8,918 \ 4,490 \ -
General loan Woori Bankand others
5.45%~6.27% 1,545,089 870,384 388,673
Collateralized borrowings1
Woori Bankand others
2.16%~2.60% 982,316 921,556 910,039
Other bill discount and others TongYangsecurities Inc.and others
1.07%~5.08% 577,300 349,924 363,883
\ 3,113,623 \ 2,146,354 \ 1,662,595
1The Group sold foreign accounts receivable to financial institutions and these transactions are accounted foras secured borrowing.
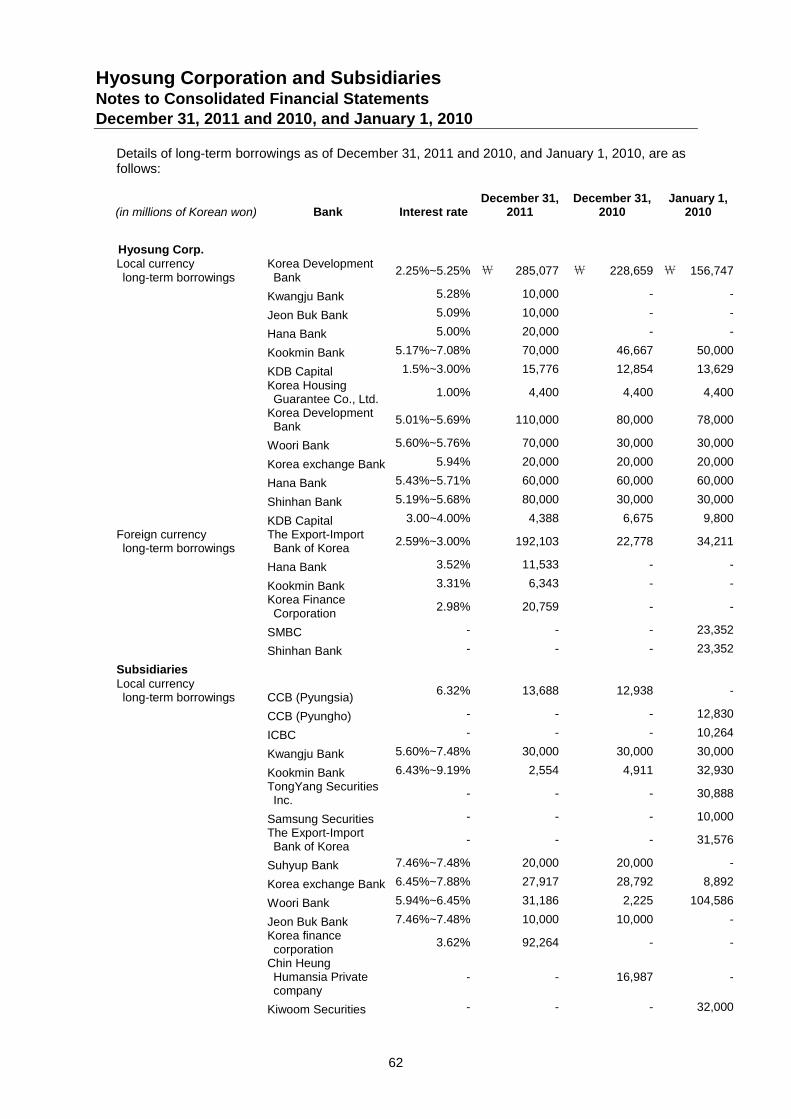
Hyosung Corporation and SubsidiariesNotes to Consolidated Financial StatementsDecember 31, 2011 and 2010, and January 1, 2010
62
Details of long-term borrowings as of December 31, 2011 and 2010, and January 1, 2010, are asfollows:
(in millions of Korean won) Bank Interest rateDecember 31,
2011December 31,
2010January 1,
2010
Hyosung Corp.Local currencylong-term borrowings
Korea DevelopmentBank
2.25%~5.25% \ 285,077 \ 228,659 \ 156,747
Kwangju Bank 5.28% 10,000 - -
Jeon Buk Bank 5.09% 10,000 - -
Hana Bank 5.00% 20,000 - -
Kookmin Bank 5.17%~7.08% 70,000 46,667 50,000
KDB Capital 1.5%~3.00% 15,776 12,854 13,629
Korea HousingGuarantee Co., Ltd.
1.00% 4,400 4,400 4,400
Korea DevelopmentBank
5.01%~5.69% 110,000 80,000 78,000
Woori Bank 5.60%~5.76% 70,000 30,000 30,000
Korea exchange Bank 5.94% 20,000 20,000 20,000
Hana Bank 5.43%~5.71% 60,000 60,000 60,000
Shinhan Bank 5.19%~5.68% 80,000 30,000 30,000
KDB Capital 3.00~4.00% 4,388 6,675 9,800
Foreign currencylong-term borrowings
The Export-ImportBank of Korea
2.59%~3.00% 192,103 22,778 34,211
Hana Bank 3.52% 11,533 - -
Kookmin Bank 3.31% 6,343 - -
Korea FinanceCorporation
2.98% 20,759 - -
SMBC - - - 23,352
Shinhan Bank - - - 23,352
SubsidiariesLocal currencylong-term borrowings CCB (Pyungsia)
6.32% 13,688 12,938 -
CCB (Pyungho) - - - 12,830
ICBC - - - 10,264
Kwangju Bank 5.60%~7.48% 30,000 30,000 30,000
Kookmin Bank 6.43%~9.19% 2,554 4,911 32,930
TongYang SecuritiesInc.
- - - 30,888
Samsung Securities - - - 10,000
The Export-ImportBank of Korea
- - - 31,576
Suhyup Bank 7.46%~7.48% 20,000 20,000 -
Korea exchange Bank 6.45%~7.88% 27,917 28,792 8,892
Woori Bank 5.94%~6.45% 31,186 2,225 104,586
Jeon Buk Bank 7.46%~7.48% 10,000 10,000 -
Korea financecorporation
3.62% 92,264 - -
Chin HeungHumansia Privatecompany
- - 16,987 -
Kiwoom Securities - - - 32,000
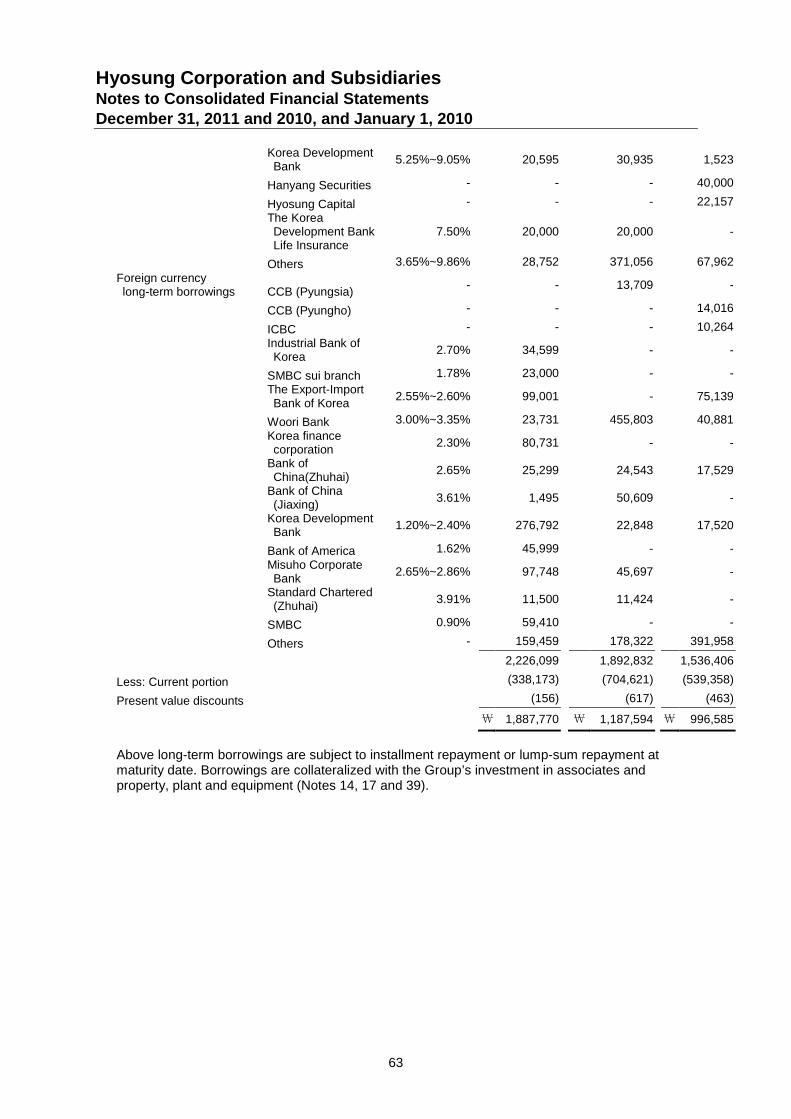
Hyosung Corporation and SubsidiariesNotes to Consolidated Financial StatementsDecember 31, 2011 and 2010, and January 1, 2010
63
Korea DevelopmentBank
5.25%~9.05% 20,595 30,935 1,523
Hanyang Securities - - - 40,000
Hyosung Capital - - - 22,157
The KoreaDevelopment BankLife Insurance
7.50% 20,000 20,000 -
Others 3.65%~9.86% 28,752 371,056 67,962
Foreign currencylong-term borrowings CCB (Pyungsia)
- - 13,709 -
CCB (Pyungho) - - - 14,016
ICBC - - - 10,264
Industrial Bank ofKorea
2.70% 34,599 - -
SMBC sui branch 1.78% 23,000 - -
The Export-ImportBank of Korea
2.55%~2.60% 99,001 - 75,139
Woori Bank 3.00%~3.35% 23,731 455,803 40,881
Korea financecorporation
2.30% 80,731 - -
Bank ofChina(Zhuhai)
2.65% 25,299 24,543 17,529
Bank of China(Jiaxing)
3.61% 1,495 50,609 -
Korea DevelopmentBank
1.20%~2.40% 276,792 22,848 17,520
Bank of America 1.62% 45,999 - -
Misuho CorporateBank
2.65%~2.86% 97,748 45,697 -
Standard Chartered(Zhuhai)
3.91% 11,500 11,424 -
SMBC 0.90% 59,410 - -
Others - 159,459 178,322 391,958
2,226,099 1,892,832 1,536,406
Less: Current portion (338,173) (704,621) (539,358)
Present value discounts (156) (617) (463)
\ 1,887,770 \ 1,187,594 \ 996,585
Above long-term borrowings are subject to installment repayment or lump-sum repayment atmaturity date. Borrowings are collateralized with the Group’s investment in associates andproperty, plant and equipment (Notes 14, 17 and 39).
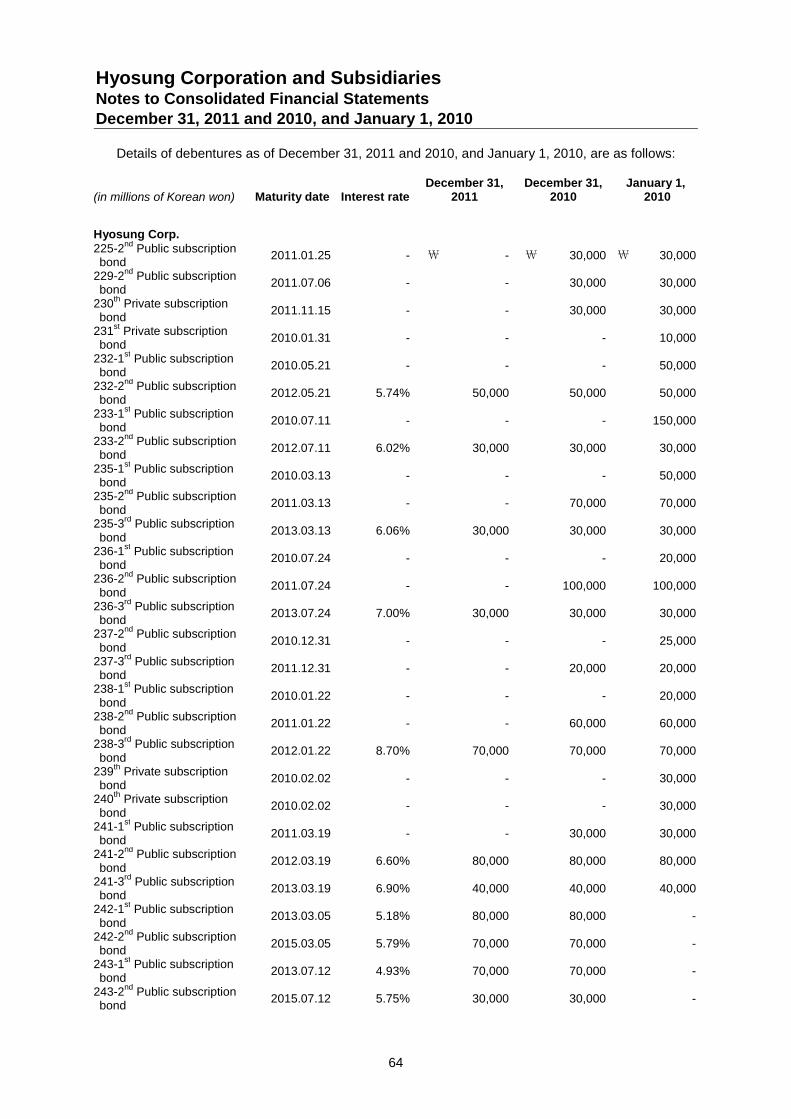
Hyosung Corporation and SubsidiariesNotes to Consolidated Financial StatementsDecember 31, 2011 and 2010, and January 1, 2010
64
Details of debentures as of December 31, 2011 and 2010, and January 1, 2010, are as follows:
(in millions of Korean won) Maturity date Interest rateDecember 31,
2011December 31,
2010January 1,
2010
Hyosung Corp.225-2
ndPublic subscription
bond2011.01.25 - \ - \ 30,000 \ 30,000
229-2nd
Public subscriptionbond
2011.07.06 - - 30,000 30,000
230th
Private subscriptionbond
2011.11.15 - - 30,000 30,000
231st
Private subscriptionbond
2010.01.31 - - - 10,000
232-1st
Public subscriptionbond
2010.05.21 - - - 50,000
232-2nd
Public subscriptionbond
2012.05.21 5.74% 50,000 50,000 50,000
233-1st
Public subscriptionbond
2010.07.11 - - - 150,000
233-2nd
Public subscriptionbond
2012.07.11 6.02% 30,000 30,000 30,000
235-1st
Public subscriptionbond
2010.03.13 - - - 50,000
235-2nd
Public subscriptionbond
2011.03.13 - - 70,000 70,000
235-3rd
Public subscriptionbond
2013.03.13 6.06% 30,000 30,000 30,000
236-1st
Public subscriptionbond
2010.07.24 - - - 20,000
236-2nd
Public subscriptionbond
2011.07.24 - - 100,000 100,000
236-3rd
Public subscriptionbond
2013.07.24 7.00% 30,000 30,000 30,000
237-2nd
Public subscriptionbond
2010.12.31 - - - 25,000
237-3rd
Public subscriptionbond
2011.12.31 - - 20,000 20,000
238-1st
Public subscriptionbond
2010.01.22 - - - 20,000
238-2nd
Public subscriptionbond
2011.01.22 - - 60,000 60,000
238-3rd
Public subscriptionbond
2012.01.22 8.70% 70,000 70,000 70,000
239th
Private subscriptionbond
2010.02.02 - - - 30,000
240th
Private subscriptionbond
2010.02.02 - - - 30,000
241-1st
Public subscriptionbond
2011.03.19 - - 30,000 30,000
241-2nd
Public subscriptionbond
2012.03.19 6.60% 80,000 80,000 80,000
241-3rd
Public subscriptionbond
2013.03.19 6.90% 40,000 40,000 40,000
242-1st
Public subscriptionbond
2013.03.05 5.18% 80,000 80,000 -
242-2nd
Public subscriptionbond
2015.03.05 5.79% 70,000 70,000 -
243-1st
Public subscriptionbond
2013.07.12 4.93% 70,000 70,000 -
243-2nd
Public subscriptionbond
2015.07.12 5.75% 30,000 30,000 -
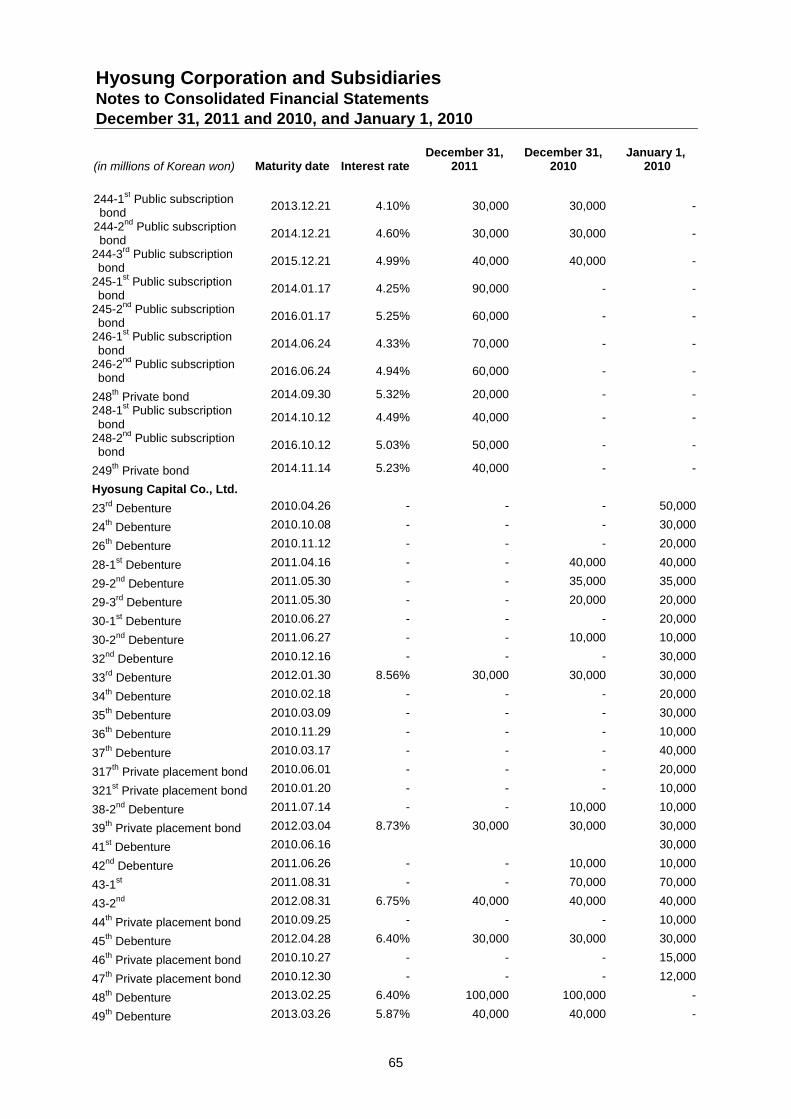
Hyosung Corporation and SubsidiariesNotes to Consolidated Financial StatementsDecember 31, 2011 and 2010, and January 1, 2010
65
(in millions of Korean won) Maturity date Interest rateDecember 31,
2011December 31,
2010January 1,
2010
244-1st
Public subscriptionbond
2013.12.21 4.10% 30,000 30,000 -
244-2nd
Public subscriptionbond
2014.12.21 4.60% 30,000 30,000 -
244-3rd
Public subscriptionbond
2015.12.21 4.99% 40,000 40,000 -
245-1st
Public subscriptionbond
2014.01.17 4.25% 90,000 - -
245-2nd
Public subscriptionbond
2016.01.17 5.25% 60,000 - -
246-1st
Public subscriptionbond
2014.06.24 4.33% 70,000 - -
246-2nd
Public subscriptionbond
2016.06.24 4.94% 60,000 - -
248th
Private bond 2014.09.30 5.32% 20,000 - -
248-1st
Public subscriptionbond
2014.10.12 4.49% 40,000 - -
248-2nd
Public subscriptionbond
2016.10.12 5.03% 50,000 - -
249th
Private bond 2014.11.14 5.23% 40,000 - -
Hyosung Capital Co., Ltd.
23rd
Debenture 2010.04.26 - - - 50,000
24th
Debenture 2010.10.08 - - - 30,000
26th
Debenture 2010.11.12 - - - 20,000
28-1st
Debenture 2011.04.16 - - 40,000 40,000
29-2nd
Debenture 2011.05.30 - - 35,000 35,000
29-3rd
Debenture 2011.05.30 - - 20,000 20,000
30-1st
Debenture 2010.06.27 - - - 20,000
30-2nd
Debenture 2011.06.27 - - 10,000 10,000
32nd
Debenture 2010.12.16 - - - 30,000
33rd
Debenture 2012.01.30 8.56% 30,000 30,000 30,000
34th
Debenture 2010.02.18 - - - 20,000
35th
Debenture 2010.03.09 - - - 30,000
36th
Debenture 2010.11.29 - - - 10,000
37th
Debenture 2010.03.17 - - - 40,000
317th
Private placement bond 2010.06.01 - - - 20,000
321st
Private placement bond 2010.01.20 - - - 10,000
38-2nd
Debenture 2011.07.14 - - 10,000 10,000
39th
Private placement bond 2012.03.04 8.73% 30,000 30,000 30,000
41st
Debenture 2010.06.16 30,000
42nd
Debenture 2011.06.26 - - 10,000 10,000
43-1st 2011.08.31 - - 70,000 70,000
43-2nd 2012.08.31 6.75% 40,000 40,000 40,000
44th
Private placement bond 2010.09.25 - - - 10,000
45th
Debenture 2012.04.28 6.40% 30,000 30,000 30,000
46th
Private placement bond 2010.10.27 - - - 15,000
47th
Private placement bond 2010.12.30 - - - 12,000
48th
Debenture 2013.02.25 6.40% 100,000 100,000 -
49th
Debenture 2013.03.26 5.87% 40,000 40,000 -
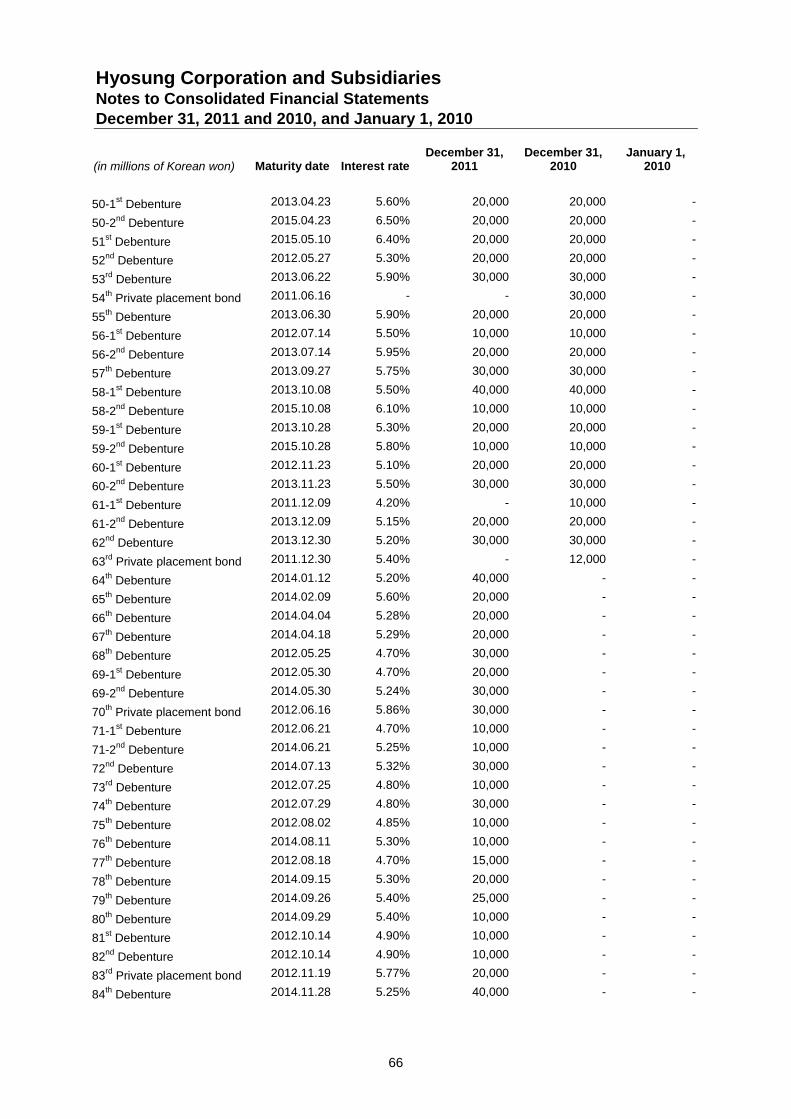
Hyosung Corporation and SubsidiariesNotes to Consolidated Financial StatementsDecember 31, 2011 and 2010, and January 1, 2010
66
(in millions of Korean won) Maturity date Interest rateDecember 31,
2011December 31,
2010January 1,
2010
50-1st
Debenture 2013.04.23 5.60% 20,000 20,000 -
50-2nd
Debenture 2015.04.23 6.50% 20,000 20,000 -
51st
Debenture 2015.05.10 6.40% 20,000 20,000 -
52nd
Debenture 2012.05.27 5.30% 20,000 20,000 -
53rd
Debenture 2013.06.22 5.90% 30,000 30,000 -
54th
Private placement bond 2011.06.16 - - 30,000 -
55th
Debenture 2013.06.30 5.90% 20,000 20,000 -
56-1st
Debenture 2012.07.14 5.50% 10,000 10,000 -
56-2nd
Debenture 2013.07.14 5.95% 20,000 20,000 -
57th
Debenture 2013.09.27 5.75% 30,000 30,000 -
58-1st
Debenture 2013.10.08 5.50% 40,000 40,000 -
58-2nd
Debenture 2015.10.08 6.10% 10,000 10,000 -
59-1st
Debenture 2013.10.28 5.30% 20,000 20,000 -
59-2nd
Debenture 2015.10.28 5.80% 10,000 10,000 -
60-1st
Debenture 2012.11.23 5.10% 20,000 20,000 -
60-2nd
Debenture 2013.11.23 5.50% 30,000 30,000 -
61-1st
Debenture 2011.12.09 4.20% - 10,000 -
61-2nd
Debenture 2013.12.09 5.15% 20,000 20,000 -
62nd
Debenture 2013.12.30 5.20% 30,000 30,000 -
63rd
Private placement bond 2011.12.30 5.40% - 12,000 -
64th
Debenture 2014.01.12 5.20% 40,000 - -
65th
Debenture 2014.02.09 5.60% 20,000 - -
66th
Debenture 2014.04.04 5.28% 20,000 - -
67th
Debenture 2014.04.18 5.29% 20,000 - -
68th
Debenture 2012.05.25 4.70% 30,000 - -
69-1st
Debenture 2012.05.30 4.70% 20,000 - -
69-2nd
Debenture 2014.05.30 5.24% 30,000 - -
70th
Private placement bond 2012.06.16 5.86% 30,000 - -
71-1st
Debenture 2012.06.21 4.70% 10,000 - -
71-2nd
Debenture 2014.06.21 5.25% 10,000 - -
72nd
Debenture 2014.07.13 5.32% 30,000 - -
73rd
Debenture 2012.07.25 4.80% 10,000 - -
74th
Debenture 2012.07.29 4.80% 30,000 - -
75th
Debenture 2012.08.02 4.85% 10,000 - -
76th
Debenture 2014.08.11 5.30% 10,000 - -
77th
Debenture 2012.08.18 4.70% 15,000 - -
78th
Debenture 2014.09.15 5.30% 20,000 - -
79th
Debenture 2014.09.26 5.40% 25,000 - -
80th
Debenture 2014.09.29 5.40% 10,000 - -
81st
Debenture 2012.10.14 4.90% 10,000 - -
82nd
Debenture 2012.10.14 4.90% 10,000 - -
83rd
Private placement bond 2012.11.19 5.77% 20,000 - -
84th
Debenture 2014.11.28 5.25% 40,000 - -
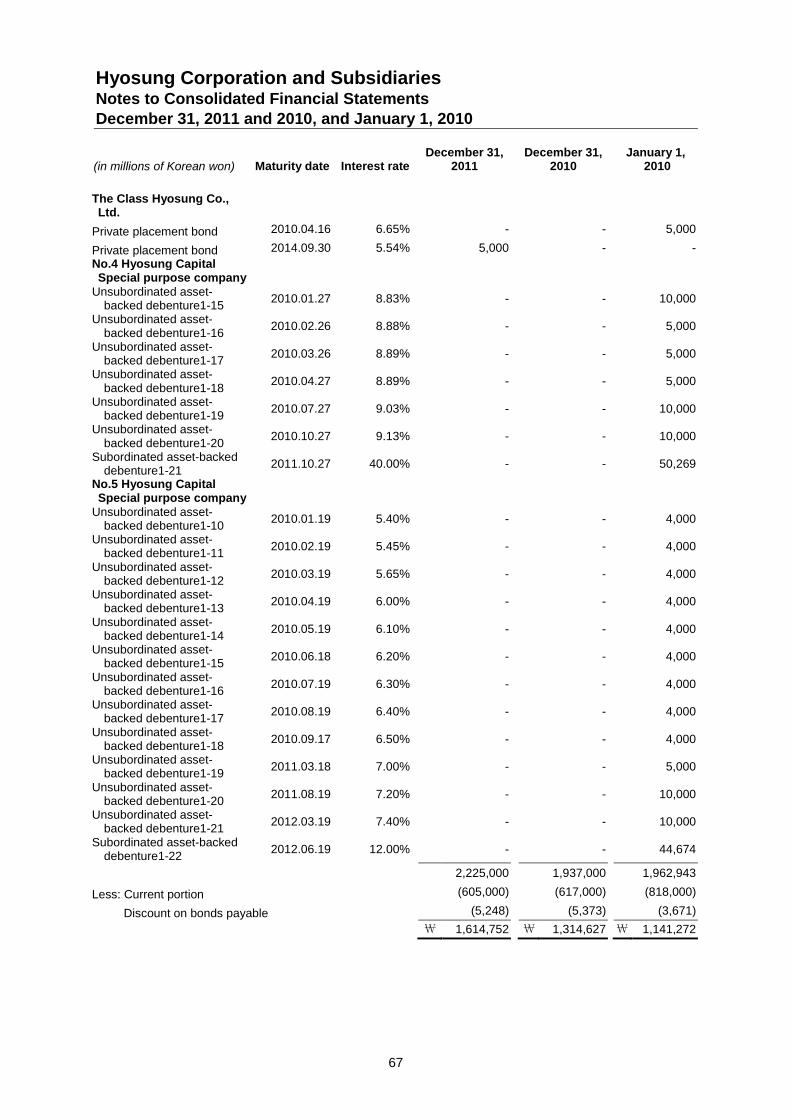
Hyosung Corporation and SubsidiariesNotes to Consolidated Financial StatementsDecember 31, 2011 and 2010, and January 1, 2010
67
(in millions of Korean won) Maturity date Interest rateDecember 31,
2011December 31,
2010January 1,
2010
The Class Hyosung Co.,Ltd.
Private placement bond 2010.04.16 6.65% - - 5,000
Private placement bond 2014.09.30 5.54% 5,000 - -
No.4 Hyosung CapitalSpecial purpose company
Unsubordinated asset-backed debenture1-15
2010.01.27 8.83% - - 10,000
Unsubordinated asset-backed debenture1-16
2010.02.26 8.88% - - 5,000
Unsubordinated asset-backed debenture1-17
2010.03.26 8.89% - - 5,000
Unsubordinated asset-backed debenture1-18
2010.04.27 8.89% - - 5,000
Unsubordinated asset-backed debenture1-19
2010.07.27 9.03% - - 10,000
Unsubordinated asset-backed debenture1-20
2010.10.27 9.13% - - 10,000
Subordinated asset-backeddebenture1-21
2011.10.27 40.00% - - 50,269
No.5 Hyosung CapitalSpecial purpose company
Unsubordinated asset-backed debenture1-10
2010.01.19 5.40% - - 4,000
Unsubordinated asset-backed debenture1-11
2010.02.19 5.45% - - 4,000
Unsubordinated asset-backed debenture1-12
2010.03.19 5.65% - - 4,000
Unsubordinated asset-backed debenture1-13
2010.04.19 6.00% - - 4,000
Unsubordinated asset-backed debenture1-14
2010.05.19 6.10% - - 4,000
Unsubordinated asset-backed debenture1-15
2010.06.18 6.20% - - 4,000
Unsubordinated asset-backed debenture1-16
2010.07.19 6.30% - - 4,000
Unsubordinated asset-backed debenture1-17
2010.08.19 6.40% - - 4,000
Unsubordinated asset-backed debenture1-18
2010.09.17 6.50% - - 4,000
Unsubordinated asset-backed debenture1-19
2011.03.18 7.00% - - 5,000
Unsubordinated asset-backed debenture1-20
2011.08.19 7.20% - - 10,000
Unsubordinated asset-backed debenture1-21
2012.03.19 7.40% - - 10,000
Subordinated asset-backeddebenture1-22
2012.06.19 12.00% - - 44,674
2,225,000 1,937,000 1,962,943
Less: Current portion (605,000) (617,000) (818,000)
Discount on bonds payable (5,248) (5,373) (3,671)
\ 1,614,752 \ 1,314,627 \ 1,141,272
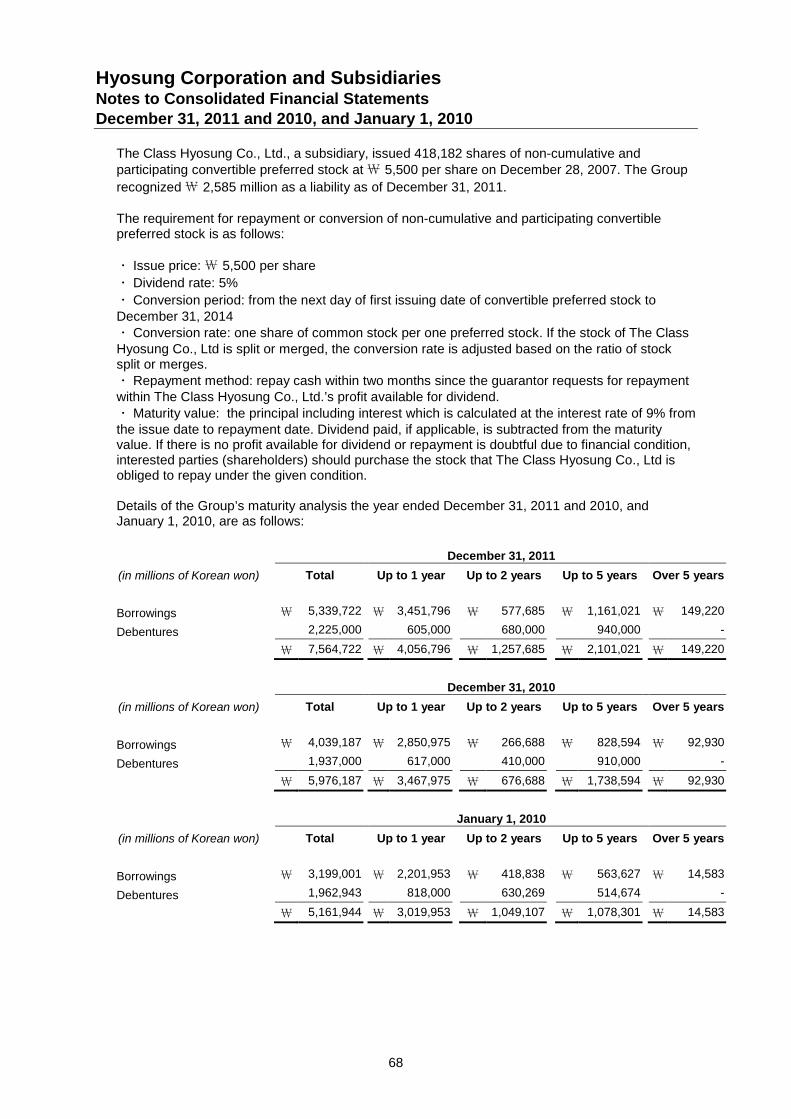
Hyosung Corporation and SubsidiariesNotes to Consolidated Financial StatementsDecember 31, 2011 and 2010, and January 1, 2010
68
The Class Hyosung Co., Ltd., a subsidiary, issued 418,182 shares of non-cumulative andparticipating convertible preferred stock at\ 5,500 per share on December 28, 2007. The Group
recognized\ 2,585 million as a liability as of December 31, 2011.
The requirement for repayment or conversion of non-cumulative and participating convertiblepreferred stock is as follows:
ㆍ Issue price:\ 5,500 per share
ㆍ Dividend rate: 5%
ㆍ Conversion period: from the next day of first issuing date of convertible preferred stock toDecember 31, 2014ㆍ Conversion rate: one share of common stock per one preferred stock. If the stock of The ClassHyosung Co., Ltd is split or merged, the conversion rate is adjusted based on the ratio of stocksplit or merges.ㆍ Repayment method: repay cash within two months since the guarantor requests for repaymentwithin The Class Hyosung Co., Ltd.’s profit available for dividend.ㆍ Maturity value: the principal including interest which is calculated at the interest rate of 9% fromthe issue date to repayment date. Dividend paid, if applicable, is subtracted from the maturityvalue. If there is no profit available for dividend or repayment is doubtful due to financial condition,interested parties (shareholders) should purchase the stock that The Class Hyosung Co., Ltd isobliged to repay under the given condition.
Details of the Group’s maturity analysis the year ended December 31, 2011 and 2010, andJanuary 1, 2010, are as follows:
December 31, 2011
(in millions of Korean won) Total Up to 1 year Up to 2 years Up to 5 years Over 5 years
Borrowings \ 5,339,722 \ 3,451,796 \ 577,685 \ 1,161,021 \ 149,220
Debentures 2,225,000 605,000 680,000 940,000 -
\ 7,564,722 \ 4,056,796 \ 1,257,685 \ 2,101,021 \ 149,220
December 31, 2010
(in millions of Korean won) Total Up to 1 year Up to 2 years Up to 5 years Over 5 years
Borrowings \ 4,039,187 \ 2,850,975 \ 266,688 \ 828,594 \ 92,930
Debentures 1,937,000 617,000 410,000 910,000 -
\ 5,976,187 \ 3,467,975 \ 676,688 \ 1,738,594 \ 92,930
January 1, 2010
(in millions of Korean won) Total Up to 1 year Up to 2 years Up to 5 years Over 5 years
Borrowings \ 3,199,001 \ 2,201,953 \ 418,838 \ 563,627 \ 14,583
Debentures 1,962,943 818,000 630,269 514,674 -
\ 5,161,944 \ 3,019,953 \ 1,049,107 \ 1,078,301 \ 14,583
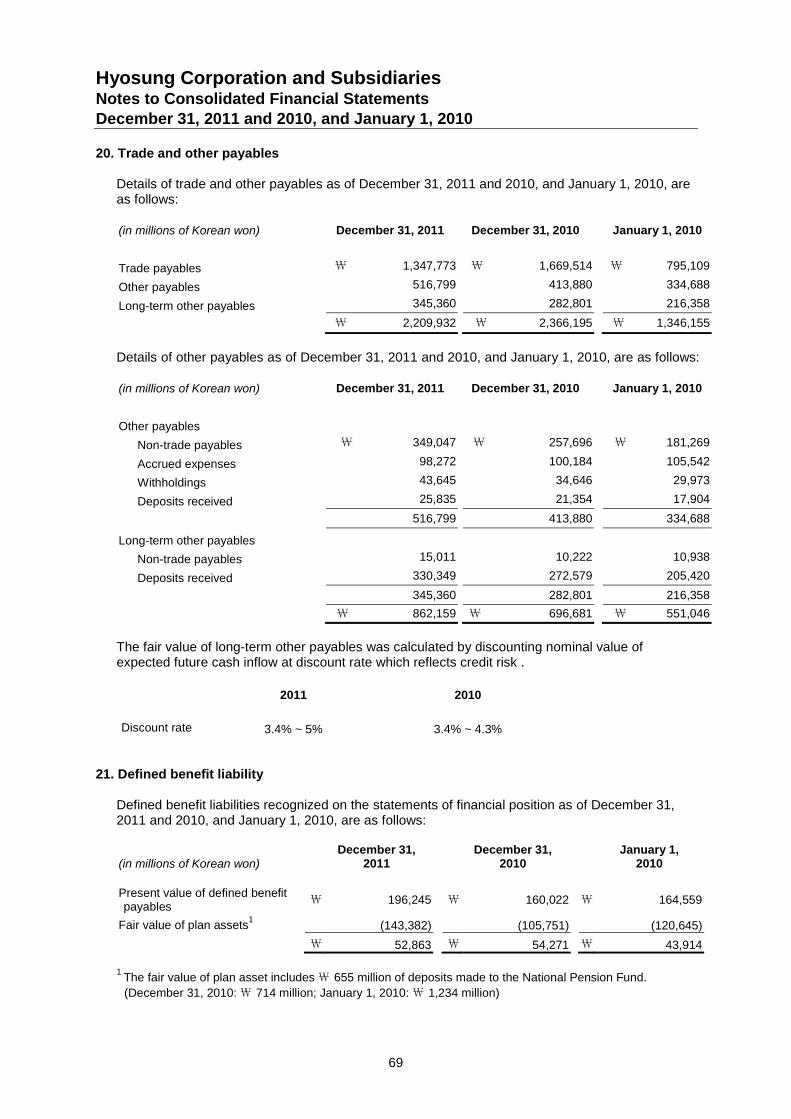
Hyosung Corporation and SubsidiariesNotes to Consolidated Financial StatementsDecember 31, 2011 and 2010, and January 1, 2010
69
20. Trade and other payables
Details of trade and other payables as of December 31, 2011 and 2010, and January 1, 2010, areas follows:
(in millions of Korean won) December 31, 2011 December 31, 2010 January 1, 2010
Trade payables \ 1,347,773 \ 1,669,514 \ 795,109
Other payables 516,799 413,880 334,688
Long-term other payables 345,360 282,801 216,358
\ 2,209,932 \ 2,366,195 \ 1,346,155
Details of other payables as of December 31, 2011 and 2010, and January 1, 2010, are as follows:
(in millions of Korean won) December 31, 2011 December 31, 2010 January 1, 2010
Other payables
Non-trade payables \ 349,047 \ 257,696 \ 181,269
Accrued expenses 98,272 100,184 105,542
Withholdings 43,645 34,646 29,973
Deposits received 25,835 21,354 17,904
516,799 413,880 334,688
Long-term other payables
Non-trade payables 15,011 10,222 10,938
Deposits received 330,349 272,579 205,420
345,360 282,801 216,358
\ 862,159 \ 696,681 \ 551,046
The fair value of long-term other payables was calculated by discounting nominal value ofexpected future cash inflow at discount rate which reflects credit risk .
2011 2010
Discount rate 3.4% ~ 5% 3.4% ~ 4.3%
21. Defined benefit liability
Defined benefit liabilities recognized on the statements of financial position as of December 31,2011 and 2010, and January 1, 2010, are as follows:
(in millions of Korean won)December 31,
2011December 31,
2010January 1,
2010
Present value of defined benefitpayables
₩ 196,245 ₩ 160,022 ₩ 164,559
Fair value of plan assets1
(143,382) (105,751) (120,645)
₩ 52,863 ₩ 54,271 ₩ 43,914
1The fair value of plan asset includes₩ 655 million of deposits made to the National Pension Fund.
(December 31, 2010:₩ 714 million; January 1, 2010:₩ 1,234 million)
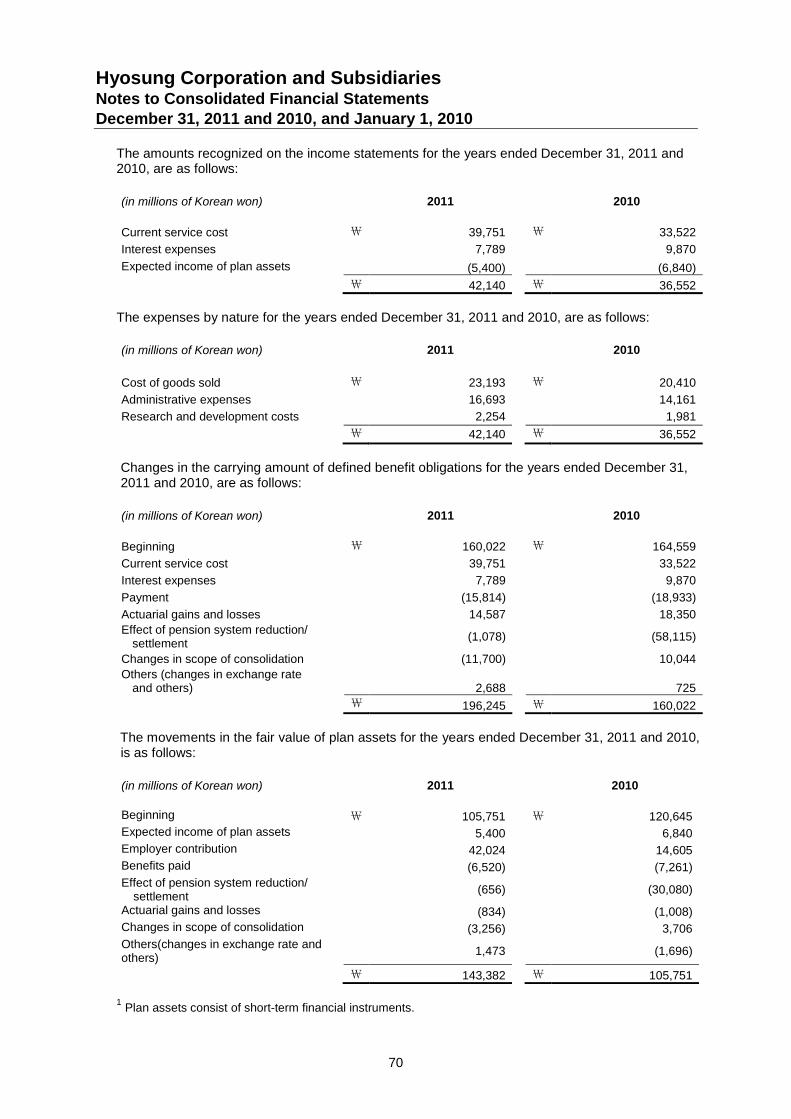
Hyosung Corporation and SubsidiariesNotes to Consolidated Financial StatementsDecember 31, 2011 and 2010, and January 1, 2010
70
The amounts recognized on the income statements for the years ended December 31, 2011 and2010, are as follows:
(in millions of Korean won) 2011 2010
Current service cost ₩ 39,751 ₩ 33,522
Interest expenses 7,789 9,870
Expected income of plan assets (5,400) (6,840)
₩ 42,140 ₩ 36,552
The expenses by nature for the years ended December 31, 2011 and 2010, are as follows:
(in millions of Korean won) 2011 2010
Cost of goods sold ₩ 23,193 ₩ 20,410
Administrative expenses 16,693 14,161
Research and development costs 2,254 1,981
₩ 42,140 ₩ 36,552
Changes in the carrying amount of defined benefit obligations for the years ended December 31,2011 and 2010, are as follows:
(in millions of Korean won) 2011 2010
Beginning ₩ 160,022 ₩ 164,559
Current service cost 39,751 33,522
Interest expenses 7,789 9,870
Payment (15,814) (18,933)
Actuarial gains and losses 14,587 18,350
Effect of pension system reduction/settlement
(1,078) (58,115)
Changes in scope of consolidation (11,700) 10,044
Others (changes in exchange rateand others) 2,688 725
₩ 196,245 ₩ 160,022
The movements in the fair value of plan assets for the years ended December 31, 2011 and 2010,is as follows:
(in millions of Korean won) 2011 2010
Beginning ₩ 105,751 ₩ 120,645
Expected income of plan assets 5,400 6,840
Employer contribution 42,024 14,605
Benefits paid (6,520) (7,261)
Effect of pension system reduction/settlement
(656) (30,080)
Actuarial gains and losses (834) (1,008)
Changes in scope of consolidation (3,256) 3,706
Others(changes in exchange rate andothers)
1,473 (1,696)
₩ 143,382 ₩ 105,751
1Plan assets consist of short-term financial instruments.
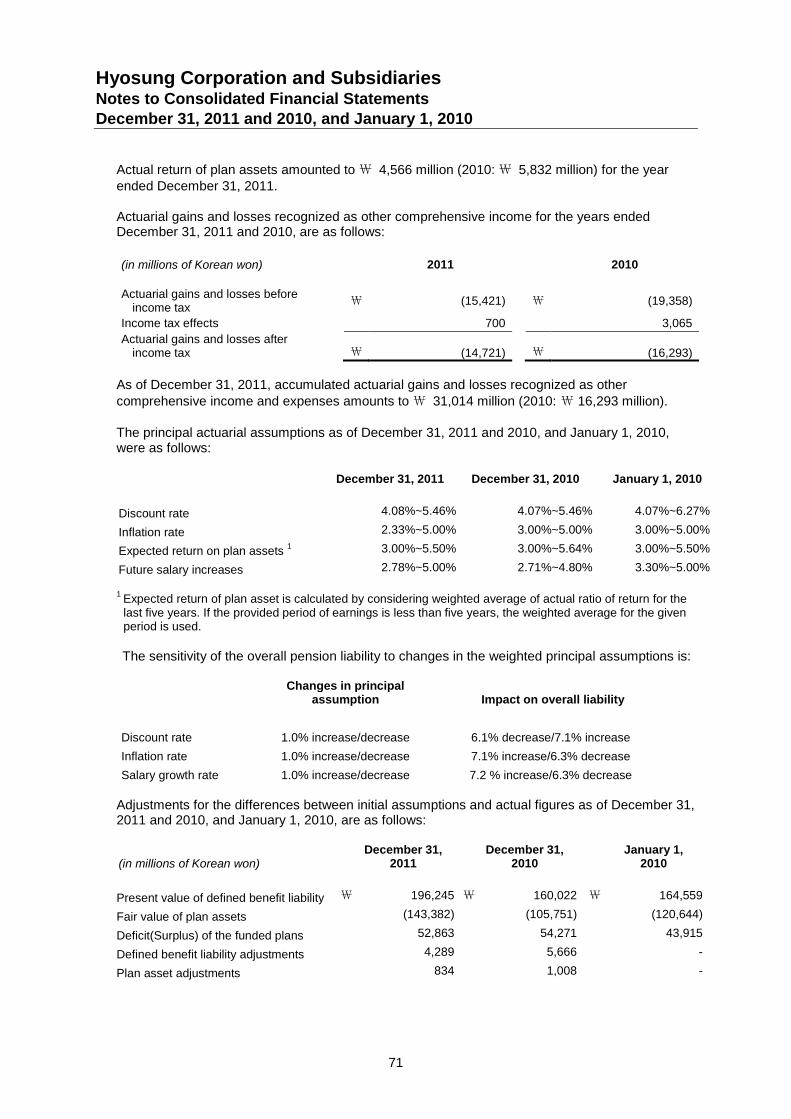
Hyosung Corporation and SubsidiariesNotes to Consolidated Financial StatementsDecember 31, 2011 and 2010, and January 1, 2010
71
Actual return of plan assets amounted to₩ 4,566 million (2010:₩ 5,832 million) for the yearended December 31, 2011.
Actuarial gains and losses recognized as other comprehensive income for the years endedDecember 31, 2011 and 2010, are as follows:
(in millions of Korean won) 2011 2010
Actuarial gains and losses beforeincome tax
₩ (15,421) ₩ (19,358)
Income tax effects 700 3,065
Actuarial gains and losses afterincome tax ₩ (14,721) ₩ (16,293)
As of December 31, 2011, accumulated actuarial gains and losses recognized as othercomprehensive income and expenses amounts to₩ 31,014 million (2010: ₩ 16,293 million).
The principal actuarial assumptions as of December 31, 2011 and 2010, and January 1, 2010,were as follows:
December 31, 2011 December 31, 2010 January 1, 2010
Discount rate 4.08%~5.46% 4.07%~5.46% 4.07%~6.27%
Inflation rate 2.33%~5.00% 3.00%~5.00% 3.00%~5.00%
Expected return on plan assets1 3.00%~5.50% 3.00%~5.64% 3.00%~5.50%
Future salary increases 2.78%~5.00% 2.71%~4.80% 3.30%~5.00%
1Expected return of plan asset is calculated by considering weighted average of actual ratio of return for thelast five years. If the provided period of earnings is less than five years, the weighted average for the givenperiod is used.
The sensitivity of the overall pension liability to changes in the weighted principal assumptions is:
Changes in principalassumption Impact on overall liability
Discount rate 1.0% increase/decrease 6.1% decrease/7.1% increase
Inflation rate 1.0% increase/decrease 7.1% increase/6.3% decrease
Salary growth rate 1.0% increase/decrease 7.2 % increase/6.3% decrease
Adjustments for the differences between initial assumptions and actual figures as of December 31,2011 and 2010, and January 1, 2010, are as follows:
(in millions of Korean won)December 31,
2011December 31,
2010January 1,
2010
Present value of defined benefit liability ₩ 196,245 ₩ 160,022 ₩ 164,559
Fair value of plan assets (143,382) (105,751) (120,644)
Deficit(Surplus) of the funded plans 52,863 54,271 43,915
Defined benefit liability adjustments 4,289 5,666 -
Plan asset adjustments 834 1,008 -
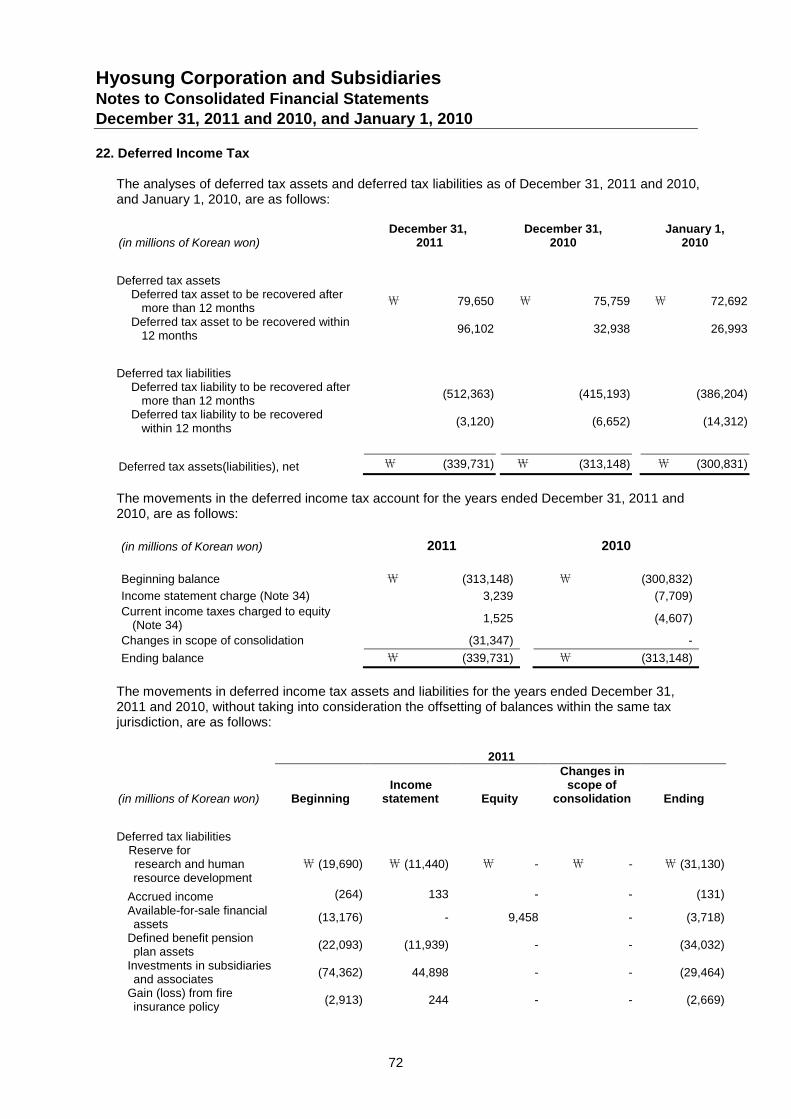
Hyosung Corporation and SubsidiariesNotes to Consolidated Financial StatementsDecember 31, 2011 and 2010, and January 1, 2010
72
22. Deferred Income Tax
The analyses of deferred tax assets and deferred tax liabilities as of December 31, 2011 and 2010,and January 1, 2010, are as follows:
(in millions of Korean won)December 31,
2011December 31,
2010January 1,
2010
Deferred tax assetsDeferred tax asset to be recovered after
more than 12 months₩ 79,650 ₩ 75,759 ₩ 72,692
Deferred tax asset to be recovered within12 months
96,102 32,938 26,993
Deferred tax liabilitiesDeferred tax liability to be recovered after
more than 12 months(512,363) (415,193) (386,204)
Deferred tax liability to be recoveredwithin 12 months
(3,120) (6,652) (14,312)
Deferred tax assets(liabilities), net ₩ (339,731) ₩ (313,148) ₩ (300,831)
The movements in the deferred income tax account for the years ended December 31, 2011 and2010, are as follows:
(in millions of Korean won) 2011 2010
Beginning balance ₩ (313,148) ₩ (300,832)
Income statement charge (Note 34) 3,239 (7,709)
Current income taxes charged to equity(Note 34)
1,525 (4,607)
Changes in scope of consolidation (31,347) -
Ending balance ₩ (339,731) ₩ (313,148)
The movements in deferred income tax assets and liabilities for the years ended December 31,2011 and 2010, without taking into consideration the offsetting of balances within the same taxjurisdiction, are as follows:
2011
(in millions of Korean won) BeginningIncome
statement Equity
Changes inscope of
consolidation Ending
Deferred tax liabilitiesReserve forresearch and humanresource development
₩ (19,690) ₩ (11,440) ₩ - ₩ - ₩ (31,130)
Accrued income (264) 133 - - (131)
Available-for-sale financialassets
(13,176) - 9,458 - (3,718)
Defined benefit pensionplan assets
(22,093) (11,939) - - (34,032)
Investments in subsidiariesand associates
(74,362) 44,898 - - (29,464)
Gain (loss) from fireinsurance policy
(2,913) 244 - - (2,669)
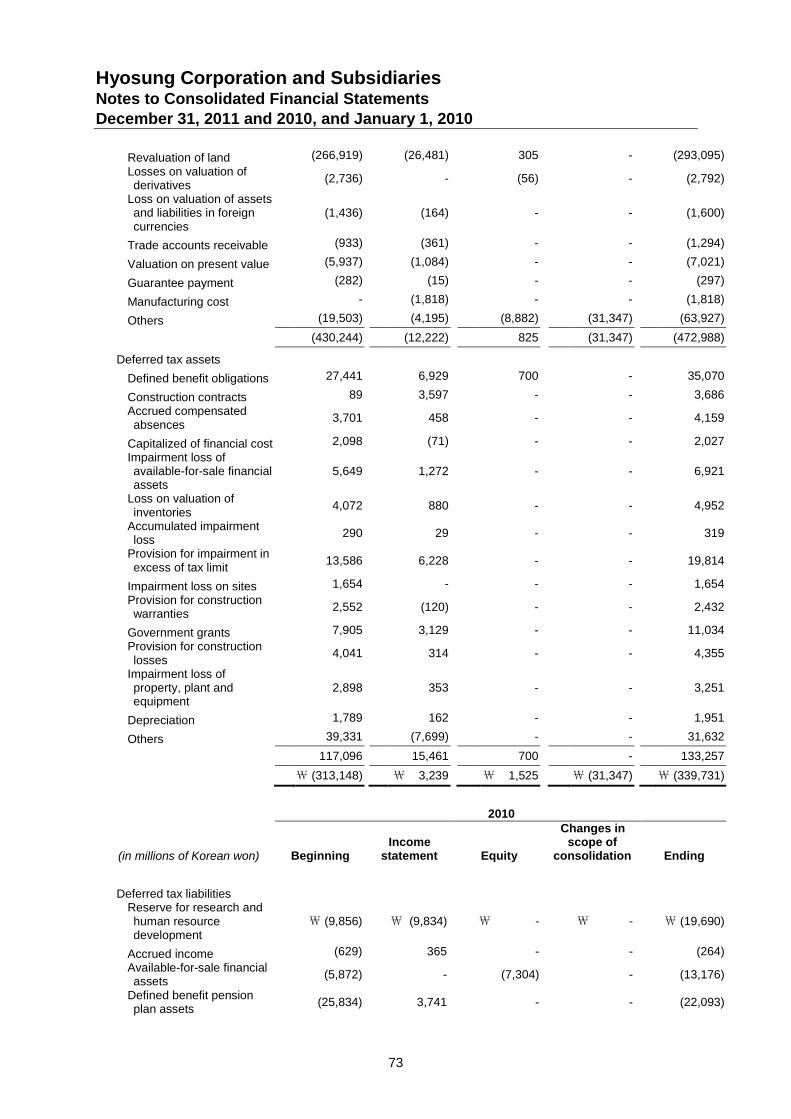
Hyosung Corporation and SubsidiariesNotes to Consolidated Financial StatementsDecember 31, 2011 and 2010, and January 1, 2010
73
Revaluation of land (266,919) (26,481) 305 - (293,095)
Losses on valuation ofderivatives
(2,736) - (56) - (2,792)
Loss on valuation of assetsand liabilities in foreigncurrencies
(1,436) (164) - - (1,600)
Trade accounts receivable (933) (361) - - (1,294)
Valuation on present value (5,937) (1,084) - - (7,021)
Guarantee payment (282) (15) - - (297)
Manufacturing cost - (1,818) - - (1,818)
Others (19,503) (4,195) (8,882) (31,347) (63,927)
(430,244) (12,222) 825 (31,347) (472,988)
Deferred tax assets
Defined benefit obligations 27,441 6,929 700 - 35,070
Construction contracts 89 3,597 - - 3,686
Accrued compensatedabsences
3,701 458 - - 4,159
Capitalized of financial cost 2,098 (71) - - 2,027
Impairment loss ofavailable-for-sale financialassets
5,649 1,272 - - 6,921
Loss on valuation ofinventories
4,072 880 - - 4,952
Accumulated impairmentloss
290 29 - - 319
Provision for impairment inexcess of tax limit
13,586 6,228 - - 19,814
Impairment loss on sites 1,654 - - - 1,654
Provision for constructionwarranties
2,552 (120) - - 2,432
Government grants 7,905 3,129 - - 11,034
Provision for constructionlosses
4,041 314 - - 4,355
Impairment loss ofproperty, plant andequipment
2,898 353 - - 3,251
Depreciation 1,789 162 - - 1,951
Others 39,331 (7,699) - - 31,632
117,096 15,461 700 - 133,257
₩ (313,148) ₩ 3,239 ₩ 1,525 ₩ (31,347) ₩ (339,731)
2010
(in millions of Korean won) BeginningIncome
statement Equity
Changes inscope of
consolidation Ending
Deferred tax liabilitiesReserve for research andhuman resourcedevelopment
₩ (9,856) ₩ (9,834) ₩ - ₩ - ₩ (19,690)
Accrued income (629) 365 - - (264)
Available-for-sale financialassets
(5,872) - (7,304) - (13,176)
Defined benefit pensionplan assets
(25,834) 3,741 - - (22,093)
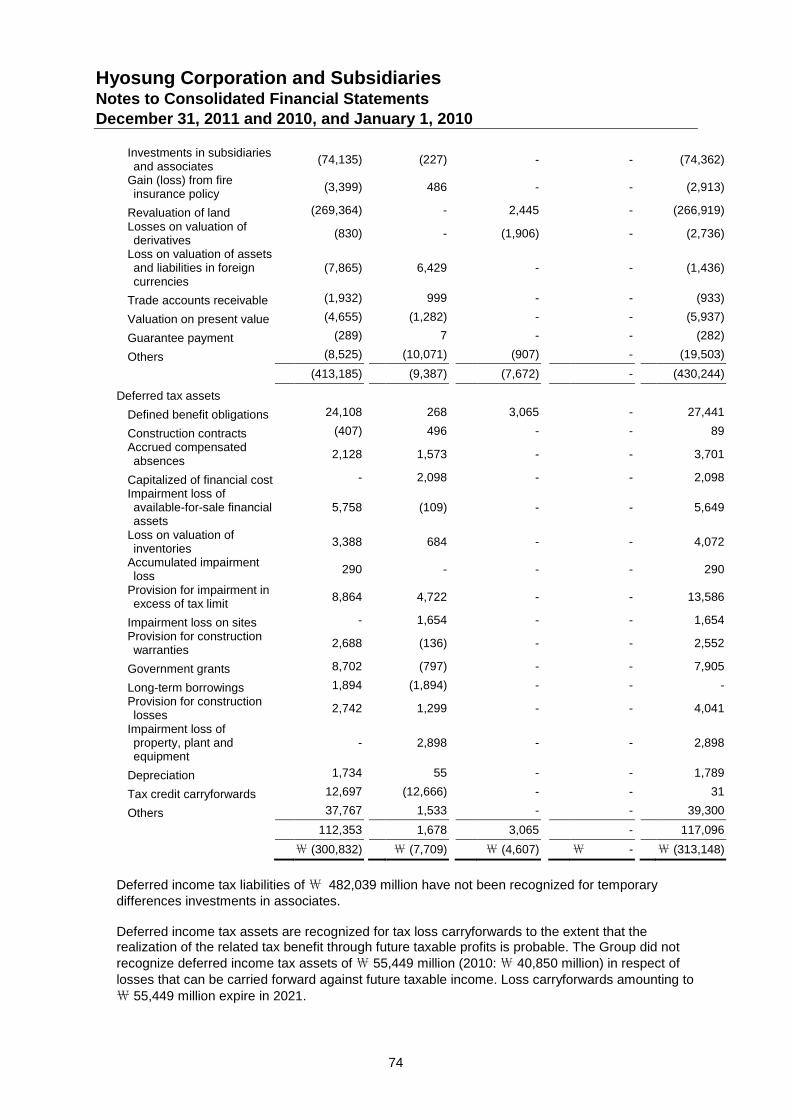
Hyosung Corporation and SubsidiariesNotes to Consolidated Financial StatementsDecember 31, 2011 and 2010, and January 1, 2010
74
Investments in subsidiariesand associates
(74,135) (227) - - (74,362)
Gain (loss) from fireinsurance policy
(3,399) 486 - - (2,913)
Revaluation of land (269,364) - 2,445 - (266,919)
Losses on valuation ofderivatives
(830) - (1,906) - (2,736)
Loss on valuation of assetsand liabilities in foreigncurrencies
(7,865) 6,429 - - (1,436)
Trade accounts receivable (1,932) 999 - - (933)
Valuation on present value (4,655) (1,282) - - (5,937)
Guarantee payment (289) 7 - - (282)
Others (8,525) (10,071) (907) - (19,503)
(413,185) (9,387) (7,672) - (430,244)
Deferred tax assets
Defined benefit obligations 24,108 268 3,065 - 27,441
Construction contracts (407) 496 - - 89
Accrued compensatedabsences
2,128 1,573 - - 3,701
Capitalized of financial cost - 2,098 - - 2,098
Impairment loss ofavailable-for-sale financialassets
5,758 (109) - - 5,649
Loss on valuation ofinventories
3,388 684 - - 4,072
Accumulated impairmentloss
290 - - - 290
Provision for impairment inexcess of tax limit
8,864 4,722 - - 13,586
Impairment loss on sites - 1,654 - - 1,654
Provision for constructionwarranties
2,688 (136) - - 2,552
Government grants 8,702 (797) - - 7,905
Long-term borrowings 1,894 (1,894) - - -
Provision for constructionlosses
2,742 1,299 - - 4,041
Impairment loss ofproperty, plant andequipment
- 2,898 - - 2,898
Depreciation 1,734 55 - - 1,789
Tax credit carryforwards 12,697 (12,666) - - 31
Others 37,767 1,533 - - 39,300
112,353 1,678 3,065 - 117,096
₩ (300,832) ₩ (7,709) ₩ (4,607) ₩ - ₩ (313,148)
Deferred income tax liabilities of₩ 482,039 million have not been recognized for temporarydifferences investments in associates.
Deferred income tax assets are recognized for tax loss carryforwards to the extent that therealization of the related tax benefit through future taxable profits is probable. The Group did notrecognize deferred income tax assets of₩ 55,449 million (2010:₩ 40,850 million) in respect oflosses that can be carried forward against future taxable income. Loss carryforwards amounting to₩ 55,449 million expire in 2021.
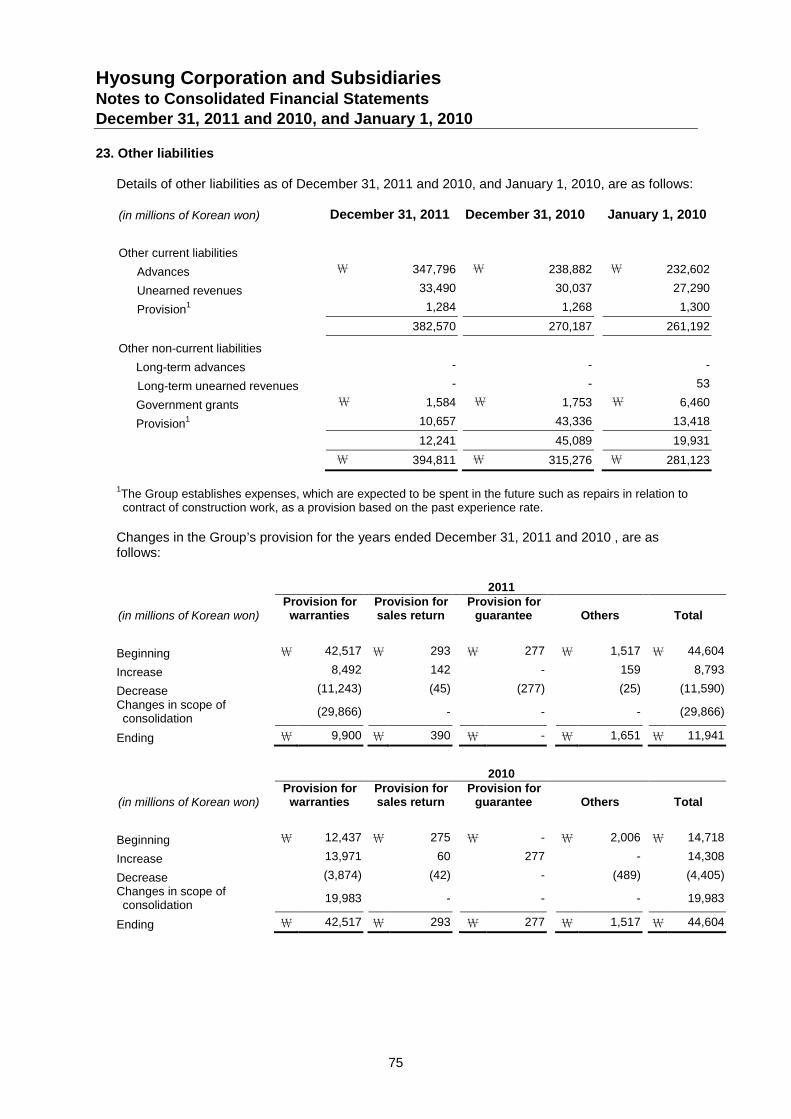
Hyosung Corporation and SubsidiariesNotes to Consolidated Financial StatementsDecember 31, 2011 and 2010, and January 1, 2010
75
23. Other liabilities
Details of other liabilities as of December 31, 2011 and 2010, and January 1, 2010, are as follows:
(in millions of Korean won) December 31, 2011 December 31, 2010 January 1, 2010
Other current liabilities
Advances \ 347,796 \ 238,882 \ 232,602
Unearned revenues 33,490 30,037 27,290
Provision1 1,284 1,268 1,300
382,570 270,187 261,192
Other non-current liabilities
Long-term advances - - -
Long-term unearned revenues - - 53
Government grants \ 1,584 \ 1,753 \ 6,460
Provision1 10,657 43,336 13,418
12,241 45,089 19,931
\ 394,811 \ 315,276 \ 281,123
1The Group establishes expenses, which are expected to be spent in the future such as repairs in relation tocontract of construction work, as a provision based on the past experience rate.
Changes in the Group’s provision for the years ended December 31, 2011 and 2010 , are asfollows:
2011
(in millions of Korean won)Provision forwarranties
Provision forsales return
Provision forguarantee Others Total
Beginning \ 42,517 \ 293 \ 277 \ 1,517 \ 44,604
Increase 8,492 142 - 159 8,793
Decrease (11,243) (45) (277) (25) (11,590)
Changes in scope ofconsolidation
(29,866) - - - (29,866)
Ending \ 9,900 \ 390 \ - \ 1,651 \ 11,941
2010
(in millions of Korean won)Provision forwarranties
Provision forsales return
Provision forguarantee Others Total
Beginning \ 12,437 \ 275 \ - \ 2,006 \ 14,718
Increase 13,971 60 277 - 14,308
Decrease (3,874) (42) - (489) (4,405)
Changes in scope ofconsolidation
19,983 - - - 19,983
Ending \ 42,517 \ 293 \ 277 \ 1,517 \ 44,604
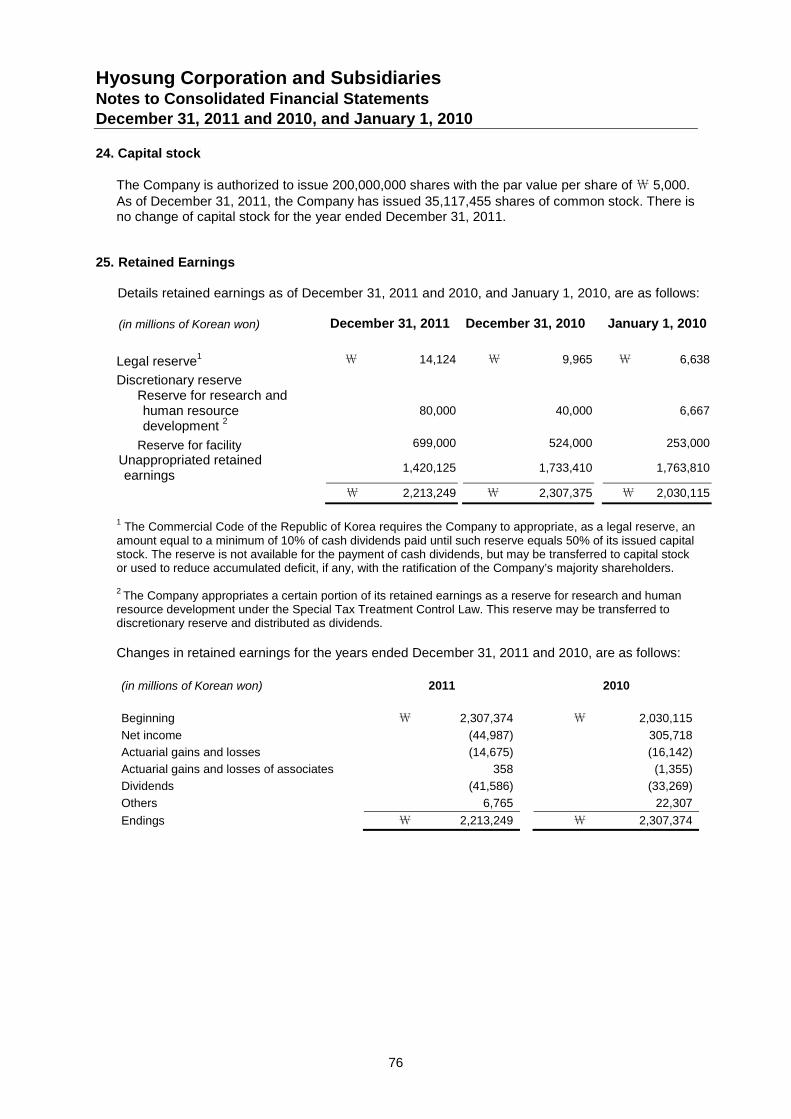
Hyosung Corporation and SubsidiariesNotes to Consolidated Financial StatementsDecember 31, 2011 and 2010, and January 1, 2010
76
24. Capital stock
The Company is authorized to issue 200,000,000 shares with the par value per share of₩ 5,000.As of December 31, 2011, the Company has issued 35,117,455 shares of common stock. There isno change of capital stock for the year ended December 31, 2011.
25. Retained Earnings
Details retained earnings as of December 31, 2011 and 2010, and January 1, 2010, are as follows:
(in millions of Korean won) December 31, 2011 December 31, 2010 January 1, 2010
Legal reserve1 \ 14,124 \ 9,965 \ 6,638
Discretionary reserveReserve for research andhuman resourcedevelopment
280,000 40,000 6,667
Reserve for facility 699,000 524,000 253,000
Unappropriated retainedearnings
1,420,125 1,733,410 1,763,810
\ 2,213,249 \ 2,307,375 \ 2,030,115
1The Commercial Code of the Republic of Korea requires the Company to appropriate, as a legal reserve, an
amount equal to a minimum of 10% of cash dividends paid until such reserve equals 50% of its issued capitalstock. The reserve is not available for the payment of cash dividends, but may be transferred to capital stockor used to reduce accumulated deficit, if any, with the ratification of the Company’s majority shareholders.
2The Company appropriates a certain portion of its retained earnings as a reserve for research and human
resource development under the Special Tax Treatment Control Law. This reserve may be transferred todiscretionary reserve and distributed as dividends.
Changes in retained earnings for the years ended December 31, 2011 and 2010, are as follows:
(in millions of Korean won) 2011 2010
Beginning \ 2,307,374 \ 2,030,115
Net income (44,987) 305,718
Actuarial gains and losses (14,675) (16,142)
Actuarial gains and losses of associates 358 (1,355)
Dividends (41,586) (33,269)
Others 6,765 22,307
Endings \ 2,213,249 \ 2,307,374
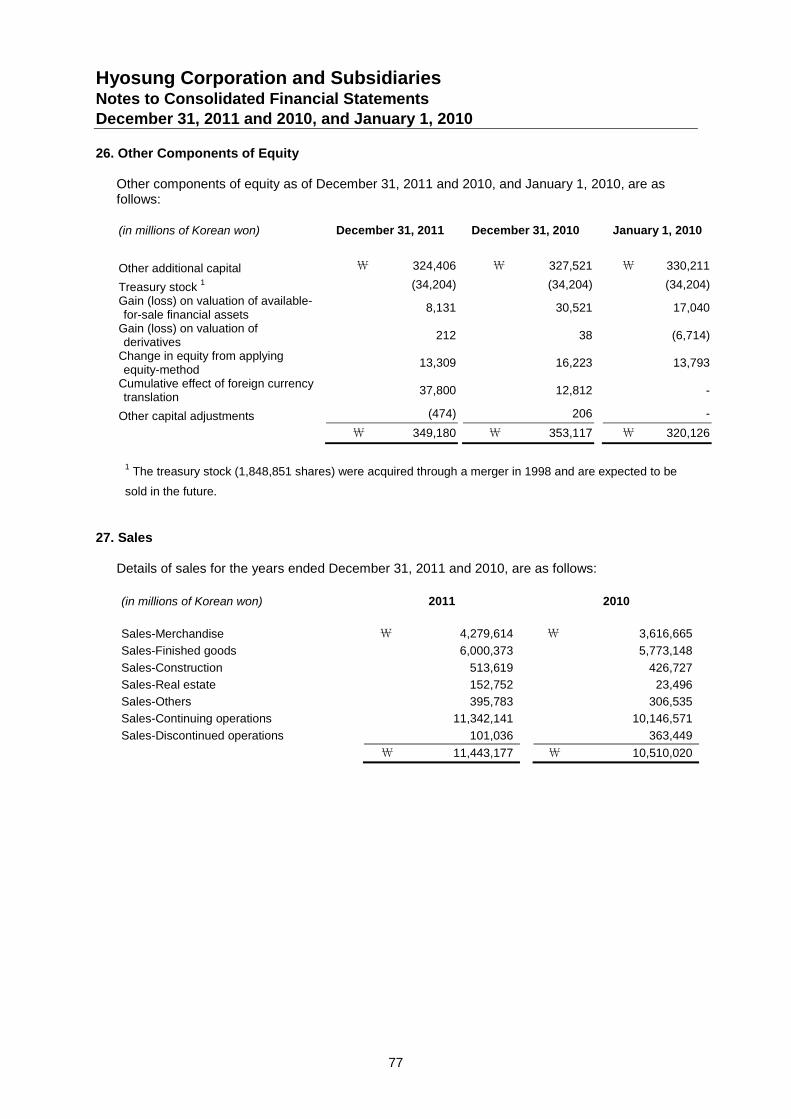
Hyosung Corporation and SubsidiariesNotes to Consolidated Financial StatementsDecember 31, 2011 and 2010, and January 1, 2010
77
26. Other Components of Equity
Other components of equity as of December 31, 2011 and 2010, and January 1, 2010, are asfollows:
(in millions of Korean won) December 31, 2011 December 31, 2010 January 1, 2010
Other additional capital \ 324,406 \ 327,521 \ 330,211
Treasury stock1 (34,204) (34,204) (34,204)
Gain (loss) on valuation of available-for-sale financial assets
8,131 30,521 17,040
Gain (loss) on valuation ofderivatives
212 38 (6,714)
Change in equity from applyingequity-method
13,309 16,223 13,793
Cumulative effect of foreign currencytranslation
37,800 12,812 -
Other capital adjustments (474) 206 -
\ 349,180 \ 353,117 \ 320,126
1The treasury stock (1,848,851 shares) were acquired through a merger in 1998 and are expected to be
sold in the future.
27. Sales
Details of sales for the years ended December 31, 2011 and 2010, are as follows:
(in millions of Korean won) 2011 2010
Sales-Merchandise \ 4,279,614 \ 3,616,665
Sales-Finished goods 6,000,373 5,773,148
Sales-Construction 513,619 426,727
Sales-Real estate 152,752 23,496
Sales-Others 395,783 306,535
Sales-Continuing operations 11,342,141 10,146,571
Sales-Discontinued operations 101,036 363,449
\ 11,443,177 \ 10,510,020
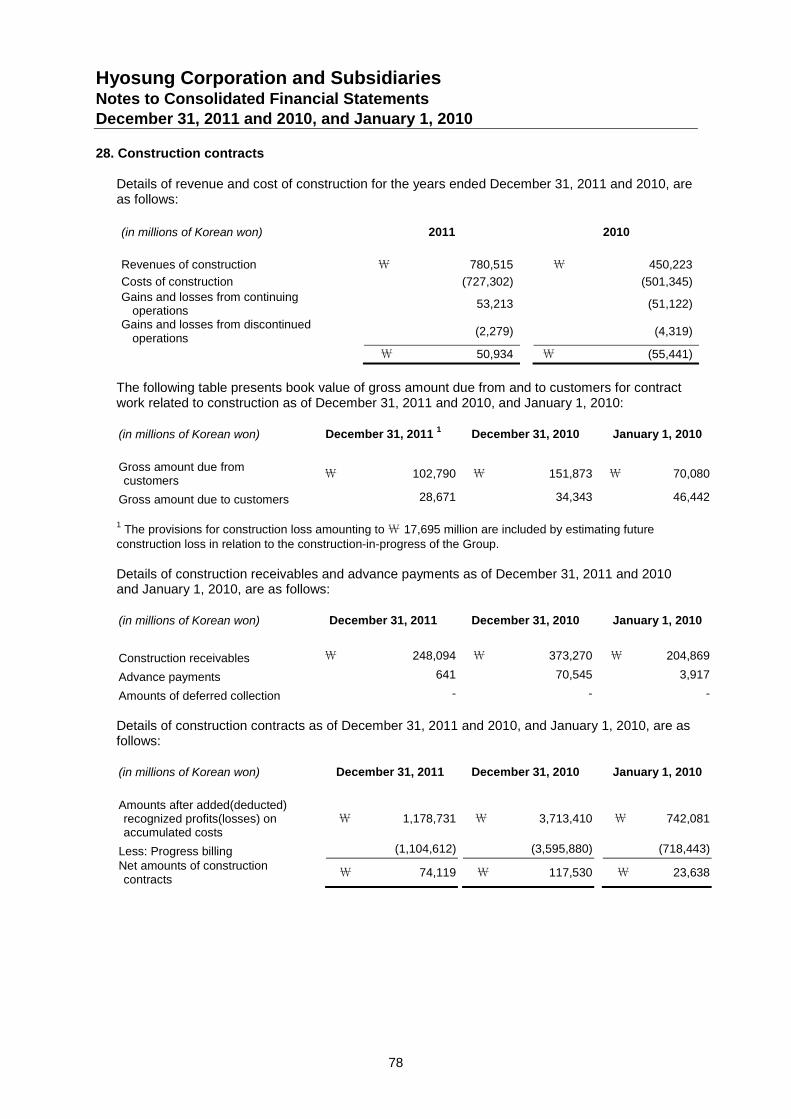
Hyosung Corporation and SubsidiariesNotes to Consolidated Financial StatementsDecember 31, 2011 and 2010, and January 1, 2010
78
28. Construction contracts
Details of revenue and cost of construction for the years ended December 31, 2011 and 2010, areas follows:
(in millions of Korean won) 2011 2010
Revenues of construction \ 780,515 \ 450,223
Costs of construction (727,302) (501,345)
Gains and losses from continuingoperations
53,213 (51,122)
Gains and losses from discontinuedoperations
(2,279) (4,319)
\ 50,934 \ (55,441)
The following table presents book value of gross amount due from and to customers for contractwork related to construction as of December 31, 2011 and 2010, and January 1, 2010:
(in millions of Korean won) December 31, 20111
December 31, 2010 January 1, 2010
Gross amount due fromcustomers
\ 102,790 \ 151,873 \ 70,080
Gross amount due to customers 28,671 34,343 46,442
1The provisions for construction loss amounting to\ 17,695 million are included by estimating future
construction loss in relation to the construction-in-progress of the Group.
Details of construction receivables and advance payments as of December 31, 2011 and 2010and January 1, 2010, are as follows:
(in millions of Korean won) December 31, 2011 December 31, 2010 January 1, 2010
Construction receivables \ 248,094 \ 373,270 \ 204,869
Advance payments 641 70,545 3,917
Amounts of deferred collection - - -
Details of construction contracts as of December 31, 2011 and 2010, and January 1, 2010, are asfollows:
(in millions of Korean won) December 31, 2011 December 31, 2010 January 1, 2010
Amounts after added(deducted)recognized profits(losses) onaccumulated costs
\ 1,178,731 \ 3,713,410 \ 742,081
Less: Progress billing (1,104,612) (3,595,880) (718,443)
Net amounts of constructioncontracts
\ 74,119 \ 117,530 \ 23,638
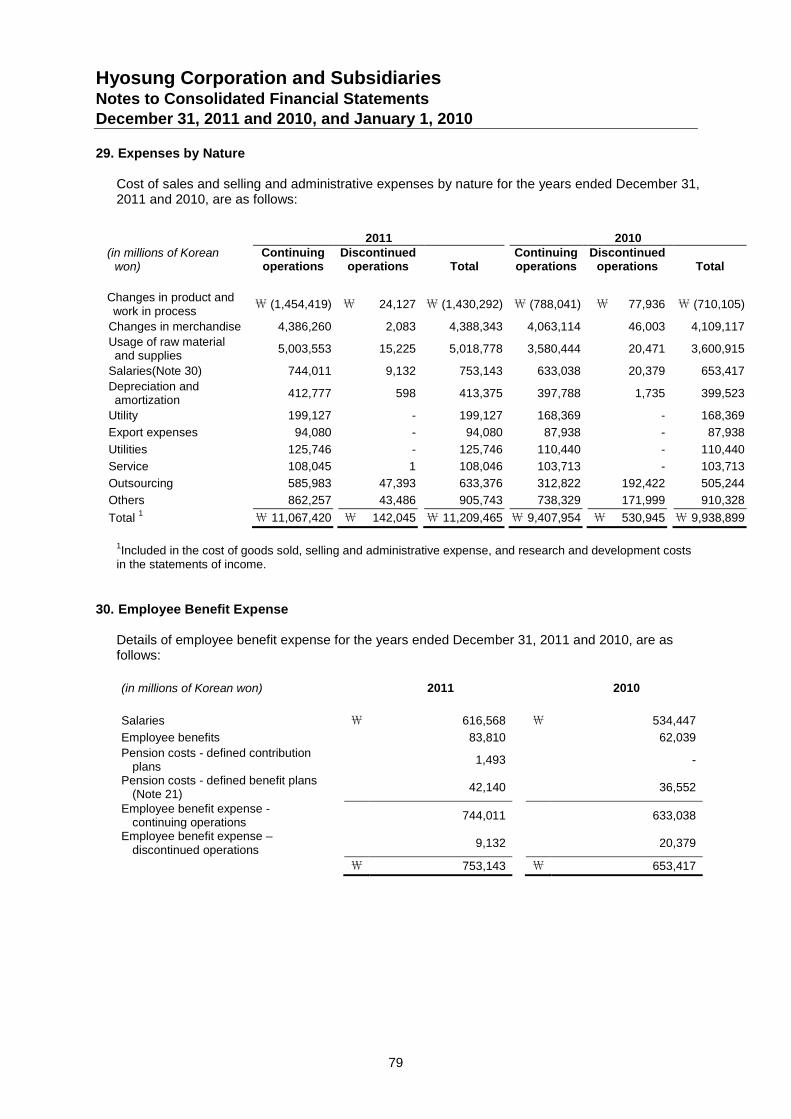
Hyosung Corporation and SubsidiariesNotes to Consolidated Financial StatementsDecember 31, 2011 and 2010, and January 1, 2010
79
29. Expenses by Nature
Cost of sales and selling and administrative expenses by nature for the years ended December 31,2011 and 2010, are as follows:
2011 2010(in millions of Korean
won)Continuingoperations
Discontinuedoperations Total
Continuingoperations
Discontinuedoperations Total
Changes in product andwork in process
\ (1,454,419) \ 24,127 \ (1,430,292) \ (788,041) \ 77,936 \ (710,105)
Changes in merchandise 4,386,260 2,083 4,388,343 4,063,114 46,003 4,109,117
Usage of raw materialand supplies
5,003,553 15,225 5,018,778 3,580,444 20,471 3,600,915
Salaries(Note 30) 744,011 9,132 753,143 633,038 20,379 653,417
Depreciation andamortization
412,777 598 413,375 397,788 1,735 399,523
Utility 199,127 - 199,127 168,369 - 168,369
Export expenses 94,080 - 94,080 87,938 - 87,938
Utilities 125,746 - 125,746 110,440 - 110,440
Service 108,045 1 108,046 103,713 - 103,713
Outsourcing 585,983 47,393 633,376 312,822 192,422 505,244
Others 862,257 43,486 905,743 738,329 171,999 910,328
Total1 \ 11,067,420 \ 142,045 \ 11,209,465 \ 9,407,954 \ 530,945 \ 9,938,899
1Included in the cost of goods sold, selling and administrative expense, and research and development costs
in the statements of income.
30. Employee Benefit Expense
Details of employee benefit expense for the years ended December 31, 2011 and 2010, are asfollows:
(in millions of Korean won) 2011 2010
Salaries ₩ 616,568 ₩ 534,447
Employee benefits 83,810 62,039
Pension costs - defined contributionplans
1,493 -
Pension costs - defined benefit plans(Note 21)
42,140 36,552
Employee benefit expense -continuing operations
744,011 633,038
Employee benefit expense –discontinued operations
9,132 20,379
₩ 753,143 ₩ 653,417
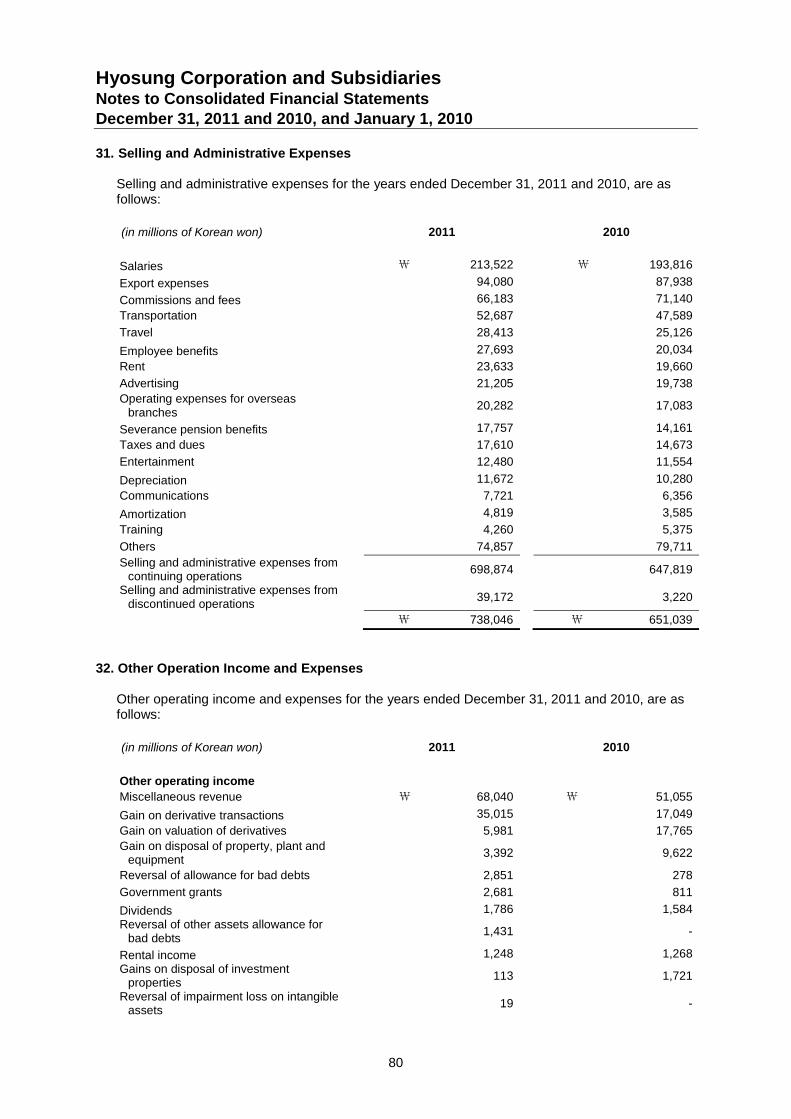
Hyosung Corporation and SubsidiariesNotes to Consolidated Financial StatementsDecember 31, 2011 and 2010, and January 1, 2010
80
31. Selling and Administrative Expenses
Selling and administrative expenses for the years ended December 31, 2011 and 2010, are asfollows:
(in millions of Korean won) 2011 2010
Salaries ₩ 213,522 ₩ 193,816
Export expenses 94,080 87,938
Commissions and fees 66,183 71,140
Transportation 52,687 47,589
Travel 28,413 25,126
Employee benefits 27,693 20,034
Rent 23,633 19,660
Advertising 21,205 19,738
Operating expenses for overseasbranches
20,282 17,083
Severance pension benefits 17,757 14,161
Taxes and dues 17,610 14,673
Entertainment 12,480 11,554
Depreciation 11,672 10,280
Communications 7,721 6,356
Amortization 4,819 3,585
Training 4,260 5,375
Others 74,857 79,711
Selling and administrative expenses fromcontinuing operations
698,874 647,819
Selling and administrative expenses fromdiscontinued operations
39,172 3,220
₩ 738,046 ₩ 651,039
32. Other Operation Income and Expenses
Other operating income and expenses for the years ended December 31, 2011 and 2010, are asfollows:
(in millions of Korean won) 2011 2010
Other operating income
Miscellaneous revenue ₩ 68,040 ₩ 51,055
Gain on derivative transactions 35,015 17,049
Gain on valuation of derivatives 5,981 17,765
Gain on disposal of property, plant andequipment
3,392 9,622
Reversal of allowance for bad debts 2,851 278
Government grants 2,681 811
Dividends 1,786 1,584
Reversal of other assets allowance forbad debts
1,431 -
Rental income 1,248 1,268
Gains on disposal of investmentproperties
113 1,721
Reversal of impairment loss on intangibleassets
19 -
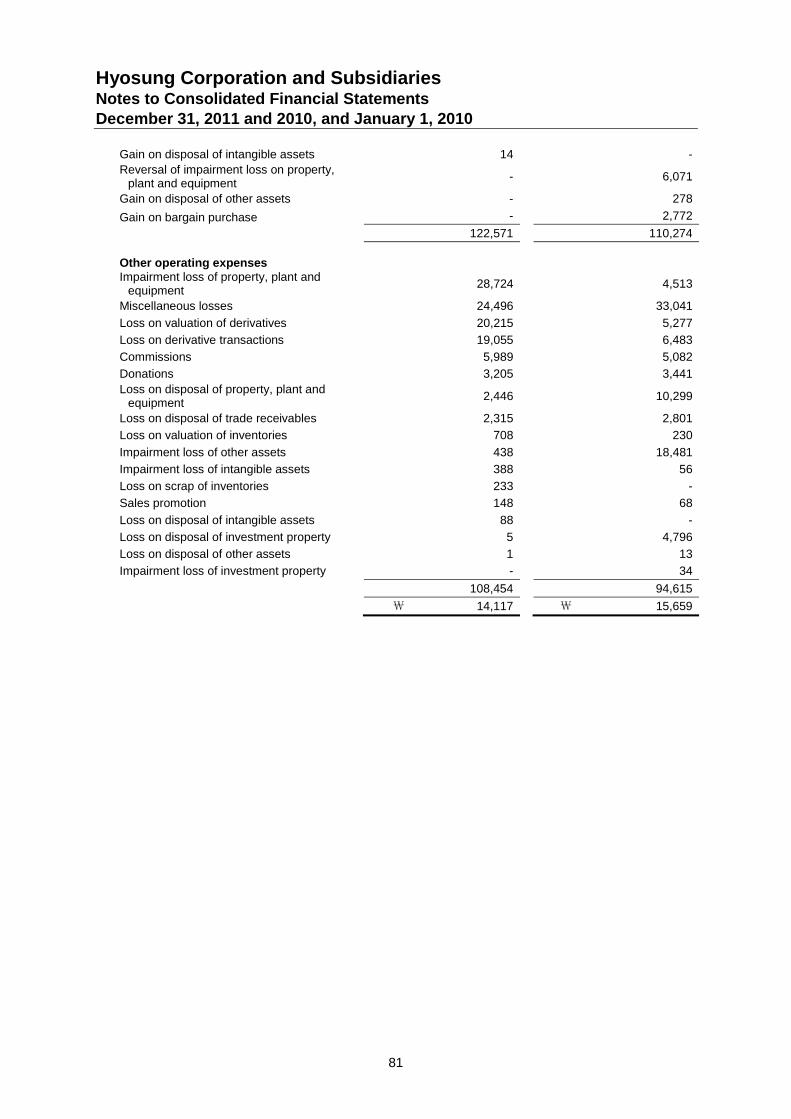
Hyosung Corporation and SubsidiariesNotes to Consolidated Financial StatementsDecember 31, 2011 and 2010, and January 1, 2010
81
Gain on disposal of intangible assets 14 -
Reversal of impairment loss on property,plant and equipment
- 6,071
Gain on disposal of other assets - 278
Gain on bargain purchase - 2,772
122,571 110,274
Other operating expensesImpairment loss of property, plant and
equipment28,724 4,513
Miscellaneous losses 24,496 33,041
Loss on valuation of derivatives 20,215 5,277
Loss on derivative transactions 19,055 6,483
Commissions 5,989 5,082
Donations 3,205 3,441
Loss on disposal of property, plant andequipment
2,446 10,299
Loss on disposal of trade receivables 2,315 2,801
Loss on valuation of inventories 708 230
Impairment loss of other assets 438 18,481
Impairment loss of intangible assets 388 56
Loss on scrap of inventories 233 -
Sales promotion 148 68
Loss on disposal of intangible assets 88 -
Loss on disposal of investment property 5 4,796
Loss on disposal of other assets 1 13
Impairment loss of investment property - 34
108,454 94,615
₩ 14,117 ₩ 15,659
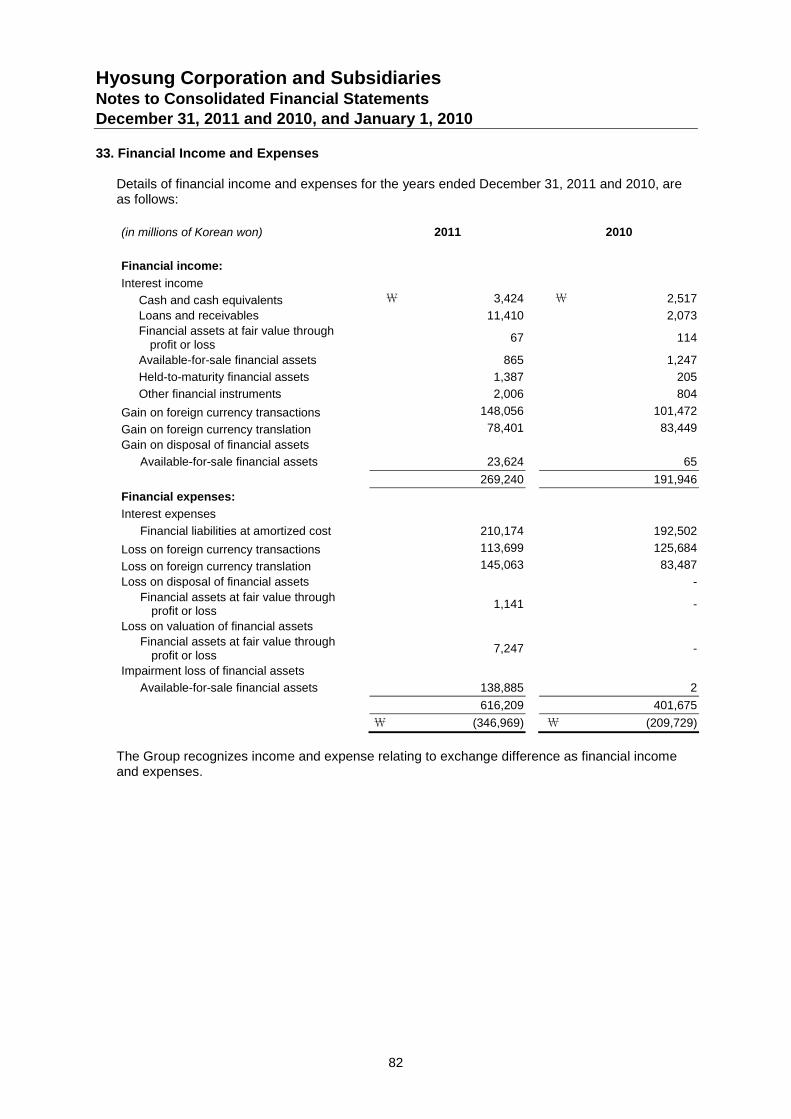
Hyosung Corporation and SubsidiariesNotes to Consolidated Financial StatementsDecember 31, 2011 and 2010, and January 1, 2010
82
33. Financial Income and Expenses
Details of financial income and expenses for the years ended December 31, 2011 and 2010, areas follows:
(in millions of Korean won) 2011 2010
Financial income:
Interest income
Cash and cash equivalents \ 3,424 \ 2,517
Loans and receivables 11,410 2,073
Financial assets at fair value throughprofit or loss
67 114
Available-for-sale financial assets 865 1,247
Held-to-maturity financial assets 1,387 205
Other financial instruments 2,006 804
Gain on foreign currency transactions 148,056 101,472
Gain on foreign currency translation 78,401 83,449
Gain on disposal of financial assets
Available-for-sale financial assets 23,624 65
269,240 191,946
Financial expenses:
Interest expenses
Financial liabilities at amortized cost 210,174 192,502
Loss on foreign currency transactions 113,699 125,684
Loss on foreign currency translation 145,063 83,487
Loss on disposal of financial assets -
Financial assets at fair value throughprofit or loss
1,141 -
Loss on valuation of financial assets
Financial assets at fair value throughprofit or loss
7,247 -
Impairment loss of financial assets
Available-for-sale financial assets 138,885 2
616,209 401,675
\ (346,969) \ (209,729)
The Group recognizes income and expense relating to exchange difference as financial incomeand expenses.
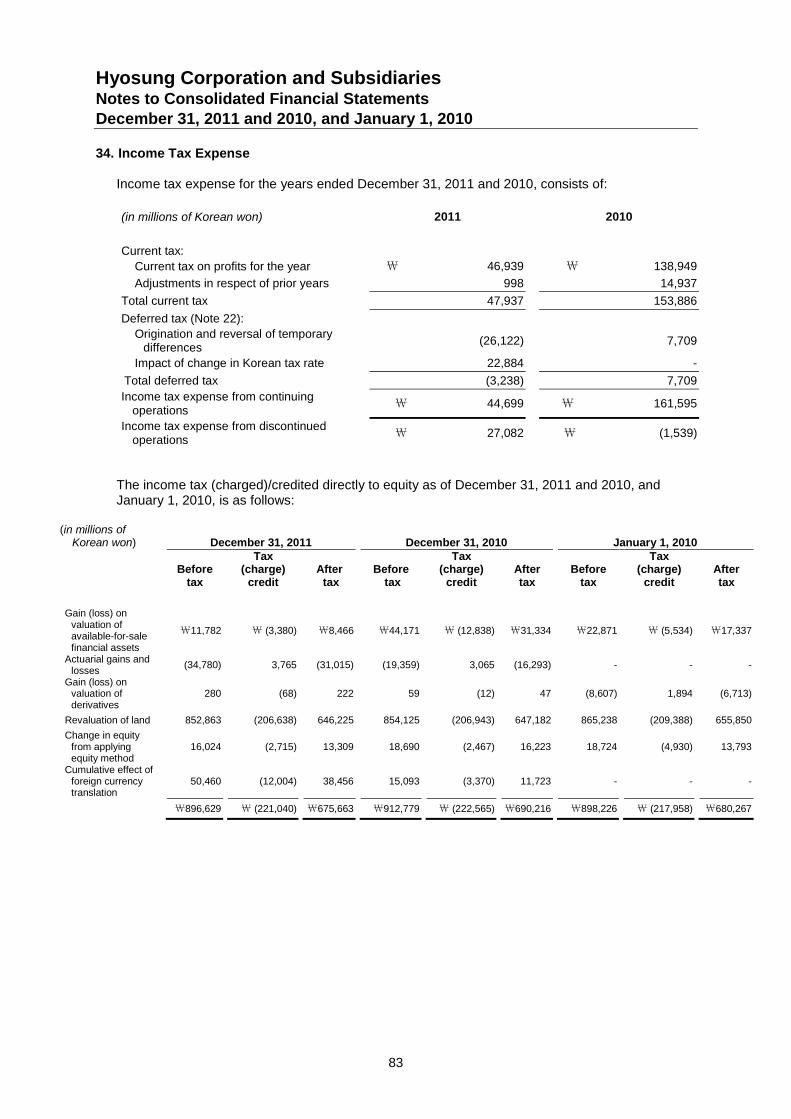
Hyosung Corporation and SubsidiariesNotes to Consolidated Financial StatementsDecember 31, 2011 and 2010, and January 1, 2010
83
34. Income Tax Expense
Income tax expense for the years ended December 31, 2011 and 2010, consists of:
(in millions of Korean won) 2011 2010
Current tax:
Current tax on profits for the year \ 46,939 \ 138,949
Adjustments in respect of prior years 998 14,937
Total current tax 47,937 153,886
Deferred tax (Note 22):
Origination and reversal of temporarydifferences
(26,122) 7,709
Impact of change in Korean tax rate 22,884 -
Total deferred tax (3,238) 7,709
Income tax expense from continuingoperations
\ 44,699 \ 161,595
Income tax expense from discontinuedoperations
\ 27,082 \ (1,539)
The income tax (charged)/credited directly to equity as of December 31, 2011 and 2010, andJanuary 1, 2010, is as follows:
(in millions ofKorean won) December 31, 2011 December 31, 2010 January 1, 2010
Beforetax
Tax(charge)
creditAfter
taxBefore
tax
Tax(charge)
creditAftertax
Beforetax
Tax(charge)
creditAftertax
Gain (loss) onvaluation ofavailable-for-salefinancial assets
\11,782 \ (3,380) \8,466 \44,171 \ (12,838) \31,334 \22,871 \ (5,534) \17,337
Actuarial gains andlosses
(34,780) 3,765 (31,015) (19,359) 3,065 (16,293) - - -
Gain (loss) onvaluation ofderivatives
280 (68) 222 59 (12) 47 (8,607) 1,894 (6,713)
Revaluation of land 852,863 (206,638) 646,225 854,125 (206,943) 647,182 865,238 (209,388) 655,850
Change in equityfrom applyingequity method
16,024 (2,715) 13,309 18,690 (2,467) 16,223 18,724 (4,930) 13,793
Cumulative effect offoreign currencytranslation
50,460 (12,004) 38,456 15,093 (3,370) 11,723 - - -
\896,629 \ (221,040) \675,663 \912,779 \ (222,565) \690,216 \898,226 \ (217,958) \680,267
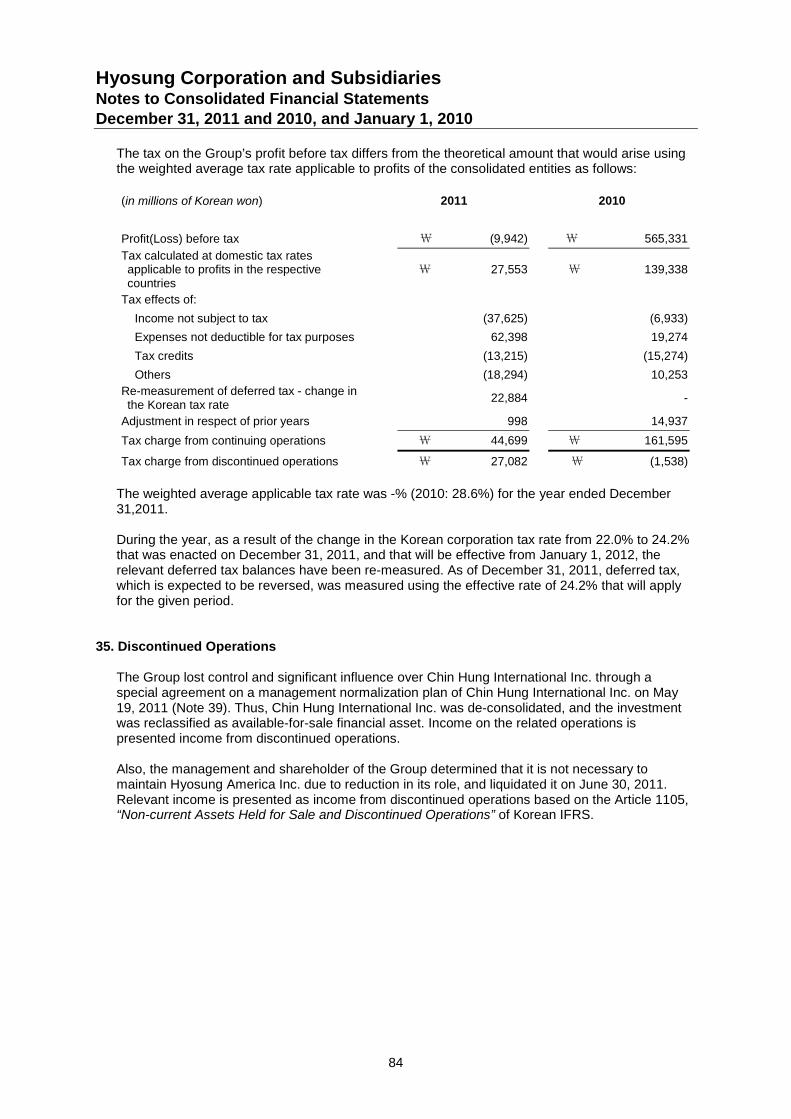
Hyosung Corporation and SubsidiariesNotes to Consolidated Financial StatementsDecember 31, 2011 and 2010, and January 1, 2010
84
The tax on the Group’s profit before tax differs from the theoretical amount that would arise usingthe weighted average tax rate applicable to profits of the consolidated entities as follows:
(in millions of Korean won) 2011 2010
Profit(Loss) before tax \ (9,942) \ 565,331
Tax calculated at domestic tax ratesapplicable to profits in the respectivecountries
\ 27,553 \ 139,338
Tax effects of:
Income not subject to tax (37,625) (6,933)
Expenses not deductible for tax purposes 62,398 19,274
Tax credits (13,215) (15,274)
Others (18,294) 10,253
Re-measurement of deferred tax - change inthe Korean tax rate
22,884 -
Adjustment in respect of prior years 998 14,937
Tax charge from continuing operations \ 44,699 \ 161,595
Tax charge from discontinued operations \ 27,082 \ (1,538)
The weighted average applicable tax rate was -% (2010: 28.6%) for the year ended December31,2011.
During the year, as a result of the change in the Korean corporation tax rate from 22.0% to 24.2%that was enacted on December 31, 2011, and that will be effective from January 1, 2012, therelevant deferred tax balances have been re-measured. As of December 31, 2011, deferred tax,
which is expected to be reversed, was measured using the effective rate of 24.2% that will applyfor the given period.
35. Discontinued Operations
The Group lost control and significant influence over Chin Hung International Inc. through aspecial agreement on a management normalization plan of Chin Hung International Inc. on May19, 2011 (Note 39). Thus, Chin Hung International Inc. was de-consolidated, and the investmentwas reclassified as available-for-sale financial asset. Income on the related operations ispresented income from discontinued operations.
Also, the management and shareholder of the Group determined that it is not necessary tomaintain Hyosung America Inc. due to reduction in its role, and liquidated it on June 30, 2011.Relevant income is presented as income from discontinued operations based on the Article 1105,“Non-current Assets Held for Sale and Discontinued Operations” of Korean IFRS.
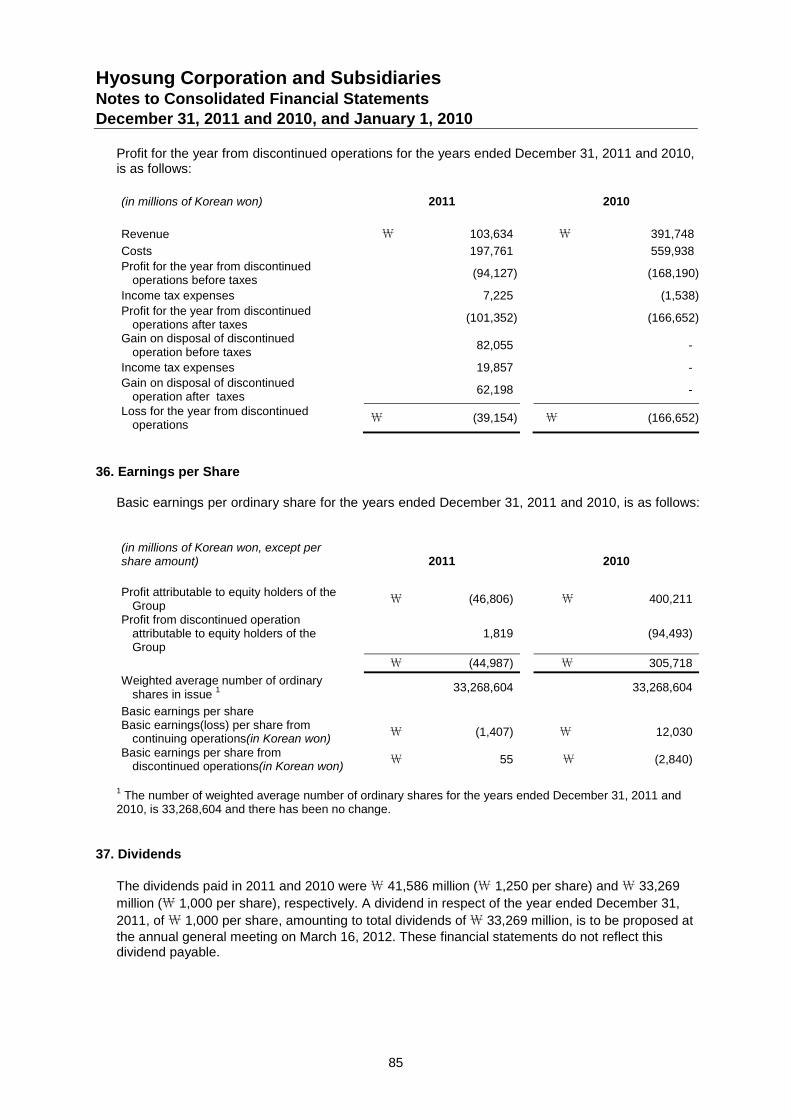
Hyosung Corporation and SubsidiariesNotes to Consolidated Financial StatementsDecember 31, 2011 and 2010, and January 1, 2010
85
Profit for the year from discontinued operations for the years ended December 31, 2011 and 2010,is as follows:
(in millions of Korean won) 2011 2010
Revenue \ 103,634 \ 391,748
Costs 197,761 559,938
Profit for the year from discontinuedoperations before taxes
(94,127) (168,190)
Income tax expenses 7,225 (1,538)
Profit for the year from discontinuedoperations after taxes
(101,352) (166,652)
Gain on disposal of discontinuedoperation before taxes
82,055 -
Income tax expenses 19,857 -
Gain on disposal of discontinuedoperation after taxes
62,198 -
Loss for the year from discontinuedoperations
\ (39,154) \ (166,652)
36. Earnings per Share
Basic earnings per ordinary share for the years ended December 31, 2011 and 2010, is as follows:
(in millions of Korean won, except pershare amount) 2011 2010
Profit attributable to equity holders of theGroup
\ (46,806) \ 400,211
Profit from discontinued operationattributable to equity holders of theGroup
1,819 (94,493)
\ (44,987) \ 305,718
Weighted average number of ordinaryshares in issue
1 33,268,604 33,268,604
Basic earnings per shareBasic earnings(loss) per share from
continuing operations(in Korean won)\ (1,407) \ 12,030
Basic earnings per share fromdiscontinued operations(in Korean won)
\ 55 \ (2,840)
1The number of weighted average number of ordinary shares for the years ended December 31, 2011 and
2010, is 33,268,604 and there has been no change.
37. Dividends
The dividends paid in 2011 and 2010 were\ 41,586 million (\ 1,250 per share) and\ 33,269
million (\ 1,000 per share), respectively. A dividend in respect of the year ended December 31,
2011, of\ 1,000 per share, amounting to total dividends of\ 33,269 million, is to be proposed atthe annual general meeting on March 16, 2012. These financial statements do not reflect thisdividend payable.
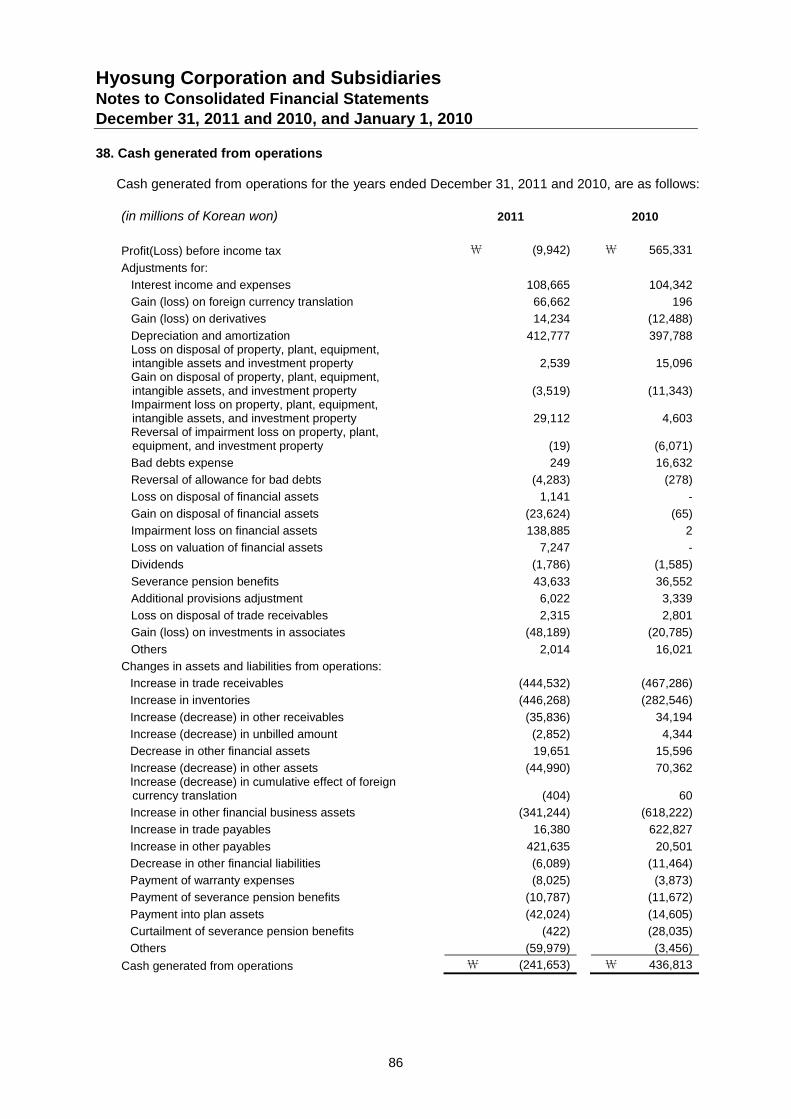
Hyosung Corporation and SubsidiariesNotes to Consolidated Financial StatementsDecember 31, 2011 and 2010, and January 1, 2010
86
38. Cash generated from operations
Cash generated from operations for the years ended December 31, 2011 and 2010, are as follows:
(in millions of Korean won) 2011 2010
Profit(Loss) before income tax \ (9,942) \ 565,331
Adjustments for:
Interest income and expenses 108,665 104,342
Gain (loss) on foreign currency translation 66,662 196
Gain (loss) on derivatives 14,234 (12,488)
Depreciation and amortization 412,777 397,788Loss on disposal of property, plant, equipment,intangible assets and investment property 2,539 15,096Gain on disposal of property, plant, equipment,intangible assets, and investment property (3,519) (11,343)Impairment loss on property, plant, equipment,intangible assets, and investment property 29,112 4,603Reversal of impairment loss on property, plant,equipment, and investment property (19) (6,071)
Bad debts expense 249 16,632
Reversal of allowance for bad debts (4,283) (278)
Loss on disposal of financial assets 1,141 -
Gain on disposal of financial assets (23,624) (65)
Impairment loss on financial assets 138,885 2
Loss on valuation of financial assets 7,247 -
Dividends (1,786) (1,585)
Severance pension benefits 43,633 36,552
Additional provisions adjustment 6,022 3,339
Loss on disposal of trade receivables 2,315 2,801
Gain (loss) on investments in associates (48,189) (20,785)
Others 2,014 16,021
Changes in assets and liabilities from operations:
Increase in trade receivables (444,532) (467,286)
Increase in inventories (446,268) (282,546)
Increase (decrease) in other receivables (35,836) 34,194
Increase (decrease) in unbilled amount (2,852) 4,344
Decrease in other financial assets 19,651 15,596
Increase (decrease) in other assets (44,990) 70,362Increase (decrease) in cumulative effect of foreigncurrency translation (404) 60
Increase in other financial business assets (341,244) (618,222)
Increase in trade payables 16,380 622,827
Increase in other payables 421,635 20,501
Decrease in other financial liabilities (6,089) (11,464)
Payment of warranty expenses (8,025) (3,873)
Payment of severance pension benefits (10,787) (11,672)
Payment into plan assets (42,024) (14,605)
Curtailment of severance pension benefits (422) (28,035)
Others (59,979) (3,456)
Cash generated from operations \ (241,653) \ 436,813
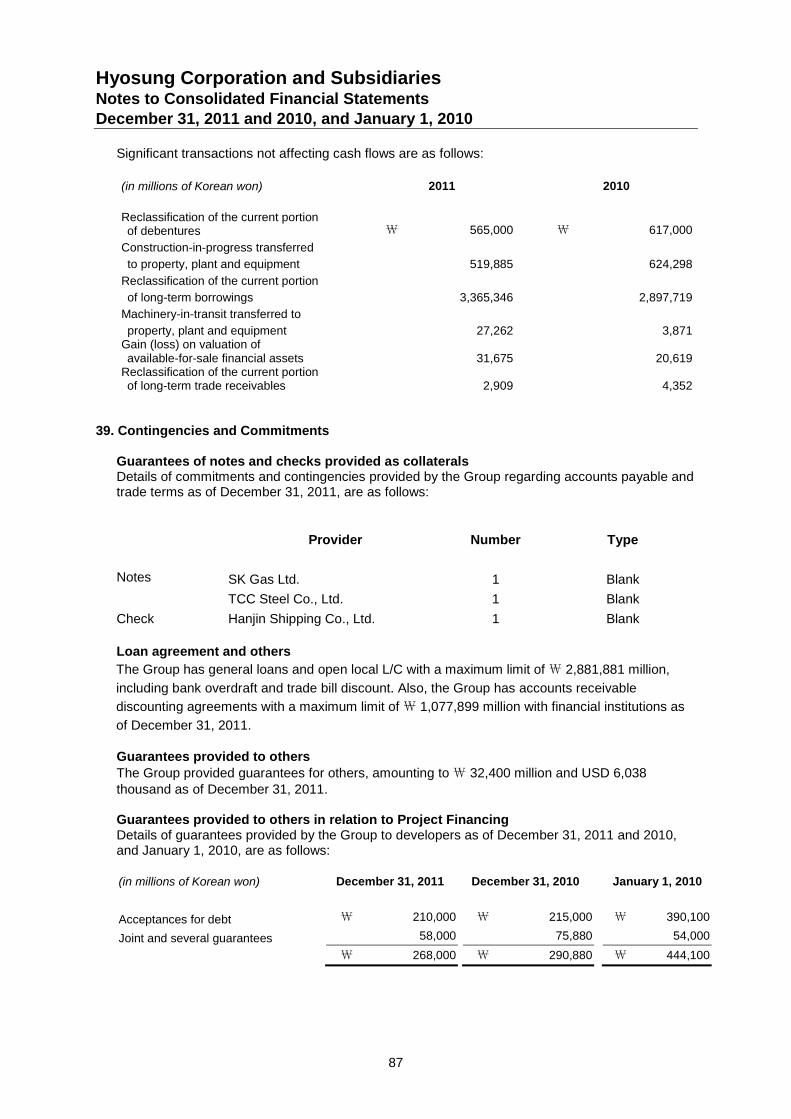
Hyosung Corporation and SubsidiariesNotes to Consolidated Financial StatementsDecember 31, 2011 and 2010, and January 1, 2010
87
Significant transactions not affecting cash flows are as follows:
(in millions of Korean won) 2011 2010
Reclassification of the current portionof debentures \ 565,000 \ 617,000
Construction-in-progress transferred
to property, plant and equipment 519,885 624,298
Reclassification of the current portion
of long-term borrowings 3,365,346 2,897,719
Machinery-in-transit transferred to
property, plant and equipment 27,262 3,871Gain (loss) on valuation ofavailable-for-sale financial assets 31,675 20,619
Reclassification of the current portionof long-term trade receivables 2,909 4,352
39. Contingencies and Commitments
Guarantees of notes and checks provided as collateralsDetails of commitments and contingencies provided by the Group regarding accounts payable andtrade terms as of December 31, 2011, are as follows:
Provider Number Type
Notes SK Gas Ltd. 1 Blank
TCC Steel Co., Ltd. 1 Blank
Check Hanjin Shipping Co., Ltd. 1 Blank
Loan agreement and others
The Group has general loans and open local L/C with a maximum limit of₩ 2,881,881 million,
including bank overdraft and trade bill discount. Also, the Group has accounts receivable
discounting agreements with a maximum limit of₩ 1,077,899 million with financial institutions as
of December 31, 2011.
Guarantees provided to othersThe Group provided guarantees for others, amounting to₩ 32,400 million and USD 6,038thousand as of December 31, 2011.
Guarantees provided to others in relation to Project FinancingDetails of guarantees provided by the Group to developers as of December 31, 2011 and 2010,and January 1, 2010, are as follows:
(in millions of Korean won) December 31, 2011 December 31, 2010 January 1, 2010
Acceptances for debt \ 210,000 \ 215,000 \ 390,100
Joint and several guarantees 58,000 75,880 54,000
\ 268,000 \ 290,880 \ 444,100
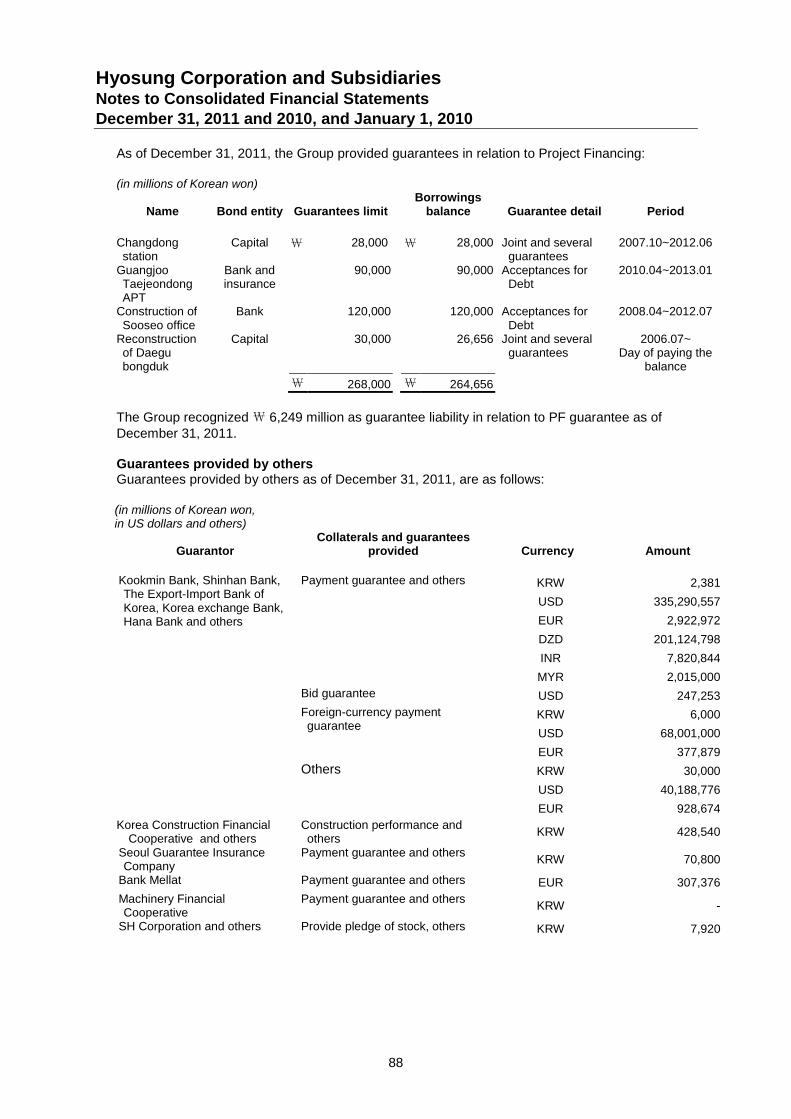
Hyosung Corporation and SubsidiariesNotes to Consolidated Financial StatementsDecember 31, 2011 and 2010, and January 1, 2010
88
As of December 31, 2011, the Group provided guarantees in relation to Project Financing:
(in millions of Korean won)
Name Bond entity Guarantees limitBorrowings
balance Guarantee detail Period
Changdongstation
Capital \ 28,000 \ 28,000 Joint and severalguarantees
2007.10~2012.06
GuangjooTaejeondongAPT
Bank andinsurance
90,000 90,000 Acceptances forDebt
2010.04~2013.01
Construction ofSooseo office
Bank 120,000 120,000 Acceptances forDebt
2008.04~2012.07
Reconstructionof Daegubongduk
Capital 30,000 26,656 Joint and severalguarantees
2006.07~Day of paying the
balance
\ 268,000 \ 264,656
The Group recognized₩ 6,249 million as guarantee liability in relation to PF guarantee as ofDecember 31, 2011.
Guarantees provided by othersGuarantees provided by others as of December 31, 2011, are as follows:
(in millions of Korean won,in US dollars and others)
GuarantorCollaterals and guarantees
provided Currency Amount
Kookmin Bank, Shinhan Bank,The Export-Import Bank ofKorea, Korea exchange Bank,Hana Bank and others
Payment guarantee and others KRW 2,381
USD 335,290,557
EUR 2,922,972
DZD 201,124,798
INR 7,820,844
MYR 2,015,000
Bid guarantee USD 247,253
Foreign-currency paymentguarantee
KRW 6,000
USD 68,001,000
EUR 377,879
Others KRW 30,000
USD 40,188,776
EUR 928,674
Korea Construction FinancialCooperative and others
Construction performance andothers
KRW 428,540
Seoul Guarantee InsuranceCompany
Payment guarantee and othersKRW 70,800
Bank Mellat Payment guarantee and others EUR 307,376
Machinery FinancialCooperative
Payment guarantee and othersKRW -
SH Corporation and others Provide pledge of stock, others KRW 7,920
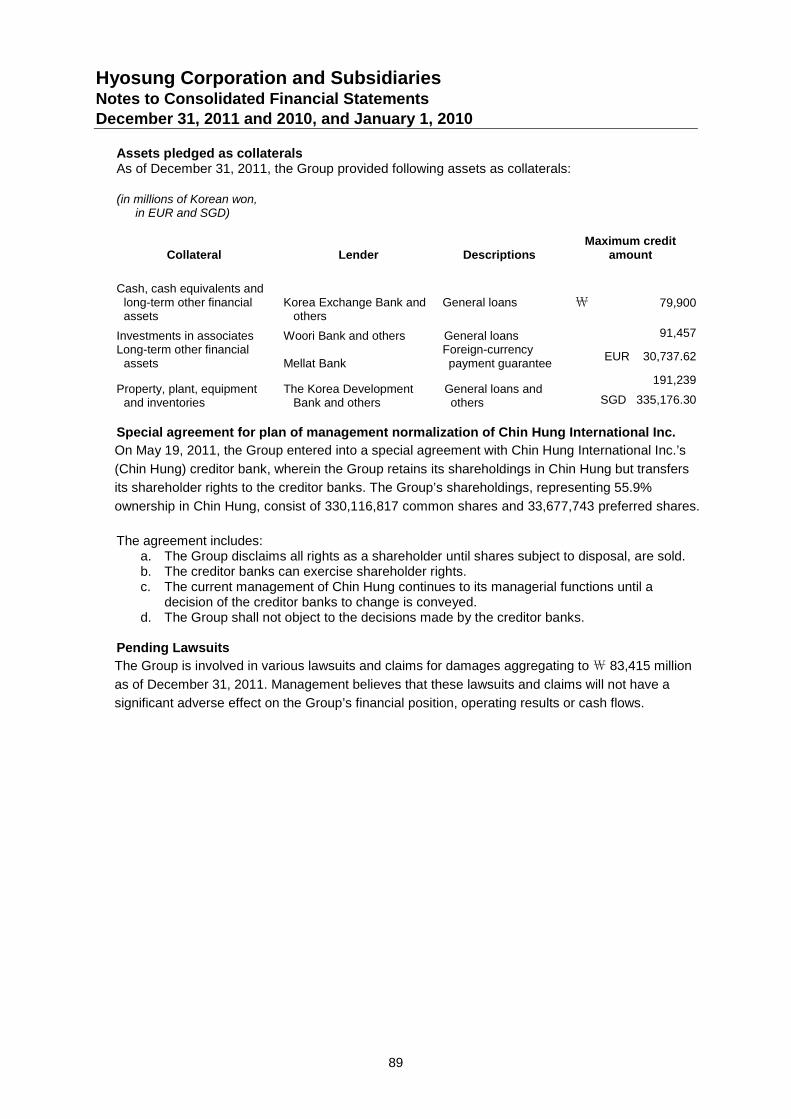
Hyosung Corporation and SubsidiariesNotes to Consolidated Financial StatementsDecember 31, 2011 and 2010, and January 1, 2010
89
Assets pledged as collateralsAs of December 31, 2011, the Group provided following assets as collaterals:
(in millions of Korean won,in EUR and SGD)
Collateral Lender DescriptionsMaximum credit
amount
Cash, cash equivalents andlong-term other financialassets
Korea Exchange Bank andothers
General loans \ 79,900
Investments in associates Woori Bank and others General loans 91,457
Long-term other financialassets Mellat Bank
Foreign-currencypayment guarantee
EUR 30,737.62
Property, plant, equipmentand inventories
The Korea DevelopmentBank and others
General loans andothers
191,239
SGD 335,176.30
Special agreement for plan of management normalization of Chin Hung International Inc.
On May 19, 2011, the Group entered into a special agreement with Chin Hung International Inc.’s
(Chin Hung) creditor bank, wherein the Group retains its shareholdings in Chin Hung but transfers
its shareholder rights to the creditor banks. The Group’s shareholdings, representing 55.9%
ownership in Chin Hung, consist of 330,116,817 common shares and 33,677,743 preferred shares.
The agreement includes:a. The Group disclaims all rights as a shareholder until shares subject to disposal, are sold.b. The creditor banks can exercise shareholder rights.c. The current management of Chin Hung continues to its managerial functions until a
decision of the creditor banks to change is conveyed.d. The Group shall not object to the decisions made by the creditor banks.
Pending Lawsuits
The Group is involved in various lawsuits and claims for damages aggregating to₩ 83,415 million
as of December 31, 2011. Management believes that these lawsuits and claims will not have a
significant adverse effect on the Group’s financial position, operating results or cash flows.
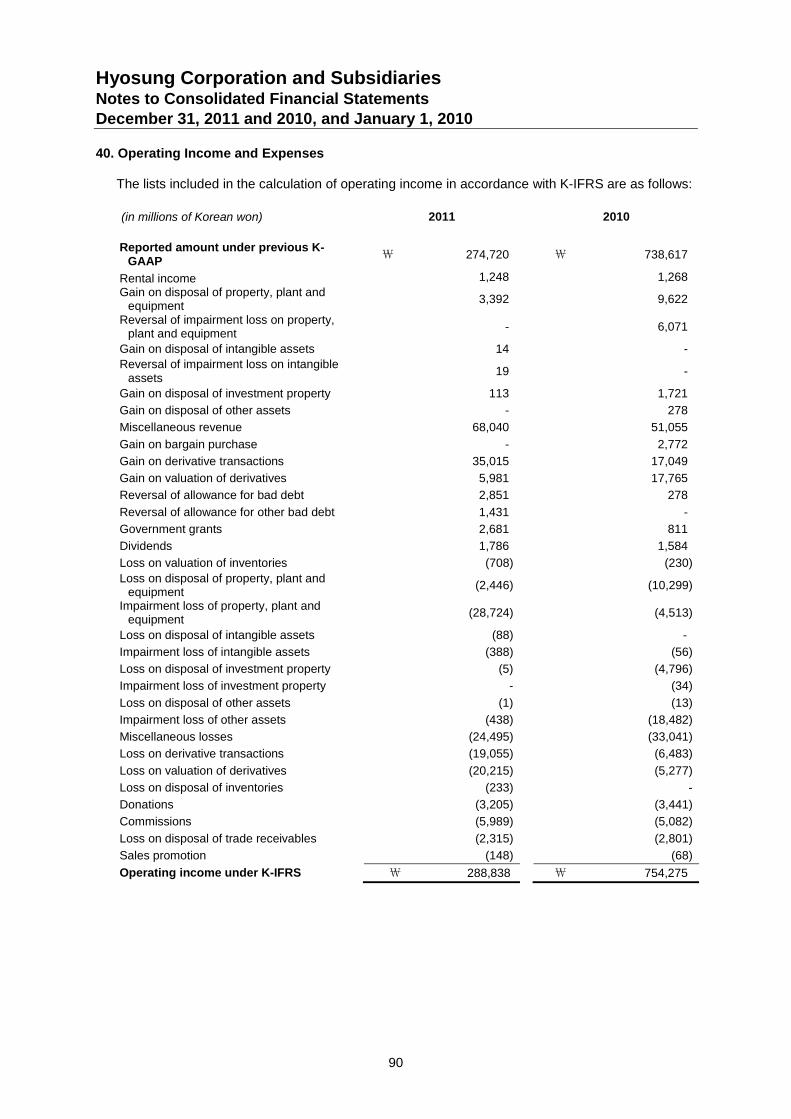
Hyosung Corporation and SubsidiariesNotes to Consolidated Financial StatementsDecember 31, 2011 and 2010, and January 1, 2010
90
40. Operating Income and Expenses
The lists included in the calculation of operating income in accordance with K-IFRS are as follows:
(in millions of Korean won) 2011 2010
Reported amount under previous K-GAAP
₩ 274,720 ₩ 738,617
Rental income 1,248 1,268
Gain on disposal of property, plant andequipment
3,392 9,622
Reversal of impairment loss on property,plant and equipment
- 6,071
Gain on disposal of intangible assets 14 -
Reversal of impairment loss on intangibleassets
19 -
Gain on disposal of investment property 113 1,721
Gain on disposal of other assets - 278
Miscellaneous revenue 68,040 51,055
Gain on bargain purchase - 2,772
Gain on derivative transactions 35,015 17,049
Gain on valuation of derivatives 5,981 17,765
Reversal of allowance for bad debt 2,851 278
Reversal of allowance for other bad debt 1,431 -
Government grants 2,681 811
Dividends 1,786 1,584
Loss on valuation of inventories (708) (230)
Loss on disposal of property, plant andequipment
(2,446) (10,299)
Impairment loss of property, plant andequipment
(28,724) (4,513)
Loss on disposal of intangible assets (88) -
Impairment loss of intangible assets (388) (56)
Loss on disposal of investment property (5) (4,796)
Impairment loss of investment property - (34)
Loss on disposal of other assets (1) (13)
Impairment loss of other assets (438) (18,482)
Miscellaneous losses (24,495) (33,041)
Loss on derivative transactions (19,055) (6,483)
Loss on valuation of derivatives (20,215) (5,277)
Loss on disposal of inventories (233) -
Donations (3,205) (3,441)
Commissions (5,989) (5,082)
Loss on disposal of trade receivables (2,315) (2,801)
Sales promotion (148) (68)
Operating income under K-IFRS ₩ 288,838 ₩ 754,275

Hyosung Corporation and SubsidiariesNotes to Consolidated Financial StatementsDecember 31, 2011 and 2010, and January 1, 2010
91
41. Business Combinations
GST GmbH, a subsidiary, acquired 100% interest in Global Safety Textile Holdco II GmbH(GSTHoldco II GmbH) for₩ 170,682 million on November 22, 2011, who engages in the textilebusiness of airbags, to create synergy effect with the existing business.
The goodwill of₩ 57,201 million arising from the acquisition is attributable to economies of scaleexpected from combining the operations of the Group and GST Holdco II GmbH. The followingtable summarizes the consideration paid for GST Holdco II GmbH Group, the fair value of assetsacquired, liabilities assumed and the non-controlling interest at the acquisition date.
(in millions of Korean won)
Consideration transferred
Cash \ 170,682
Recognized amounts of identifiable assets acquired and liabilities assumed
Cash and cash equivalents 60,716
Property, plant and equipment 117,718
Intangible assets 77,929
Inventories 48,081
Trade and other receivables 42,187
Other assets 918
Trade and other payables (42,462)
Defined benefit liabilities (1,776)
Borrowings (149,760)
Income taxes payable (1,201)
Deferred tax liabilities (30,920)
121,430
Non-controlling interest (7,178)
Goodwill 56,430
\ 170,682
42. Transition to Korean IFRS
42.1 First-time Adoption of Korean IFRS
The Group's transition date to Korean IFRS is January 1, 2010, and adoption date is January 1,2011.
In preparing consolidated financial statements in accordance with Korean IFRS 1101(First-timeAdoption of Korean International Financial Reporting Standards), the Group has applied themandatory exceptions and certain optional exemptions allowed by Korean IFRS.
Hyosung Corporation and SubsidiariesNotes to Consolidated Financial StatementsDecember 31, 2011 and 2010, and January 1, 2010
92
42.2 Changes in Scope of Consolidation
The scope of consolidation as of January 1, 2010, has changed as follows:
Remarks Subsidiary
Included as the major shareholder who exceeds30% of interest in accordance with pastaccounting standards, yet excluded from thescope of consolidation as it is consideredhaving no control in accordance with K-IFRS.
Chin Hung International Inc1, Taeuk
Construction Co., Ltd1, Nautilus Hyosung
Inc., Nautilus Hyosung America Inc.,Beijing Hyosung Computer TechnologiesCo., Ltd., Hyosung FMS Corporation
Excluded from consolidation in accordance withpast accounting standards, yet included inconsolidation in review of consolidation ofspecial purpose business in accordance with K-IFRS.
No.2 Hyosung Capital Special purposecompany
2
No.4 Hyosung Capital Special purposecompany
2
No.5 Hyosung Capital Special purposecompany
2
Excluded from consolidation due to the totalasset value of less than KRW 10,000 million asof prior year ended in accordance with pastaccounting standards, yet included inconsolidation in accordance with K-IFRS.
Gumoknongsan Co., Ltd, Hongjin Data
Service , Hyosung Wind Power holdings
Ltd., Beijing Hyosung
Food & Beverage Co., Ltd, Hyosung (H.K)
LIMITED, Hyosung (H.K)
INTERNATIONAL CO.,LTD, Hyosung
Resource (Australia) PTY., Ltd., Xepix
Corp., Hyosung Brasil industrial &
commercial LTDA, Nantong Transformer
Co., Ltd., Powertech Corporation,
KangLung Wind Power Corporation,
Hanil Leasing&Finance(H.K)
1Consolidated as the voting power increased due to paidin-capital increase of Chin HungInternational Inc. during 2010.
2De-consolidated as liquidation was completed in 2010.
42.3 Exemption Options under Korean IFRS 1101
The Group elected to apply the following optional exemptions from full retrospective application.
(1) Business combinations
The Group elected to apply the exemption for business combinations allowed under Korean IFRS1101 and has not retrospectively applied Korean IFRS 1103 to past business combinations thatoccurred before the transition date.
(2) Cumulative translation differences
The Group elected to deem the cumulative translation differences for all foreign operations to bezero at January 1, 2010, in accordance with Korean IFRS 1101.
Hyosung Corporation and SubsidiariesNotes to Consolidated Financial StatementsDecember 31, 2011 and 2010, and January 1, 2010
93
(3) Deemed cost
The Group used revaluation amount on the land as of January 1, 2010 (transition date) asdeemed cost of transition date in accordance with the past accounting standards. The fair value,which was calculated based on revaluation amount according to the Assets Revaluation Law ofOctober 1, 1998, for machinery, other than land, was recognized as deemed cost. The fair valueof transition date was recognized as deemed cost for some machinery that the associate owns.
(4) Capitalization of borrowing costs
The Group elected to capitalize borrowing costs for the construction of qualifying assets that areincurred after the transition date to Korean IFRS.
42.4 Mandatory Exceptions to Retroactive Application of Other Korean IFRS
Exceptions to other Korean IFRS applied by the Group are as follows:
(1) Derecognition of financial assets
The Group applied the derecognition requirements in Korean IFRS 1039, Financial Instruments:Recognition and Measurement, prospectively for transfers of financial assets occurring on or afterthe transition date. Where the Group had derecognized financial assets before the transition datein accordance with previous K-GAAP, the Group did not recognizes these assets even when thetransfers did not meet the derecognition criteria under Korean IFRS.
(2) Exception for estimates
The Group’s Korean IFRS estimates at the transition date are consistent with the estimates as atthe same date made in conformity with the previous K-GAAP (after adjustments to reflect anydifference in accounting policies), unless there is objective evidence that those estimates were inerror.
42.5 Reconciliation between Previous K-GAAP and Korean IFRS
(1) Effects on the financial position and financial performance
Effects of Korean IFRS adoption on the Group’s total assets, liabilities and equity as of January 1,2010, the date of Korean IFRS transition, are as follows:
January 1, 2010
(in millions of Korean won) Total assets Total liabilities Total equity
Reported amount under previousK-GAAP
\ 10,280,914 \ 7,241,026 \ 3,039,888
Adjustments for:
Financial guarantee liabilities1
6,044 4,904 1,140
Provision for impairment2
(4,854) - (4,854)
Net carrying amount of thefinancial asset or financialliability
3- (876) 876
Transfer of receivables4
1,065,450 1,077,028 (11,578)
Construction contracts5
15,455 14,875 580
Unused annual leave6
- 10,516 (10,516)
Retirement benefit obligations7
- (9,159) 9,159
Deferred income tax of revaluation - 79,012 (79,012)
Hyosung Corporation and SubsidiariesNotes to Consolidated Financial StatementsDecember 31, 2011 and 2010, and January 1, 2010
94
reserve8
Deferred income tax9
3,029 12,575 (9,546)
Subsidiary’s corrections of errors10
(3,715) - (3,715)
Negative goodwill11
17,186 - 17,186
Adjustment of investment inassociates
12 35,823 - 35,823
Changes in scope of consolidationand others
13 (1,400,339) (1,170,373) (229,966)
(265,921) 18,502 (284,423)
Adjusted amount under KoreanIFRS
\ 10,014,993 \ 7,259,528 \ 2,755,465
Effects of Korean IFRS adoption on the Group’s total assets, liabilities and equity, profit andcomprehensive income as of and for the year ended December 31, 2010, are as follows:
December 31, 2010
(in millions of Korean won) Total assetsTotal
liabilities Total equity ProfitComprehensive
income
Reported amount underprevious K-GAAP
\ 11,699,888 \ 8,473,146 \ 3,226,742 \ 191,844 \ 213,830
Adjustments for:
Financial guaranteeliabilities
1 29,320 12,292 17,028 1,748 1,748
Provision for impairment2
(2,807) - (2,807) 5,572 5,572
Net carrying amount of thefinancial asset orfinancial liability
3(29) (12,007) 11,978 4,837 4,837
Transfer of receivables4
928,422 929,020 (598) (1,063) (1,063)
Construction contracts5
22,461 36,765 (14,304) (1,201) (1,201)
Unused annual leaves6
(948) 18,439 (19,387) (6,716) (6,716)
Retirement benefitobligations
7 (96) 4,957 (5,053) 7,993 (10,750)
Deferred income tax ofrevaluation reserve
8 - 77,261 (77,261) 1,752 1,752
Deferred income tax9
(15,053) (11,174) (3,879) 14,949 12,504
Subsidiary’s corrections oferrors
10 (5,351) - (5,351) (5,351) (5,351)
Negative goodwill11
16,507 - 16,507 (680) (680)
Adjustment of investmentin associates
12 35,690 - 35,690 - -
Changes in scope ofconsolidation andothers
13(430,409) (337,057) (93,352) 2,093 7,443
Cancellation ofamortization of goodwill
14 32,419 - 32,419 32,419 32,419
Revaluation surplus15
- - - (11,112) -
610,126 718,496 (108,370) 45,240 40,514
Adjusted amount underKorean IFRS
\ 12,310,014 \ 9,191,642 \ 3,118,372 \ 237,084 \ 254,344
1Recognized as a liability measuring fair value of financial guarantee contract.
2Calculated provision for impairment based on historical experience rate for accrued incidents of individual
and collective impairment losses3Assessed present value of financial asset or liability.
Hyosung Corporation and SubsidiariesNotes to Consolidated Financial StatementsDecember 31, 2011 and 2010, and January 1, 2010
95
4Recognized as a financial liability, instead of eliminating financial asset, if the Group continues to retain a
majority of risk and rewards of financial asset even after transferring financial asset to a financial institution.5Presented as total amount of accounts receivable and advances received on unbilled construction and
overbilled construction on the identical customers related to percentage-of completion of sales.6Recognized expenses at the point of providing work, regardless of whether it is paid or not.
7Accounted present value of estimated pension as defined benefit liability by actuarial assumptions and
discount rates according to the projected unit credit method8Recognize a liability of deferred corporate tax which was excluded based on the past accounting standards.
9Reflected the effect of corporate tax differences and deferred corporate tax on the above adjustment.
10Adjusted financial statement as the audit report of Chin Hung International Inc., a subsidiary of the
Company, is reissued based on the past accounting standards of transition date and 2010.11
Adjusted through reversal of negative goodwill.12
Adjusted through the effect of transition to IFRS, such as application of deemed cost of property, plant andequipment of associates.13
Effect from changes in the scope of consolidation and other adjustments.14
Cancelled amortization of goodwill.15
Adjusted income from disposition due to application of deemed cost on property, plant and equipment,which was recognized in other comprehensive income at the point of revaluation based on prior accountingstandards.
(2) Effects on the cash flows
On adoption of Korean IFRS, cash flows from interest received, interest paid, dividends received,and income taxes paid, which had not been separately presented, are presented separately on theface of the statement of cash flows. In order to accommodate the change, cash flows related torelevant income/expenses, assets/liabilities have been adjusted. The effects of the change inexchange rate on cash and cash equivalents in a foreign currency are presented separately fromcash flows from operating, investing and financing activities.
Cash flows from operating and financing activities are adjusted due to certain transfers of tradereceivables that were derecognized under the previous K-GAAP but are treated as collateralizedborrowings under Korean IFRS. Also, other Korean IFRS transition effects are reflected on cashflows where they have an effect on cash flows.


