
Hydrothermal Synthesis and Characterization of Cadmium Selenide Nanocrystals
by
Juandria V. Williams
A dissertation submitted in partial fulfillment
of the requirements for the degree of
Doctor of Philosophy
(Chemical Engineering)
in The University of Michigan
2008
Doctoral Committee:
Professor Phillip E. Savage, Chair
Professor Levi T. Thompson, Jr.
Associate Professor Rachel S. Goldman
Associate Professor Nicholas A. Kotov


© Juandria V.Williams
All rights reserved
2008

ii
To Grandma
(Bernice E Lee – 1912-2001)
But without faith it is impossible to please Him, for he who comes to God must believe
that He is, and that He is a rewarder of those who diligently seek Him.—Hebrews 11:6
iii
Acknowledgements
I would first like to give praise to Jesus Christ for putting up with my doubts and
complaining, and for enabling me to persevere through what I perceived, at times, to be
impossible. I must also thank my advisor, Professor Phillip E. Savage for his deep technical
knowledge, superior writing skills and patience. His door was always open and he never wavered
to help me with a technical issue. I also wish to thank my doctoral committee: Professor Nick
Kotov, Professor Levi Thompson and Professor Rachel Goldman for sharing their advice to
enrich my research and dissertation. I am grateful to the Chemical Engineering department at
Michigan for the financial assistance, and especially to Susan Hamlin for her ability to always
provide me with any ancillary support when needed.
I must thank Claire Adams for her tireless work in the lab and providing results for our
first publication.
William Johnson (PhD ’07) from the Thompson group served as a great friend and
sounding board.
Finally, I thank my mother, Bobbie Williams, father, Juan Williams, sister, Lacia
Williams and brother, Nathaniel Williams, for their never-ending prayers, love and support.

iv
Table of Contents
Dedication ........................................................................................................................... ii
Acknowledgements ............................................................................................................ iii
List of Figures .................................................................................................................... vi
List of Tables ...................................................................................................................... ix
Abstract .............................................................................................................................. xi
Chapter 1 Introduction ........................................................................................................ 1
1.1 Semiconductor Nanocrystals ............................................................................. 5
1.2 Characterization ................................................................................................ 8
1.3 High-temperature Water .................................................................................. 10
1.4 Cadmium Selenide Nanocrystals .................................................................... 11
1.5 Bibliography ................................................................................................... 18
Chapter 2 Motivation ........................................................................................................ 19
2.1 Bibliography ................................................................................................... 23
Chapter 3 Literature Review ............................................................................................. 24
3.1 Reaction Solvent ............................................................................................. 24
3.2 Growth Kinetics .............................................................................................. 33
3.3 Bibliography .................................................................................................... 37
Chapter 4 Experimental Methods ...................................................................................... 40
4.1 Materials .......................................................................................................... 40
4.2 Method ............................................................................................................ 42
4.3 Analysis ........................................................................................................... 48
4.4 Bibliography .................................................................................................... 50
Chapter 5 Feasibility Study ............................................................................................... 51
5.1 Introduction ..................................................................................................... 51
5.2 Experimental Methods .................................................................................... 52

v
5.3 Results and Discussion .................................................................................... 52
5.4 Summary ......................................................................................................... 67
5.5 Bibliography .................................................................................................... 69
Chapter 6 Rapid Hot-injection Method ............................................................................. 70
6.1 Introduction ..................................................................................................... 70
6.2 Experimental Methods .................................................................................... 72
6.3 Results and Discussion .................................................................................... 72
6.4 Summary ......................................................................................................... 99
6.5 Bibliography .................................................................................................. 100
Chapter 7 Kinetics Study................................................................................................. 102
7.1 Introduction ................................................................................................... 102
7.2 Experimental Methods .................................................................................. 104
7.3 Model Development ...................................................................................... 104
7.4 Results and Discussion .................................................................................. 106
7.5 Summary ....................................................................................................... 123
7.6 Appendix: Derivation of Redshift Rate Model ............................................. 124
7.7 Bibliography .................................................................................................. 127
Chapter 8 Summary and Conclusions ............................................................................. 128
8.1 Summary ....................................................................................................... 128
8.2 Conclusions and Future Work ....................................................................... 130
8.3 Bibliography .................................................................................................. 135
vi
List of Figures
Figure 4.1a-c Graphic of the materials for the batch reactor used for the
syntheses. The batch reactor consisted of 3/8” stainless
steel (A) port connectors and (B) end caps. A bellows
valve (C) was fitted to a batch reactor for the rapid
hot-injection study. ............................................................................... 41
Figure 4.2 Reactor heat-up profile for a batch reactor in a sand batch
at 200 °C for 3 minutes. A Type-K thermocouple was
inserted through a bored Swagelok reducing union at one
end of the reactor. ................................................................................. 45
Figure 5.1 Normalized PL peak spectra for CdSe nanocrystals
synthesized in high-temperature water under base case
conditions. ............................................................................................. 53
Figure 5.2 HRTEM image of CdSe nanocrystals produced by rapid hot-
injection under base case conditions. ................................................... 55
Figure 5.3 Normalized PL emission spectra for CdSe nanocrystals
synthesized in high-temperature water at different sand bath
temperatures .......................................................................................... 57
Figure 5.4 Normalized PL emission spectra of CdSe nanocrystals
synthesized in high-temperature water at different bath holding
times ...................................................................................................... 59
Figure 5.5 Normalized PL emission spectra of CdSe nanocrystals
synthesized in high-temperature water at different Cd:Se molar
ratios ..................................................................................................... 62
Figure 5.6 Normalized PL emission spectra of CdSe nanocrystals
synthesized in high-temperature water at different pHs ....................... 64
Figure 5.7 Normalized PL emission spectra of CdSe nanocrystals
synthesized in high-temperature water at different stabilizer
loadings ................................................................................................. 66

vii
Figure 6.1 Normalized PL peak spectra for CdSe nanocrystals
synthesized in high-temperature water using the rapid hot-
injection and cold injection methods. Both spectra
represent base case conditions. ............................................................. 73
Figure 6.2 HRTEM image of CdSe nanocrystals produced by rapid
hot-injection under base case conditions. ............................................. 75
Figure 6.3 Fluorescence intensities for CdSe nanoparticles synthesized
in high-temperature water using the rapid hot-injection and
cold injection methods. The spectra represent base case
synthesis. ............................................................................................... 76
Figure 6.4 Normalized PL emission spectra for CdSe nanocrystals
synthesized in high-temperature water at different
sand bath temperatures. ........................................................................ 78
Figure 6.5 Profile of peak intensities for CdSe nanocrystals synthesized
in high-temperature water at different sand bath temperatures. ........... 79
Figure 6.6 Normalized PL emission spectra for CdSe nanocrystals
synthesized in high-temperature water at different reaction
times. ..................................................................................................... 84
Figure 6.7 Profile of PL peak intensities for CdSe nanocrystals synthesized
in high-temperature water at different reaction times........................... 85
Figure 6.8 Normalized PL emission spectra for CdSe nanocrystals
synthesized in high-temperature water at different Cd:Se
molar ratios. .......................................................................................... 90
Figure 6.9 Profile of PL peak intensities for CdSe nanocrystals synthesized
in high-temperature water at different Cd:Se molar ratios ................... 91
Figure 6.10 Normalized PL emission spectra for CdSe nanocrystals
synthesized in high-temperature water at different pHs. ...................... 94
Figure 6.11 Profile of PL peak intensities for CdSe nanocrystals synthesized
in high-temperature water at different pHs ........................................... 95
Figure 6.12 Normalized PL emission spectra for CdSe nanocrystals
synthesized in high-temperature water at different stabilizer
loadings. ................................................................................................ 97

viii
Figure 6.13 Profile of PL peak intensities for CdSe nanocrystals synthesize
in high-temperature water at different stabilizer loadings. ................... 98
Figure 7.1a Evolution of peak wavelength, ����, with reaction time at
various reaction temperatures for CdSe nanocrystals synthesized
in high-temperature water. .................................................................. 107
Figure 7.1b Evolution of peak wavelength with reaction time at various
reaction temperatures for CdSe nanocrystals synthesized in
stearic acid by Dickerson et al. [7] ..................................................... 108
Figure 7.1c Evolution of peak wavelength, ����, with reaction time at various
reaction temperatures for CdSe nanocrystals synthesized in high-
temperature water, fitted with a 3rd
order polynomial ........................ 110
Figure 7.2a Red-shift rates of peak wavelengths at various reaction
temperatures for CdSe nanocrystals synthesized in high-
temperature water. The completion wavelength, ��, is
estimated to be 573 nm. ...................................................................... 111
Figure 7.2 b Red-shift rates of peak wavelengths at various temperatures
for CdSe nanocrystals synthesized in stearic acid by Dickerson
et al. The completion wavelength, ��, is shown to be 590 nm. [7] ... 112
Figure 7.2c Arrhenius plot of red-shift rates at a test wavelength of 580 nm
for CdSe nanocrystals synthesized in high-temperature water. .......... 114
Figure 7.3a Activation energies from red-shift rates at various test
wavelengths for CdSe nanocrystals synthesized in high-
temperature water. The completion wavelength, ��,
corresponds to a point just before the energies begin to rapidly rise,
which is about 578 nm. The average activation energy, �, is
0.50 ± 0.10 eV/molecule……………………………………………..115
Figure 7.3b Activation energies from red-shift rates at various test
wavelengths for CdSe nanocrystals synthesized in stearic
acid and TOPO by Dickerson et al. [6] ............................................. 116
Figure 7.4a Profile of fwhm for CdSe nanocrystals prepared in high-
temperature water under base case conditions (� = 200 °C)
at varying times. The error bars correspond to the calculated
uncertainty for repeat base case experiments. .................................... 121
Figure 7.4b Profile of fwhm for CdSe nanocrystals prepared in stearic acid
by Dickerson et al. [7] ........................................................................ 122

ix
List of Tables
Table 4.1 Range of process parameters used for the feasibility, rapid hot-injection
and kinetics experiments. All values are on a per reactor basis.. .............. 42
Table 4.2 Amounts of concentrations of the cadmium and selenium
precursors and the capping agent (sodium citrate) used for the base
case synthesis for one batch reactor. Each was modified
accordingly as process variables changed for each investigation. ............. 47
Table 5.1 A summary of the effect of temperature on the PL emission peak
(����) and size distribution (fwhm). ......................................................... 57
Table 5.2 A summary of the effect of reaction time on the PL emission peak
(����) and size distribution (fwhm). ......................................................... 60
Table 5.3 A summary of the effect of the Cd:Se molar ratio on the PL
emission peak (����) and size distribution (fwhm). ................................. 62
Table 5.4 A summary of the effect of pH on the PL emission peak
(����) and size distribution (fwhm). ......................................................... 64
Table 5.5 A summary of the effect of the Cd: stabilizer molar ratio on the PL
emission peak (����) and size distribution (fwhm). ................................. 66
Table 6.1 A summary of the effect of temperature on the PL emission peak
(����), size distribution (fwhm) and quantum yield (QY).. ...................... 79
Table 6.2 A summary of the effect of reaction time on the PL emission peak
(����), size distribution (fwhm) and quantum yield (QY).. ...................... 86
Table 6.3 A summary of the effect of the Cd:Se molar ratio on the PL
emission peak (����), size distribution (fwhm) and
quantum yield (QY).. ................................................................................. 91

x
Table 6.4 A summary of the effect of the pH on the PL emission peak
(����), size distribution (fwhm) and quantum yield (QY).. ...................... 95
Table 6.5 A summary of the effect of the Cd:stabilizer ratio on the PL
emission peak (����), size distribution (fwhm) and quantum
yield (QY).. ................................................................................................ 98
Table 7.1 Table showing the 3rd
-order polynomial functions for
each temperature. ..................................................................................... 110
Table 7.2 Summary of average activation energies obtained by analysis
of redshift rates. ....................................................................................... 119

xi
Abstract
Hydrothermal Synthesis and Characterization of Cadmium Selenide Nanocrystals
by
Juandria V. Williams
Cadmium Selenide (CdSe), a type of semiconductor nanocrystal, is of interest
because its optical properties can be tuned by varying its size, thus yielding a material
that has potential application in electronics and biology. Conventional preparations of
CdSe primarily use organic solvents. We explored the use of high-temperature liquid
water (HTW) as an alternative reaction medium because of its environmental benignity
and solvent properties which could potentially mimic the function of the conventional
organic-based mediums.
The base case experimental conditions for the feasibility study (non-isothermal
conditions) produced nanocrystals that exhibited quantum confinement behavior. The
quantum yield (QY) for the base case nanocrystals was 1.5%, but was easily increased to
~7% by adding a cadmium sulfide (CdS) shell. The nanocrystal mean size increased with
increasing reaction time, temperature, stabilizer concentration and Cd:Se molar ratio.
The mean size decreased with increasing pH.

xii
Under isothermal synthesis conditions, nanocrystals smaller than those produced
in the feasibility study were obtained when using the same process parameters. The
mean nanocrystal size did not increase with reaction temperature at 2 minutes, but did
increase with time and stabilizer concentration. The mean size also decreased with
increasing pH and Cd:Se molar ratio. An increase in the Cd:Se molar ratio, pH and
Cd:stabilizer molar ratio increased the QY. The reaction temperature and time had no
affect on QY.
We used red-shift rates to determine an activation energy � for the CdSe growth
in HTW. We calculated � = 0.24 ± 0.04 eV/molecule from the red-shift rate method.
Compared with organic-based systems, this value is lower, possibly due to the less bulky
cadmium-citrate complex used. The kinetics analysis indicates that the synthesis in HTW
could be both reaction- and diffusion-controlled.
This work indicates that HTW is a viable alternative reaction medium.
Nanocrystals can be grown that exhibit quantum confinement, and certain process
parameters have a profound effect on the nanocrystal’s quality. Further studies can
identify the optimum process conditions to produce the nanocrystal with the highest
quality.

1
Chapter 1
Introduction
Unique physical, optical and electrical phenomena can occur when a macroscopic
material decreases in size. At a length scale of 1 x 10⁻⁹
of a meter, a “nanomaterial” can
display properties not exhibited by its macroscopic (bulk) analogue. Carbon black, an
amorphous form of carbon, is one of the first nanomaterials ever to be produced
commercially, as is fumed silica. Because of their size, carbon black and fumed silica
particles, as well as other materials, have greatly benefited society. As the needs and
desires of society expand so does the demand for novel materials and devices whose
properties are controlled by phenomena that occur in materials structured at the
nanoscale.
Conventional bulk manufacturing strategies could be reaching the limit of
successfully fabricating and characterizing nano-structured materials [1]. Many of these
“top-down” methods – the building of objects by incorporating small pieces of bulk
material – cannot effectively allow a scientist or engineer to control the structure at the
nanoscale, thereby influencing the resulting properties. The ability to design materials
with desired properties has been achieved through a “bottom-up” method – incorporating
atomic and molecular building blocks into a material or device. Even though the “top-
down” method can yield nanoscale material, it lacks atomic control, and, thus, is not very
reproducible.
2
Nanotechnology is boundless in its research, but more limited in its successful
application to date. This does not mean that knowledge has not impacted a number of
industries. According to the National Nanotechnology Initiative [2], some of the
products that benefit from unique properties of nanomaterials include sunscreens and
cosmetics, metal-cutting tools, protective paints and coatings and, of course,
semiconductors. Bulk semiconductors have had a monumental impact on society, but
researchers are finding even greater promise with semiconductors on the nanoscale.
Semiconductor nanocrystals, a type of nanoparticle sometimes termed “quantum
dots”, exhibit size and shape dependent electronic and optical properties that make them
attractive. Types of commonly fabricated semiconductor nanocrystals include cadmium
sulfide (CdS), lead sulfide and selenide (PbS and PbSe), cadmium telluride (CdTe) and
cadmium selenide (CdSe). These nanocrystals possess characteristics that make them
attractive for opto-electronic applications such as light-emitting diodes (LEDs) [3, 4, 5],
solar cells [6, 7] and biological markers [8, 9, 10, 11]. Their properties are currently
being exploited in the field of energy conservation, most notably as alternatives to
conventional phosphors in solid-state lighting (SSL). According to researchers at Sandia
National Laboratories in Albuquerque, New Mexico, conventional phosphors used in
fluorescent lighting are not ideal in SSL due to their poor energy absorption properties
[5]. They also account for a 50% reduction in package efficiency due to light scattering
and associated optical losses. The small size of a quantum dot eliminates the light
scattering, reducing optical losses. Furthermore, ensembles of quantum dots have nearly
continuous absorption spectra from their band gap wavelength (near infra-red) into
ultraviolet, allowing for multi-color emission by simultaneous excitation of different

3
sized quantum dots, according to Lee et al [4]. Their narrow emission spectra almost
guarantee pure color emission. These specific advantages are reasons for implementing
them as active agents in SSL.
Photovoltaics is another application where quantum dots have demonstrated
promise. Current solar cells carry, at best, a 31% efficiency, meaning only 31% of the
sun’s energy (rays) are converted into electricity as the remaining energy is wasted as
heat [12]. The current technology is limited due to absorption and emission dynamics
above the semiconductor band gap. Nozik asserts that these dynamics can be markedly
affected by the quantization effects in quantum dots, potentially realizing an increase in
solar energy conversion to 66% [12]. A group led by Nozik demonstrated multiple
exciton generation (MEG) in colloidal PbSe and PbS quantum dots, an important
mechanism that may increase the conversion efficiency of solar cell devices [6]. Schaller
et al. demonstrated a 10% reduction in energy loss by generating seven excitons from one
photon as opposed to only one exciton produced by a single photon which accounts for
the traditional high energy loss [7].
Biological applications for imaging require materials and devices with intrinsic
optical integrity – good photostability and emission efficiency. Conventional dyes and
fluorophores, used by researchers to visualize cellular matter, are limited by their narrow
absorption range, broad emission spectra and short fluorescent lifetime [8]. Quantum
dots can especially overcome these limitations by providing narrow emission spectra, a
broad absorption range and an excellent photostability and resistance to photobleaching
[8, 13]. ZnS/CdSe core/shell quantum dots covalently coupled to biomolecules have
been demonstrated in use for ultra-sensitive biological detection [9, 10, 11, 13].

4
Nanoparticle synthesis can be achieved myriad ways. Four generic routes exist to
make nanoparticles [14]: gas phase synthesis, mechanical methods, form-in-place and
wet chemistry. Each results in a material with significantly different properties
depending on the synthetic route. Additionally, some routes are more amenable to a
certain class of raw materials than others. Of the routes listed, wet chemical processes
have the advantage of producing a large variety of inorganic and organic compounds and
some metals in significant quantities using inexpensive equipment (as opposed to costly
furnaces, vacuum deposition equipment, ball mills). Furthermore, the ability to control
particle size and achieve high monodispersity is another attractive factor. One drawback,
though, is that for bulk production, a large infrastructure for bulk chemical processing
may be required, rendering it expensive.
Conventional growth techniques such as molecular beam epitaxy and chemical
vapor deposition have been used to fabricate CdSe. However, these techniques may limit
the practical application of the nanocrystal because it is attached to a substrate or
embedded in a matrix [15]. Organic solvent-based colloidal methods have realized high
quality semiconductor nanocrystals for over 15 years [16, 17, 18, 19, 20]. Key chemicals
used in this synthetic route are often hazardous and the experiments can lack sufficient
control, making the results difficult to reproduce [21, 22]. This has inspired researchers
to develop greener chemistries such as alternative precursors [22, 23, 24, 25].
Researchers have demonstrated aqueous-based synthetic routes at relatively low
temperatures (<100 °C) with various cadmium and selenium precursors and stabilizing
ligands [26, 27, 28, 29]. Each of these routes, although successfully producing physical
samples, has yet to be optimized to obtain highly luminescent, photostable, crystalline

5
structures. In general, the quality of nanocrystals resulting from aqueous-based synthetic
methods is not as good as those obtained from the organic-based methods. The literature
provides supporting evidence that the high temperature processes (250-350 °C), common
in organic-based methods, yield higher quality product [16, 30, 31].
A reaction medium that has not been previously used for the synthesis of CdSe is
high- temperature liquid water (> 200 ˚C). This medium is of interest because high
temperature processes (250 °C-350 °C) such as those in organic-based methods,
generally yield higher quality product. By varying temperature, the properties of water
could be tuned to obtain a medium that can, i) mimic polar solvents commonly used in
nanoparticle synthesis, ii) provide low surface tension (for excellent wetting of surfaces),
and, iii) provide high diffusion coefficients. Numerous studies have demonstrated the
successful fabrication of metallic and ceramic nanomaterials using high-temperature
water [32, 33, 34, 35, 36, 37, 38].
1.1 Semiconductor Nanocrystals
The most remarkable characteristic of a semiconductor nanocrystal is the ability
to tune its optical and electronic properties by controlling its size. As the size of a bulk
semiconductor is reduced, the surface area/volume ratio increases and the optical and
electronic properties become strongly influenced by its surface structure. Moreover, the
electronic structure at the nanoscale ceases to resemble the bulk. This phenomenon is a
result of quantum confinement effects: the behavior of electrons in a particle due to
spatial limitations. “Quantum dots” are those particles that exhibit the behavior.

6
When a semiconductor absorbs light, an electron moves from the nearly-full
valence band to the nearly-empty conduction band. The minimum energy required to
excite an electron is dictated by the energy band gap. The loss of the electron creates a
“hole” (the absence of a negative charge). The electron-hole pair, characterized by a
preferred distance known as the Bohr radius, becomes electrostatically bound, forming an
exciton. As the free electron loses any excess energy in the conduction band, it will drop
to the lower energy state (valence band) and recombine with the hole. This energy loss
occurs in the form of light.
When an exciton is created within a spatially confined box smaller than the Bohr
radius, the semiconductor’s (now a quantum dot) band gap widens since it takes much
more energy to confine the exciton. The energy loss associated with this electron-hole
recombination manifests itself through shorter wavelength light emission (higher energy),
also known as a “blue shift”. In essence, as the nanocrystal’s size decreases, the
absorption and emission wavelengths decrease and the light emitted transforms to a bluer
color. This behavior is one reason why quantum dots are being explored for many
different applications.
The minimum energy required for creating an exciton can be attributed to the bulk
band gap energy, �, and the confinement energy for the charge carriers in a potential
well. The overall confinement energy for the exciton can then be described as the ground
state energy for the familiar “particle in a box” system:
���� ������� (1.1)
where � is Planck’s constant, � is the diameter and �� is the reduced mass of the exciton:

7
���
���
� ���
(1.2)
Here, �� and �� are the effective masses for the electrons and holes, respectively.
Another contribution to the exciton energy is the Coulombic interaction between the
electron and the hole. This can be written as:
����� ���������� � (1.3)
where � = electron charge (C), � = dielectric constant and � = permittivity constant.
Combining Equations 1.1, 1.2 and 1.3 gives an estimate of the size-dependent energy gap
for a quantum dot:
�!"#$% �!&'()% � ���� � ����� (1.4)
� � � ������� �
��������� � (1.5)
This is known as the effective mass approximation [31, 39, 40, 41] and is only a first
approximation. Other contributions can be included that describe a more precise
interaction, but doing so requires a more sophisticated calculation. The approximation
contains size dependence in both the confinement (� ��* % and Coulombic (� �%* terms.
For very small quantum dot sizes, the confinement term becomes the dominant term.
Although this approximation is not valid for all semiconductors, for practical purposes, it
is useful in estimating the size of a nanocrystal given a peak wavelength in the emission
spectrum. It also provides a useful qualitative understanding of quantum confinement
effects on semiconductor nanocrystals.

8
1.2 Characterization
Because the purpose for fabricating semiconductor nanocrystals has been to
exploit their size-tunable optical characteristics, the control of the photoluminescence
properties has been a major goal for developing tailored synthetic chemistries. These
properties, which comprise absorption and emission, arise from interactions between
electrons, holes and their local environments.
Photoluminescence spectra serve as an optical fingerprint by which the effect of
process parameters on the size and overall intensity of quantum dots can be analyzed.
Semiconductor nanocrystal emissions are collected in a fluorimeter and displayed as a
peak that may be Gaussian. The peak of the curve corresponds to the emission
wavelength from the mean size of the nanoparticle. The width of the peak, typically
reported as the full-width-at-half-maximum (fwhm), is one common method used to
evaluate the particle size distribution. An ensemble of quantum dots is comprised of
individual dots with slightly different electronic properties and energy levels based on the
size [42]. This leads to inhomogeneous broadening and displays what is reasonable to
assume as a Gaussian function [42]. Thus, the emission spectra represent size
distributions of individual emissions. The fwhm serves as a statistic that can accurately
represent the size distribution.
The excitation of an electron in a semiconductor nanocrystal by a photon
eventually results in a loss of energy as the electron returns to the ground state from an
excited state. This loss of energy (deactivation) can either manifest as fluorescence
(emission of light), non-radiative heat to the surroundings, or some other deactivation
process. As the size of the energy band gap increases, the fluorescence process can be

9
interrupted since the electron has to lose more energy to reach the ground state. The
ability for a nanocrystal to emit the photons it has absorbed is described as quantum
efficiency. Quantitatively, the ratio of photons emitted to photons absorbed is the
quantum yield. It can be determined experimentally as:
�+,��-�� �+,./012,��-�� 2,./* 3145,./ 45,��-��* 36 (1.6)
where �+,��-�� is the quantum yield for the nanocrystal sample; �+,./ is the quantum
yield for a known organic fluorophore such as Rhodamine B; 2,��-��789"72,./ are the
integrated intensities of the photoluminescence emission spectra for the nanocrystal
sample and organic standard, respectively; 45,./789"745,��-�� are the optical densities
of the organic standard and nanocrystal sample, respectively.
Since the emissive properties and quantum efficiencies are affected by the particle
size, it would stand to reason that the absorption is size-dependent as well. This means
that absorption depends on the energy band gap. For a direct band gap semiconductor,
the optical absorption near the band edge follows the equation [43]:
:�; <!�; � �%= �* (1.7)
where : is the absorption coefficient, �; is the photon energy (� is Planck’s constant; ; =
photon frequency (Hz)), < is a constant, and � is the energy band gap (eV). This
equation clearly shows the dependence of the band gap on the absorption properties.

10
UV-vis absorption is a useful tool for determining nanocrystal size, however, for our
studies, we primarily focused on photoluminescence emission spectra to analyze size
evolution.
The physical determination of size and approximate morphology of the
nanocrystals can be obtained by high-resolution transmission electron microscopy
(HRTEM). TEM uses a beam of electrons to pass through the crystalline sample. A
detector collects the electrons and an image is formed, magnified and viewed on a
phosphor screen which is coupled to a digital camera for viewing.
1.3 High-temperature Water
One property of liquid water is that as the temperature increases, the static
dielectric constant decreases. Under high-temperature (T > 200 °C) conditions, water
behaves more like a polar organic solvent than water at room temperature. By varying
temperature, some of the properties of high temperature water can be tuned to mimic
those of common organic solvents which are often used as reaction mediums, as well for
storage, and to exchange capping groups on nanocrystals. Ambient liquid water also
possesses a high surface tension because of the hydrogen bonding. But, as water
temperature increases, hydrogen bonding and surface tension become less pronounced.
A lower surface tension increases wettability, and, when coupled with the high-
temperature water, could effectively anneal the surface of the nanocrystal and reduce the
number of surface defects. These attributes, coupled with its environmental benignity,
make high-temperature water an intriguing reaction medium for the synthesis and
processing of nanomaterials.

11
High-temperature water has attracted a growing interest due to its applications in
destroying toxic waste and its uses as a medium for chemical synthesis. Hydrothermal
synthesis methods have also been established for a variety of particulate chemistries to
produce materials such as ceramics and catalysts. In particular, the synthesis of
nanocrystalline metal oxides, using high-temperature water, has been demonstrated in
groups led by Adschiri [33, 34, 38, 44] and Arai [32, 37, 45, 46], among others. Particle
morphology, size and crystal structure were controlled by varying the reaction time,
temperature and pressure [33, 34]. High temperatures also promote crystallization which
eliminates the need for post-process annealing [47]. The results of these studies indicate
the potential for these methods to affect the quantum behavior of semiconductor
nanocrystals because of the controllable thermodynamic and transport properties of this
high-temperature medium.
1.4 Cadmium Selenide Nanocrystals
1.4.1 Properties
Much attention has been paid to semiconductor nanocrystals such as cadmium
selenide (CdSe), a II-VI metal chalcogenide semiconductor. The CdSe nanocrystal has
an interior structure and bonding identical to that of bulk CdSe. Bulk CdSe has a band
gap energy of about 1.74 eV at room temperature. Its Bohr radius (size of the exciton) is
approximately 6 nm. A CdSe particle smaller than this will exhibit quantum
confinement.

12
1.4.2 Synthesis
A number of methods that have been developed for the preparation of CdSe
nanocrystals include photochemical [48], γ-irradiation [49], sonochemical [50] and
solvothermal [51] methods. While these strategies yield particulates with properties
unique to their fabrication strategy, the best preparation technique that exhibits strong
confinement effects comes from colloidal chemistry using molecular precursors [52].
The traditional synthesis of semiconductor nanocrystals based on the pyrolysis of
an organometallic cadmium reagent in a hot coordinating solvent serves as a powerful
means of achieving a high quality product. The pioneers of CdSe and other nanocrystal
synthesis are Murray et al. [18] who, in 1993, developed a robust method by injecting an
organic cadmium reagent, with an inorganic selenium reagent, into a hot (300 C)
coordinating solvent – tri-n-octylphosphine oxide (TOPO). TOPO, also acting as an
organic ligand, served two purposes – to stabilize the growth and, to some degree,
eliminate surface defects by binding to cadmium surface sites. Hines and Guyo-Sionnest
[53] progressed the research more by developing a method to encapsulate a CdSe
nanocrystal with an inorganic shell (ZnS). This enhanced the fluorescence, thereby
increasing the nanocrystal’s utility. Alivisatos’ labs at the University of California,
Berkeley, and Lawrence Berkeley National laboratory demonstrated, through numerous
studies, that the conventional method, with some modifications, could produce high-
quality anisotropic shapes of CdSe nanocrystals [19, 20, 54, 55]. Hundreds of
publications dealing with the various aspects of CdSe nanocrystal preparations exist, but
the highlights of the research will be briefly described in the Literature Review section.

13
This thesis is the culmination of investigative studies of the synthesis of CdSe
nanocrystals in high-temperature water. The objective of our studies were to i)
demonstrate the one-pot synthesis of CdSe nanocrystals and examine the effects of
process variables on the size and quality, ii) modify the injection method and examine the
effect of the method on the nanocrystal size and quality, iii) explore and quantitatively
model the growth evolution of CdSe nanocrystals in an aqueous medium. The thesis is
organized as follows:
1. Chapter 2 presents the motivation for our work;
2. Chapter 3 describes past and present work of CdSe nanocrystal synthesis;
3. Chapter 4 describes the experimental and analytical methods used to
prepare and characterize our samples;
4. Chapter 5 examines the feasibility of using high-temperature water as an
alternative reaction medium;
5. Chapter 6 examines the effects of process variables on the nanocrystals
using rapid hot-injection;
6. Chapter 7 discusses the evolution of growth of CdSe nanocrystals and
provides some preliminary analytical framework for a kinetics study;
7. Chapter 8 provides a summary of the investigative findings and concludes
with thoughts on implementing future studies that can build and enhance
present work

14
1.5 Bibliography
1. National Institute of Standards and Technology Nanomanufacturing. (accessed
November 20, 2007).
2. NNI National Nanotechnology Initiative.
http://www.nano.gov/html/facts/appsprod.html (accessed November 15, 2007).
3. Steckel, J. S.; Zimmer, J. P.; Coe-Sullivan, S.; Stott, N. E.; Bulovic, V.; Bawendi, M.
G. Blue Luminescence from (CdS)ZnS Core–Shell Nanocrystals. Angew. Chem. Int.
Ed. 2004, 43, 2154-2158.
4. Lee, J. W.; Sundar, V. C.; Heine, J. R.; Bawendi, M. G.; Jensen, K. F.
Full Color Emission from II±VI Semiconductor Quantum Dot-Polymer Composites.
Adv. Mater. 2000, 12, 1102-1105.
5. Sandia National Laboratories Sandia researchers use quantum dots as a new
approach to solid-state lighting. http://www.sandia.gov/news-center/news-
releases/2003/elect-semi-sensors/quantum.html (accessed December 07, 2007).
6. Ellingson, R. J.; Beard, M. C.; Johnson, J. C.; Yu, P. R.; Micic, O. I.; Nozik, A. J.;
Shabaev, A.; Efros, A. L. Highly Efficient Multiple Exciton Generation in Colloidal
PbSe and PbS Quantum Dots. Nano Lett. 2005, 5, 865-871.
7. Schaller, R. D.; Sykora, M.; Pietryga, J. M.; Klimov, V. I. Seven Excitons at a Cost
of One: Redefining the Limits for Conversion Efficiency of Photons into Charge
Carriers. Nano Lett. 2006, 6, 424-429.
8. Bruchez, M.; Moronne, M.; Gin, P.; Weiss, S.; Alivisatos, A. P. Semiconductor
Nanocrystals as Fluorescent Biological Labels. Science 1998, 281, 2013-2016.
9. Chan, W. C. W.; Nie, S. Quantum Dot Bioconjugates for Ultrasensitive Noniostopic
Detection. Science 1998, 281, 2016.
10. Gao, X. H.; Chan, W. C. W.; Nie, S. M. Quantum-Dot Nanocrystals for
Ultrasensitive Biological Labeling and Multicolor Optical Encoding. J. Biomed. Opt.
2002, 7, 532-537.
11. Mattoussi, H.; Mauro, J. M.; Goldman, E. R.; Anderson, G. P.; Sundar, V. C.;
Mikulec, F. V.; Bawendi, M. G. Self-Assembly of CdSe-ZnS Quantum Dot
Bioconjugates using an Engineered Recombinant Protein . J. Am. Chem. Soc. 2000,
122, 12142-12150.
12. Nozik, A. J. Quantum Dot Solar Cells. Physica E 2002, 14, 115-120.
15
13. Gerion, D.; Pinaud, F.; Williams, S. C.; Parak, W. J.; Zanchet, D.; Weiss, S.;
Alivisatos, A. P. Synthesis and Properties of Biocompatible Water-Soluble Silica-
Coated CdSe/ZnS Semiconductor Quantum Dots. J. Phys. Chem. B 2001, 105, 8861-
8871.
14. Pitkethly, M. J. Nanoparticles as Building Blocks? Mat. Today 2003, 6, 36.
15. Gaponenko, S. V. In Optical Properties of Semiconductor Nanocrystals; Cambridge
University Press: Cambridge, U.K., 1998; .
16. Murray, C. B.; Sun, S. H.; Gaschler, W.; Doyle, H.; Betley, T. A.; Kagan, C. R.
Colloidal Synthesis of Nanocrystals and Nanocrystal Superlattices. J. Res. Dev.
2001, 45, 47-56.
17. Murray, C. B.; Nirmal, M.; Norris, D. J.; Bawendi, M. G. Synthesis and Structural
Characterization of Ii-Vi Semiconductor Nanocrystallites (Quantum Dots). Zeits. Fur
Phys. D 1993, 26, S231-S233.
18. Murray, C. B.; Norris, D. J.; Bawendi, M. G. Synthesis and Characterization of
nearly Monodisperse Cde (E = S, Se, Te) Semiconductor Nanocrystallites. J. Am.
Chem. Soc. 1993, 115, 8706-8715.
19. Peng, X. G.; Manna, L.; Yang, W. D.; Wickham, J.; Scher, E.; Kadavanich, A.;
Alivisatos, A. P. Shape Control of CdSe Nanocrystals. Nature 2000, 404, 59-61.
20. Peng, X. G.; Wickham, J.; Alivsatos, A. P. Kinetics of II-VI and III-V Colloidal
Semiconductor Nanocrystal Growth: “Focusing” of Size Distributions. J. Am. Chem.
Soc. 1998, 120, 5343-5344.
21. Gaponik, N.; Talapin, D. V.; Rogach, A. L.; Eychmuller, A.; Weller, H. Efficient
Phase Transfer of Luminescent Thiol-Capped Nanocrystals: From Water to Nonpolar
Organic Solvents. Nano Lett. 2002, 2, 803-806.
22. Peng, X. G. Green Chemical Approaches Toward High-Quality Semiconductor
Nanocrystals. Chem. Eur. J. 2002, 8, 335-339.
23. Peng, Z. A.; Peng, X. G. Nearly Monodisperse and Shape-Controlled CdSe
Nanocrystals Via Alternative Routes: Nucleation and Growth. J. Am. Chem. Soc.
2002, 124, 3343-3353.
24. Qu, L. H.; Peng, Z. A.; Peng, X. G. Alternative Routes Toward High Quality CdSe
Nanocrystals. Nano Lett. 2001, 1, 333-337.
25. Bunge, S. D.; Krueger, K. M.; Boyle, T. J.; Rodriguez, M. A.; Headley, T. J.; Colvin,
V. L. Growth and Morphology of Cadmium Chalcogenides: The Synthesis of
Nanorods, Tetrapods, and Spheres from CdO and Cd(O2CCH3)2 . J. Mater. Chem.
2003, 13, 1705-1709.

16
26. Rogach, A. L.; Kornowski, A.; Gao, M. Y.; Eychmuller, A.; Weller, H. Synthesis
and Characterization of a Size Series of Extremely Small Thiol-Stabilized CdSe
Nanocrystals. J Phys Chem B 1999, 103, 3065-3069.
27. Pellegrino, T.; Manna, L.; Kudera, S.; Liedl, T.; Koktysh, D.; Rogach, A. L.; Keller,
S.; Radler, J.; Natile, G.; Parak, W. J. Hydrophobic Nanocrystals Coated with an
Amphiphilic Polymer Shell: A General Route to Water Soluble Nanocrystals. Nano
Lett. 2004, 4, 703-707.
28. Liang, J. G.; Ai, X. P.; He, Z. K.; Pang, D. W. Functionalized CdSe Quantum Dots
as Selective Silver Ion Chemodosimeter. Analyst 2004, 129, 619-622.
29. Skaff, H.; Emrick, T. The use of 4-Substituted Pyridines to Afford Amphiphilic,
Pegylated Cadmium Selenide Nanoparticles. Chem. Comm. 2003, 52-53.
30. Qu, L. H.; Peng, X. G. Control of Photoluminescence Properties of CdSe
Nanocrystals in Growth. J. Am. Chem. Soc. 2002, 124, 2049-2055.
31. Steigerwald, M. L.; Brus, L. E. Semiconductor Crystallites - a Class of Large
Molecules. Acc. Chem. Res. 1990, 23, 183-188.
32. Sue, K.; Murata, K.; Kimura, K.; Arai, K. Continuous Synthesis of Zinc Oxide
Nanoparticles in Supercritical Water. Green Chem. 2003, 5, 659-662.
33. Adschiri, T.; Hakuta, Y.; Sue, K.; Arai, K. Hydrothermal Synthesis of Metal Oxide
Nanoparticles at Supercritical Conditions. J. Nano. Res. 2001, 3, 227-235.
34. Adschiri, T.; Hakuta, Y.; Arai, K. Hydrothermal Synthesis of Metal Oxide Fine
Particles at Supercritical Conditions. Ind Eng Chem Res 2000, 39, 4901-4907.
35. Holmes, J. D.; Lyons, D. M.; Ziegler, K. J. Supercritical Fluid Synthesis of Metal
and Semiconductor Nanomaterials. Chem. A Euro. J. 2003, 9, 2144-2150.
36. Hakuta, Y.; Onai, S.; Terayama, H.; Adschiri, T.; Arai, K. Production of Ultra-Fine
Ceria Particles by Hydrothermal Synthesis Under Supercritical Conditions. J. Mater.
Sci. Lett. 1998, 17, 1211-1213.
37. Hakuta, Y.; Haganuma, T.; Sue, K.; Adschiri, T.; Arai, K. Continuous Production of
Phosphor YAG : Tb Nanoparticles by Hydrothermal Synthesis in Supercritical
Water. Mater. Res. Bull. 2003, 38, 1257-1265.
38. Hakuta, Y.; Seino, K.; Ura, H.; Adschiri, T.; Takizawa, H.; Arai, K. Production of
Phosphor (YAG : Tb) Fine Particles by Hydrothermal Synthesis in Supercritical
Water. J. Mater. Chem. 1999, 9, 2671-2674.
39. Brus, L. E. Electron Electron and Electron-Hole Interactions in Small Semiconductor
Crystallites - the Size Dependence of the Lowest Excited Electronic State. J. Chem.
Phys. 1984, 80, 4403-4409.

17
40. Schmid, G., Ed.; In Nanoparticles: From Theory to Application; WILEY-VCH
Verlag GmbH &Co.: Germany, 2004; , pp 434.
41. Brus, L. E. A Simple-Model for the Ionization-Potential, Electron-Affinity, and
Aqueous Redox Potentials of Small Semiconductor Crystallites. J. Chem. Phys.
1983, 79, 5566-5571.
42. Bimberg, D.; Grundmann, M.; Ledentsov, N. N. In Quantum Dot Heterostructures;
John Wiley and Sons: 1999; , pp 338.
43. Butler, M. A. Photoelectrolysis and Physical Properties of the Semiconducting
Electrode WO3. J. Appl. Phys. 1977, 48, 1914-1920.
44. Hakuta, Y.; Adschiri, T.; Hirakoso, H.; Arai, K. Chemical Equilibria and Particle
Morphology of Boehmite (AlOOH) in Sub and Supercritical Water. Fluid Phase
Equilib. 1999, 160, 733-742.
45. Li, G.; Smith, R. L.; Inomata, H.; Arai, K. Synthesis and Thermal Decomposition of
Nitrate-Free Boehmite Nanocrystals by Supercritical Hydrothermal Conditions.
Mater Lett 2002, 53, 175-179.
46. Li, G. S.; Smith, R. L.; Inomata, H.; Arai, K. Preparation and Magnetization of
Hematite Nanocrystals with Amorphous Iron Oxide Layers by Hydrothermal
Conditions. Mater. Res. Bull. 2002, 37, 949-955.
47. Darr, J. A.; Poliakoff, M. New Directions in Inorganic and Metal-Organic
Coordination Chemistry in Supercritical Fluids. Chem. Rev. 1999, 99, 495.
48. Yan, Y. L.; Li, Y.; Qian, X. F.; Yin, J.; Zhu, Z. K. Preparation and Characterization
of CdSe Nanocrystals Via Na2SO3-Assisted Photochemical Route. Mat. Sci. Eng.
2003, 103, 202-206.
49. Yang, Q.; Tang, K. B.; Wang, F.; Wang, C. R.; Qian, Y. T. A Gamma-Irradiation
Reduction Route to Nanocrystalline CdE (E = Se, Te) at Room Temperature. Mater.
Lett. 2003, 57, 3508-3512.
50. Ge, J. P.; Li, Y. D.; Yang, G. Q. Mechanism of Aqueous Ultrasonic Reaction:
Controlled Synthesis, Luminescence Properties of Amorphous Cluster and
Nanocrystalline CdSe. Chem. Comm. 2002, 1826-1827.
51. Gautam, U. K.; Rajamathi, M.; Meldrum, F.; Morgan, P.; Seshadri, R. A
Solvothermal Route to Capped CdSe Nanoparticles. Chem. Comm. 2001, 629-630.
52. Weller, H. Quantized Semiconductor Particles - a Novel State of Matter for
Materials Science. Adv Mater 1993, 5, 88-95.
53. Hines, M. A.; Guyot-Sionnest, P. Synthesis and Characterization of Strongly
Luminescing ZnS-Capped CdSe Nanocrystals. J. Phys. Chem. 1996, 100, 468-471.

18
54. Manna, L.; Scher, E. C.; Alivisatos, A. P. Shape Control of Colloidal Semiconductor
Nanocrystals. Journal of Cluster Science 2002, 13, 521-532.
55. Manna, L.; Scher, E. C.; Alivisatos, A. P. Synthesis of Soluble and Processable Rod-
, Arrow-, Teardrop-, and Tetrapod-Shaped CdSe Nanocrystals. J. Am. Chem. Soc.
2000, 122, 12700-12706.

19
Chapter 2
Motivation
A prerequisite for the synthesis of high-quality CdSe nanocrystals is a high-
temperature reaction medium to promote growth. Another requirement is an organic or
inorganic capping agent to chemically passivate the surface and mediate growth. The
judicious control of the competition between the temperature and capping agent will yield
a nanocrystal with a size leading to quantum confinement as exhibited by emission
spectra within the visible light region. The synthetic process must also facilitate surface
reconstruction to eliminate surface defects due to energy traps which can suppress
emission and lower quantum yields. These achievements have been demonstrated, with
varying degrees of success, through the conventional organic-based synthetic routes, but
many limitations and hindrances do exist.
The workhorse for the benchmark organic route consists of the organic solvent
TOPO. It coordinates the surface of the nanocrystal, permitting slow steady growth.
The ligands are quite bulky and present a significant barrier to bulk cadmium and
selenium monomer as they add to the nanocrystal surface. Additionally, the solvent
electronically passivates the surface as the ligands terminate dangling cadmium bonds,
reducing energy traps. While a seemingly perfect solvent, one of TOPO’s shortcomings
is its flammability. The temperatures needed to produce the nanocrystals in TOPO often

20
exceed its flashpoint (180-200 °C). Talapin et al.[1] and Gaponik [2] cite another
problem with the TOPO method being the irreproducibility of the growth dynamics and
the shape of the CdSe nanocrystals because of the grade of chemical provided. The
impurities in technical grade TOPO have offered benefits over the pure grade [1, 3], but
only serendipitously. Researchers have sought to use pure TOPO and add other solvents
in order to mimic the presence of the tech-grade impurities [3]. This method can lack
control as the type of impurities and amounts are often not known since they are not
deliberately added.
Another limitation present in the original TOPO method is the use of hazardous
precursors, in particular, dimethyl cadmium. The range of compatible cadmium
precursors is limited when using TOPO, thus the reason for the use of dimethyl cadmium.
It is highly toxic and can be unstable at the high temperature required for the reactions
[4].
Fatty acids, an alternative to TOPO, are the most versatile solvent/ligand [5]. A
wider range of greener precursors are compatible with fatty acids. Stearic acid, for
example, promotes faster reactions, and, thus, larger nanoparticles than what are
produced from TOPO [5]. But, the fear here may be that the nanoparticles produced by
fatty acids will not exhibit quantum behavior [6]. Other solvents have been used to act as
a co-solvent to TOPO or to replace it altogether with the goal of reducing hazards and
extra processing steps [5, 7]. In spite of this “green” effort, the usage of hazardous
chemicals continues. And while these are used in a laboratory setting, it is hoped that
these methods can be parlayed into high-volume process technologies. With the goal of
21
industry cutting down on materials that burden the environment, these methods will
simply not be feasible in the long run.
Semiconductor nanocrystals that are synthesized in and remain in organic solvents
are limited to opto-electronic applications. A water-soluble nanocrystal is required to
function in biological entities. Many complex methods have been developed for making
nanocrystals water-soluble that were originally synthesized in organic solvents. Water as
the reaction medium, at temperatures below ambient conditions (<100 °C), has been used
with little success, resulting in very low quantum yields [8, 9].
While the methods outlined above represent a step forward in the right direction,
there remains a need to find a solvent and precursors that are at least as good as in the
traditional organometallic approach, but are safe, inexpensive and environmentally
friendly. An ideal synthetic route to high-quality nanocrystals would (i) reduce
environmental and safety risks, (ii) operate with relatively small quantities of reagents,
(iii) incorporate a single-step and scalable process, (iv) promote solubility in organic and
aqueous matrices, and (v) facilitate a successful technology transfer.
We propose that high-temperature water could be a medium that will offer
tremendous opportunities as an alternative to conventional methods, which are often
chemically complex, experimentally tedious and hazardous. First and foremost, it is a
benign solvent, at any temperature. Secondly, its properties can be tuned continuously,
and adapted to a desired process technology. More interestingly, though, at high
temperatures, it behaves more like a polar organic solvent, possibly enabling the use of a
wide variety of precursors that are deemed safe. It is the most versatile solvent
abundantly available and could offer more process benefits than a traditional organic

22
solvent. To date, no one has elucidated the effects of high-temperature water on the
physical, surface and optical properties of CdSe nanocrystals synthesized therein.

23
2.1 Bibliography
1. Talapin, D. V.; Rogach, A. L.; Kornowski, A.; Haase, M.; Weller, H. Highly
Luminescent Monodisperse CdSe and CdSe/ZnS Nanocrystals Synthesized in a
Hexadecylamine-Trioctylphosphine Oxide-Trioctylphospine Mixture. Nano Lett.
2001, 1, 207-211.
2. Gaponik, N.; Talapin, D. V.; Rogach, A. L.; Hoppe, K.; Shevchenko, E. V.;
Kornowski, A.; Eychmuller, A.; Weller, H. Thiol-Capping of CdTe Nanocrystals:
An Alternative to Organometallic Synthetic Routes. J Phys Chem B 2002, 106,
7177-7185.
3. Hollingsworth, J. A. In Semiconductor Nanocrystal Quantum Dots; Encyclopedia of
Inorganic Chemistry; John Wiley and Sons: 2007; .
4. Peng, X. G. Green Chemical Approaches Toward High-Quality Semiconductor
Nanocrystals. Chem. Eur. J. 2002, 8, 335-339.
5. Qu, L. H.; Peng, Z. A.; Peng, X. G. Alternative Routes Toward High Quality CdSe
Nanocrystals. Nano Lett. 2001, 1, 333-337.
6. Alivisatos, A. P. Semiconductor Clusters, Nanocrystals, and Quantum Dots. Science
1996, 271, 933-937.
7. Qu, L. H.; Peng, X. G. Control of Photoluminescence Properties of CdSe
Nanocrystals in Growth. J. Am. Chem. Soc. 2002, 124, 2049-2055.
8. Deng, D. W.; Y, J. S.; Pan, Y. Water-Soluble CdSe and CdSe/CdS Nanocrystals: A
Greener Synthetic Route. J. Coll. Int. Sci. 2006, 299, 225-232.
9. Rogach, A. L.; Nagesha, D.; Ostrander, J. W.; Giersig, M.; Kotov, N. A. "Raisin
Bun"-Type Composite Spheres of Silica and Semiconductor Nanocrystals. Chem.
Mater. 2000, 12, 2676-2685.

24
Chapter 3
Literature Review
The synthesis of II-VI semiconductor nanoparticles has experienced an enormous
development in the past two decades. CdSe, in particular, has been the subject of much
basic research into the electronic and optical properties of quantum dots. The amount of
literature dealing with this topic is too voluminous to review within the context of this
dissertation. As such, we will initially discuss the type of reaction mediums used to
prepare the nanocrystals and the results of the effects of experimental parameters on the
nanocrystals. We will then focus on the works performed by researchers in their attempts
to understand and eventually model the growth kinetics of CdSe nanocrystals. This
narrower focus is justified because these are the central topics of this dissertation.
3.1 Reaction Solvent
3.1.1 Organic-based Systems
The most successful preparations that realize high quality nanocrystals with
narrow size distributions entail the pyrolysis of organometallic precursors in hot
coordinating solvents. Murray et al. [1] pioneered this strategy by injecting cadmium and
selenium precursors into a hot (300 °C) solution of tri-n-octylphosphine oxide (TOPO)
and maintaining growth at 230-260 °C. The TOPO served multiple crucial roles by
acting as the reaction medium, controlling the growth process, stabilizing the colloidal

25
dispersion, and passivating the nanocrystal’s surface. This strategy produced TOPO-
capped CdSe nanocrystals with a tunable size range from 1.2 – 11.5 nm. The average
size and the size distribution were dependent on the growth temperature, and growth
appeared consistent with Ostwald ripening. They assert that as the size distribution
sharpens, the reaction temperature must increase to maintain steady growth. Conversely,
they add, if the size distribution broadens, the necessary temperature for slow steady
growth decreases. Crude estimates of the size distribution yielded an fwhm = 50 nm, but
modulation of the reaction temperature allowed the maintenance of a narrow size
distribution as the sample grew. A size distribution with a standard deviation of 10% for
one sample with a mean particle diameter of 3.5nm was reduced to ~5% for particles with
a mean diameter of 3.7 nm using size-selective precipitation procedures They calculated
a QY of 9.6% for CdSe samples with an average size of 3.5 nm. Their work formed the
basis of the organometallic preparative routes and they cite several advantages. For
instance, nucleation does not continue during the growth stage; this helps establish the
narrow size distribution. The higher temperatures allowed by this method enable faster
reactions and more crystalline product due to the annealing process during the
nanocrystal’s growth. This can often translate to higher quantum yields. But the
quantum yields achieved in this strategy do not exceed 5-15% for as-prepared particles.
The luminescent properties can be enhanced by growing a shell with a wide-band gap
semiconductor around the bare particles. The TOPO method, again, yields just a small
amount of nanoparticles. Another problem with the TOPO method is the
irreproducibility of the growth dynamics.

26
Adding a solvent, such as a primary amine, to TOPO has allowed researchers to
overcome some of the disadvantages inherent in TOPO alone. Primary amines have been
found to provide superior passivation to bare nanocrystals, such as ZnSe [2], as they may
provide higher capping density and boost the quantum efficiency. Furthermore, they
allow for a higher reaction rate than TOPO, and monodispersity can be achieved quickly
and maintained throughout the reaction. Knowing this, Talapin et al. [3] tried to improve
upon the original TOPO synthesis by introducing HDA (hexadecylamine). Exceptionally
monodisperse samples (fwhm = 27-31 nm) were obtained, thus, the need for post-
preparative size-selective precipitation was eliminated. The alkylamines effectively
passivated the bare CdSe nanocrystals allowing them to reproducibly reach quantum
yields of 40-50%.
Qu and Peng [4] examined the QY of nanocrystals under various conditions in a
solvent mixture of TOPO and HDA, as well as TOPO mixed with other amines, such as
dodecylamine (DDA) and octadecylamine (ODA). They performed a systematic study
on the relationship between the optical properties of as-prepared CdSe nanocrystals and a
variety of growth conditions. They looked at higher wavelength (red emitting)
nanocrystals, in particular, those that fluoresced between 600 and 650 nm. In general,
their results showed that the fwhm and QY were strongly affected by the initial Cd:Se
molar ratio. They demonstrated that an excess of either cadmium or selenium promoted
the formation of CdSe nanoparticles with high QY. In excess selenium the reaction
started out focused, or with a very narrow size-distribution as determined by the small
fwhm. But, as the system became more cadmium-rich, the size-distribution, over time,
began to broaden; concurrently, the quantum yield gradually increased, came to a

27
maximum, and then gradually decreased. At a Cd:Se molar ratio of 1:1, the size-
distribution was initially broad, but quickly narrowed over time. The QY, under these
conditions, over time, quickly increased then decreased. A reaction in excess cadmium
(Cd:Se = 2:1) did not greatly affect the size-distribution. The QY, however, sharply
increased, then decreased and stabilized over time.
The nature of the amines was found to be an important parameter in their system
for growing nanocrystals with high quantum efficiency. However, among the amines,
DDA was the worst due to the limited reaction temperature range (<230 °C). The
reactions that took place in TOPO/ODA yielded nanocrystals with maximum quantum
yields of 50-60% over a given time, albeit in a large excess of selenium. HDA was the
best amine to produce a high quantum yield at any one point in time. A secondary amine,
dioctylamine (DOA), had no appreciable effect on the emission properties of the
nanocrystals produced.
Alternatives to TOPO have been used due to TOPO’s inherent hazards. For
example, Qu et al. [5] used a one-pot approach to produce CdSe nanocrystals in a fatty
acid solvent, namely, stearic acid at a growth temperature set between 200 and 320 °C.
Fatty acids are much less expensive and more environmentally friendly. This solvent
system yielded nanocrystals in a broad size range (2 to >25 nm). They observed
extremely fast reaction rates, compared with the traditional TOPO method, and stated that
this solvent was ideal for synthesizing larger nanoparticles (>4 nm). The system did
luminesce well with a QY = 20-30%. The QY did tend to decrease with an increase in
particle size.

28
Dickerson et al. [6] also noticed rapid growth of CdSe nanoparticles in a reaction
mixture comprised of 95% stearic acid, achieving a maximum QY of about 26% at a
temperature of 255 °C. Nanoparticles synthesized in dodecylamine obtained a maximum
QY of 28% at a reaction temperature of 195 °C. In general, the evolution of the QY and
emission peak width (fwhm) correlated more consistently with the emission wavelength
than with temperature. Furthermore, the nanoparticle radius was virtually unaffected by
the initial Cd:Se ratio. They also observed that higher selenium levels led to the
formation of more initial nuclei.
Bullen et al. [7] used a non-coordinating solvent, octadecene (ODE), as their
reaction medium and cadmium oleate as their capping agent. Their as-prepared CdSe
nanoparticles, grown at a reaction temperature of 265 °C, initially exhibited an fwhm of
43 nm, but quickly narrowed to 30 nm after the first 200 seconds. The main focus of
their work was toward the growth kinetics of the nanoparticles and it will be referenced
further in this chapter.
Asokan et al. [8] demonstrated the formation of CdSe nanocrystals using heat
transfer fluids DTA and T66 as reaction media. At a growth temperature of 280 °C,
nanocrystals formed in T66 were smaller than those formed in ODE. After 1h of growth
at 220 °C, synthesis in DTA and T66 yielded particles with an average diameter of 2.9
and 3.1 nm, respectively. These sizes were slightly less than those prepared in ODE (3.1
nm) and TOPO (4.0 nm). The size distributions for those nanocrystals prepared in DTA
and T66 were reported as 18% and 17%, respectively. These are higher than those
reported for ODE (15%) and TOPO (13%). Although these are rather broad, they cite
the reason for this as an artifact of TEM analysis. An ensemble of 2.7 nm CdSe

29
nanocrystals yielded quantum yields of 3.3% and 8.4% for DTE and T66, respectively,
lower than those for the nanocrystals prepared in ODE (11.7%) and TOPO (15.9%). The
fwhms for the same ensemble were estimated to be 24 and 27nm for DTE and T66,
respectively, compared with 33 and 34 nm for ODE and TOPO, respectively. Reasons
for this, they cite, include differences in surface structure and no exclusion of oxygen and
moisture during their synthesis and characterization processes.
The advancement of TOPO-based preparations has served as the benchmark for
the widespread success of producing CdSe nanocrystals. Early applications of CdSe are
based on this strategy, such as the fabrication of a light-emitting diode and a single
electron transistor. But the success has, in the recent years, been tempered by the need to
maintain environmental benignity. As such, researchers have been motivated to develop
alternative synthetic methods for the well-studied model system. Peng [9], in particular,
discussed the drawbacks to using the organometallic synthetic approach in a hot
coordinating solvent such as TOPO, citing toxic and hazardous conditions, expensive
chemicals and sophisticated equipment. Additionally, this approach is not easily
controllable or reproducible, and only preparation of cadmium chalcogenides has been
successfully developed.
3.1.2 Aqueous-based Systems
Another method commonly used to prepare nanocrystals uses an aqueous
medium. Aqueous synthetic approaches are in general, simpler, less expensive, more
reproducible, and scalable. Moreover, water-soluble materials are required for biological
applications. Attempts have been made to initially prepare the nanocrystals in organic

30
media, and then manipulate the surface through ligand exchange [1, 3, 5, 10, 11] or
application of a polymer shell [12, 13] to make it water-soluble. But these methods
require more chemical processing. Researchers have investigated various types of
precursors, stabilizers, heating technologies and other experimental parameters in
attempts to further develop the aqueous-based method.
Zhang and company [14] produced cubic-structured nanocrystalline CdSe, with
an average size of 5 nm, in an aqueous solution at room temperature. The reaction took
place in an excess volume of alkaline selenium solution. This was done to prevent
dilution of the selenium source so that selenium ion would not precipitate. A cadmium
complex rather than cadmium ion served as the cadmium source; the complex proved to
be more stable, greatly reducing the byproduct of cadmium hydroxide. A TEM image
showed spherical but slightly agglomerated particles.
Xu et al. [15] produced CdSe quantum dots in an aqueous solution using a gelatin
stabilizer at room temperature. They observed quenched photoluminescence, suggesting
inadequate passivation or overall low crystallinity.
Li et al. [16] realized highly photoluminescent CdSe nanocrystals from room-
temperature aqueous synthesis, followed by a low temperature chemical etching process.
Prior to etching, the nanoparticles showed no photoluminescence. The etching process
served to eliminate surface defects, thereby increasing the quantum efficiency to as high
as 50%. Furthermore, they observed narrower size-distributions post-etching, with fwhm
values as low as 30 nm, in addition to smaller size nanoparticles.
Sondi et al. [17] synthesized CdSe nanoparticles in the presence of aminodextran
(Amdex) in an aqueous solution at room temperature. The Amdex served as a growth

31
stabilizer and capping agent. They produced CdSe nanocrystals with quantum yields of
15-16%. They observed wider particle distribution in the presence of Amdex compared
with CdSe prepared in the conventional TOPO method. They attribute this to the wide
molecular weight distribution of the polymer itself.
Water alone cannot provide a ligand suitable for stabilizing and/or passivating the
nanocrystal surface. Therefore, judicious effort must be taken to provide a ligand or
capping agent that is soluble and can withstand the reaction conditions. The above
examples describe a variety of capping agents that served the researcher’s purpose. The
use of thiols in aqueous solutions, however, was made prominent by researchers in their
effort for producing cadmium telluride [18], and CdS-core clusters [19].
Rogach et al. [20] extended the use of thiols to CdSe nanocrystal synthesis. They
prepared CdSe in higher temperature aqueous-solutions using various thiols as a
stabilizer. One preparation involved refluxing the solution for different lengths of times,
resulting in larger nanoparticles at longer times. They noticed that, during the heating of
the solution, particle growth proceeded about 5 times faster in the presence of thioacid-
stabilized CdSe compared with thioalcohol-stabilized CdSe. As a result, thioacid-
stabilized CdSe nanocrystals were larger (2.1-3.2 nm) than thioalcohol-stabilized samples
(1.4-2.2 nm). The CdSe samples prepared showed a quantum yield of less than 0.1%.
Rogach [21] later demonstrated the presence of citrate-stabilized CdSe
nanocrystals in 70 °C water. The QY was quite weak at 0.1-0.15%, but the size-
distribution was relatively narrow (fwhm = 30-50 nm).
Deng et al. [22] also synthesized citrate-stabilized CdSe nanoparticles in water at
75 C. They incorporated a photoactivation procedure by exposing the nanoparticles to

32
ambient light for a few days, hypothesizing that this would eliminate topological surface
defects. They noticed a trend of increased QY with prolonged exposure to ambient light,
reporting a final QY of 4%. They also reported a decrease in the nanoparticle size with
an increase in the pH, further noticing that nanoparticles prepared in a pH = 9.1 displayed
stronger luminescence properties than those prepared at pH = 8 and 10. They
investigated the effects of the initial Cd:Se molar ratio on the nanoparticle properties, and
found that the photoluminescence intensity increased as the ratio increased from 2 to 10.
Also, the fwhm narrowed to 37 nm as the molar ratio increased.
Most recently, Gao et al. [23] prepared CdSe nanocrystals in water, and then
fabricated an LED by redispersing the as-prepared nanocrystals in a surfactant to transfer
them to an organic solvent. They noticed that by changing the molar ratio of cadmium
and selenium and the reflux time, different size nanocrystals were obtained. The average
size obtained was just under 10 nm. Of interest were two characteristics of the integrity
of the nanocrystal. The photoluminescence spectra showed weak emission, but
electroluminescence spectra displayed strong emission. Basically, the electron transport
inside the crystal was quite good as it served to act as an electron carrier while a polymer
acted as an electron hole. By applying a voltage between the two entities, an exciton was
formed. These results provide more substantive proof that the promise of CdSe can be
realized as a device component when fabricated in an aqueous medium.
The articles above report on CdSe synthesis in water, but always at temperatures
at or below the normal boiling point. Quantum yields for as-prepared particles tend to be
low, and the processes tend to involve several steps. It is apparent that high-temperature
synthetic strategies are an important gateway to obtaining ideal CdSe nanocrystals. Past

33
and present day methods incorporating aqueous reaction mediums have not provided the
high temperature required for a true crystalline product. Nonetheless, traditional organic
strategies are not desirable in the long run because of safety, cost, processing and
environmental issues. More desirable is a fully developed route that is safe, simple,
inexpensive, and versatile. High-temperature water has the qualities that can provide
tremendous advantages over conventional methods.
Aqueous-based reactions above the boiling point (130 - 180 °C) have been
reported for synthesis of various semiconductor nanocrystals such as CdTe [24] and CdS
[25]. As-prepared CdTe nanocrystals prepared by Zhang et al. evolved from 2 to 4 nm
within 2 hours of growth. They exhibited a QY of 30% without any post-preparative
treatment. Liu et al. [25] prepared polymer-capped CdS nanoparticles with an average
diameter of 8 nm and an fwhm of ~42 nm. Qian et al. [26] prepared alloyed CdSe-CdS
nanocrystals at a reaction temperature of 140 °C for 1 hour. Because of the CdS shell,
the QY measured at 25%. They found that after a short heating time (less than 1 hour)
the QY measured <0.1%. The prolonging of the heating time allowed the CdS shell to
mature on the CdSe surface. The fwhm was about 28 nm. They note that their method of
heating, microwave irradiation, greatly accelerated the growth compared with
conventional aqueous synthesis. Other hydrothermal methods have produced
semiconductor nanocrystals as reported by Rajamathi et al.[27]
3.2 Growth Kinetics
One important aspect of Murray’s work with TOPO involved a temporally
discrete nucleation event followed by relatively rapid growth from the monomers in the

34
solution. This permits a controlled growth of the nanocrystals. The challenge then is to
understand the mechanisms behind the nucleation and growth. Researchers have just
recently begun to study and understand the kinetic behavior of CdSe growth under a
variety of reaction conditions.
Bullen et al. [7] investigated the effects of temperature and an oleic acid stabilizer
on the growth kinetics of CdSe nanocrystals in octadecene, a non-coordinating solvent.
They observed increasing oleic acid concentrations led to lower nuclei concentrations,
smaller nuclei size and larger final particle size. They also observed that at higher
temperatures, particles nucleated with smaller radii than those present at lower
temperatures. This, according to them, indicated that the nucleation is faster as
temperature increases and that growth kinetics are less strongly dependent on
temperature. Consequently, higher temperatures produced more nuclei.
Peng et al. [28] discussed the focusing of size distributions and its effect on
nanocrystal growth. After growing CdSe nanocrystals in TOPO at 200 °C, they observed
an initial large size distribution (~20%) for particles with an average diameter of 2.1 nm,
and two distinct kinetic regimes. During the first 22 minutes, the size increased rapidly
and the initial size distribution of particles began to narrow to ~7.7% (average diameter
of 3.3 nm). The nanocrystals then grew more slowly and the size distribution broadened
to about 10.6% (average diameter of 3.9 nm). The reason for this broadening was the
occurrence of Ostwald ripening. Upon a second injection of precursor, the size-
distribution began to narrow and decreased to 8.7%. They later emphasized the
importance of maintaining a high enough precursor concentration so that the system does
not experience Ostwald ripening which could lead to broader size distributions.

35
Qu et al. [29] introduced an in situ method for the study of the nucleation and
growth kinetics of CdSe nanocrystals. Their observations suggest that the growth process
can be divided into four stages. The first stage is the nucleation where the total number
of particles increases as a result of nuclei forming. The second stage shows a significant
drop in the concentration of the particles, and a narrowing of the size distribution. They
contend that the decrease of the particle concentration could not be seen ex situ. A third
stage, the stable stage, exhibited an equilibrium between the monomers and the particles
in solution. The monomer concentration was close to the solubility of the particles in
solution, so little to no growth was occurring. The fourth stage is Ostwald ripening, and
thus a broadening of the size distribution occurs.
It is apparent that Ostwald ripening, although regarded as the primary means of
growth in earlier research, is not easily controllable, and, because of recent insights in
kinetic behavior, can possibly be avoided. Peng, [28] above, provides one example of a
solution to prevent Ostwald ripening from occurring. More important, however, is
determining where, in the kinetic regime, growth is at its optimum. This understanding is
crucial for the control of the growth process. It can also serve as a conceptual framework
for developing large-scale systems that can produce uniform particles under optimum
conditions.
Dushkin et al. [30] supplied a comprehensive study of the kinetics of CdSe
nanocrystal growth in a hot amphiphile (TOPO) matrix. They solved kinetic equations,
based on classical theory, to derive analytical expressions for the mean radius and
variance of the size distribution. They considered the growth to be a two-stage process in
order to describe the time variation of nanoparticle size. During the first stage, called

36
reaction-limited growth, they noticed the size of the initial nuclei rapidly increased and
caused an exhaustion of reactants at the nanoparticle surface. The growth also favored a
size focusing or narrowing of the size distribution. Further development of the
nanocrystal followed classic diffusion-limited growth. The size distribution began to
broaden at this time, however, increasing in proportion to the average particle size. Their
theoretical model was in good agreement with their experimental observations. They
conclude that the reaction-limited growth is important to obtain well-defined nanocrystals
of high quality. Good, precise control of the nucleation process is key to reproducible
uniform nanoparticles, but, unfortunately, how to control this process is still unknown.
Dickerson et al. [6, 31] saw the need for developing analytical expressions that
would yield the activation energy for CdSe growth in a given reaction solvent. Citing
the need for eventual commercialization as a reason for measuring activation energies,
they developed expressions based on synthesis time, temperature and reactant
concentration. Their model yielded activation energies for nanocrystals prepared in
TOPO and stearic acid. Chapter 7 describes, in detail, the model provided by Dickerson
and how we adapted it for our aqueous system.

37
3.3 Bibliography
1. Murray, C. B.; Norris, D. J.; Bawendi, M. G. Synthesis and Characterization of
nearly Monodisperse Cde (E = S, Se, Te) Semiconductor Nanocrystallites. J. Am.
Chem. Soc. 1993, 115, 8706-8715.
2. Hines, M. A.; Guyot-Sionnest, P. Bright UV-Blue Luminescent Colloidal ZnSe
Nanocrystals. J. Phys. Chem. B 1998, 102, 3655-3657.
3. Talapin, D. V.; Rogach, A. L.; Kornowski, A.; Haase, M.; Weller, H. Highly
Luminescent Monodisperse CdSe and CdSe/ZnS Nanocrystals Synthesized in a
Hexadecylamine-Trioctylphosphine Oxide-Trioctylphospine Mixture. Nano Lett.
2001, 1, 207-211.
4. Qu, L. H.; Peng, X. G. Control of Photoluminescence Properties of CdSe
Nanocrystals in Growth. J. Am. Chem. Soc. 2002, 124, 2049-2055.
5. Qu, L. H.; Peng, Z. A.; Peng, X. G. Alternative Routes Toward High Quality CdSe
Nanocrystals. Nano Lett. 2001, 1, 333-337.
6. Dickerson, B. D. Organometallic Synthesis Kinetics Of CdSe Quantum Dots,
Virginia Polytechnic Institute and State University, 2005.
7. Bullen, C. R.; Mulvaey, P. Nucleation and Growth Kinetics of CdSe Nanocrystals in
Octadecene. Nano Lett. 2004, 4, 2303-2307.
8. Asokan, S.; Krueger, K., M; Alhkawaldeh, A.; Carreon, A., R; Mu, Z.; Colvin, V., L;
Mantzaris, N., V; Wong Michael, S. The use of Heat Transfer Fluids in the Synthesis
of High-Quality CdSe Quantum Dots, core/shell Quantum Dots, and Quantum Rods.
Nanotechnology 2005, 16, 2000.
9. Peng, X. G. Green Chemical Approaches Toward High-Quality Semiconductor
Nanocrystals. Chem. Eur. J. 2002, 8, 335-339.
10. Mattoussi, H.; Mauro, J. M.; Goldman, E. R.; Anderson, G. P.; Sundar, V. C.;
Mikulec, F. V.; Bawendi, M. G. Self-Assembly of CdSe-ZnS Quantum Dot
Bioconjugates using an Engineered Recombinant Protein . J. Am. Chem. Soc. 2000,
122, 12142-12150.
11. Chan, W. C. W.; Nie, S. Quantum Dot Bioconjugates for Ultrasensitive Noniostopic
Detection. Science 1998, 281, 2016.
12. Pellegrino, T.; Manna, L.; Kudera, S.; Liedl, T.; Koktysh, D.; Rogach, A. L.; Keller,
S.; Radler, J.; Natile, G.; Parak, W. J. Hydrophobic Nanocrystals Coated with an
Amphiphilic Polymer Shell: A General Route to Water Soluble Nanocrystals. Nano
Lett. 2004, 4, 703-707.

38
13. Wu, X. Y.; Liu, H. J.; Liu, J. Q.; Haley, K. N.; Treadway, J. A.; Larson, J. P.; Ge, N.
F.; Peale, F.; Bruchez, M. P. Immunofluorescent Labeling of Cancer Marker Her2
and Other Cellular Targets with Semiconductor Quantum Dots. Nature
Biotechnology 2002, 21, 41-46.
14. Zhang, W. X.; Wang, C.; Zhang, L.; Zhang, X. M.; Liu, X. M.; Tang, K. B.; Qian, Y.
T. Room-Temperature Synthesis of Cubic Nanocrystalline CdSe in Aqueous
Solution. Journal of Solid State Chemistry 2000, 151, 241-244.
15. Xu, L.; Chen, K.; El-Khair, H. M.; Li, M. H.; Huang, X. F.
Enhancement of Band-Edge Luminescence and Photo-Stability
in Colloidal CdSe Quantum Dots by various Surface Passivation Technologies.
Applied Surface Science 2001, 172, 84-88.
16. Li, R.; Lee, J. H.; Kang, D.; Luo, Z. T.; Aindow, M.; Papadimitrakopoulos, F. Band-
Edge Photoluminescence Recovery from Zinc-Blende CdSe Nanocrystals
Synthesized at Room Temperature. Advanced Functional Materials 2005, 16, 345-
350.
17. Sondi, I.; Siiman, A.; Matijevic, E. Synthesis of CdSe Nanoparticles in the Presence
of Aminodextran as Stabilizing and Capping Agent. J. Coll. Inter. Sci. 2004, 275,
503-507.
18. Gaponik, N.; Talapin, D. V.; Rogach, A. L.; Hoppe, K.; Shevchenko, E. V.;
Kornowski, A.; Eychmuller, A.; Weller, H. Thiol-Capping of CdTe Nanocrystals:
An Alternative to Organometallic Synthetic Routes. J Phys Chem B 2002, 106, 7177-
7185.
19. Herron, N.; Calabrese, J. C.; Farneth, W. E.; Wang, Y. Crystal Structure and Optical
Properties of Cd32 S14 (SC6H5) 36 DMF4, a Cluster with a 15 Angstrom CdS Core.
Science 1993, 259, 1426-1428.
20. Rogach, A. L.; Kornowski, A.; Gao, M. Y.; Eychmuller, A.; Weller, H. Synthesis
and Characterization of a Size Series of Extremely Small Thiol-Stabilized CdSe
Nanocrystals. J Phys Chem B 1999, 103, 3065-3069.
21. Rogach, A. L.; Nagesha, D.; Ostrander, J. W.; Giersig, M.; Kotov, N. A. "Raisin
Bun"-Type Composite Spheres of Silica and Semiconductor Nanocrystals. Chem.
Mater. 2000, 12, 2676-2685.
22. Deng, D. W.; Y, J. S.; Pan, Y. Water-Soluble CdSe and CdSe/CdS Nanocrystals: A
Greener Synthetic Route. J. Coll. Int. Sci. 2006, 299, 225-232.
23. Gao, Y. H.; Liang, C. J.; Tang, A.; Teng, F.; Li, D.; Deng, Z.; Huang, S. H.
Electroluminescence of Cadmium Selenium Nanocrystals Synthesized in Aqueous
Solution. Journal of Luminescence 2007, 122-123, 648.

39
24. Zhang, H.; Wang, L. P.; Xiong, H. M.; Hu, L. H.; Yang, B.; Li, W. Hydrothermal
Synthesis for High-Quality CdTe Nanocrystals. Adv Mater 2003, 15, 1712-1715.
25. Liu, S. H.; Qian, X. F.; Yin, J.; Ma, X. D.; Yuan, J. Y.; Zhu, Z. K. Preparation and
Characterization of Polymer-Capped CdS Nanocrystals. J. Phys. Chem. Solids 2003,
64, 455-458.
26. Qian, H. F.; Li, L.; Ren, J. One-Step and Rapid Synthesis of High Quality Alloyed
Quantum Dots (CdSe–CdS) in Aqueous Phase by Microwave Irradiation
with Controllable Temperature. Mater. Res. Bull. 2005, 40, 1726-1736.
27. Rajamathia, M.; Seshadrib, R. Oxide and Chalcogenide Nanoparticles from
Hydrothermal/ Solvothermal Reactions. Curr. Opin. Solid State Mat. Sci. 2002, 6,
337-345.
28. Peng, X. G.; Wickham, J.; Alivsatos, A. P. Kinetics of II-VI and III-V Colloidal
Semiconductor Nanocrystal Growth: “Focusing” of Size Distributions. J. Am. Chem.
Soc. 1998, 120, 5343-5344.
29. Qu, L. H.; Yu, W. W.; Peng, X. P. In Situ Observation of the Nucleation and Growth
of CdSe Nanocrystals. Nano Lett. 2004, 4, 465-469.
30. Dushkin, C. D.; Saita, S.; Yoshie, K.; Yamaguchi, Y. The Kinetics of Growth of
Semiconductor Nanocrystals in a Hot Amphiphile Matrix. Adv. Coll. Inter. Sci. 2000,
88, 37-78.
31. Dickerson, B. D.; Irving, D. M.; Herz, E.; Claus, R. O.; Spillman, W. B.; Meissner,
K. E. Synthesis Kinetics of CdSe Quantum Dots in Trioctylphosphine Oxide and in
Stearic Acid. Applied Physics Letters 2005, 86, 171915-1-171915-3.

40
Chapter 4
Experimental Methods
Batch reactor studies of the effects of experimental parameters such as time,
temperature, pH and reagent concentrations on the optical and physical properties of
CdSe nanocrystals were performed. Three studies were performed – a feasibility study,
rapid hot-injection study and a kinetic study. Analyses were performed using
spectroscopy and electron microscopy techniques.
4.1 Materials
The reagents used were a cadmium and selenium precursor, sodium hydroxide for
pH adjustment, sodium citrate as a capping agent, thioacetamide as a sulfur source, and
deionized water as the reaction medium. These reagents were used because they were
successfully employed to produce CdSe nanocrystals in experiments by Rogach et al.[1]
Cadmium perchlorate (Aldrich , 99% ), N,N-dimethylselenourea (Sigma-Aldrich, 97%),
sodium citrate tribasic dihydrate (Sigma-Aldrich, 99%), sodium hydroxide (Fisher, 0.1N)
and thioacetamide (Sigma-Aldrich, 99+%) were used as received.
The batch reactors comprised 3/8” stainless steel Swagelok® fittings (port
connectors and end caps) that, when assembled, created a reactor volume of
approximately 1.54 ml (Figure 4.1a-b). An additional high-temperature rated bellows
valve, attached to one end of a batch reactor, was used for the rapid hot-injection and

41
kinetics studies (Figure 4.1c). Our heat source consisted of a fluidized sand bath (Techne
SBL-2) fitted with a Techne temperature controller.
A
B
C
Figure 4.1a-c. Graphic of the materials for the batch reactor system used for the
syntheses. The batch reactor consisted of 3/8” stainless steel (A) port connectors and (B)
end caps. A bellows valve (C) was fitted to a batch reactor for the rapid hot-injection
study.

42
4.2 Method
The batch reactors were assembled and conditioned in the following manner.
Two 3/8” inch stainless steel Swagelok caps were attached to the two ends of a 3/8” port
connector using a vice and a wrench. This was done so that one end would be
permanently capped and the other end would be fitted with the compression ferrule and
ready to receive the cap when needed. Conditioning consisted of triple rinsing each
reactor with acetone, followed by a rinse with deionized water. The empty reactors were
then capped on both ends and placed in the preheated sand bath for 1 hour at 300 °C. The
conditioned reactors were taken out of the sand bath, cooled and rinsed prior to starting
the experiments.
We examined the following process variables for the feasibility and rapid hot-
injection studies: reaction temperature, reaction time, pH, initial Cd:Se molar ratio and
stabilizer loading. For the kinetics study, we varied only time and temperature. Table
4.1 shows the range of the process variables.
Feasibility Study Rapid Hot-injection
Study Kinetics Study
Temperature, C 200 – 215 200 – 240 200 – 240
Time, min 1.5 – 2.5 1 – 10 1 – 45
pH 8 – 11 8 – 11 9
Stabilizer
Loading, g
2.80x10⁻³
–
1.40x10⁻²
2.80x10⁻³
–
1.40x10⁻²
2.80x10
-3
Cd:Se Molar
Ratio 4 – 16 4 – 40 8
Table 4.1. Range of process parameters used for the feasibility, rapid hot-injection and
kinetics experiments. All values are on a per reactor basis.

43
4.2.1 Feasibility Study
Citrate-stabilized nanocrystals were prepared in the following manner (based on a
procedure by others): using a pipette, 5 ml of 8x10⁻²
M cadmium perchlorate dihydrate
solution was added to 45 ml of deionized water containing 0.1 g sodium citrate.
Different Cd:stabilizer molar ratios were obtained by adding different amounts of sodium
citrate. Enough 0.1 M NaOH was added to increase the pH to 9.0. Then, 5 mL of this
mixture was added to a glass vial. Immediately prior to running an experiment, a
carefully measured amount of 1x10⁻²
M N,N-dimethylselenourea solution was added to
the cadmium/sodium citrate solution in the vial. 1.5 ml of this resulting solution was then
transferred to the reactor which was tightly sealed. The selenium reagent was added
immediately before the reaction to minimize the fast oxidative loss of the selenourea.
Adding 0.5 ml of the selenourea solution yielded a Cd:Se molar ratio of 8:1. Different
Cd:Se molar ratios were obtained by adding different volumes of the N,N-
dimethylselenourea. We chose to run experiments with excess cadmium, primarily due
to successes with a similar CdSe synthesis by Rogach et al. The sealed reactor was
immersed in the preheated sand bath. After the appointed time, the reactors were
withdrawn from the sand bath, immediately placed in a water bath at room-temperature,
and allowed to cool for about 1 minute. They were then opened and their contents were
retained in glass vials and stored in a dark, cool cabinet.
It is important to note that the temperature inside the reactor was not the same as
the sand bath temperature in the feasibility experiments. The synthesis took place under
non-isothermal conditions as the batch holding times we explored (<3 min) coincided
with the reactor heat up time. This mode of operation was not problematic because the

44
method of heat-up yielded reproducible results. Moreover, our goals in this work are to
assess the feasibility of hydrothermal syntheses and to determine the effects of different
process variables. Non-isothermal reaction conditions do not hinder the accomplishment
of these goals. Figure 4.2 shows the measured temperature inside the reactor as a
function of the time elapsed since being placed in the sand bath.
Core-shell CdSe/CdS nanocrystals were prepared as follows (based on a
procedure by others [1]): 15 µL of a 4x10⁻²
M solution of thioacetamide was added to an
already-prepared solution (~1.5 mL) of CdSe nanocrystals synthesized under the base
case conditions. The solution was transferred to a reactor and tightly sealed.
Subsequent steps were identical to those for synthesizing the bare CdSe nanocrystals.

45
Figure 4.2. Reactor heat-up profile for a batch reactor in a sand bath at 200 C for 3
minutes. A Type-K thermocouple was inserted through a bored Swagelok reducing
union at one end of the reactor.
0
20
40
60
80
100
120
140
160
180
200
0 1 2 3
Tem
per
atu
re,
°C
Time, min

46
4.2.2 Rapid Hot-injection and Kinetics Studies
The procedure to prepare the reagents for this study was identical to that for the
feasibility study up to the point of pH adjustment. After the sodium hydroxide was added
to the cadmium/sodium citrate solution, the reactor assembly, comprising a batch reactor
fitted with the bellows valve, was placed in the preheated sand bath and allowed to heat
for at least 3 minutes. The selenourea solution, described in the feasibility section, was
made at the last possible moment minimize reaction with the oxygen in the atmosphere.
Once the reagents were mixed thoroughly in the glass vial, a syringe was used to
withdraw approximately 2 ml of solution. The contents in the syringe were immediately
injected into the open port of the valve. The valve was quickly closed, and the reaction
was allowed to take place. At the appointed time, the reactor assembly was then quickly
withdrawn from the sand bath and submerged into an ice water bath where the reactor
contents were allowed to cool. The reactors were then opened and their contents were
retained in glass vials and stored in a dark, cool cabinet to await analysis.
Table 4.2 summarizes the quantities of materials used in the stock solutions, vials and
batch reactors.

47
Cadmium Selenium
Sodium
Citrate Water
Molecular
Weight 311.30 g 151.07 g 294.10 g 18.00 g
Amount in
stock solution 0.1245 g ------ 0.1000 g 50 ml
# of moles in
stock solution 4.0x10
-4 ------ 3.4x10
-4 -----
Amount in vial 4.0x10⁻⁵
moles 5.0x10⁻⁶
moles 3.4x10⁻⁵
moles 5 ml
Amount in a
reactor 1.12x10
-5 moles
1.40x10
-6 moles 9.52x10
-6 moles 1.54 ml
Table 4.2. Amounts and concentrations of the cadmium and selenium precursors and the
capping agent (sodium citrate) used for the base case synthesis for one batch reactor.
Each was modified accordingly as process variables changed for each investigation.

48
4.3 Analysis
4.3.1 Photoluminescence Emission
Spectroscopic analysis was performed on as-prepared aqueous solutions of
nanocrystals. Photoluminescence spectra were acquired for each sample by using a
modular Fluorolog 3 SPEX spectrofluorimeter. Using a pipette, the stored sample was
placed in a rinsed 1-cm quartz cuvette. The cuvette was placed into the sample holder.
For all cases, the excitation wavelength was programmed to 380 nm and emission was
monitored from 400 to 750 nm. After the scan was completed, the fwhm of the spectrum
was obtained by using the fluorimeter’s Datamax software built-in statistical analysis.
4.3.2 Absorption
Absorption spectra were acquired on a HP8453 diode array Hewlett-Packard
spectrophotometer with a cell temperature of 25 °C. Using a pipette, the stored sample
was placed in a clean 1-cm quartz cuvette. The instrument software was programmed to
run in manual mode at fixed wavelength. This allowed us to readily examine the
absorbance at desired wavelengths. Prior to data acquisition, a blank was used to
calibrate. The cuvette full of sample was loaded into the sample holder and the data
acquisition proceeded.
4.3.3 Quantum Yield
Determining absolute quantum yields (QY) are difficult, but one can find the
relative quantum yield of a sample in reference to a standard. In order to calculate an
accurate quantum yield, it is necessary to avoid high concentrations of sample solution

49
which can give rise to multiple scattering processes. The standard and sample solutions,
therefore, need to be diluted. For our samples, a Rhodamine B standard was used as our
organic standard. The diluents used were ethylene glycol and deionized water for
Rhodamine B and the CdSe samples, respectively. Our goal was to obtain an absorption
of .08 at an excitation wavelength of 380. We began by diluting Rhodamine B with
ethylene glycol and loading into a 1-cm quartz cuvette. We selected a fixed wavelength
of 380 nm then followed the procedure described for the UV-vis absorption analysis. We
repeatedly diluted each analyzed solution until the absorption was .08, or slightly less, for
a wavelength of 380 nm. We then proceeded to collect fluorescence data for the diluted
standard by following the procedure described for acquiring photoluminescence emission
spectra. Once the data for the Rhodamine B was collected, we proceeded to collect the
data for the CdSe sample by following the procedure used for Rhodamine B. Our only
difference was the use of a different diluent which was deionized water rather than
ethylene glycol.
After the data was collected, we used Equation (1.6) to determine QY. We
obtained the integrated intensities of the photoluminescence spectra from the
fluorimeter’s Datamax software built-in statistical analysis.
4.3.4 TEM
High-resolution transmission electron microscopy was performed on a JEOL
3011 HRTEM microscope operating at 300 kV. Samples were prepared by drying a drop
on a 300 mesh copper grid pre-coated with thin hole-y carbon film. Images were
recorded on a Gatan 794 slow scan CCD TV system.

50
4.4 Bibliography
1. Rogach, A. L.; Nagesha, D.; Ostrander, J. W.; Giersig, M.; Kotov, N. A. "Raisin
Bun"-Type Composite Spheres of Silica and Semiconductor Nanocrystals. Chem.
Mater. 2000, 12, 2676-2685.

51
Chapter 5
Feasibility Study
In this chapter, we test the hypothesis that the synthesis of CdSe nanocrystals in
high-temperature water will yield nanocrystals that exhibit quantum behavior. This will
be defined by a blue shift of the photoluminescence emission. We will also verify the
presence of nanocrystals through TEM. We will test the quality of the CdSe nanocrystals
by calculating a quantum yield.
5.1 Introduction
The purpose of the feasibility study was to conduct exploratory research on the
viability of high-temperature water as a possible reaction medium for the preparation of
CdSe nanocrystals. A previous aqueous-base synthesis method [1] which we adapted
used a conventional microwave oven as a heat source which provided, on average, a
temperature of 70 °C. As noted in a previous chapter, higher temperatures tend to
provide higher quality nanoparticles. Therefore, the goal of this chapter is to provide the
results of a baseline study of CdSe preparation as an extension of previous work to higher
temperature realms not yet studied.

52
5.2 Experimental Methods
We conducted experiments in stainless steel batch reactors as described in
Chapter 4. All analytical methods used for this study include spectroscopy and TEM,
descriptions of which are in Chapter 4. All emission data is displayed as normalized
curves to show only the effect of the experimental conditions on the peak wavelength.
5.3 Results and Discussion
5.3.1 Base Case Synthesis
We chose � = 200 °C, > = 1.5 minutes, a Cd:Se ratio of 8:1, a Cd:stabilizer ratio
of 1.04 and a pH of 9 as the base case conditions for our experiments. Figure 5.1, which
shows the emission spectrum from particles synthesized at these conditions, reveals a
blue shift from the bulk band gap (~700 nm). This shift indicates the existence of
quantum confinement in the nanoparticles. The presence of a strong, single peak
indicates that CdSe is the only nanoparticle being synthesized. If any by-products are
formed, they are irrelevant, and are most likely not in the form of a nanocrystal.
The wavelength at which the peak maximum occurs (λmax) is related to the mean
size of the nanoparticles. Smaller particles emit at shorter wavelengths. Thus, one can
use λmax as an indicator of the mean particle size. Our λmax of 579 nm represents a mean
particle size of approximately 5 nm, as confirmed by HRTEM. Rogach et al.
demonstrate CdSe particles synthesized at 3 and 5 nm, corresponding to approximate
peak wavelengths of 560 and 580 nm, respectively [1].

53
Figure 5.1. Normalized PL emission spectra for CdSe nanocrystals synthesized in high-
temperature water under base case conditions.
0
0.2
0.4
0.6
0.8
1
1.2
520 540 560 580 600 620 640
PL
/PL
(ma
x)
Wavelength, nm
579 nm Cd:Se = 8:1
T = 200 °C
t = 1.5 min

54
The full-width-at-half-maximum (fwhm), which is related to the particle size
distribution, was calculated from the emission spectrum. The fwhm values provide
information about the sample’s monodispersity. An fwhm value of ≤40 nm represents a
narrow size distribution [2, 3]. The fwhm for the base case product was 36 nm.
To verify the reproducibility of the synthesis, we performed additional
independent experiments at the base case conditions. The mean value determined for
λmax is 579 ± 5 nm. The mean value for fwhm is 37 ± 0.5 nm. The uncertainties are the
standard deviations. Given these results, we conclude that the method is reproducible.
Figure 5.2, an HRTEM image of particles obtained at these base case conditions,
further supports the presence of CdSe quantum dots. These images show particles on the
order of about 5 nm diameter.
The quantum yield of the particles produced in this base case was 1.5%, which is
lower than quantum yields of 10-30% for particles synthesized in organic media [4, 5, 6].
The yield is lower in our experiment, possibly due to weak passivation by sodium citrate
and potential CdSe corrosion due to active oxygen species. As we will report in a later
section, the quantum yield can easily be improved by capping the particles with a CdS
shell in a subsequent hydrothermal treatment. It is also very likely that CdSe with a
higher quantum yield can be synthesized hydrothermally by heating the aqueous reaction
medium before adding the inorganic reactants. This approach would more closely mimic
that used with organic media, and it would allow the particle growth to occur entirely at a
high temperature.

55
Figure 5.2. HRTEM image of CdSe nanocrystals synthesized in high-temperature water under
base case conditions.
56
5.3.2 Effect of Temperature
We explored the effect of temperature within a range of 200 – 215 °C. All other
variables remained at their base case values. Figure 5.3 shows normalized emission
spectra for CdSe crystals synthesized at different temperatures. Table 5.1 provides a
summary of the effect of reaction temperature on λmax and fwhm. The graphic indicates
that as the temperature increases, the nanocrystal size increases. At the higher
temperatures, a cloudy, brownish product was observed, suggesting the presence of larger
CdSe particles with bulk properties.
The fwhm is 36, 37, 39 and 39 nm for the particles synthesized at 200, 205, 210
and 215 °C, respectively. There is a very modest upward trend in these values, but the
increase may be within the bounds of experimental error. Though we cannot completely
rule out the existence of a relationship between temperature and particle size distribution,
the relationship is a weak one if it indeed exists.

57
Figure 5.3. Normalized PL emission spectra for CdSe nanocrystals synthesized in high-
temperature water at different sand bath temperatures.
T, °C λmax, nm fwhm, nm
200 579 36
205 582 37
210 589 39
215 603 39
Table 5.1. A summary of the effect of temperature on the PL emission peak (����) and
size distribution (fwhm).
0
0.2
0.4
0.6
0.8
1
510 530 550 570 590 610 630 650 670
PL
/PL
(m
ax)
Wavelength, nm
T=200 C; λmax = 579 nm
T=205 C; λmax = 582 nm
T=210 C; λmax = 589 nm
T=215 C; λmax = 603 nm
58
5.3.3 Effect of Batch Holding Time
We next focused on the batch holding time. In general, one expects the size of the
nanocrystal to increase with increasing reaction time as more material adds to its surface.
Figure 5.4 shows emission curves for particles synthesized at the same temperature and
Cd:Se ratios, but batch holding times increasing in 30 second increments. Table 5.2
shows the relationship between the batch holding time and the nanocrystal’s properties,
λmax and fwhm. As expected, the nanocrystal’s size (as inferred from λmax) increases as
reaction time increases. The increase in λmax with each additional 30 sec of reaction is
about the same for all peaks except for those from the runs at 1.5 to 2.0 minutes. There is
a larger gap between these two curves. A replicate set of experiments exhibited the same
gap. The precise reason for this gap is not clear, but it seems there may exist a nucleation
and/or growth process that is sensitive to the higher average reactor temperature in the
two-minute experiment.
The fwhm values (34, 34, 36, 36 and 36) are all about the same for the different
synthesis times. These experiments suggest that the size distribution is not affected much
by the reaction time.

59
Figure 5.4. Normalized PL emission spectra for CdSe nanocrystals synthesized in high-
temperature water at different batch holding times.
0
0.2
0.4
0.6
0.8
1
500 550 600 650 700
PL
/PL
(m
ax)
Wavelength, nm
t=30 s; λmax = 561 nm
t=1 min; λmax = 567 nm
t=1.5 min; λmax = 579 nm
t=2 min; λmax = 613 nm
t=2.5 min; λmax = 619 nm

60
t, min λmax, nm fwhm, nm
0.5 561 34
1.0 567 34
1.5 579 36
2.0 613 36
2.5 619 36
Table 5.2. A summary of the effect of reaction time on the PL emission peak (����) and
size distribution (fwhm).

61
5.3.4 Effect of Cd:Se Molar Ratio
A few previous studies showed that the precursor ratios can dramatically
influence the behavior of CdSe synthesis [7, 8, 9]. Donega et al. [8] and Peng [7] both
concluded that an excess of Se, in addition to the judicious choices of other parameters,
yields highly luminescent and nearly monodisperse nanocrystals without any
postpreparative treatment. It must be noted, however, that these two studies involved
organic-based systems. No studies exist on the influence of Cd:Se ratio during
hydrothermal synthesis of the nanocrystals.
Figure 5.5 shows that λmax increases as the Cd:Se ratio increases. Table 5.3
provides a summary of the effect of Cd:Se molar ratio on the λmax and fwhm trends. This
trend indicates that the mean particle size likewise increases. The fwhm of the spectra
decreases from 39 to 36 to 32 nm as the Cd:Se ratio increases from 4:1 to 8:1 to 16:1.
This trend suggests that the size-distribution narrows as the Cd:Se ratio increases, under
the base case conditions for temperature and time, similar to the data previously obtained
for microwave synthesis of CdS [10].

62
Figure 5.5 Normalized PL emission spectra for CdSe nanocrystals synthesized in high-
temperature water at different Cd:Se molar ratios.
Cd:Se λmax, nm fwhm, nm
4 560 39
8 579 36
16 589 32
Table 5.3. A summary of the effect of the Cd:Se molar ratio on the PL emission peak
(����) and size distribution (fwhm).
0
0.2
0.4
0.6
0.8
1
500 520 540 560 580 600 620 640
PL
/PL
(m
ax)
Wavelength, nm
4:1
8:1
16:1

63
5.3.5 Effect of pH
Basic conditions facilitate the coordination of the sodium citrate stabilizer to the
cadmium ion. We wanted to learn the effect of pH on the average particle size during
hydrothermal synthesis. Figure 5.6 shows that the more basic the environment, the
smaller the nanocrystal. Table 5.4 summarizes the effect of pH on λmax and fwhm. This
result is reasonable because as the coordination between the citrate and cadmium ion
strengthens, the particles will become more stabilized and less likely to add more
material. The fwhm steadily increases with pH. The values were 34, 36, 37 and 43 nm at
a pH of 8, 9, 10 and 11, respectively. These results indicate that the particle size
distribution broadened as the pH increased.

64
Figure 5.6. Normalized PL emission spectra for CdSe nanocrystals synthesized in high-
temperature water at different pHs.
pH λmax, nm fwhm, nm
8 582 34
9 579 36
10 572 37
11 562 43
Table 5.4. A summary of the effect of pH on the PL emission peak (����) and size
distribution (fwhm).
0
0.2
0.4
0.6
0.8
1
500 520 540 560 580 600 620 640
PL
/PL
(ma
x)
Wavelength, nm
pH=8; λmax = 582 nm
pH=9; λmax = 579 nm
pH=10; λmax = 572 nm
pH=11; λmax = 562 nm

65
5.3.6 Effect of Stabilizer Loading
The sodium citrate stabilizer helps to control the size of the nanocrystal. The
literature suggests that using larger amounts of stabilizer would yield smaller
nanocrystals [11]. We observed an opposite trend. Figure 5.7 shows that λmax decreases
(smaller particles) as the amount of stabilizer decreases (increasing Cd:stabilizer ratio).
Being surprised by this result, we repeated the experiments. Precisely the same trend was
observed in the replicate runs. Therefore, we believe the effect in Figure 5.7 is real and
cannot be attributed to random error. This unexpected result may indicate that the
nucleation and growth processes in this system somehow differ from those in other
systems previously explored. Clearly, further research is warranted to understand the
effects of the sodium citrate stabilizer on the nanocrystal growth rate. Unlike the mean
particle size, the range of the size distribution is virtually unaffected by the increase in
stabilizer loadings. The fwhm values were 36, 35, 35 and 36 at the four different
Cd:stabilizer ratios. Table 5.5 shows the summary of the effect of stabilizer loading on
λmax and fwhm.
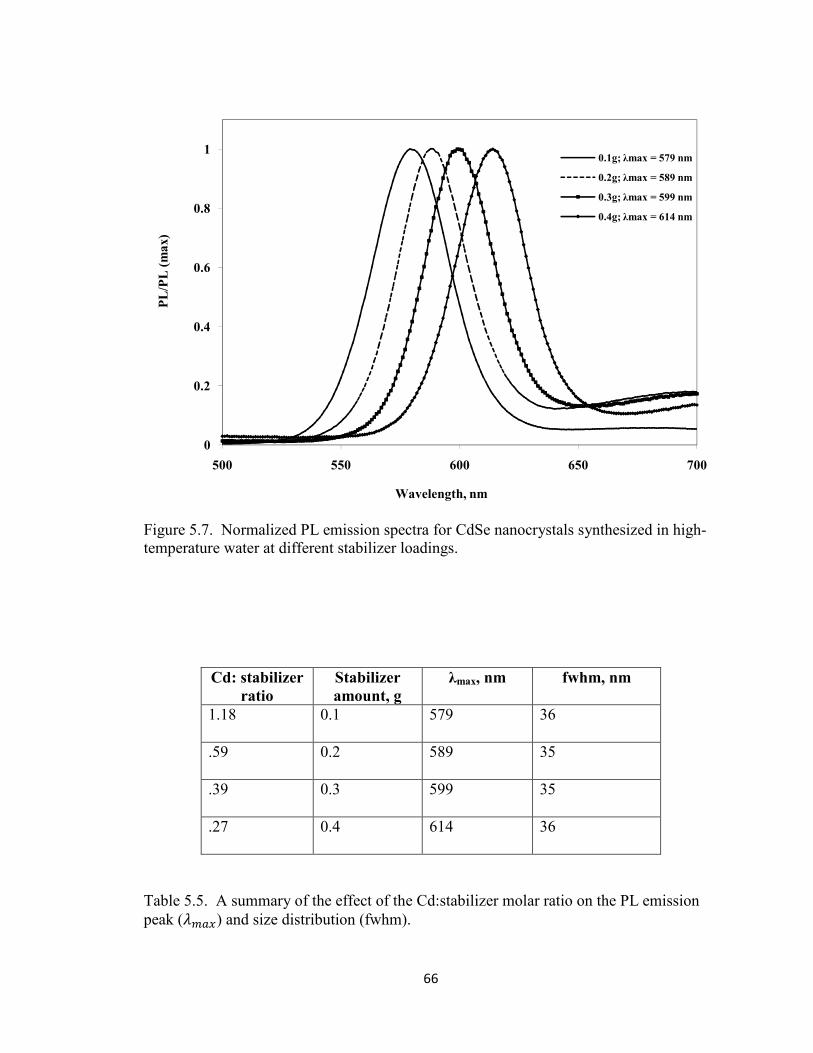
66
Figure 5.7. Normalized PL emission spectra for CdSe nanocrystals synthesized in high-
temperature water at different stabilizer loadings.
Cd: stabilizer
ratio
Stabilizer
amount, g
λmax, nm fwhm, nm
1.18 0.1 579 36
.59 0.2 589 35
.39 0.3 599 35
.27 0.4 614 36
Table 5.5. A summary of the effect of the Cd:stabilizer molar ratio on the PL emission
peak (����) and size distribution (fwhm).
0
0.2
0.4
0.6
0.8
1
500 550 600 650 700
PL
/PL
(m
ax)
Wavelength, nm
0.1g; λmax = 579 nm
0.2g; λmax = 589 nm
0.3g; λmax = 599 nm
0.4g; λmax = 614 nm

67
5.3.7 Improving Quantum Yield
The addition of an outer shell layer to CdSe nanocrystals is known to improve the
quantum yield. For example, the methods of Rogach et al. for low-temperature aqueous
phase synthesis increased the quantum yield from 0.15 to 4.2% by adding a layer of CdS
[1]. The shell serves to passivate the crystal’s surface, decreasing the number of defects
that a bare crystal tends to possess. The quantum yield in the present experiments
increased from 1.5% (base case) to approximately 7% by adding a CdS shell. This result
shows that CdSe nanoparticles with quantum yields of at least 7% can be prepared from
the one-pot hydrothermal synthetic methods we described herein.
5.4 Summary
The one-pot synthesis of CdSe nanoparticles in high temperature water has been
demonstrated for the first time. Hydrothermal synthesis at T=200 °C, Cd:Se=8:1, t=1.5
minutes produced CdSe nanocrystals that exhibit quantum confinement behavior as
characterized by the blue shift of a strong emission peak and the ability to fluoresce. The
nanoparticle size and overall size distribution depended on the reaction temperature,
batch holding time, Cd:Se molar ratio, pH and Cd:stabilizer ratio. The size increased
with an increase in reaction temperature, time, stabilizer concentration and Cd:Se ratio
and, a with a decrease in pH. This trend with the stabilizer loading was unexpected. It
suggests that this hydrothermal synthesis method may provide new opportunities to
engineer nanoparticle production systems. It also suggests that the chemistry of CdSe
nanoparticle synthesis in HTW might differ from that in coordinating organic solvents.

68
The quantum yield proved to be low for the base-case CdSe crystals. The
addition of a CdS shell, which can be done easily in HTW, increased the quantum yield
to approximately 7%. The low quantum yield for the bare particle (1.5%) could be a
result of allowing both nucleation and growth to occur together in the reactor system.
One potential remedy is to develop a method of injecting the molecular precursors into
preheated high temperature water.
69
5.5 Bibliography
1. Rogach, A. L.; Nagesha, D.; Ostrander, J. W.; Giersig, M.; Kotov, N. A. "Raisin
Bun"-Type Composite Spheres of Silica and Semiconductor Nanocrystals. Chem.
Mater. 2000, 12, 2676-2685.
2. Murray, C. B.; Norris, D. J.; Bawendi, M. G. Synthesis and Characterization of
nearly Monodisperse Cde (E = S, Se, Te) Semiconductor Nanocrystallites. J. Am.
Chem. Soc. 1993, 115, 8706-8715.
3. Michalet, X.; Pinaud, F.; Lacoste, T. D.; Dahan, M.; Bruchez, M. P.; Alivisatos, A.
P.; Weiss, S. Properties of Fluorescent Semiconductor Nanocrystals and their
Application to Biological Labeling. Single Mol. 2001, 2, 261.
4. Murray, C. B.; Nirmal, M.; Norris, D. J.; Bawendi, M. G. Synthesis and Structural
Characterization of Ii-Vi Semiconductor Nanocrystallites (Quantum Dots). Zeits. Fur
Phys. D 1993, 26, S231-S233.
5. Asokan, S.; Krueger, K., M; Alhkawaldeh, A.; Carreon, A., R; Mu, Z.; Colvin, V., L;
Mantzaris, N., V; Wong Michael, S. The use of Heat Transfer Fluids in the Synthesis
of High-Quality CdSe Quantum Dots, core/shell Quantum Dots, and Quantum Rods.
Nanotechnology 2005, 16, 2000.
6. Qu, L. H.; Peng, Z. A.; Peng, X. G. Alternative Routes Toward High Quality CdSe
Nanocrystals. Nano Lett. 2001, 1, 333-337.
7. Peng, Z. A.; Peng, X. Formation of High-Quality CdTe, CdSe and CdS Nanocrystals
using CdO as a Precursor. J. Am. Chem. Soc. 2001, 123, 183.
8. Donega, C. D.; Hickey, S. G.; Wuister, S. F.; Vanmaekelbergh, D.; Meijerink, A.
Single-Step Synthesis to Control the Photoluminescence Quantum Yield and Size
Dispersion of CdSe Nanocrystals. J Phys Chem B 2003, 107, 489-496.
9. Peng, X. G.; Wickham, J.; Alivisatos, A. P. Kinetics of II-VI and III-V Colloidal
Semiconductor Nanocrystal Growth: "Focusing" of Size Distributions. J. Am. Chem.
Soc. 1998, 120, 5343-5344.
10. Ni, T.; Nagesha, D. K.; Robles, J.; Materer, N. F.; Mussig, S.; Kotov, N. A. CdS
Nanoparticles Modified to Chalcogen Sites: New Supramolecular Complexes,
Butterfly Bridging, and Related Optical Effects. J. Am. Chem. Soc. 2002, 124, 3980-
3992.
11. Sun, S.; Murray, C. B.; Doyle, H. Controlled Assembly of Monodisperse ε-Cobalt-
Based Nanocrystals. Mater. Res. Soc. Symp. Proc. 1999, 385-398.

70
Chapter 6
Rapid Hot-injection Method
In the previous chapter, we demonstrated the formation of CdSe nanocrystals
using high-temperature water as a reaction solvent. But, we speculated that the
nucleation and growth dynamics were not conducive to creating high-quality
nanocrystals. In this chapter, we test the hypothesis that by using a rapid hot-injection
method similar to convention, we will be able to affect nucleation and growth dynamics,
possibly separating the two more than what the previous method allowed.
6.1 Introduction
The upsurge in the study of CdSe nanocrystals began with the trailblazing work
performed by Murray et al. where high quality nanocrystals were obtained, not only due
to reaction conditions, but, in part because of the synthetic route. Their synthesis began
with the injection of a cold precursor solution into a hot reaction solvent, causing the
formation of nuclei. Because the solvent temperature dropped, the formation of new
nuclei ceased, and the system contained relatively monodisperse nuclei and enough free
cadmium and selenium ions to establish a slow growth at a temperature lower than the
injection temperature. Researchers [1, 2, 3, 4, 5, 6, 7] later adapted the Murray method,
producing nanocrystals with various physical attributes. Murray et al. set the precedent

71
for a requisite strategy for obtaining high-quality, uniform nanocrystals: the separation of
nucleation and growth. The adoption of separate nucleation and growth events as an
important concept in nanocrystal synthesis was made possible from the work performed
by LaMer and Dinegar [8]. They showed that a monodisperse preparation of colloids
was best achieved by producing just one “brief outburst” of nuclei, leaving enough free
monomer to then produce growth by diffusion. This outburst was consistent with
classical nucleation theory which states that under a condition of supersaturation and thus
high free energy, clusters of monomer can form as a means of relieving the energy.
Murray et al. [9] believed that the temperature of the solution was sufficient to
decompose the reagents and, upon injection, form a supersaturated solution. The
resulting high free energy was relieved by nucleation of nanocrystals wherein the
concentration of the monomer dropped below a critical concentration required for
nucleation. Growth was then allowed on existing nuclei, the rate of which depended on
the temperature.
Donega et al. [10] evaluated the phenomenology of nucleation within the
framework of the rapid hot-injection method. They concluded that while it is doubtful
that the classical theory can be quantitatively applied to the formation of nuclei in the
hot-injection method, it can provide a qualitative basis for it. Their explanation is in
agreement with Murray’s.

72
Our hot-injection method is different from convention in that we do not inject a
cold fluid into a hot fluid, but, rather, into a hot metal chamber. The cold fluid comes
into immediate contact with a metal surface, much like pouring cold water into a hot pan
on the stove. When this occurs, there is an instantaneous formation of bubbles. It could
stand to reason that similar bubbles form when injecting the cold precursor solution into
the hot reactor, and the bubbles themselves serve as nucleation sites. So, while we do not
affect the saturation limit of the precursor solution, we may provide an opportunity to
induce nucleation due to the temperature differential.
6.2 Experimental Methods
We conducted experiments in stainless steel batch reactors fitted with a high-
temperature rated bellows valve as described in Chapter 4. All analytical methods used
for this study include spectroscopy and TEM, descriptions of which are in Chapter 4. All
emission data is displayed as normalized curves to show only the effect of the
experimental conditions on the peak wavelength.
6.3 Results and Discussion
6.3.1 Base Case Synthesis
The following conditions were chosen as a base case: � = 200 °C, > = 2 minutes,
?@ = 9, Cd:stabilizer molar ratio = 1.18, Cd:Se molar ratio = 8:1. Similar to what was
observed in the feasibility study, the emission spectrum does undergo a blue shift from
the bulk band gap (~700 nm), indicating the existence of quantum confinement.

73
Figure 6.1. Normalized PL peak spectra for CdSe nanocrystals synthesized in high-
temperature water using the rapid hot-injection (base case conditions) and cold injection
(conditions identical to those for rapid hot-injection) methods.
0
0.1
0.2
0.3
0.4
0.5
0.6
0.7
0.8
0.9
1
500 520 540 560 580 600 620 640 660
PL
/PL
max
Wavelength, nm
Cold-injection
Method
Rapid Hot-Injection
Method
λmax = 563 nm λmax = 613 nm

74
The mean size of the nanocrystals formed by the rapid hot-injection method is smaller
(λmax = 563 nm) than that formed by the method conducted in the feasibility study under
the same conditions (λmax = 613 nm) (Figure 6.1). An analysis by HRTEM (Figure 6.2)
confirms that the mean particle size (about 3.5 nm) is indeed smaller. The cold-injection
method yielded a mean particle size of approximately 5 nm based on HRTEM. The sizes
were also determined by using the effective mass approximation and were calculated to
be 4.9 nm for the rapid hot-injection study and 5.2 nm for the feasibility study. The
effective mass approximation, although not precise for small nanocrystals, does confirm
the effects of quantum confinement and the rapid hot-injection method producing smaller
particles.
For the base case, repeat experiments resulted in an average λmax of 557 A76.5 nm,
where the uncertainty is the standard deviation. We did not repeat experiments for all
conditions, but the standard deviation observed at the base case likely applies to the other
experiments that were conducted.
The fluorescence intensity of the nanocrystals formed under the rapid hot-
injection conditions is a little more than half of that formed under the cold-injection
method (Figure 6.3). Nakamura prepared CdSe in a microflow reactor and observed
weak intensities by the smaller particles [11].

75
Figure 6.2 HRTEM image of CdSe nanocrystals produced by rapid hot-injection under
base case conditions.
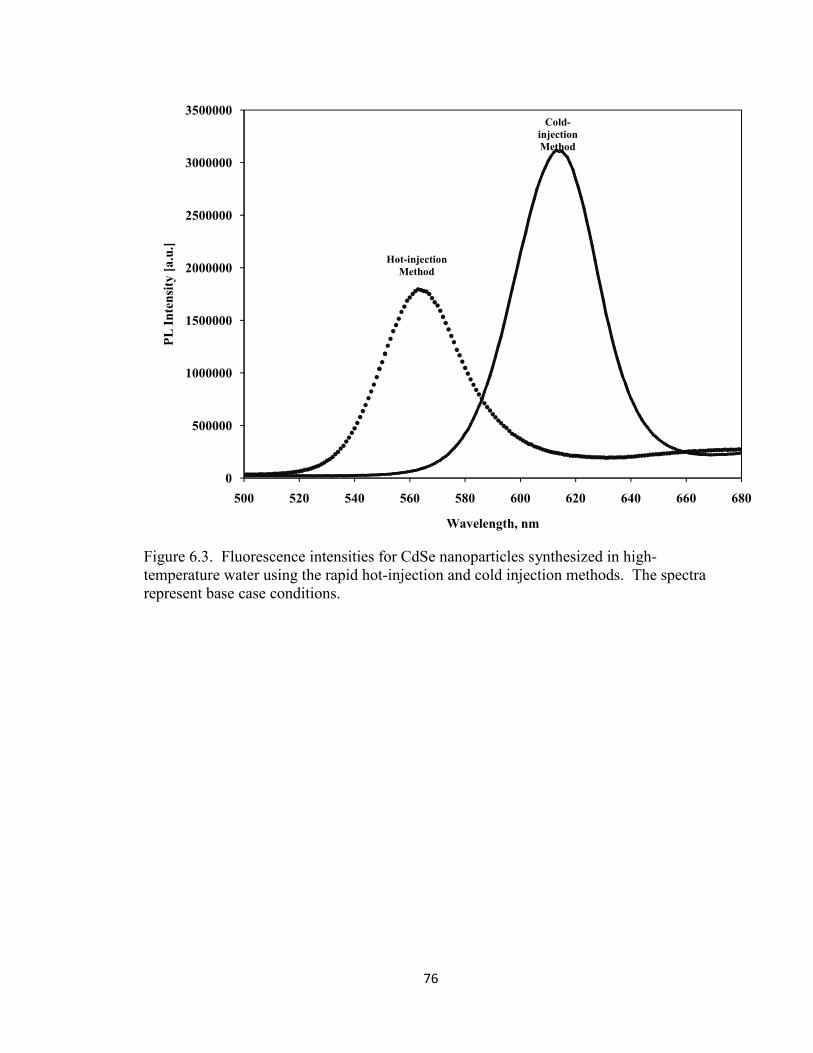
76
Figure 6.3. Fluorescence intensities for CdSe nanoparticles synthesized in high-
temperature water using the rapid hot-injection and cold injection methods. The spectra
represent base case conditions.
0
500000
1000000
1500000
2000000
2500000
3000000
3500000
500 520 540 560 580 600 620 640 660 680
PL
In
ten
sity
[a
.u.]
Wavelength, nm
Cold-
injection
Method
Hot-injection
Method

77
The full-width-at-half-max (fwhm) was determined from the emission spectrum
to be 35 nm. The fwhm for the nanocrystals formed under the cold-injection method with
the same conditions is 36 nm. There does not seem to be any difference in the degree of
monodispersity for the two methods. For the base case, repeat experiments resulted in an
average fwhm of 35.7 A71.1 nm. Again, this measure of the random error is likely
applicable to all other experiments that were conducted. Since a narrow size distribution
can be defined as fwhm ≤ 40 nm [9], we can conclude that the base case for rapid hot-
injection has a rather narrow size distribution.
The quantum yield for the base case was calculated to be 0.99 %. This is not
much different from the quantum yield calculated for the base case under the cold-
injection method (1.5%), even though the batch holding times are different (2 minutes for
rapid hot-injection vs. 1.5 minutes for cold-injection). The presence of the weaker
emission also supports the lower quantum efficiency, which may arise from either
inadequate surface passivation or deep trapped emission due to surface defects. It is
easier to tune the particle properties by modifying the surface via passivation, something
we investigated and will discuss later.
6.3.2 Effect of Temperature
The temperature dependence of nanoparticle size and quality was investigated for
a range of 200 – 240 °C. All other variables remained at their base case values.
Normalized PL emission profiles are displayed in Figures 6.4 and 6.5. Table 6.1 shows
the fwhm and quantum yield for the particles obtained at each temperature.

78
Figure 6.4. Normalized PL emission spectra for CdSe nanocrystals synthesized in high-
temperature water at different sand bath temperatures.
0
0.1
0.2
0.3
0.4
0.5
0.6
0.7
0.8
0.9
1
500 520 540 560 580 600 620 640
PL
/PL
max
Wavlength, nm
T=200 C ;λmax=563 nm
T=210 C ;λmax=566 nm
T=220 C ;λmax=565 nm
T=230 C ;λmax=567 nm
T=240 C ;λmax=565 nm

79
Figure 6.5. Profile of peak intensities for CdSe nanocrystals synthesized in high-
temperature water at different sand bath temperatures.
T, °C λmax, nm fwhm, nm QY, %
200 563 35 .99
210 566 38 5.7
220 565 37 5.5
230 567 37 5.3
240 565 37 4.9
Table 6.1. A summary of the effect of temperature on the PL emission peak (����), size
distribution (fwhm) and quantum yield (QY).
0
500000
1000000
1500000
2000000
2500000
0.9 0.95 1 1.05 1.1
PL
In
ten
sity
[a
.u.]
Normalized Wavelength
T=200 C
T=210 C
T=220 C
T=230 C
T=240 C

80
The temperature seems to have very little effect on the particle’s mean size, as
indicated by the small differences in the λmax values. A temperature range of 40 °C
resulted in a λmax range of only 4 nm, which is definitely within the experimental
uncertainty of ±6.5 nm. It should be noted that we were able to explore a much wider
range of temperatures with the rapid hot-injection method, as the final product did not
convert to bulk cadmium selenide. The highest temperature for the cold-injection method
was 215 °C as this was a temperature that would still yield cadmium selenide
nanocrystals in the time scale we could investigate experimentally. With a temperature
range of 15 °C, we observed a 20 nm range in λmax.
Though the temperature does not affect the nanocrystal’s size for the rapid hot-
injection method, we recognize that the reaction time was only two minutes. It is
possible that this reaction time may be too short to exhibit any significant growth. It is
also possible that the rapid-injection method may have contributed to this phenomenon
because of the nucleation. Dushkin et al. [12] assert that the nucleation event can, and
does, define the subsequent growth behavior. Bullen et al. [4] studied nucleation and
growth of CdSe nanocrystals in a non-coordinating solvent, observing effects of
temperature, among other variables. They observed smaller nuclei and final particle sizes
as the temperature increased. They suggest that at higher temperatures, nucleation events
are faster, nuclei concentration increases and growth kinetics are less strongly dependent
on temperature. This scenario may help explain the results we obtained. As the
concentration of CdSe nuclei increases with an increase in temperature, the availability of
monomer decreases. With a lack of material to add to existing nuclei, further growth is
slowed tremendously.

81
Table 6.1 shows that the temperature has very little effect on the size distribution
within the experimental temperature range, or, on the quantum yield. The quantum yield
for T = 200 °C is considerably lower than those for the remaining temperatures. It is
important to note that this rapid injection method did achieve quantum yields much
higher than those obtained for the base case from the previous method (QY = 1.5%).
Although we did not calculate quantum yields for all cases in the cold-injection method,
it is likely that the yields would not have increased with an increase in temperature since
the nanoparticle size increased dramatically.
It has long been recognized [9, 13] that the growth stage following a nucleation
event, if controlled, can increase the quantum yield due to thermal annealing. It is
believed that the growth of the nanoparticle allows the surface to restructure through the
addition of material. The surface can reorganize by adding ligands needed to passivate
dangling cadmium ions and eliminating trapped surface charges to allow for proper
electron-hole recombination. Because we observed no appreciable increase in the mean
size of the nanocrystal at higher temperatures, we would not expect the quantum yield to
change very much with temperature. The temperature increase may have only served to
create additional nuclei, thereby influencing the physical properties of the system, rather
than the nanoparticle’s surface properties. This scenario is consistent with the quantum
yields at 210 – 240 °C in Table 6.1 being essentially independent of temperature. This
does not explain the sudden increase in quantum yield from T=200 °C to the higher
temperatures.

82
The general trend observed in relation to temperature and nanocrystal intensity
was that the highest reaction temperature yielded the brightest nanocrystal (Figure 6.5).
We believe that this is due to thermal annealing of the surface.
The temperature of the system is crucial in the overall growth and final size of
CdSe nanoparticles, especially under the rapid injection method. Murray et al. pioneered
this method, which involved injection of a cold fluid into a hot solvent. The injection led
to the instantaneous formation of CdSe nuclei. The subsequent drop in temperature, due
to injection of the cold precursor solution, helped to prevent formation of new nuclei.
Consequently, a manual increase in the temperature led to a slow growth of the
nanoparticles. One difference in our system is that we did not inject the cold precursor
solution into a hot solvent, but rather into a hot empty metal reactor. We speculate that
a nucleation event was induced simply because of the temperature. The reactor
temperature probably decreased upon injection which limited nucleation. As for the
growth, it occurred at roughly the same temperature as the injection. Based on the
success of others’ hot-injection synthetic routes, we hypothesize that nucleation and
growth were more discrete events in this hot-injection method than in the injection
method discussed in the previous chapter.
6.3.3 Effect of Reaction Time
Time, as a synthesis condition, has been studied to assess its effects on
nanoparticle size and overall quality. With all other parameters remaining constant, we
should expect the size of the nanocrystals to increase with an increase in reaction time.
This is because more material is allowed to add to existing nanoparticles. Figures 6.6 and

83
6.7 show the temporal evolutions of nanoparticle size (as inferred from λmax) and
intensity in a time range of 10 minutes from synthesis at 200 °C. As indicated by the
increase in λmax, appreciable growth occurs within the entire 10 minute time span.
We observed no consistent trend in the peak intensity. The base case time of 2
min exhibits the largest intensity. There seems to be an alternating increase/decrease in
intensity as the time increases.

84
Figure 6.6. Normalized PL emission spectra for CdSe nanocrystals synthesized in high-
temperature water at different reaction times.
0
0.1
0.2
0.3
0.4
0.5
0.6
0.7
0.8
0.9
1
500 520 540 560 580 600 620 640
PL
/Pl m
ax
Wavlength, nm
t=1 min; λmax=552nm
t=2 min; λmax=563nm
t=4 min; λmax=566 nm
t=6 min; λmax=572 nm
t=8 min; λmax=579 nm
t=10 min; λmax=589 nm

85
Figure 6.7. Profile of PL peak intensities for CdSe synthesized in high-temperature water
at different reaction times.
0
200000
400000
600000
800000
1000000
1200000
1400000
1600000
1800000
2000000
0.9 0.95 1 1.05 1.1
PL
In
ten
sity
[a
.u.]
Normalized Wavelength
t=1 min
t=2 min
t=4 min
t=6 min
t=8 min
t=10 min

86
Table 6.2 shows the effect of reaction time on λmax , the fwhm, and the quantum yield.
The fwhm values show a modest change, with the largest value at 4 minutes and at 8
minutes. It is unclear whether there is a true increase in fwhm from > = 1 to 4 minutes
and then a decrease from > = 4 to 10 minutes. It does appear that the smaller fwhm
values correlate with the lower quantum yields.
t, min λmax, nm fwhm, nm QY, %
1 555 35 1.1
2 563 35 0.99
4 566 40 1.7
6 572 36 1.1
8 579 40 1.3
10 589 33 0.71
Table 6.2. A summary of the effect of reaction time on the PL emission peak (����),
size distribution (fwhm) and quantum yield (QY).

87
The feasibility study and this study did reveal similar trends (increase in time
yielded an increase in size), but we did find that this study produced smaller
nanoparticles. For the feasibility study, a 2.5 min reaction time span produced
nanoparticles with λmax = 619 nm. An increase in time (> ≥ 3 min) resulted in brownish-
red precipitate forming, indicating larger bulk CdSe particles. For the rapid hot-injection
study, we were able to react for 10 minutes and produce nanoparticles with a λmax = 589
nm. This outcome may be a function of the synthesis method as we allowed contact of
the cold precursor solution with a hot metal surface. Small bubbles may have formed on
the surface of the reactor, acting as the sites for nuclei on which the bulk material would
grow.
We did not observe any effect of time on the fwhm for the feasibility study and
we are reluctant to declare the existence of any trend under the rapid hot-injection
method. Even when we have assumed, from the base case, that a 95% confidence
interval of ± 1.1 nm can be applied for all of our experiments, we still cannot conclude
that the initial increase in the fwhm followed by the decrease may in fact be real.
An increase in the reaction time will increase the size of a nanoparticle since there
is more time for material to move from the bulk to the nanoparticle’s surface. This
observation was also apparent in the feasibility study and is not a new concept. Since
nanoparticle size is the most important physical attribute, the application of time, in the
context of nanoparticle synthesis, is useful when analytical expressions can be derived
and used to describe the evolution of nanocrystal growth. We will discuss, in more
detail, the aspect of time in regards to the growth kinetics in Chapter 7.

88
6.3.4 Effect of Cd:Se Molar Ratio
Since the surface of the nanocrystal plays such a crucial role in affecting the
overall quality of the nanocrystal, a systematic control of the ratio of metal precursors
could in turn control and improve the photoluminescence qualities [13]. Figures 6.8 and
6.9 show normalized emission spectra and a profile of peak intensities for CdSe
nanocrystals synthesized at 200 °C and different Cd:Se molar ratios. Table 6.3 further
shows the effect of the different molar ratios on the fwhm and the quantum yield.
Our results reveal that the initial Cd:Se molar ratio is a determining factor for the
emission properties of the synthesized nanocrystals. The size and quantum yield trends
were strongly correlated with the increase in the Cd:Se molar ratio. Figure 6.8 reveals a
decrease in nanoparticle size as the Cd:Se molar ratio increases. This is expected with
our system since we did not change the number of cadmium ions for each experiment.
Thus, the Cd:stabilizer molar ratio remained constant. We did vary, however, the
selenium concentration. With less selenium monomer available for particle growth, the
size of the nanoparticle should decrease.
Table 6.3 shows that while the fwhm is virtually unaffected by the initial Cd:Se
ratio, the quantum yield increases. It is possible that with fewer dangling Se bonds, fewer
trapped emission sites exist, thereby increasing the quantum yield [6, 14].
Our results are in stark contrast to those produced from the cold-injection method,
where a more cadmium-rich environment yielded larger nanocrystals. The cold-injection
method most likely promoted Ostwald ripening. With decreasing amounts of selenium
monomer, the critical particle size required to maintain equilibrium increased so any
particles that remained in solution were at least slightly larger than the critical size. Peng

89
et al. [3] even discuss the importance of injecting additional monomer in order to shift the
critical particle size of the nanoparticle back to a smaller value.
The rapid hot-injection method may have allowed for instantaneous formation of
nuclei, but subsequent growth may have been hindered, possibly due to cadmium-citrate
complexes slowing the rate of additional selenium monomer. At a molar ratio of 40:1,
selenium monomer may have been virtually unavailable for further growth.

90
Figure 6.8. Normalized PL emission spectra for CdSe nanocrystals synthesized in high-
temperature water at different Cd:Se molar ratios.
0
0.1
0.2
0.3
0.4
0.5
0.6
0.7
0.8
0.9
1
500 520 540 560 580 600 620 640
PL
/Pl m
ax
Wavelength, nm
4:1
5.7:1
8:1
16:1
40:1

91
Figure 6.9. Profile of peak intensities for CdSe nanocrystals synthesized in high-
temperature water at different Cd:Se molar ratios.
Cd:Se λmax, nm fwhm, nm QY, %
4:1 568 34 .05
5.7:1 566 34 2.2
8:1 563 35 .99
16:1 553 34 3.9
40:1 543 35 4.9
Table 6.3. A summary of the effect of the Cd:Se molar ratio on the PL emission peak
(����), size distribution (fwhm) and quantum yield (QY).
0
500000
1000000
1500000
2000000
0.9 0.95 1 1.05 1.1 1.15
PL
In
ten
sity
[a
.u.]
Normalized wavelength
4:1
5.7:1
8:1
16:1
40:1

92
Numerous researchers have studied the characteristics of CdSe grown in excess
selenium [6, 13, 15]. A selenium-rich environment promoted a faster nucleation process,
higher quantum yields and narrower size distributions. Conversely, cadmium-rich
systems resulted in fewer nuclei formed, slow nucleation, and low quantum yields [6].
We did not carry out experiments in excess of selenium because the selenium precursor
reacted with oxygen from the air. In spite of this limitation, our results do show that the
surface chemistry, as modified by the changing the Cd:Se molar ratio, is indeed a major
influence of the nanoparticle’s quality. These parameters had the most dynamic affect on
the quantum efficiency.
6.3.5 Effect of pH
The results obtained from experiments using the cold-injection method showed
that a higher basicity yielded smaller particles. We observed a similar trend for the rapid
injection method (Figure 6.10). The emission peak from nanoparticles synthesized (200
°C) at a pH of 7 is much less defined in the rapid injection method, primarily due to the
extremely weak intensity (Figure 6.11). Nanoparticles synthesized at higher pH values
exhibit more intense emission and do generate well-defined peaks. The nanoparticle size
decreases from the base case condition (pH = 9) as pH increases and yields more intense
emission spectra. Additionally, the quantum efficiency increases with the increase in pH
from the base case condition.
Our results imply that, in the presence of increased alkalinity, cadmium citrate
complexes are more strongly bound, stabilizing growth (smaller nanocrystal) and
electronically passivating the surface (stronger emission peak). Furthermore, cadmium
adsorption to the nanocrystal may be stronger, since it is widely known that cadmium

93
ions tend to desorb at low pH values [16]. This increased affinity for the surface would
aid in creating a more optimal surface structure, and with the cadmium’s increased
affinity to the citrate, reducing dangling bonds.
Gao et al. [17] observed enhanced fluorescence for CdTe nanoparticles prepared
in low pH in an aqueous solution. They conclude that the particle surface coverage with
thiol ligands is increased in acidic CdTe solutions. They suggest that a thick layer of
cadmium thiol complexes is formed on the nanoparticle’s surface and can be considered
as a wide-band gap material, making it analogous to CdS or ZnS passivation shell around
the CdTe core. Although our nanoparticles are prepared in the presence of a higher pH,
this same type of pH-sensitive phenomenon could very well be occurring in our system.
For pH values above 9, we observed a reaction after the selenium precursor was
injected into the cadmium and citrate solution. The color of the solution began to change
while remaining optically clear, indicating the formation of CdSe. Thus, it seems that a
chemically-induced nucleation event occurred. Subsequent injection of the solution into
the hot reactor prompted a separate thermally-induced nucleation event. The initial CdSe
nuclei may have been shrouded with cadmium citrate complexes, delaying any additional
material to be adsorbed onto the particle during the thermal growth event. The thermally-
induced nuclei may not have had much material addition due to fewer free cadmium and
selenium ions available for appreciable growth.

94
Figure 6.10. Normalized PL emission spectra for CdSe nanocrystals synthesized in high-
temperature water at different pHs.
0
0.1
0.2
0.3
0.4
0.5
0.6
0.7
0.8
0.9
1
450 470 490 510 530 550 570 590 610 630
PL
/Pl m
ax
Wavelength, nm
pH=7
pH=8
pH=9
pH=10
pH=11

95
Figure 6.11. Profile of peak intensities for CdSe nanocrystals synthesized in high-
temperature water at different pHs.
pH λmax, nm fwhm, nm QY, %
7 556 N/A .56
8 555 36 3.3
9 563 35 .99
10 560 35 3.8
11 540 36 5.2
Table 6.4. A summary of the effect of pH on the PL emission peak (����), size
distribution (fwhm) and quantum yield (QY).
0
500000
1000000
1500000
2000000
2500000
0.9 0.95 1 1.05 1.1 1.15
PL
In
ten
sity
[a
.u.]
Normalized Wavelength
pH=7
pH=8
pH=9
pH=10
pH=11

96
6.3.6 Effect of StabilizerLloading
We reported earlier that, under the cold injection method, larger amounts of
stabilizer increased the particle size. We observed an identical trend with the rapid-
injection method. As the stabilizer amounts decrease, the mean particle size decreases
and the intensity increases dramatically (Figures 6.12 and 6.13). The data shows that
dispersity increases initially, and then decreases as the nanoparticle size increases. There
does not seem to be a consistent trend between the fwhm and the amount of stabilizer,
although, at higher stabilizer amounts, the fwhm does trend downward. Reasons for this
could be due to there being a small number of particles. The presence of too many citrate
ions in the solution may be preventing the cadmium and selenium ions from attaching.
The sheer number of citrate ions could overwhelm the cadmium, hindering the formation
of many CdSe nuclei, but, at the same time, the citrate could rapidly complex to the
cadmium ion as any nuclei form. Bullen et al. [4] observed this phenomenon while
synthesizing CdSe nanoparticles in hot octadecene. They noticed that the number of
nuclei linearly reduced as more oleic acid (capping agent) was added.
The decrease in the quantum yield with increasing amount of stabilizer may be a
result of limited overgrowth to reconstruct the surface during the growth stage [13]. The
excess citrate may provide a steric hindrance to the selenium monomer as it tries to move
through the bulk to the nanocrystal’s surface. This would increase the chance of there
being dangling cadmium bonds, and would adversely affect the quantum efficiency.

97
Figure 6.12. Normalized PL emission spectra for CdSe nanocrystals synthesized in high-
temperature water at different stabilizer loadings.
0
0.1
0.2
0.3
0.4
0.5
0.6
0.7
0.8
0.9
1
490 540 590 640 690
PL
/PL
ma
x
Wavelength, nm
0.1g
0.2g
0.3g
0.4g
0.5g

98
Figure 6.13. Profile of peak intensities for CdSe nanocrystals synthesized in high-
temperature water at different stabilizer loadings.
Cd: stabilizer
ratio
Stabilizer
amount, g
λmax, nm fwhm, nm QY, %
1.18 0.1 563 35 0.99
.59 0.2 578 40 0.64
.39 0.3 594 37 0.22
.27 0.4 608 32 0.08
.24 0.5 620 19 0.06
Table 6.5. A summary of the effect of the Cd:stabilizer ratio on the PL emission peak
(����), size distribution (fwhm) and quantum yield (QY).
0
200000
400000
600000
800000
1000000
1200000
1400000
1600000
1800000
0.9 0.95 1 1.05 1.1 1.15
PL
In
ten
sity
[a
.u.]
Normalized Wavelength
.1g
.2g
.3g
.4g
.5g

99
6.4 Summary
This chapter highlights the results of using a rapid hot-injection method that is
similar to that found in conventional methods. Our investigation revealed a smaller
nanocrystal (���� = 563 nm) and a similar fwhm (35 nm) compared with Chapter 5’s
cold-injection method (���� = 613 nm; fwhm = 36 nm) under the same experimental
conditions. The QY calculated for the rapid hot-injection method was 0.99%. This is not
much different from the QY calculated for the cold-injection method of 1.5% under the
same experimental conditions except for time, which differed by 30 seconds. We
surveyed the effects of experimental parameters on the size (represented by ����, size-
distribution (represented by fwhm) and QY.
size – an increase in reaction time increased the size, while an increase in Cd:Se molar
ratio, pH and Cd:stabilizer ratio decreased the size. An increase in reaction temperature
did not affect the nanocrystal size.
fwhm – an increase in the reaction temperature, Cd:Se molar ratio and pH did not affect
the fwhm. There seemed to be no consistent trend with the stabilizer loading in general,
but at higher stabilizer loadings, the fwhm tended to decrease.
QY – an increase in Cd:Se molar ratio, pH and Cd:stabilizer molar ratio increased the
QY, but an increase in the reaction temperature and time had no effect on QY
The rapid hot-injection method offers advantages over the cold-injection method
from the previous chapter in that a larger reaction temperature range can be explored. It
is also an adaptation of the preferred injection method since it more readily separates
nucleation from growth. These are reasons why we continued using this method for the
kinetics study presented in the next chapter.

100
6.5 Bibliography
1. Qu, L. H.; Peng, Z. A.; Peng, X. G. Alternative Routes Toward High Quality CdSe
Nanocrystals. Nano Lett. 2001, 1, 333-337.
2. Peng, X. G.; Manna, L.; Yang, W. D.; Wickham, J.; Scher, E.; Kadavanich, A.;
Alivisatos, A. P. Shape Control of CdSe Nanocrystals. Nature 2000, 404, 59-61.
3. Peng, X. G.; Wickham, J.; Alivsatos, A. P. Kinetics of II-VI and III-V Colloidal
Semiconductor Nanocrystal Growth: “Focusing” of Size Distributions. J. Am. Chem.
Soc. 1998, 120, 5343-5344.
4. Bullen, C. R.; Mulvaey, P. Nucleation and Growth Kinetics of CdSe Nanocrystals in
Octadecene. Nano Lett. 2004, 4, 2303-2307.
5. Qu, L. H.; Yu, W. W.; Peng, X. P. In Situ Observation of the Nucleation and Growth
of CdSe Nanocrystals. Nano Lett. 2004, 4, 465-469.
6. Qu, L. H.; Peng, X. G. Control of Photoluminescence Properties of CdSe
Nanocrystals in Growth. J. Am. Chem. Soc. 2002, 124, 2049-2055.
7. Talapin, D. V.; Rogach, A. L.; Kornowski, A.; Haase, M.; Weller, H. Highly
Luminescent Monodisperse CdSe and CdSe/ZnS Nanocrystals Synthesized in a
Hexadecylamine-Trioctylphosphine Oxide-Trioctylphospine Mixture. Nano Lett.
2001, 1, 207-211.
8. LaMer, V. K.; Dinegar, R. H. Theory, Production and Mechanism of Formation of
Monodispersed Hydrosols. J. Am. Chem. Soc. 1950, 72, 4847-4854.
9. Murray, C. B.; Norris, D. J.; Bawendi, M. G. Synthesis and Characterization of
nearly Monodisperse Cde (E = S, Se, Te) Semiconductor Nanocrystallites. J. Am.
Chem. Soc. 1993, 115, 8706-8715.
10. Donega, C. D. M.; Liljeroth, P.; Vanmaekelbergh, D. Physicochemical Evaluation of
the Hot-Injection Method, a Synthesis Rotue for Monodisperse Nanocrystals. Small
2005, 1, 1152-1162.
11. Nakamura, H.; Yamaguchi, Y.; Miyazaki, M.; Maeda, H.; Ueharab, M.; Mulvaney,
P. Preparation of CdSe Nanocrystals in a Micro-Flow-Reactor. Chem. Comm. 2002,
2844-2845.
12. Dushkin, C. D.; Saita, S.; Yoshie, K.; Yamaguchi, Y. The Kinetics of Growth of
Semiconductor Nanocrystals in a Hot Amphiphile Matrix. Adv. Coll. Inter. Sci. 2000,
88, 37-78.

101
13. Donega, C. D.; Hickey, S. G.; Wuister, S. F.; Vanmaekelbergh, D.; Meijerink, A.
Single-Step Synthesis to Control the Photoluminescence Quantum Yield and Size
Dispersion of CdSe Nanocrystals. J Phys Chem B 2003, 107, 489-496.
14. Underwood, D. F.; Kippeny, T.; Rosenthal, S. J. Charge Carrier Dynamics in CdSe
Nanocrystals: Implications for the use of Quantum Dots in Novel Photovoltaics. Eur.
Phys. J. D 2001, 16, 241-244.
15. Peng, Z. A.; Peng, X. G. Nearly Monodisperse and Shape-Controlled CdSe
Nanocrystals Via Alternative Routes: Nucleation and Growth. J. Am. Chem. Soc.
2002, 124, 3343-3353.
16. Lee, M. K.; Saunders, J. A. Effects of pH on Metals Precipitation and Sorption: Field
Bioremediation and Geochemical Modeling Approaches. Vadose Zone J. 2003, 2,
177-185.
17. Gao, M.; Kirstein, S.; Mohwald, H.; Rogach, A. L.; Kornowski, A.; Eychmuller, A.;
Weller, H. Strongly Photoluminescent CdTe Nanocrystals by Proper Surface
Modification. J. Phys. Chem. 1998, 102, 8360.

102
Chapter 7
Kinetics Study
The feasibility study in Chapter 5 confirmed the presence of CdSe nanoparticles
as a result of using high-temperature water as a reaction medium. The study provided
insight into the effects of the process variables on the nanocrystal size and properties.
Although this synthesis route yielded nanocrystals, we next explored (Chapter 6) a rapid-
hot injection that better mimicked conventional routes. This new route yielded a smaller
nanocrystal but behavior similar to that observed in the feasibility study. We decided that
this route was the better one to use in follow-up studies on nanoparticle growth dynamics
as it would better enable us to make comparisons with experiments conducted by others
that used the rapid hot-injection route. The goal of this chapter is to explore and quantify
the growth evolution of CdSe nanocrystals in an aqueous medium.
7.1 Introduction
A large amount of research has been dedicated to the preparation of nanocrystals
with the aim of understanding the reaction conditions that favor high quality particles.
The precise control of parameters such as pH, time, temperature, and reagent chemistries
can determine the size, and hence the optical properties. The ability to control the size of

103
a nanocrystal and its size-dependent properties is what makes them desirable as materials
with unique properties. It is therefore essential to understand the growth behavior so that
a desired size, and ultimately, a targeted property can be realized.
A dearth of literature claims what mechanism actually controls the growth stage,
or is even responsible for producing the best quality nanocrystal. The little research that
does exist suggests that growth is consistent with diffusion-limited Ostwald ripening
[1, 2, 3]. Peng et al. [3] further conclude that the greatest narrowing of size distributions
occurs within the diffusion-limited regime, and suggests that this narrowing occurs just
before the onset of Ostwald ripening.
Dushkin et al. [4] provided the first comprehensive study of the kinetics of CdSe
nanocrystal growth by developing mathematical models that attempt to describe the
entire growth process, using classical kinetics models. Their model contends that
reaction and diffusion-limited growth both play a role in the growth of the nanocrystal.
But, they suggest that the fast reaction-limited growth is important to obtain well-defined
and uniform nanocrystals of high-quality, which is contrary to what Peng suggests.
Talapin et al. [5] performed Monte Carlo simulations and concluded that growth could be
limited by reaction, diffusion, or a combination of both processes, but agreed with Peng’s
assertion. A detailed look into the reaction conditions, however, could very well explain
why, though general assumptions can be made, different conclusions can be drawn.
When taking into consideration precursor chemistries, capping agents, and even
analytical techniques, determining the actual kinetics of a system is quite complex. But,
it seems that mathematical models of the growth process are needed to accurately
describe the evolution of nanocrystal growth to determine which kinetic regime governs

104
growth. Those developed by [4, 5, 6] provide invaluable insight, but are for synthesis in
organic solvent systems. As far as we know, there is no record of any quantitative
kinetics modeling for aqueous systems. But because classic kinetic theory should be
independent of the reaction medium, approaches developed for organics should apply, to
some extent, to synthesis in aqueous systems.
The model herein only represents the influence of reaction time and temperature
on the growth evolution. Chapter 6 does verify that other process variables, namely pH,
Cd:Se molar concentration and Cd:stabilizer molar concentration also affect the growth
of the nanocrystals. Including these parameters is essential for a more comprehensive
kinetic model, but time and temperature data are the most readily treatable in well-
established kinetic models.
7.2 Experimental Methods
We conducted experiments in stainless steel batch reactors fitted with a high-
temperature rated bellows valve as described in Chapter 4. All analytical methods used
for this study include spectroscopy and TEM, descriptions of which are in Chapter 4.
7.3 Model Development
One proposed route to exploring the kinetic behavior is by determining an
activation energy, Q. For both reaction- and diffusion-controlled growth processes, the
kinetic behavior should be characterized by Arrhenius behavior. The extraction of Q
from an Arrhenius plot of ln rate vs. � �* could help reveal how much of the process is in
fact controlled by diffusion.

105
Dickerson [7] provides a modeling framework for synthesis of CdSe in TOPO and
stearic acid. We adapted his model to describe our synthesis as well. Dickerson’s model
assumes: 1) the growth of nanoparticles occurs after nucleation and before Ostwald
ripening, 2) the number of nuclei remains constant, 3) the particles are spherical, 4) the
diffusion of cadmium complexes is significantly slower than diffusion of selenium, 5) the
concentration gradient is linear, and 6) the transport of the cadmium complex is by
diffusion with Arrhenius temperature behavior.
Dickerson’s model was built on the basis of Fick’s first law of diffusion:
B �5�C�D (7.1)
�C�D E
CF��G � CHI.�JKL ECF��G
KL (7.2)
5 5��D? M� �NF�O (7.3)
where B7PQ7$RS7T('U7#V7W8"XP'X7!X#(SQYWX� Z Q%, 57PQ7$RS7"PVV'QP[P$\7!WX�YQ%,7�C is the
difference in concentration of cadmium complexes in the bulk solution and those at the
nanocrystal’s surface (moles/cm3), CF��G is the concentration of cadmium complexes
(moles/cm3) in the bulk solution, LD is the diffusion length (cm), CHI.�J is the surface
concentration of cadmium complexes (moles/cm3) (it is assumed that it is orders of
magnitude lower than in the bulk solution, so CHI.�J~0), �D is the radial distance (cm), 5�
is the pre-exponential diffusivity coefficient (WX�YQ), � is the activation energy
(eV/molecule), NF is the Boltzmann’s constant (eV/molecule · K) and T is the absolute
temperature (K). The governing equation for the growth rate is:
]!.% �^�_!.%� ` B ^�_!.%��C�D 5 (7.4)

106
]!.% ^�_!.%�CF��G!.%KL 5��D? M� �
NF�O (7.5)
where a!.% = molar growth rate (moles/s) and _!.% is the average nanocrystal radius (cm)
at time >. Dickerson proposed using the temperature-dependence of the redshift rate of PL
emission peak wavelengths (�� �>* ) as a way for estimating7�. The redshift rate is
related to the rate of growth of the nanocrystal over time. Through application of the
effective mass model, it can be shown that �� �> b 7a.* at a fixed test wavlength [6]. A
full model derivation is available in Section 7.6 “Appendix: Derivation of Redshift Rate
Model ”.
7.4 Results and Discussion
Since the peak emission wavelength, ����, is an indicator of nanoparticle size, a
temporal profile of peak wavelengths will exhibit the particle growth behavior. Figure
7.1a shows such a profile for our system at various reaction temperatures. At higher
temperatures, the profiles trend higher because the higher temperatures tend to yield
larger nanoparticles, indicated by larger wavelengths. For each temperature it is apparent
that the peak wavelength initially increases with increasing time, and then, in general,
levels off at longer times.

107
Figure 7.1a. Evolution of peak wavelength, ����, with reaction time at various reaction
temperatures for CdSe nanocrystals synthesized in high-temperature water.
540
550
560
570
580
590
600
0 500 1000 1500 2000 2500 3000
Pea
k W
av
elen
gth
, n
m,
Reaction Time, s
T=200 C
T=210 C
T=220 C
T=230 C
T=240 C

108
Figure 7.1b. Evolution of peak wavelength with reaction time at various reaction
temperatures for CdSe nanocrystals synthesized in stearic acid [7].

109
Thus two distinct regimes, fast growth and slow growth, are apparent in Figure
7.1a. These profiles are similar to those observed for CdSe nanocrystals synthesized in
stearic acid (Figure 7.1b) [7]. The rapid increase of the nanocrystal’s size at the
beginning of the growth curves could be due to a reaction-controlled process. Monomer
from the particle’s immediate vicinity adsorbs to the surface, and is subsequently
exhausted. The longer time scale exhibits a slower growth process, which could be
controlled by diffusion and then Ostwald ripening.
The redshift rate can be mathematically defined as the change in emission
wavelength with reaction time. We fit a 3rd
-order polynomial function to the λ vs. time
curves at each temperature (Figure 7.1c). Table 7.1 lists the best fit equation for each
temperature. We then differentiated each function to obtain the redshift rate.
Figure 7.2a shows the profile of the red-shift rates. In general, at a fixed
wavelength, the red-shift rates trend higher at higher temperatures. This is consistent
with the growth profile shown in Figure 7.1a. Looking at a typical red-shift rate for a
given synthesis temperature, we see that it decreases as the wavelength increases. The
rate of growth of nanoparticles declines rapidly as the nanoparticle size increases. This
trend is similar to that observed by Dickerson et al. for CdSe nanocrystals prepared in
stearic acid (Figure 7.2b), as well as Dushkin’s [4] observation for the preparation of
CdSe nanocrystals in TOPO. Dushkin further suggested the existence of the two growth
regimes based on this trend, which leads us to speculate that we have separated
nucleation and growth, to a degree, using our rapid hot-injection method.

110
Figure 7.1c Evolution of peak wavelength, ����, with reaction time at various reaction
temperatures for CdSe nanocrystals synthesized in high-temperature water, fitted with a
3rd
order polynomial.
Temperature, °C 3rd
-order Polynomial Function
200 ����7 71.29x10⁻⁹>c � 1.18x10
-5>� � 3.48x10⁻²> �551
210 ����7 72.63x10⁻¹⁰>c � 6.85x10
-6>� � 2.86x10⁻²> � 554
220 ����7 71.07x10⁻⁹>c � 9.13x10
-6>� � 2.91x10⁻²> �557
230 ����7 72.22x10⁻⁹>c � 1.40x10
-5>� � 3.47x10⁻²> �559
240 ����7 72.13x10⁻⁹>c � 1.53x10
-5>� � 3.91x10⁻²> �561
Table 7.1 Table showing the 3rd
-order polynomial functions for each temperature.
550
555
560
565
570
575
580
585
590
595
600
0 500 1000 1500 2000 2500 3000
Pea
k W
av
elen
gth
, n
m,
Reaction Time, s
T=200 C
T=210 C
T=220 C
T=230 C
T=240 C

111
Figure 7.2a. Red-shift rates of peak wavelengths at various reaction temperatures for
CdSe nanocrystals synthesized in high-temperature water. The completion wavelength,
��, is estimated to be about 573 nm.
0
0.005
0.01
0.015
0.02
0.025
0.03
0.035
0.04
0.045
0.05
555 560 565 570 575 580 585 590
Red
shif
t R
ate
, n
m/s
Wavelength, nm
T=200 C
T=210 C
T=220 C
T=230 C
T=240 C

112
Figure 7.2b. Red-shift rates of peak wavelengths at various reaction temperatures for
CdSe synthesized in stearic acid by Dickerson et al. The completion wavelength, ��, is
shown to be 590 nm. [7]

113
According to Dickerson et al. [6], the redshift rate curves for the different
temperatures tend to converge to a common wavelength, defined as a “completion
wavelength”, ��. It is at this wavelength that the limiting reactant can be assumed to be
exhausted, and that further growth would be governed by Ostwald ripening. Our data
begin to converge at roughly 573 nm for the temperature range 200 – 220 °C.
Activation energies were calculated from the red-shift rates by plotting the natural
log of the red-shift rate against the reciprocal absolute temperature for a selected test
wavelength. The activation energy, �, for each test wavelength was extracted from the
slope of the individual plots. An example plot is shown in Figure 7.2c for a test
wavelength of 580 nm. Linear regression of these data lead to a � = 0.40 ± 0.11
eV/molecule where the uncertainty represents the standard error from a regression
analysis. The activation energies, at each test wavelength, were then plotted against the
entire range of test wavelengths to generate the plot shown in Figure 7.3a. A similar plot
for CdSe prepared in stearic acid and TOPO is shown in Figure 7.3b.
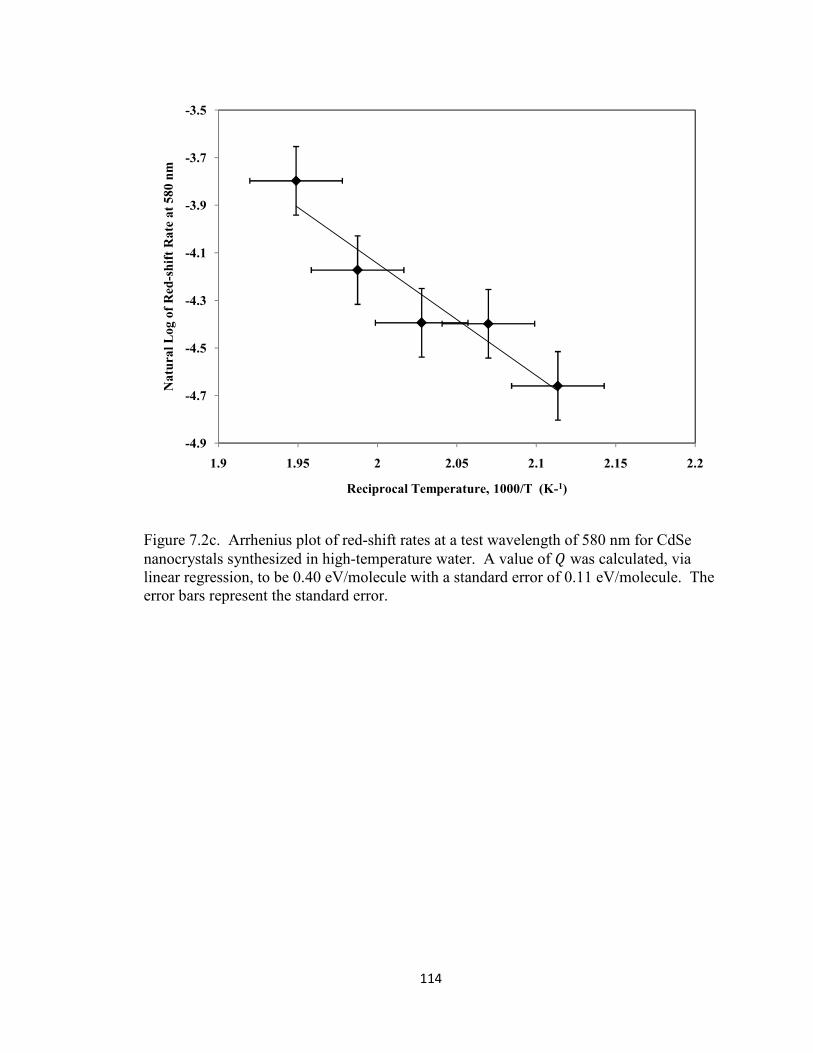
114
Figure 7.2c. Arrhenius plot of red-shift rates at a test wavelength of 580 nm for CdSe
nanocrystals synthesized in high-temperature water. A value of � was calculated, via
linear regression, to be 0.40 eV/molecule with a standard error of 0.11 eV/molecule. The
error bars represent the standard error.
-4.9
-4.7
-4.5
-4.3
-4.1
-3.9
-3.7
-3.5
1.9 1.95 2 2.05 2.1 2.15 2.2
Na
tura
l L
og
of
Red
-sh
ift
Ra
te a
t 5
80
nm
Reciprocal Temperature, 1000/T (K-1)

115
Figure 7.3a. Activation energies from redshift rates at various test wavelengths for CdSe
nanocrystals synthesized in high-temperature water. The completion wavelength, ��, is
marked at 573 nm. The average activation energy, �, is 0.24 ± 0.04 eV/molecule. The
error bars represent the standard error at each test wavelength.
0
0.2
0.4
0.6
0.8
1
1.2
1.4
560 565 570 575 580 585
Act
iva
tio
n E
ner
gy
, Q
(ev
/mo
lecu
le)
Test Wavelength, nm
λc
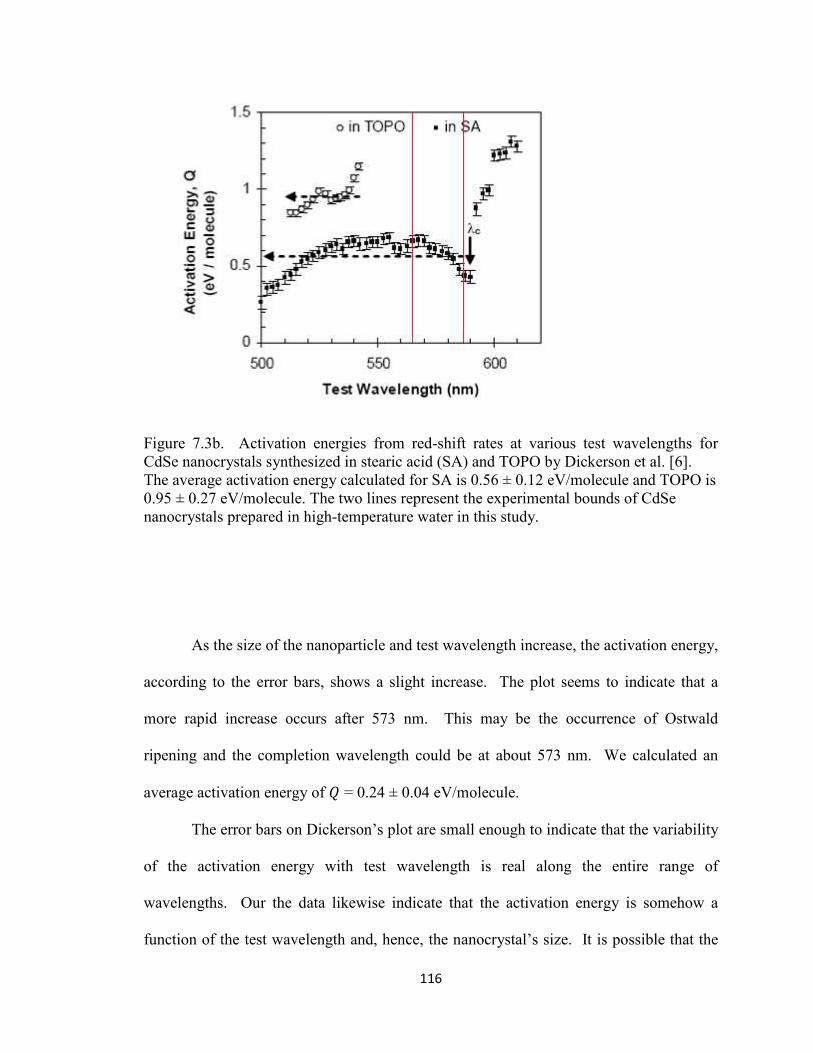
116
Figure 7.3b. Activation energies from red-shift rates at various test wavelengths for
CdSe nanocrystals synthesized in stearic acid (SA) and TOPO by Dickerson et al. [6].
The average activation energy calculated for SA is 0.56 ± 0.12 eV/molecule and TOPO is
0.95 ± 0.27 eV/molecule. The two lines represent the experimental bounds of CdSe
nanocrystals prepared in high-temperature water in this study.
As the size of the nanoparticle and test wavelength increase, the activation energy,
according to the error bars, shows a slight increase. The plot seems to indicate that a
more rapid increase occurs after 573 nm. This may be the occurrence of Ostwald
ripening and the completion wavelength could be at about 573 nm. We calculated an
average activation energy of � = 0.24 ± 0.04 eV/molecule.
The error bars on Dickerson’s plot are small enough to indicate that the variability
of the activation energy with test wavelength is real along the entire range of
wavelengths. Our the data likewise indicate that the activation energy is somehow a
function of the test wavelength and, hence, the nanocrystal’s size. It is possible that the

117
activation energy is a function of the evolving kinetic process, especially at the onset of
Ostwald ripening which, as Figure 7.3a suggests, may occur at about 573 nm. Talapin et
al. [5] assert, through their theoretical study of the evolution of a nanoparticle in colloidal
solution, that activation energies of the growth and dissolution process are a function of
nanoparticle radius. This is because the thermodynamic chemical potential of the
nanoparticle depends on the nanoparticle’s surface curvature. This may help explain the
large increase in activation energy after the suggested completion wavelength, �� = 573
nm. At this point, the process of Ostwald ripening begins as smaller particles dissolve
and larger ones grow.
The kinetics model provided by Dickerson et al. [7] may help us to begin to
understand the growth dynamics for nanoparticles produced in aqueous media. In
general, our data from aqueous-phase synthesis exhibits similar behavior to that obtained
from synthesis in stearic acid. Our particle growth, as seen in Figure 7.1a, shows a two-
step process, rapid initial growth, followed by a slower growth. Our redshift rate profile
is different from that produced form the organic-based system. It is unknown at this time
if this is a function of the experimental method, which may introduce more random error,
or the type of reaction medium. The convergence of red-shift rates, known as the
reaction completion wavelength, ��, was observed to be 590 nm for the organic-based
system and 573 nm for the aqueous-based system. The lower completion wavelength
may be a factor of the experimental method or the reaction medium. Further studies,
with different reaction mediums and identical experimental methods, would have to
verify this. The shape of the curve (Figure 7.3a) that shows the activation energies from
the red-shift rates is different than what was obtained for stearic acid (Figure 7.3b).

118
When comparing the two profiles within the same test wavelength range, our curves seem
to show a slight increase, then a more rapid increase in activation energies. It is
interesting that our profile is more similar to that shown for TOPO (Figure 7.3b),
although our profile is not within the same wavelength region. Dickerson et al. [6] do
state that � for TOPO could not be accurately estimated from test wavelengths near 560
nm due to a limited number of chosen synthesis temperatures. The plots showing the
redshift rate and the activation energy profile indicate that the diffusion-controlled
growth may have ceased at 573 nm.
Our activation energy value is lower than those obtained for synthesis in stearic
acid and TOPO (Table 7.2). The difference may be due to the use of different stabilizer
ligands. All three ligands differ in their carbon structure and length. Both stearic acid
and sodium citrate contain carboxyl groups. Additionally, they possess linear carbon
chains, but stearic acid is a longer chain acid (Scheme 7.1), and, therefore, bulkier with
more mass. TOPO has a branched carbon chain structure (Scheme 7.1) and is more
massive. The comparisons of the chemical structure of the different stabilizer ligands
may help explain the higher activation energy for that system as it would take more
energy to move the stearic acid and TOPO molecules, as they complex with cadmium,
from the bulk solution to the nanoparticle’s surface.

Q
(eV/molecule)
Table 7.2. Summary of average activation energies obtained by analysis of redshift rates
Stearic Acid
TOPO
Sodium Citrate
Scheme 7.1. Comparison of stearic acid, TOPO and sodium citrate ligands.
The activation energy for the self
eV/molecule [8] for our experimental temperature range (200
activation energy is higher than this value, which is not surprising since the value takes
into account the diffusion of cadmium citrate complexes and selenium monomer, entities
that will diffuse more slowly than the much smaller water molecules. From comparison
119
High-
temperature
Water
Stearic Acid
[6]
0.24 ± 0.04 0.56 ± 0.12
Table 7.2. Summary of average activation energies obtained by analysis of redshift rates
Scheme 7.1. Comparison of stearic acid, TOPO and sodium citrate ligands.
The activation energy for the self-diffusion of water is approximately 0.14
8] for our experimental temperature range (200 – 240 °C). The calculated
rgy is higher than this value, which is not surprising since the value takes
into account the diffusion of cadmium citrate complexes and selenium monomer, entities
that will diffuse more slowly than the much smaller water molecules. From comparison
TOPO
[6]
0.95 ± 0.27
Table 7.2. Summary of average activation energies obtained by analysis of redshift rates
Scheme 7.1. Comparison of stearic acid, TOPO and sodium citrate ligands.
diffusion of water is approximately 0.14
240 °C). The calculated
rgy is higher than this value, which is not surprising since the value takes
into account the diffusion of cadmium citrate complexes and selenium monomer, entities
that will diffuse more slowly than the much smaller water molecules. From comparison

120
with the self-diffusion number alone, we do not know if growth is entirely diffusion-
limited.
The error bars on our activation energy profile are larger than those on
Dickerson’s profile. Careful inspection of Figure 7.1a reveals wide variability of the raw
peak wavelength vs. time data, especially at smaller times. This is most likely an artifact
of the way the experiments were run as we were not able to continuously draw samples
from a large batch. Each wavelength represents one distinct experiment, likely
introducing more random error.
The presence of a self-focusing size distribution can provide evidence for
diffusion-controlled growth, according to Dickerson [7]. The fwhm value should
decrease with an increase in wavelength, with the minimum value occurring at �� (Figure
7.6b). Figure 7.4a shows the profile of the fwhm for the base case conditions. The
observed minimum occurs at � = 576 nm, but the characteristic rapid decrease in the
fwhm, observed in stearic acid, does not exist in our data. It is possible that nucleation
does not completely separate from growth, and that nuclei continue to form during the
synthesis process. The nuclei that do form may experience the reaction-limited growth
kinetics at the same time that the mature particles experience diffusion-limited growth
kinetics. The plot seems to indicate that growth is not necessarily governed by one
kinetic regime, but, may in fact be controlled by both reaction and diffusion.

121
Figure 7.4a. Profile of fwhm for CdSe nanocrystals prepared in high-temperature water
under base case conditions (� = 200 °C) at varying times. The error bars correspond to
the standard deviation for repeat base case experiments.
30
32
34
36
38
40
42
44
530 540 550 560 570 580 590 600
FW
HM
(n
m)
Wavelength, nm
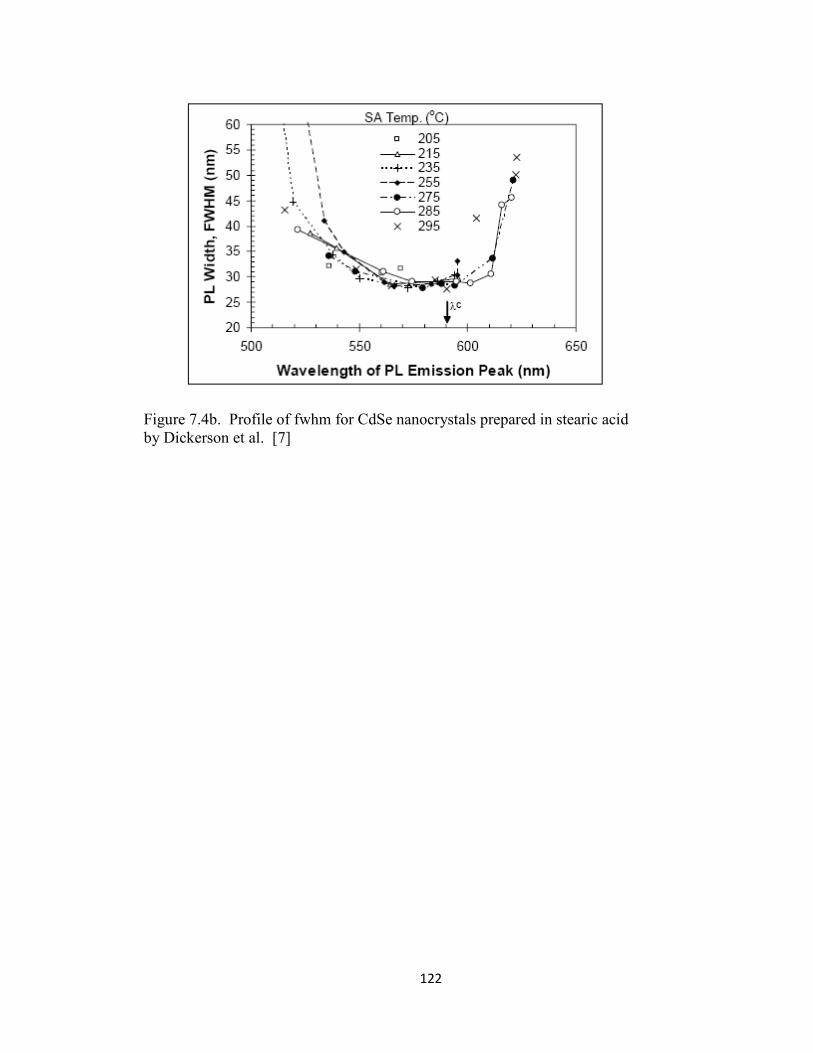
122
Figure 7.4b. Profile of fwhm for CdSe nanocrystals prepared in stearic acid
by Dickerson et al. [7]

123
7.5 Summary
This chapter reports the first quantitative analysis of the growth kinetics for CdSe
nanoparticles prepared in high-temperature water. We adapted a model originally
developed for organic-based systems. Two growth regimes are apparent: a rapid increase
in nanoparticle size followed by a slower growth. An activation energy, �, was
determined by using a red-shift rate (� = 0.24 ± 0.04 eV/molecule). The red-shift rate
method yielded activation energies that seemed to vary with the particle size. Our
activation energy is lower than those obtained from synthesis of CdSe in stearic acid and
TOPO possibly due to the stearic and TOPO ligands being bulkier and more massive than
the citrate ligand. We cannot, at this point, determine if the synthesis in high-temperature
water is reaction- or diffusion-controlled, but we do provide an analytical framework to
build on this research.

124
7.6 Appendix: Derivation of Redshift Rate Model
The full derivation of the Dickerson’s redshift rate model, used to calculate
activation energy, is shown in this section.
The model is based on Fick’s first law of diffusion:
B �5�C�D (A-1)
where B is the flux of cadmium into the nanocrystal (moles/cm2·s, 5 is the diffusivity
(cm2/s), and �C �D* is the radial concentration gradient from D _ to D KL:
�C�D�de E
CF��G � CHI.�JKL ECF��G
KL 7 !A-�%7
where CF��G is the concentration of cadmium complexes (moles/cm3) in the bulk solution,
KL is the diffusion length (cm), CHI.�J is the surface concentration of cadmium complexes
(moles/cm3) and it is assumed to be orders of magnitude lower than in the bulk solution
(CHI.�JEh%. The diffusion process can be described in terms of Arrhenius behavior:
5 5�SUi M� �NF�O (A-3)
where 5� is the pre-exponential term for the diffusion coefficient, � is the activation
energy, NF7 is the Boltzman’s constant and � is the absolute temperature.

125
The molar growth rate, a, can then be described as:
a �< Z B (A-4)
a < Z 5 �C�D (A-5)
< ^�_� (A-6)
Since we are interested in the Arrhenius behavior of the nanocrystal’s growth, we can
combine equations A-2, A-3, A-5 and A-6 to obtain the relationship between the molar
growth rate and an activation energy, �:
a!.% ^�_� CF��GKL 5�SUi M� �
NF�O (A-7)
Taking the natural log of both sides of equation A-7 yields:
(9 a!.% (97 M^�_� CF��GKL 5�O �7� �
NF� (A-8)
A plot of ln a!.% vs.� �* should yield a straight line with a slope = �� NF* .
Dickerson suggests that the molar growth rate is proportional to �� �>* as derived
from the effective mass approximation. We can express the effective mass
approximation as:
�j� � � k
_� (A-9)
where � is represented by �j �* and k represents the constants �� ���* (see Equation
1.5). Solving for _�:
_� k�j �* � � (A-10)
�_�
�j�k � �
k (A-11)

126
We can express the decrease in cadmium concentration by:
CF��G!.% C� � ^lm�nno��.
�o� _!.%c (A-12)
Where C� is the original molar concentration of cadmium in the reactor (moles/cm3),
o��. is the total volume of material in the reactor, o�7 is the molar volume of CdSe
(cm3/moles) and m�nn is the effective number of spherical nanocrystals. The molar
growth rate can be expressed in terms of cadmium depletion:
a!.% �o��.m�nn
�CF��G�> (A-13)
Differentiation of Equation A-12 and substituting the result into A-13 yields:
�CF��G �M^lm�nno��.
�o� Z l_��_!.%O (A-14)
From Equation A-9:
�_!.% _c�j���k ��
(A-15)
So the growth rate can be written as:
a!.% � �o� _p �j
��k���>
(A-16)
Equation A-16 shows that it is convenient to monitor the red-shift rate as a way to track
the growth rate of the nanocrystals. Thus, substituting �� �>* at a fixed test wavelength
for a!.% in Equation A-8 should still exhibit Arrhenius behavior.

127
7.7 Bibliography
1. Murray, C. B.; Norris, D. J.; Bawendi, M. G. Synthesis and Characterization of
nearly Monodisperse Cde (E = S, Se, Te) Semiconductor Nanocrystallites. J. Am.
Chem. Soc. 1993, 115, 8706-8715.
2. Peng, Z. A.; Peng, X. G. Nearly Monodisperse and Shape-Controlled CdSe
Nanocrystals Via Alternative Routes: Nucleation and Growth. J. Am. Chem. Soc.
2002, 124, 3343-3353.
3. Peng, X. G.; Wickham, J.; Alivsatos, A. P. Kinetics of II-VI and III-V Colloidal
Semiconductor Nanocrystal Growth: “Focusing” of Size Distributions. J. Am. Chem.
Soc. 1998, 120, 5343-5344.
4. Dushkin, C. D.; Saita, S.; Yoshie, K.; Yamaguchi, Y. The Kinetics of Growth of
Semiconductor Nanocrystals in a Hot Amphiphile Matrix. Adv. Coll. Inter. Sci. 2000,
88, 37-78.
5. Talapin, D. V.; Rogach, A. L.; Haase, M.; Weller, H. Evolution of an Ensemble of
Nanoparticles in a Colloidal Solution: Theoretical Study. J. Phys. Chem. B 2001,
105, 12278-12285.
6. Dickerson, B. D.; Irving, D. M.; Herz, E.; Claus, R. O.; Spillman, W. B.; Meissner,
K. E. Synthesis Kinetics of CdSe Quantum Dots in Trioctylphosphine Oxide and in
Stearic Acid. Applied Physics Letters 2005, 86, 171915-1-171915-3.
7. Dickerson, B. D. Organometallic Synthesis Kinetics of CdSe Quantum Dots,
Virginia Polytechnic Institute and State University, 2005.
8. Kyrnicki, K.; Green, C. D.; Sawyer, D. W. Pressure and Temperature Dependence of
Self-Diffusion in Water. Faraday Discuss. Chem. Soc. 1978, 66, 199-208.

128
Chapter 8
Summary and Conclusions
8.1 Summary
This thesis is a culmination of a series of studies of the potential for high-
temperature water to serve as a viable reaction solvent in the preparation of CdSe
nanocrystals. We tested a hypothesis that CdSe nanocrystals could be produced in high-
temperature water through a feasibility study (non-isothermal conditions). Additionally,
we examined the effects of various process parameters on the as-prepared nanocrystals.
We then adapted a rapid hot-injection method (isothermal conditions) similar to
convention to examine how the influence of the process parameters was affected by the
synthesis method. Finally, we assessed the kinetics of the growth evolution of the
nanocrystals in high-temperature water, and compared our results with those from
organic-based synthesis. The following is a summation of key results from our
investigative studies:
• CdSe nanocrystals that exhibit quantum behavior can be synthesized in liquid water at
temperatures > 200 °C;
• Under non-isothermal conditions, the reaction temperature greatly affected the
nanocrystal’s growth, possibly due to Ostwald ripening. Under isothermal
conditions, and at short times growth was about the same at all temperatures, being an

129
effect of either a short reaction time or the nucleation kinetics. An increase in the
temperature had negligible effect on the quantum yield or on the fwhm;
• An increase in reaction time increased the size of the nanocrystals but had negligible
effect on quantum yield. Under non-isothermal conditions, reaction time had
negligible effect on the fwhm, while, under isothermal conditions, we did not observe
a consistent trend.
• An increase in the Cd:Se molar ratio resulted in an increase in the nanocrystal size
under non-isothermal conditions. This trend was observed to be just the opposite
under isothermal conditions, where, additionally, higher Cd:Se molar ratios had a
negligible effect on fwhm but significantly increased quantum yield;
• The pH of the solution greatly affected the nanocrystal size. An increase in pH
caused a decrease in the size under non-isothermal and isothermal conditions. An
increase in pH produced nanocrystals with higher quantum yields;
• An increase in the amount of stabilizer increased the nanocrystal size. It caused
negligible effect on fwhm under non-isothermal conditions, but no consistent general
trend was observed under isothermal conditions (there did seem to be a dramatic
decrease in the fwhm at higher stabilizer amounts). The increase in stabilizer
decreased the quantum yield;
• Under non-isothermal conditions, the addition of a CdS shell increased the quantum
yield from 1.5% to ~7%;

130
• A kinetic model developed for CdSe nanocrystals synthesized in stearic acid and
TOPO was adapted for our hydrothermal synthesis. A redshift rate method for
obtaining an activation energy was used. This method yielded a value of � equal to
0.24 ± 0.04 eV/molecule. ;
• It is very possible that the nanocrystal growth in our studies is governed by both
reaction- and diffusion-controlled processes.
8.2 Conclusions and Future Work
It is apparent that traditional experimental parameters can and do affect growth
dynamics but, not surprisingly, the variability of surface atoms had a greater influence on
the optical properties. An increase in the Cd:Se molar ratio and Cd:stabilizer molar ratio
had a profound effect on the nanocrystal’s quantum yield. Quantum dots have a higher
surface area-to-volume ratio than their bulk analogues. Surface reconstruction and
composition are expected to have a large influence on the optical properties of
semiconductor nanocrystals [1]. Literature recognizes the role of the surface in
determining the quantum yields of semiconductor nanocrystals [1, 2, 3, 4, 5]. To better
understand how growth conditions determine the surface structure of CdSe nanocrystals
prepared in high-temperature water, more comprehensive studies of each contribution of
individual parameters, and the effect of their combination, will need to be assessed.
Our kinetics study provided the first quantitative analysis for CdSe prepared
hydrothermally. Even though our experimental data agreed well with a model developed
for organic-based systems [6], the model is probably not a complete representation of the
growth dynamics of the nanocrystals. The analytical expression uses only two process

131
variables, time and temperature. Our feasibility and rapid hot-injection studies, however,
confirm the influence of additional parameters such as pH and surface chemistries on
nanoparticle size and even quantum yield. Such parameters would need to be included in
a kinetics model to make it more complete and more broadly applicable.
Another interesting observation about our hydrothermal study is that some of the
growth behavior is similar to that seen in studies conducted in octadecene [7], an organic
non-coordinating solvent. Growth was hardly affected as the temperature increased at a
reaction time of two minutes, a phenomenon also observed in octadecene after five
minutes of growth. But our kinetics study confirmed that growth was appreciable after
longer time periods (Figure 7.1a), especially at higher temperatures (� > 220 °C). It
could simply be that a two minute reaction time was not long enough to survey the
growth in high-temperature water. Moreover, a five minute reaction time may not be
adequate time to observe appreciable growth in octadecene. Another observation, made
in both the hydrothermal and organic non-coordinating systems, was the increase in
nanocrystal size as the amount of stabilizer increased. To our knowledge, this effect has
not been reported by researchers using coordinating organic solvents (e.g. TOPO, stearic
acid). It is likely that the non-coordinating property of the medium plays an integral role
in the nucleation and growth dynamics of semiconductor nanocrystals.
We have shown, in this work, that the hydrothermal synthesis of CdSe
nanocrystals is feasible and controllable. This route could be a new strategy for
semiconductor nanocrystals. Much additional work is required if this ultimate goal is to
be achieved. The following paragraphs suggest some future research directions.
132
8.2.1 Autoclave Batch and Flow Reactor Studies
An autoclave reactor can allow isothermal studies of large batches to be
conducted. This capability is important when a full suite of analyses needs to be
performed and volume of product is essential. It can also allow for samples to be
withdrawn at various time intervals and possibly enable online analysis to be conducted
so that trends can be assessed in real-time without disturbing the reaction [8]. Finally,
studies conducted in an autoclave would represent a scale-up of about 100X from the 1.5
mL reactors used in this work.
A continuous flow reactor would allow for small scale studies that could simulate
high-volume production. It can enable the experimenter to operate at high temperatures
at very short times, possibly improving quantum yield.
8.2.2 Kinetics Modeling
A comprehensive study on the kinetics of CdSe nanocrystals grown
hydrothermally needs to be performed to truly determine the mechanism behind the
growth at all time scales. Data need to be obtained by conducting additional experiments
in an autoclave batch and continuous flow reactor mentioned above. Samples taken at
time intervals that cover the entire growth process can result in optical spectra that better
represents more complete growth kinetics [9]. An in situ method, akin to that developed
by Qu et al. [8] may uncover aspects of the growth stages that cannot be observed using
conventional analyses. A thorough and reliable kinetics model would be useful for
designing and optimizing large-scale processes for hydrothermal synthesis of CdSe
nanocrystals.

133
8.2.3 X-ray Analysis
X-ray studies should be implemented to complement TEM in order to obtain a
description of the nanocrystal structure. X-ray studies can further determine the crystal
phases (wurtzite vs. zinc blende) and indicate the presence of stacking faults. This
information is important in understanding the influence of structure on the electronic
properties.
8.2.4 Design of Experiments
A design of experiments (DOE) is a systematic approach to maximizing
information gained while reducing time and resources. A DOE can identify the most
influential sources of variation of the process parameters. It can also quantify the effects
of the important factors including their interactions and can identify the optimal
conditions.
8.2.5 Life-cycle Assessment
To verify the environmental benefits provided by the hydrothermal route, a life-
cycle assessment should be performed. The assessment would involve quantifying the
amount of energy and raw materials used and the amount of waste generated. The
assessment would entail choosing alternative reaction mediums (e.g. TOPO, heat transfer
fluids), defining system boundaries and environmental parameters, and performing
preliminary screens. This work would ensure a direct and objective comparison of
synthesis in the different reaction mediums and their impact on the environment.

134
8.2.6 Emission Spectra Fitting
Many of the emission spectra collected in these studies were not true Gaussian
curves as they possessed tails. A fit of the measured data to, for example, either Gaussian
or Lorentzian functions could reduce the error in determining the fwhm of the spectra.
This effort may also reveal some additional information about the effect of a process
parameter on the nanocrystal’s growth and size distribution.

135
8.3 Bibliography
1. Alivisatos, A. P. Perspectives on the Physical Chemistry of Semiconductor
Nanocrystals. J. Phys. Chem. 1996, 100, 13226-13239.
2. Donega, C. D.; Hickey, S. G.; Wuister, S. F.; Vanmaekelbergh, D.; Meijerink, A.
Single-Step Synthesis to Control the Photoluminescence Quantum Yield and Size
Dispersion of CdSe Nanocrystals. J Phys Chem B 2003, 107, 489-496.
3. Hines, M. A.; Guyot-Sionnest, P. Synthesis and Characterization of Strongly
Luminescing ZnS-Capped CdSe Nanocrystals. J. Phys. Chem. 1996, 100, 468-471.
4. Dabbousi, B. O.; RodriguezViejo, J.; Mikulec, F. V.; Heine, J. R.; Mattoussi, H.;
Ober, R.; Jensen, K. F.; Bawendi, M. G. (CdSe)ZnS Core-Shell Quantum Dots:
Synthesis and Characterization of a Size Series of Highly Luminescent
Nanocrystallites. J. Phys. Chem. B 1997, 101, 9463-9475.
5. Qu, L. H.; Peng, X. G. Control of Photoluminescence Properties of CdSe
Nanocrystals in Growth. J. Am. Chem. Soc. 2002, 124, 2049-2055.
6. Dickerson, B. D.; Irving, D. M.; Herz, E.; Claus, R. O.; Spillman, W. B.; Meissner,
K. E. Synthesis Kinetics of CdSe Quantum Dots in Trioctylphosphine Oxide and in
Stearic Acid. Applied Physics Letters 2005, 86, 171915-1-171915-3.
7. Bullen, C. R.; Mulvaey, P. Nucleation and Growth Kinetics of CdSe Nanocrystals in
Octadecene. Nano Lett. 2004, 4, 2303-2307.
8. Qu, L. H.; Yu, W. W.; Peng, X. P. In Situ Observation of the Nucleation and Growth
of CdSe Nanocrystals. Nano Lett. 2004, 4, 465-469.
9. Dushkin, C. D.; Saita, S.; Yoshie, K.; Yamaguchi, Y. The Kinetics of Growth of
Semiconductor Nanocrystals in a Hot Amphiphile Matrix. Adv. Coll. Inter. Sci. 2000,
88, 37-78.


![Lattice matched epitaxial shell growth on InZnP quantum dots · A less toxic alternative for cadmium selenide quantum dots are indium phosphide quantum dots. [28] However, the PLQY,](https://cdn.vdocuments.us/doc/165x107/5f0e4c8b7e708231d43e90ba/lattice-matched-epitaxial-shell-growth-on-inznp-quantum-dots-a-less-toxic-alternative.jpg)

