T.C.
BAHÇEŞEHİR ÜNİVERSİTESİ
INSTITUTE OF SCIENCE
COMPUTER ENGINEERING
HUMAN RESOURCE PERFORMANCE CLUSTERING
BY USING SELF REGULATING CLUSTERING
METHOD
Master Thesis
OSMAN KAYA
SUPERVISOR
ASSOC. PROF. DR. ADEM KARAHOCA
İSTANBUL 2008


T.C.
BAHÇEŞEHİR ÜNİVERSİTESİ
INSTITUTE OF SCIENCE
COMPUTER ENGINEERING
HUMAN RESOURCE PERFORMANCE CLUSTERING
BY USING SELF REGULATING CLUSTERING
METHOD
Master Thesis
OSMAN KAYA
SUPERVISOR
ASSOC. PROF. DR. ADEM KARAHOCA
İSTANBUL 2008

T.C.
BAHÇEŞEHİR ÜNİVERSİTESİ
INSTITUTE OF SCIENCE
COMPUTER ENGINEERING
Name of the thesis: Human Resource Performance Clustering by Using Self
Regulating Clustering Method
Name/Last Name of the Student: Osman KAYA
Date of Thesis Defense: 05.09.2008
The thesis has been approved by the Institute of Science.
Prof. Dr. Bülent Özgüler
Director
___________________
I certify that this thesis meets all the requirements as a thesis for the degree of Master of Science.
Assoc. Prof. Dr. Adem KARAHOCA
Program Coordinator
____________________
This is to certify that we have read this thesis and that we find it fully adequate in scope, quality and content, as a thesis for the degree of Master of Science.
Examining Committee Members Signature
Assoc. Prof.Dr. Adem KARAHOCA ____________________
Prof. Dr. Nizamettin AYDIN ____________________
Asst. Prof. Dr. Yalçın ÇEKİÇ ____________________

i
ACKNOWLEDGMENTS
This thesis is dedicated to my parents for their patience and understanding during my
master’s study and the writing of this thesis.
I would like to express my gratitude to Assoc. Prof. Dr. Adem Karahoca for his great
contribution to my career by admitting me as a research assistant and then make me do many
researches on various topics and make me feel that I can accomplish everything if I really
want and work patiently.
I would like to thank CSE faculty and research assistants for making my two years at Bahçeşehir University a great experience.
Finally, I would like to thank all my friends for their motivation.

ii
ABSTRACT
HUMAN RESOURCE PERFORMANCE CLUSTERING BY USING SELF REGULATING
CLUSTERING METHOD
Kaya, Osman
M.S. Department of Computer Engineering
Supervisor: Assoc. Prof. Dr. Adem Karahoca
August, 2008, 41 pages
In organizational performance evaluation, performance of each staff plays a key role for organization. Although, the whole is greater than the sum of its parts, outstanding personnel performances determine the performance of the whole organization. At this point, an understanding and awareness of individual differences in performance stands as a critical point in making decisions related to promotion, wage determination, fringe benefit allotment and etc. since, those decisions are directly related to personnel motivation, retention and further organizational performance. Data mining and clustering methods can be used in personnel performance evaluation. After gathering personnel performance data from human resource department, the need to take some specific results about performance measurement and evaluation may be addressed by clustering methods. By clustering, a distinction between personnel by grouping them by their performance grades both assists attaining a bird’s eye view of the general performance of the organization and each staff’s contribution level to the organizational performance. For evaluating cluster numbers using x-mean algorithm, the algorithm finds optimum cluster number for cluster distribution. Hence, our problem of an optimum clustering schema for personnel performance data may be addressed. These results show the usefulness of an innovative technique when applied to research so far conducted through traditional methodologies, and brings to the surface questions about the universal applicability of the widely accepted relationship between superior HRM and superior business performance.
Keywords: Human resource management, online self regulating clustering algorithm, data mining, c-mean-online clustering, x-mean algorithm, performance evaluation, organizational performance.

iii
ÖZET
İNSAN KAYNAKLARI PERFORMANSI KÜMELEMEDE KENDİLİĞİNDEN
DÜZENLENEN KÜMELEME YÖNTEMİNİN KULLANILMASI
Kaya, Osman
Yüksek Lisans, Bilgisayar Mühendisliği Bölümü
Tez Yöneticisi: Doç. Dr. Adem Karahoca
Temmuz, 2008, 41 sayfa
Organizasyonel performans ölçümünde, her bir çalışanın performansı anahtar rol oynamaktadır. Bütün, parçaların toplamından büyük olsa da, öne çıkan çalışanların performansı tüm organizasyonun performansını belirlemektedir. Bu noktada, çalışanlar arası performansların farklılıklarının anlaşılması ve fark edilmesi, terfi, ücret ve yan haklar gibi konularda alınacak kararlarda hayati önem taşımaktadır, çünkü alınan kararlar, çalışanların motivasyonu ve organizasyonda tutulabilmesi daha yüksek organizasyonel performans için doğrudan nedensellik ilişkisi taşımaktadır. Bu noktada, veri madenciliği ve kümelendirme yöntemlerinden yardım alınabilmektedir. İnsan kaynakları biriminden çalışan performans puanları elde edildikten sonra, verilerden belirli sonuçlara ulaşılabilecek yorumlar elde edebilmek için kümelendirme yöntemleri kullanılabilir. Kümelendirme sayesinde, çalışanların performans puanlarına göre farklı kümelerde incelenmesi, hem organizasyonun genel performansına kuş bakışı bir bakış açısından bakılmasına, hem de her bir çalışanın organizasyona bireysel katkısının anlaşılmasına yardımcı olacaktır. X-mean algoritmasından yararlanarak en uygun küme adedi hesaplanabilir. Böylece, amacımız olan çalışanların performans verilerinin en uygun biçimde kümelere göre ayırt edilmesi gerçekleştirilebilir.Sonuçlar, geleneksel yöntemlere göre daha ileri, yararlı ve yenilikçi sonuçlara ulaştırmakta ve genel Kabul gören, daha iyi insan kaynakları yönetimi ve iş performansı ilişkisini açıklayabilmektedir.
Anahtar Kelimeler: İnsan kaynakları yönetimi, çevrimiçi kendiliğinden düzenlenen kümeleme algoritması, kümeleme algoritması, veri madenciliği, c-mean çevrimiçi kümeleme, x-mean algoritması, performans ölçümü, organizasyonel performans.
iv
TABLE OF CONTENTS
ABSTRACT………………………………………………………………………………..…..i
ÖZET………………………………………………………………………………………….ii
TABLE OF CONTENTS……………………………………………………………………iii
LIST OF TABLES……………………………………………………….…………………...v
LIST OF FIGURES……………………………………………………………………….....vi
LIST OF ABBREVIATIONS……………………………………………………………....vii
LIST OF FORMULAS……………………………………………………………………..viii
1. INTRODUCTION…………………..……………………………………………………..1
1.1. PROBLEM DEFINITION...…………………………………………………….2
2. LITERATURE SURVEY AND BACKGROUND……………...….……………...….....3
2.1. Data Mining to Improve Personnel Selection And Enhance Human
Capital……………………………….…………………………………………..3
2.2. Human Resource Management And Performance Measurement By
Neural Network Analysis…………………..…………………………………..4
2.3. The Impact of Human Resource Management on Organizational
Performance…………………………………………………………….............4
2.4. Attracting and Retaining Talent...………………………………………............4
3. MATERIAL AND METHOD……………………...……………………………………...6
3.1. About Data Set……………………………………………………………………..6
3.2. Clustering Model………………………………………………………………….11
3.2.1. Fuzzy Clustering Algorithms for Pattern
Recognition…...………………….…………..…………………………….11
3.2.2. Validity Guided (Re)Clustering with Applications to Image
Segmentation………………………………………………………..…...12

v
3.2.3. Optimal Adaptive K-Means Algorithm with Dynamic Adjustment of
Learning Rate……………………………………………………….…...12
3.2.4. Self-Splitting Competitive Learning Through a New Online Clustering
Paradigm……….…………………………………………………...……13
3.2.5. Dynamic Cluster Generation for a Fuzzy Classifier with Ellipsoidal
Regions………….………………………………………………………..14
3.2.6. Efficient Function Approximation Using an Online Regulating
Clustering Algorithm………………………………………………………..14
3.3. ONLINE SELF REGULATING SYSTEM…………………………………......15
3.3.1. Finding Cluster Numbers………………………………………………...15
3.3.2. Online Self Regulating Cluster Analysis Design.……………………….15
4. PROBLEM SOLUTION AND FINDINGS….………………………………………….19
4.1. Application of Performance Clustering By Using Self Regulating
Clustering to the Human Resource Performance Data………………………..19
4.2. RECEIVER OPERATING CHARACTERISTIC CURVEANALYSIS..…….28
4.2.1. ROC Curve Parameters…………………………………………………...29
4.2.2. ROC Curve Analysis (Fuzzy C-Mean)…………………………………...32
4.2.3. ROC Curve Analysis (Gustafson-Kessel)………………………………...34
4.2.4. ROC Curve Analysis (Gath-Geva)……………………………………….35
5. CONCLUSIONS.…………………………………………………………………………37
6. REFERENCES…………………………………………………………………...……….38
6.1. Books……….....…...……………………………………………………………....38
6.2. Periodicals…………..……………………………………………………………..38
6.3.Other Publications….…………………………………….………………………..41
7. Curriculum Vitae….……………………………………………………………………....42

vi
LIST OF TABLES
Table 3.1 : Description of dataset columns …………...………...…………….....…....6
Table 3.2 : Performance target items for managers……………………………………6
Table 3.3 : Performance target items for internal auditors…………………….…..…..8
Table 3.4 : Performance target items for tellers…………………………………...…...9
Table 3.5 : Performance evaluation scale…………………………………………….10
Table 4.1 : Simple input data…………………………………………………....……19
Table 4.2 : X mean algorithm configuration parameters……………………………..22
Table 4.3 : Clusters.………………………………………………....……………......22
Table 4.4 : Clustered Instances …………………………………………………....... 23
Table 4.5 : ROC Curve Analysis of Fuzzy c-means result………………………..…32
Table 4.6 : ROC Curve Analysis of Gustafson-Kessel Result…………………….....34
Table 4.7 : ROC Curve Analysis of Gath-Geva Result……………………………...35
vii
LIST OF FIGURES
Figure 4.1: Result of finding optimum cluster number using X-mean algorithm…………..21
Figure 4.2: Result of Fuzzy C-means algorithm by the synthetic overlapping performance
data with normalization……………………………………………………………………...23
Figure 4.3: Result of Gustafson-Kessel algorithm by the synthetic overlap-ping performance
data with normalization……………………………………………………………………...25
Figure 4.4: Result of Gath-Geva algorithm by the synthetic overlapping data with
normalization…………………………………………………………………………………27
Figure 4.5: The display of data without regulating vector ellipse…………….…………...28
Figure 4.6: The display of personnel total performance data with self regulating vector ellipse ………………………………………………………………………………….………….….28
Figure 4.7: ROC Curve of Fuzzy C-means …………….………….....................................33
Figure 4.8: ROC Curve of Gustafson-Kessel ……………………………….…………...34
Figure 4.9: ROC Curve of Gath-Geva ………………………………………………..…...35

viii
LIST OF ABBREVIATIONS
Fully self organizing simplified adaptive resonance theory : FOSART
Fuzzy adaptive resonance theory : fuzzy ART
Fuzzy learning vector quantization : FLVQ
Growing neural gas : GNG
Human resource management : HRM
Magnetic resonance image : MRI
One prototype take one cluster : OPTOC
Radial basis function networks : RBFN
Self organizing map : SOM
Self regulating clustering algorithm : SRCA
Self-splitting competitive learning : SSCL
Validity guided (re)clustering : VGC

ix
LIST OF FORMULAS
Formula (1): Cluster numbers…………………………………………………………….16
Formula (2): Cluster centers……………………………………………………………....17
Formula (3): Cluster variances……………………………………………………………18
1. INTRODUCTION
Human Resources effectiveness is a critical issue. Human Resources procedures require
a strong emphasis for improving decisions about human capital. Human capital
determines how far a business may improve and reach its targets. Thus, in order to
understand the dynamics of motivation of the personnel and have a clear perception of
the improvement of the personnel performance, the performance data shall be analyzed
utilizing the most appropriate statistical techniques to yield the desired practical
information (Berman, West, Wang 1999).
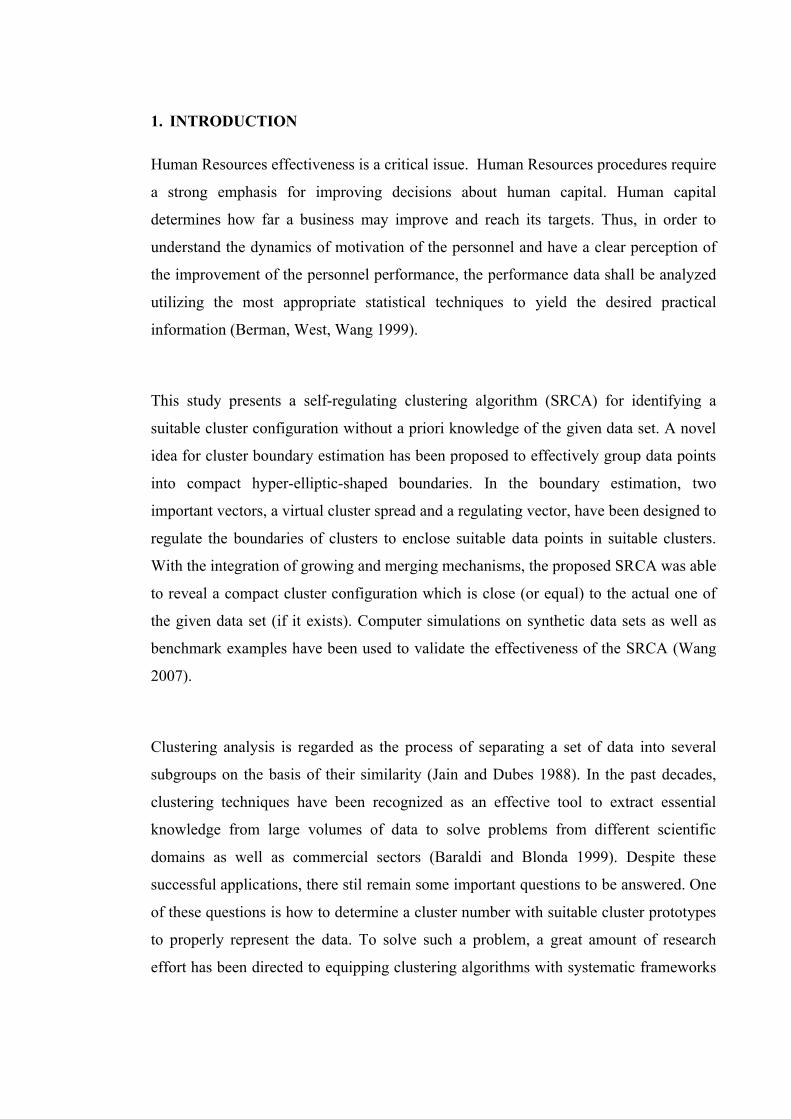
This study presents a self-regulating clustering algorithm (SRCA) for identifying a
suitable cluster configuration without a priori knowledge of the given data set. A novel
idea for cluster boundary estimation has been proposed to effectively group data points
into compact hyper-elliptic-shaped boundaries. In the boundary estimation, two
important vectors, a virtual cluster spread and a regulating vector, have been designed to
regulate the boundaries of clusters to enclose suitable data points in suitable clusters.
With the integration of growing and merging mechanisms, the proposed SRCA was able
to reveal a compact cluster configuration which is close (or equal) to the actual one of
the given data set (if it exists). Computer simulations on synthetic data sets as well as
benchmark examples have been used to validate the effectiveness of the SRCA (Wang
2007).
Clustering analysis is regarded as the process of separating a set of data into several
subgroups on the basis of their similarity (Jain and Dubes 1988). In the past decades,
clustering techniques have been recognized as an effective tool to extract essential
knowledge from large volumes of data to solve problems from different scientific
domains as well as commercial sectors (Baraldi and Blonda 1999). Despite these
successful applications, there stil remain some important questions to be answered. One
of these questions is how to determine a cluster number with suitable cluster prototypes
to properly represent the data. To solve such a problem, a great amount of research
effort has been directed to equipping clustering algorithms with systematic frameworks

2
to automatically reveal the cluster configuration of data sets (Chinrungrueng and Sequin
1995).
In order to figure out the numbers of clusters of the data, we implemented x-means
algorithm (Pelleg and Moore 2000).
1.1. PROBLEM DEFINITION
This study aims to explore the following research questions;
1. Which organizational departments contribute most to the differentiation between
superior and lower performing organizations?
2. How departments’ contribution to the organizational performance might be
measured and differentiated.
3. Do superior-performer organizations form a specific pattern that distinguishes them
from lower performer?
4. How personnel contribution to the organizational performance might be measured
and how a better comparison might be attained among personnel performance?
The objective of cluster analysis is the classification of objects according to similarities
among them, and organizing of data into groups. Clustering techniques are among the
unsupervised methods, they do not use prior class identifiers. The main potential of
clustering is to detect the underlying structure in data, not only for classification and
pattern recognition, but for model reduction and optimization. Different classifications
can be related to the algorithmic approach of the clustering techniques. Partitioning,
hierarchical, graph-theoretic methods and methods based on objective function can be
distinguished.
This working is aid taking some decisions for Human Resource department.

3
2. LITERATURE SURVEY AND BACKGROUND
At the past, many scientists made researches on the topic of human resources
performance evaluation and classification through clustering. List of literature is listed
below as follows:
2.1. Data Mining to Improve Personnel Selection and Enhance Human Capital
(Chien and Chen 2008) developed a data mining framework based on decision tree and
association rules in order to generate useful rules for personnel selection and retention.
The study focuses on quality of human capital at high-tech companies. The main
problems that high-tech companies are listed as high turnover rates and difficulties in
recruiting right talents, who are the most suitable to company’s own organizational
structure. Also, the mined results of the study is assessed to help improving human
resource management activities including job redesign, job rotation, mentoring, and
career path development. It is assessed that with an effective personnel selection
process, organizations can find the suitable talents at the first time to improve retention
rate and generate better performance.
The developed data mining framework to extract rules from the relationships between
personnel profile data and their work behaviors, and developed strategies with domain
experts in the case company and most of the suggestions are implemented. The study
used applicant’s demographical data and work experience to predict their work
performance and retention. It is also stated that further data may be used such as
address, the rank or scores in school and number of owned licenses and uncover buried
relationships, and some other turnover reasons other than considered in the study may
be subject of further study.
In the study, decision tree is used for data mining, since, it is easier to perceive and
offers acceptable level of accuracy. The empirical study revealed practical viability of

4
this approach for extracting rules for human resource management in the semiconductor
industry. Also, it is stressed that this methodology can be applied to other occupations
like operators and management level occupations, and to other industries to find
matched talents to enhance human capital, and a screening mechanism working on an
information system that processes large volumes of personnel data may be used for
reducing recruiter’s visible and invisible costs.
2.2. Human Resource Management And Performance Measurement By Neural
Network Analysis
(Stavrou, Charalambous, and Spiliotis 2007) utilizes an innovative research
methodology known as Kohonen’s Self-Organizing Maps to explore the connection
between human resource management as a source of competitive advantage and
perceived organizational performance in the European Union private and public sectors.
Results of the study revealed the usefulness of an innovative technique when applied to
research so far conducted through conventional methodologies, and caused questions to
arise about the universal applicability of the widely accepted relationship between better
human resource management and better business performance.
2.3. The Impact of Human Resource Management on Organizational Performance
(Becker and Gerhart 1996) emphasizes the importance of human resource management
in its influence on organizational performance. The paper addresses the link between
human resource management and organizational performance in unique view of angle
and provides suggestions regarding a better perception about the issue.
2.4. Attracting and Retaining Talent
(Holland, Sheehan, and Cieri 2007) approaches to the skilled labor attraction,
recruitment, and retention issue from a competitive advantage point of view. The paper
examined responses from 1372 Australian human resources professionals who

5
participated in an online survey of a national human resource professional association
and results are interpreted with respect to human resource efforts to attract, develop, and
retain talent.
The paper concludes that in critical human resource development areas, associated with
retention such as training, job design, skill development, careers management and team
building, results indicate a lower level of resource allocation, and hence, lack of
resource allocation suggests weaknesses for Australian companies in competition for
attracting, recruiting, and retaining skilled worker.
6
3. MATERIAL AND METHOD
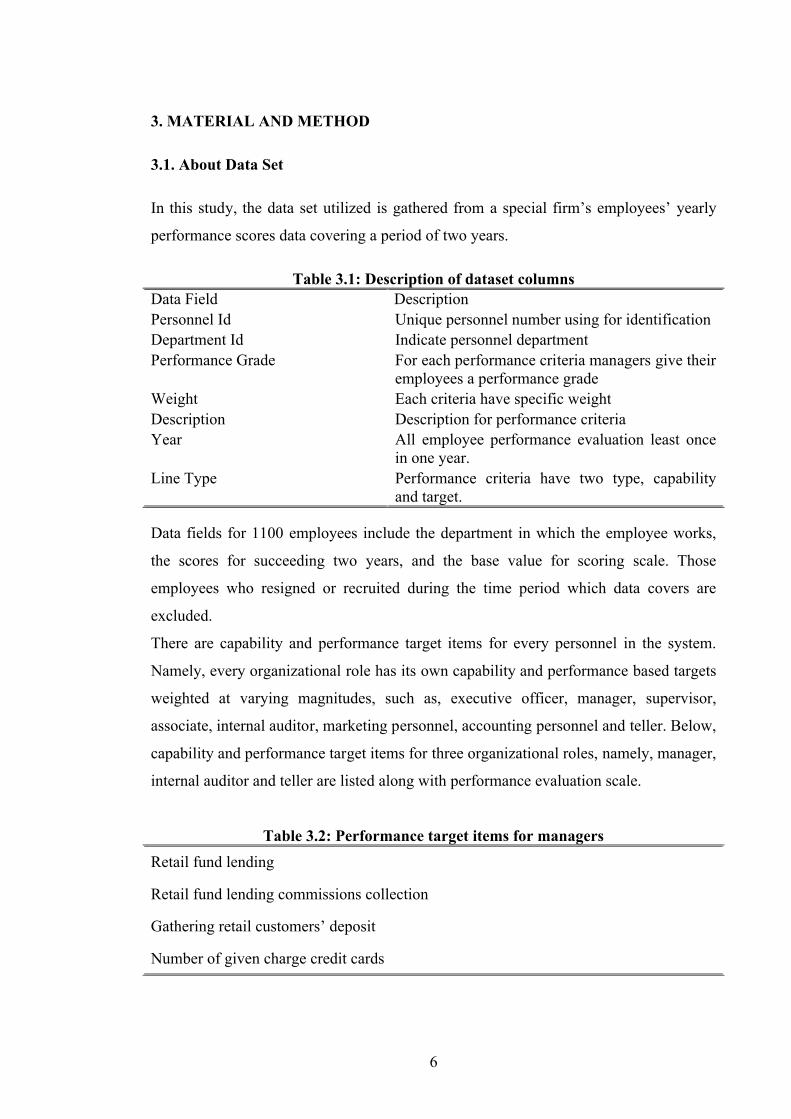
3.1. About Data Set
In this study, the data set utilized is gathered from a special firm’s employees’ yearly
performance scores data covering a period of two years.
Table 3.1: Description of dataset columnsData Field DescriptionPersonnel Id Unique personnel number using for identificationDepartment Id Indicate personnel departmentPerformance Grade For each performance criteria managers give their
employees a performance gradeWeight Each criteria have specific weight Description Description for performance criteria Year All employee performance evaluation least once
in one year. Line Type Performance criteria have two type, capability
and target.
Data fields for 1100 employees include the department in which the employee works,
the scores for succeeding two years, and the base value for scoring scale. Those
employees who resigned or recruited during the time period which data covers are
excluded.
There are capability and performance target items for every personnel in the system.
Namely, every organizational role has its own capability and performance based targets
weighted at varying magnitudes, such as, executive officer, manager, supervisor,
associate, internal auditor, marketing personnel, accounting personnel and teller. Below,
capability and performance target items for three organizational roles, namely, manager,
internal auditor and teller are listed along with performance evaluation scale.
Table 3.2: Performance target items for managers
Retail fund lending
Retail fund lending commissions collection
Gathering retail customers’ deposit
Number of given charge credit cards

7
Number of new internet banking customers
Number of given debit cards
Branch income
Total of new credit limits
Total amount of banking services income
POS turnover
Success orientation
Analytical thinking
Cooperation
Personal communication and persuasion capabilities
Customer oriented marketing
General communication and information sharing
Stress resistance
Total amount of foreign trade transactions commissions collection
Total amount of foreign trade transactions volume
Corporate fund lending commissions collection
Total volume of corporate deposit accounts
Total volume of corporate saving accounts
Total volume of corporate loans
Total amount of letter of guarantee commissions collection
Total volume of letter of guarantees
Net profit/loss
The performance agreement between the Senior Manager and the General Manager
must set out expectations and the means by which performance against these
expectations will be assessed. A new performance agreement should not be entered into
until the previous year’s performance review has been completed. The expectations in
the performance agreement should be consistent with the General Manager’s duties and

8
functions as identified in the Standard Contract (see attached). The performance
agreement should be realistic and achievable and the Council should provide adequate
resources to enable the General Manager to perform his/her duties and functions in
Table 3.2
A fundamental component of any performance agreement is the ability to measure
performance at both the organisational and individual level. This will require both
quantitative and qualitative measures.
Table 3.3: Performance target items for internal auditors
Managing expenditures in line with the budget
Attending at least three professional training programs within the accounting year
Completing branch and department audits as planned
Conducting customer and risk oriented research and development activities, reporting the resultsEducating the branch and department personnel concerning corporate policy and procedures
Observing corporate compliance with Risk Management Decree
Observing corporate compliance with related codes and regulations
Sharing professional judgment regarding ongoing operations’ acceptable risk levels
Developing brand new audit techniques
Reporting high risk areas and suggesting solutions
Supporting practical and theoretical professional training of new personnel
Good personal relations with colleagues. Completing tasks and duties adequately. Attending to corporate social activitiesCommunicating and information sharing with other departments on risk and audit related issues
Developing solutions for problems confronted during audits
Completing projects submitted by the manager and succeeding at written examinations
Analytical thinking
Customer orientation

9
Success orientation
Communication and information sharing
Planning and organization
The internal audit function is established to provide independent, objective assurance
and consulting services designed to add value and improve the organization’s
operations. It helps the organization accomplish its objectives by bringing a systematic,
disciplined approach to evaluate and improve the effectiveness of risk management,
control, and governance processes. In Table 3.3 list internal auditor evaluation
performance criteria.
Table 3.4: Performance target items for tellersAttaining average transaction time lower than 105% of corporation’s average transaction time.
Classifying recurring transactions (cash withdrawal, cash machine daily control, etc.)
Classifying and monitoring outgoing cash transaction to other banks
Receiving less than 4 yearly customer complaints while at most 2 of them are action requiring complaints
Success orientation
Adaption to change
Cooperative working
Communication and information sharing
Customer orientation
Stress resistance
Persuasive influence
Table 3.4 displays performance target items for teller prepares by human resource department for evaluating teller performance and improvement.

10
Table 3.5: Performance evaluation scale
Performance Grade Evaluation
Higher than 110% 5High Performance above responsibilities
Between 101% and 109% 4Performance above responsibilities
Between 86% and 100% 3 Fully met responsibilities
Between 75% and 85% 2Performance below responsibilities
Lower than 74% 1 Unsuccessful
As a result of this process, those listed criteria are evaluated by managers for every
individual personnel and a grade between 1 to 5 is attached to the personnel. However,
while some managers expect the personnel to accomplish 3 to 4 targets, some others
may expect 20 to 30 to be accomplished. In this case, the number of target items gains
relative importance as well as the grade attached.
There is also the issue of department IDs. That is for demonstrating that if two separate
departments that had the same grade as at the example above in fact had different
grades. This is intented for benchmarking.
Our intent is to match all personnel performance data for specific results. Such as,
benchmarking is annual performance data for two different departments. In this study
we use only performance grade, line count and department information.
Those fields below listed are used for this study: Personnel Id: for user identification;
Department Id: for benchmarking; Grade: Performance grade for all criteria; Also in
calculate line, count for each personnel grade. However, all personnel information are
retained on HR information system, so if we can evaluate different scenarios, we can
demonstrate personnel performance and;

11
i. Age
ii. Gender
iii. Marital status
iv. Degree
v. School/school tier
vi. Major
vii. Work experience
3.2. Clustering Model
At the past, many scientists made researches on the topic of classification through
clustering. List of literature is listed below as follows:
3.2.1. Fuzzy Clustering Algorithms for Pattern Recognition
(Baraldi and Blonda 1999) proposed equivalence between the concepts of fuzzy
clustering and soft competitive learning in clustering algorithms on the basis of the
existing literature. Moreover, a set of functional attributes is selected for use as
dictionary entries in the comparison of clustering algorithms. Five clustering algorithms
taken from literature are reviewed, assessed and compared on the basis of the selected
properties of interest. These clustering models are, (1) self-organizing map (SOM); (2)
fuzzy learning vector quantization (FLVQ); (3) fuzzy adaptive resonance theory (fuzzy
ART); (4) growing neural gas (GNG); (5) fully self organizing simplified adaptive
resonance theory (FOSART). Although our theoretical comparison is fairly simple, it
yields observations that may appear paradoxical. First, only FLVQ, fuzzy ART, and
FOSART exploit concepts derived from fuzzy set theory. Second, only SOM, FLVQ,
GNG, and FOSART employ soft competitive learning mechanisms, which are affected

12
by asymptotic misbehaviours in the case of FLVQ, i.e., only SOM, GNG, and FOSART
are considered effective fuzzy clustering algorithms.
3.2.2. Validity Guided (Re)Clustering with Applications to Image Segmentation
(Bensaid, Hall, Bezdek, Clarke, Silbiger, Arrington, Murtagh, 1996) stresses that the
goal when clustering algorithms are applied to image segmentation, the goal is a
adequate classification. However, clustering algorithms do not directly optimize
classification duality. As a result, they are susceptible to two problems: 1) the criterion
they optimize may not be a good estimator of true classification quality. And 2) they
often admit many solutions. The paper introduces an algorithm that uses cluster validity
to mitigate problems 1 and 2. The validity-guided (re)clustering (VGC) algorithm uses
cluster-validity information to guide a fuzzy (re)clustering process toward better
solutions. It starts with a partition generated by a soft or fuzzy clustering algorithm.
Then it iteratively alters the partition by applying (novel) split-and-merge operations to
the clusters. Partition modifications that result in improved partition validity are
retained. VGC is tested on both synthetic and real-world data. For magnetic resonance
image (MRI) segmentation, evaluations by radiologists show that VGC outperforms the
(unsupervised) fuzzy c-means algorithm, and VGC’s performance approaches that of
the (supervised) k-nearest-neighbours algorithm.
3.2.3. Optimal Adaptive K-Means Algorithm with Dynamic Adjustment of
Learning Rate
(Chinrungrueng and Sequin 1995) states that adaptive k-means clustering algorithms
have been used in several artificial neural network architectures, such as radial basis
function Networks or feature-map classifiers, for a competitive partitioning of the input
domain. The paper presents an enhancement of the traditional k-means algorithm. It
approximates an optimal clustering solution with an efficient adaptive learning rate,
which renders it usable even in situations where the statistics of the problem task varies
slowly with time. This modification is based on the optimality criterion fort he k-means

13
partition stating that: all the regions in an optimal k-means partition have the same
variations if the number of regions in the partition is large and the underlying
distribution for generating input patterns is smooth. The goal of equalizing these
variations is introduced in the competitive function that assigns each new pattern vector
to the appropriate region. To evaluate the optimal k-means algorithm, the authors first
compare it to other k-means variants on several simple tutorial examples, then the
authors evaluate it on a practical application: vector quantization of image data.
3.2.4. Self-Splitting Competitive Learning Through a New Online Clustering
Paradigm
(Zhang and Liu 2002) states that clustering in the neural-network literature is generally
based on the competitive learning paradigm. The paper addresses two major issues
associated with conventional competitive learning, namely, sensitivity to initialization
and difficulty in determining the number of prototypes. In general, selecting the
appropriate number of prototypes is a difficult task, as we do not usually know the
number of clusters in the input data a priori. It is therefore desirable to develop an
algorithm that has no dependency on the initial prototype locations and is able to
adaptively generate prototypes to fit the input data patterns. Authors present a new,
more powerful competitive learning algorithm, self-splitting competitive learning
(SSCL), which is able to find the natural number of clusters based on the one-prototype-
take-one-cluster (OPTOC) paradigm and a self-splitting validity measure. It starts with
a single prototype randomly initialized in the feature space and splits adaptively during
the learning process until all clusters are found; each cluster is associated with a
prototype at its center. Authors have conducted extensive experiments to demonstrate
the effectiveness of the SSCL algorithm. The results show that SSCL has the desired
ability for a variety of applications, including unsupervised classification, curve
detection, and image segmentation.
14
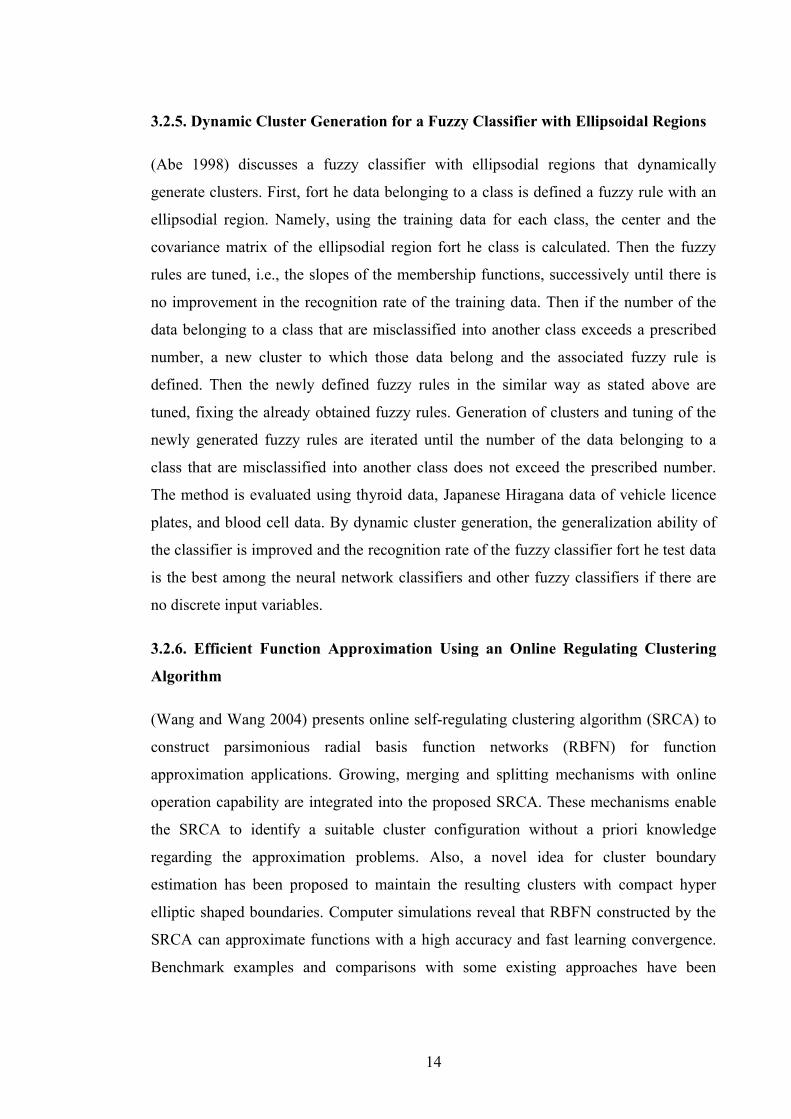
3.2.5. Dynamic Cluster Generation for a Fuzzy Classifier with Ellipsoidal Regions
(Abe 1998) discusses a fuzzy classifier with ellipsodial regions that dynamically
generate clusters. First, fort he data belonging to a class is defined a fuzzy rule with an
ellipsodial region. Namely, using the training data for each class, the center and the
covariance matrix of the ellipsodial region fort he class is calculated. Then the fuzzy
rules are tuned, i.e., the slopes of the membership functions, successively until there is
no improvement in the recognition rate of the training data. Then if the number of the
data belonging to a class that are misclassified into another class exceeds a prescribed
number, a new cluster to which those data belong and the associated fuzzy rule is
defined. Then the newly defined fuzzy rules in the similar way as stated above are
tuned, fixing the already obtained fuzzy rules. Generation of clusters and tuning of the
newly generated fuzzy rules are iterated until the number of the data belonging to a
class that are misclassified into another class does not exceed the prescribed number.
The method is evaluated using thyroid data, Japanese Hiragana data of vehicle licence
plates, and blood cell data. By dynamic cluster generation, the generalization ability of
the classifier is improved and the recognition rate of the fuzzy classifier fort he test data
is the best among the neural network classifiers and other fuzzy classifiers if there are
no discrete input variables.
3.2.6. Efficient Function Approximation Using an Online Regulating Clustering
Algorithm
(Wang and Wang 2004) presents online self-regulating clustering algorithm (SRCA) to
construct parsimonious radial basis function networks (RBFN) for function
approximation applications. Growing, merging and splitting mechanisms with online
operation capability are integrated into the proposed SRCA. These mechanisms enable
the SRCA to identify a suitable cluster configuration without a priori knowledge
regarding the approximation problems. Also, a novel idea for cluster boundary
estimation has been proposed to maintain the resulting clusters with compact hyper
elliptic shaped boundaries. Computer simulations reveal that RBFN constructed by the
SRCA can approximate functions with a high accuracy and fast learning convergence.
Benchmark examples and comparisons with some existing approaches have been

15
conducted to validate the effectiveness and feasibility of the SRCA for function
approximation problems.
3.3. ONLINE SELF REGULATING SYSTEM
3.3.1. Finding Cluster Numbers
In order to figure out cluster numbers, x-means algorithm is implemented. X-means
algorithm is implemented to figure out the optimum number of clusters that fits best to
the data. Other clustering algorithm takes cluster number and distributes items for this
number. In this situation don’t know optimum cluster number, so we must use a
algorithm for calculate optimum cluster number. X-mean is an ideal algorithm for this
situation.
3.3.2 Online Self Regulating Cluster Analysis Design
For online clustering algorithms, growing mechanisms are frequently used to
dynamically adapt new data for the identification of cluster configuration (Wang 2007),
(Abe 1998). In the design of growing mechanisms, the range of cluster boundaries plays
a decisive role in the clustering outcome. However, this parameter is difficult, if not
impossible, for users to acquire in advance. An aligned clustering algorithm that uses a
pre-specified constant to define the variance of initial clusters and then grows clusters
for new data that are not covered by the existing clusters (Juang and Lin 1998). If the
pre-specified variance of clusters is small, the number of clusters will be large in the
final clustering result. Contrarily, all the data will be covered by one cluster if the
variance is too big. That is, the outcome of this clustering algorithm is fully governed by
this constant. A satisfactory result may require some trial-and-error effort or prior
knowledge of the data distribution. Unlike using a constant for cluster initialization, the
authors in (Zhang and Liu 2002) constructed a dynamic neighborhood for a randomly
assigned cluster prototype and gradually reduced its size to zero to guarantee the
convergence of the prototype. This idea was named a one-prototype-take-one-cluster. In
their algorithm, the number of clusters grows by the evaluation of a split validity
criterion that is satisfied when the distance between the prototype (a) Cluster boundary
16
estimation using rectangles to enclose elliptical clusters. (b) The moving trajectories of
the regulating vectors and the variation of cluster variances and the centroid of the
cluster is less than a predefined threshold. The bigger the threshold is, the poorer the
accuracy of the clustering. Some adjacent clusters merge into one cluster since there is
no merging criterion.
From the above literature review, we conclude that a reliable clustering algorithm
should be capable of 1) cooperatively integrating both growing and merging
mechanisms into a systemic framework, 2) dynamically regulating the size as well as
the number of clusters, and 3) effectively extracting the information of cluster
distribution. These three main properties have directed our research effort to developing
the proposed self-regulating clustering algorithm (SRCA). A novel idea has been
formulated to dynamically regulate cluster boundaries with the integration of growing
and merging mechanisms to systematically reveal the number as well as the prototypes
of the clusters.
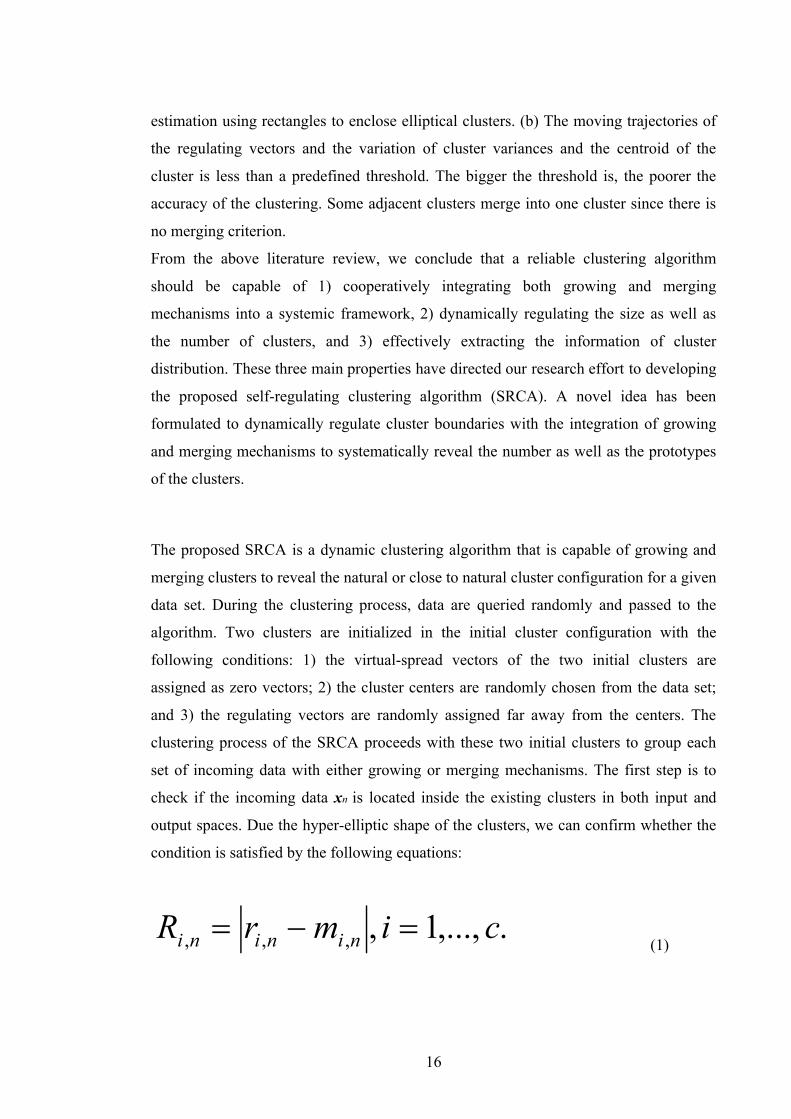
The proposed SRCA is a dynamic clustering algorithm that is capable of growing and
merging clusters to reveal the natural or close to natural cluster configuration for a given
data set. During the clustering process, data are queried randomly and passed to the
algorithm. Two clusters are initialized in the initial cluster configuration with the
following conditions: 1) the virtual-spread vectors of the two initial clusters are
assigned as zero vectors; 2) the cluster centers are randomly chosen from the data set;
and 3) the regulating vectors are randomly assigned far away from the centers. The
clustering process of the SRCA proceeds with these two initial clusters to group each
set of incoming data with either growing or merging mechanisms. The first step is to
check if the incoming data xn is located inside the existing clusters in both input and
output spaces. Due the hyper-elliptic shape of the clusters, we can confirm whether the
condition is satisfied by the following equations:
.,...,1,,,, cimrR ninini (1)

17
,...2
2
,,
2
2
,2,2
2
2
,1,1
,,,2,1 niknini R
mx
R
mx
R
mx niknkninnin
ni
(2)
where mi,n = [mi1,n, mi2,n, …, mik,n,]T, Ri,n = [Ri1,n, Ri2,n, …, Rik,n,]T, and the components of
R denote the radiuses of the ith cluster boundary. Note that the values of Λi,n, i = 1,…,
c, are computed to determine the locations of the incoming data in both the input and
output spaces. If the data is covered by the existing clusters, the values of Λi,n in both
the input and output spaces should be less than (or equal to) 1. We treat the incoming
data as an internal point. Otherwise, we regard the incoming data as an external point of
the existing clusters.
If the incoming data is an external point, before a new cluster is created, the data will be
further examined by two additional criteria: 1) the constraint of input-output mapping
consistency (MC), and 2) the limitation of cluster variances (CV) in the output space.
These two criteria are proposed so as to prevent false determination caused by the
immature coverage of clusters in the initial stage. The first criterion was adopted
from our previous study and is based on a general assumption for data clustering:
similar input patterns should map to similar output patterns. The input-output mapping
relationship is defined as “consistent” if two clusters are reciprocally close in Euclidean
distance to each other in both input space and output space. Then these two clusters can
be considered to be from the same class and thus can be merged together. Otherwise, if
two clusters are reciprocally close in the input space but are far away in the output
space, then these two clusters can belong to different classes. Here, we treat the
incoming data as the centroid of a candidate cluster and use the above concept to
evaluate the mapping relationship between the existing clusters and the candidate
cluster. In the initial clustering stage, the coverage of each cluster is gradually
broadened to group similar data into the same cluster. If the creation of new clusters is
solely based on whether the data is an

18
external point of the existing clustering, then some redundant clusters can be generated
due to the immature cluster coverage in the initial stage. Hence, we introduce the
mapping consistency as an important criterion for the determination of the execution of
the growing mechanism. In addition, if the incoming data satisfies the mapping
consistency with a cluster, say the ith cluster, but is not covered by all the existing
clusters, we consider that the incoming data is a member of the ith cluster. The limitation
of CV in the output space is introduced as a sifting criterion if the following inequality
is satisfied.
,.... 2,
22,
21, Tkiiii
(3)
where δi is the output variance of the ith cluster containing the incoming data and T is a
pre-specified constant. The reason why we only consider the output variance is that the
output clusters are directly related to the performance of data classifications.
If the incoming data does not satisfy any one of the above two criteria, a new cluster
will be created with the incoming data as its centroid. Otherwise, the existing cluster
configuration will be updated with respect to the incoming data. On the other hand, if
the incoming data is an internal point, the cluster boundary estimation approach will be
employed to update the cluster parameters, such as the cluster centers, virtual-spread
vector, and regulating vectors.

19
4. PROBLEM SOLUTION AND FINDINGS
4.1. Application of Performance Clustering By Using Self Regulating Clustering to
the Human Resource Performance Data
In order to figure out how many clusters are present, first x-mean algorithms are
calculated. The result of the x-mean algorithm yields the centroids. After this point
every datum included to the data set is first determined in which cluster it will be
included and then the regulator vector is updated. Finally, the ellipse is depicted on the
regulator vector value.
In this study, our intent is to apply Self Regulating Clustering Method to evaluate HR
performance by using cluster analysis.
In system identification, the purpose of clustering is to find relationships between
independent system variables and future values of dependent variables. One should,
however, realize that the relations revealed by clustering are just causal associations
among the data vectors, and as such do not yet constitute a prediction model of the
given system. To obtain such a model, additional steps are needed.
System Inputs;
Personnel Id: using for identification
Performance grade: takes from relevant manager
Lines of grade for each personnel: count of grade line
Table 4.1: Simple input data
PersonnelId
Grade# of evaluation
of criteria
194 4 28
196 2 22
197 3 17
199 2 22
215 3 34

20
Output:
Dependent on input values estimate cluster count and distribution.
System take 1100 personnel data and 17,000 capability or performance target row for
relevant. First find cluster count using X-mean algorithm –find 4 cluster - , later find
and show these data cluster distributions using self regulating method.

21
X-mean results
X-mean algorithm applies for finds optimum number of cluster count, average of
distance for each cluster point and standard deviation for each cluster.
Figure 4.1: Result of finding optimum cluster number using X-mean algorithm.
Dunn's Index (DI): This index is originally proposed to use at the identification of
"compact and well separated clusters". So the result of the clustering has to be
recalculated as it was a hard partition algorithm.
Alternative Dunn Index (ADI): The aim of modifying the original Dunn's index was
that the calculation becomes more simple, when the dissimilarity
In Figure 3.1 shows optimum number of cluster for x-mean algorithm. Dunn Index and
Alternative Dunn Index shows ideal cluster number, our algorithm select minimum
count for cluster number.

22
After finding this information about clusters, this data is passed on the c-means
algorithm.
Table 4.2: X-mean algorithm configuration parameters
Parameter Value
Requested iterations 1Iterations performed 1Splits prepared 2Splits performed 2Cutoff factor 0.5Percentage of splits accepted by cutoff factor 0 %Cutoff factor 0.5Cluster centers 4 centers
X-Means is K-Means extended by an Improve-Structure part in this part of the
algorithm the centers are attempted to be split in its region. The decision between the
children of each center and itself is done comparing the BIC-values of the two
structures.
X-mean calculates and performance parameter shows on Table 3.2. Parameter “cutoff
factor” means takes the given percentage of the spitted centroids if none of the children
win.
Mean and standard deviation values for all clusters are as summarized below:
Table 4.3: Clusters
Cluster Mean Standard Deviation
0 0.6005 0.38611 0.3907 0.18432 1.0 -0.84433 0.7994 0.6080

23
Table 4.3 displays findings for cluster number, means and standard deviation for each
cluster. This information is using by c-mean algorithm.
Table 4.4: Clustered Instances
Cluster Number of row Percent of Row
0 633 57%1 140 13%2 30 3%3 311 28%
Table 3.4 displays number of data for each cluster and percent. We can see distribution of data on charts.
Figure 4.2: Result of Fuzzy C-means algorithm by the synthetic overlappingperformance data with normalization.

24
The Fuzzy C-means clustering algorithm uses the minimization of the fuzzy C-means
functional. There are three input parameter needed to run this function: as the number of
clusters or initializing partition matrix. The one latter parameter has their default value
5, if they are not given by X-mean algorithm. The function calculates with the standard
Euclidean distance norm, the norm inducing matrix is an NXN identity matrix. The
result of the partition is collected in structure arrays. One can get the partition matrix
cluster centers, the square distances, the number of iteration and the values of the C-
means functional at each iteration step.
In Fig. 4.2 the '.' remark the data points, the 'o' the cluster centers, which are the
weighted mean of the data. The algorithm can only detect clusters with circle shape, that
is why it cannot really discover the orientation and shape of the cluster "right below" in
Fig. 4.2 the circles in the contour-map are a little elongated, since the clusters have
correct on each other. However the Fuzzy C-means algorithm is a very good
initialization tool for more sensitive methods

25
Figure 4.3: Result of Gustafson-Kessel algorithm by the synthetic overlap-pingperformance data with normalization.
The clustering algorithm forces, that each cluster has its own norm inducing matrix Ai,
so they are allowed to adapt the distance norm to the local topological structure of the
data points. The algorithm uses the Mahalanobis distance norm.
There are two numerical problems with Gustafson-Kessel algorithm.
1. If there is no prior knowledge, the prior probability for each cluster. is 1 for each
cluster, so the GK algorithm can 2nd only clusters with approximately equal volumes.
2. A numerical drawback of Gustafson-Kessel algorithm is: When an Eigenvalue is zero
or when the ratio between the maximal and the minimal Eigenvalue, i.e. the condition
number of the covariance matrix is very large, the matrix is nearly singular.

26
Also the normalization to a fixed volume fails, as the determinant becomes zero. In this
case it is useful to constrain the ratio between the maximal and minimal eigenvalue, this
ratio should be smaller than some predefined threshold.
In Fig. 4.3 the '.' remark the data points, the 'o' the cluster centers. Since this algorithm
is an extension of the C-means algorithm (uses adaptive distance norm), it detects the
elongated clusters. The orientation and shape can be "mined" from the eigenstructure of
the covariance matrix: the directions of the axes are given by the eigenvectors. In Fig.
4.3 the contour-map shows the superposition of the four ellipsoidal clusters.

27
Figure 4.4: Result of Gath-Geva algorithm by the synthetic overlapping data with normalization.
In the figure 4.4 the '.' remark the data points, the 'o' the cluster centers. Cause of the
exponential term in the distance norm, which decreases faster by increasing distance,
the Gata-Geva algorithm divides the data space into disjoint subspaces shown in Fig.
4.4

28
Figure 4.5: The display of data without regulating vector ellipse
Figure 4.6: The display of personnel total performance data with self regulating ellipse
Fig 4.5 displays distributions of personnel total performance data base on fuzzy c-mean
algorithm. Finally software draws ellipse using regularity vector variables, result shown
on Fig 4.6
Note that desired criteria may be implemented on choice.
4.2. RECEIVER OPERATING CHARACTERISTIC CURVE ANALYSIS
ROC graphs are another way in addition to confusion matrices to analyze the
performance of classifiers. A ROC graph is a plot with the false positive rate on the X
axis and the true positive rate on the Y axis. The point (0,1) is the perfect classifier
because it classifies all positive cases and negative cases correctly. It is (0,1) because
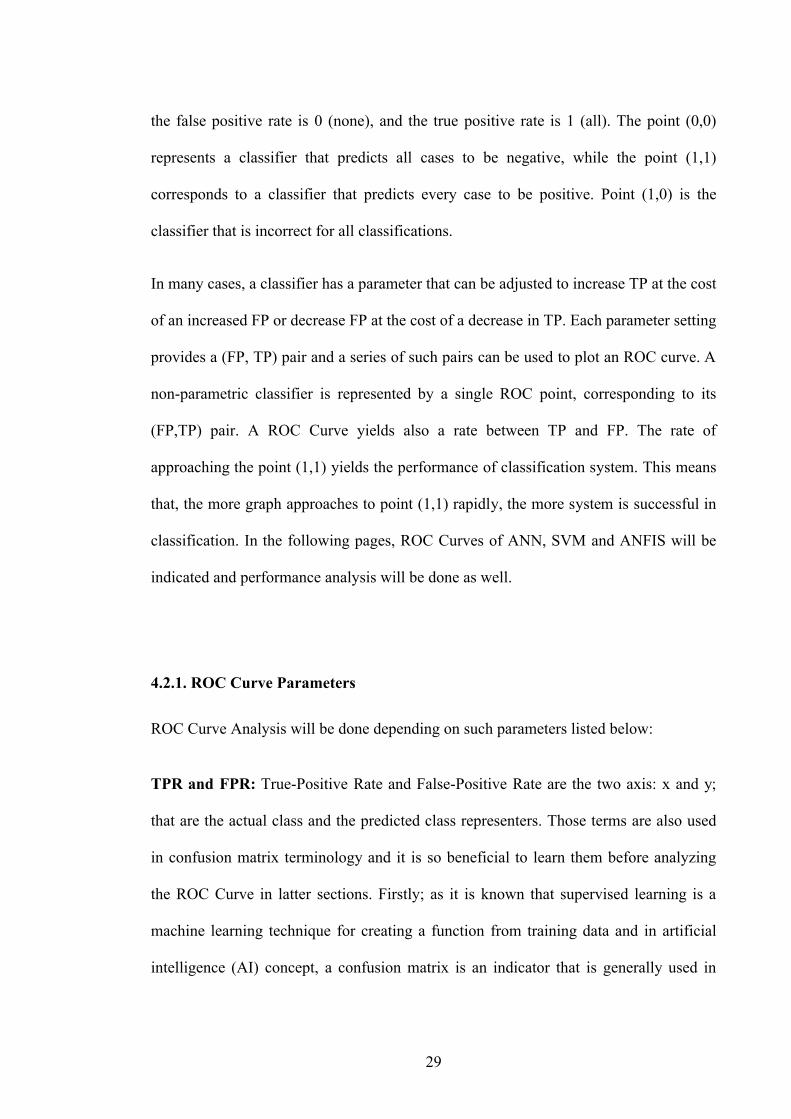
29
the false positive rate is 0 (none), and the true positive rate is 1 (all). The point (0,0)
represents a classifier that predicts all cases to be negative, while the point (1,1)
corresponds to a classifier that predicts every case to be positive. Point (1,0) is the
classifier that is incorrect for all classifications.
In many cases, a classifier has a parameter that can be adjusted to increase TP at the cost
of an increased FP or decrease FP at the cost of a decrease in TP. Each parameter setting
provides a (FP, TP) pair and a series of such pairs can be used to plot an ROC curve. A
non-parametric classifier is represented by a single ROC point, corresponding to its
(FP,TP) pair. A ROC Curve yields also a rate between TP and FP. The rate of
approaching the point (1,1) yields the performance of classification system. This means
that, the more graph approaches to point (1,1) rapidly, the more system is successful in
classification. In the following pages, ROC Curves of ANN, SVM and ANFIS will be
indicated and performance analysis will be done as well.
4.2.1. ROC Curve Parameters
ROC Curve Analysis will be done depending on such parameters listed below:
TPR and FPR: True-Positive Rate and False-Positive Rate are the two axis: x and y;
that are the actual class and the predicted class representers. Those terms are also used
in confusion matrix terminology and it is so beneficial to learn them before analyzing
the ROC Curve in latter sections. Firstly; as it is known that supervised learning is a
machine learning technique for creating a function from training data and in artificial
intelligence (AI) concept, a confusion matrix is an indicator that is generally used in
30
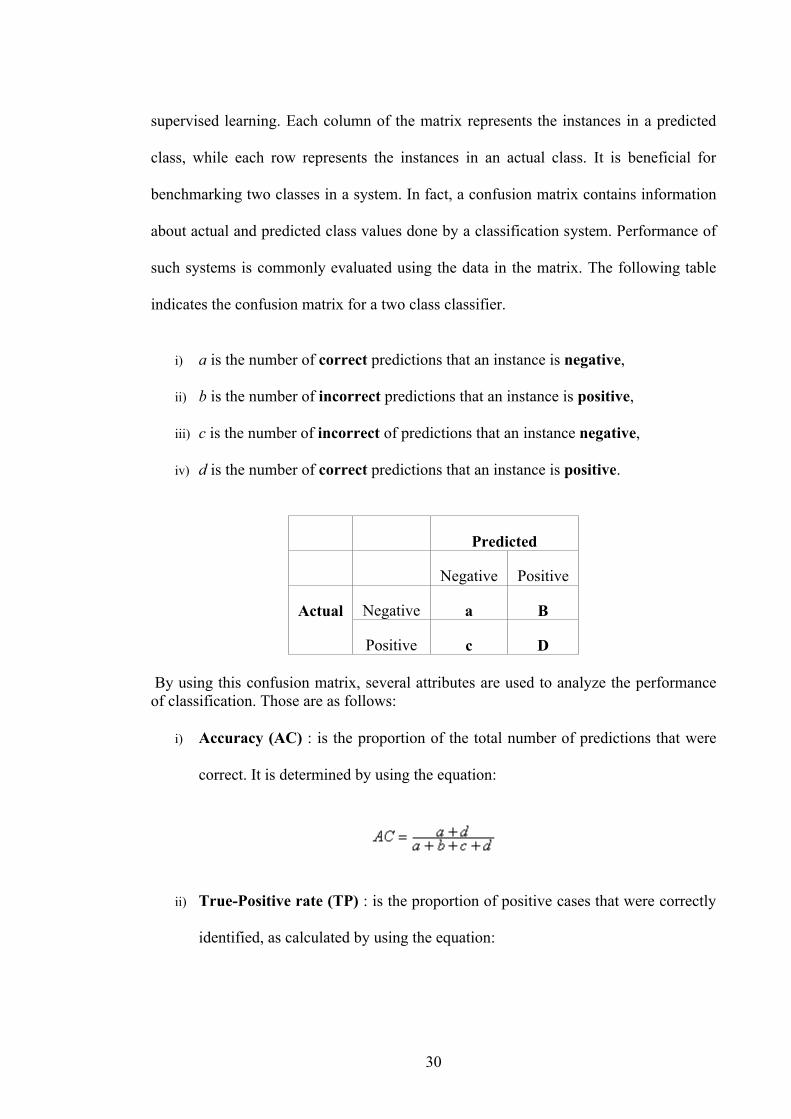
supervised learning. Each column of the matrix represents the instances in a predicted
class, while each row represents the instances in an actual class. It is beneficial for
benchmarking two classes in a system. In fact, a confusion matrix contains information
about actual and predicted class values done by a classification system. Performance of
such systems is commonly evaluated using the data in the matrix. The following table
indicates the confusion matrix for a two class classifier.
i) a is the number of correct predictions that an instance is negative,
ii) b is the number of incorrect predictions that an instance is positive,
iii) c is the number of incorrect of predictions that an instance negative,
iv) d is the number of correct predictions that an instance is positive.
Predicted
Negative Positive
Actual Negative a B
Positive c D
By using this confusion matrix, several attributes are used to analyze the performance of classification. Those are as follows:
i) Accuracy (AC) : is the proportion of the total number of predictions that were
correct. It is determined by using the equation:
ii) True-Positive rate (TP) : is the proportion of positive cases that were correctly
identified, as calculated by using the equation:

31
iii) False-Positive rate (FP) : is the proportion of negatives cases that were
incorrectly classified as positive, as calculated by using the equation:
iv) True-Negative rate (TN) : is defined as the proportion of negatives cases that
were classified correctly, as calculated by using the equation:
v) False-Negative rate (FN) : is the proportion of positives cases that were
incorrectly classified as negative, as calculated by using the equation:
vi) Precision (P) : is the proportion of the predicted positive cases that were correct,
as calculated by using the equation:
According to this terminology, ROC Curve uses these two parameters as its axises and
the ROC Curve shows the relationship between TP and FP axises and this yields the
performance and accuracy of classification.

32
AUC :The area under the curve (AUC) is a measure of the ability of the diagnostic test
to correctly identify cases. Diagnostic tests with higher AUCs are generally better and
should always be higher than 0.5, indicating the test is better at diagnosing than chance.
A hypothesis test is used to statistically test if the diagnostic test is better than chance at
correctly diagnosing state. A significant p- value indicates the diagnostic test is better at
diagnosing than chance.
SE: Standard error estimate under the area of ROC Curve. This shows the average
deviation from the findings of ROC resulting data.
Confidence Interval: The criterion commonly used to measure the ranking quality of a
classification algorithm is the area under the ROC curve (AUC). To handle it properly,
it is important to determine an interval of confidence for its value. Confidence interval
yields how the ROC curve is confidential with its results. Therefore, the higher
confidence interval, the higher correctness in the results of classification.
4.2.2. ROC Curve Analysis (Fuzzy C-Mean)
The ROC Curve of Fuzzy c-means filter is as follows shown below:
Table 4.5: ROC Curve Analysis of Fuzzy c-means result
Test Area 95% CI SE Z pFuzzy c-means 0.58 0.46 to 0.70 0.062 1.29 0.983
As seen in Table 4.7 above, classes with their TPR and FPR and the area under the each
step of TP and FP axises are handled with software. Area means that at each step, the
distance between ROC Curve point and the diagonal line changes depending on the

33
values of TP and FP values. Necessary values to benchmark Fuzzy C-mean with other
filters are as follows with their values found by Fuzzy C-mean below:
i) AUC: 0,58
ii) SE: 0,062
iii) Confidence Interval: 0,46 to 0.70
ROC Curve
0
0.1
0.2
0.3
0.4
0.5
0.6
0.7
0.8
0.9
1
0 0.1 0.2 0.3 0.4 0.5 0.6 0.7 0.8 0.9 1
False positive rate (1-Specificity)
Tru
e p
os
itiv
e r
ate
(S
en
sit
ivit
y)
Figure 4.7: ROC Curve of Fuzzy C-Means
AUC is the total area under the curve and it means that how much less amount of AUC
exist, then, the classification is more accurate and has more performance. AUC of Fuzzy
C-mean is 0.58.
34
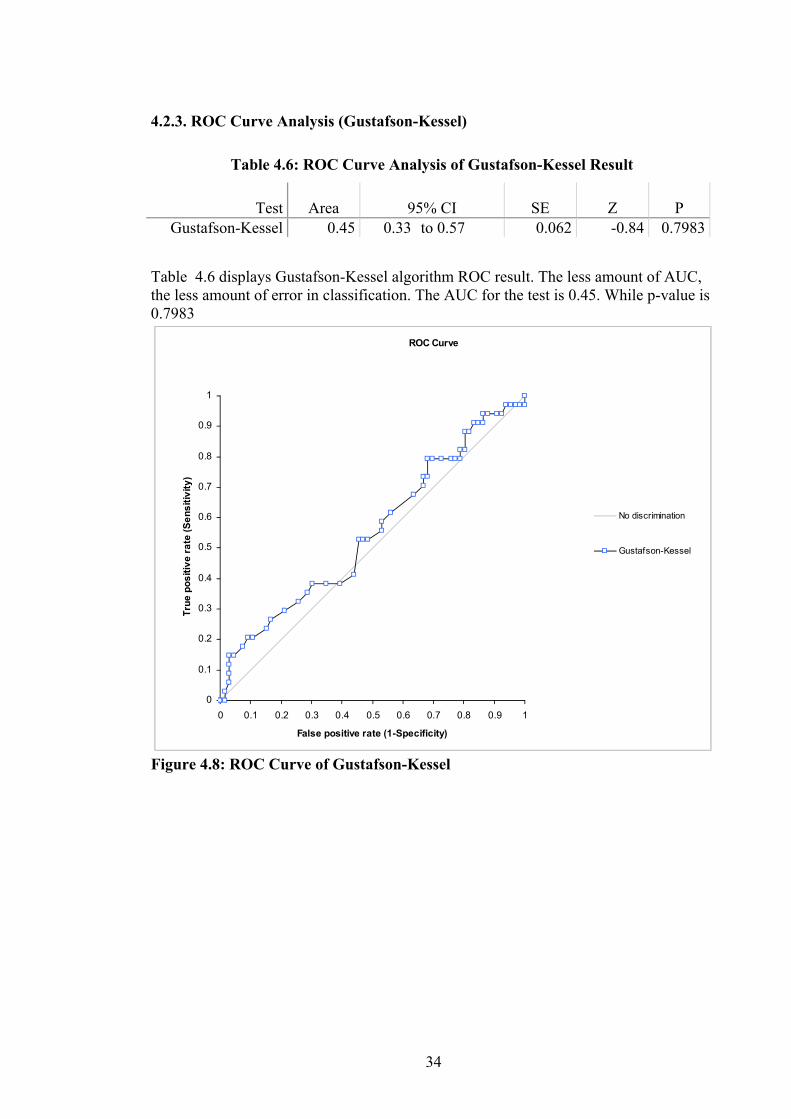
4.2.3. ROC Curve Analysis (Gustafson-Kessel)
Table 4.6: ROC Curve Analysis of Gustafson-Kessel Result
Test Area 95% CI SE Z PGustafson-Kessel 0.45 0.33 to 0.57 0.062 -0.84 0.7983
Table 4.6 displays Gustafson-Kessel algorithm ROC result. The less amount of AUC, the less amount of error in classification. The AUC for the test is 0.45. While p-value is 0.7983
ROC Curve
0
0.1
0.2
0.3
0.4
0.5
0.6
0.7
0.8
0.9
1
0 0.1 0.2 0.3 0.4 0.5 0.6 0.7 0.8 0.9 1
False positive rate (1-Specificity)
Tru
e p
os
itiv
e r
ate
(S
en
sit
ivit
y)
No discrimination
Gustafson-Kessel
Figure 4.8: ROC Curve of Gustafson-Kessel

35
4.2.4. ROC Curve Analysis (Gath-Geva)
Table 4.7: ROC Curve Analysis of Gath-Geva Result
Test Area 95% CI SE Z pGath-Geva 0.42 0.30 to 0.54 0.061 -1.35 0.9121
In Table 4.7 shows Gath-Geva algorithm ROC result. The less amount of AUC, the
less amount of error in classification. The AUC for the test is 0.42. While p-value is
0.9121
ROC Curve
0
0.1
0.2
0.3
0.4
0.5
0.6
0.7
0.8
0.9
1
0 0.1 0.2 0.3 0.4 0.5 0.6 0.7 0.8 0.9 1
False positive rate (1-Specificity)
Tru
e p
os
itiv
e r
ate
(S
en
sit
ivit
y)
No discrimination
Gath-Geva
Figure 4.9: ROC Curve of Gath-Geva
Depending on this information the area under the curve for Fuzzy c-means is 0.58 and
this value is greater than the critical value 0.5. the area for Gustafson-Kessel and Gath-

36
Geva are 0.45 and 0.42. These results reveal that, Fuzzy c-means display the best
performance amount those three methods.

37
5. CONCLUSIONS
Online Self Regulating Clustering Method is applied to the human resource
performance data, which are gathered from 1100 employees’ yearly performance scores
for two years.
The vital point in performance data evaluation is not gathering data and applying
standard methods, but attaining concrete results through tailored to fit techniques for
distinguishing among employees’ performances. In this sense, Online Self Regulating
Clustering Method yields optimum results to contribute in improving human resource
management performance, and also hits bull’s eye in promotion, bonus, and related
fringe benefit decisions, thus maximize personnel motivation and corporate
profitability.
In this study, upon given performance evaluation data gathered from a special firm’s
human resource management department, clustering analysis is run to figure out
questions arising due to how to perceive and contrast different employee’s performance
evaluation results which are working at varying organizational units while those data are
merely summarized as row score values. More importantly, when a perception of those
data and comparison of different employee’s performance data is on the focus for taking
critical organizational decisions like, promotions, fringe benefit allotments, salary raises
and so like, and an obstacle lies before the decision maker such that performance
evaluation for every employee is undertaken concerning heavily the special
requirements of each and every specific unit in the organization, a concrete tool to
reconcile those performance evaluation scores with contrasting bases is of critical
importance. Thus, clustering analysis as a reconciliation basis for contrasting employee
performance evaluation data for critical decision making is of much assistance.
The result of the study utilizing clustering analysis on the data resulted in clustering our
data in an optimum number of four different clusters. Such that, every cluster include
qualitatively close performances while many of them stem from quantitatively diverse
performance scores. Hence, a comparison among varying employees from diverse
organizational units became probable upon statistically valid and justifiable
foundations.

38
6. REFERENCES
6.1. Books
Jain , A. K. and Dubes, R. C. Algorithms for clustering data, New York: Prentice Hall,
1988.
Wang, Jeen-Shing, A Self-Regulating Clustering Algorithm for Function
Approximation. Taiwan, R.O.C., 2007.
J. C. Bezdek, Pattern Recognition with Fuzzy Objective Function Algorithms, Plenum
Press, 1981
6.2. Periodicals
Abe, S., “Dynamic cluster generation for a fuzzy classifier with ellipsoidal regions,”
IEEE Trans. Syst., Man, Cybern. B, vol. 28, no.6, pp. 869–876, Dec. 1998.
Arthur, J.B., ‘Effects of Human Resource Systems on Manufacturing Performance and
Turnover’, Academy of Management Journal, vol. 37, no. 3, pp. 670-687, 1994
Baraldi, A. and Blonda, P., “A survey of fuzzy clustering algorithms for pattern
recognition-part I,” IEEE Trans. on Systems, Man and Cybernetics, vol. 29, no. 6,
pp. 778-785, Dec. 1999.
Becker, B. and Gerhart, B. “The impact of human resource management on
organizational performance: Progress and prospects,” The Academy of
Management Journal, vol. 39, No. 4, pp. 779-801, 1996.
Bensaid, A. M., Hall, L. O., Bezdek, J. C., Clarke, L. P., Silbiger, M. L., Arrington, J.
A. and Murtagh, R. F. “Validity-guided (re)clustering with applications to image

39
segmentation,” IEEE Trans. on Fuzzy Systems, vol. 4, no. 2, pp. 112-123, May
1996.
Berman, E., West, J., and Wang., X., ‘Using Performance Measurement in Human
Resource Management’, Review of Public Personnel Administration, vol. 29, no.
2, pp. 5-17. 1999.
Chien, Chen-Fu and Chen, Li-Fei, “Data mining to improve personnel selection and
enhance human capital: A case study in high-technology industry,” Expert
Systems with Applications, vol. 34, pp. 280-90, 2008.
Chinrungrueng, C. and Séquin, C. H. “Optimal adaptive k-means Algorithm with
dynamic adjustment of learning rate,” IEEE Trans. on Neural Networks, vol. 6,
no. 1, pp. 157-169, Jan. 1995.
Guest, D. E., ‘Human Resource Management and Performance: A Review and Research
Agenda’, International Journal of Human Resource Management, vol. 8, no. 3, pp.
263-276. 1997.
Holland, P., Sheehan, C. and De Cieri, H. “Attracting and retaining talent: Exploring
human resources development trends in Australia,” Human Resource
Development International, vol. 10, No. 3, pp. 247-62, 2007.
I. Gath and A.B. Geva, Unsupervised Optimal Fuzzy Clustering, IEEE Transactions on
Pattern Analysis and Machine Intelligence, pp: 773-781, 1989
Li, C. H. and Yuen, P. C. “Regularized color clustering in medical image database,”
IEEE Trans. on Medical Imaging, vol. 19, no. 11, pp. 1150-1155, Nov. 2000.
Pelleg, D., Moore, A. W., X-means: Extending K-means with Efficient Estimation of
the Number of Clusters, Proceedings of the Seventeenth International Conference
on Machine Learning, p.727-734, June 29-July 02, 2000.
40
R. Babuska, P.J. van der Veen, and U. Kaymak. Improved co-variance estimation for
GustafsonKessel clustering. In Proceedings of 2002 IEEE International
Conference on Fuzzy Systems, pp 1081-1085, Honolulu, Hawaii, May 2002
Stavrou, E. T., Charalambous, C. and Spiliotis, S. “Human resource management and
performance: A neural network analysis,” European Journal of Operational
Research, vol. 181, pp. 453-67, 2006.
Wang, Jiun-Kai and Wang, Jeen-Shing, “Efficient function approximation using an
online regulating clustering algorithm,” IEEE International Conference on System,
Man, and Cybernetics, Vol. 6, Issue 10-13, pp. 5935-40, 2004.
Young, D. and Gray, A. J. “Semi-automatic boundary detection for identification of
cells in DIC microscope images,” Proc. of IEEE Sixth Int'l Conf. on Image
Processing and Its Applications, vol. 1, pp. 246-250, July 1997.
Zhang,Ya-Jun and Liu, Zhi-Qiang, “Self-splitting competitive learning: a new on-line
clustering paradigm,” IEEE Trans. on Neural Networks, vol. 13, no. 2, pp. 369-
380, 2002.

41
6.3. Other Publications
Hutchinson, S. Kinnie, N. & Purcell, J., “HR Practices and Business Performance: what
makes a difference?” Conference Paper, Nijmegen School of Management,
Netherlands. 2001,
Juang, F. and Lin, C. T., “An on-line self-constructing neural fuzzy inference network
and its applications,” IEEE Trans. on Fuzzy Systems, Vol. 6, Issue: 1, pp. 12-32,
1998.
Wang, J. S. and Lee, C. S. G. "Self-adaptive recurrent neuro-fuzzy control of an
autonomous underwater vehicle," IEEE Trans. on Robotics and Automation,
vol.19, no. 2, pp. 283-295, 2003.
42
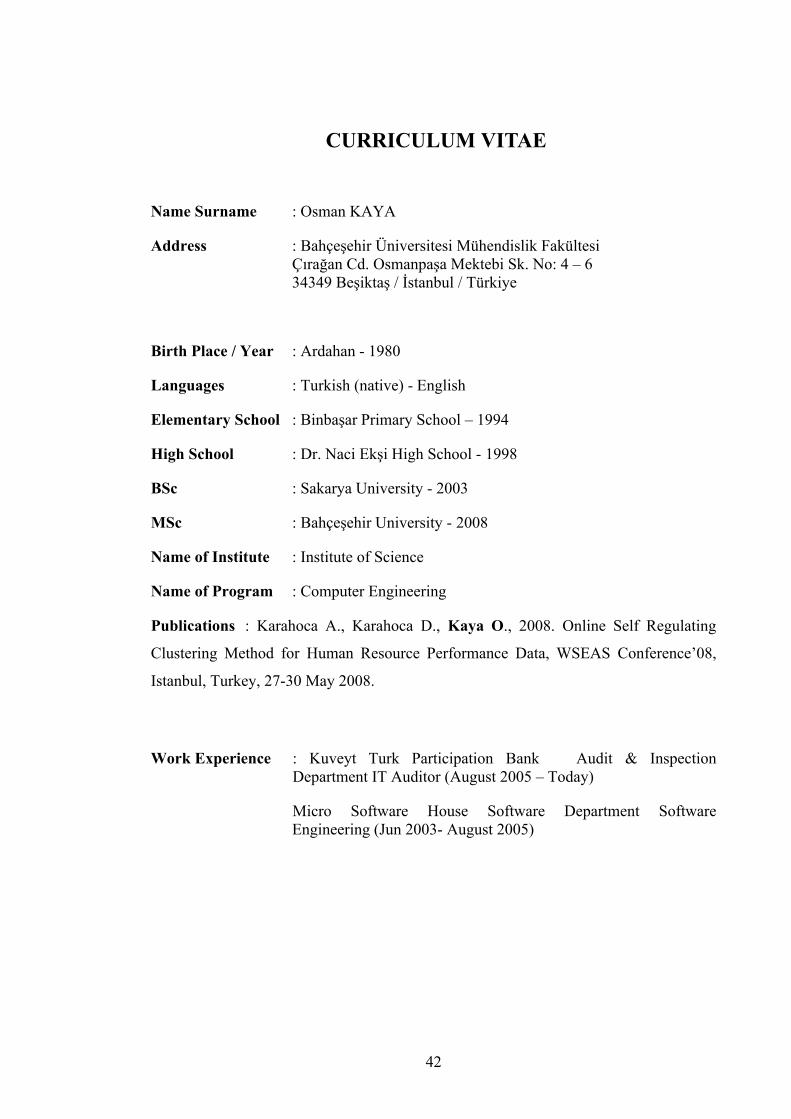
CURRICULUM VITAE
Name Surname : Osman KAYA
Address : Bahçeşehir Üniversitesi Mühendislik Fakültesi Çırağan Cd. Osmanpaşa Mektebi Sk. No: 4 – 6 34349 Beşiktaş / İstanbul / Türkiye
Birth Place / Year : Ardahan - 1980
Languages : Turkish (native) - English
Elementary School : Binbaşar Primary School – 1994
High School : Dr. Naci Ekşi High School - 1998
BSc : Sakarya University - 2003
MSc : Bahçeşehir University - 2008
Name of Institute : Institute of Science
Name of Program : Computer Engineering
Publications : Karahoca A., Karahoca D., Kaya O., 2008. Online Self Regulating
Clustering Method for Human Resource Performance Data, WSEAS Conference’08,
Istanbul, Turkey, 27-30 May 2008.
Work Experience : Kuveyt Turk Participation Bank Audit & Inspection Department IT Auditor (August 2005 – Today)
Micro Software House Software Department Software Engineering (Jun 2003- August 2005)


