HQ 10‐Year Capital PlanFY19‐28 estimates as of September 2018
Lakewood, COOctober 2, 2018
Introduction
• Welcome• Approach to plan development
– HQ/regional collaboration– Capital planning committee– Customer feedback
• Key drivers– Lifecycle management ‐ IT, Aviation– Physical Security– Improved reliability & efficiency
• Today's focus
HQ 10‐Year Capital Plan | 2

Lifecycle Management strategy
Effective lifecycle management will:– Increase reliability– Enable effective financial planning
– Meet compliance requirements• FISMA• NERC ‐ CIP• FITARA• Financial
HQ 10‐Year Capital Plan | 3
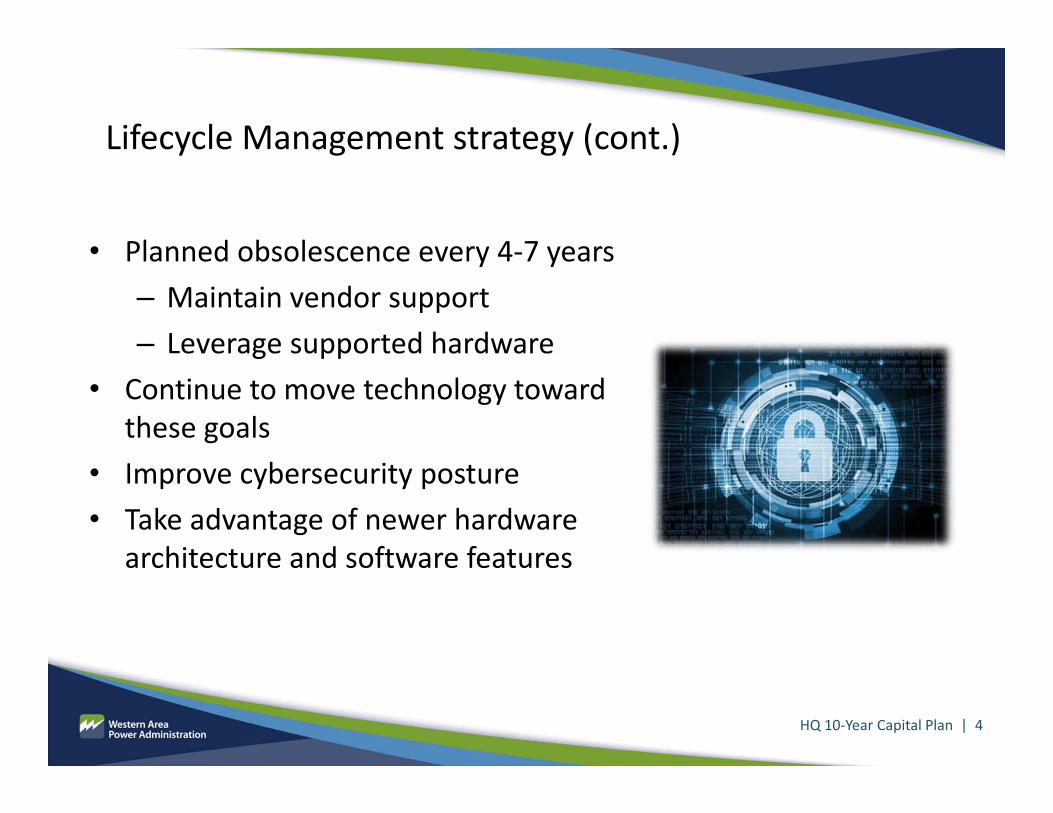
Lifecycle Management strategy (cont.)
• Planned obsolescence every 4‐7 years– Maintain vendor support– Leverage supported hardware
• Continue to move technology toward these goals
• Improve cybersecurity posture• Take advantage of newer hardware
architecture and software features
HQ 10‐Year Capital Plan | 4
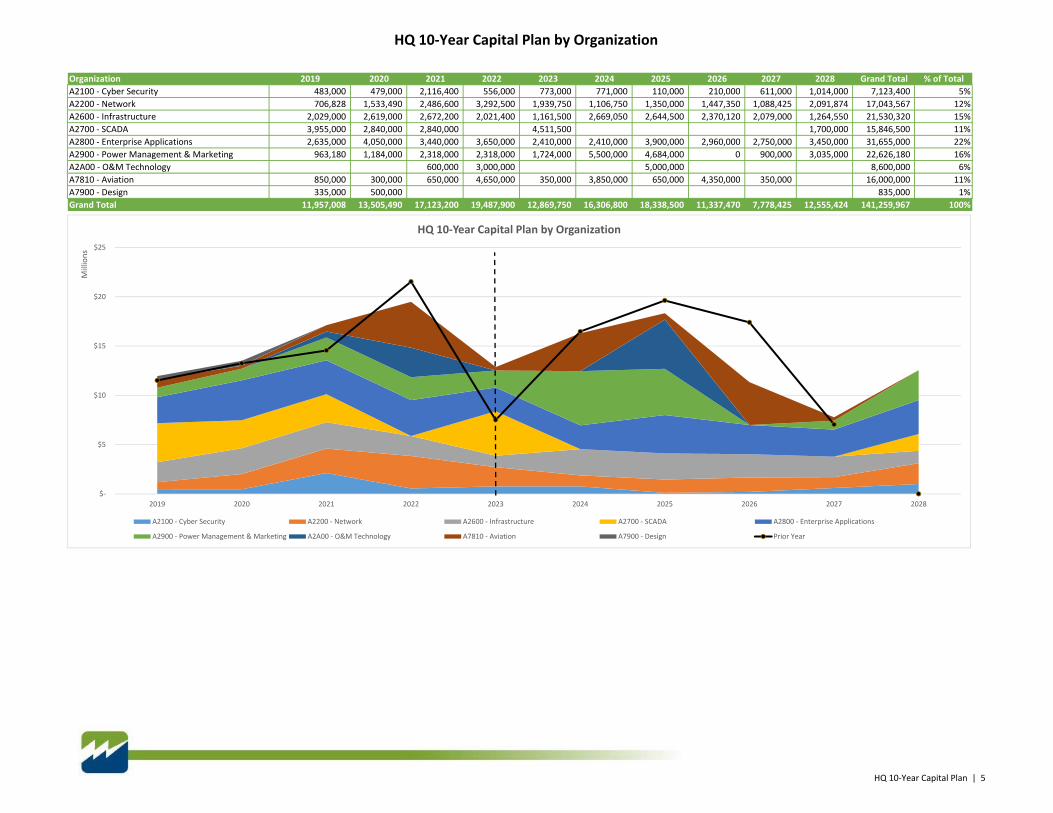
HQ 10‐Year Capital Plan by Organization
Organization 2019 2020 2021 2022 2023 2024 2025 2026 2027 2028 Grand Total % of TotalA2100 ‐ Cyber Security 483,000 479,000 2,116,400 556,000 773,000 771,000 110,000 210,000 611,000 1,014,000 7,123,400 5%A2200 ‐ Network 706,828 1,533,490 2,486,600 3,292,500 1,939,750 1,106,750 1,350,000 1,447,350 1,088,425 2,091,874 17,043,567 12%A2600 ‐ Infrastructure 2,029,000 2,619,000 2,672,200 2,021,400 1,161,500 2,669,050 2,644,500 2,370,120 2,079,000 1,264,550 21,530,320 15%A2700 ‐ SCADA 3,955,000 2,840,000 2,840,000 4,511,500 1,700,000 15,846,500 11%A2800 ‐ Enterprise Applications 2,635,000 4,050,000 3,440,000 3,650,000 2,410,000 2,410,000 3,900,000 2,960,000 2,750,000 3,450,000 31,655,000 22%A2900 ‐ Power Management & Marketing 963,180 1,184,000 2,318,000 2,318,000 1,724,000 5,500,000 4,684,000 0 900,000 3,035,000 22,626,180 16%A2A00 ‐ O&M Technology 600,000 3,000,000 5,000,000 8,600,000 6%A7810 ‐ Aviation 850,000 300,000 650,000 4,650,000 350,000 3,850,000 650,000 4,350,000 350,000 16,000,000 11%A7900 ‐ Design 335,000 500,000 835,000 1%Grand Total 11,957,008 13,505,490 17,123,200 19,487,900 12,869,750 16,306,800 18,338,500 11,337,470 7,778,425 12,555,424 141,259,967 100%
$‐
$5
$10
$15
$20
$25
2019 2020 2021 2022 2023 2024 2025 2026 2027 2028
Millions
HQ 10‐Year Capital Plan by Organization
A2100 ‐ Cyber Security A2200 ‐ Network A2600 ‐ Infrastructure A2700 ‐ SCADA A2800 ‐ Enterprise Applications
A2900 ‐ Power Management & Marketing A2A00 ‐ O&M Technology A7810 ‐ Aviation A7900 ‐ Design Prior Year
HQ 10‐Year Capital Plan | 5

HQ 10‐Year Capital Plan by Power System
Power System 2019 2020 2021 2022 2023 2024 2025 2026 2027 2028 Grand Total % of TotalBoulder Canyon Project 108,269 22,927 97,518 39,215 128,738 3,666 18,552 75,739 15,744 510,367 0%Central Arizona Project 97,805 19,557 71,909 28,917 126,419 2,703 15,489 55,849 11,610 430,257 0%Central Valley Project 601,160 2,722,500 1,440,880 1,596,000 881,128 374,250 573,700 162,500 257,000 671,100 9,280,218 7%Electrical District 5‐to‐Palo Verde Hub 166 55 424 171 26 16 50 329 68 1,305 0%Intertie (Southern Portion) 347,092 654,512 119,895 75,182 388,886 10,318 130,844 81,469 49,935 64,600 1,922,731 1%Levee Project 13,541 2,596 8,395 3,376 18,479 316 2,022 6,520 1,355 56,601 0%Parker‐Davis Project 768,586 353,031 2,033,818 1,696,082 1,229,284 264,333 405,016 705,307 507,695 584,000 8,547,152 6%Pick‐Sloan (Eastern & Western Division) 2,655,735 694,250 4,275,970 1,073,900 2,923,889 1,113,393 732,200 1,165,875 747,400 1,352,800 16,735,411 12%Salinity Project 7,094 1,385 4,749 1,910 9,461 179 1,087 3,688 767 30,318 0%Salt Lake City Area/Integrated Projects 834,860 312,927 812,943 312,248 1,290,692 139,408 441,941 574,824 161,476 200,200 5,081,519 4%WAPA Wide 6,522,700 8,721,750 8,256,700 14,660,900 5,872,750 14,398,220 16,017,600 8,505,370 6,025,375 9,682,724 98,664,089 70%Grand Total 11,957,008 13,505,490 17,123,200 19,487,900 12,869,750 16,306,800 18,338,500 11,337,470 7,778,425 12,555,424 141,259,967 100%
$‐
$5
$10
$15
$20
$25
2019 2020 2021 2022 2023 2024 2025 2026 2027 2028
Millions
HQ 10‐Year Capital Plan by Power System
WAPA Wide Boulder Canyon Project Central Arizona Project Central Valley Project Electrical District 5‐to‐Palo Verde Hub Intertie (Southern Portion)
Levee Project Parker‐Davis Project Pick‐Sloan (Eastern & Western Division) Salinity Project Salt Lake City Area/Integrated Projects Prior Year WAPA Wide
HQ 10‐Year Capital Plan | 6
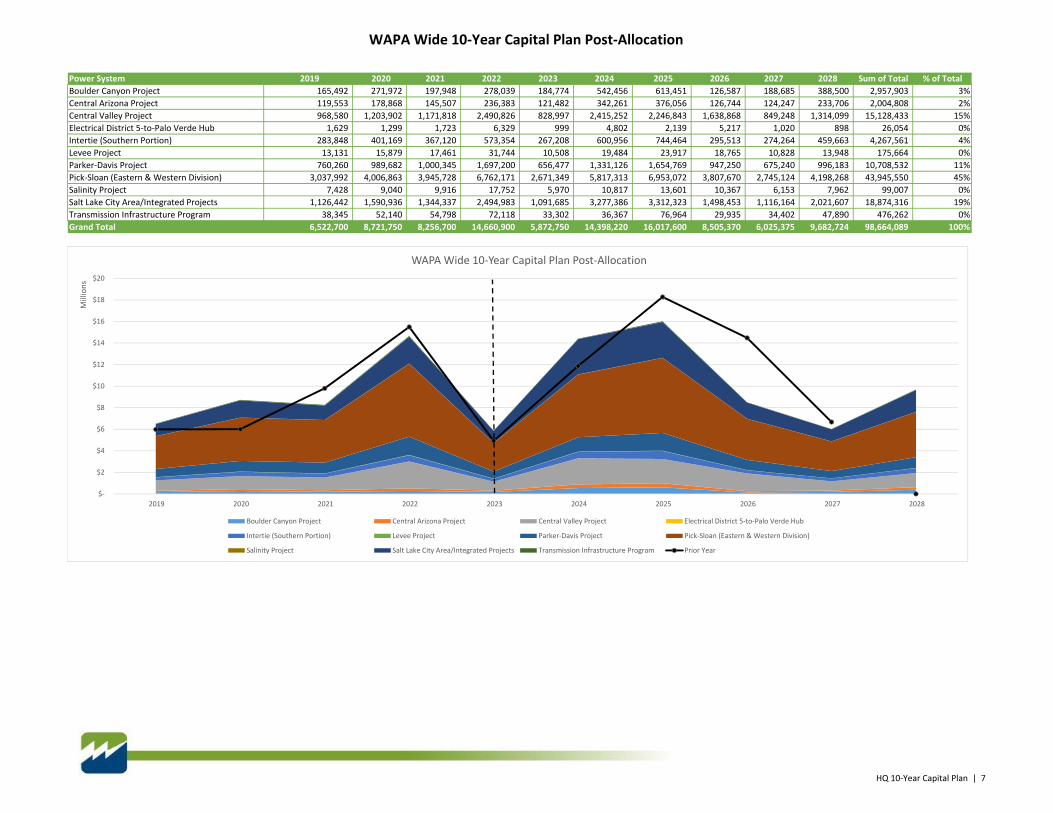
WAPA Wide 10‐Year Capital Plan Post‐Allocation
Power System 2019 2020 2021 2022 2023 2024 2025 2026 2027 2028 Sum of Total % of TotalBoulder Canyon Project 165,492 271,972 197,948 278,039 184,774 542,456 613,451 126,587 188,685 388,500 2,957,903 3%Central Arizona Project 119,553 178,868 145,507 236,383 121,482 342,261 376,056 126,744 124,247 233,706 2,004,808 2%Central Valley Project 968,580 1,203,902 1,171,818 2,490,826 828,997 2,415,252 2,246,843 1,638,868 849,248 1,314,099 15,128,433 15%Electrical District 5‐to‐Palo Verde Hub 1,629 1,299 1,723 6,329 999 4,802 2,139 5,217 1,020 898 26,054 0%Intertie (Southern Portion) 283,848 401,169 367,120 573,354 267,208 600,956 744,464 295,513 274,264 459,663 4,267,561 4%Levee Project 13,131 15,879 17,461 31,744 10,508 19,484 23,917 18,765 10,828 13,948 175,664 0%Parker‐Davis Project 760,260 989,682 1,000,345 1,697,200 656,477 1,331,126 1,654,769 947,250 675,240 996,183 10,708,532 11%Pick‐Sloan (Eastern & Western Division) 3,037,992 4,006,863 3,945,728 6,762,171 2,671,349 5,817,313 6,953,072 3,807,670 2,745,124 4,198,268 43,945,550 45%Salinity Project 7,428 9,040 9,916 17,752 5,970 10,817 13,601 10,367 6,153 7,962 99,007 0%Salt Lake City Area/Integrated Projects 1,126,442 1,590,936 1,344,337 2,494,983 1,091,685 3,277,386 3,312,323 1,498,453 1,116,164 2,021,607 18,874,316 19%Transmission Infrastructure Program 38,345 52,140 54,798 72,118 33,302 36,367 76,964 29,935 34,402 47,890 476,262 0%Grand Total 6,522,700 8,721,750 8,256,700 14,660,900 5,872,750 14,398,220 16,017,600 8,505,370 6,025,375 9,682,724 98,664,089 100%
$‐
$2
$4
$6
$8
$10
$12
$14
$16
$18
$20
2019 2020 2021 2022 2023 2024 2025 2026 2027 2028
Millions
WAPA Wide 10‐Year Capital Plan Post‐Allocation
Boulder Canyon Project Central Arizona Project Central Valley Project Electrical District 5‐to‐Palo Verde Hub
Intertie (Southern Portion) Levee Project Parker‐Davis Project Pick‐Sloan (Eastern & Western Division)
Salinity Project Salt Lake City Area/Integrated Projects Transmission Infrastructure Program Prior Year
HQ 10‐Year Capital Plan | 7

HQ 10‐Year Capital Plan Post‐Allocation
Power System 2019 2020 2021 2022 2023 2024 2025 2026 2027 2028 Sum of Total % of TotalBoulder Canyon Project 273,761 294,899 295,465 317,254 313,511 546,121 632,003 202,326 204,429 388,500 3,468,270 2%Central Arizona Project 217,358 198,424 217,416 265,300 247,901 344,964 391,545 182,593 135,857 233,706 2,435,065 2%Central Valley Project 1,569,740 3,926,402 2,612,698 4,086,826 1,710,125 2,789,502 2,820,543 1,801,368 1,106,248 1,985,199 24,408,651 17%Electrical District 5‐to‐Palo Verde Hub 1,795 1,353 2,147 6,499 1,025 4,818 2,189 5,546 1,088 898 27,359 0%Intertie (Southern Portion) 630,940 1,055,681 487,015 648,536 656,094 611,274 875,308 376,982 324,199 524,263 6,190,292 4%Levee Project 26,672 18,475 25,856 35,120 28,987 19,799 25,939 25,285 12,183 13,948 232,265 0%Parker‐Davis Project 1,528,846 1,342,713 3,034,163 3,393,282 1,885,761 1,595,459 2,059,785 1,652,557 1,182,935 1,580,183 19,255,683 14%Pick‐Sloan (Eastern & Western Division) 5,693,727 4,701,113 8,221,698 7,836,071 5,595,237 6,930,706 7,685,272 4,973,545 3,492,524 5,551,068 60,680,961 43%Salinity Project 14,522 10,425 14,664 19,662 15,431 10,996 14,688 14,056 6,920 7,962 129,324 0%Salt Lake City Area/Integrated Projects 1,961,303 1,903,863 2,157,280 2,807,232 2,382,377 3,416,794 3,754,264 2,073,277 1,277,640 2,221,807 23,955,835 17%Transmission Infrastructure Program 38,345 52,140 54,798 72,118 33,302 36,367 76,964 29,935 34,402 47,890 476,262 0%Grand Total 11,957,008 13,505,490 17,123,200 19,487,900 12,869,750 16,306,800 18,338,500 11,337,470 7,778,425 12,555,424 141,259,967 100%
$‐
$5
$10
$15
$20
$25
2019 2020 2021 2022 2023 2024 2025 2026 2027 2028
Millions
HQ 10‐Year Capital Plan Post‐Allocation
Boulder Canyon Project Central Arizona Project Central Valley Project Electrical District 5‐to‐Palo Verde Hub
Intertie (Southern Portion) Levee Project Parker‐Davis Project Pick‐Sloan (Eastern & Western Division)
Salinity Project Salt Lake City Area/Integrated Projects Transmission Infrastructure Program Prior Year
HQ 10‐Year Capital Plan | 8
Changes highlighted
• Overall plan total consistent with PY plan• Rolling 5‐year rate window increase of 3%• Network expansion in support of cloud, wifi, and remote access
• Infrastructure expansion in support of data storage growth• Enterprise Applications mandates and initiatives• Power Management and Marketing decreases
HQ 10‐Year Capital Plan | 9
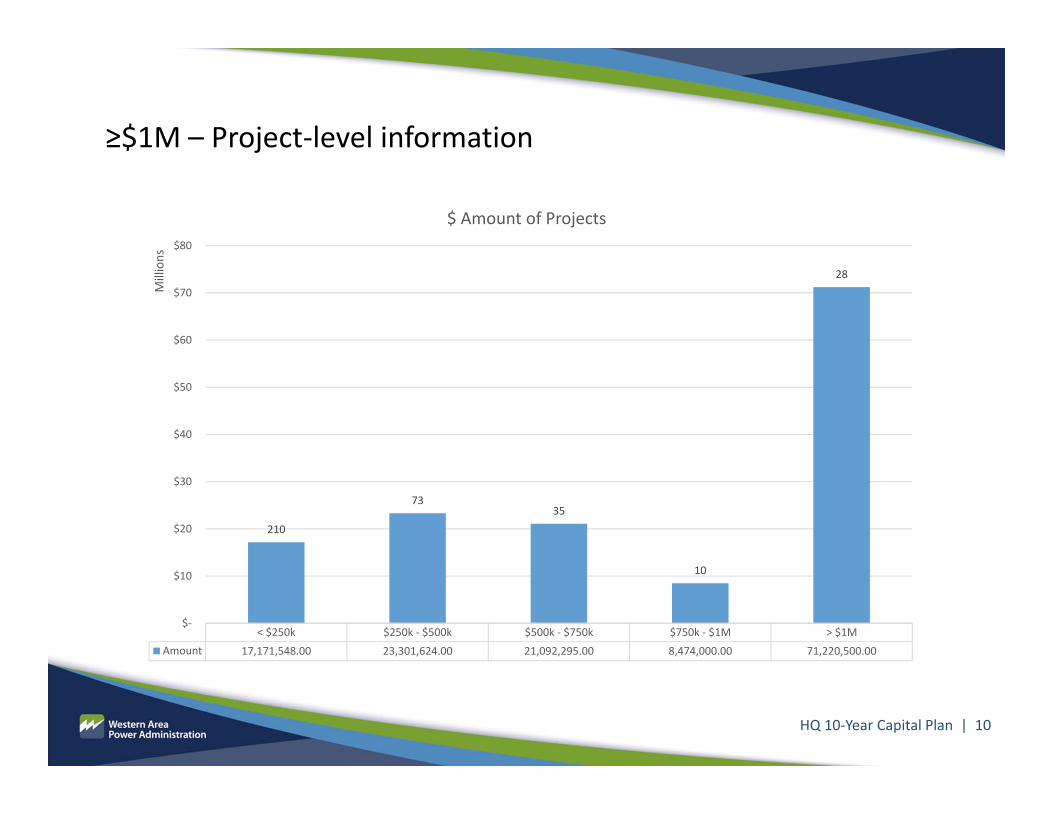
≥$1M – Project‐level information
HQ 10‐Year Capital Plan | 10
< $250k $250k ‐ $500k $500k ‐ $750k $750k ‐ $1M > $1MAmount 17,171,548.00 23,301,624.00 21,092,295.00 8,474,000.00 71,220,500.00
210
7335
10
28
$‐
$10
$20
$30
$40
$50
$60
$70
$80
Millions
$ Amount of Projects

HQ 10‐Year Capital PlanProjects >$1M
Org Name Project # Name Of Project 2019 2020 2021 2022 2023 2024 2025 2026 2027 2028 Grand TotalA2800 ‐ Enterprise Applications #1 Enterprise Application Enhancements ‐ 2028 2,350,000 2,350,000
#2 Enterprise Applications Upgrades and Enhancements ‐ 2024 2,160,000 2,160,000 #3 Enterprise Applications ‐ Hardware Lifecycle Replacement ‐ 2027 1,600,000 1,600,000 #4 Enterprise Applications ‐ Hardware Lifecycle Replacement ‐ 2028 1,100,000 1,100,000 #5 Enterprise Applications ‐ Hardware Lifecycle Replacement ‐ 2022 1,500,000 1,500,000 #6 Enterprise Applications ‐ Hardware Lifecycle Replacement ‐ 2023 1,210,000 1,210,000 #7 Enterprise Applications Upgrades ‐ 2025 2,750,000 2,750,000 #8 Enterprise Applications Upgrades ‐ 2026 2,000,000 2,000,000 #9 FIMS 12.2 Upgrade ‐ 2020 1,650,000 1,650,000 #10 FIMS 12.2 Upgrade and Enhancements ‐ 2021 1,700,000 1,700,000
A2800 ‐ Enterprise Applications Total 1,650,000 1,700,000 1,500,000 1,210,000 2,160,000 2,750,000 2,000,000 1,600,000 3,450,000 18,020,000 #11 Metering Strategy ‐ MV90 Infrastructure Enhancement 2,500,000 2,500,000 #12 Power Billing Software System ‐ Phase I 3,000,000 3,000,000 #13 Power Billing Software System ‐ Phase II 3,000,000 3,000,000 #14 Standardize EMMO and Settlements tools across WAPA Phase I 2,318,000 2,318,000 #15 Standardize EMMO and Settlements tools across WAPA Phase II 2,318,000 2,318,000 #16 Upgrade/Replace In‐house developed tools ‐ update frameworks 1,184,000 1,184,000 #17 Upgrade/Replace In‐house developed tools ‐ update frameworks ‐ 2025 1,184,000 1,184,000
A2900 ‐ Power Management & Marketing Total 1,184,000 2,318,000 2,318,000 5,500,000 4,184,000 2,350,000 17,854,000 A2700 ‐ SCADA #18 Common SCADA/EMS Vendor 3,955,000 3,955,000
#19 Implementa on of the Common SCADA vendor ‐ RMR/DSW (PD) 2,840,000 2,840,000 #20 Implementa on of the Common SCADA vendor ‐ SNR (PD) 2,840,000 2,840,000 #21 Implementa on of the Common SCADA vendor ‐ UGP (PD) 2,840,000 2,840,000 #22 PI enterprise license renewal ‐ FY23 1,671,500 1,671,500 #23 PI enterprise license renewal ‐ FY28 1,700,000 1,700,000
A2700 ‐ SCADA Total 3,955,000 2,840,000 2,840,000 4,511,500 1,700,000 15,846,500 A7810 ‐ Aviation #24 2022 Aviation Helicopter replacement 4,000,000 4,000,000
#25 2024 Aviation Helicopter Replacement 3,500,000 3,500,000 #26 2026 Aviation Helicopter Replacement 4,000,000 4,000,000
A7810 ‐ Aviation Total 4,000,000 3,500,000 4,000,000 11,500,000 A2A00 ‐ O&M Technology #27 Key Management System Concept 3,000,000 3,000,000
#28 Security Operations Center Concept 5,000,000 5,000,000 A2A00 ‐ O&M Technology Total 3,000,000 5,000,000 8,000,000 Grand Total 3,955,000 5,674,000 6,858,000 10,818,000 5,721,500 11,160,000 11,934,000 6,000,000 1,600,000 7,500,000 71,220,500
HQ 10‐Year Capital Plan | 11
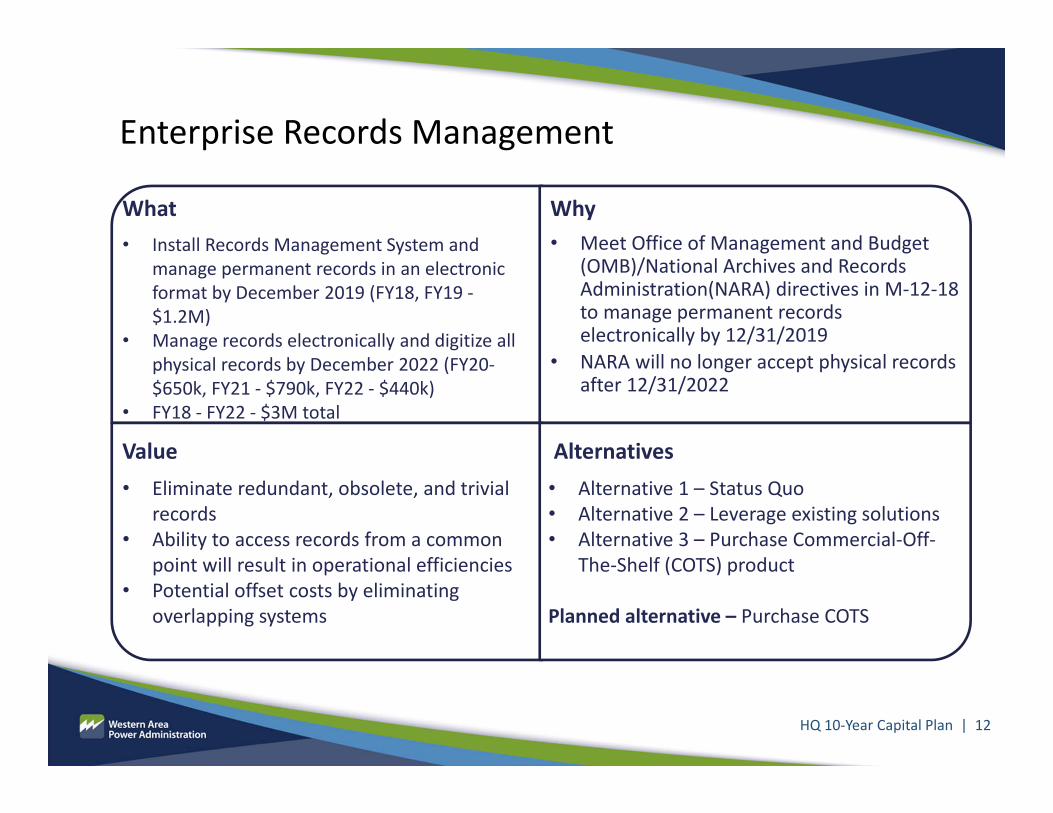
What• Install Records Management System and
manage permanent records in an electronic format by December 2019 (FY18, FY19 ‐$1.2M)
• Manage records electronically and digitize all physical records by December 2022 (FY20‐$650k, FY21 ‐ $790k, FY22 ‐ $440k)
• FY18 ‐ FY22 ‐ $3M total
Why• Meet Office of Management and Budget
(OMB)/National Archives and Records Administration(NARA) directives in M‐12‐18 to manage permanent records electronically by 12/31/2019
• NARA will no longer accept physical records after 12/31/2022
Value• Eliminate redundant, obsolete, and trivial
records• Ability to access records from a common
point will result in operational efficiencies• Potential offset costs by eliminating
overlapping systems
Alternatives• Alternative 1 – Status Quo • Alternative 2 – Leverage existing solutions• Alternative 3 – Purchase Commercial‐Off‐
The‐Shelf (COTS) product
Planned alternative – Purchase COTS
Enterprise Records Management
HQ 10‐Year Capital Plan | 12
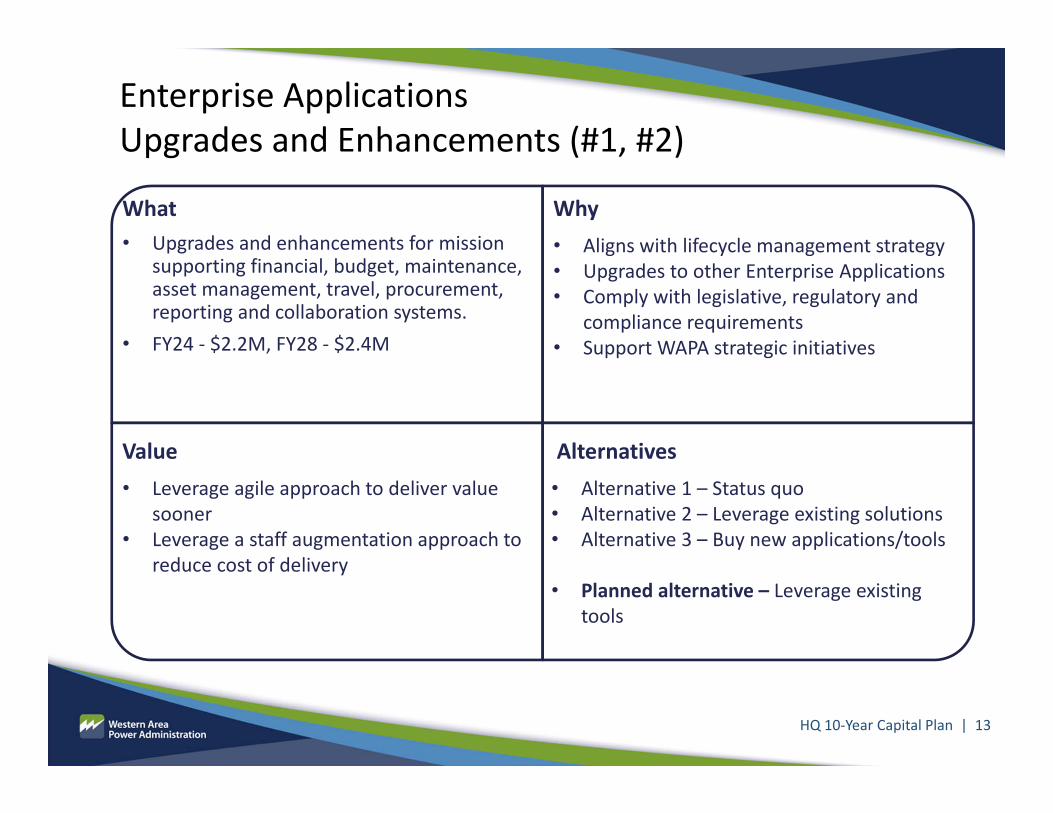
What• Upgrades and enhancements for mission
supporting financial, budget, maintenance, asset management, travel, procurement, reporting and collaboration systems.
• FY24 ‐ $2.2M, FY28 ‐ $2.4M
Why• Aligns with lifecycle management strategy• Upgrades to other Enterprise Applications• Comply with legislative, regulatory and
compliance requirements• Support WAPA strategic initiatives
Value• Leverage agile approach to deliver value
sooner• Leverage a staff augmentation approach to
reduce cost of delivery
Alternatives• Alternative 1 – Status quo• Alternative 2 – Leverage existing solutions• Alternative 3 – Buy new applications/tools
• Planned alternative – Leverage existing tools
Enterprise Applications Upgrades and Enhancements (#1, #2)
HQ 10‐Year Capital Plan | 13
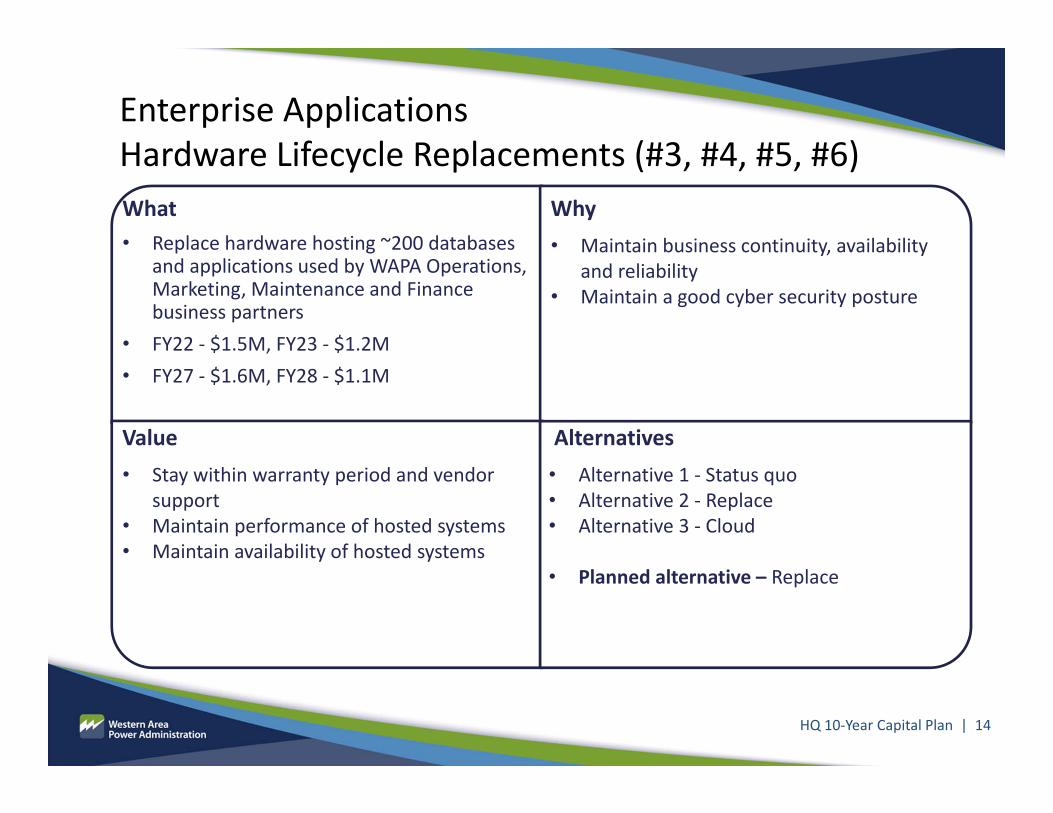
What• Replace hardware hosting ~200 databases
and applications used by WAPA Operations, Marketing, Maintenance and Finance business partners
• FY22 ‐ $1.5M, FY23 ‐ $1.2M• FY27 ‐ $1.6M, FY28 ‐ $1.1M
Why• Maintain business continuity, availability
and reliability• Maintain a good cyber security posture
Value• Stay within warranty period and vendor
support • Maintain performance of hosted systems• Maintain availability of hosted systems
Alternatives• Alternative 1 ‐ Status quo• Alternative 2 ‐ Replace• Alternative 3 ‐ Cloud
• Planned alternative – Replace
Enterprise Applications Hardware Lifecycle Replacements (#3, #4, #5, #6)
HQ 10‐Year Capital Plan | 14
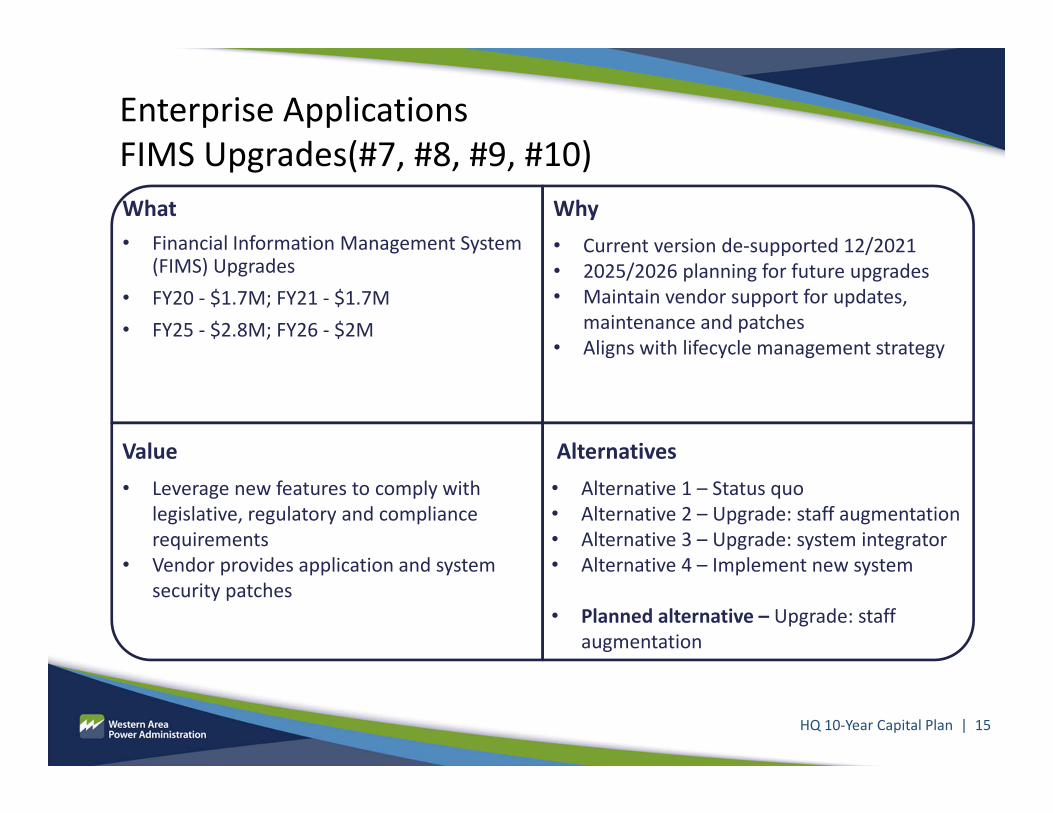
What• Financial Information Management System
(FIMS) Upgrades• FY20 ‐ $1.7M; FY21 ‐ $1.7M• FY25 ‐ $2.8M; FY26 ‐ $2M
Why• Current version de‐supported 12/2021• 2025/2026 planning for future upgrades• Maintain vendor support for updates,
maintenance and patches• Aligns with lifecycle management strategy
Value• Leverage new features to comply with
legislative, regulatory and compliance requirements
• Vendor provides application and system security patches
Alternatives• Alternative 1 – Status quo• Alternative 2 – Upgrade: staff augmentation• Alternative 3 – Upgrade: system integrator• Alternative 4 – Implement new system
• Planned alternative – Upgrade: staff augmentation
Enterprise Applications FIMS Upgrades(#7, #8, #9, #10)
HQ 10‐Year Capital Plan | 15
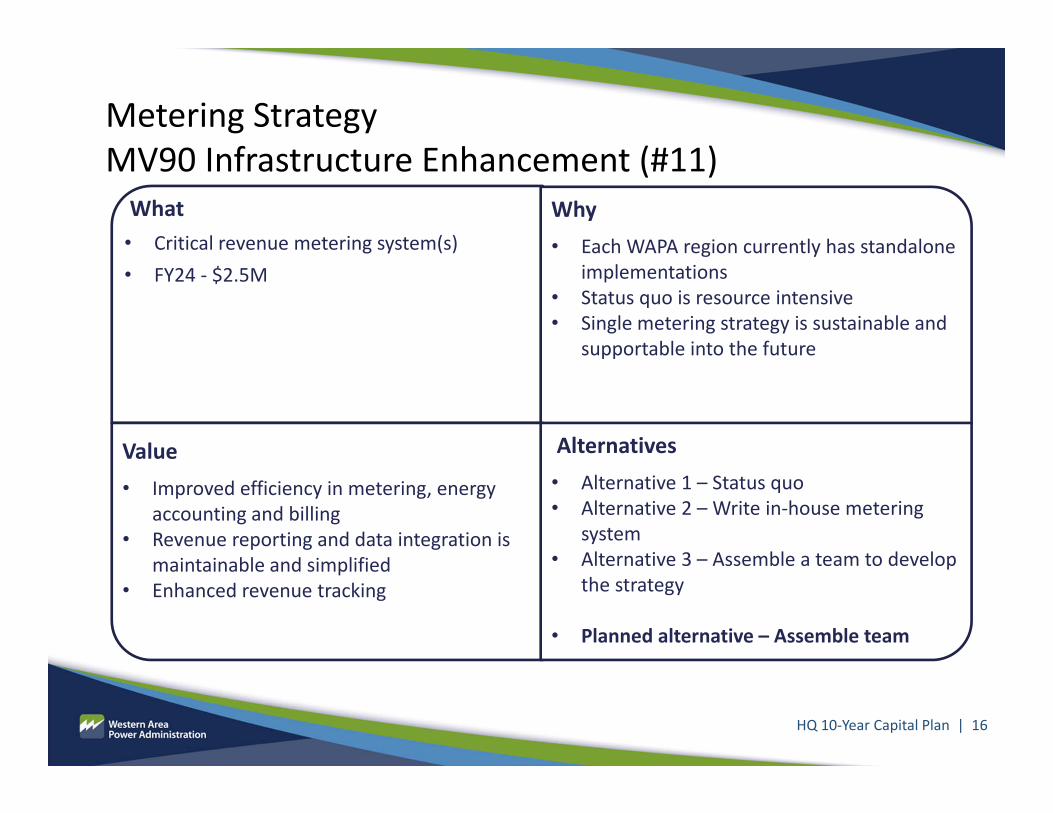
What• Critical revenue metering system(s)• FY24 ‐ $2.5M
Why• Each WAPA region currently has standalone
implementations• Status quo is resource intensive• Single metering strategy is sustainable and
supportable into the future
Value• Improved efficiency in metering, energy
accounting and billing• Revenue reporting and data integration is
maintainable and simplified• Enhanced revenue tracking
Alternatives• Alternative 1 – Status quo• Alternative 2 – Write in‐house metering
system• Alternative 3 – Assemble a team to develop
the strategy
• Planned alternative – Assemble team
Metering StrategyMV90 Infrastructure Enhancement (#11)
HQ 10‐Year Capital Plan | 16

What• Upgrade/replace in‐house developed
power billing system • FY24 ‐ $3M, FY25 ‐ $3M
Why• In‐house power billing system will be
15 years old• Frameworks will need to be upgraded to
align with effective life‐cycle management• Adheres to WAPA cyber security policies
Value• Facilitates common practices across WAPA
• Provides opportunity for efficient resource deployment
• Creates common, sustainable, access to data
Alternatives• Alternative 1 – Status quo• Alternative 2 – Re‐write in‐house system• Alternative 3 ‐ Look for existing COTS
system (updated cost estimate)
• Planned alternative – COTS
Power Billing Software System Phase I&II(#12, #13)
HQ 10‐Year Capital Plan | 17
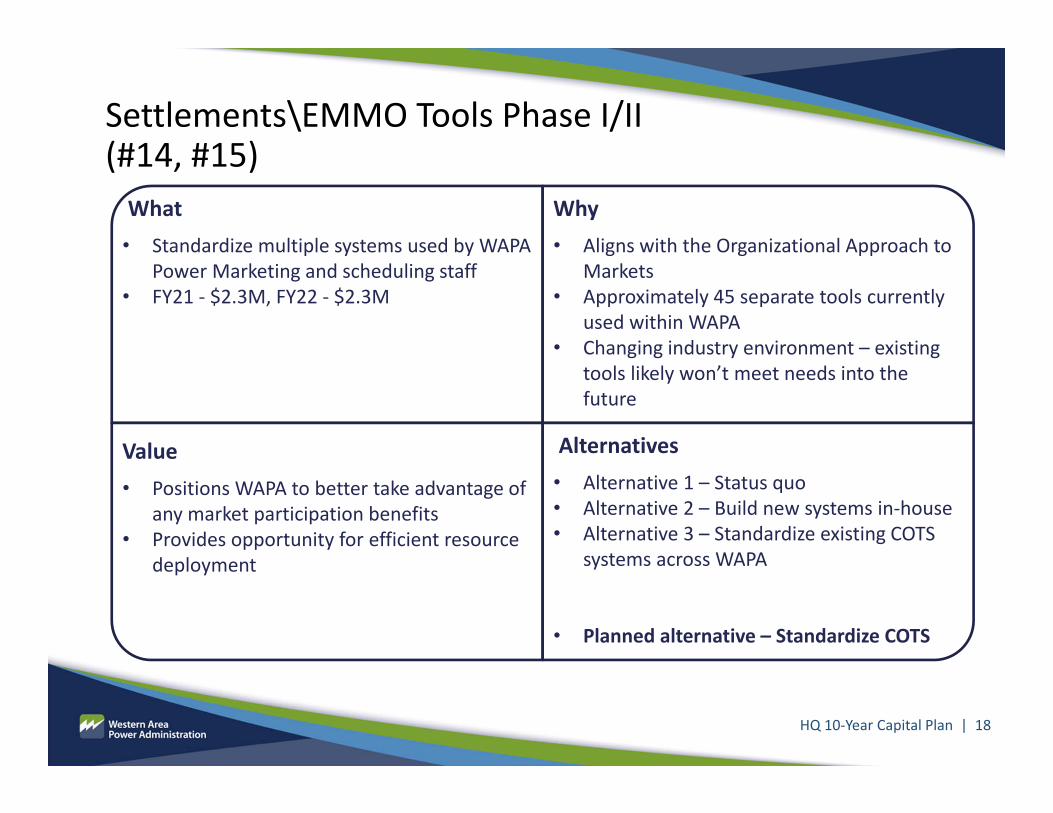
What• Standardize multiple systems used by WAPA
Power Marketing and scheduling staff• FY21 ‐ $2.3M, FY22 ‐ $2.3M
Why• Aligns with the Organizational Approach to
Markets• Approximately 45 separate tools currently
used within WAPA• Changing industry environment – existing
tools likely won’t meet needs into the future
Value• Positions WAPA to better take advantage of
any market participation benefits• Provides opportunity for efficient resource
deployment
Alternatives• Alternative 1 – Status quo• Alternative 2 – Build new systems in‐house• Alternative 3 – Standardize existing COTS
systems across WAPA
• Planned alternative – Standardize COTS
Settlements\EMMO Tools Phase I/II(#14, #15)
HQ 10‐Year Capital Plan | 18

What• In‐house developed tools for WAPA specific
processes• Software lifecycle replacement of in‐house
power marketing related applications• FY20 ‐ $1.2M, FY25 ‐ $1.2M
Why• Address WAPA specific business process
needs• No vendor options at the time in‐house
systems were built• Unsupported by vendor
Value• Facilitates exchange of information with
business partners and customers• Fill the WAPA process gaps • Streamline solution to common issues
Alternatives• Alternative 1 – Status quo• Alternative 2 – Upgrade/replace• Alternative 3 – Look for existing COTS
system
• Planned alternative – Upgrade/replace
Upgrade/replace In‐house developed tools(#16, #17)
HQ 10‐Year Capital Plan | 19
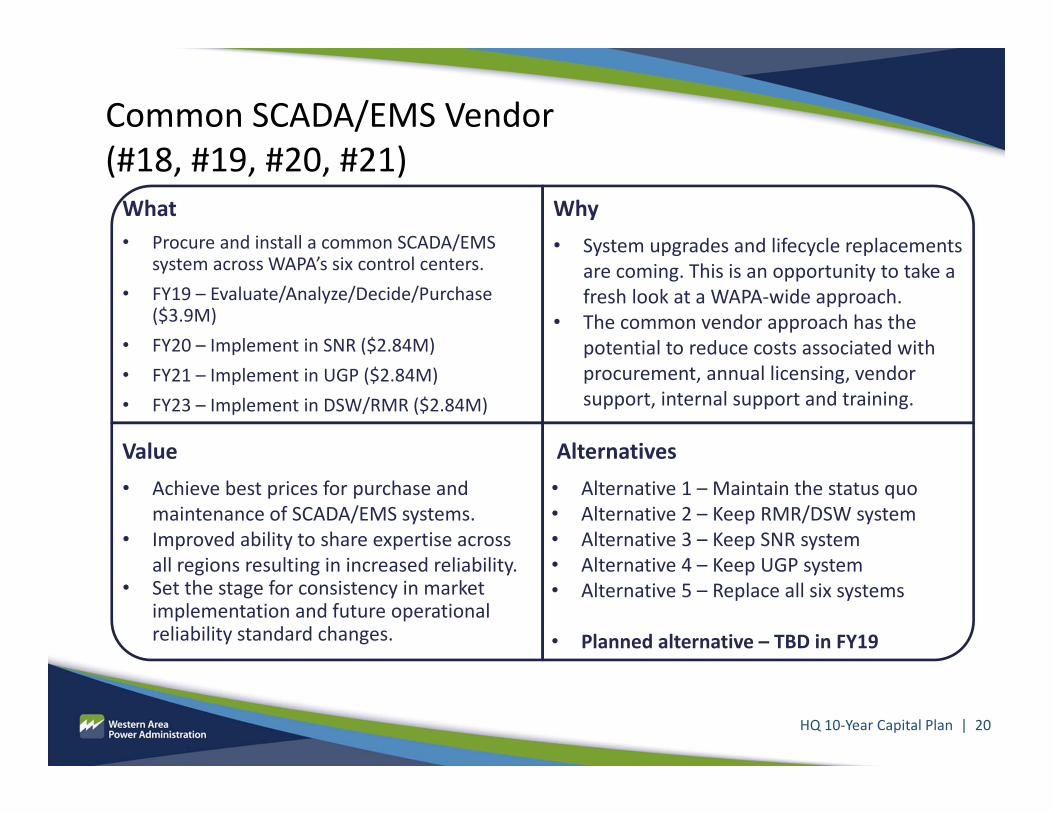
What• Procure and install a common SCADA/EMS
system across WAPA’s six control centers.• FY19 – Evaluate/Analyze/Decide/Purchase
($3.9M)• FY20 – Implement in SNR ($2.84M)• FY21 – Implement in UGP ($2.84M)• FY23 – Implement in DSW/RMR ($2.84M)
Why• System upgrades and lifecycle replacements
are coming. This is an opportunity to take a fresh look at a WAPA‐wide approach.
• The common vendor approach has the potential to reduce costs associated with procurement, annual licensing, vendor support, internal support and training.
Value• Achieve best prices for purchase and
maintenance of SCADA/EMS systems.• Improved ability to share expertise across
all regions resulting in increased reliability.• Set the stage for consistency in market
implementation and future operational reliability standard changes.
Alternatives• Alternative 1 – Maintain the status quo• Alternative 2 – Keep RMR/DSW system• Alternative 3 – Keep SNR system• Alternative 4 – Keep UGP system• Alternative 5 – Replace all six systems
• Planned alternative – TBD in FY19
Common SCADA/EMS Vendor (#18, #19, #20, #21)
HQ 10‐Year Capital Plan | 20

What• Historian software provides a repository for
the collection of bulk electric system data.• The historian is bundled with analytical
tools and display tools.• The license renewal takes place every five
years. • FY23 ‐ $1.6M, FY28 ‐ $1.7M
Why• This enterprise agreement provides WAPA
with unlimited use of the historian for data collected from DSW, RMR and SNR substations. It is used by:• Operations• Maintenance• Power Marketing
Value• Data produced by intelligent electronic devices is
growing by leaps and bounds. It takes a product like a data historian to collect, analyze and display the data.
• It is used by Operations to monitor the electric system, by Maintenance for asset management, by Transmission Planning to design the grid, and by Power Marketing to observe power plants.
Alternatives• Alternative 1 – Historian• Alternative 2 – No Historian
• Planned alternative – Historian
Historian Software License Renewal (#22, #23)
HQ 10‐Year Capital Plan | 21
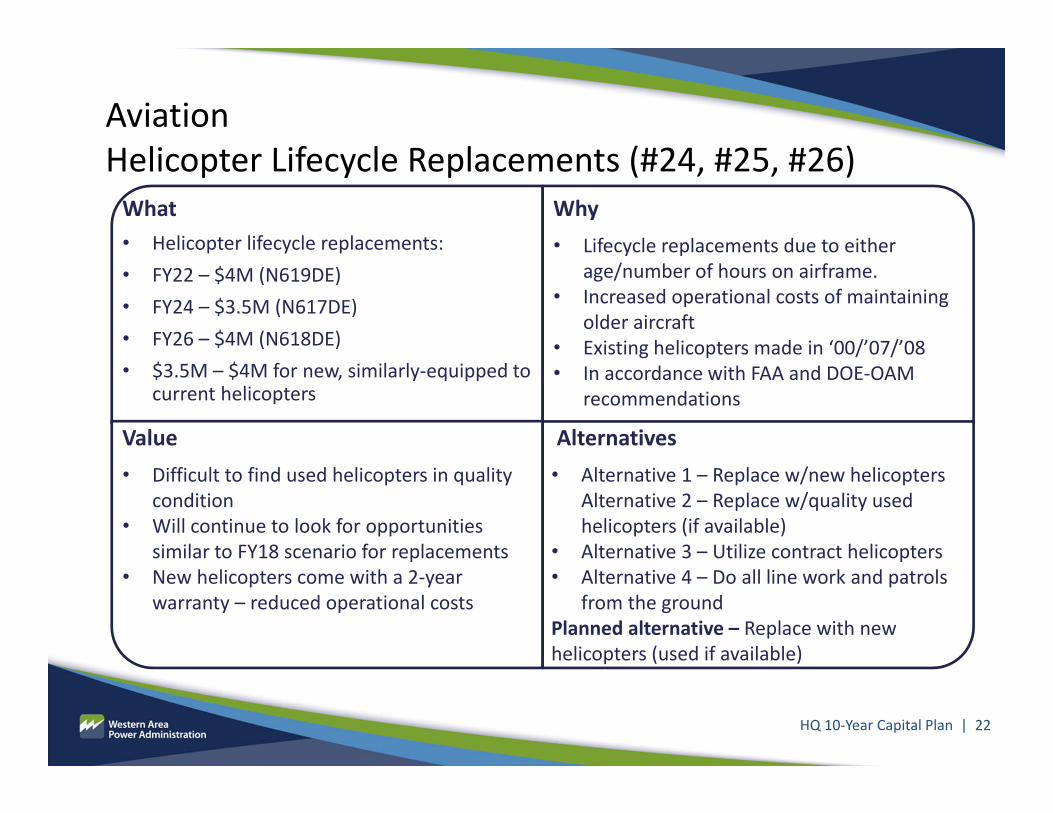
What• Helicopter lifecycle replacements: • FY22 – $4M (N619DE) • FY24 – $3.5M (N617DE) • FY26 – $4M (N618DE)• $3.5M – $4M for new, similarly‐equipped to
current helicopters
Why• Lifecycle replacements due to either
age/number of hours on airframe.• Increased operational costs of maintaining
older aircraft• Existing helicopters made in ‘00/’07/’08• In accordance with FAA and DOE‐OAM
recommendations
Value• Difficult to find used helicopters in quality
condition• Will continue to look for opportunities
similar to FY18 scenario for replacements• New helicopters come with a 2‐year
warranty – reduced operational costs
Alternatives• Alternative 1 – Replace w/new helicopters
Alternative 2 – Replace w/quality used helicopters (if available)
• Alternative 3 – Utilize contract helicopters• Alternative 4 – Do all line work and patrols
from the groundPlanned alternative – Replace with new helicopters (used if available)
AviationHelicopter Lifecycle Replacements (#24, #25, #26)
HQ 10‐Year Capital Plan | 22

What• Improves control of substation keys and
access management• System will assist with compliance of CIP
003.‐6 and address IG finding. • Extends our physical access control systems
where feasible• FY22 ‐ $3M/Requirements based solution
Why• Inspector General identified
shortcomings in CIP –003‐6• Supports CIP 003‐6 requirements• Enhanced tracking, control and
accountability would increase key management system effectiveness
Value
• Improves security• Ensures compliance• Potential decrease in effort to
administer key management system process
Alternatives• Alternative 1 ‐ Extend our Physical Access
Control Systems • Alternative 2 ‐ Re‐core existing locks and
track the key through a combination of manual process and technology solutionsto include PACs
Planned alternative – Alternative 2
Access Management System (concept)(#27)
HQ 10‐Year Capital Plan | 23
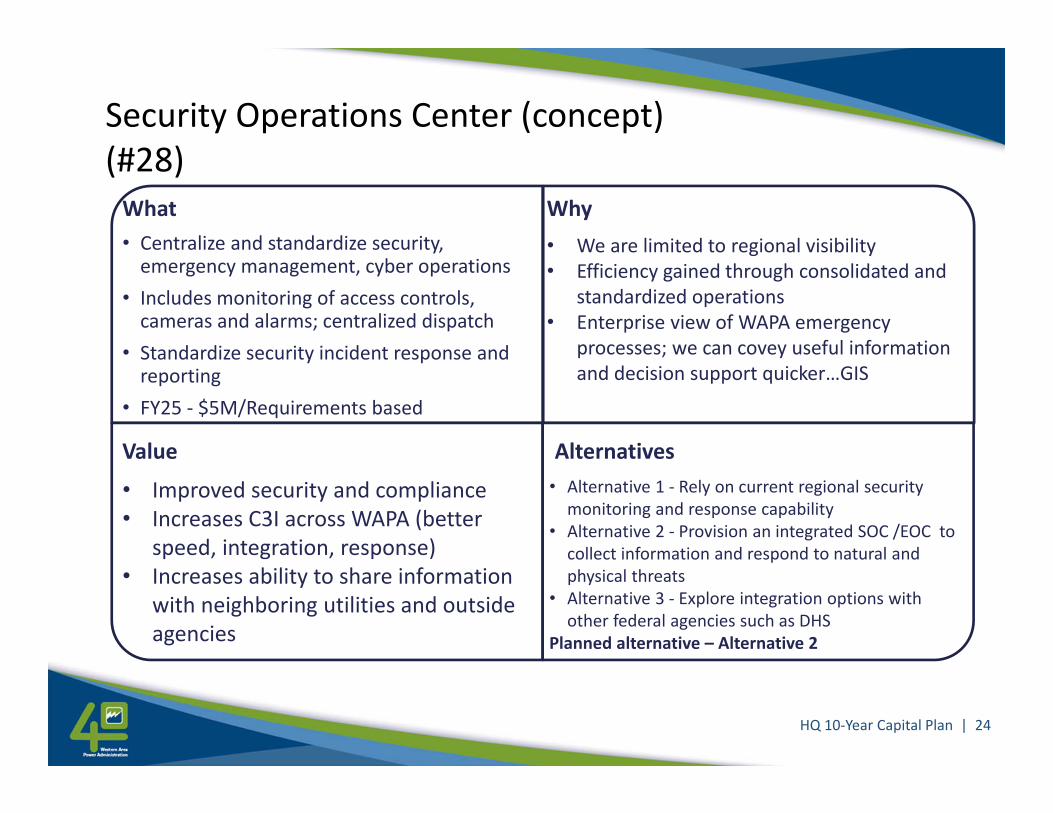
What• Centralize and standardize security, emergency management, cyber operations
• Includes monitoring of access controls, cameras and alarms; centralized dispatch
• Standardize security incident response and reporting
• FY25 ‐ $5M/Requirements based
Why• We are limited to regional visibility• Efficiency gained through consolidated and
standardized operations• Enterprise view of WAPA emergency
processes; we can covey useful information and decision support quicker…GIS
Value
• Improved security and compliance• Increases C3I across WAPA (better
speed, integration, response)• Increases ability to share information
with neighboring utilities and outside agencies
Alternatives• Alternative 1 ‐ Rely on current regional security monitoring and response capability
• Alternative 2 ‐ Provision an integrated SOC /EOC to collect information and respond to natural and physical threats
• Alternative 3 ‐ Explore integration options with other federal agencies such as DHS
Planned alternative – Alternative 2
Security Operations Center (concept) (#28)
HQ 10‐Year Capital Plan | 24
Questions and next steps
Provide feedback to Colin Marquez [email protected] or 720.962.7434
By Oct. 19
HQ 10‐Year Capital Plan | 25
Round table discussions
• To promote further discussion and understanding of programs, we encourage you to ask questions and have meaningful discussion.
• Power management and marketing – Led by Brett Fisher, VP of IT Power Management and Marketing and Jack Murray, VP of Power Marketing
• SCADA – Led by James Phillips, VP of IT SCADA and Jonathan Aust, Operations Manager
• Lifecycle management – Led by Joe Fast, Acting VP of IT Enterprise Applications
HQ 10‐Year Capital Plan | 26
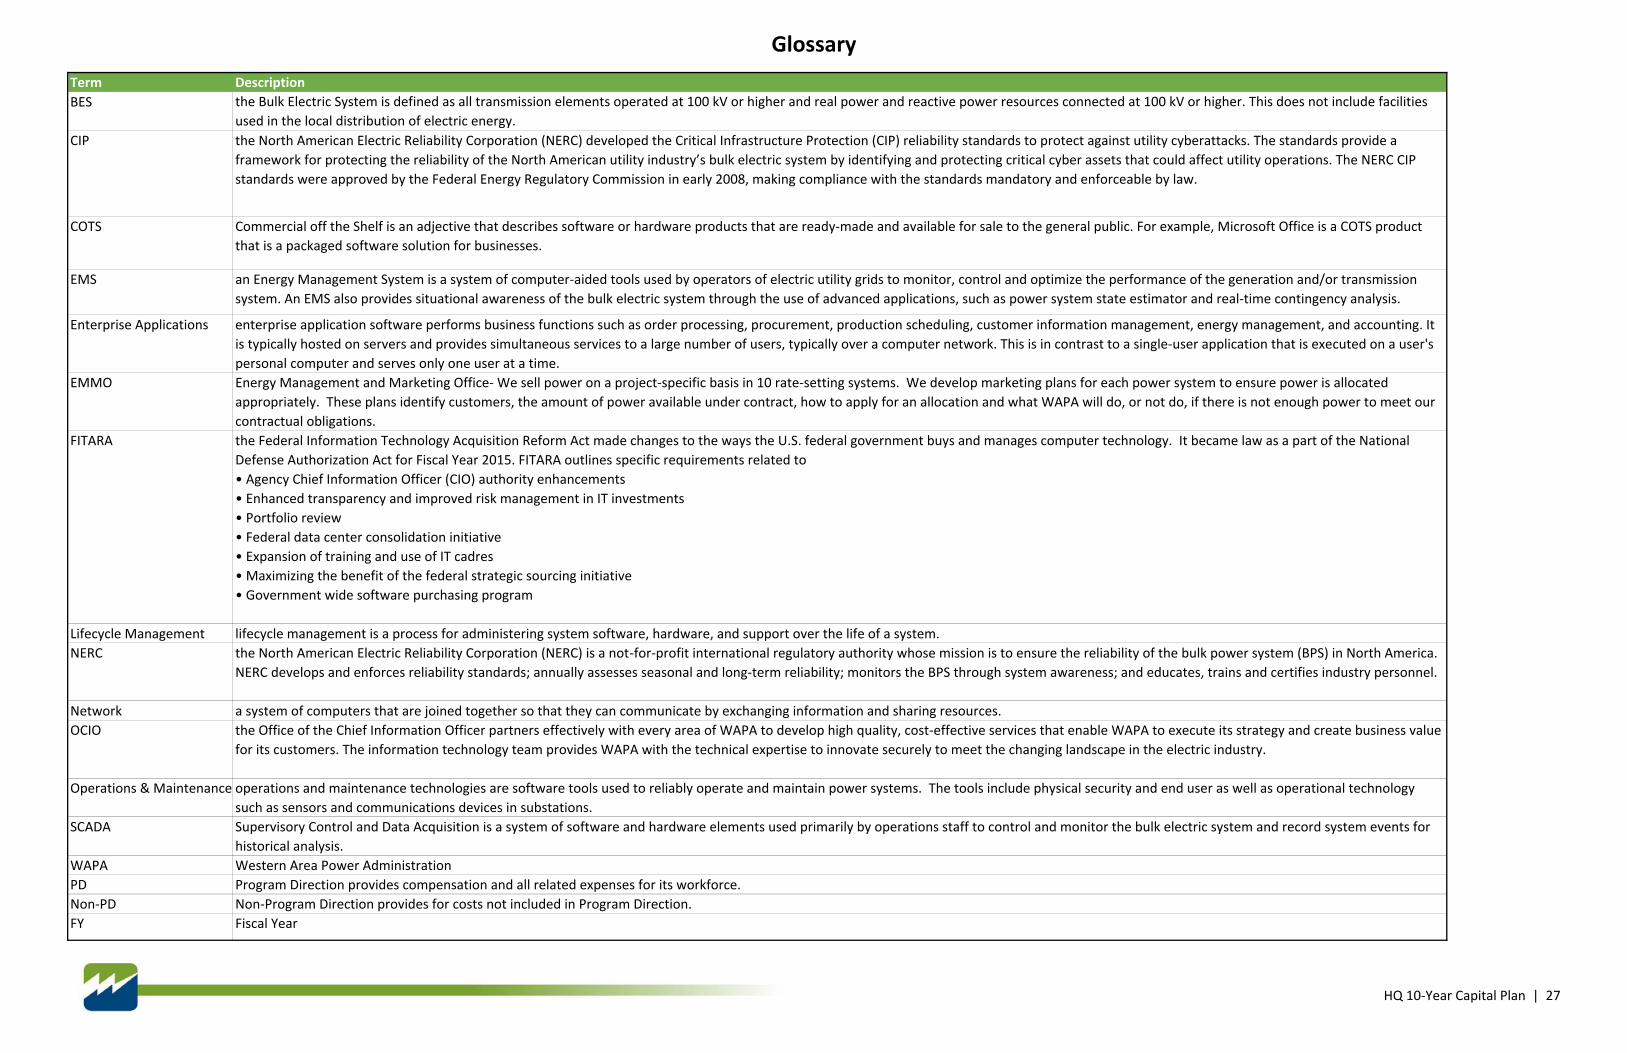
GlossaryTerm DescriptionBES the Bulk Electric System is defined as all transmission elements operated at 100 kV or higher and real power and reactive power resources connected at 100 kV or higher. This does not include facilities
used in the local distribution of electric energy.CIP the North American Electric Reliability Corporation (NERC) developed the Critical Infrastructure Protection (CIP) reliability standards to protect against utility cyberattacks. The standards provide a
framework for protecting the reliability of the North American utility industry’s bulk electric system by identifying and protecting critical cyber assets that could affect utility operations. The NERC CIP standards were approved by the Federal Energy Regulatory Commission in early 2008, making compliance with the standards mandatory and enforceable by law.
COTS Commercial off the Shelf is an adjective that describes software or hardware products that are ready‐made and available for sale to the general public. For example, Microsoft Office is a COTS product that is a packaged software solution for businesses.
EMS an Energy Management System is a system of computer‐aided tools used by operators of electric utility grids to monitor, control and optimize the performance of the generation and/or transmission system. An EMS also provides situational awareness of the bulk electric system through the use of advanced applications, such as power system state estimator and real‐time contingency analysis.
Enterprise Applications enterprise application software performs business functions such as order processing, procurement, production scheduling, customer information management, energy management, and accounting. It is typically hosted on servers and provides simultaneous services to a large number of users, typically over a computer network. This is in contrast to a single‐user application that is executed on a user's personal computer and serves only one user at a time.
EMMO Energy Management and Marketing Office‐ We sell power on a project‐specific basis in 10 rate‐setting systems. We develop marketing plans for each power system to ensure power is allocated appropriately. These plans identify customers, the amount of power available under contract, how to apply for an allocation and what WAPA will do, or not do, if there is not enough power to meet our contractual obligations.
FITARA the Federal Information Technology Acquisition Reform Act made changes to the ways the U.S. federal government buys and manages computer technology. It became law as a part of the National Defense Authorization Act for Fiscal Year 2015. FITARA outlines specific requirements related to• Agency Chief Information Officer (CIO) authority enhancements• Enhanced transparency and improved risk management in IT investments• Portfolio review• Federal data center consolidation initiative• Expansion of training and use of IT cadres• Maximizing the benefit of the federal strategic sourcing initiative• Government wide software purchasing program
Lifecycle Management lifecycle management is a process for administering system software, hardware, and support over the life of a system.NERC the North American Electric Reliability Corporation (NERC) is a not‐for‐profit international regulatory authority whose mission is to ensure the reliability of the bulk power system (BPS) in North America.
NERC develops and enforces reliability standards; annually assesses seasonal and long‐term reliability; monitors the BPS through system awareness; and educates, trains and certifies industry personnel.
Network a system of computers that are joined together so that they can communicate by exchanging information and sharing resources.OCIO the Office of the Chief Information Officer partners effectively with every area of WAPA to develop high quality, cost‐effective services that enable WAPA to execute its strategy and create business value
for its customers. The information technology team provides WAPA with the technical expertise to innovate securely to meet the changing landscape in the electric industry.
Operations & Maintenance operations and maintenance technologies are software tools used to reliably operate and maintain power systems. The tools include physical security and end user as well as operational technology such as sensors and communications devices in substations.
SCADA Supervisory Control and Data Acquisition is a system of software and hardware elements used primarily by operations staff to control and monitor the bulk electric system and record system events for historical analysis.
WAPA Western Area Power AdministrationPD Program Direction provides compensation and all related expenses for its workforce.Non‐PD Non‐Program Direction provides for costs not included in Program Direction.FY Fiscal Year
HQ 10‐Year Capital Plan | 27


