
Presentation 1

Using tablet
computers
for data
collectionAngie Ficek, MPH
Professional Data Analysts, Inc.
MNEA | January 2016

❶ Why we used tablet computers
❷ How we used tablet computers
❸ What we learned
❹ What you should consider

Different programs in different settings
with differing levels of access to technology

We used paper forms in past evaluations.

We first created our own secure website
for data entry.

We chose
a secure
website
over an
app.

We determined a tablet was the best fit
for our project.

We used
the
refurbished
iPad 2.

iPad Setup:Restrictions

iPad Setup:Data plan

iPad Setup:Contract

iPad Setup:Training & technical assistance

Much
quicker
process,
for us and
for
grantees.

The data is cleaner and more secure.

One size
does not
fit all.or

Next time, we would better determine
who would actually use the tablet.

There are very few ongoing costs.

Most costs are one-time costs.

Is a tablet a good fit?
User
Mobility
Project length
Tech expert
Ongoing TA
Cost


Presentation 2


Do I count this?
• Theme (40)
– Subtheme (15)
• Subtheme of the subtheme (5)
• Subtheme of the subtheme (10)
–Micro subtheme of the subtheme (4)
–Micro subtheme of the subtheme (6)
– Subtheme (5)
– Subtheme (20)
• Subtheme of the subtheme (10)
• Subtheme of the subtheme (10)

To what extent can evaluators use humor
to break the ice with evaluation
participants? Does this lead to better data
collection?
I’ve got a question

Study Design (5 case studies, cross case analysis)
• Review 12 interview transcripts with joke
• Review 12 interview transcripts without joke
• Observe each evaluator in field visit 3 times


It is even compatible with Zotero


Qualitative analysis software doesn’t

Buy Nvivo + Scrivener + a cup of coffee & a pastry
$1,140 for a 12 month
license
$45 for a license$10 for a Dogwood
Coffee and Rustica
Bakery Chocolate
Pistachio Danish

Why not use a writing a platform instead?

Presentation 3

How to make maps for free with CartoDB
MNEA Tech Tools Event
January 21st, 2016Kirsten L. Anderson, M.A.
Kirsten L. Anderson, L.L.C.

The Project

Community Outreach

Defined geographicalborders

The data visualization
challenge


The data visualization
solution


Step 1. Database Export.csv
Step 2. Data Cleaning


Step 3. Geocoding

= CONCATENATE(A2,B2)
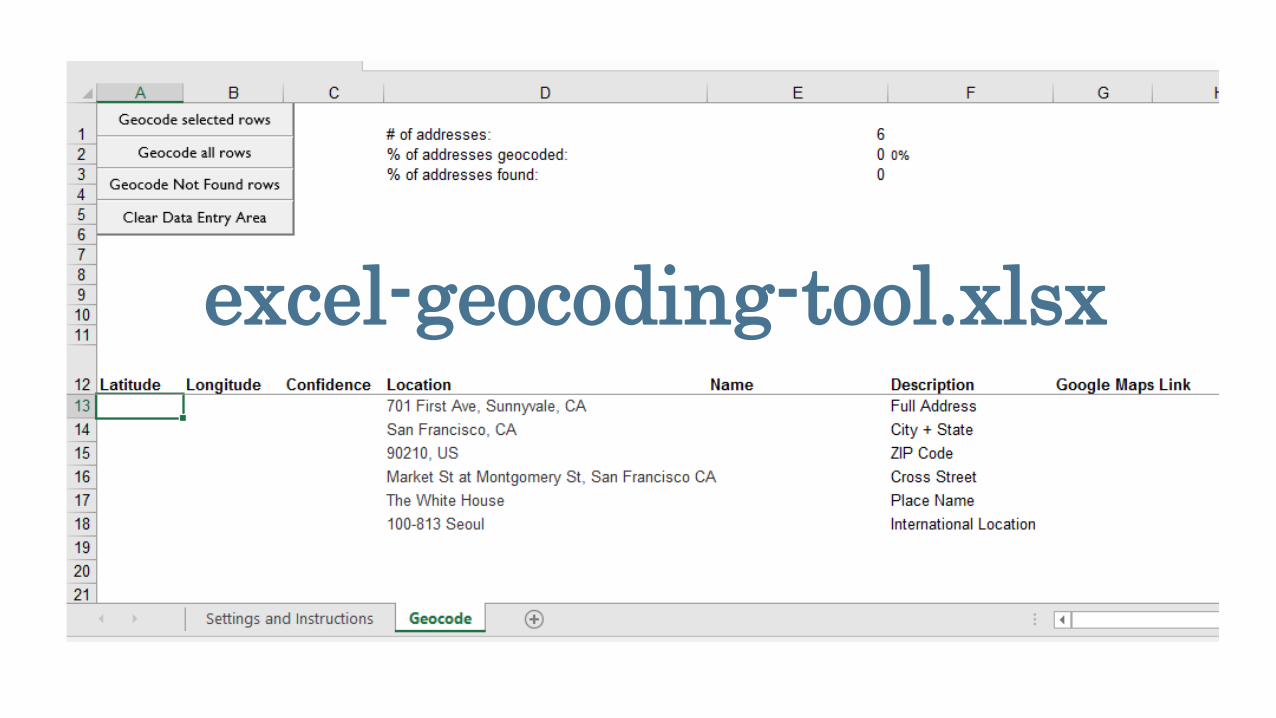
excel-geocoding-tool.xlsx

Step 4. Upload into CartoDB
Step 5. Play with fun data viz options

https://5klynna5.cartodb.com

Spay/Neuter Status of Pets having interaction with AHS Community Outreach in Frogtown*
*June 1 2014 – July 7, 2015Not Spay/Neutered Spay/Neutered Spay/Neutered through Kindest Cut
Original Status Current Status

Kirsten L. Anderson, M.A.www.kirstenlanderson.com | [email protected]

Presentation 4

Data Visualization Using
Tableau

What is MNHS?
● Founded in 1849
● 26 historic sites and
museums
● 700 employees
● 2 full-time evaluation
staff

LOTS... ~150 evaluations annually
Two-thirds are public programs surveys
What does MNHS evaluate?

What are the
audiences?
K-12
Audience
Adult
Audience
Family
Audience
Young
Adult
Audience

Who is my client? What are their needs?
Program managers
● Individual program
● Filter by attributes
VS.
Division Directors
Senior Leadership
● BIG data
● Compare by year and
program

Who is my client? What are their needs?
Program managers
● Individual program
● Filter by attributes
VS.
Division Directors
Senior Leadership
● BIG data
● Compare by year and
program

Reporting methods
Technical reports...nobody read
Paper Reports

Google Dashboards
Reporting methods

What is Tableau?

Tableau
Audience
Reports
Digital

Ability to show individual program survey data
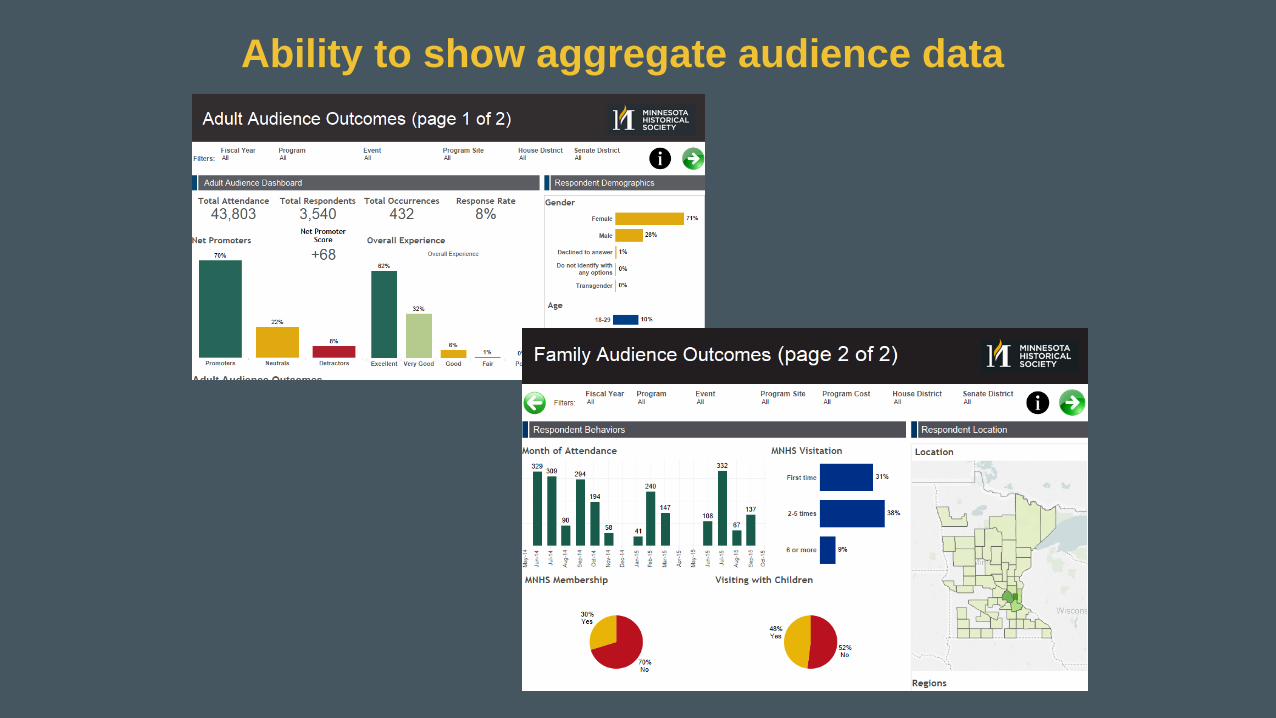
Ability to show aggregate audience data

Ability to compare programs

Ability to compare multiple years of data

Ability to filter and sort data
It’s interactive!!

Filtering Data
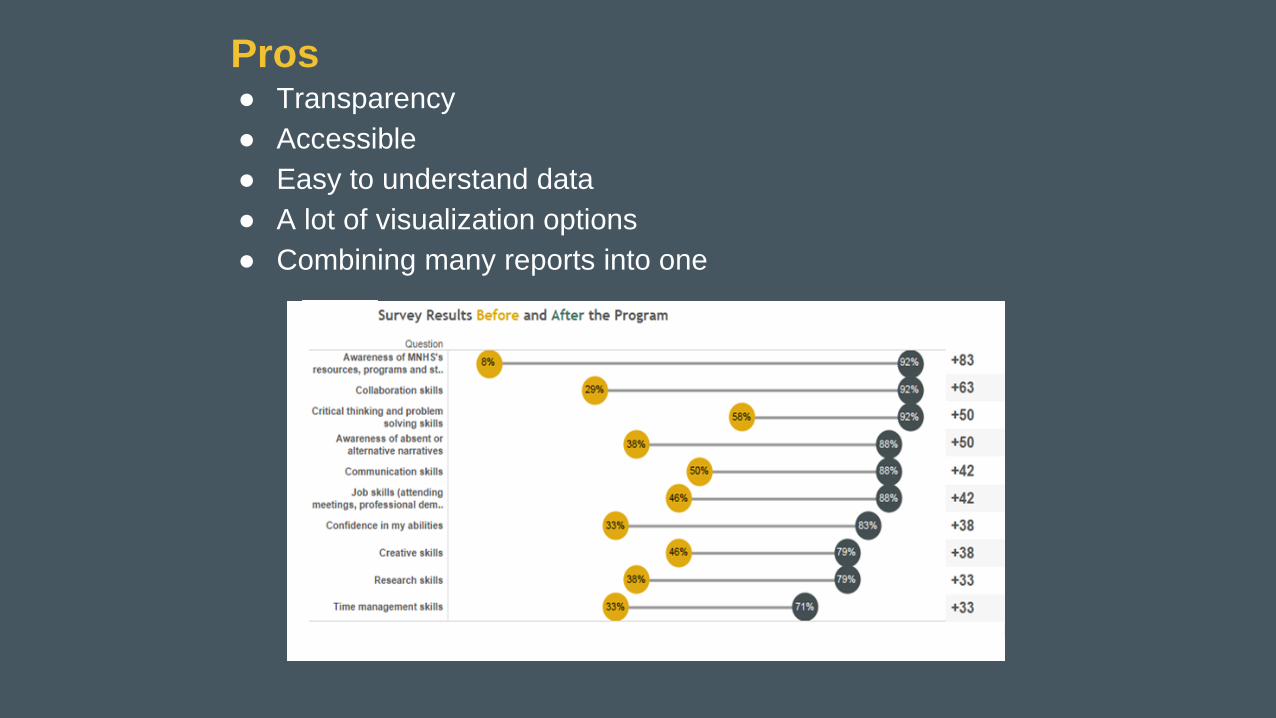
Pros● Transparency
● Accessible
● Easy to understand data
● A lot of visualization options
● Combining many reports into one

Pros● Transparency
● Accessible
● Easy to understand data
● A lot of visualization options
● Combining many reports into one
Cons● Expensive (up to $2000 per desktop license)
● Steep learning curve for creating dashboards
● Not designed for survey data


Presentation 5

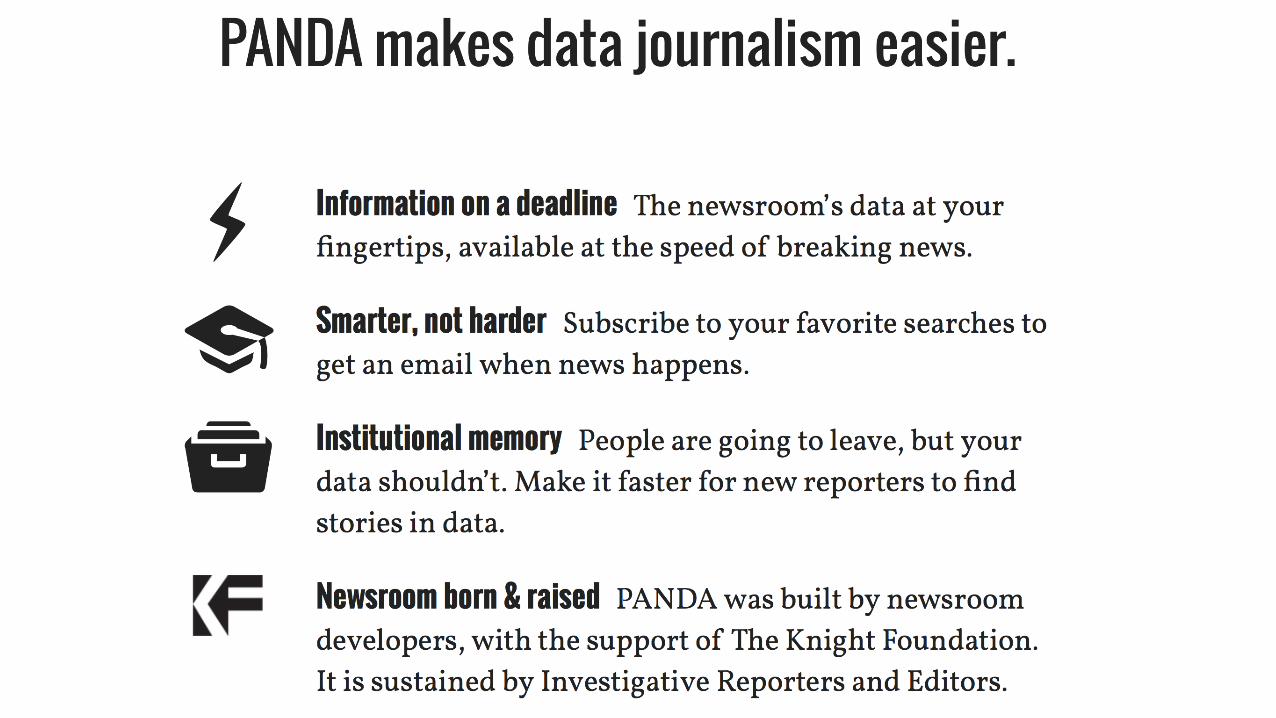
Please Feed the PANDA
Please Feed the PANDA


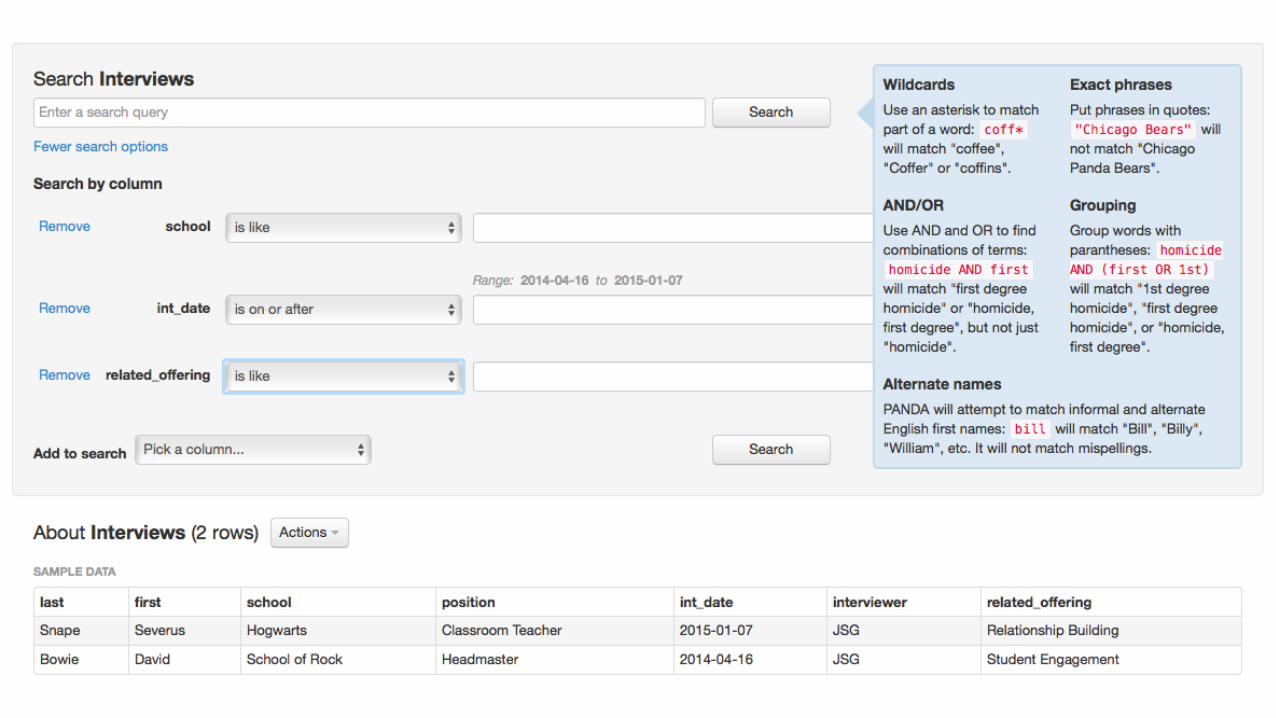
Joinable Shareable Queryable

What about making connections *between* datasets?

My project
(Not really *my* project at all, but calling it that helps get this photo in the door.)

P Panda
A a
N news
D data
A appliance *
* Recursive acronym


What PANDA is not.


Feed the PANDA!


demo.pandaproject.net


Please Feed the PANDA
![Problem Solving With Geospatial Data // Javier de la Torre, CartoDB [FirstMark's Data Driven]](https://cdn.vdocuments.us/doc/165x107/587389c51a28ab272d8b65df/problem-solving-with-geospatial-data-javier-de-la-torre-cartodb-firstmarks.jpg)


