Download - Housing rents in Kent Local Authorities

Strategic Commissioning - Analytics, Kent County Council www.kent.gov.uk/research
Strategic Commissioning Statistical Bulletin April 2020
Housing rents in Kent Local Authorities Related documents
This bulletin presents housing rent levels by sector for Kent Local Authorities. The data was collected and published by the Valuation Office Agency (VOA) and the Ministry of Housing, Communities and Local Government (MHCLG). The information presented is for all sectors of the rental market: Local Authority (LA), Private Registered Providers (PRP) (e.g. Housing Associations), the Private Rental Market (PRM) sector and the VOA Local Reference Rents (LRR).
Summary
• The average weekly rent for local authority owned properties in Kent during 2017/18 ranged from £81.73 in Thanet to £94.17 in Dartford. The average for England was £86.71
• The average weekly rent for Private Register Providers (Housing Associations etc.) ranged from £90.32 in Dover to £114.73 in Tonbridge & Malling. The average for England was £95.59
• The average monthly rent in the private rental market for Kent for the year ending September 2018 was £831; this is below the average for England (£844)
• The index of private rental prices for England at February 2019 was 107.6, +1.1% on 1 year ago
The Housing Statistics web page contains more information which you may find useful.
• House prices and transactions
• New Dwelling completions
• Kent Housing Stock
Note: In this bulletin ‘Kent’ refers to the Kent County Council (KCC) area which excludes Medway Unitary Authority.
Further information Strategic Commissioning - Analytics Kent County Council Sessions House Maidstone, Kent ME14 1XQ Email: [email protected] Tel: 03000 417444

Strategic Commissioning - Analytics, Kent County Council www.kent.gov.uk/research
Page 1
Introduction This bulletin looks at housing rent levels by sector for Kent Local Authorities using data published by the Valuation Office Agency (VOA) and the Ministry of Housing, Communities and Local Government (MHCLG). The different rental sectors included are local authority (local authority owned housing), private rental provider (housing owned by housing associations) and private rental market (housing owned by private landlords).
In addition to the different rental sectors this bulletin looks at Local Reference Rents. These rents are used to help determine the amount of Housing Benefit for tenants renting from private landlords.
Finally this bulletin looks at The Index of Private Rental Prices (IPHRP). The IPHRP is an experimental price index tracking the prices paid for renting property from private landlords in the United Kingdom. It is produced by the Office for National Statistics (ONS)
Local Authority Rents This data shows the district-level data collected annually from all local authorities by the Valuation Office Agency under their main collection processes (local authority housing statistics (LAHS)). The data is considered essential for central and local governments to have an understanding of its housing situation and how policies affect it. The data is published by the Ministry of Housing, Communities and Local Government (MHCLG).
Local Authority housing is that which is owned and managed by local authorities.
The average weekly local authority rents are for the financial year. Most local authorities set their rents at the beginning of the financial year.
The figures shown do not include rates/council tax or any service charges.
Private Registered Providers Private registered providers (PRP) are non-profit and profit-making providers of social housing approved and regulated by Government. Most non-profit providers are also known as housing associations. Over recent years, a number of local authorities have transferred all or part of their housing stock to PRPs.
Data relating to rents charged by Housing Associations (HAs) are comparable to the local authority rents data and are collected by the Communities Agency via their Statistical Data Return (SDR). Data are published by the Valuation Office Agency (VOA).
Private rental market The Valuation Office Agency publishes statistics on the private rental market for England. The data used to generate these statistics is based on a sample of rental information, collected by Rent Officers from landlords and letting agents.

Strategic Commissioning - Analytics, Kent County Council www.kent.gov.uk/research
Page 2
The sample used to produce these statistics is not statistical and may not be consistent over time; as such, these data should not be compared across time periods or between areas.
The data provide mean (average), median, lower quartile, and upper quartile gross monthly rent paid for a number of bedroom/room categories for each local authority in England.
This bulletin presents the mean and the lower quartile data for Kent and Medway local authorities.
Local Reference Rents Local Reference Rents are used to help determine Local Housing Allowance (LHA) rates used to calculate housing benefit for tenants renting from private landlords. LHA rates are based on private market rents being paid by tenants in the broad rental market area (BRMA). A BRMA is an area: within which a tenant of the dwelling could reasonably be expected to live having regard to facilities and services for the purposes of health, education, recreation, personal banking and shopping, taking account of the distance of travel, by public and private transport, to and from those facilities and services. A BRMA (LRR) must contain: sufficient privately rented residential premises, to ensure that, in the Rent Officer’s opinion, the Local Reference Rents for tenancies in the area are representative of the rents that a landlord might reasonably be expected to obtain in that area.
Information on Local reference Rents are published by The Valuation Office Agency (VOA).
The Index of Private Rental Prices Finally this bulletin looks at The Index of Private Housing Rental Prices
(IPHRP) produced by the Office for National Statistics (ONS). The IPHRP is
an experimental price index tracking the prices paid for renting property from
private landlords in the United Kingdom. It measures the change in price
which tenants face when renting residential property from private landlords,
thereby allowing a comparison between the prices tenants are charged in the
current month as opposed to the same month in the previous year. The index
does not measure the change in newly advertised rental prices only, but
reflects price changes for all private rental properties.
IPHRP is released as an experimental statistic. It is a new official statistic
undergoing evaluation and therefore it is recommended that caution is
exercised when drawing conclusions from the published data as the index is
likely to be further developed. Information about the methodology used to
create the index is available from the Office for National Statistics.
The index is available for England and the regions of England.

Strategic Commissioning - Analytics, Kent County Council www.kent.gov.uk/research
Page 3
Local Authority Rents This data shows the district-level information collected annually from all local authorities by the Valuation Office Agency (VOA). The data is published by the Ministry for Housing, Communities and Local Government (MHCLG).
Local Authority housing is that which is owned and managed by local authorities, more commonly known as council housing.
The average weekly local authority rents are for the financial year and the latest data available is for 2018/19.
Five local authorities in Kent have transferred all or most of their housing stock to Private Registered Providers (Housing Associations).
Four of the seven local authorities in Kent which still retain their housing stock have average rents higher than the national average of £85.97 per week. The highest average rent is in Dartford (£92.91 per week). The lowest is in Thanet with an average weekly rent of £80.48.
Ashford and Dartford have seen the greatest increase in average weekly rents, up £24.87 and £22.45 respectively over the last ten years. These are the only Kent authorities which saw a higher increase than the national average of £21.76.
Dover saw the smallest increase in average weekly rents since 2008/09 (+£16.09).
Table 1 shows average weekly local authority rates from 2007/08 to 2018/19.
Table 1: Average weekly local authority rents
Chart 1 shows the average weekly local authority rents in Kent and Medway in 2018/19 compared to the national average.
Local authority average weekly (social and affordable) rents £ per week
2007-08 2008-09 2009-10 2010-11 2011-12 2012-13 2013-14 2014-15 2015-16 2016-17 2017-18 2018-19
E07000105 Ashford 66.49 69.77 71.15 72.99 82.38 85.37 88.10 91.91 93.18 93.04 93.81 94.64
E07000106 Canterbury 67.07 69.26 71.20 70.78 78.00 82.69 85.68 87.84 89.79 89.10 88.21 86.45
E07000107 Dartford 66.93 70.46 72.90 74.96 83.49 88.61 90.42 93.43 95.25 95.06 94.17 92.91
E07000108 Dover 65.67 68.08 70.36 70.20 73.95 79.66 81.21 84.72 86.50 85.78 84.92 84.17
E07000109 Gravesham 64.54 67.28 69.34 70.03 73.46 79.36 83.26 87.79 89.73 92.74 88.76 88.15
E07000110 Maidstone LSVT LSVT LSVT LSVT LSVT LSVT LSVT LSVT LSVT LSVT LSVT LSVT
E07000111 Sevenoaks LSVT LSVT LSVT LSVT LSVT LSVT LSVT LSVT LSVT LSVT LSVT LSVT
E07000112 Folkestone and Hythe 60.79 63.45 65.37 66.39 73.80 83.68 87.21 86.82 85.30 84.99 84.31 83.71
E07000113 Swale LSVT LSVT LSVT LSVT LSVT LSVT LSVT LSVT LSVT LSVT LSVT LSVT
E07000114 Thanet 61.50 63.38 65.19 67.14 69.17 74.33 77.25 81.03 82.23 82.41 81.73 80.48
E07000115 Tonbridge and Malling LSVT LSVT LSVT LSVT LSVT LSVT LSVT LSVT LSVT LSVT LSVT LSVT
E07000116 Tunbridge Wells LSVT LSVT LSVT LSVT LSVT LSVT LSVT LSVT LSVT LSVT LSVT LSVT
E06000035 Medway 62.76 64.90 66.81 68.00 76.74 79.44 82.42 84.24 84.26 83.49 82.61 80.95
E92000001 England 61.62 64.21 66.05 67.83 73.58 78.55 82.44 85.89 87.93 87.36 86.71 85.97
"LSVT" Large Scale Voluntary Transfer - All or most of the local authority's stock has been transferred to the Private Registered Provider sector
"n.a" - not available
Source: MHCLG - Live Table 702
Presented by: Strategic Commissioning - Analytics, Kent County Council

Strategic Commissioning - Analytics, Kent County Council www.kent.gov.uk/research
Page 4
Chart 1: Average weekly local authority rents in Kent & Medway
Private Registered Provider Rents Private registered providers (PRP) are non-profit and profit-making providers of social housing approved and regulated by Government. Most non-profit providers are also known as housing associations.
As at 2019 the average weekly PRP rent in England was £95.12. Nine local authorities in Kent have higher average weekly PRP rents than the national average.
Tonbridge and Malling has the highest average weekly PRP rent with £113.10 per week. The lowest is in Dover (£89.35 per week).
On average PRP rents have increased by £21.61 nationally over the last ten years. Six local authorities in Kent have seen PRP rents increase above the national average. The biggest increase was seen in Tonbridge and Malling where the average rent increased by £27.44 per week. Dover saw the smallest increase since 2009 (+£13.33).
The average weekly PRP rents in Kent and Medway local authorities from 2008 to 2019 are shown in table 2.
Ash
ford
, £
94
.64
Dar
tfo
rd,
£9
2.9
1
Gra
vesh
am,
£8
8.1
5
Can
terb
ury
, £
86
.45
Do
ver,
£8
4.1
7
Folk
est
on
e a
nd
Hyt
he
, £8
3.7
1
Me
dw
ay,
£8
0.9
5
Than
et,
£8
0.4
870.0
75.0
80.0
85.0
90.0
95.0
100.0
Ashford Dartford Gravesham Canterbury Dover Folkestoneand Hythe
Medway Thanet Maidstone Sevenoaks Swale Tonbridgeand Malling
TunbridgeWells
£ p
er w
eek
Local authority average weekly rents, 2018/19
England£86.0
Source: HMCLGPresented by: Strategic Commissioning - Analytics, Kent County Council

Strategic Commissioning - Analytics, Kent County Council www.kent.gov.uk/research
Page 5
Table 2: Private registered provider rents
Chart 2 shows the average weekly PRP rents in Kent and Medway in 2019 compared to the national average.
Chart 2: Average weekly PRP rents in Kent & Medway
Private rental market rents The Valuation Office Agency publishes estimates on the private rental market (PRM) for England. The data used to generate these statistics is based on a sample of rental information, collected by Rent Officers from landlords and letting agents.
The sample used to produce these statistics is not statistical and may not be consistent over time; as such, these data should not be compared across time periods or between areas.
Whilst the data provide the mean (average), median, lower quartile, and upper quartile gross monthly rent paid for a number of bedroom/room categories for
£ per week
2008 2009 2010 2011 2012 2013 2014 2015 2016 2017 2018 2019
E07000105 Ashford 78.87 81.01 83.95 83.96 87.01 93.47 97.01 101.1 102.8 101.4 100.7 99.7
E07000106 Canterbury 78.55 82.19 86.82 86.76 92.19 96.30 99.77 103.78 105.64 104.11 103.55 103.27
E07000107 Dartford 79.68 82.42 86.77 87.97 90.94 99.92 103.72 108.09 111.02 109.67 108.66 107.99
E07000108 Dover 75.00 76.02 78.70 77.70 81.39 84.18 87.69 90.91 92.69 90.72 90.32 89.35
E07000109 Gravesham 81.33 83.05 87.72 88.98 93.53 98.45 101.69 106.05 108.46 107.96 106.86 107.03
E07000110 Maidstone 70.26 74.11 78.77 78.61 83.39 88.62 91.29 95.96 97.73 97.37 96.30 96.79
E07000111 Sevenoaks 79.02 82.83 87.59 87.96 93.00 102.57 103.24 109.64 108.96 108.77 107.78 106.30
E07000112 Folkestone and Hythe 73.98 76.43 79.52 79.66 84.63 88.12 92.12 94.93 96.79 94.85 94.79 94.16
E07000113 Swale 82.54 84.13 87.19 84.90 85.95 91.34 94.32 97.82 100.24 99.18 98.21 97.47
E07000114 Thanet 74.00 76.68 78.89 77.22 84.15 85.73 90.66 93.20 93.80 92.57 92.22 91.07
E07000115 Tonbridge and Malling 81.28 85.66 91.07 91.61 97.06 102.96 107.40 113.50 116.33 115.17 114.73 113.10
E07000116 Tunbridge Wells 84.07 87.18 92.34 91.96 101.06 102.59 106.80 110.61 113.01 112.00 110.91 109.77
E06000035 Medway UA 77.40 80.70 84.22 84.16 89.33 93.89 97.64 101.42 102.80 100.98 101.20 100.47
E92000001 England 69.96 73.51 77.91 78.28 83.21 88.41 92.30 95.89 97.84 96.61 95.59 95.12
Source: MHCLG - Live Table 704
Presented by: Strategic Commissioning - Analytics, Kent County Council
Ton
bri
dge
an
d M
allin
g, £
11
3.1
0
Tun
bri
dge
We
lls,
£1
09
.77
Dar
tfo
rd,
£1
07
.99
Gra
vesh
am,
£1
07
.03
Seve
no
aks,
£1
06
.30
Can
terb
ury
, £
10
3.2
7
Me
dw
ay U
A,
£1
00
.47
Ash
ford
, £
99
.73
Swal
e,
£9
7.4
7
Mai
dst
on
e,
£9
6.7
9
Folk
est
on
e a
nd
Hyt
he
, £
94
.16
Than
et,
£9
1.0
7
Do
ver,
£8
9.3
5
0.0
20.0
40.0
60.0
80.0
100.0
120.0
140.0
Tonbridgeand Malling
TunbridgeWells
Dartford Gravesham Sevenoaks Canterbury Medway UA Ashford Swale Maidstone Folkestoneand Hythe
Thanet Dover
£ p
er w
eek
Private registered provider rents, 2019
England£95.12
Source: HMCLGPresented by: Strategic Commissioning - Analytics, Kent County Council

Strategic Commissioning - Analytics, Kent County Council www.kent.gov.uk/research
Page 6
each local authority in England this bulletin presents the mean and the lower quartile data for Kent and Medway local authorities.
The latest data is for the year October 2017 to September 2018.
As at 2018/19 the average (mean) monthly PRM rent for properties of all sizes in England was £858, the average for the South East region was higher at £980 per month.
In Kent the average was £869 per month, above the national average and below the regional average, however three local authorities in Kent (Tunbridge Wells, Tonbridge and Malling and Sevenoaks) had average PRM rents that were higher than the national and regional average.
The highest average PRM rent in Kent for properties of all sizes was in Sevenoaks. At £1,386 per month this is £528 above the national average.
The lowest average PRM rent was in Folkestone & Hythe (£646 per month).
Table 3 shows the average (mean) monthly PRM rents as at 2018/19.
Table 3: Private rental market – mean rents
Chart 3 shows the average (mean) monthly PRM rents in Kent and Medway compared to the national average .
£ per month
2018/19 Room Studio 1 bed 2 bed 3 bed 4+ beds
All
categories
Ashford 423 518 644 766 963 1,391 797
Canterbury 409 563 671 854 1,060 1,765 873
Dartford 0 605 776 981 1,199 1,583 997
Dover 390 405 491 658 825 1,183 673
Gravesham 425 560 671 846 1,041 1,363 874
Maidstone 470 548 675 849 1,071 1,436 867
Sevenoaks 0 618 857 1,134 1,428 2,472 1,386
Folkestone & Hythe 396 416 486 641 823 1,174 646
Swale 470 516 582 753 883 1,239 779
Thanet 382 389 521 688 878 1,155 685
Tonbridge and Malling 552 594 756 978 1,268 1,903 1,114
Tunbridge Wells 527 567 737 998 1,276 2,099 1,052
Kent 424 528 630 824 1,051 1,667 869
Medway UA 392 521 644 803 900 1,354 788
SOUTH EAST 436 583 718 916 1,131 1,873 980
London 630 1,034 1,350 1,700 2,166 3,221 1,727
ENGLAND 411 668 731 800 916 1,611 858
Source: Valuation Office Agency
Presented by: Strategic Commissioning - Analytics, Kent County Council

Strategic Commissioning - Analytics, Kent County Council www.kent.gov.uk/research
Page 7
Chart 3: Average monthly PRM rents in Kent and Medway
Chart 4 shows the average monthly PRM rents for all property sizes in local authorities in the South East region.
Sevenoaks had the fourth highest monthly PRM rents in the South East. Folkestone & Hythe had the lowest average monthly PRM rent in the region.
Chart 4: Average PRM rents in South East local authorities
Seve
no
aks,
£1
,38
6
Ton
bri
dge
an
d M
allin
g, £
1,1
14
Tun
bri
dge
We
lls,
£1
,05
2
Dar
tfo
rd,
£9
97
Gra
vesh
am,
£8
74
Can
terb
ury
, £
87
3
Ke
nt,
£8
69
Mai
dst
on
e,
£8
67
Ash
ford
, £
79
7
Me
dw
ay U
A,
£7
88
Swal
e,
£7
79
Than
et,
£6
85
Do
ver,
£6
73
Folk
est
on
e &
Hyt
he
, £
64
6
£0
£200
£400
£600
£800
£1,000
£1,200
£1,400
£1,600
Sevenoaks Tonbridgeand Malling
TunbridgeWells
Dartford Gravesham Canterbury Kent Maidstone Ashford Medway UA Swale Thanet Dover Folkestone& Hythe
£ p
er m
on
thPrivate rental market - mean monthly rents 2018-19
England £844
Source: VOAPresented by: Strategic Commissioning - Analytics, Kent County Council
Seve
noa
ks, £
1,38
6
Ton
bri
dge
an
d M
alli
ng,
£1,
114
Tun
bri
dge
Wel
ls, £
1,05
2
Da
rtfo
rd, £
997
Gra
vesh
am, £
874
Ca
nte
rbu
ry, £
87
3
Ma
idst
one
, £86
7
Ash
ford
, £7
97
Me
dw
ay
UA
, £78
8
Swa
le, £
779
Tha
net
, £6
85
Do
ver,
£67
3
Folk
esto
ne
& H
yth
e, £
646
0
200
400
600
800
1,000
1,200
1,400
1,600
1,800
2,000
Elm
bri
dge
Sout
h B
ucks
Gui
ldfo
rdSe
ven
oak
sO
xfo
rdEp
som
and
Ew
ell
Bri
ghto
n an
d H
ove
UA
Wo
kin
gC
hilt
ern
Tan
dri
dge
Wa
verl
eyM
ole
Val
ley
Win
dso
r an
d M
aid
enh
ead
…W
oki
ngh
am U
AR
unn
ymed
eW
inch
este
rR
eiga
te a
nd
Ban
stea
dSp
elth
orn
eV
ale
of
Wh
ite
Ho
rse
Tonb
rid
ge a
nd M
alli
ngSu
rrey
Hea
thW
ycom
be
Har
tSo
uth
Oxf
ord
shir
eH
orsh
amTu
nbri
dge
Wel
lsW
est
Ber
kshi
re U
AM
id S
uss
ex
Bra
ckn
ell F
ore
st U
AR
ead
ing
UA
We
ald
enLe
we
sD
artf
ord
Slo
ugh
UA
Cra
wle
yW
est
Oxf
ord
shir
eM
ilton
Key
nes
UA
Test
Val
ley
Chi
ches
ter
New
Fo
rest
East
Ham
pshi
reB
asin
gsto
ke a
nd
De
ane
Che
rwel
lA
yle
sbur
y V
ale
Ad
urFa
reh
amG
rave
sha
mC
ante
rbur
yR
ushm
oor
Mai
dsto
neEa
stle
igh
Hav
ant
Aru
nR
oth
erP
orts
mo
uth
UA
Wo
rth
ing
Ash
ford
Sout
ham
pto
n U
AM
edw
ay U
ASw
ale
East
bou
rne
Gos
port
Than
etD
over
Isle
of W
igh
t U
AH
asti
ngs
Folk
esto
ne &
Hyt
he
£ p
er m
on
th
Private rental markent - mean monthly rents in the South East2018-19
England £858
Source: VOAPresented by: Strategic Commissioning - Analytics, Kent County Council
Strategic Commissioning - Analytics, Kent County Council www.kent.gov.uk/research
Page 8
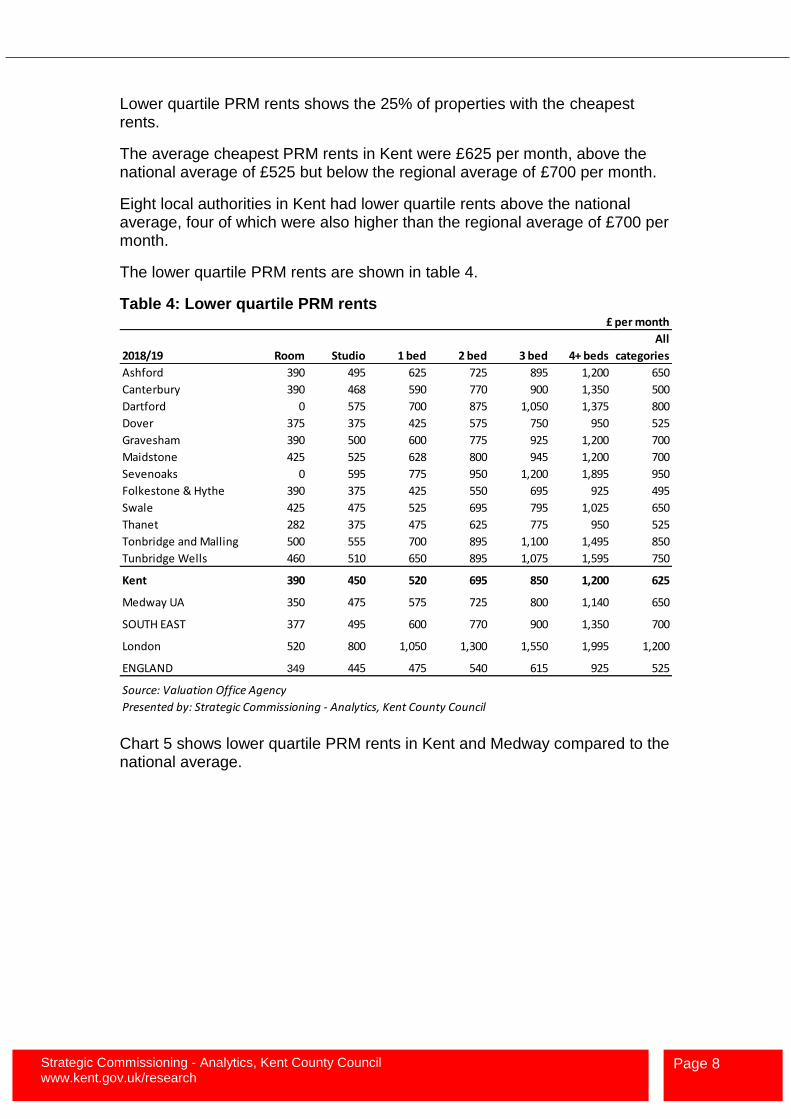
Lower quartile PRM rents shows the 25% of properties with the cheapest rents.
The average cheapest PRM rents in Kent were £625 per month, above the national average of £525 but below the regional average of £700 per month.
Eight local authorities in Kent had lower quartile rents above the national average, four of which were also higher than the regional average of £700 per month.
The lower quartile PRM rents are shown in table 4.
Table 4: Lower quartile PRM rents
Chart 5 shows lower quartile PRM rents in Kent and Medway compared to the national average.
£ per month
2018/19 Room Studio 1 bed 2 bed 3 bed 4+ beds
All
categories
Ashford 390 495 625 725 895 1,200 650
Canterbury 390 468 590 770 900 1,350 500
Dartford 0 575 700 875 1,050 1,375 800
Dover 375 375 425 575 750 950 525
Gravesham 390 500 600 775 925 1,200 700
Maidstone 425 525 628 800 945 1,200 700
Sevenoaks 0 595 775 950 1,200 1,895 950
Folkestone & Hythe 390 375 425 550 695 925 495
Swale 425 475 525 695 795 1,025 650
Thanet 282 375 475 625 775 950 525
Tonbridge and Malling 500 555 700 895 1,100 1,495 850
Tunbridge Wells 460 510 650 895 1,075 1,595 750
Kent 390 450 520 695 850 1,200 625
Medway UA 350 475 575 725 800 1,140 650
SOUTH EAST 377 495 600 770 900 1,350 700
London 520 800 1,050 1,300 1,550 1,995 1,200
ENGLAND 349 445 475 540 615 925 525
Source: Valuation Office Agency
Presented by: Strategic Commissioning - Analytics, Kent County Council

Strategic Commissioning - Analytics, Kent County Council www.kent.gov.uk/research
Page 9
Chart 5: Lower quartile PRM rents in Kent and Medway
Comparison of rents Table 5 and chart 6 show local authority rents, PRP rents and PRM rents compared to each other. Table 5: Comparison of LA rents, PRP rents and PRM rents in Kent & Medway
£0
£100
£200
£300
£400
£500
£600
£700
£800
£900
£1,000
Sevenoaks Tonbridgeand
Malling
TunbridgeWells
Dartford GraveshamCanterbury Kent Maidstone Ashford MedwayUA
Swale Thanet Dover Folkestone& Hythe
Private rental market - lower quartile monthly rents 2018/19
England £525
Source: VOAPresented by: Strategic Commissioning - Analytics, Kent County Council
Published rents Calculated monthly equivalent
Local
Authority
Rents £
per week
Private
Registered
Provider
Rents £
per week
Private
Rental £
per month
Local
Authority
Rents
Private
Registered
Provider
Rents
Private
Rental
2018/19 2019 2018/19 2018/19 2019 2018/19
Ashford £94.6 £99.7 £797.0 Ashford £410.1 £432.2 £797.0
Canterbury £86.5 £103.3 £873.0 Canterbury £374.6 £447.5 £873.0
Dartford £92.9 £108.0 £997.0 Dartford £402.6 £468.0 £997.0
Dover £84.2 £89.4 £673.0 Dover £364.7 £387.2 £673.0
Folkestone and Hythe £88.2 £107.0 £874.0 Folkestone and Hythe £382.0 £463.8 £874.0
Gravesham £96.8 £867.0 Gravesham £0.0 £419.4 £867.0
Maidstone £106.3 £1,386.0 Maidstone £0.0 £460.6 £1,386.0
Sevenoaks £83.7 £94.2 £646.0 Sevenoaks £362.7 £408.0 £646.0
Swale £97.5 £779.0 Swale £0.0 £422.4 £779.0
Thanet £80.5 £91.1 £685.0 Thanet £348.8 £394.6 £685.0
Tonbridge and Malling £113.1 £1,114.0 Tonbridge and Malling £0.0 £490.1 £1,114.0
Tunbridge Wells £109.8 £1,052.0 Tunbridge Wells £0.0 £475.7 £1,052.0
Medway £81.0 £100.5 £788.0 Medway £350.8 £435.4 £788.0
Monthly equivalents calculated per calendar month: weekly rent x 52 weeks/12 months
Source: Valuation Office Agency; MHCLG
Presented by: Strategic Commissioning - Analytics, Kent County Council

Strategic Commissioning - Analytics, Kent County Council www.kent.gov.uk/research
Page 10
Chart 6: LA rents, PRP rents and PRM rents in Kent & Medway
Local Reference Rents Information on Local Reference Rents are published by The Valuation Office Agency (VOA).
Local Reference Rents are used to help determine Local Housing Allowance (LHA) rates used to calculate housing benefit for tenants renting from private landlords.
LHA rates are based on private market rents being paid by tenants in the broad rental market area (BRMA). A BRMA is an area: within which a tenant of the dwelling could reasonably be expected to live having regard to facilities and services for the purposes of health, education, recreation, personal banking and shopping, taking account of the distance of travel, by public and private transport, to and from those facilities and services. A BRMA (LRR) must contain: sufficient privately rented residential premises, to ensure that, in the Rent Officer’s opinion, the Local Reference Rents for tenancies in the area are representative of the rents that a landlord might reasonably be expected to obtain in that area.
Map 1 shows Kent and Medway local authorities and the BRMA within which they sit.
£4
10
£3
75
£403
£365
£363
£3
82
£351
£349
£4
32
£448 £4
68
£387 £4
08 £464
£419
£435 £4
61
£422
£395
£490
£4
76
£7
97 £8
73
£9
97
£673
£6
46
£874
£867
£788
£1,3
86
£779
£685
£1,1
14
£1,0
52
£0
£200
£400
£600
£800
£1,000
£1,200
£1,400
£1,600
Ashford Canterbury Dartford Dover Folkestoneand Hythe
Gravesham Maidstone Medway Sevenoaks Swale Thanet Tonbridgeand Malling
TunbridgeWells
£ p
er m
on
thEstimated average monthly rent comparison by provider
LA 2018/19 PRP 2019 Private Rental 2018/19
Source: HMCLG; VOAPresented by: Strategic Commissioning - Analytics, Kent County Council

Strategic Commissioning - Analytics, Kent County Council www.kent.gov.uk/research
Page 11
Map 1: BRMAs in Kent and Medway
Local reference rents are highest in the High Weald BRMA. This BRMA contains Sevenoaks, Tonbridge and Malling and Tunbridge Wells, where as previously noted private rental market rates are highest.
Local reference rents for BRMAs within Kent and Medway are presented in Table 6.
Table 6:Local reference rents in Kent and Medway BRMAs
Chart 7 shows the local reference rents within Kent and Medway BRMAs by number of bedrooms.
Local Reference Rents - January 2020 £ per week
BRMA (LRR) One room (board)
One room
(shared
facilities)
One room
(self-
contained)
Two
rooms
Three
rooms
Four
rooms
Five
rooms Six Rooms
Ashford 127.50 94.48 127.50 152.89 181.73 233.66 261.92 322.50
Canterbury 127.50 89.60 127.50 155.19 210.58 253.85 319.62 391.16
Dover-Shepway 127.50 84.04 127.50 121.16 159.81 189.81 225.00 288.46
High Weald 130.00 107.87 130.00 184.62 253.85 299.43 359.43 450.00
Maidstone 127.50 99.00 127.50 163.85 204.81 253.27 285.58 351.93
Medway & Swale 127.50 86.07 127.50 155.77 193.27 222.12 262.50 322.08
North West Kent 127.50 88.04 127.50 173.08 223.27 274.04 300.00 346.15
Thanet 127.50 85.23 127.50 129.81 163.85 199.04 230.19 265.39
Source: Valuation Office Agency
Presented by: Strategic Commissioning - Analytics, Kent County Council

Strategic Commissioning - Analytics, Kent County Council www.kent.gov.uk/research
Page 12
Chart 7: Local reference rents by BRMA in Kent & Medway
The index of Private Housing Rental Prices (IPHRP) An Experimental Index The IPHRP is an experimental price index produced by the Office for National
Statistics (ONS) to track the prices paid for renting property from private
landlords in the United Kingdom.
The IPHRP measures the change in price which tenants face when renting
residential property from private landlords, thereby allowing a comparison
between the prices tenants are charged in the current month as opposed to
the same month in the previous year. The index does not measure the
change in newly advertised rental prices only, but reflects price changes for all
private rental properties.
IPHRP is released as an experimental statistic. It is a new official statistic undergoing evaluation and therefore it is recommended that caution is exercised when drawing conclusions from the published data as the index is likely to be further developed.
The index is available for England and the regions of England.
£0
£50
£100
£150
£200
£250
£300
£350
£400
£450
£500
Ashford Canterbury Dover-Shepway High Weald Maidstone Medway & Swale North West Kent Thanet
£ p
er w
eek
Local reference rents by broad rental market area in Kent & Medway, January 2020
One room (board) One room (shared facilities) One room (self-contained) Two rooms Three rooms Four rooms Five rooms Six Rooms
Source: VOAPresented by: Strategic Commissioning - Analytics, Kent County Council

Strategic Commissioning - Analytics, Kent County Council www.kent.gov.uk/research
Page 13
Table 7: IPHRP for the South East, London and England
% change on a year earlier Index (Jan 2015 = 100.0)
London
South
East England
England
(excl
London) London
South
East England
England
(excl
London)
2015 Jan 2.8 2.1 1.9 1.4 100.0 100.0 100.0 100.0
Feb 3.0 2.2 2.1 1.4 100.3 100.2 100.2 100.1
Mar 3.2 2.3 2.1 1.5 100.6 100.3 100.4 100.2
Apr 3.3 2.4 2.3 1.6 100.9 100.6 100.6 100.4
May 3.7 2.4 2.5 1.7 101.5 100.7 100.9 100.5
Jun 3.8 2.5 2.5 1.7 101.8 100.9 101.1 100.7
Jul 3.7 2.4 2.5 1.7 102.0 101.0 101.2 100.8
Aug 4.3 2.6 2.8 1.9 102.7 101.3 101.6 101.0
Sep 4.1 2.7 2.8 1.9 102.8 101.6 101.8 101.2
Oct 4.1 2.8 2.8 2.0 103.0 101.8 102.0 101.3
Nov 4.1 2.7 2.8 2.0 103.3 102.1 102.2 101.6
Dec 3.9 2.8 2.7 1.9 103.4 102.5 102.3 101.7
2016 Jan 3.9 2.9 2.7 2.0 103.9 102.9 102.7 102.0
Feb 3.8 2.9 2.8 2.1 104.1 103.1 102.9 102.2
Mar 3.7 2.9 2.8 2.1 104.4 103.3 103.1 102.4
Apr 3.7 3.1 2.8 2.2 104.7 103.7 103.4 102.6
May 3.3 3.4 2.6 2.3 104.8 104.1 103.6 102.8
Jun 3.0 3.4 2.5 2.2 104.9 104.3 103.7 102.9
Jul 3.0 3.5 2.6 2.3 105.0 104.5 103.8 103.1
Aug 2.6 3.4 2.4 2.3 105.3 104.7 104.1 103.4
Sep 2.7 3.5 2.5 2.4 105.5 105.1 104.3 103.6
Oct 2.6 3.4 2.5 2.5 105.7 105.2 104.5 103.8
Nov 2.4 3.4 2.4 2.5 105.7 105.6 104.7 104.1
Dec 2.4 3.4 2.5 2.6 105.8 106.0 104.9 104.3
2017 Jan 2.1 3.3 2.3 2.5 106.1 106.3 105.1 104.6
Feb 1.9 3.3 2.3 2.5 106.1 106.5 105.2 104.7
Mar 1.6 3.4 2.1 2.4 106.0 106.7 105.3 104.8
Apr 1.4 3.1 2.0 2.4 106.1 106.9 105.4 105.0
May 1.3 2.8 1.9 2.2 106.3 107.1 105.5 105.1
Jun 1.3 2.8 1.9 2.2 106.3 107.2 105.6 105.2
Jul 1.5 2.6 1.9 2.2 106.5 107.3 105.8 105.4
Aug 1.2 2.6 1.7 2.1 106.5 107.4 105.9 105.5
Sep 0.9 2.5 1.6 2.1 106.5 107.7 106.0 105.7
Oct 0.8 2.4 1.5 2.0 106.5 107.8 106.1 105.9
Nov 0.6 2.3 1.4 1.9 106.4 108.0 106.2 106.1
Dec 0.4 2.0 1.3 1.8 106.2 108.2 106.2 106.2
2018 Jan 0.2 1.8 1.1 1.7 106.3 108.2 106.3 106.4
Feb 0.1 1.7 1.1 1.7 106.2 108.3 106.4 106.5
Mar 0.1 1.7 1.1 1.7 106.1 108.5 106.4 106.6
Apr 0.0 1.6 1.0 1.7 106.1 108.7 106.5 106.8
May -0.2 1.6 1.0 1.7 106.1 108.8 106.6 106.9
Jun -0.2 1.5 1.0 1.7 106.1 108.8 106.7 107.0
Jul -0.3 1.5 0.9 1.6 106.2 109.0 106.8 107.1
Aug -0.3 1.5 0.9 1.6 106.3 109.1 106.9 107.3
Sep -0.2 1.4 0.9 1.6 106.3 109.2 107.0 107.4
Oct -0.2 1.3 0.9 1.6 106.3 109.2 107.1 107.5
Nov 0.0 1.2 1.0 1.5 106.3 109.3 107.2 107.7
Dec 0.2 1.4 1.1 1.5 106.4 109.7 107.4 107.9
2019 Jan 0.1 1.5 1.1 1.6 106.4 109.9 107.4 108.1
Feb 0.2 1.6 1.1 1.6 106.5 110.1 107.6 108.2
Mar 0.5 1.5 1.2 1.6 106.6 110.2 107.7 108.3
Apr 0.5 1.6 1.2 1.6 106.7 110.4 107.8 108.4
May 0.9 1.5 1.3 1.5 107.0 110.4 108.0 108.5
Jun 0.9 1.6 1.3 1.6 107.0 110.5 108.1 108.7
Jul 0.9 1.6 1.4 1.6 107.2 110.7 108.2 108.8
Aug 0.8 1.6 1.3 1.5 107.1 110.8 108.3 108.9
Sep 0.9 1.6 1.3 1.5 107.2 110.9 108.4 109.1
Oct 0.9 1.7 1.4 1.6 107.3 111.1 108.6 109.3
Nov 1.0 1.7 1.4 1.7 107.4 111.2 108.7 109.5
Dec 1.2 1.4 1.4 1.6 107.6 111.2 108.9 109.6
2020 Jan 1.3 1.4 1.5 1.7 107.7 111.4 109.1 109.8
Feb 1.1 1.2 1.4 1.6 107.7 111.4 109.1 109.9
Experimental data - Not seasonally adjusted
Index level (January 2015 = 100)
Source: Office for National Statistics
Presented by: Strategic Commissioning - Analytics, Kent County Council

Strategic Commissioning - Analytics, Kent County Council www.kent.gov.uk/research
Page 14
Chart 8: IPHRP for the South East, London and England from 2015
Chart 9: IPHRP – 1 year percentage change
98.0
100.0
102.0
104.0
106.0
108.0
110.0
112.0
114.0
Jan Mar May Jul Sep Nov Jan Mar May Jul Sep Nov Jan Mar May Jul Sep Nov Jan Mar May Jul Sep Nov Jan Mar May Jul Sep Nov Jan
2015 2016 2017 2018 2019 2020
Ind
ex: J
an
ua
ry 2
01
5=1
00
Index of private housing rental prices (experimental statistics)January 2015=100
London South East England (excl London)
Source: Office for National StatisticsPresented by: Strategic Commissioning - Analytics, Kent County Council
-1.0
-0.5
0.0
0.5
1.0
1.5
2.0
2.5
3.0
3.5
4.0
4.5
Jan Mar May Jul Sep Nov Jan Mar May Jul Sep Nov Jan Mar May Jul Sep Nov Jan Mar May Jul Sep Nov Jan Mar May Jul Sep Nov Jan
2015 2016 2017 2018 2019 2020
Per
cen
tage
Index of private housing rental prices (experimental statistics)1 year percentage change
London South East England (excl London)
Source: Office for National StatisticsPresented by: Strategic Commissioning - Analytics, Kent County Council


