· . ..
HINGE ROTATION CAPABILITY OF
PRESTRESSED CONCRETE BEAMS
by
NEVILLE CHAI
A thesis submitted to the Faculty of Graduate
Studies and Research in partial fulfillment
of the requirements for the degree of
Master of Engineering
Department of Civil Engineering
and Applied Mechanics
McGill University
Montreal, Canada
® 1:evi11e Chai 1971
August, 1970

To
Christina

- i -
Hinge Rotation Capabi1ity of
Prestressed Concrete Beams
Neville Chai
Department of Civil Engineering
and App1ied Mechanics
ABSTRAGr
M. Eng.
August 1970
The present study was conducted to investigate the magnitude of the
hinge rotation and the extent of the plastic region of rectangu1ar prestressed
concrete beams under a concentrated load at midspan. The effects of the mag
nitude of the prestressing force and the spacings of the web reinforcement
were studied.
Extensive ~urements of rotations were ca1cu1ated by severa1 methods.
Hinge rotation was ca1cu1ated from the curvature distribution measured from
concrete strains.
A theoretica1 moment-curvature re1ationship using equi1ibrium of
forces, compatibi1ity of deformations, the stress-strain curves of concrete
and tension steel and the physica1 beam properties is presented. The results
thus ca1cu1ated were found to compare we11 with the experimenta1 resu1ts.
The experimenta1 resu1ts provide data of 1imiting values for concrete
deformations in ine1astic design theories.
- ii -
ACKNOWLEDGEMENTS
The author is deeply indebted for the advice and guidance provided
by Professor J.O. McCutcheon in directing this program. The helpful sug
gestions by Drs. M.A. Sheikh and M. Celebi in the initial phase of the
project is appreciated. The author wishes to extend his acknowledgements
to Drs. M.S. Mirza and J. Nemec who willingly offered their assistance and
helpful criticism during informal discussions.
The ideas provided by his fellow graduate students and the tech
nical assistances given by Mr. B. Cockayne and his staff are deeply appre
ciated.
The author acknowledges financial assistance from the Emergency
Measures Organization of Canada under Grant No. 275-22. Support from the
Steel Company of Canada and the Canada Cement Co. Ltd., who provided the
prestressing wires and the cement respectively, is wholeheartedly
appreciated.
ABSTRACT .•••
ACKNOWLEDGEMENTS
TABLE OF CONTENTS.
LIST OF FIGURES. •
LIST OF TABLES •
l - INTRODUCT ION
- iii -
TABLE OF CONTENT S
1.1 Object and Scope •••
1.2 Nature of the prob1em .
II - SURVEY OF LITERATURE • • •
III - TEST PROCEDURES AND INSTRUMENTATION
3.1 Strain Measurements on Prestressing Strands •
3.2 Strain Gauges on Concrete •.
3.3
3.4
Lever Arms at End Supports ••
Def1ections at Midspan. . • .
IV - EXPERIMENrAL RESULTS AND ANALYSIS
4.1 CurvatureS and Curvature Distributions .•
4.2
4.3
4.4
Strain Distributions.
Rotations • . • • •.• •
Hinge Rotation measured from Curvature Distribution .
4.5 Average Curvature over the Hinge Length .••
4.6 Rotation measured from Midspan Def1ections.
4.7 Rotation measured from Lever Arms • . • • •
Page
i
ii
. • iii
v
vi
1
2
4
6
7
7
7
8
9
10
11
12
· 12
· 12
4.8 Total Rotation measured from Curvature Distribution . 13
V - THEORETICAL ANALYSIS
5.1 Assumptions ..
5.2 General Formulas. .
5.3 Hinge Rotation ..
. • 14
· 18
21

- iv -
VI - CONCLUSIONS
6.1 Comparison of Experimental and Theoretical Results • 23
. . 24 Hinge Rotation and Total Rotations 6.2
6.3 Differences between Reinforced and Prestressed Members 25
6.4 Recommendations for Future Research.
FIGURES.
TABLES .•.
APPENDIX A.
APPENDIX B.
BIBLIOGRAPHY.
. . . 26
• • • 27
• 75
82
. • 85
93
Figure No.
1
2
3
4
5-13
14
15-21
22
23-35
36-42
43
44-45
46-48
BI
B2
B3
- v -
LIST OF FIGURES
Title Page
Beam Dimensions 27
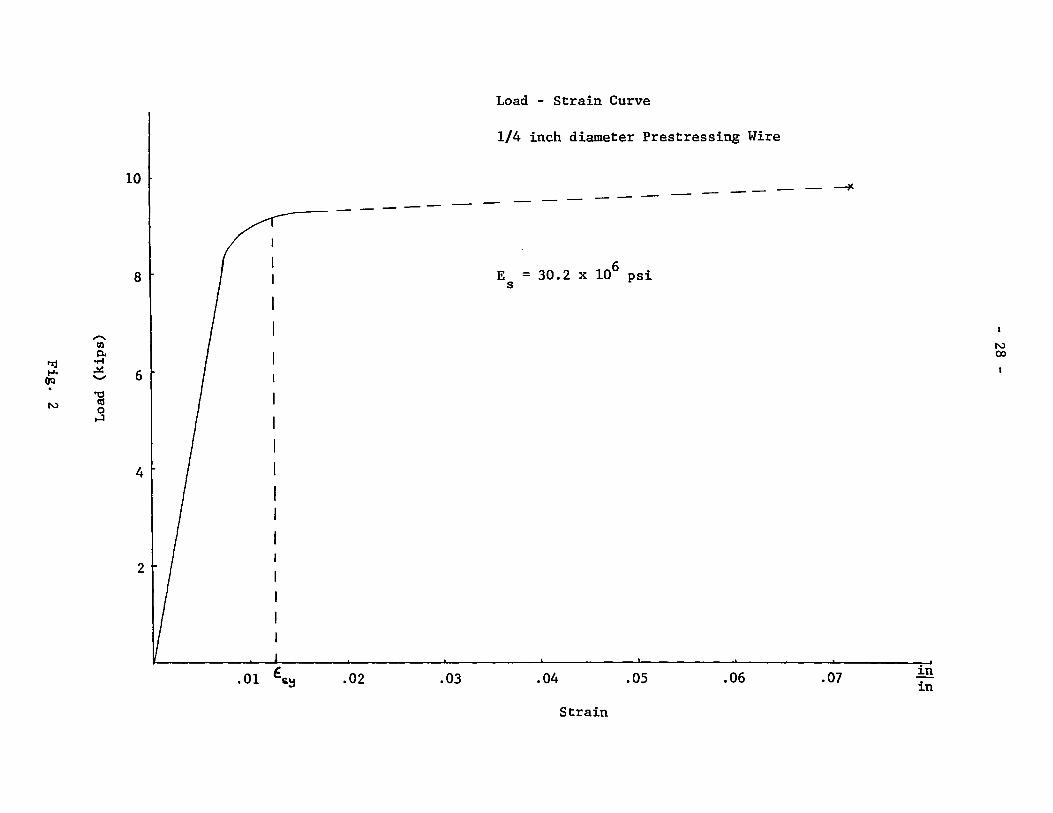
Load-Strain Curve of Steel 28
Schematic Representation of Instrumentation 29
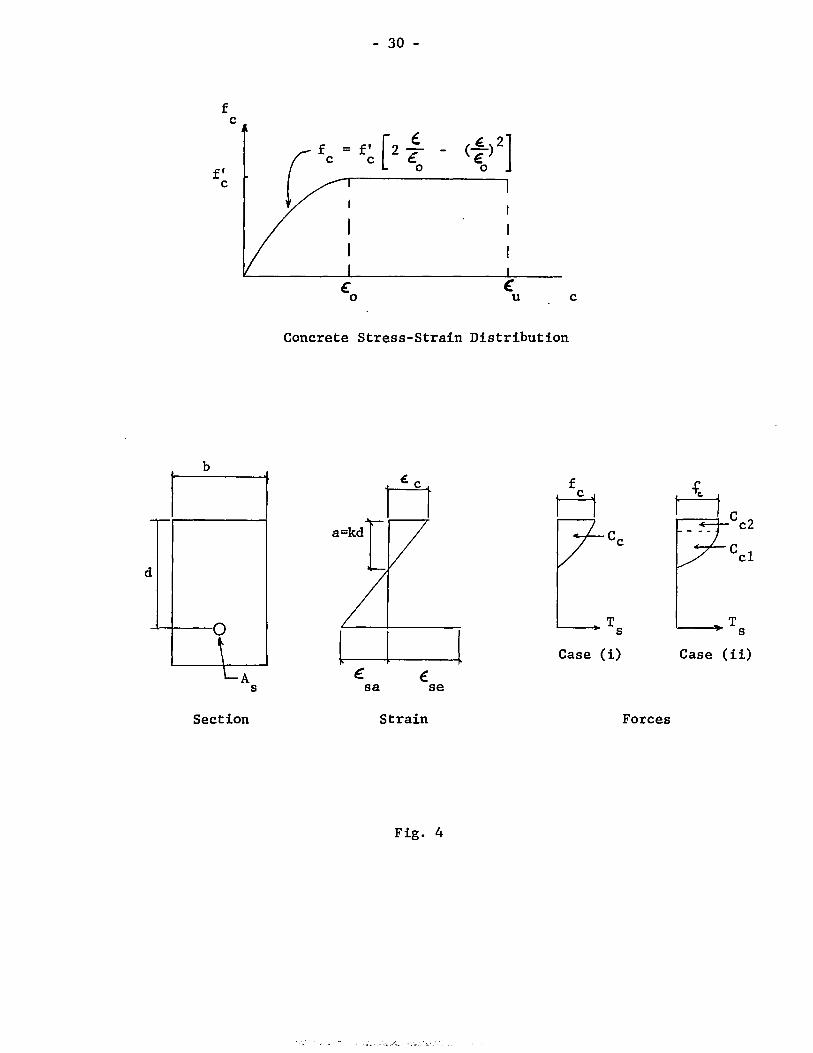
Concrete Stress-Strain Distribution 30
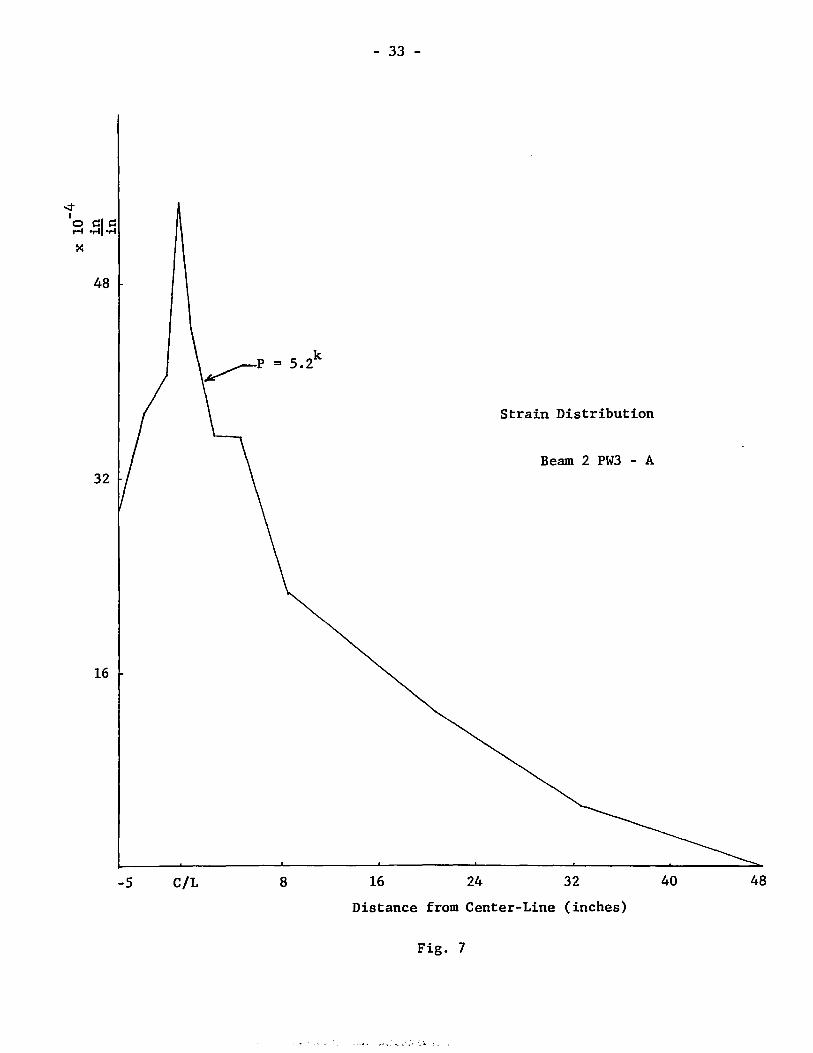
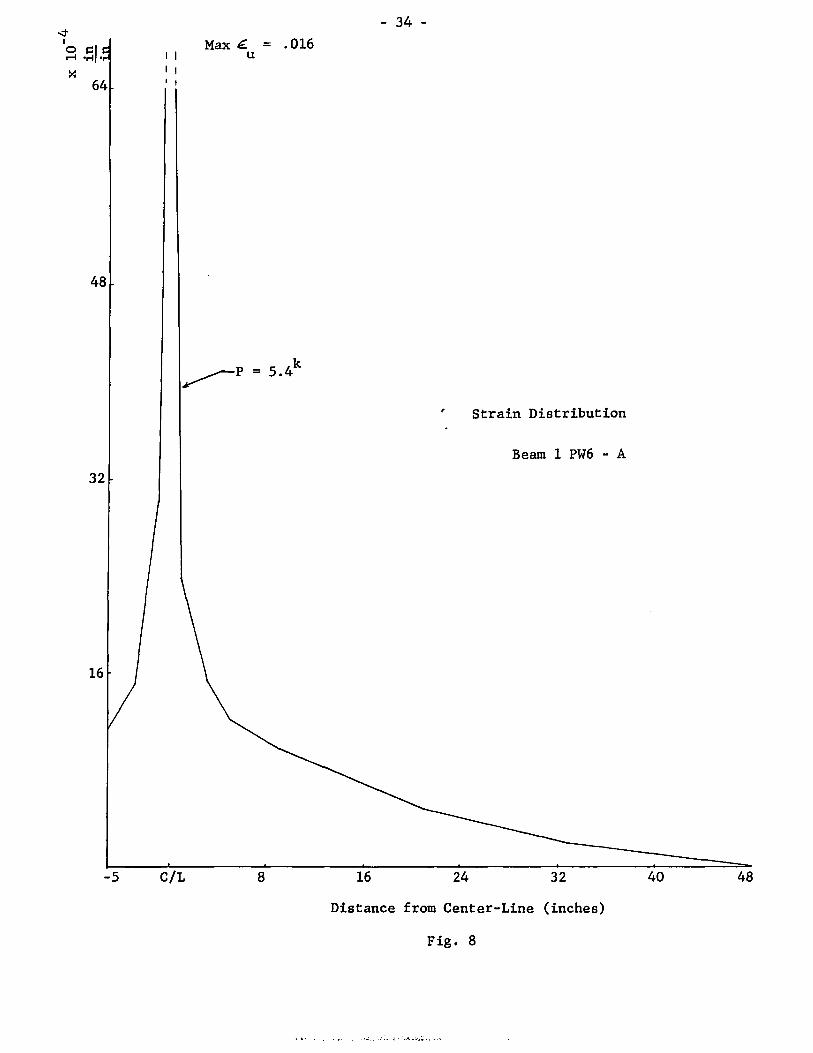
Strain Distribution 31
Histogram of Ultimate Strain Values in Hinge Length 40
Curvature Distribution 41
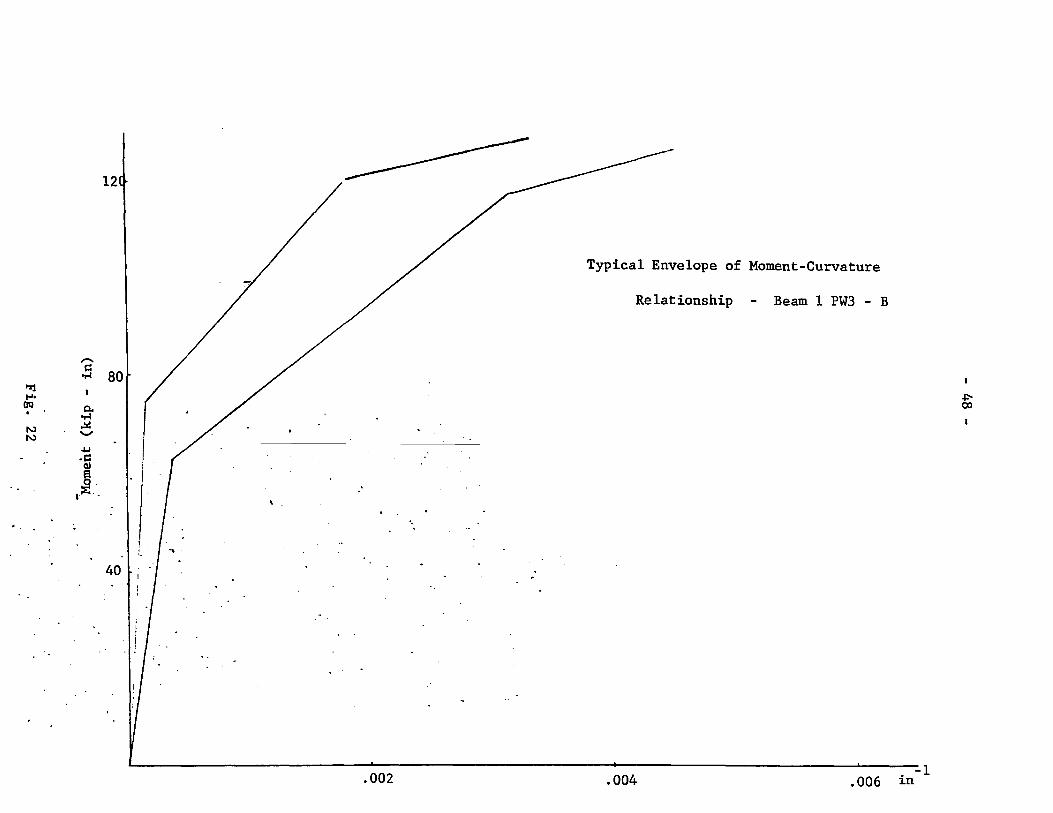
Typical Envelope of Moment-Curvature Relationship 48
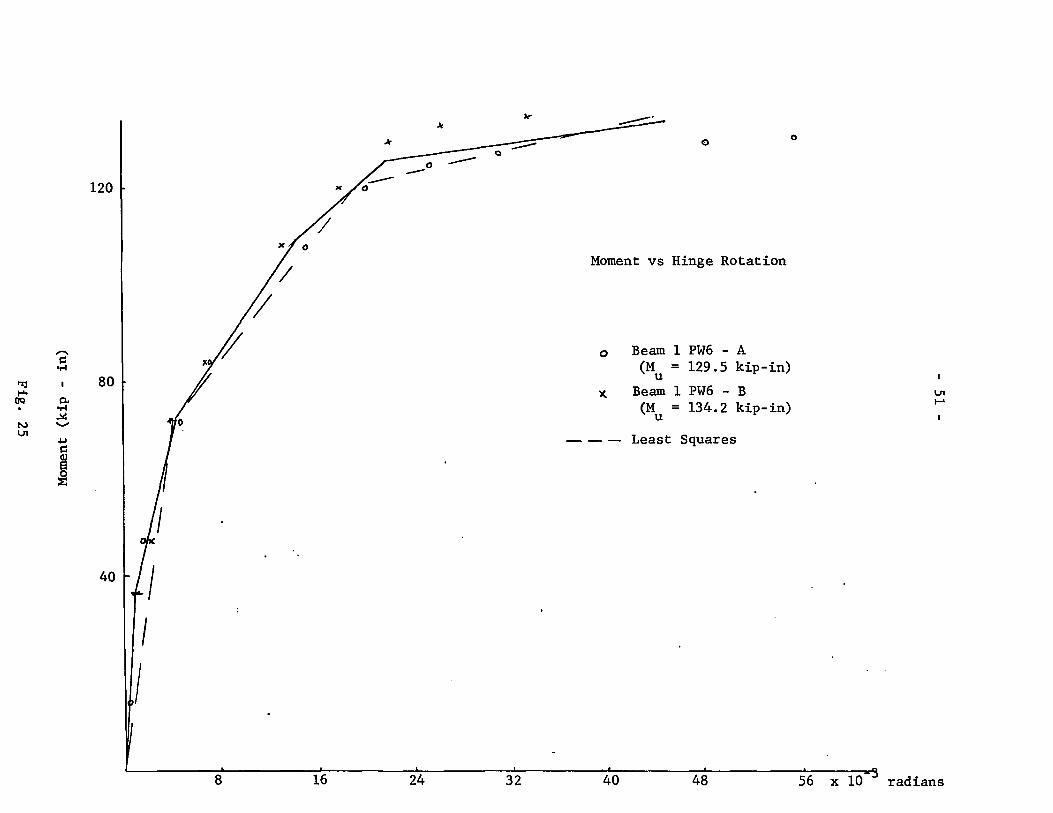
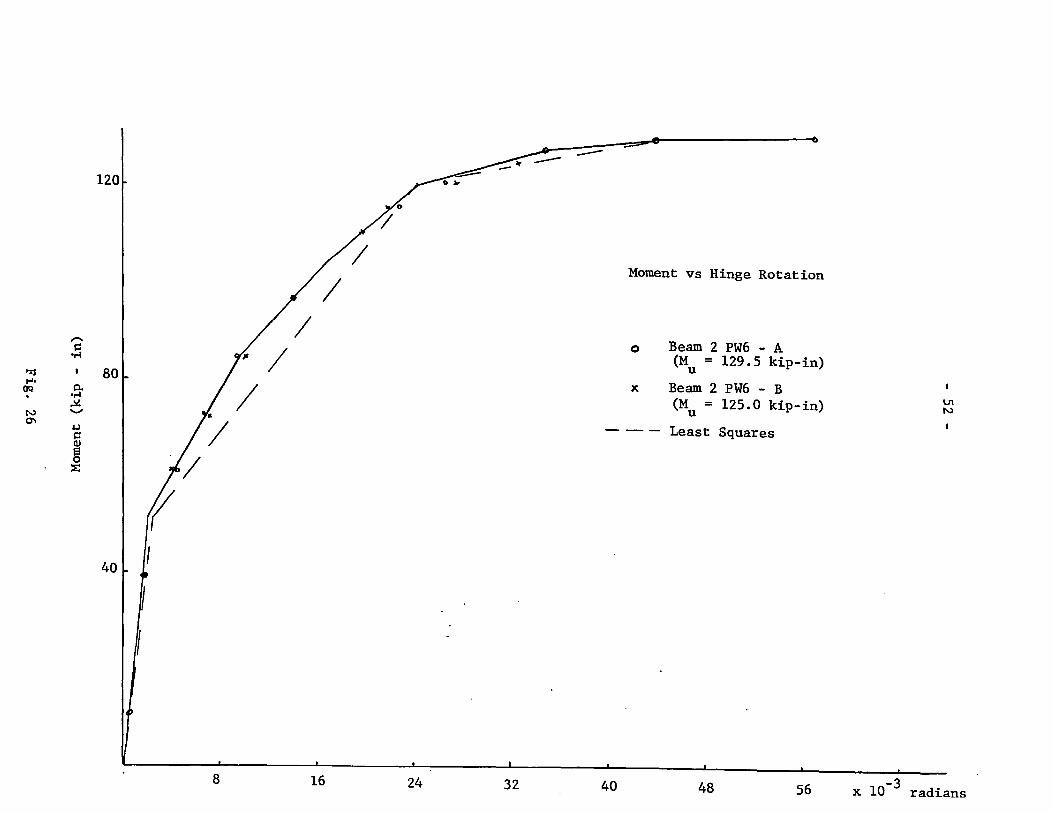
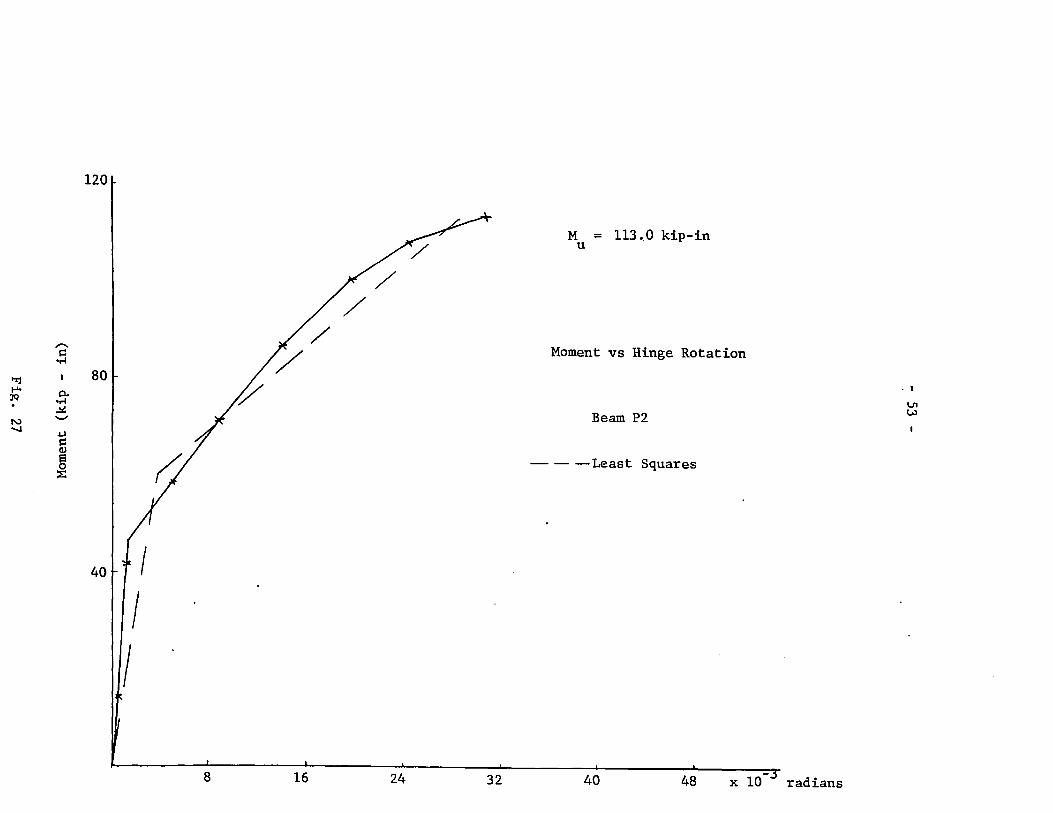
Moment vs Hinge Rotation 49
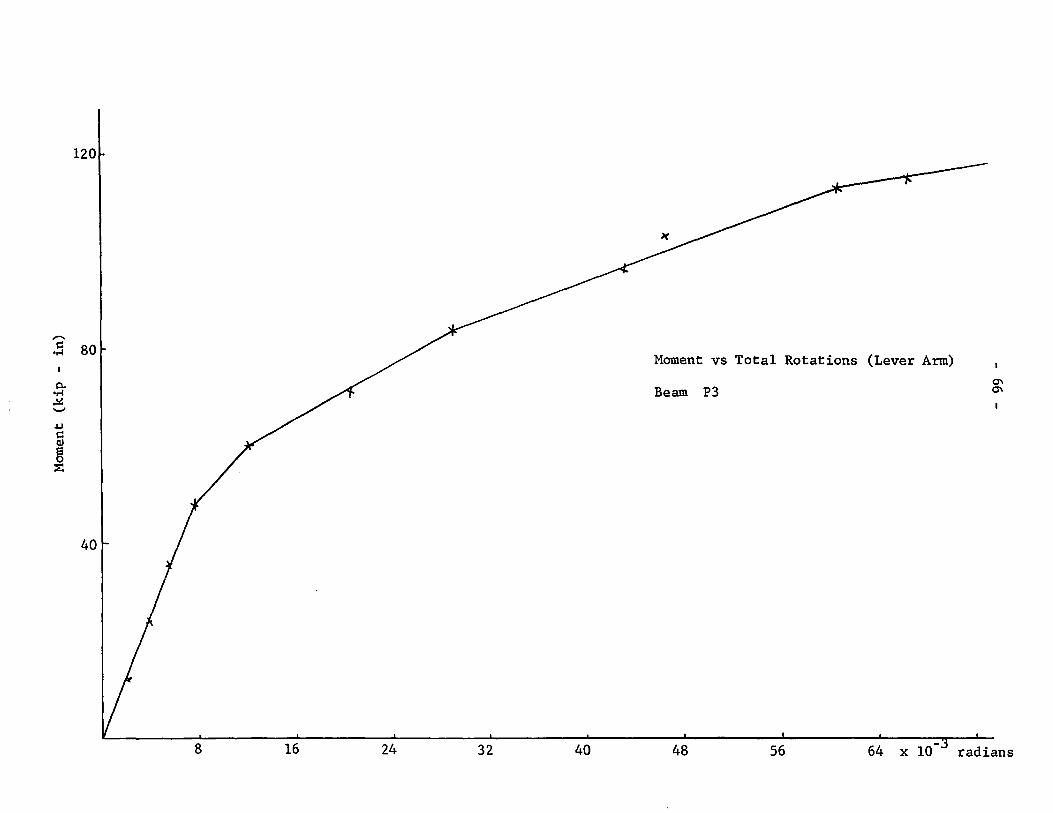
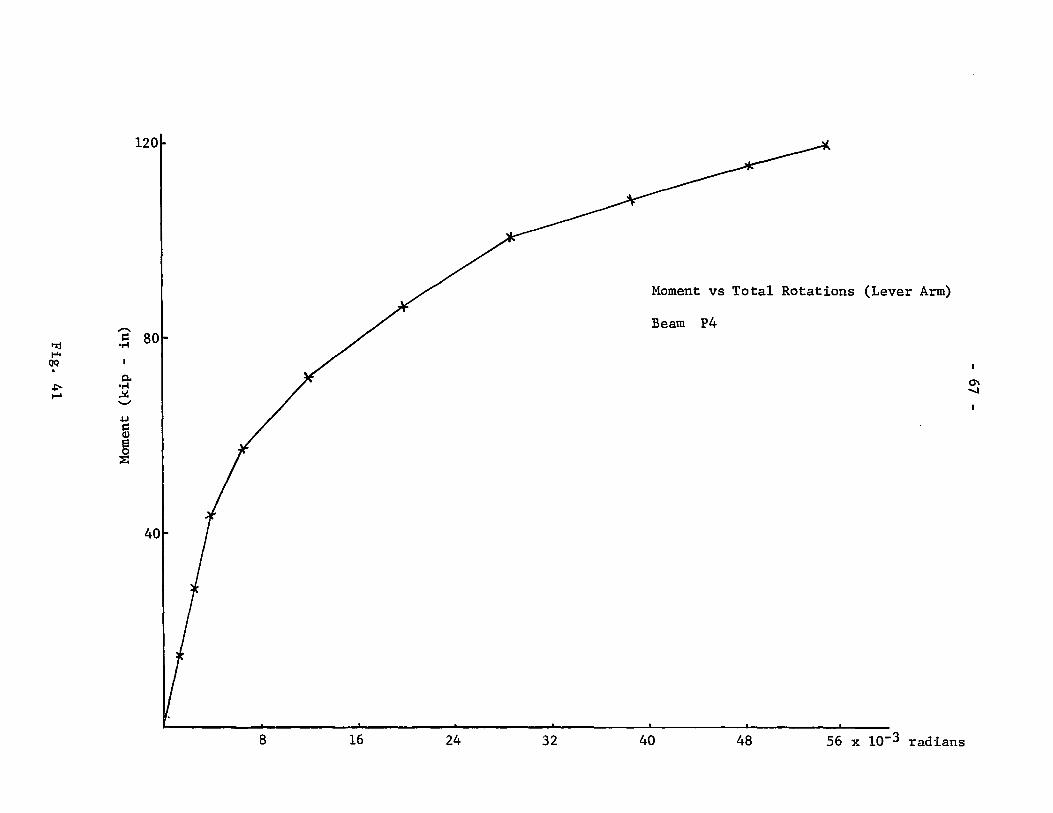
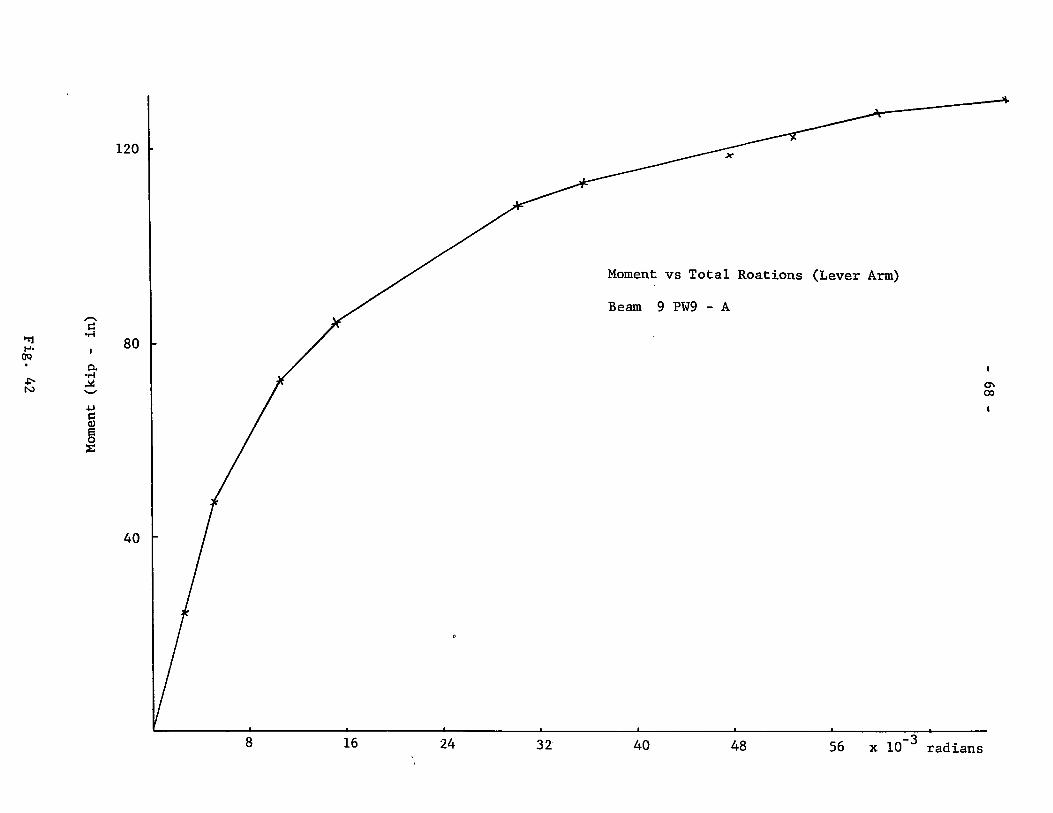
Moment vs Total Rotations (Lever Arm) 62
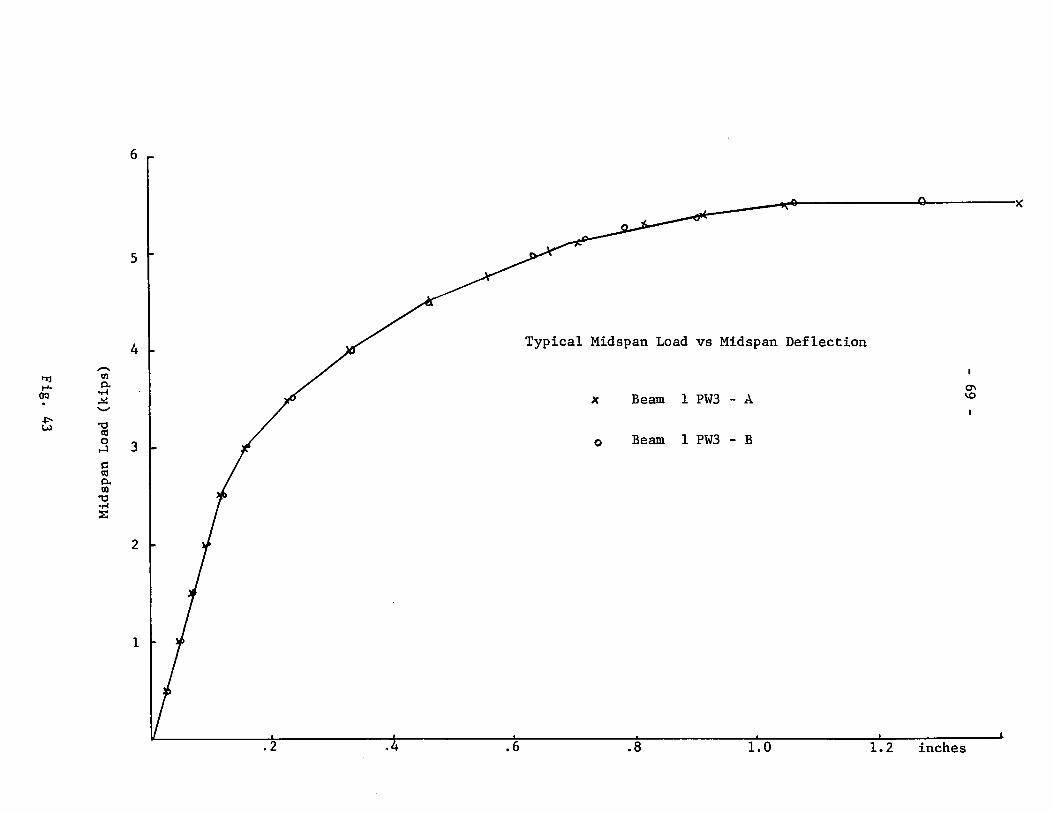
Typical Midspan Load vs Midspan Deflection 69
Moment vs Hinge Rotation/Effect of Web Reinforcement 70
Moment vs Hinge Rotation/Effect of Prestressing Force 72
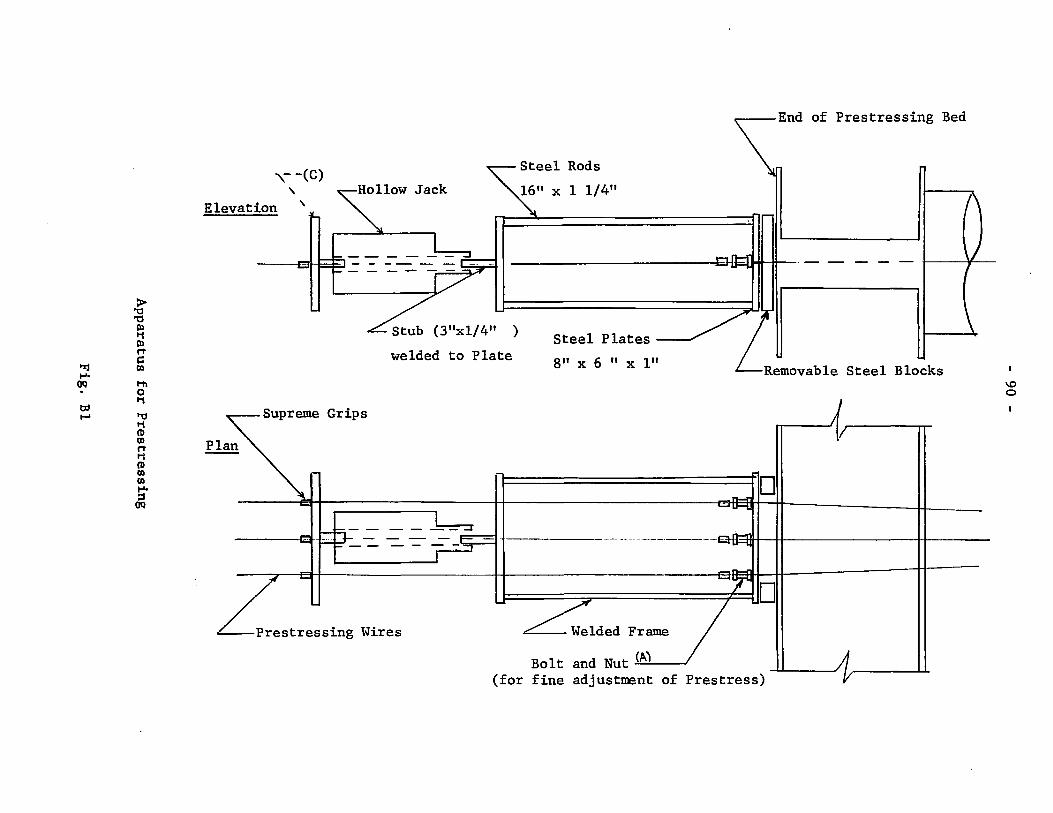
Apparatus for Prestressing 90
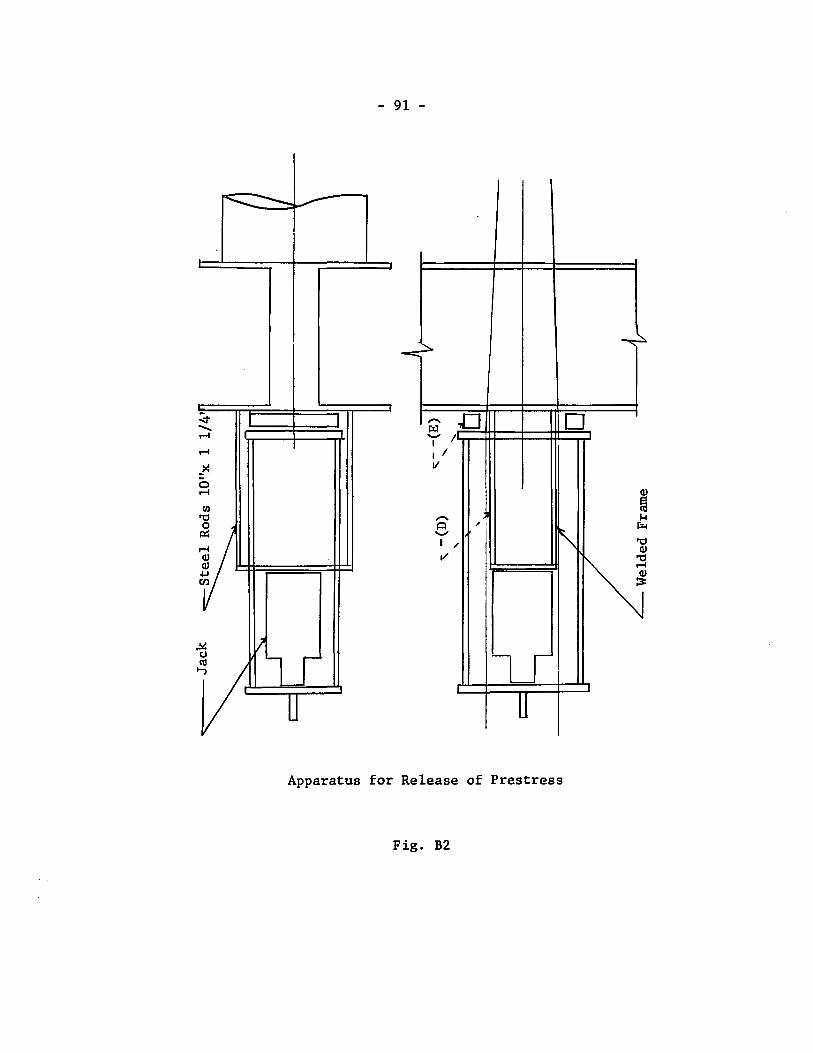
Apparatus for Release of Prestress 91
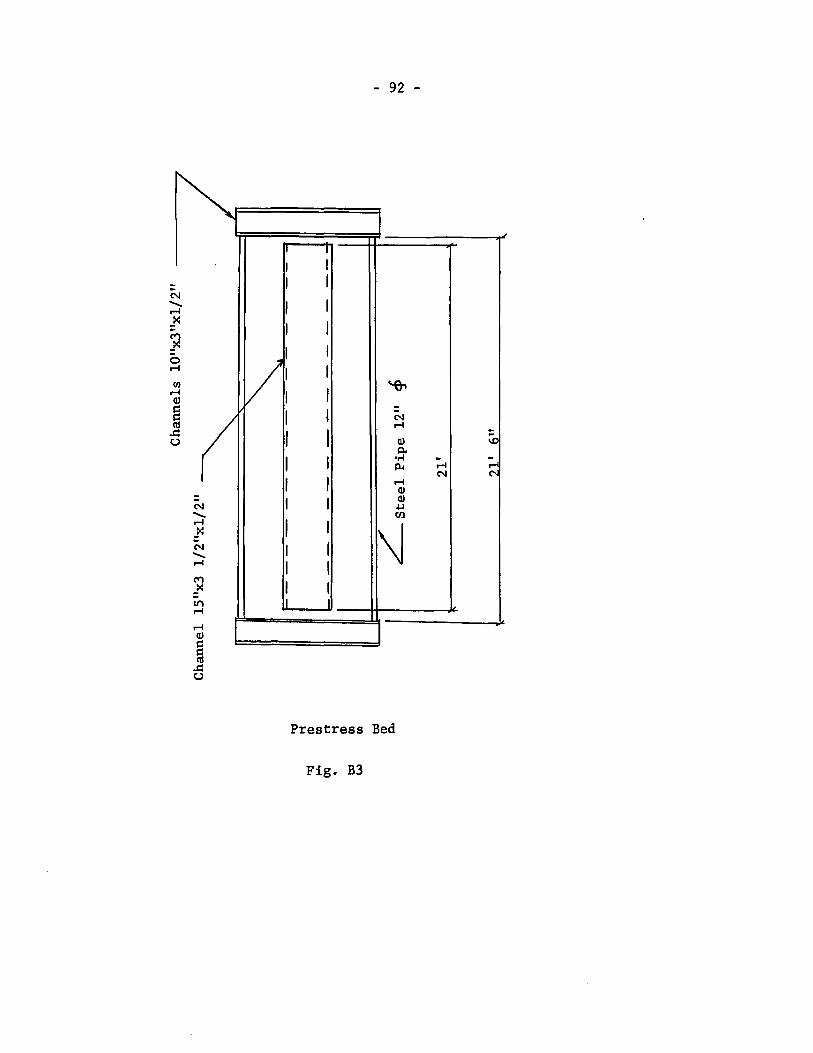
Prestress Bed 92
Table
1
2
3
4
5
6
7
No.
- vi -
LIST OF TABLES
Tit1e
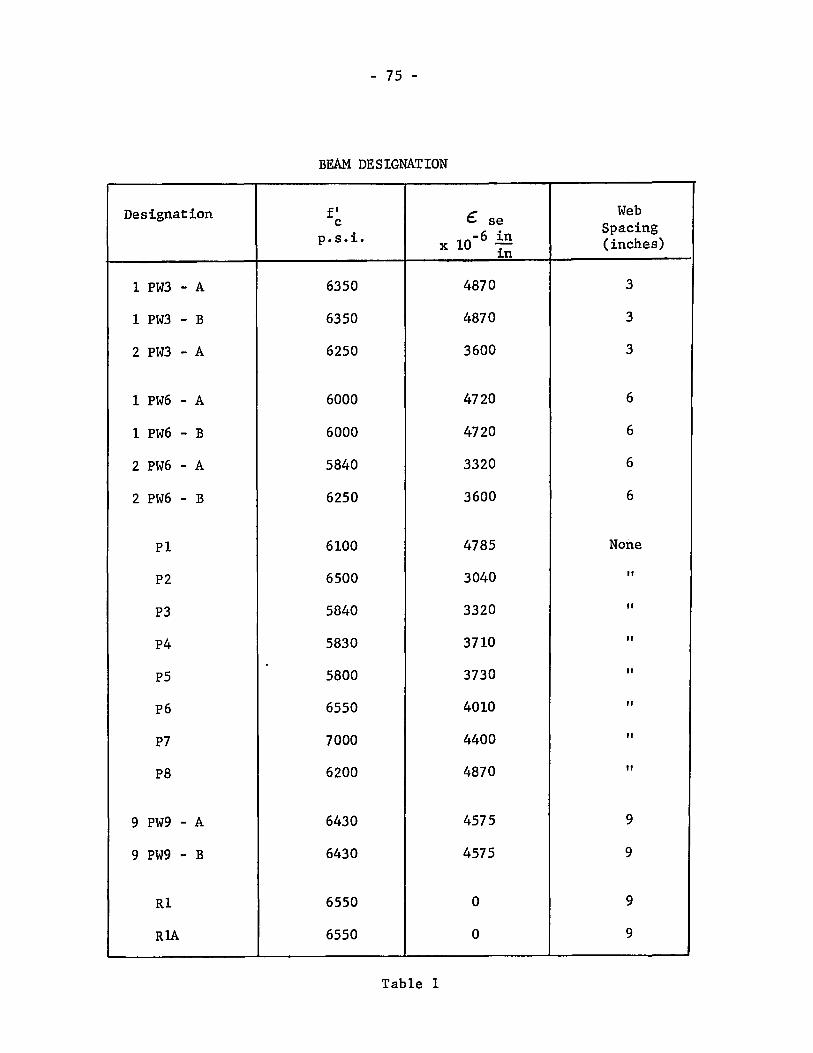
Beam Designation
Theoretica1 Moment-Curvature
Theoretica1 Ana1ysis of Hinge Rotation
U1ttmate Strains, Curvatures, Def1ections
Experimental Rotations at U1timate
Effect of Web Reinforcing on Rotations
Effect of Prestressing Force on Rotations
Page
75
76
77
78
79
80
81
1.1 Object and Scope
- 1 -
CHAPTER l
INTRODUCTION
A logical and realistic method of design and analysis applicable to rein
forced or prestressed concrete structures must be based on the actual conditions
which exist on the structure when that structure is said to have failed. The
criteria for failure must be clearly defined and the prescribed limits must not
. be exceeded under the worst condition of loading.
Limit Design or Ultimate Load theories recognize the inelastic behaviour
of concrete and steel. However, one of the aspects of structural behaviour in
which there is very limited information is that of the plastic behaviour of con
crete structures. Of fundamental interest to any inelastic theory is the rota
tion capability of concrete hinges in complex indeterminate structures.
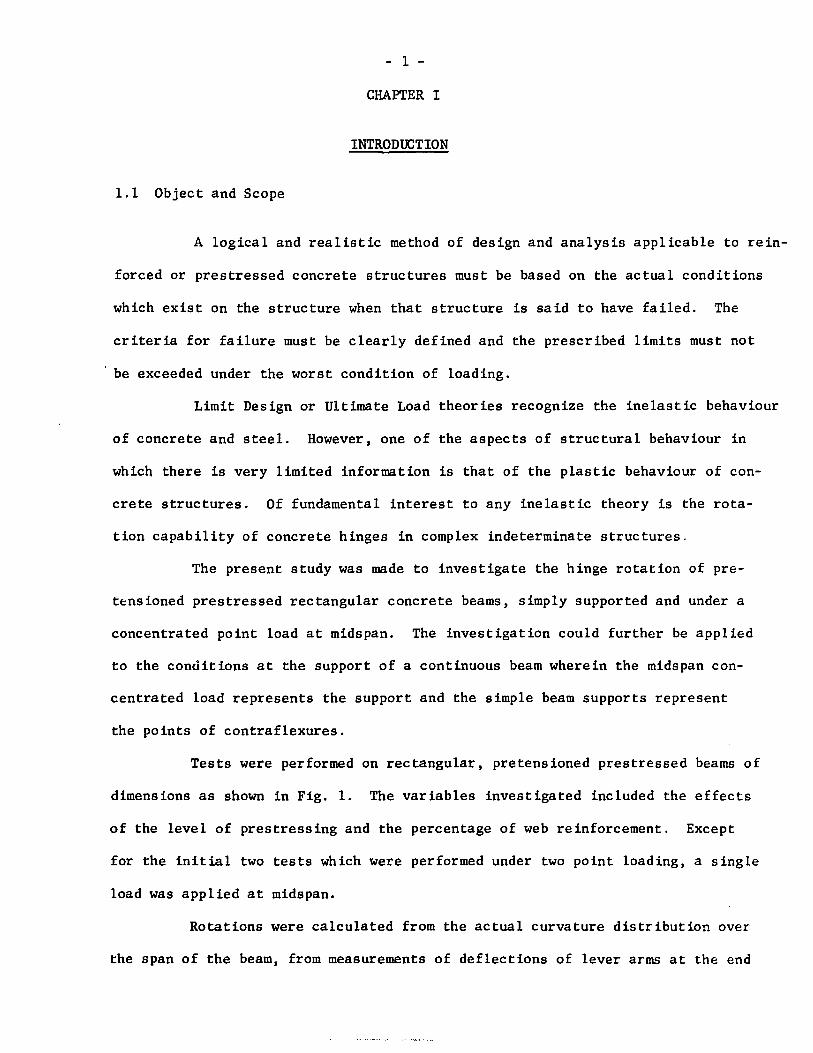
The present study was made to investigate the hinge rotation of pre
t~nsioned prestressed rectangular concrete beams, simply supported and under a
concentrated point load at midspan. The investigation could further be applied
to the conditions at the support of a continuous beam wherein the midspan con
centrated load represents the support and the simple beam supports represent
the points of contraflexures.
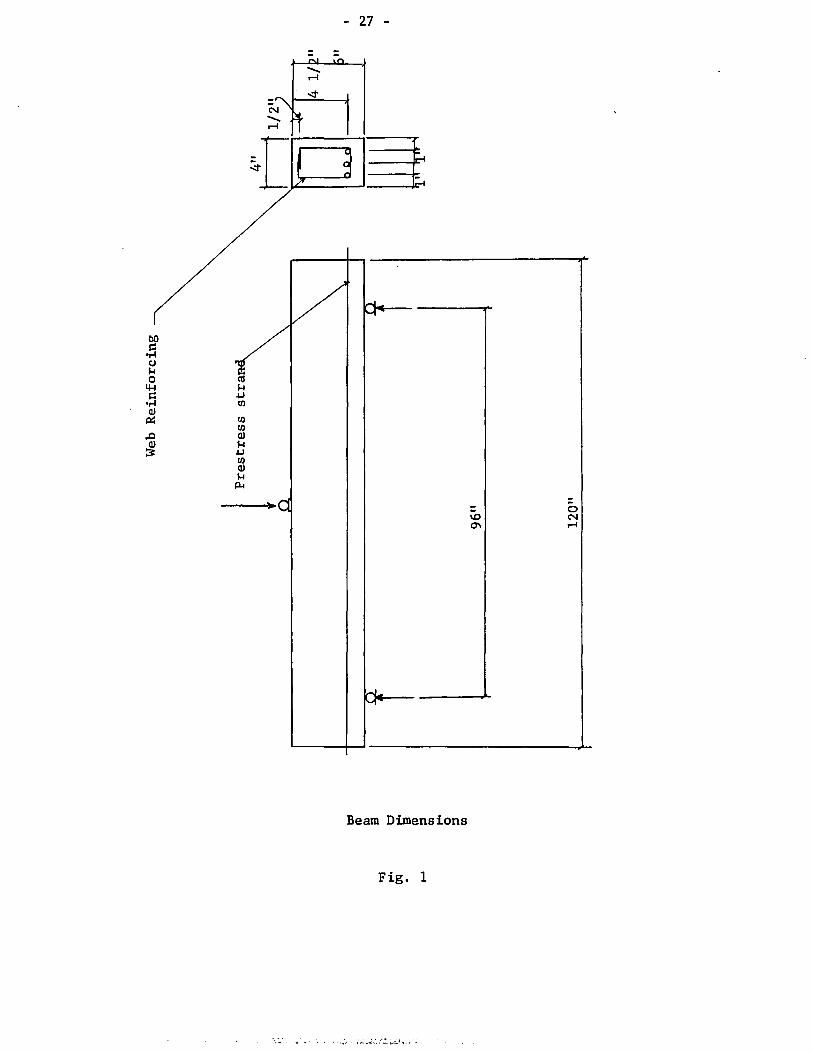
Tests were performed on rectangular, pretensioned prestressed beams of
dimensions as shown in Fig. 1. The variables investigated included the effects
of the level of prestressing and the percentage of web reinforcement. Except
for the initial two tests which were performed under two point loading, a single
load was applied at midspan.
Rotations were calculated from the actual curvature distribution over
the span of the beam, from measurements of deflections of lever arms at the end

- 2 -
supports and from the load-deflection curve at midspan.
A conventional theoretical analysis to de termine the Moment-Curvature
relationship of a section of the beam using equilibrium of forces, compatibility
of deformations and the physical properties of the beam section is presented.
Various assumptions were made, the most important being the stress-distribu-
tian in the compression zone and the value of the ultimate strain in concrete.
1.2 Nature of the problem
13 14 24 30 Recent developments in limit design theories ' , , or inelastic
theories of indeterminate concrete structures, in which redistribution of inter-
nal moments and forces at various cross-sections are recognized, have indicated
the necessity for obtaining realistic Moment-Rotation relationships for a given
section. The need for simplified Moment-Curvature or Moment-Rotation relation··
ships is evident. The danger of theorists indulging in complicated mathematical
theories for complex structures based on the simple plastic theory, without
experimental evidence of the limitations of reinforced or prestressed concrete
structures, is real.
Definitions and assumptions are required to develop a practical design
theory. The designer must however be constantly aware of the many inaccuracies
and limitations inherent in the analysis and must intuitively keep in clear
perspective the actual behaviour of the real structure in its entirety.
Keeping this in mind, a review of the most frequently used definitions
relevant to ultimate load analyses for concrete structures will he given.
Plastic Hinge is a section in a structural member at which the inelas··
tic rotations are assumed to be concentrated.
Hinge Rotation is the total change of slope at a hinge or critical
section due to inelastic or plastic behaviour •
. ' "' ... ,
- 3 -
Equivalent plastic length is an assumed length of the member, over
which the curvature is assumed to be constant, such that the calculated rota
tion at the hinge equals the actual rotation at the hinge.
A structural member behaves elastically according to the initial
linear relationship of the curve. The remaining contribution is due to
plastic action.
- 4 -
CHAPTER II
S URVEY OF LITERATURE
There is ample evidence IO ,12,20,2l to show that for under-reinforced
concrete indeterminate structures, sufficient plastic curvature is developed
to produce substantial redistribution of moments at ultimate load.
Limit Design theories 13 ,14,24 have been proposed which predict in-
elastic hinge rotations necessary to develop full redistribution of moments.
14 32 33 The work undertaken by Professor A.L.L. Baker ' , at Imperial
College is of conside~able significance to the development of limit design
theories. Baker reported a simplified method of calculating rotations using
safe limit design values. These limiting values were based on experiments on
statically de termina te members and were found to be very conservative.
10 12 13 25 1 28 2 37 Chan , Ernst ' , , Mattock' , Corley , Obeid have made con-
siderable contributions to the limited experimental knowledge of rotation capa-
cities of reinforced concrete sections.
Chan has developed an expression for the rotation capacity using
flexural rigidities and a curvature distribution factor. Ernst has adopted
revised moment-area theorems for computations of elastic slopes and deflections
that occur during the yielding of the plastic hinge. Mattock, Corley developed
expressions using an average curvature measured over the hinge length.
Attempts to evaluate magnitudes of hinge rotations have in Many cases
led to proposed determinations of the MOst fundamental relationship, the Moment-
Curvature diagram.
16 38 Unfortunately, experimental results ' do not confirm the existence
of a moment-curvature relationship for a given beam cross-section. It is vir-
tually impossible to predict accurately the value of the curvature at or very
- 5 -
near the critical section after the reinforcing steel has yielded.
A more realistic representation of the behaviour for a length of the
beam under consideration would be the moment-average curvature relationship
over the particular length.
The load and loading distribution, the rate of loading, the stress-
strain relationships of concrete and steel, the variation in the structural
system, i.e. relative stiffnesses, local behaviour e.g. bond slip and cracking,
the span to depth ratio all have an appreciable effect on the rotation capa-
bility of the hinging regions.
18 26 Roy and Sozen ,Nawy in their experiments to determine the effects
of rectangular ties and rectangular spirals have shown that the ductility of
concrete governs the rotation capacity of the section. 21 .
Macchi has observed that the rotation capability is limited if the
percentage of reinforcing increases, or if axial load is acting at the same
time as bending. Obeid37 has also confirmed the effect of axial load on limit-·
int the rotation capacity of the section.
- 6 -
CHAPTER III
TEST PROCEDURES AND INSTRUMENTATION
The rectangular beam section with an effective depth of 4.5 inches
is shown in Fig. 1. The strength of concrete was determined from axially
loaded compression tests on standard 12" x 6" diameter concrete cylinders. The
concrete strength was not a parame ter to be studiéd. Because of the difficulty
of measuring the average water content of the sand used in the concrete batch,
the strength of concrete displayed some scatter.
Stress-relieved high strength 1/4" diameter 7-wires prestress ing
strands manufactured by Stelco Company were used as the prestressing reinforc
ing. The stress-strain curve is shown in Fig. 2.
Deformed bars designated D-2 (area = .02 in2) with a yield stress of
80 ksi was used as web reinforcing. The dimensions are shown in Fig. 1.
The load was applied by a 400 ton capacity Baldwin-Lima hydraulic
testing machine. This load was applied through a steel roller 4 inches long and
1 3/4 inches in diameter. The roller was welded to a plate 4" x 2 1/4" x 1/2"
thick. A small groove was cut from the bot tom of the plate so that the con
crete strain gages in the vicinity of the midspan would be operat.ive.
3.1 Strain Measurements on Prestressing Strands
Polyester gauges, PS-20, manufactured hy Tokyo Sokki Kenkyujo Co.,
Ltd., were applied on the prestressing wires. Eastman 910 adhesive cement
was used. GW-5 waterproofing manufactured by Automation Industries Inc. was
applied after the lead wires were connected.
The gauges were located at the midspan of the beam to measure the pre
stressing force (by using the stress-strain curve of the steel). An electrical
SR-4 strain indicator box was used for measuring strains before the test and a
- 7 -
Budd automatic strain indicator was used during the test.
3.2 Strain Gauges on Concrete
Polyester gauges, PL-2~ were applied on the concrete surface at the
top of the beam along the longitudinal center-line and ahalf inch from the
top along one side of the beam, Fig. 3. The gauges on the concrete gave the
strain and curvature distributions along the span of the beam at any parti
cular loading stage.
3.3 Lever Arms at End Supports
Two small angles 3" x 1 1/2" x 1 1/2" were cemented at the mid-height
of the beam at the end-supports. At the time of test, rigid steel bars were
clamped to the angles in a horizontal position. Direct Voltage Differential
Transducers (DVDT) were placed over the bars at a distance of 20 inches from
the end-support. Continuous deflections measured at these points, by means
of a Sanborn automatic recorder, gave values for the end-rotations at any
particular load.
3.4 Deflections at Midspan
A small angle was also cemented at the midspan and another DVDT was
placed at this point. Continuous deflections were recorded to ultimate.

- 8 -
CHAPTER IV
EXPERIMENTAL RESULTS AND ANALYSIS
1 10 16 In experimenta1 programs' , concerned with the measurement of
hinge rotations, the most frequent method of ca1cu1ation is based on the
integration of the curvature distribution. 16 26 38 The use of c1inometers ' ,
4 16 38 to measure rotation direct1y and the use of def1ection gauges' , to in-
direct1y ca1cu1ate relative rotations are a1so common.
4.1 Curvatures and Curvature Distributions
1 Some investigators who use the curvature distribution method ini-
tia11y assume the 1ength of the hinge and th en proceed to measure the strain,
or more precise1y, the average e10ngation within that predetermined 1ength and
thence ca1cu1ate the hinge rotation. Whereas this is a very convenient method
(and especia11y so in theoretica1 analyses) this procedure does not i11ustrate
the true extent of the p1asticity region.
In this experimenta1 program, curvatures were measured at c10se1y
spaced interva1s near the critica1 section and more wide1y spaced a10ng the
remaining 1ength of the beam.
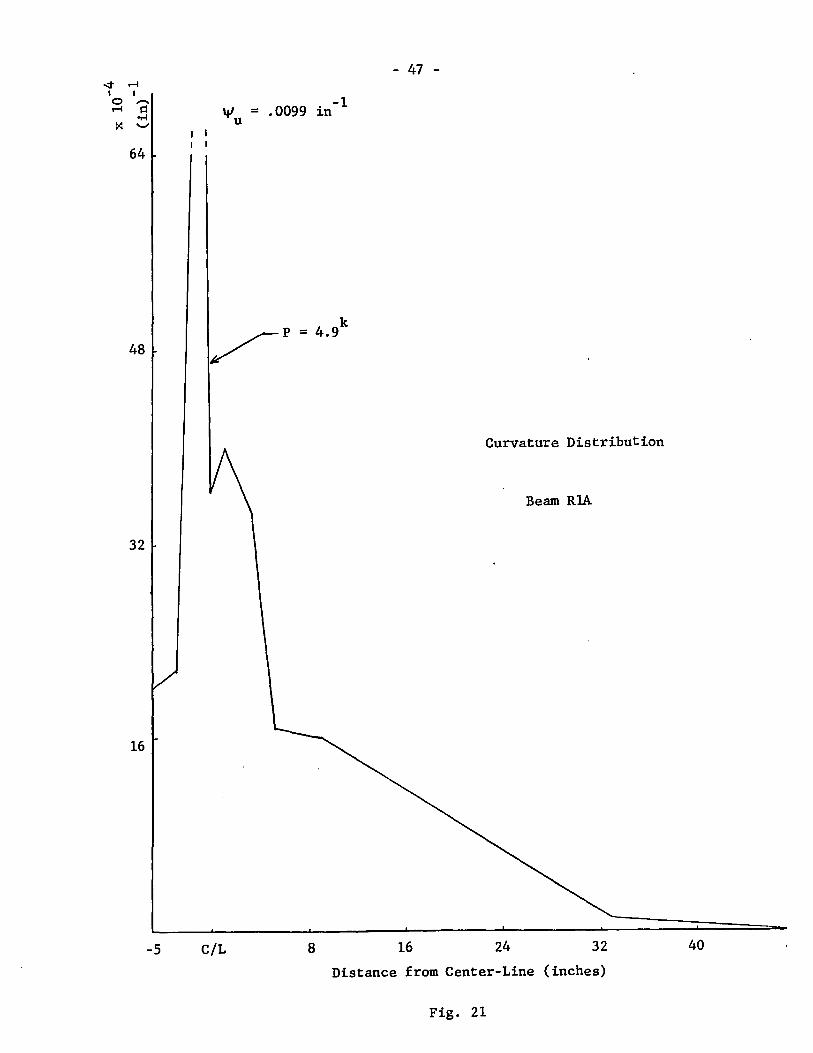
The resu1ts indicate that there is no true symmetry of curvatures at
symmetrica1 sections of the beam (Fig. 15-21). A1so, there is a wide scatter
of Moment-Curvature re1ationships for different sections a10ng the beam (Fig.
22). As a matter of fact, there is great doubt as to whether there is a defin-
able Moment-Curvature re1ationship for a given beam cross-section.
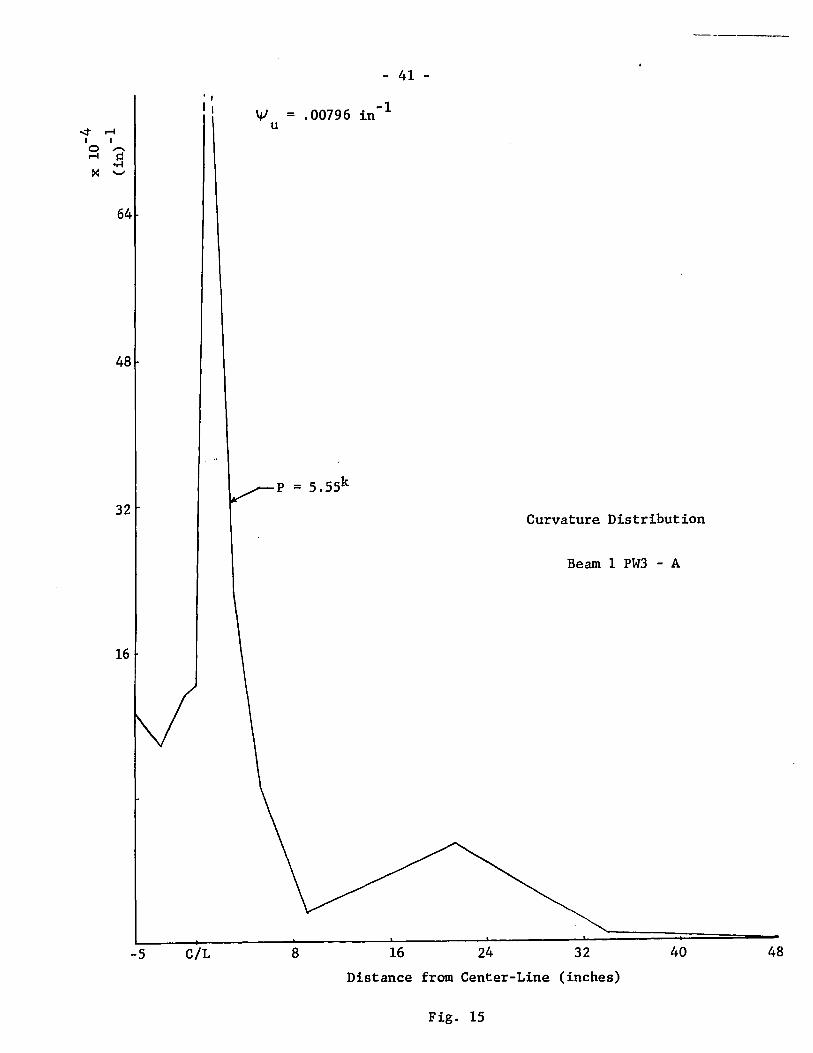
The curvature distributions i11ustrate definite maximum peaks even
at c10se1y spaced sections (Fig. 15-21). This i8 due to the concentrated strain
distribution in the vicinity of widening cracks. In between cracks, the
- 9 -
"
curvature is less. For load stages approaching the ultimate, the magnification
of the 'peak' curvatures are more pronounced in the vicinity of the critical
section (Fig. 15-21). In regions outside of the critical sections, the peaks
are not as pronounced. Here, there is a semblance of the curvature distribu-
tion 'following' the shape of the moment diagram, especially at the lower loads.
The values of the ultimate curvatures measured display a great scatter
(Table 4). These values were mainly dependent on the time at which the last
reading at the section with the greatest curvature was taken. The automatic
recorder for the Budd indicator was available only for half of the tests per-
formed and the other results had to be taken manually.
Experimental results in the later experiments however indicate maxi
-1 mum curvature readings in the range of .006 to .008 in with an exceptionally
-1 high value of .026 in in beam lPW6-A. An analysis of the sections at which
it was still possible to measure curvature readings after considerable yield-
ing shows that the maximum curvature rose sharply at the most critical section
and decreased or remained constant at immediate neighbouring sections. This
demonstrates the hinge mechanism in concrete elements and supports partially,
theoretical assumptions of hinges assumed to be located at the critical sec-
tion at ultimate.
4.2 Strain Distributions
The strain distributions on the outermost fiber in compression are
illustrated in Fig. 5 to Fig. 13. Strain concentrations observed in the vicinity
of cracks result in peaks in the strain distributions. Outside of the critical
region the strain distribution closely followed the shape of the Bending Moment
diagram.

- 10 -
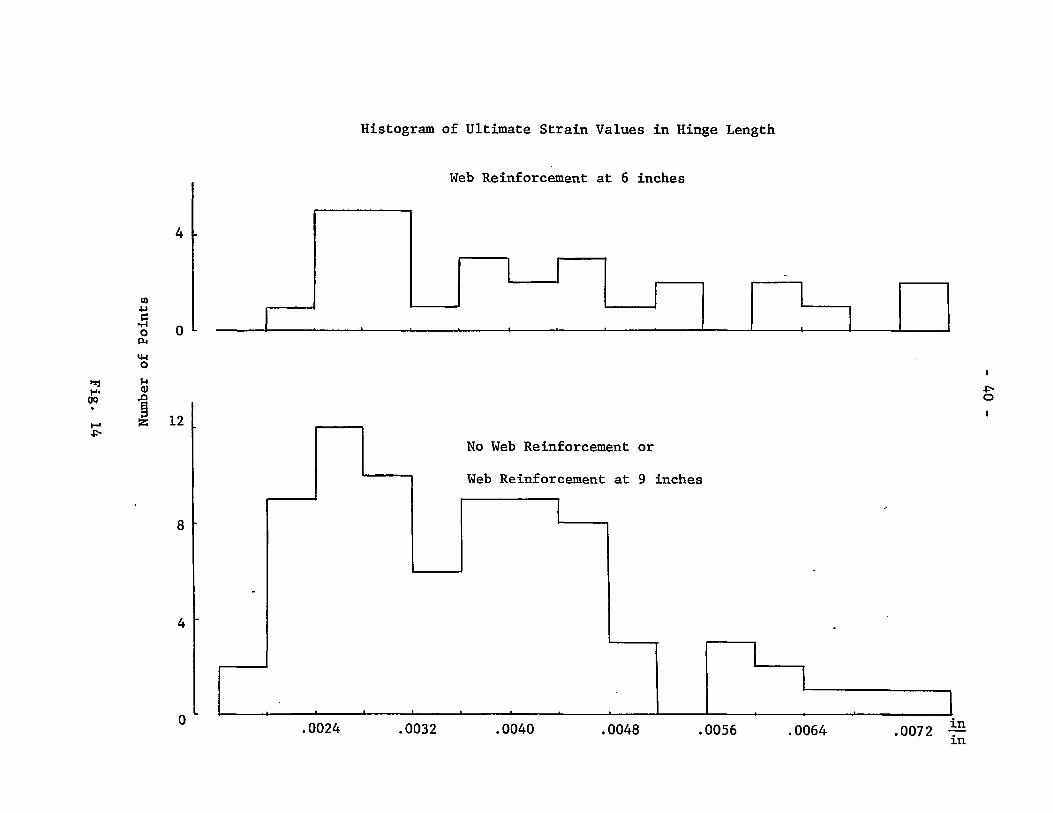
The ultimate strains measured display a wide scatter. Eighty-five
percent of absolute ultimate concrete strains measured within the hinge
length varied from .002 to .0052. A histogram of the ultimate strains mea
sured in the critical hinging region is shown in Fig. 14. Since most of the
rotation is assumed to occur within this region, it is felt that the value
of the ultimate strain to be used in a theoretical analysis must lie within
the range indicated in the histogram. More results of this nature are re
quired to evaluate statistically the much sought after "true" value of ulti
mate or limiting strain in flexure of concrete to be used for rotation cal
culations.
4.3 Rotations
Measurements for rotations were calculated directly by integrating
under the curvature distribution along the span. MOment·Rotation curves for
the beams tested are shown in Fig. 23 to Fig. 35. The rotations indicate
total rotation for the hinging length.
In inelastic theory analyses, the plastic rotation capability of
hinging regions is of prime importance. The moment-rotation curves enable
the designer to de termine the moment distribution at any section. From the
moment-rotation curves as shown, the elastic contribution of rotation must
be subtracted.
A real problem is to de termine the contribution due to elastic action
and that due to plastic action in reinforced or prestressed concrete elements.
In other words, how much of the rotation is available for redistribution of
moments?
In prestressed concrete, there are 3 distinct stages of the Moment
Rotation characteristic. The first stage relates to the stage before cracking.
- Il -
It can safely be assumed that this stage is elastic. The second stage relates
to the region after cracking has taken place to the time of yield (normally
defined as when yielding of steel has begun); and the third stage shows the
portion of the curve between yielding of the steel and the ultimate moment.
For convenience of calculations and analyses, it is normal1y assumed
that the first linear stage can be extended and the value of the e1astic
rotation at any particular moment can be determined. The remainder of the
rotation is then assumed to be plastic. Imp1icit in this calculation is the
assumption that plasticity of concrete occurs as soon as cracking begins.
True plasticity in concrete occurs only to a limited degree. The extent of
the deformations is due to the opening of cracks. It must be kept in mind
that the value of rotation calculated as above is a maximum value.
4.4 Hinge Rotation measured from Curvature Distribution
The hinge 1ength is vaguely defined as the length in which a large
portion of the inelastic rotation is concentrated. An examination of the
strain and curvature distributions indicate that within a length of five
inches (l.ld) on either side of the midspan, the strains and curvatures re
corded were distinctly magnified as compared to the readings outside of this
region. The magnitudes of the concrete strains on the surface of the beam
in this hinging region were in the inelastic range.
From the curvature distribution, it was evident that there were
portions outside of the hinging region which were not elastic. However, for
the purposes of calculations in inelastic analyses it was felt that the plastic
hinge rotation was more realistical1y estimated by measuring the rotations con
tributed from the ten inch hinge length.

- 12 -
Graphs of moment versus total rotation over the hinge 1ength are
shown in Fig. 23 to Fig. 35. The e1astic contribution was determined by
extending the initia11y 1inear portion of the graphe The plastic rotation
avai1ab1e in the hinge is the difference between the total rotation and the
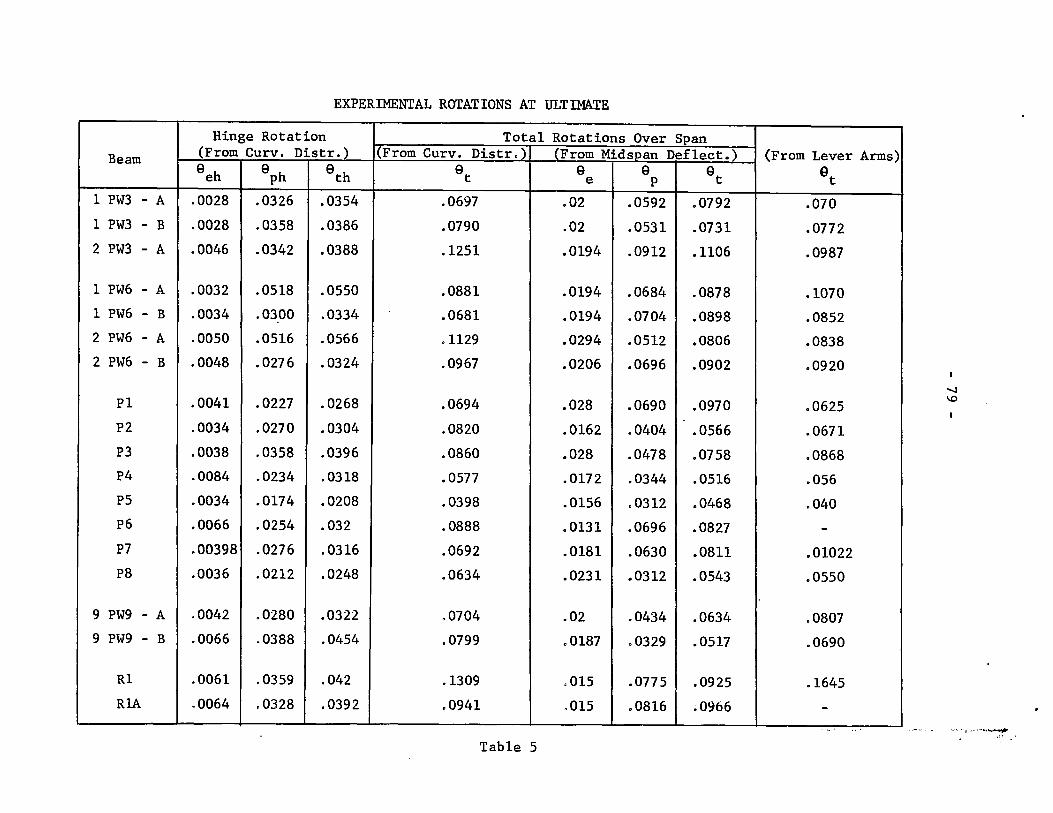
e1astic rotation. These values at u1timate are shown in Table 5.
4.5 Average Curvature over the hinge length
The average curvature over the hinge length is defined as that cur-
vature which is assumed to be constant over the hinging region and which will
produce the required rotation over the hinge length. The average constant
curvature value is a convenient value to be used in ca1cu1ations but is not
rea1istic even in constant moment regions. Average curvature values at the
u1timate are shown in Table 4.
4.6 Rotation measured from Midspan Def1ections
The deflection at midspan is assumed to comprise of an elastic de-
f1ection together with a plastic deflection. The elastic deflection is that
represented by the continuation of the initial linear uncracked re1ationship.
The plastic deflection is the difference of the total def1ections and the ela-
stic deflection.
-lle. The plastic rotation, 9 is equal to 2 tan • The elastic p z
contribution to rotation is determined using the second Moment-Area theolem.
The values of these rotations are shown in Table 5.
4.7 Rotation measured from Lever Arms
The angulat" end rotations are determined by dividing the measured
- 13 -
deflection of the lever by the length of the arm from the support. These
values are shown in Table 5.
4.8 Total Rotation measured from Curvature Distribution
The total rotation over the span of the beam at ultimate obtained
by integrating under the curvature distribution is also shown in "Table 5.
A comparison of the results at ultimate of the total rotations
as obtained [rom the midspan deflections, the curvature distribution and the
lever arms show good agreement considering the difficulties encountered in
measuring deformations at ultimate.
- 14 -
CHAPTER V
THEORETICAL ANALYSIS
The ana1ysis as presented is one which is based on the equi1ibrium
of forces and the compatibi1ity of deformations. The genera1 ana1ysis for
ca1cu1ating the MOment-Curvature re1ationship from the point of cracking to
u1timate is presented. It is assumed that the re1ationship for the uncracked
section is 1inear. An equation for the moment and curvature at cracking is
given.
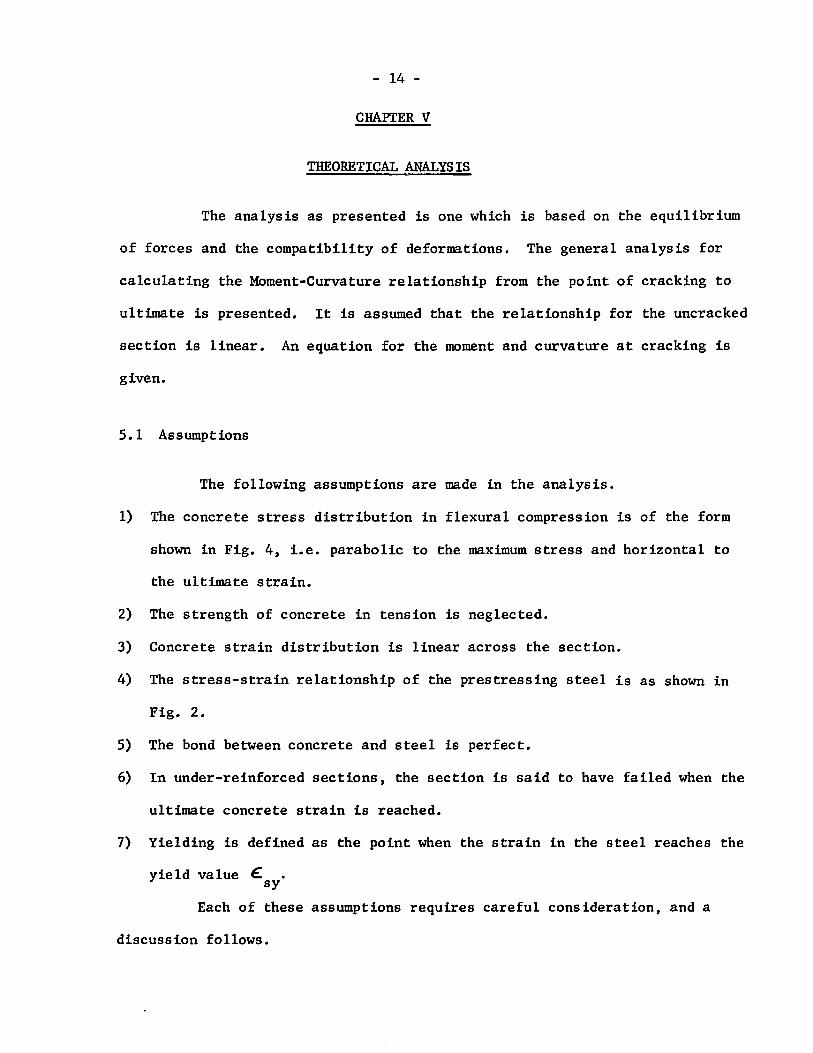
5.1 Assumptions
The fo11owing assumptions are made in the ana1ysis.
1) The concrete stress distribution in flexural compression is of the form
shown in Fig. 4, i.e. parabolic to the maximum stress and horizontal to
the u1timate strain.
2) The strength of concrete in tension is neg1ected.
3) Concrete strain distribution is 1inear across the section.
4) The stress-strain re1ationship of the prestressing steel is as shown in
Fig. 2.
5) The bond between concrete and steel is perfecto
6) In under-reinforced sections, the section is said to have failed when the
ultimate concrete strain is reached.
7) Yie1ding is defined as the point when the strain in the steel reaches the
yie ld va lue E: • sy
Each of these assumptions requires careful consideration, and a
discussion follows.

- 15 -
Assumption 1
27 31 33 The stress distribution in concrete in f1exural compression ' ,
has been the subject of much controversial discussion. Most investigators
have assumed that the stress-strain curve of concrete in uniaxial compression
is a good approximation of the stress distribution in concrete under bending
with or without axial load. The result is that attention has been focussed
15 18 on obtaining the complete stress-strain curve under uniaxial compression ' .
It is now well-established that the form of the stress-strain curve and also
the ultimate strain observed is a function of many parameters. These para-
meters include
i) The type of loading machine used, i.e. whether the loading head is con-
tro1led by deformation or by applied load.
ii) The rate of straining.
iii) The size of the gauge length used.
iv) The manner of measuring strains.
v) The type of specimen used.
vi) The length of time the load is sustained near ultimate.
Beyond the ultimate load, the specimen is generally badly cracked and the re-
sponse to load is highly sensitive to time.
Added to all the above factors involved in determining the stress-
strain curve in uniaxial compression is perhaps the most important considera-
tion which is whether it truly represents the stress response to strain where
the stress is dependent on the space gradient of strain. Also, one must con-
sider whether the state of stress is one of simple bending or whether the
section is in fact subject to a complex distribution of localized stresses.
After taking all the above into consideration, the form of the
stress-strain curve is determined and the value of the absolute ultimate strain

- 16 -
in the concrete must be found. In ine1astic theories where u1timate values
are of major importance, perhaps the most important parame ter which affects
the values obtained in theoretica1 analyses is the value of the u1timate
strain in concrete. 15 18 27 31 Here again many investigators ' , , have attempted
to solve this prob1em. The u1timate strain de pends 1arge1y on whether the
concrete is we11-bounded or not. That is to say, it depends on the degree
of confinement of the concrete. To what extent confinement is obtained will
de pend not on1y on the spacing or volumetrie percentage of the binding rein-
forcement but a1so on the manner in which the binding reinforcement is ap-
p1ied. The effect of rectangu1ar, spiral, vertical, inc1ined binders p1aced
inside or outside of the concrete section will certain1y affect the value
of the u1timate strain in concrete.
On the basis of tests performed by Hognestad on reinforced concrete
members subject to combined bending and axial 10ad, the author has adopted
the form of the Ritter's parabo1a for the stress-strain curve up to the
u1timate strength of concrete as obtained by test cy1inders. The value of
~ = .002 is obtained as the 10wer 1imit of the strains obtained in the exper~ o
mental resu1ts in the hinging region of the beams tested. The equation as
3 derived by Cor1ey was adopted for the u1timate strains.
~ u
b P"f" ) 2 = . 003 + . 02 + (----Y
z 20
The values th us obtained lie within the range of the experimenta1
values obtained during the test.
Assumption 2
A1though the tensi1e strength of concrete i8 approximate1y 10 per-

- 17 -
cent of the compressive strength in uniaxial compression, the effect of in
cluding the tensile strength is negligible near ultimate conditions.
Assumption 3
Results obtained from tests to de termine concrete strains over
the depth of the section show that the strain distribution is linear across
the depth of the compression block and fairly linear across the tensile
region near ultimate. Because the curvature was measured within the compres
sion region, this assumption is valid for the curvature. However, in the
analysis of ultimate moment, a small error may occur depending on the ultimate
strain in the steel. In the analyses performed, this error is negligible
because the stress in the steel at ultimate invariably occurred in the almost
horizontal region of the stress-strain curve for the steel.
Assumption 4
The stress-strain curve of the prestressing strand used was ob
tained using an extensometer with a gauge length of twenty-four inches. The
dotted line represents the region where the extensometer was removed. The
ultimate load and the total elongation was used to define the ultimate co
ordinates.
Assumption 5
For the convenience of analysis, bond between concrete and steel
was assumed perfecto Although perfect bond is impossible to obtain, the bond
obtained as measured from the observations of the crack patterns was suffi
ciently good to justify the assumption.

- 18 -
5.2 General Formu1ae
Forces in Concrete
Case (i) € c ~ ~o
C ab r fI [2 .f. (..f.) 2] d€ =-
c Cc c €. é 0 0
0
ab f' ~ 3~ - € c c ( 0 c) (1) = éo 3 ~
0
Case (ii) E: c '> é o
Ccl = (~) f' b (lo) a (2) 3 c E'c
f - € Cc2 = ( c 0) a f' b (3)
€ c c
[~ fo ~ - <; C = + ( c 0) fI b a (4) c 3 € ~c c c
Moments in Concrete (about Neutra1 Axis)
Case (i) / c:c
M = (!!....)2 b fI J [2 ~ -c € c é c 0
o
8 e - 3 ~ (
0 c) 12 E: o
(5)
Case (ii)
5 Mc1 - 12
Compatibi1ity of Strains
~c €. sa - = -..,....:==---,-kd d (1 - k)
- 19 -
+
é. = (1 - k) E + é s k c se
Equi1ibrium of Forces
Case (i)
Le.
bkd fI ~ c C
€ o
3€ - G ( 0 c) = A f = pbd f
3 é s s s o
(6)
(7)
(8)
(9)
(l0)
(11)
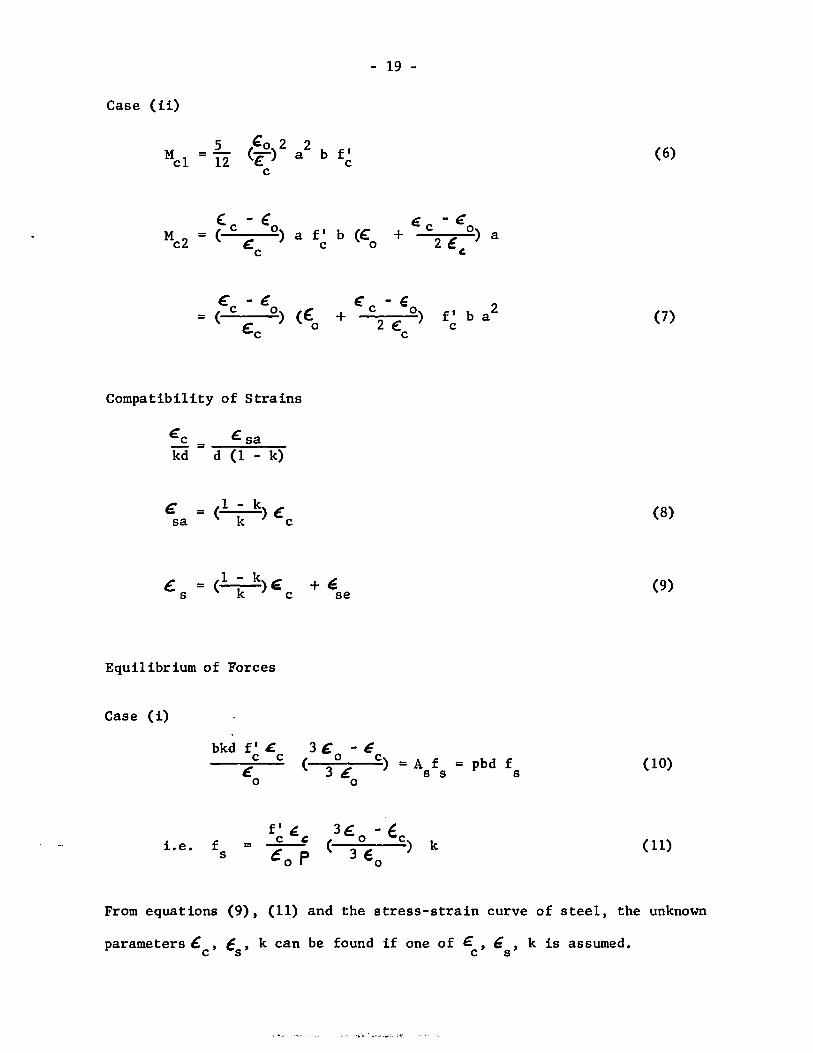
From equations (9), (11) and the stress-strain curve of steel, the unknown
parameters € , é , k can be found if one of € , , , k is assumed. c s c s
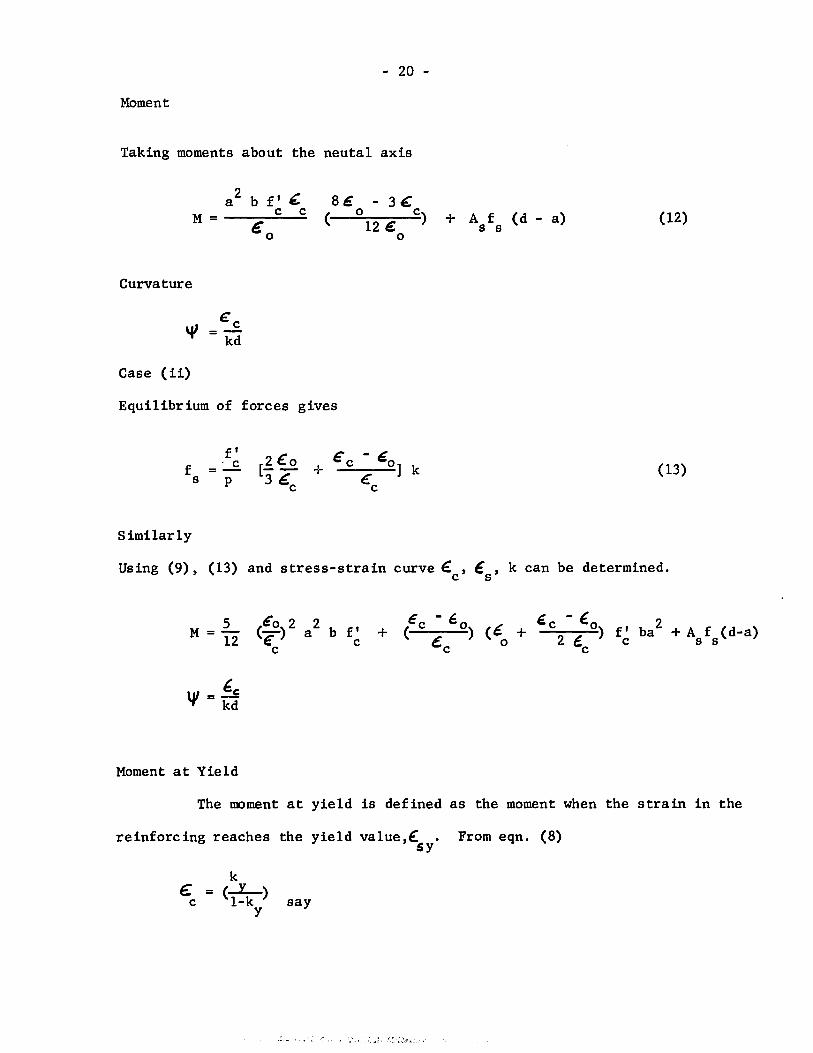
- 20 -
Moment
Taking moments about the neuta1 axis
Curvature
Case (ii)
a 2 b fI If. c c M = ---.,;~.;;.
~o
8~ - 3~ ( 0
12 e c)
o
Equi1ibrium of forces gives
f s
Similar1y
fI ·C
=-p
+ A f s s (d - a) (12)
(13)
Using (9), (13) and stress-strain curve ~ , é , k can be determined. c s
"1 = ~t:. ., kd
Moment at Yie1d
The moment at yie1d i8 defined as the moment when the strain in the
reinforcing reaches the yie1d va1ue,( • From eqn. (8) sy
say

- 21 -
By equating the force in the steel with the force in concrete as before
e ,k can be found. c y
Also, M is found by taking moments about the neutral axis. y
Moment at Cracking
The moment at cracking was found by equating the sum of the compres-
sive stresses produced by the prestressing and the tension stress produced by
the flexural moment at cracking to the tensile stress of concrete in bending.
midspan.
i.e.
or
The
p P ey M y -E + --E-:. + cr = A l l
! !P [f + (1 + M = cr y r A
\fi M = cr cr E l c
as used expression for f r
f r = 3000
3 + 12,000
fI c
f r
A e l!y) ]
by Warwaruk 4 was adopted
The value of E l was determined from the load-deflection curve at c
Tri-linear moment-curvature relationships were calculated using the
above analysis for each beam tested and the results are presented in Table 2.
5.3 Hinge Rotation
The moment-curvature relationships as derived from the above analysis
were used to calculate the hinge rotations of each beam.

- 22 -
l 10 The plastic region at ultimate is defined by some authors' for
reinforced concrete as the region where the moment exceeds the yield moment.
This definition is convenient but it hardly represents the true length of the
plasticity zone if it infers that outside of this zone the beam is truly
elastic, that is uncracked. It is well-known that sections are cracked
long before the steel reinforcing begins to yield.
In inelastic analysis, it is the plastic rotation within the hinge
length which is of real significance and not the contribution due to plastic
rotation over the entire beam. The hinge length represents the length over
which a major portion of the plastic rotation is assumed to be concentrated.
However, it must be remembered that in the analysis, the rotation is assumed
to occur at a particular section and hence the contribution to the hinge
rotation must necessarily be derived from that in the immediate vicinity of
the hinge.
1 14 21 Many authors' , have for convenience assumed the hinge length
23 for reinfcrced concrete to be equal to the effective depth. In the Report
of the Institution of Civil Engineering Commit tee it is reported that the
hinge length may vary from O.4d to 2.4d.
In this analysis, the hinge length, based on experimental evidence,
is taken to be approximately 2.2d or 10 inches.
The total rotation within the hinge length was calculated by
integrating under the curvature distribution obtained from a simplified tri-
linear moment-curvature relationship.
The total elastic rotation was calculated by extending the moment-
curvature portion for the uncracked section and deriving the curvature dis-
tribution using the uncracked section relationship.
The total plastic rotation was taken as the difference between the
total rotation and the elastic rotation.

- 23 -
." CttAPTER VI
CONCLUS IONS
6.1 Comparison of Experimental and Theoretical Results
For each beam, total rotations were calculated by integrating under
the curvature distribution, by deflections measured at midspan and by rota
tions of the lever arms. The results obtained were found to be comparable
with deviations of approximately 10-15 percent in most cases (Table 5).
The values of ultimate hinge rotations obtained experimentally
were compared with those obtained theoretically. Here again there was good
correlation with deviations of the same magnitude (Tables 3 and 5).
The average ultimate curvatures as measured within the hinging
region (Table 4) showed deviations of 10-20 percent from the values calculated
theoretically. This is thought to be within acceptable limits of deviation
for deformations at ultimate.
An attempt was made to evaluate experimental moment-curvature rela
tionships for various sections within the hinge length of each beam. The
results obtained were very scattered, thus confirming that there is no unique
moment-curvature relationship for a given section (Fig. 22). As a last re
sort, a tri-linear curve was fitled using a least squares law. The rotations
obtained in the hinging region were compared with the rotations obtained from
the curvature distribution (Fig. 23 to Fig. 34). Because of the wide scatter
of the curvatures at different sections, it is not recommended that evalua
tion of a moment-curvature relationship for a given beam section be attempted
experimentally.
- 24 -
6.2 Hinge Rotation and Total Rotations
Effect of Web Reinforcing (Fig. 44,45,46 and Table 6). At both
leve1s of prestress of 147 ksi and 109 ksi, the effect of reducing web
reinforcing spacing is to increase the amount of rotation.
At the higher 1eve1 of prestress, the resu1ts do not indicate
the trend very strong1y because of the relative ineffectiveness of the web
reinforcing in confining the compression b10ck of the concrete. The depth
of the compression b10ck at u1timate was approximate1y 1.25 inches whi1e
the concrete cov~ at the top was 0.5 inch.
At the 10wer 1eve1 of prestress, the effect is distinct1y shown
in both the hinge rotation and the total rotation.
If confinement was more efficient a greater variation of rotation
capabi1ity cou1d be expected using the same percentages of reinforcing.
Better confinement cou1d be obtained by using rectangu1ar spirals or by
placing the stirrups so as to enclose the compression b10ck more effectively.
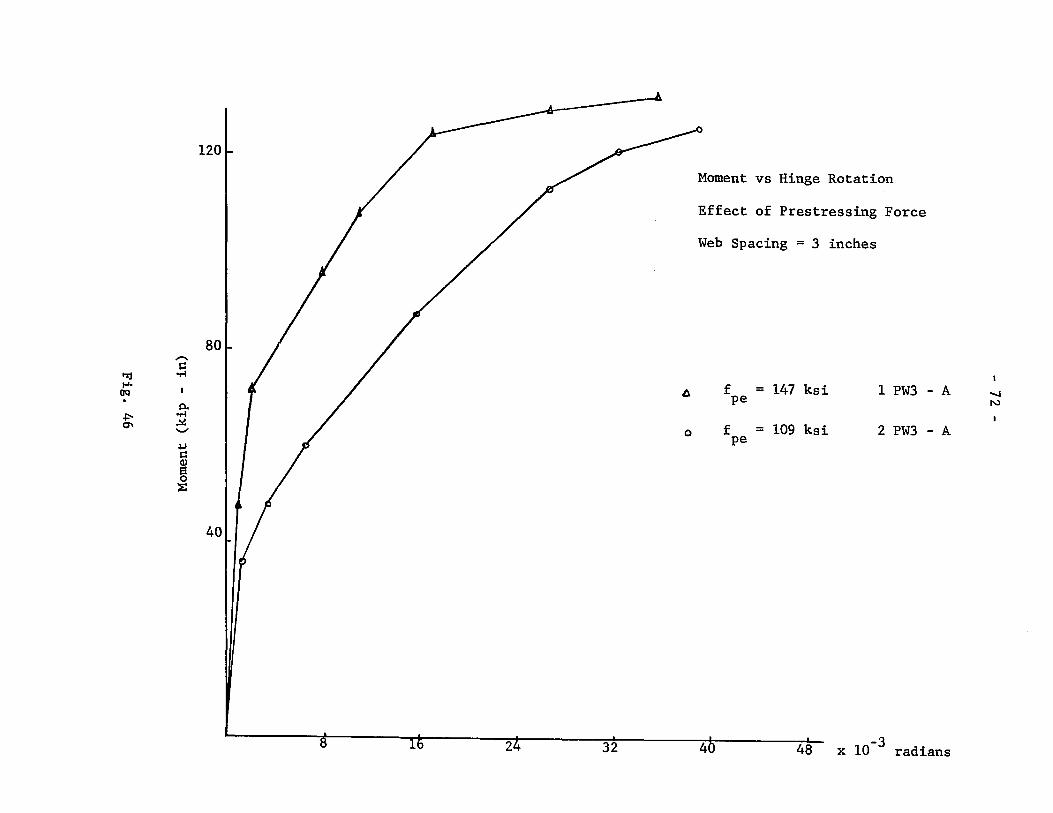
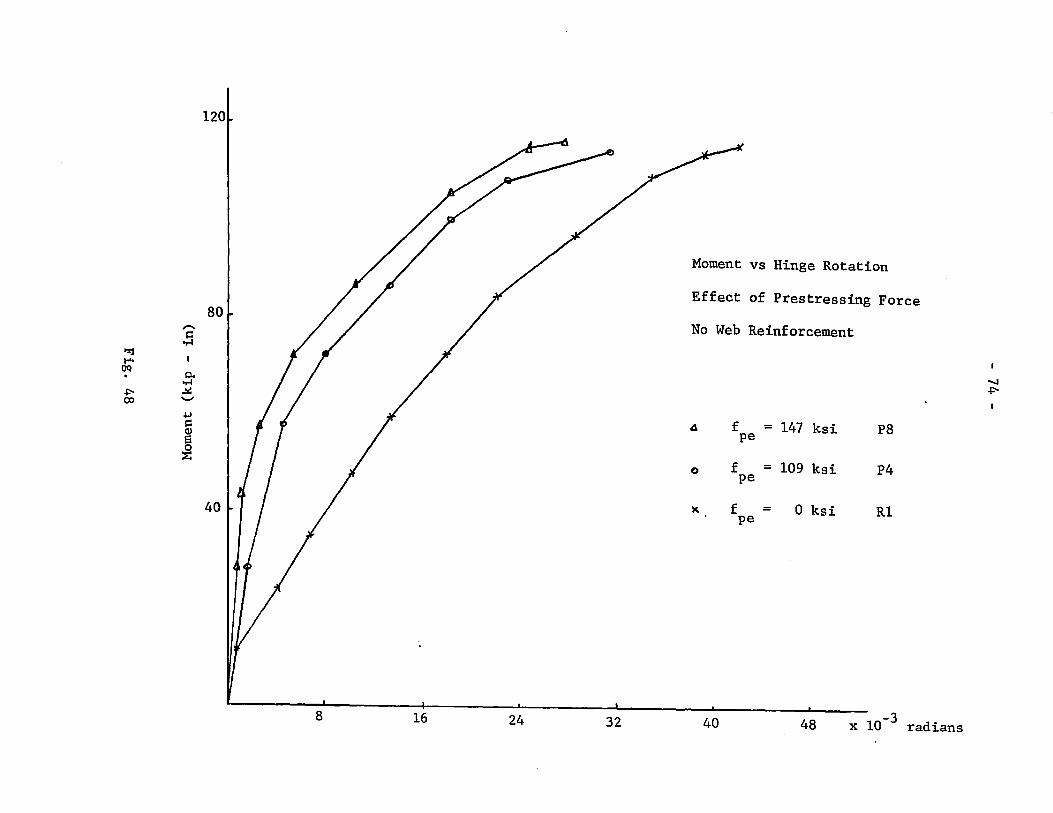
Effect of Prestressing Force (Fig. 47,48 and Table 7).
The effect of increasing the prestressing force is to decrease the rotation
capacity. This is shown for the different spacings of web reinforcing.
Again, the effect is recognized more distinct1y by comparing the total rota
tions. The effect is magnified by considering the rotations for the beams
with no prestressing force.
The mode of fai1ure at high prestressing forces tends to be of a
more sudden britt1e nature than that at lower prestressing forces. The
higher the prestressing force, the higher is the cracking load, the shorter
is the region from cracking to yield, and the smal1er the ultimate rotation.

- 25 -
6.3 Differences between Reinforced and Prestressed Members
The differencesbetween reinforced and prestressed members in hinge
formation and rotationcapBbility are due to the effects of the axial load
and also to the different types of reinforcing normally used in reinforced
and prestressed concrete members.
Axial load with an eccentricity produces a longitudinal compression
and a uniform bending moment in the opposite direction to the load bending
moment. The effect of the longitudinal compression is ta produce a stiffer
member and the effect of the moment is to produce a camber in the member.
An increase in the axial load increases the stiffness of the member
with the result that the elastic portion of the rotation is also increased.
The mode of failure is of a more brittle nature and the total ultimate
rotation is lower.
By keeping the prestressing force constant and increasing the eccen
tricity of the force, the prestressing moment can be increased. If the camber
is sufficiently large and the load moment is applied in the opposite direc
tion, the curvatures along the member may or may not be reversed, dependent
on the magnitude and the type of loading conditions. That is to say, there
may be points along the beam with increasing negative curvatures. This be
haviour was observed experimentally in regions away from the hinge. This
effect would tend to reduce the total rotations of the beam.
Tension reinforcement for reinforced concrete members normally
has a stress-strain relationship which exhibits a definite yield point stress
and plateau. The yield stress i6 much lower than that for reinforcement
used in prestressed concrete members.
Provided that the section is under-reinforced and the same area
- 26 -
of steel is used for both types of reinforcing, th en at ultllnate the force in
the mild steel is much lower than that in the prestressing steel. Rence,
the force in concrete compression is smaller for the reinforced concrete sec
tion and the depth to the neutral axis is less. The ultllnate curvature and
ultllnate rotation is therefore greater than for the prestressed concrete
section (Tables 2,3,4,5).
The above discussion also applies when the yield strain is reached
in the prestressing reinforcement.
Up to the point of yield of mild steel, the behaviour of the sec
tions using both types of reinforcement will be the same.
6.4 Recommendations for Future Research
The number of variables that affect the rotation capacity of
prestressed concrete members is so great that information must be gathered
from separate sources.
Parameters such as percentage of reinforcing, amount of compression
steel, effects of different types of binders, span/depth ratio and varying
moment gradients need to be studied before an understanding of hinge rota
tion can be achieved in indeterminate structures.
Limit Design theories can only be used as a practical design method
when sufficient confidence can be given to the values of the hinge rotation
capability. Because of the number of parameters that influence the hinge
length and the hinge rotation capability, it is evident that a statistical
analysis using more results would be the logical solution to this problem.
It is recommended that smaller sized specimens be used in further investiga
tions to decrease the manual labor involved and to increase the efficiency
of producing more data. Further research must include studies on simple in
determinate structures.
- 27 -
: =
V k i'-'t.
( 1-1 .u CIl
CIl CIl Q) 1-1 .u CIl Q) 1-1
Il-<
~rI "1 0
\0 N 0\ .-f
W ['-1
Beam Dimensions
Fig. 1
. ... . ,;., .. ,~.; ~.,:,.' .. -':..: : ... L!, .. ' "
10
8
"'"' CIl 0. 1
":1 or! .... ~ 6 ()Q '-"
"0 N cu
0 ...:1
4
2
. 01 ~~!i
- ---
.02 .03
Load - Strain Curve
1/4 inch diameter Prestressing Wire
-- - - ---
6 E = 30.2 x 10 psi s
.04 .05
Strain
.06
-?C
.07 in in
N (Xl

CI) (')
=-~ " .... (')
~ en "CI t;
'Tj en ID .... en
OQ ::s " III w " .... -0 ::s 0 HI
H ::s CIl
" t;
m ::s " III
" .... 0 ::s
DVDT Lever
~ f..
33"
21"
9"
ATm \ \ \ \ \ \ 1 \ 1 ,.concrete strain ------ / gauge 1/2" - -- - - - r~ ------- -
IQ H--.........--. 1/4" l'
I-.J \0
Steel Strain Prestress Gauge Wire
Def1ection Gauge
~
20" 20"
96"
120" _~ J ____________ _---"='-- ____________________ _ ,
1
d
b
f
fi C
\
c
LA
Section
1
s
- 30 -
f f i [2 é: (;0)2] C C_=r--C _é_O ----~ --,
€ ( o u c
Concrete Stress-Strain Distribution
f
H Cc2 Cc
Ccl
T "" T
l t s s
Case (i) Case (ii) é é
sa se
Strain Forces
Fig. 4
,< - '.\ :1..

- 31 -
~ 6
48
= 5.55k
Strain Distribution
Bearn 1 PW3 - A 3
1
-5 CIL 8 16 24 32 48
Distance fram Center-Line (inches)
Fig. 5

64
48
32
16
-5 CIL
k = 5.5
8
- 32 -
Strain Distribution
Beam 1 PW3 - B
16 24 32 40 48
Distance from Center-Line (inches)
Fig. 6
- 33 -
48
Strain Distribution
Bearn 2 PW3 - A 32
16
-5 CIL 8 16 24 32 40 48
Distance from Center-Line (inches)
Fig. 7
..;t 1
o !=lI ....... .-j.
~
1 1
1 1
Max é = .016 u
64 'I
48
~P
32
16
-5 CIL 8
- 34 -
Strain Distribution
Bearn 1 PW6 - A
16 24 32 40 48
Distance from Center-Line (inches)
Fig. 8

64
48
32
16
-5 CiL
k ~P = 5.4
8
- 35 -
Strain Distribution
Beam 2 PW6 - A
16 24 32 40 48
Distance from Center-Line (inches)
Fig. 9
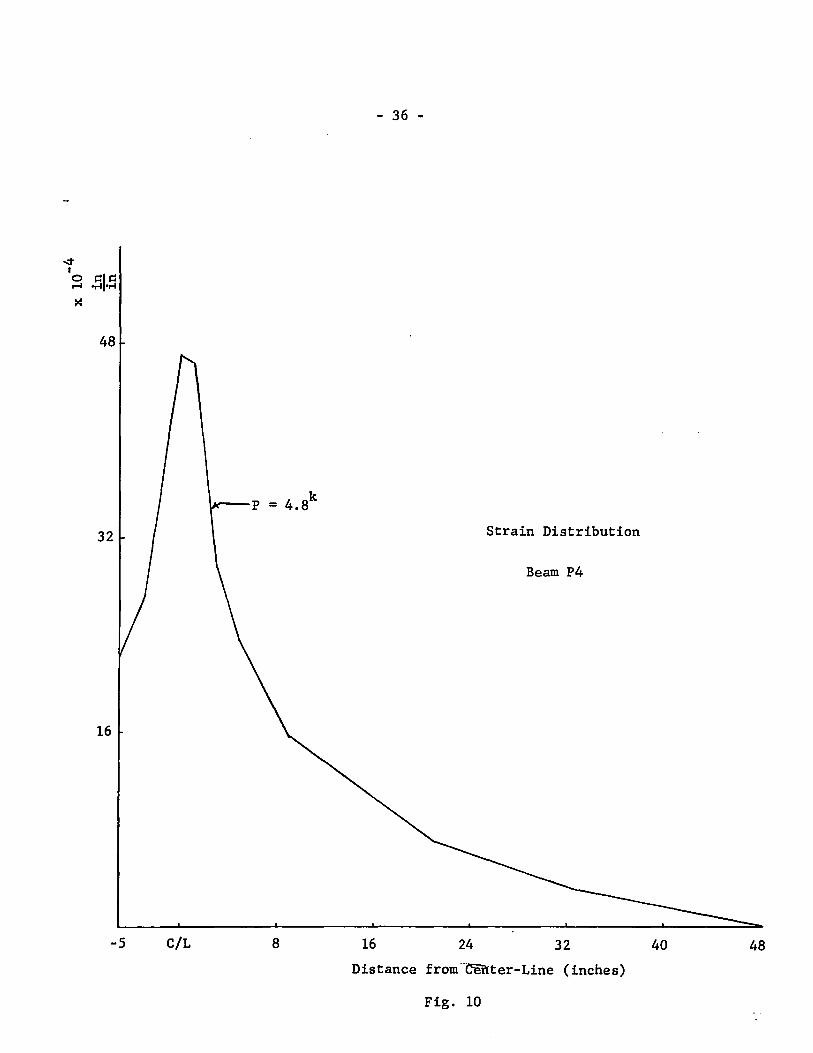
- 36 -
48
• ...--p = 4.8k
32 Strain Distribution
Bearn P4
16
-5 CIL 8 16 24 32 40 48
Distance from ··Clmter-Line (inches)
Fig. 10

"" 1
o C::I .-1 .......
>:
32
16
-5 CiL 8
- 37 -
Strain Distribution
Beam PS
16 24 32 40 48
Distance from Center-Line (inches)
Fig. 11

48
32
16
-5 CIL
k ,r-P = 4.8
8
- 38 -
Strain Distribution
Bearn P8
16 24 32 40 48
Distance from Center-Line (inches)
Fig. 12

- 39 -
64
48
Strain Distribution
Bearn RlA
32
16
-5 CIL 8 16 24 32 40 48
Distance from Center-Line (inches)
Fig. 13
4
al oU ~
"" 0 o 1 Po<
~ 0
t'Zj ~ .... CIl OQ ~ t-' Z 12 ~
8
-
4
o .0024
Histogram of Ultimate Strain Values in Hinge Length
Web Reinforcement at 6 inches
1 1
1
No Web Reinforcement or
Web Reinforcement at 9 inches
l
1
.0032 .0040 .0048 .0056
-
1
1
1
.0064
.
.0072
1 in in
~ o
• 1
Il
64
48
32
16
-5 CIL
- 41 -
\11 = .00796 in-1 u
P = 5.55k
8 16
Curvature Distribution
Bearn 1 PW3 - A
24 32 40
Distance fram Center-Line (inches)
Fig. 15
48

64
48
32
16
-5 CIL
- 42 -
Ip = .008 in- 1 u
8 16 24
Curvature Distribution
Beam 1 PW3 - B
32 40
Distance from Center-Line (inches)
Fig. 16
48

16
-5
" ,1
CIL
'-Pu
- 43 -
. -1 = .008 ~n
8 16
Curvature Distribution
Bearn 2 PW3 - A
24 32
Distance from Center-Line (inches)
Fig. 17
48

- 44 -
\ilu = .02634 in- 1
64
48
~P
Curvature Distribution
Beam 1 PW6 - A 32
16
-5 CIL 8 16 24 32 40 48
Distance from Center-Line (inches)
Fig. 18

"" r-I 1 1 - 45 -o r-I J:l
• .-1 li' u = .00976
-1 in
64
48
Curvature Distribution
Beam 2 PW6 - A
32
16
-5 CIL 8 16 24 32 40 48
Distance from Center-Line (inches)
Fig. 19

- 46 -
64
48
Curvature Distribution
Beam P4
32
16
-5 CIL 8 16 24 32 48
Distance from Center-Line (inches)
Fig. 20
1 1
64 1 1
'fi u = .0099 -1
in
k ~p = 4.9
48 /"
32
16
-5 CiL 8
- 47 -
Curvature Distribution
Beam RIA
16 24 32
Distance from Center-Line (inches)
Fig. 21
40
,.... s::
..-1 >Jj 1-"
OQ P-. ..-1
N ~ N '-'
~ .S::
Q)
l· 1 .
12
80
1 ( ./
40
.002
Typica1 Enve10pe of Moment-Curvature
Re1ationship
.004
Beam 1 PW3 - B
-1 .006 in
.po oo

--... ------120
Moment vs Hinge Rotation
,,-.... r::
..-l r 0 Bearn 1 PW3 - A
t'%j 80 (M = 133.0 kip-in)
1""- 0-u
O'Q ..-l . ~ X Bearn 1 PW3 - B +='
~ (M = 132.0 kip-in) \0
N U W ~
r:: Least Squares Q)
a 1 0 ~
1
1
1 40 ~I
1
1
~ 11, ':\? L..R v ln ""!:Irl; !::IInc:

t'!j ~.
OQ
N ~
120
,.... = ~
~ 80 ~ '-"
.u = g ::l!:
40
1 1
Il
8
j/
16
M = 127.2 kip-in --. u
/ Moment vs Hinge Rotation
Bearn 2 PW3 - A
- - - Least Squares
24 32 40 48 56 -3 x 10 radians
VI o
,.... = ..-4
02:1 1-'-
OQ p.. . ..-4 ~
N -VI ~ = ~ ~
120
80
40
1
1
p
8 16 24
,.. .Ir
o o
Moment vs Hinge Rotation
0 Bearn 1 PW6 - A (M = 129.5 kip-in)
u )( Bearn 1 PW6 - B VI
1-' (M = 134.2 kip-in) u
- - - Least Squares
32 40 48 56 x 10 radians
-120
/
Moment vs Hinge Rotation
;-.. / ~
/ 0 Bearn 2 PW6 - A
'o-l (M = 129.5 kip-in) t'%j 80 u ...,.
0. / Bearn 2 PW6 - B OQ x . oo-l ..!I\ (M = 125.0 kip-in) lJ1
N '-" Il U N 0\
/ oU - - - Least Squares ~
~ 0 / ~
f 1 l,
40
8 16 24 32 40 48 56 -3 x 10 radians
120
,.... s::
·rI
~ 80 t-'o 0.
1 JQ . 'rI
~ N '-' -...J .w
s:: Q)
~ // ~
40
//
//
8 16 24 32
M = 113.0 kip-in u
Moment vs Hinge Rotation
Bearn P2
- - - Leas t Squares
40 48 x 10
·1
VI w
radians
>'Jj 1-'.
OQ
N 00
120
3 80 t / / p.. / ~ ~ ...... .u / ~ QI
~
'" 40 ~ ,r Il 1
1
8
/ /
/
16 24 32
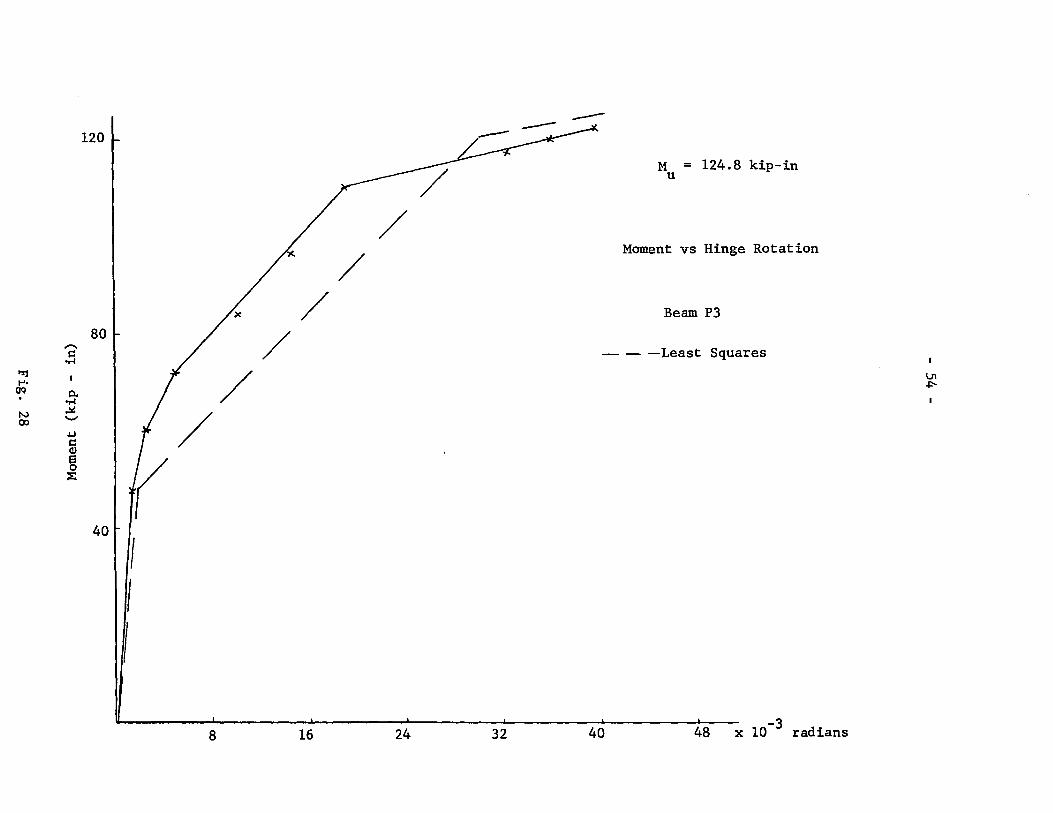
----M 124.8 kip-in
u
Moment vs Hinge Rotation
Bearn P3
- - -Least Squares
40 48 -3 x 10 radians
\.J1 ~

120
,...., 80 c:: .,-1
'::1 J? ..... OQ Po. .
"'"' ~ N .......
// \0 oU c:: al
~ ~
40
8
/ /
/
,/
16 24 32
M = 120.0 kip-in u
Moment vs Hinge Rotation
Beam P4
Least Squares
40 -3 x 10 radians
\JI VI

120
,.... 80 r // ~ ~
t'%j t-"o
OQ P-.,,4
U) ~ 0 -
.j.J
~
~ 0
::t::
40
'/
8
/ /
/
16 24
M = 113.5 kip-in u
Moment vs Hinge Rotation
Bearn PS
- - - Least Squares
32 40 -3 x 10 radians
U1 (J'I

I%j t-'.
OQ . VJ 1-'
120
,..... ~ 80
0.. -..1 ~ '-'
.u
J
40
8 16
7
/
24 32
M = 124.8 kip-in u
Moment vs Hinge Rotation
Bearn P6
- - - Leas t Squares
40 -3 x 10 radians
lJ1 -...J

120
'2 80 '.-1
'>:j 0. .....
'.-1 OQ ~ . '-"
w ~ N t::: Q)
g ~
1 Il
~ 40~ fI
~ ~
8 16 24 32
M = 126.5 kip-in u
Moment vs Hinge Rotation
Beam P7
- - -Least Squares
40 -3 x 10 radians
~
~.
U1 00

,-..
= ..-1
t'%j ... ()Q p.. . ..-1
W ~ '-'
W oU
~ ~ ~
120
80
40 t-, 1
(
1
1 1 1
8
/'
/' /'
16
/
./
/'
24 32
M = 117.5 kip-in u
Moment vs Hinge Rotation
Beam P8
- - - Least Squares
40 -3 x 10 radians
Ut \0

>zj .... OQ
w .p-
12
'2 8 ·roI
P. 'roI ~ '-"
.u
~ o ~
8 16 24 32
.. -- -K .-.4' ;> --
M = 125.0-kip-in u
Moment vs Hinge Rotation
Bearn 9 PW9 - B
- -- -- Least squares
40 48 -3 x 10 radians
0'\ o
I"%j .... OQ . \.Al \J1
" .E
P. '.-1 ~ '-'
.u c::
1
120
80
40
r 8 16 24 32 40
o
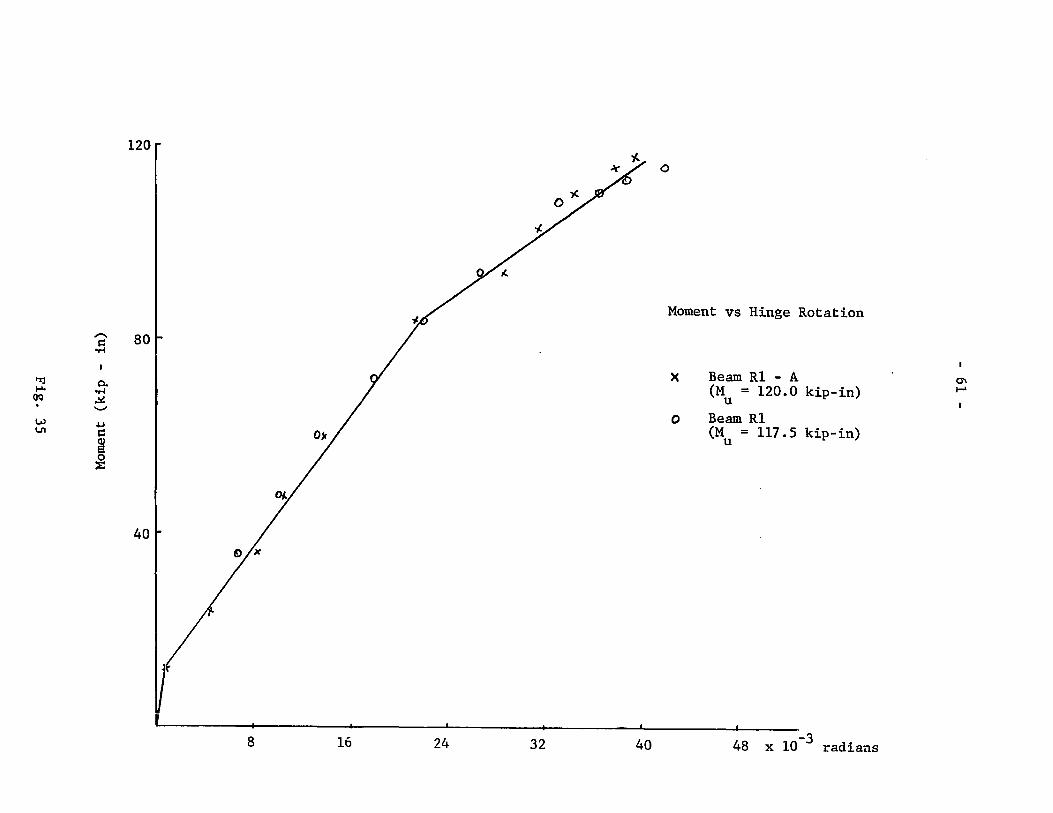
Moment vs Hinge Rotation
x
o
Bearn. R1 - A (M = 120.0 kip-in)
u
Bearn. R1 (M = 117.5 kip-in)
u
-3 48 x 10 radians
0' t-'

y. o
o
120
Moment vs Total Rotations (Lever Arm)
:§' 80 1 lr
"':1 / x Bearn 1 PW3 - A
.... OQ . p. Je/ 0 • .-1 0 Bearn 1 PW3 - B (,..) ~
IJ'
IJ' '-' ~
oU ~ al a 0 ~
40
8 16 24 32 40 48 56 -3
x 10 radians
120
"""' "%j
= 80 -,-l
1-'-OQ
0-or-l
W ...... ~ ..., .u = J
40
8 16
o
o
o
24 32 40
o
~
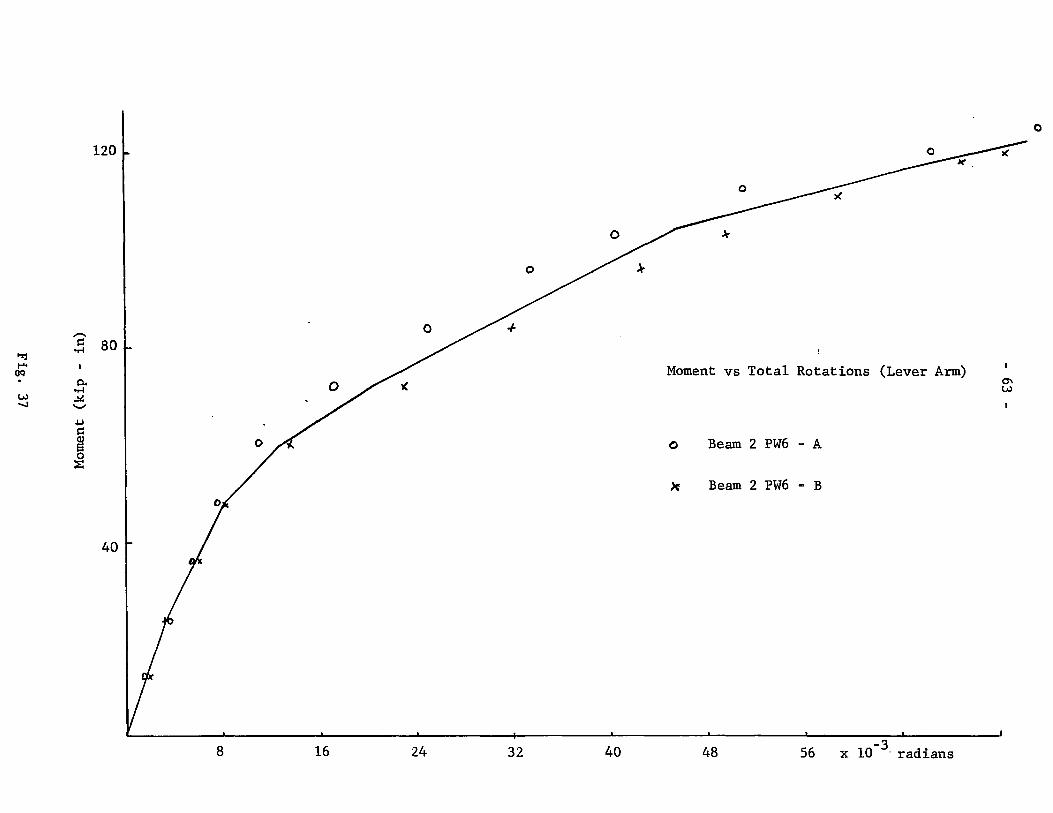
Moment vs Total Rotations (Lever Arm)
o Bearn 2 PW6 - A
X Bearn 2 PW6 - B
48 56 -3 x 10 . radians
0\ W
o
o o
-"t
120
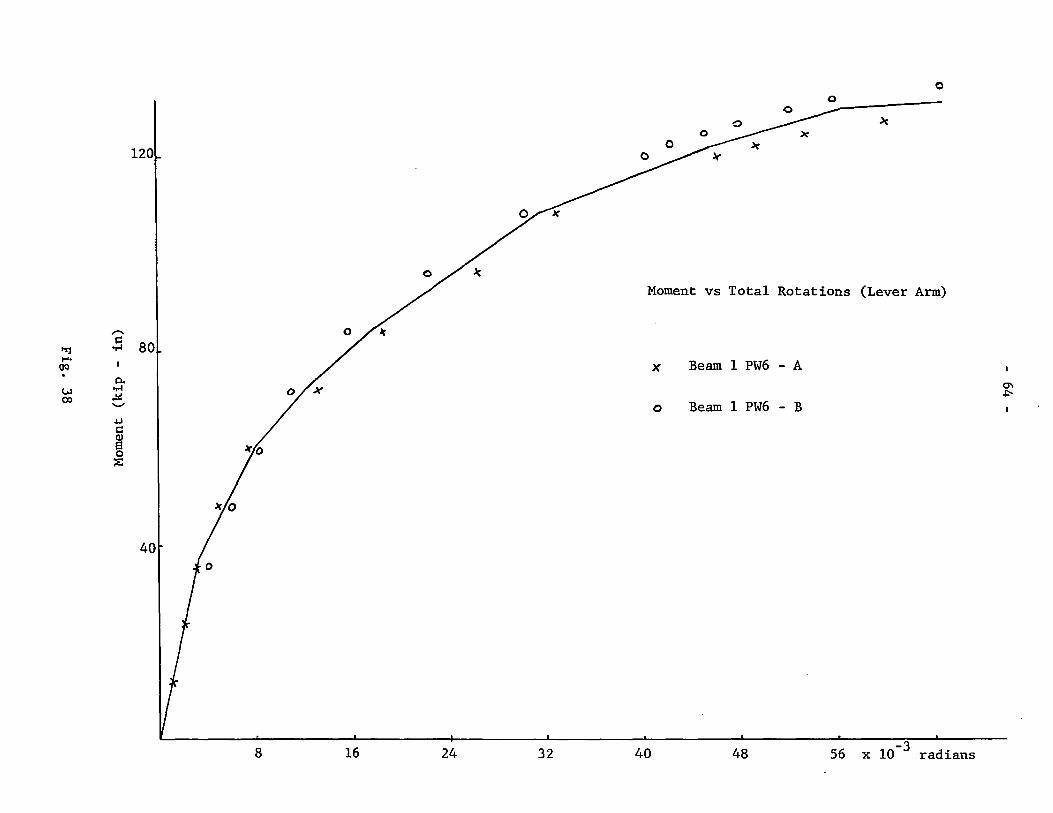
Moment vs Total Rotations (Lever Arm)
-s:: 80 "%j .,.,l
.....
/ x Bearn 1 PW6 - A OQ .
P- a-w o,.l .p-oo ..!o:
Bearn 1 PW6 - B '-'" 0 .u s:: Q)
El 0 ~
40
8 16 24 32 40 48 56 -3 x 10 radians

120
-r:: t'%j ~ .... OQ 80
0.. W ." \0 ~ -
.j.J
s:: al S 0 ~
40
8 16 24 32 40
Moment vs Total Roations (Lever Arro)
Bearn P2
48 56 -3 x 10 radians
0'\ \..TI
120
,..... c:: 80 'rl
0. orl ~ '-"
oU c:: al g l::
40
8 16 24 32 40
Moment vs Total Rotations (Lever Arm)
Bearn P3
48 56 64 x 10
0' 0'
radians
,,-..
"!j ~ 1""
OQ . p..
.p-t-'
.~
~ '-"
+J I=l QI
~
120
80
40
8 16 24 32
Moment vs Total Rotations (Lever Arm)
Bearn p4
40 48 56 x 10-3 radians
0\ -....J
120
""' r::: "'1
'rl
1-'- 80 (JQ . 0. .j:'-
.~
N ~ ........ ~ r::: al
5 ::E:
40
8 16 24 32
Moment vs Total Roations (Lever Arm)
Beam 9 PW9 - A
40 48 56 -3 x 10 radians
0\ (Xl
6
5
4
'"' tf.I t>j P. 1"" ..-l ()Q ~ . '-'
~ '"é lN tU 0 3 ~
s:: tU p. tf.I
'"é .,.c ::E:
2
1
.2 .6
,c 9 Q X
Typical Midspan Load vs Midspan Deflection
x Beam 1 PW3 - A
o Beam 1 PW3 - B
.8 1.0 1.2
0'\ 1..0
inches

120
-~ s:: .,-l
t-'. 80 ()Q .
al ~ p..
o.-l ~ ~ -
~
s:: <Il !3 0
1 q. 11 ~
40
8 16 24 32 40
Moment vs Hinge Rotation
Effect of Web Reinforcement
f = 147 ksi pe
A 3 inches spacings
,.;. 6 inches spacings
0 9 inches spacings
48 -3
x 10 radians
1 PW3 - B
1 PW6 - B
9 PW9 - A
-..J 0

120
Moment vs Hinge Rotation
Effect of Web Reinforcement
f = 109 ksi pe
/// ,.... 80
'%j .E 1-'-
OQ . c.
~ ..-1 Ut ~
Il / A 3 inches spacings 2 PW3 A '-1 '-' t-'
oU s:: al
il/' ~ ~ 6 inches spacings 2 PW6 - B ~
/// 0 Infinite spacings p4
40
8 16 24 32 40 48 -3 x 10 radians
120
Moment vs Hinge Rotation
Effect of Prestressing Force
Web Spacing = 3 inches
80 " s::
~ .,-l
..... 1 1 / Il f = 147 ksi 1 PW3 A OQ -...J .
p.. pe N
~ .,-l
0- ~
1 1 / f = 109 ksi 2 PW3 - A '-' 0 ~
pe s:: CIl a 0 ~
40
l 2 32 4 48 -3 x 10 radians

120
Moment vs Hinge Rotation
Effect of Prestressing Force
Web Spacing = 6 inches
"'1 - 80 .... r:: OQ ~ . 1 1 f 147 ksi 1 PW6 B A ...... ~ 0-
pe w ......
.~
~
/ / ..., ·f = 109 ksi 2 PW6 - A 0 "-1
pe r:: Q)
!3 ~
40
8 16 24 32 40 48 56 x 10-~ radians
120
Moment vs Hinge Rotation
Effect of Prestressing Force
'2 80 ~ // / No Web Reinforcement ..-l
l'Tj ra-
OQ 0. ...... .
/ / • ,.l / .po. .po. ~ 00 '-'
oU
f = 147 ksi P8 s:: f r / A CIl pe a 0 ~
0 f pe = 109 ksi P4
40 l f / / )C. f = o ksi R1 pe
8 16 24 32 40 48 -3 x 10 radians
- 75 -
BEAM DESIGNATION
Designation fI é se Web
c Spacing p.s.i. x 10-6 in (inches)
in
1 PW3 - A 6350 4870 3
1 PW3 - B 6350 4870 3
2 PW3 - A 6250 3600 3
1 PW6 - A 6000 4720 6
1 PW6 - B 6000 4720 6
2 PW6 - A 5840 3320 6
2 PW6 - B 6250 3600 6
pl 6100 4785 None
P2 6500 3040 Il
P3 5840 3320 Il
p4 5830 3710 Il
p5 5800 3730 Il
p6 6550 4010 Il
P7 7000 4400 Il
p8 6200 4870 Il
9 PW9 - A 6430 4575 9
9 PW9 - B 6430 4575 9
R1 6550 0 9
RlA 6550 0 9
Table 1

M Bearn u
kip - in
1 PW3 - A 109.9
1 PW3 - B 109.9
2 PW3 - A 109.53
1 PW6 - A _108.46
1 PW6 - B 108.46
2 PW6 - A 107. 72
2 PW6 - B 105.36
Pl 114.91
P2 109.51
P3 107.84
P4 107.8
P5 102.67
p6 110.33
P7 109.66
P8 108.94
9 PW9 - A 113.14
9 PW9 - B 113.14
RI 109.08
RlA 109.08
THEORET ICAL MOMENT -CURVATURE
'fJ u M 'II y y
10-6 . -1 x ~n kip - in 10-6 . -1 x ~n
4980 97.68 2430
4980 97.68 2430
4900 97.32 2820
4120 96.21 2520
4120 96.21 2520
4000 96.54 2958
4280 97.90 2800
3310 97.30 3260
3800 97.45 3070
3370 96.09 2970
3370 96.09 2860
3160 95.61 2850
3800 98.45 2660
4180 99.93 3070
3600 97.33 2480
3600 97.92 2850
3600 97.92 2850
3870 99.97 3810
3870 99.97 3810
Table 2
M cr kip - in .
52.8
52.8
43.1
52.1
52.1
40.4
43.4
49.0
46.0
40.4
44.2
43.4
46.3
49.7
52.6
52.3
52.3
14.9
14.9
\41 cr
x 10-6 in- 1
162
162
132
160
160
124
133
150
141
124
136
134
142
152
162
161
161
46
46
'-1 0'\

THEORETICAL ANALYSIS OF HINGE ROTATION
U1tirnate (rad) Yie1d (rad) Cracking 1
Bearn geh 9ph 9 th 9 th
geh
1
1 PW3 - A .0032 .03574 .03894 .0217 .00154
1 PW3 - B .0032 .03574 .03894 .0217 .00154
2 PW3 - A .00318 .03625 .03943 .0252 .00125 1
1
1 PW6 - A .00315 .03063 .03378 .0225 .00128
1 PW6 - B .00315 .03063 .03378 .0225 .00128
2 PW6 - A .00314 .03165 .03479 .02695 .00164
2 PW6 - B .00307 .0317 2 .03479 .02547 .00126 -...J -...J
Pl .00322 .02963 .03285 .0293 .00138
P2 .00318 .03313 .03631 .02777 .00133 i
P3 .00314 .02926 .03240 .02715 .00117
P4 .00315 .02889 .03204 .02604 .0013 1
P5 .00315 .02889 .03204 .02604 .0013 P6 .00319 .02871 .0319 .02418 .00133
P7 .00318 .03202 .0352 .02767 .00144
P8 .00318 .02730 .03048 .02212 .00153 1
1
9 PW9 - A .0331 .02976 .03307 .0255 .00153
9 PW9 - B .0331 .03976 .03307 .0255 .00153 1
1
RI .00316 .03440 .03756 .03576 .00043
RlA .00316 .03440 .03756 .03576 .00043 -- 1
Table 3
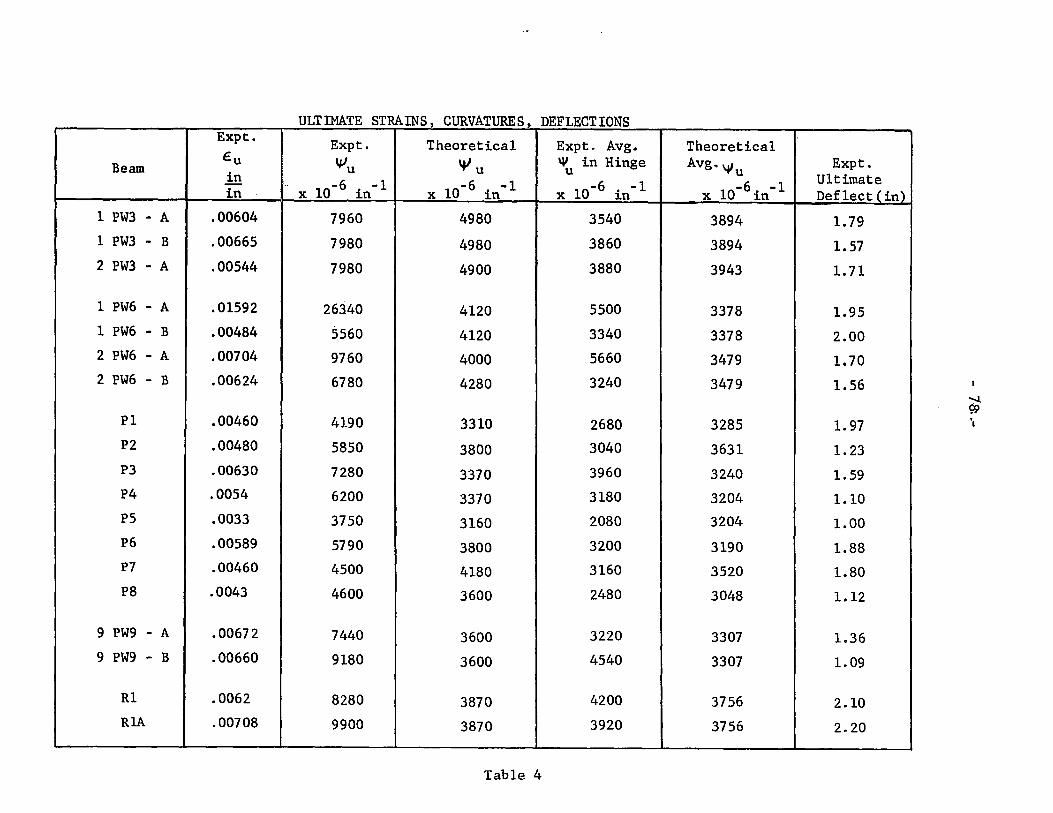
- -ULTIMATE STRAINS. CURVATURES. DEFLECTIONS Expt. Expt. Theoretica1 Expt. Avg.
Beam Eu
"'u 'Vu \&1 in Hinge in u
x 10-6 in- 1 x 10⁻⁶ in- 1 x 10⁻⁶ in- 1 in
1 PW3 - A .00604 7960 4980 3540 1 PW3 - B .00665 7980 4980 3860
2 PW3 - A .00544 7980 4900 3880
1 PW6 - A .01592 26340 4120 5500 1 PW6 - B .00484 5560 4120 3340 2 PW6 - A .00704 9760 4000 5660 2 PW6 - B .00624 6780 4280 3240
Pl .00460 4190 3310 2680 P2 .00480 5850 3800 3040 P3 .00630 7280 3370 3960 P4 .0054 6200 3370 3180 P5 .0033 3750 3160 2080 P6 .00589 5790 3800 3200 P7 .00460 4500 4180 3160 P8 .0043 4600 3600 2480
9 PW9 - A .00672 7440 3600 3220 9 PW9 - B .00660 9180 3600 4540
R1 .0062 8280 3870 4200 RlA .00708 9900 3870 3920
Table 4
Theoretica1 Avg. 'IIu
10-6. -1 x l.n
3894
3894
3943
3378
3378
3479
3479
3285
3631
3240
3204
3204
3190
3520
3048
3307
3307
3756
3756
Expt. U1timate Def 1ec t ( in)
1. 79
1.57
1. 71
1.95
2.00
1. 70
1.56
1. 97
1.23
1.59
1.10
1.00
1.88
1.80
1.12
1.36
1.09
2.10
2.20
~ ~ '1
EXPERIMENTAL ROTATIONS AT ULTIMATE
Hinge Rotation Total Rotations Over Span Bearn (From Curv. Distr.) I(From Curv. Distr.) (From Midspan Def1ect.)
geh 9ph 9 th 9 t 9 9 9 t e p
1 PW3 - A .0028 .0326 .0354 .0697 .02 .0592 .0792
1 PW3 - B .0028 .0358 .0386 .0790 .02 .0531 .0731
2 PW3 - A .0046 .0342 .0388 .1251 .0194 .0912 .1106
1 PW6 - A .0032 .0518 .0550 .0881 .0194 .0684 .0878 1 pw6 - B .0034 .0300 .0334 .0681 .0194 .0704 .0898 2 PW6 - A .0050 .0516 .0566 .1129 .0294 .0512 .0806 2 pw6 - B .0048 .0276 .0324 .0967 .0206 .0696 .0902
Pl .0041 .0227 .0268 .0694 .028 .0690 .0970 P2 .0034 .0270 .0304 .0820 .0162 .0404 .0566 P3 .0038 .0358 .0396 .0860 .028 .0478 .0758 P4 .0084 .0234 .0318 .0577 .0172 .0344 .0516 P5 .0034 .0174 .0208 .0398 .0156 .0312 .0468 p6 .0066 .0254 .032 .0888 .0131 .0696 .0827 P7 .00398 .0276 .0316 .0692 .0181 .0630 .0811 p8 .0036 .0212 .0248 .0634 .0231 .0312 .0543
9 PW9 - A .0042 .0280 .0322 .0704 .02 .0434 .0634 9 Pl-l9 - B .0066 .0388 .0454 .0799 .0187 ,0329 .0517
R1 .0061 .0359 .042 .1309 ,015 .0775 .0925 RIA .0064 .0328 .0392 .0941 ,OIS .0816 .0966
Table 5
(From Lever Arms) et
.070
.0772
.0987
.1070
.0852
.0838
.0920
.0625
.0671
.0868
.056
.040
-.01022
.0550
.0807
.0690
.1645
-- - .
--.J \0
'-",:'

EFFECT OF WEB REINFORCING ON ROTATIONS
-6 in Spacing Hinge Total ~ x 10 in Web Reinf. Rot. (rad) Rot. (rad) se
3" .0354 .0697
3" .0386 .0790
4870 6" .0550 .0881
(147 ksi) 6" .0334 .0681
None .0248 .0634
3" .0388 .1251
3600 6" .0324 .0967
(l09 ksi) None .0318 .0577
None .0208 .0398 -
Table 6
Bearn
1 PW3 - A
1 PW3 - B
1 PW6 - A
1 PW6 - B
P8
2 PW3 - A
2 PW6 - B p4
P5
1
(Xl o

EFFECT OF PRESTRESSING FORCE ON ROTATIONS
€. se
-6 in Hinge Total Web Reinf. x 10 in Rot. (rad) Rot. (rad)
3" 4870 .0354 .0697
4870 .0386 .0790
3600 .0388 .1251
6" 4720 .0550 .0881
4720 .0334 .0681
3600 .0566 .1129
3320 .0322 .0967
No web 4870 .0248 .0634
Reinforcement 4785 .0268 .0694
4400 .0316 .0692
3710 .0318 .0577
3320 .0396 .0860
3040 .0304 .0820
0 .042 .1309
0 .0892 .0941 -
Table 7
Bearn
1 PW3 - A
1 PW3 - B
2PW3 - A
1 PW6 - A
1 PW6 - B
2 PW6 - A
2 PW6 - B
P8
Pl
P7
p4
P3
P2
R1
RlA
1
i
1
1
00 t-'

- 82 -,
APPENDIX A
NOTATIONS
a = depth of neutral axis
A = cross-sectional area of concrete
A = area of prestressing steel s
b = breadth of beam
C = compressive force in concrete in flexure c
Ccl = compressi.ve force in concrete corresponding to the parabolic
portion of the stress block
Cc2 = compressive force in concrete corresponding to the rectangular
d
D
e
E c
~s
E say
Ese
f c
fi C
f r
f s
fil Y
portion of the stress block
= effective depth of beam
= depth of beam
= eccentricity of prestressing force
= strain in concrete at extreme fiber
= concrete strain corresponding to maximum concrete strength
= strain in steel
= additional strain in steel due to loading
= additional strain in steel dce to loading at yield
= effective prestrain in steel
= yield strain in steel
= ultimate strain in concrete at extreme fiber
= stress in concrete
= maximum strength of concrete cylinders
= modulus of rupture of concrete
= stress in tension steel
= yield point stress of web reinforcement

l
k
k Y
- 83 -
= moment of inertia of beam section
= ratio of depth of neutral axis ta effective depth
= ratio of depth of neutral axis ta effective depth at yield of
prestressing reinforcement
M = midspan moment
M = resisting moment due ta concrete about the neutral axis c
Mcl = resisting moment corresponding to the parabolic portion of the
stress black about the neutral axis
Mc2 = resisting moment correspondi.ng to the rectangular portion of
the stress block about the neutral axis
M = midspan cracking moment cr
M = yield midspan moment y
M = Ultimate midspan moment u
p = ratio of area of tensile reinforcement to the product of the
pli
p
p P
T s
y
z
\Vavg
'lIy
'l'u
9
breadth and effective depth of the section
= ratio of volume of binding steel ta volume of concrete bond
= midspan load
= prestressing force
= tensile force in steel
= distance of neutral axis to top fiber
= distance along span from section of maximum moment to adjacent
section of zero moment
= curvature at a section
= average curvature over hinge length
= curvature at first yield of tension reinforcement
= ultimate curvature at ultimate moment
= rotation
- 84 -
9 = elastic rotation e
geh = elastic rotation over hinge length
9 = plastic rotation over span p
9ph = plastic rotation over hinge length
9 = total rotation r
9t
= total rotation
9 th = total rotation over hinge length
9 ty = total rotation at yield
d = midspan deflection

- 85 -
APPENDIX B
In this appendix, the experimenta1 techniques found to be successfu1 are set out
for' the benefit of other researchers.
Application of s~rain gauges on prestressing strand.
1. Locate position of strain gauge.
2. C1ean are a initia11y with emery paper. Use acetone to remove partic1es of
dust, oi1, etc.
3. Position strain gauge on the strand by means of tape (Scotch tape). Keep
in this position for a few minutes so that the gauge and tape will keep
the shape a10ng the strand.
4. Peel back the tape with the gauge unti1 the gauge is off the strand whi1e
keeping the remainder of the tape on the strand and still maintaining the
initial shape.
5. App1y Eastman-910 cata1yst on the strand and 1eave to dry for a few minutes.
6. App1y a thin coating of Eastman-910 adhesive on the gauge.
7. Quick1y and accurate1y place the gauge on the strand. Using a sharp instru
ment, cut the tape a10ng the sides of the strand on the outside of the
gauge. This is to ensure that the adhesive spreads over the entire gauge.
8. App1y firm pressure by p1acing a thumb over the gauge and ho1d for a few
more minutes.
9. Peel the Scotch tape off, thus 1eaving the gage in contact with the strand.
The technique as described was found to be quite efficient. However,
other variations may equal1y we1l be app1ied as long as it is efficient1y and
cornfortab1y performed.

- 86 -
Application of Strain Gauges on Concrete Su~face
1. Locate areas wherestrain gauges are Lo be applied.
2. Clean surface by using an electric sander. Make surface smooth and fIat
if necessary.
3. Finally, clean surface with emery paper and remove particles uSlng a
cotton swab and acetone.
4. Apply a thin layer of PS-adhesive on concrete surface and leave to dry
for at least four hours.
5. Locate the position for the gauge.
6. Apply a thin layer of PS - cement and position the gauge. Place a piece
of polyethylene over the gauge.
7. Applya small pressure on the gauge with the thumb.
8. Place a plece of foam over the gauge and then place a small weight on
the gauge for a few more hours.
9. Remove weight, foam, and polyethylene.
Waterproofing of Gages
After soldering the lead wires to the strain gauges, the gauges
and a portion of the lead wires must be waterproofed.
Gauges on the strands.
GW-5 Waterproofing was used. The setting time of this mixture is
about 1 hour. In order to get a good consistency so that the water-proofing
does not flow too easily, the waterproofing is left to stand for about half
an hour before applying to the strain gauges and about four inches of lead
Wlre extending from the gauge.
Black electric tape is then wrapped around the waterproofing to
strengthen and lessen the chances of the wires ripping away from the water
proofing and the gauge.
- 87 -
Gauges on the Concrete
GW-l Waterproofing is applied over the strain gauge and a short
length of the lead wires. The application of this waterproofing is a
precaution for the gauges from being moisturized with water from the
atmosphere.
Prestressing the Wires
After the strain gauges were installed, the wires were placed
through the jacking apparatus as shown (Fig. Bl). A small load was applied
to initially remove the slack from the wires and the zero strains were
taken.
The wires were then tensioned until.the run of the jack was fully
extended. The strain in the wires were occasionally checked. If the
required tension was not reached, bolts (A) and the grips as in the dia
gram were moved forward. The load was then released and plate (C) and the
grips were moved forward.
More load was then applied until the required tension was approxi
mately acquired. Final adjustments to each wire were made by moving the
nuts on bolts A.
Releasing the Prestress (Fig. B2)
The middle wire was cut so that the equipment (D) could he placed
within the jacking apparatus. The jack was then placed as shown and just
enough load was applied so that the blocks (E) could be removed. The load
on the jack was released slowly thus releasing the prestress in the wires.
- 88 -
Fabrication of the Concrete Beam
Mix design batches were made before the start of the program.
Portland Cement Association mix design tables were used with slight varia
tion to obtain the required concrete strength and workability.
The water content of the sand was taken before each mix was
made. This water content which was meant to be representative of the
water content of the sand to be used in the mix was sometimes incorrect
because of the variation in water content inside the bin.
Half-inch and quarter inch size coarse aggregate were used.
High early strength Portland Cement was used in order to obtain the re
quired strength in approximately ten days.
Two batches of concrete were necessary for casting two specimens.
The first bat ch was used for the bottom half layer of each beam. The
second bat ch was used for the top half layer of each beam. A 'pencil'
vibrator was used for compacting the concrete.
Four standard 6" x 12" concrete cylinder specimens were pre
pared from each batch. These cylinders were compacted according to ASTM
specifications.
The beam specimen was trowelled as nearly horizontal as possible.
The concrete was left to harden for about an hour before it was covered
with polyethylene sheets to keep in most of the moisture whilst the con
crete was setting.
The steel forms were removed after about eighteen hours and the
specimens were then covered with 2 layers of wet burlap over which the
polyethylene sheets were then placed.

- 89 -
The specimens were kept wet continuous1y for about five days
before removing the bur1ap. The specimens were then a110wed to air
cure and dry. The strain gauges were app1ied and the beam was ready
for testing about 10 days after casting.
The concrete cy1inders were a110wed to cure in a simi1ar manner
as the beam specimens.
> "tl "tl ~ 11 ~
" c: al t%j ....
OQ HI . 0 11
~ .... '"tI 11 CD al
" t1 CD al al .... ::1
OQ
~---End of Prestressing Bed
,,- -(C) , Elevation
,
---6 ------------------------jI.:Jl:=:J-;lJ;I.H+ Il - -- - - - 1 Y
) Steel Plates --/ we1ded ta Plate
8" x 6 " x 1" Removab1e Steel Blacks
Supreme Grips
l nO
/- uD ...... }
Prestressing Wires .< We1ded Frame
Bo1t and Nut (A) , (for fine adjustment of Prestress)
\0 o
- 91 -
r~ ---
-...:::
~ 1 1 ........ .-1
,-. IJ 0 ri! '-' / 1
.-1 1 1
-~ 1/
0 .-1 al
tIl m "CI 0 p::
.-1
,-. ,,1 ~
j::l ~ '-' ~ 1 / "CI
al al al .u Cf.l
V'
~ l r
u
Apparatus for Re1ease of Prestress
Fig. B2
~ ~
CIl
al
8 CIl
...c:: u (
N ...... r-I
~ N ...... r-I
C"'l -~ 1t"I r-I
r-I al s::
V
1
- 92 -
1
1
1 1
1
1
1
1
1 ~
J N r-I
1 al \0 P-
I .,-l
~ r-I ~ N
1 r-I al
1 al +J CIl
1 \j 1 1 1
p (
Prestress Bed
Fig. B3

- 93 -
BIBLIOGRAPHY
The following abbreviations have been used:
ACI
ASCE
ICE
PCA
PCI
MCR
1. Mattock, A.H.
2 • Khan, A. Q •
American Concrete Institute
American Society of Civil Engineers
Institute of Civil Engineers (London)
Portland Cement Association
Prestressed Concrete Institute
Magazine of Concrete Research
Rotational Capacity of Hinging Regions
in Reinforced Concrete Beams.
An Investigation of the Behaviour of a
3D Reinforced Concrete Connection.
3. Corley, W. Gene Rotational Capacity of Reinforced
Concrete Beams.
4. Warwaruk, J.,
Sozen, M.A. &
Siess, C.P.
Strength and Behaviour in Flexure of
Prestressed Concrete Beams.
5. Ingerle, K. The Flexural Rigidity of Reinforced
Concrete Beams.
6. Popovics, Sandor A review of the Stress-Strain
Relationships for Concrete.
7. Sturman, Shah,
Winter
Effects of Flexural Gradient on
Stress-Strain Characteristics.
PCA Bulletin
DIOL
M. Eng. Thesis
McGill Univ.
Ju1y 1969.
PCA Bulletin
Dl08.
Univ. Of Illinois
Bull. No. 464.
International
Civil Engineering
March 1969.
J.A.C.I.
March 1970.
J.A.C.I.
Ju1y 1965.

8. Ma11ick, S.K.
9. Soliman, M.T.
10. Chan, W.W.L.
Il. Ma11ick, S.K.
12. Ernst, G.C. &
13. Ernst, G.C.
14. Baker, A.L.L.
15. Barnard, P.R.
16. Burnett, B.
- 94 -
Redistribution of Moments in Prestressed
Concrete Continuous Beams
The F1exura1 Stress-Strain Re1ationship
of Concrete Confined by Rectangu1ar
Transverse Reinforcement.
The Rotation of Reinforced Concrete
Plastic Hinges at U1timate Load.
Redistribution of Moments in Two-Span
Prestressed Continuous Beams
U1timate Loads and Def1ections from
Limit Design of Continuous Structural
Concrete.
A Brief for Limit Design.
U1timate Load Theory for Concrete Frame
Ana1ysis.
Researches into the Complete Stress
Strain Curve·for Concrete.
F1exura1 Rigidity, Curvature and Rota-
M.C.R.
Dec. 1966.
M.C.R.
Dec. 1967.
M.C.R.
Ju1y 1962.
M.C.R.
Nov. 1962.
J.A.C.!.
Oct. 1959.
Trans. ASCE
Paper No. 2812
Vol. 121, 1956.
Trans. ASCE
Paper No. 3386
Vol. 127, 1962.
M.C.R.
Dec. 1964.
M. C. R.
tion and their Significance in Reinforced June 1964.
Concrete Design.
17. Aoyama, Hiroyuki Moment-Curvature Characteristics of
Reinforced Concrete Members Subjected
to Axial Load and ReversaI of Bending.
ACI SP-12.

18. Roy, H.E. and
Sozen, M.A.
19. Everard, K.A.
20. Ernst, G.P.
- 95 -
Ducti1ity of Concrete.
The F1exura1 Rigidity of Reinforced
Concrete.
Plastic Hinging at the Intersection
of Beams and Co1umns.
21. Macchi, Georgio E1astic Distribution of Moments on Con-
22. Wright, D.T. &
Berwanger, C.
23. Institution
Research Connu.
24. Comité European
du Béton
25. Ernst, G. C.
26. Nawy, E.G.,
27. Rusch, H.
28. Mattock, A.H.
29. Yu, C.W., &
Hognestad, E.
tinuous Beams.
Limit Design of Reinforced Concrete
Beams.
U1timate Load Design of Concrete
Structures.
Note on the U1timate Load Design of
Statica11y Indeterminate Structures.
Moment and Shear Redistribution in 2
Span Reinforced Concrete Beams.
Rectangu1ar Spiral Binders Effect on
Plastic Hinge Rotation Capacity in
Reinforced Concrete Beams.
Researches Toward a General F1exura1
Theory for Structural Concrete
Redistribution of Design Bending Moments
in Reinforced Concrete Continuous Beams.
Review of Limit Design for Structural
Concrete.
ACI SP-12.
M.C.R.
Nov. 1962.
A.C.I.
June 1957.
ACI SP-12
A.S.C.E.
Ju1y 1960.
Proc. I.C.E.
Feb. 1962.
Bull. No. 21
J.A.C.I.
Nov. 1958.
J.A.C.I.
Dec. 1968.
J.A.C.I.
Ju1y 1960.
Paper 63/4
Proc. I.C.E.
May 1959.
Proc. ASCE
Dec. 1958.

30. Cohn, M.Z.
31. Rognestad,
Eivind
32. Baker, A.L.L.
33. Baker, A.L.L.
34. Bate, S.C.C.
35. Anchor, R.D.
36. Smyth, W.J.R. &
Feneron, S.G.S.
37. Obeid, E.R.
- 96 -
Limit Design of Reinforced Concrete
Frames.
A Study of Combined Bending and Axial
Load in Reinforced Concrete Members.
Further Research in Reinforced Concrete
and its Application to U1timate Load
Design.
Present Research in Reinforced Concrete
and its Application to Design.
Why Limit State Design?
The Application of Limit State Design.
Limit State Design: Its Practica1
Effects.
Proc. ASCE
Oct. 1968.
U. of Illinois
Bull No. 399.
Proc. T.C.E.
V. 2, Part 3,
No. 2, Aug. 1953.
J.T.C.E., V. 35
No. 4, Feb. 1951.
J. of the
Concrete Society
V. 2, No. 3
March 1968.
J. of the
Concrete Society
V. 2, No. 4
April 1968 ..
J. of the
Concr~te Institutl
Vol. 2, No. 4
May 1968.
Compression Hinges in Reinforced Concrete Dept. Civil
Elements. Engineering &
App1ied Mech.,
McGill Univ.
M. Eng. Thesis
Sept. 1969.

38. Burnett, E.F.P.
& Yu, C.W.
39. Burns, N.H.
- 97 -
Reinforced Concrete Linear Structures at
Ultimate Load.
Moment-Curvature Relationships for
Partially Prestressed Concrete Beams
A.C.1. SP 12
J.P.C.I.
Feb. 1964.


